Article

Micro-WEDM of Ti-29Nb-13Ta-4.6Zr Alloy for Antibacterial Properties: Experimental Investigation and Optimization

1
Department of Mechanical and Aerospace Engineering, School of Engineering & Digital Sciences, Nazarbayev University, Astana 010000, Kazakhstan
2
Department of Biology, School of Sciences and Humanities, Nazarbayev University, Astana 010000, Kazakhstan
*
Author to whom correspondence should be addressed.
Metals 2024, 14(6), 714; https://doi.org/10.3390/met14060714
Submission received: 25 April 2024 / Revised: 8 June 2024 / Accepted: 11 June 2024 / Published: 16 June 2024

Abstract

:
Recent developments of orthopedic implant applications have discovered a variety of new metallic biomaterials known as β-type titanium alloys. The μ-WEDM (micro-wire electro discharge machining) surface treatment technique, capable of improving the surface properties of orthopedic implants, was studied in a machining Ti-29Nb-13Ta-4.6Zr alloy. This study aimed to evaluate material removal rate (MRR), kerf width, average surface roughness, microhardness and antibacterial response at different machining parameters which are capacitance (1 nF, 10 nF and 100 nF) and gap voltage (80 V, 95 V and 110 V). The Taguchi method was used to optimize the mentioned output parameters, while ANOVA (analysis of variance) described the significance and contribution of capacitance and gap voltage. Grey relation analysis (GRA) was conducted to perform multiple output optimization. For antibacterial response, cultivations of B. subtilis, E. coli, P. aeruginosa and S. aureus bacteria on treated surfaces for 72 h were performed. As the results, optimal values of MRR, kerf width, crater area, average surface roughness and microhardness were equal to 0.0637 mm3/min, 93.0 μm, 21.8 μm2, 0.348 μm and 442 HV, respectively. Meanwhile, μ-WEDM treatment improved antibacterial properties while the highest antibacterial response was achieved at the lowest average surface roughness resulting in least biofilm formation on treated surfaces.

1. Introduction

Currently, many people worldwide are suffering from musculoskeletal pathologies which are caused from injuries, inflammations or degenerations. To address this issue, orthopedic implants are commonly used in fixation of fractured bones, their replacements, joints replacements, etc. [1]. However, there are several drawbacks associated with these currently developed metal implants such as the release of metal ions, stress shielding [2] as well as the formation of biofilm on the implant surface [1]. For these reasons, implants have received extensive attention from research aiming to increase their biocompatibility.
In order to address the above-mentioned issues, scientists have developed many metallic alloys as well as surface treatment techniques. Aiming to match the mechanical properties of bone, while maintaining biocompatibility, orthopedic implant material has developed using titanium alloys which are well established due to their excellent corrosion resistance, high fatigue strength, low density and good biocompatibility [3,4]. Meanwhile, commonly used in biomedicine, the Ti-6Al-4V alloy has been shown to have a strong titanium oxide layer which contributes to good corrosion resistance while offering reduced elastic modulus (~110 GPa [4,5,6,7]) compared to many other bioimplant materials. In comparison, the elastic modulus of cortical bones is less than 20 GPa where this difference leads to bone-implant loosening while Al and V elements in the alloy are associated with allergic effects, neurological disorders and carcinogenic effects [8]. As alternatives, a new generation of β-type titanium alloys were developed. Containing non-toxic β-stabilizers, their variation is large.
There are several β-type titanium alloys such as Ti-15Mo, Ti-35Nb-5Ta-7Zr, Ti-13Nb-13Zr, Ti-12Mo-6Zr-2Fe, Ti-29Nb-13Ta-4.6Zr, etc. Their mechanical properties such as ultimate tensile strength (UTS) and elastic modulus are listed in Table 1 with α+β type, α type and β type titanium alloys.
Among these earlier mentioned alloys, the Ti-29Nb-13Ta-4.6Zr alloy presents a β-type titanium alloy which attracted potential interest from biomedicine. Containing non-toxic Nb, Ta and Zr elements, this alloy has a low elastic modulus equal to 60–65 GPa [18,19]. In a relevant study related to aging treatments, Niinomi [20] compared fatigue performance, cyto-toxicity and the elastic modulus of the Ti-29Nb-13Ta-4.6Zr and Ti-6Al-4V alloy. Fatigue limit after 107 cycles of the first alloy after solution treatment was equal to 320 MPa. However, after 627 K aging treatment of Ti-29Nb-13Ta-4.6Zr for 259.2 ks (ks = 103 s), its fatigue limit increased up to 700 MPa which was also equal for the Ti-6Al-4V alloy. Cyto-toxicity tests showed that the Ti-29Nb-13Ta-4.6Zr alloy had higher cell viability compared to the Ti-6Al-4V alloy. The elastic modulus of the Ti-29Nb-13Ta-4.6Zr alloy was less than that of Ti-6Al-4V. On top of that, the author observed that the value of the elastic modulus of the Ti-29Nb-13Ta-4.6Zr alloy can be increased by using aging treatments. Considering the harsh environment of a human body, the corrosion resistance of Ti-29Nb-13Ta-4.6Zr was studied as well. It showed better resistance to corrosion than microcrystalline Ti grade 2 in phosphate-buffered saline [21]. Meanwhile, Rajabi et al. [22] increased the corrosion resistance of the Ti-29Nb-13Ta-4.6Zr alloy by thermomechanical processing. It resulted from the formation of a martensite phase on the passive layer. Hot compression at 900 °C resulted in smaller resistance compared to warm compression at 300 and 400 °C due to excessive shifts near grain boundaries. Comparing the corrosion resistance of Ti-29Nb-13Ta-4.6Zr and Ti-6Al-4V in a simulated body environment, according to Gunawarman et al. [23], the corrosion rate was 4.5 × 10⁻⁹ and 6.4 × 10⁻⁸ mm/y, respectively. However, the first alloy witnessed higher pitting corrosion compared to the second which was caused from bigger elemental segregation and higher content of impurities. Implant wear generation, which can result in implant loosening, inflammation, pain, etc., was studied by Li et al. [24]. Observing the wear resistance of Ti-29Nb-13Ta-4.6Zr and Ti-6Al-4V by the pin-on-disk method, the wear generation of both alloys were found to be minor compared to stainless steel. Moreover, the wear resistance of Ti-29Nb-13Ta-4.6Zr is slightly better compared to Ti-6Al-4V because of more brittle TiO2 oxides in the passive layer than Ti2O3 and Nb2O5. For that reason, Ti-6Al-4V generates cracks which increase wear generation, despite almost the same wear loss. From this study, oxidation treatment was also suggested to improve wear resistance while it was stated that heat treatments do contribute to improved wear resistance.
While the choice of implant material is a crucial part of successful implantations, their surfaces play a vital role in biocompatibility. On top of mechanical properties, the surface of implants affects osteointegration [25] as well as bacteria adhesion [26]. For the purpose of increasing the adhesion of body cells and repelling bacteria, different implant surfaces modification techniques were found such as plasma spraying, grit blasting, chemical vapor deposition, and so on. Moreover, these modification techniques are able to change the physical properties of surfaces which can be also beneficial [27].
One of the surface treatment techniques which can alter the surface properties of implants is electro-discharge machining (EDM). This process is based on melting material through electrical discharges between electrodes and a conductive workpiece in a dielectric fluid. The local temperature during the EDM process can reach up to 15,000 °C, which surpasses the melting temperature of all titanium biomedical alloys [28]. This technique removes material through electrical sparks, hence no mechanical force, making it suitable for machining harder materials [29], including nickel alloys, ferrous alloys and titanium alloys [30]. The intense energy elevates the temperature to 15,000 °C in the EDM process leading to the evaporation and melting of both the tool electrode and the work surface. The resulting molten debris is removed from the machining area by a continuously flowing dielectric fluid. The EDM process only changes the surface material properties; the process causes three layers. The recast layer: it is formed due to the re-solidification of melted material along with decomposed hydrocarbon (dielectric) on the surface and it could change the surface properties. Heat effected zone: the second layer is due to the conduction of heat to the successive layer and its thickness can be in the microns meter range; this layer also has different mechanical properties than bulk material. The last layer is known as bulk material; it is the part of the material that is not affected by the heat [31]. High output temperature of EDM is good for machining β-type titanium alloys because of their high melting temperature which increases the preparation difficulty of parts for other conventional machining techniques [32]. The EDM surface treatment of titanium alloys creates a nano-porous surface layer which increases osteointegration [29]. Adding powder particles into dielectric fluid of powder mixed electrical-discharge machining (PMEDM) such as hydroxyapatite facilitates cell growth on the surface [33], while adding silver powder increases antibacterial properties of the surface having no influence on osteoblast function [34].
Researchers exploring the domain of wire electro-discharge machining (WEDM) to machine metallic alloys, including Jayakumar and Suresh [35,36], investigated the effects of current (I), pulse-on time (Ton), pulse-off time (Toff) and voltage (V) on the machining of SS304 using two different wire materials, brass and zinc-coated brass. Their study focused on machining response variables such as material removal rate (MRR) and kerf width. Additionally, they performed WEDM with both rough and trim cuts to enhance machinability. The electrode used was a 0.25 mm diameter brass wire. They further analyzed the influence of these WEDM parameters on surface roughness (Ra), the hardness of the machined surface and the thickness of the recast layer for both wire materials on SS304. Similarly, Manoj and Narendranath [37] investigate the surface roughness, recast layer and hardness of microfer 4722 superalloy after WEDM machining. They concluded that augmentation in slant angle 0–300 reduces the surface roughness by 15.92% and the recast layer by 62.76%; however, the hardness was enhanced by 4.59%.
Having insufficient research literature at the intersection of the Ti-29Nb-13Ta-4.6Zr alloy and EDM surface treatment motivates conducting this research based on the high research interest in EDM surface modification of a commonly used Ti-6Al-4V alloy. As β-type Ti-29Nb-13Ta-4.6Zr titanium alloy possesses superior properties in biomedical implant applications, EDM surface treatment of the alloy demonstrates a big potential. This paper aims to investigate the machinability performance of micro-WEDM (wire electro-discharge machining) on a Ti-29Nb-13Ta-4.6Zr alloy and its surface modification for improved biocompatibility.

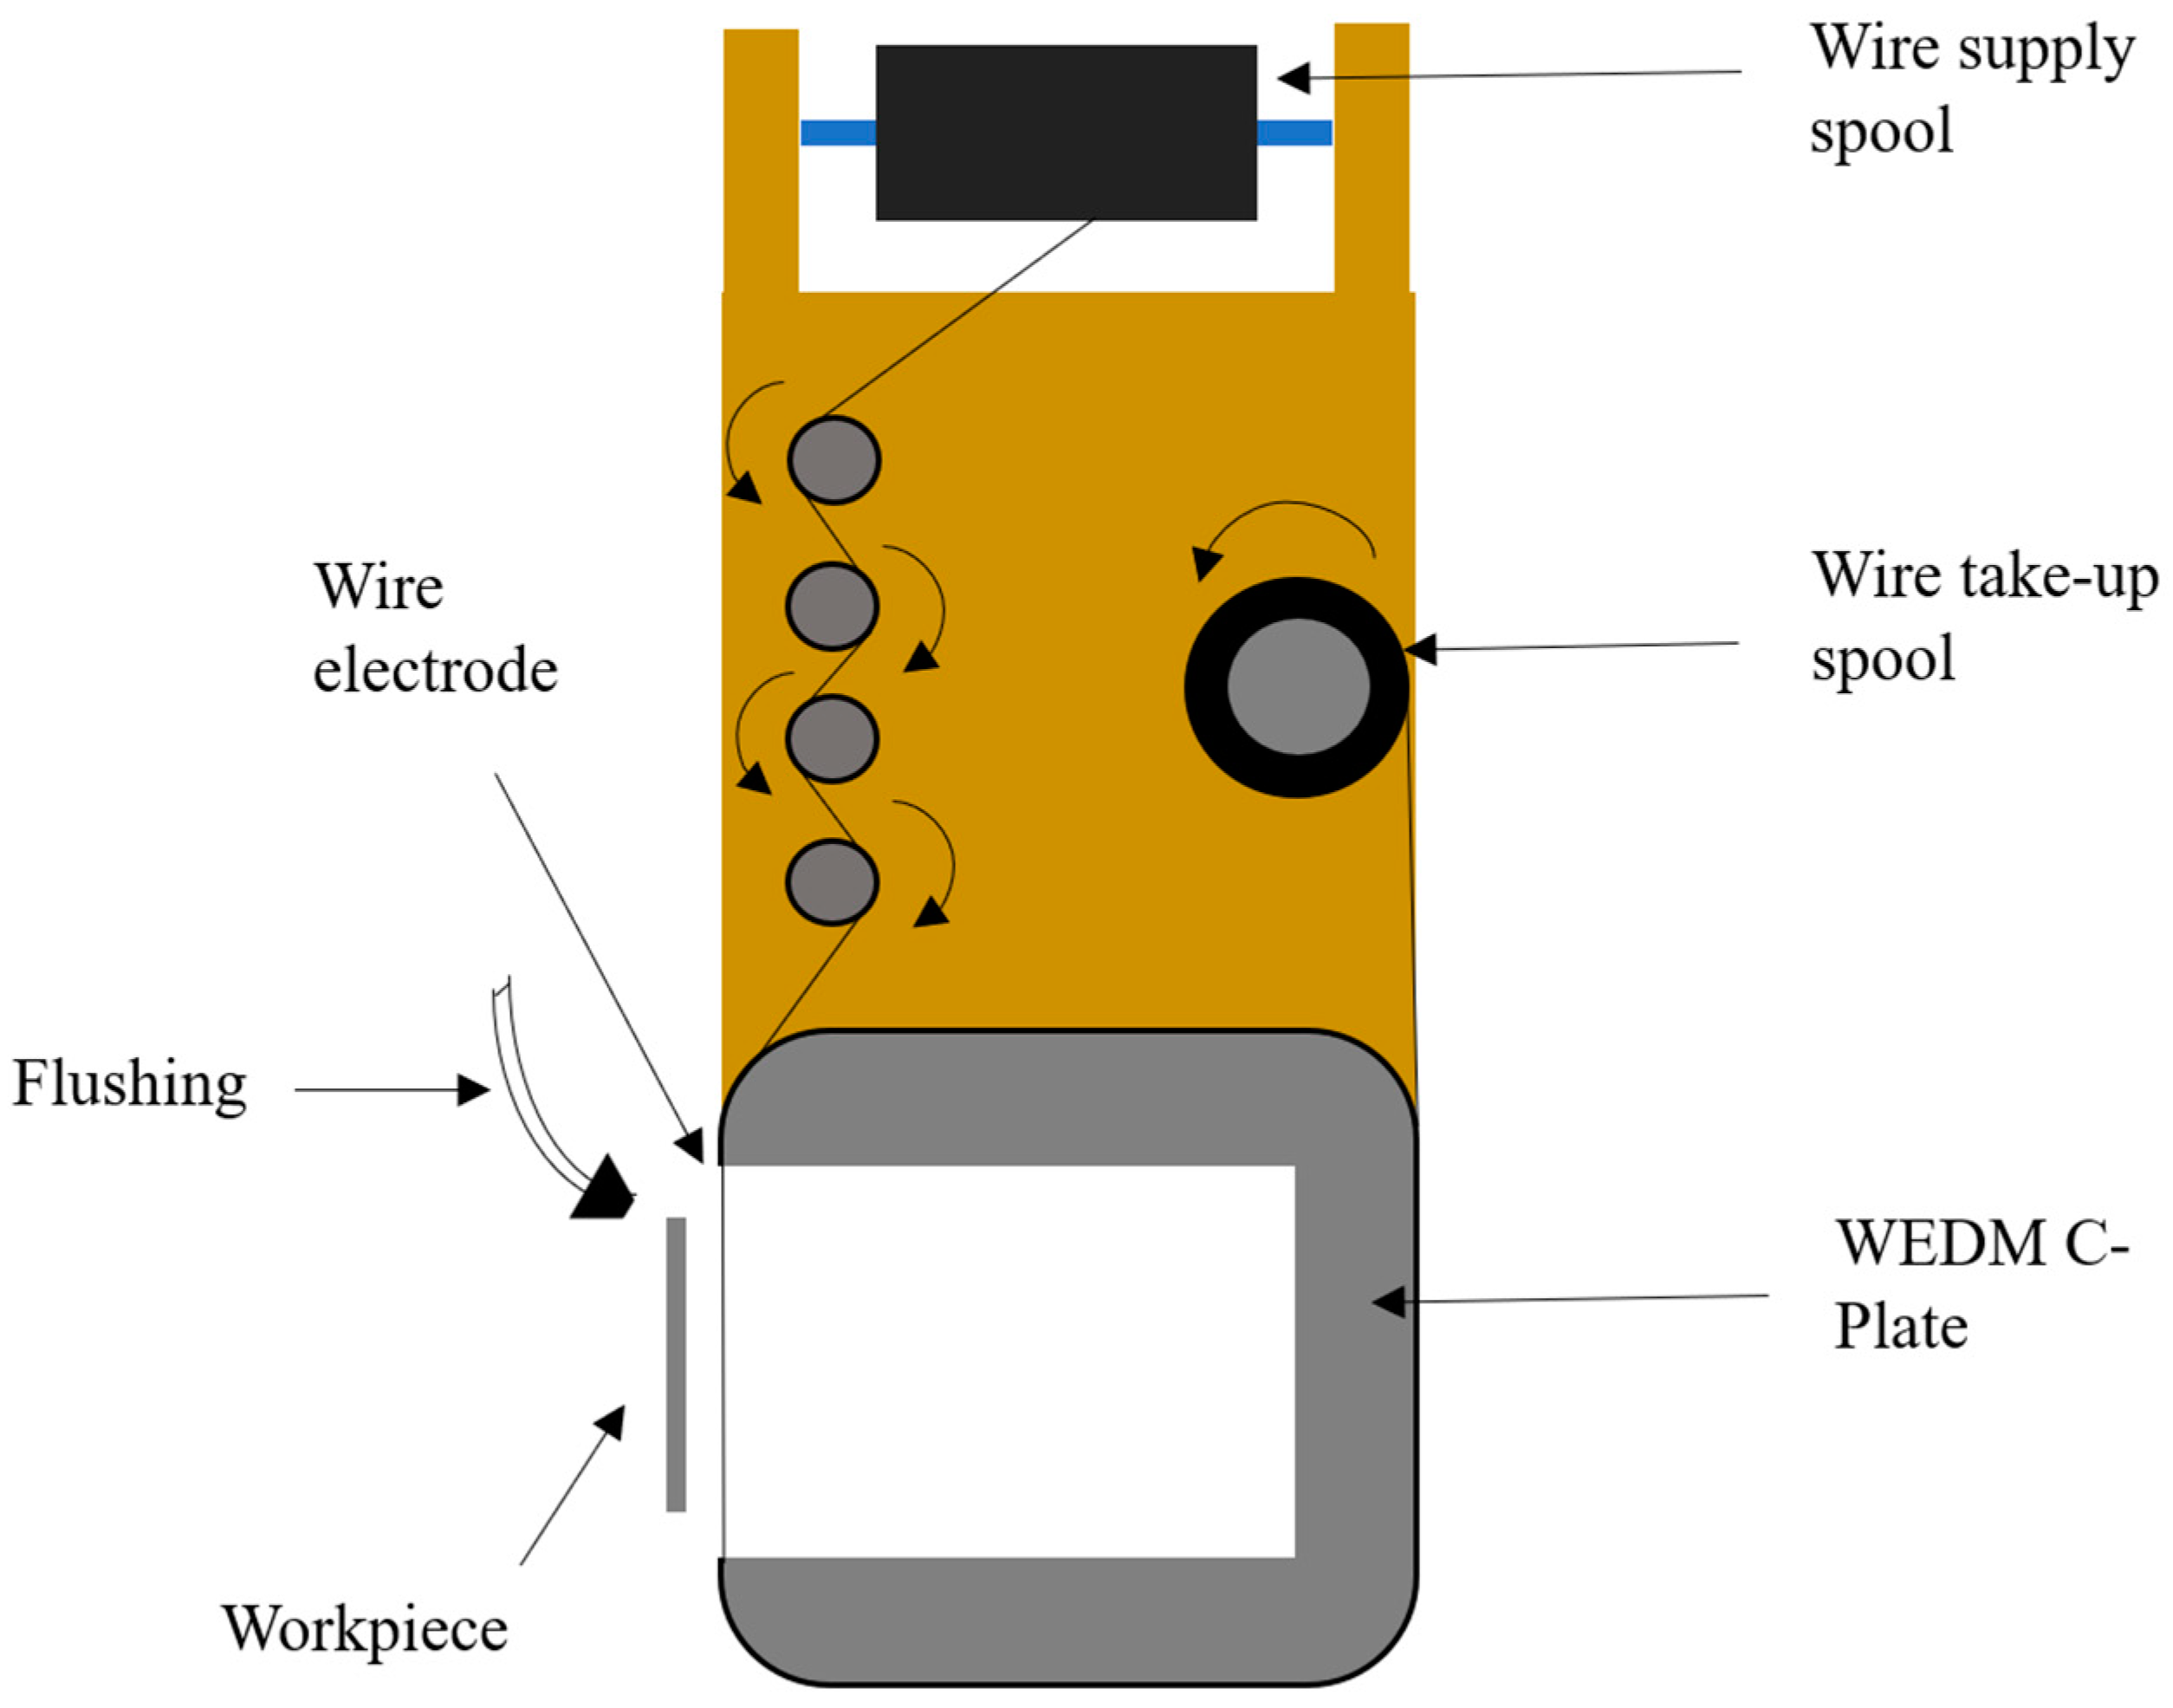
2. Materials and Methods

2.1. Materials

Surface treatments of titanium alloy were carried out using μ-WEDM. It involves enabling surface treatment processes at micro scales. Figure 1 shows the schematic diagram of the μ-WEDM experimental setup. The workpiece and wire material used in these experiments were Ti-29Nb-13Ta-4.6Zr (TNTZ) and tungsten wire, respectively. The TNTZ alloy plates were procured from “LUOYANG COMBAT TUNGSTEN & MOLYBDENUM MATERIAL CO., LTD.” LuoLong, Luoyang, Henan, China. A scanning electron microscope (SEM, JEOL JSM-IT200(LA)) was utilized to conduct the energy dispersive X-ray (EDX) analysis. The measurement parameters were set to an accelerating voltage of 20.0 kV, a working distance of 12.2 mm and a probe current of 60.0 pA. Analysis on elemental compositions collected through energy dispersive X-ray spectroscopy (EDS) are listed in Table 2. The dimensions of the workpieces were 20 mm × 20 mm × 3 mm. μ-WEDM is a stochastic process, so each experiment was repeated trice according to the design of the experiments. The experimental conditions for this study were determined based on the outcomes of initial feasibility tests conducted prior to the main experiment. During these preliminary tests, it was consistently observed that the wire broke under high energy conditions (Capacitance = 400 nF, V = 110 V). This crucial finding led us to refine and optimize the experimental parameters to ensure stable and reproducible results. Table 3 presents the specific experimental conditions for μ-WEDM experiments.

2.2. Desing of Experiments

Experimental design was set accordingly to analyze two factors with three levels. To increase the statistical stability of the analysis, the experiments were performed trice for each combination of experiments. The available design that fits the criteria is L27 Taguchi’s orthogonal array. The input parameters and their values for each level are shown in Table 4 while the design of experiments is shown in Table 5. In the design, the aim was to maximize MRR and microhardness, and minimize kerf width, crater size and average surface roughness. Therefore, the criteria for MRR and microhardness were chosen as “larger is better”, while the criteria for kerf width, crater size and average surface roughness were set as “smaller is better”. Analysis of means for each factor and ANOVA (analysis of variance) were obtained by analyses of Taguchi’s design in Minitab 18.1 software. On top of that, the conditions for optimal multiple output parameters were investigated by using grey relation analysis (GRA).

2.3. Analysis of Kerf Width (KW)

In essence, kerf width is the amount of material that the wire removes throughout the WEDM process. It is the measure of cut width that the wire electrode makes in the workpiece as it passes through it, as shown in Figure 2.

2.4. Material Removal Rate (MRR)

Material removal rate is the rate of material volume removed from the workpiece, which is determined using the equation as follows:
M R R = D e p t h   o f   c u t   ×   h e i g h t   o f   c u t   ×   k e r f   w i d t h m a c h i n i n g   t i m e
The depth of cut was equal to 50 μm, height of cut was changed accordingly from 20.03 to 19.79 mm along the workpiece, kerf width and machining time were measured during the experiments.

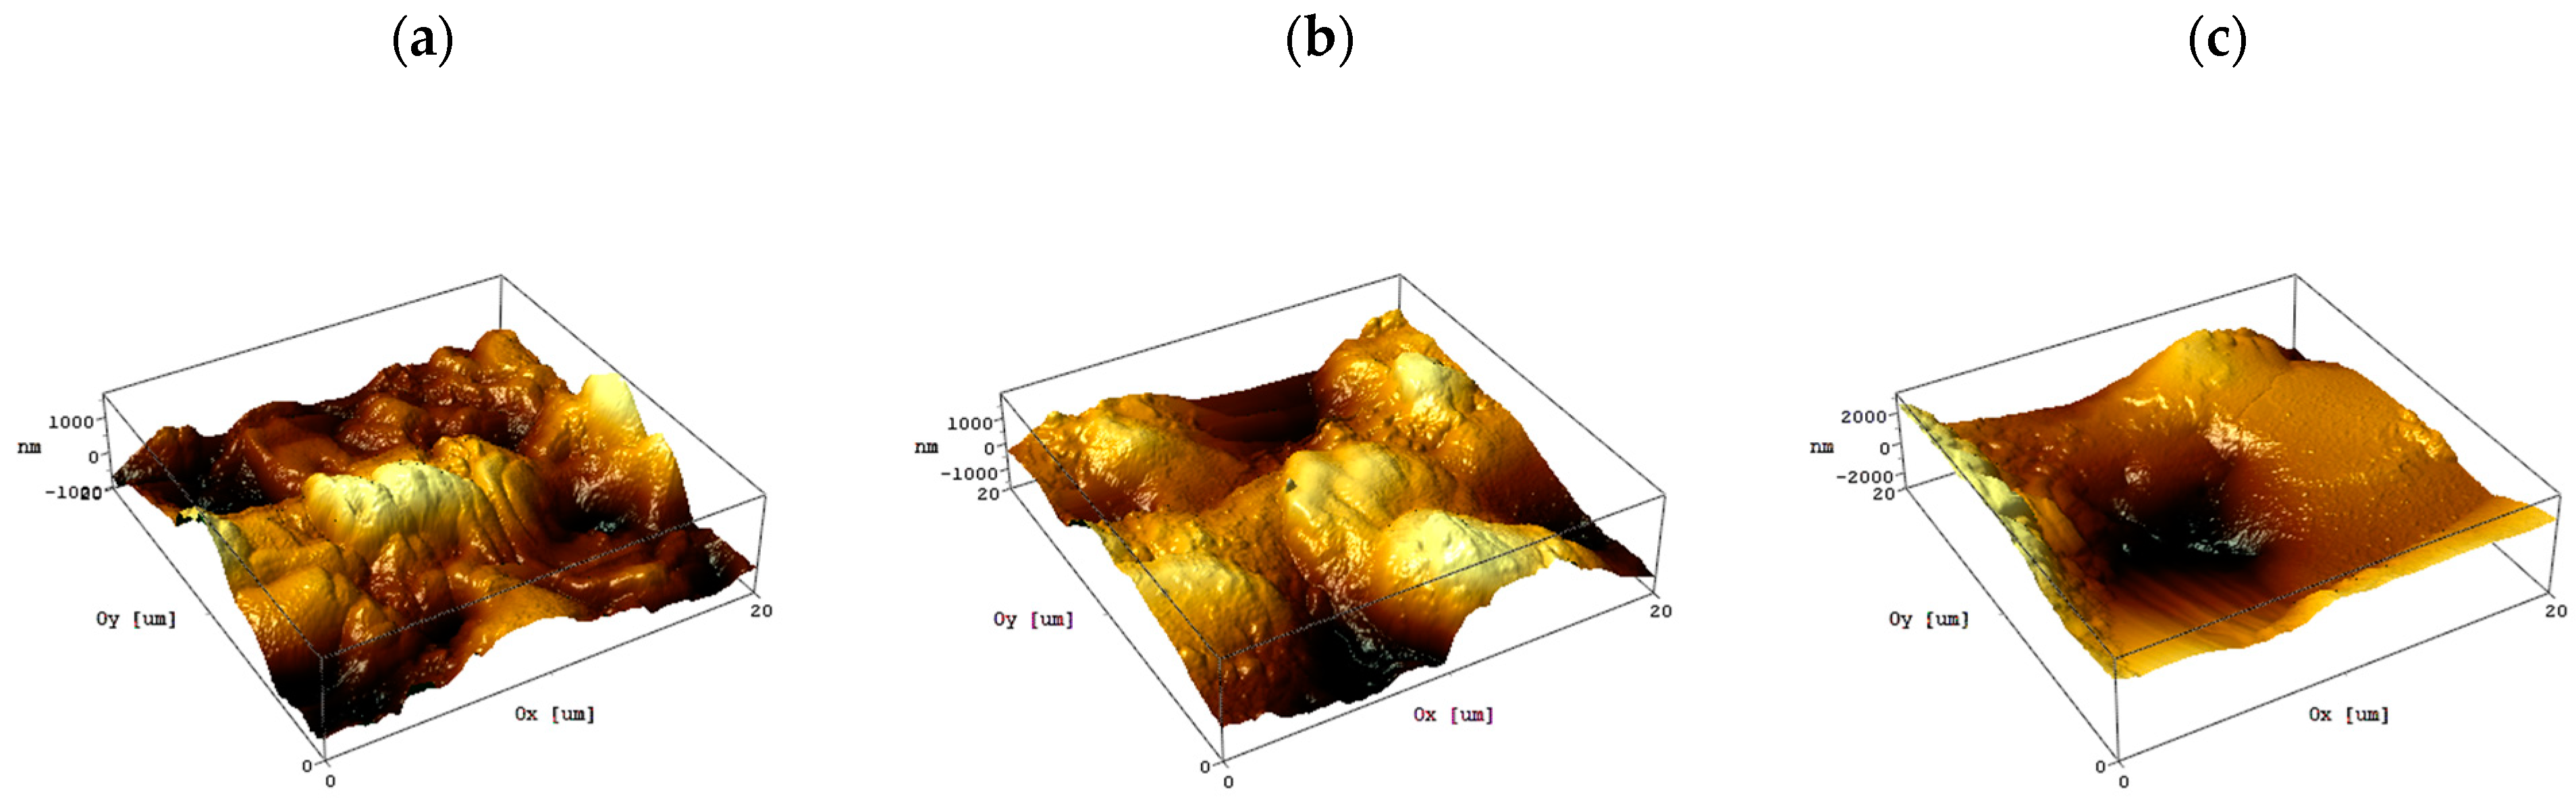
2.5. Crater Area (CA), Microhardness and Average Surface Roughness (SR)

The surface dimensions for these particular characterizations were 20 mm × 5 mm. The crater size was determined from a scanning electron microscope (SEM) by JEOL JSM-IT200(LA). The surface microhardness of μ-WEDM-ed Ti-29Nb-13Ta-4.6Zr surfaces were measured using a Vickers microhardness tester Shimadzu HMV-G31, with 200 g force indenter load and a 12 s dwell period [38,39,40] for each experiment. To ensure precision and consistency, three microhardness measurements were taken for each discharge energy setting. Additionally, for the 3D mapping and determination of average surface roughness of μ-WEDM-treated surfaces, the Atomic Force Microscope (AFM) SmartSPM 1000 is utilized. AC mode (a semi-contact mode) for the surface profiling is conducted with a resolution of 256 px × 256 px and a scan area of 20 μm × 20 μm.

2.6. Regression Model

To supplement the analysis of means of each factor, the 3D visual representation of the regression model was programmed through MATLAB software. The “combvec” MATLAB built-in function is used to generate all possible combinations of elements from multiple sets of input vectors; it is part of the optimization toolbox. Additionally, the MATLAB “fitlm” function is commonly used to fit regression models, a part of the Statistics and Machine Learning Toolbox. The “fitlm” is used to fit models with single or multiple predictor variables. In this study, the “combvec” is used to generate all possible input vectors for the combination of capacitance-voltage, and “fitlm” is used to fit the quadratic model. The approach allows the surface response to be predicted between process and performance parameters.
Due to A2 being close to A1 and distant to A3, the uneven distribution decreases the accuracy of the regression model. In order to evenly distribute the data across the variable range, capacitance was analyzed according to its power of 10 scale where level 1 is 100 nF, level 2 is 101 nF and level 3 is 102 nF. This allows us to obtain a more accurate model.

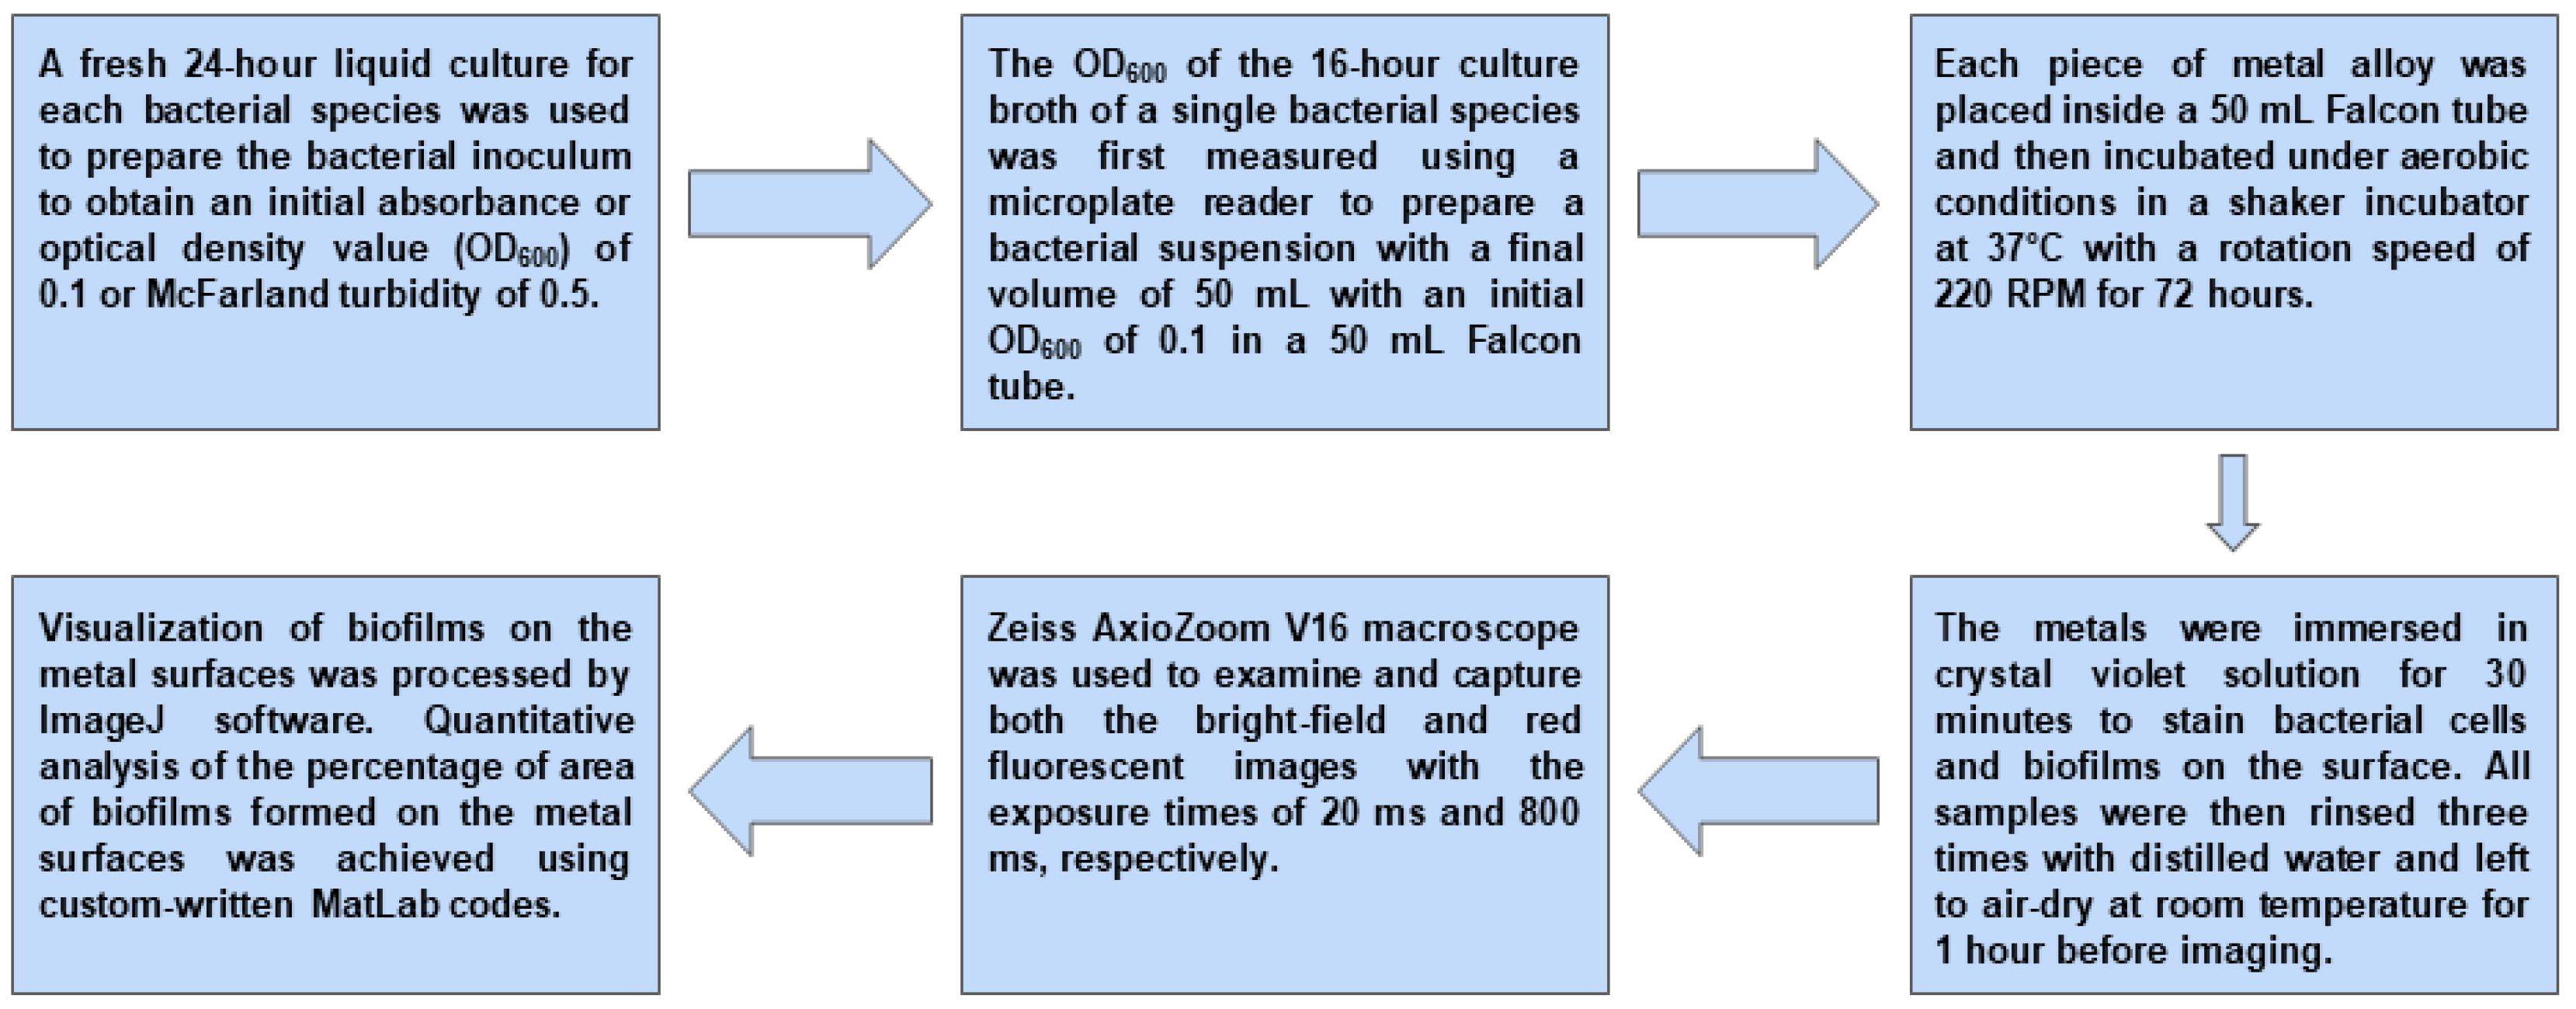
2.7. Antibacterial Test

The prevailing hypothesis regarding the influence of surface topography on bacterial attachment suggests that a maximum surface roughness slightly smaller than bacterial cell size is most effective at reducing the contact area between the cell and substrate. This creates a “fakir effect”, resulting in an unfavorable environment for bacterial proliferation. Additionally, these peaks and valleys may induce local mechanical stresses in the bacterial cell wall, potentially altering cellular metabolism [41]. The antibacterial action of the proposed EDM-treated surfaces depends on the final surface roughness. Low-energy-treated surfaces have much lower surface roughness and therefore prevent bacteria from attaching while medium- and high-energy-treated surfaces have higher roughness, leading to increasing bacterial attachment [42]. To analyze bacterial attachment and biofilm formation, separate experiments were conducted using μ-EDM with three different levels of discharge energy, higher energy (100 nF and 110 V), medium energy (10 nF and 95 V) and low energy (1 nF and 80 V). Three 3 mm × 20 mm treated surfaces for each discharge energy were made on the surfaces of Ti-29Nb-13Zr-4.6Zr. The rest of the machining parameters were kept the same as depicted in Table 3. The goal of the test was to evaluate wire electrical discharge machining’s (WEDM) antibacterial efficacy against multiple strains of bacteria, such as Escherichia coli (DH5α), Bacillus subtilis, Pseudomonas aeruginosa and Staphylococcus aureus; the methodology of the experiment is depicted in Figure 3. This was accomplished by assessing the biofilm growth on various metal surfaces following a 72 h broth culture inoculation. Fresh 24 h liquid cultures of every species of bacteria were used to prepare the bacterial inoculum, aiming for an initial optical density (OD 600) of 0.1 or a McFarland turbidity of 0.5. A microplate reader was used to measure the OD 600 of the 16 h culture broth in order to calculate the precise amount of bacteria that needed to be provided to fresh media in a 50 mL Falcon tube, leading to a final volume of 50 mL with an OD of 0.1. Every single specimen of the metal alloy was suspended in a different 50 mL Falcon tube that held a single species of bacteria in the culture medium. After that, these tubes were incubated for 72 h in an aerobic environment at 37 °C and 220 RPM in a shaker incubator.
The formation of biofilms and bacterial cells were then observed on the metal surfaces by staining them with crystal violet (CV) dye for a duration of thirty minutes. Following staining, the specimens were allowed to air dry for an hour at room temperature prior to being imaged. They were then rinsed three times using distilled water. Employing a Zeiss AxioZoom V16 macroscope, bright field and red fluorescent photos were taken with exposure periods of 20 ms and 800 ms, respectively. Using specially created MATLAB programs, a comparative study of the biofilm coverage was carried out. For the purpose of comparison, only biofilms larger than five times the surface area of a single bacterium and with a signal intensity in excess of 250 were gathered.
The metals were first submerged in a 30% acetic acid solution for 15 min to eliminate any biofilms on the machined surfaces, ensuring the cleanliness and disinfection of the metals prior to the next investigations. Following a 30 min immersion in a 70% ethanol solution, they were rinsed with distilled water and subjected to a 5 min plasma cleaning process. To guarantee thorough disinfection before to culture them with bacteria, all metals were exposed to UV light for thirty minutes prior to each biofilm development test. With the exception of Staphylococcus aureus, which was cultivated in tryptone soy broth (TSB), all bacterial strains were cultured in Luria-Bertani (LB) broth. To avoid cross-contamination, all studies were carried out in an aseptic environment.

3. Results and Discussion

3.1. Taguchi’s Orthogonal Array

Taguchi’s orthogonal array (L27) as well as the measurements of MRR, kerf width, crater size, average surface roughness and microhardness from μ-WEDM machining of Ti-29Nb-13Ta-4.6Zr alloy are shown in Table 5. According to the measurements in the table, Taguchi analyses were carried out for each output parameter according to “large is better” and “smaller is better” criteria. The plots of means for each output representing the influence of individual input parameters are shown in Figure 4, while Figure 5 shows 3D surface response plots obtained from MATLAB.
Observing Figure 4a and Figure 5a, MRR increased with gap voltage. Its increase contributes to the energy of sparks which increases the amount of material removed. The same as gap voltage, capacitance value is proportional to the value of discharge energy. However, with the change in each level of capacitance, MRR changed more sharply compared to levels of gap voltage. The graph shows that an increase in capacitance from level 1 to level 2 increased the material removed through an increase of spark energy; the analogous trend was observed by Hu et al. [43]. Followingly, by increasing capacitance from level 2 to level 3, MRR decreased. Increasing spark energy contributes to a bigger volume of removed material; however, for capacitance level 3, the amount of discharge energy was very high which may result in excessive amounts of debris concentration. Due to the presence of debris, a portion of energy was wasted on machining the debris which slowed down the removal rate of workpiece material [44]. This effect is commonly known as secondary sparks [45].
From Figure 4b,c and Figure 5b,c, the similar patterns of capacitance are seen on kerf width and crater size. A smaller difference in capacitance value, between level 1 and level 2, resulted in a smaller gain in discharge energy. Comparingly, a bigger difference in capacitance value, between level 2 and level 3, resulted in a bigger gain in discharge energy, as depicted in Figure 6a–c. High discharge energy resulted in bigger sparks which increased kerf width and craters sizes. However, the influence of gap voltage was different for kerf width and crater size; a similar trend was observed by Ali et al. [46]. It is seen that gap voltage had a higher contribution on kerf width, while its effect on crater size was smaller. Comparing the influence of gap voltage on crater size and kerf width, crater size benefits from an increase in gap voltage by its contribution to the amount of discharge energy. Meanwhile, on top of the increased discharge energy, gap voltage can increase the gap distance where a breakdown of dielectric fluid occurs [47] which in turn, increases the distance required for a spark between the workpiece and electrode, which contribute to kerf width.
Figure 7a–c displays the 3D mapping of the average surface-generated WEDM at voltage 95 V and capacitance 1 nF, 10 nF and 100 nF. According to Figure 4d, capacitance and gap voltage had similar trends with respect to average surface roughness. The effect of capacitance on surface roughness value was approximately the same for each level which resulted in the correlation between surface roughness and capacitance value in the logarithmic trend. It should be noted that the scale of capacitance axis in the 3D plot shown in Figure 5d as well as levels of factor A were based on a 10x scale which resulted in linear behavior of the output. Converting the capacitance to the linear scale will change the output average surface roughness to the logarithmic trend. The similar empirical approximation between average surface roughness and pulse energy was observed by Jeswani [48].
During the micro-EDM process, material removal occurs in the form of craters through melting and evaporation mechanisms. Consequently, the surface undergoes repeated cycles of heating and cooling, potentially altering its hardness. The recast layer, which typically forms as a result of melting of material and re-solidification on the surface, usually exhibits higher surface hardness and may contain micro-cracks and other defects. In biomedical applications like dental implants, the enhanced hardness post-micro-EDM can be beneficial [49]. Figure 4e and Figure 5e depicted the effect of gap voltage on microhardness which was minor; however, the higher the capacitance, the more challenging it was to achieve an Improvement in microhardness. The value of microhardness increased from the formation of the re-melted recast layer. On top of that, the deposition of high hardness tungsten particles from the electrode increases the hardness as well [50].

3.2. ANOVA

The analyses of variance for each output parameter were performed at the 95% confidence level. It shows the significance and contribution of capacitance and gap voltage as well as their interactions on MRR, kerf width, crater area, average surface roughness and microhardness. According to Table 6, capacitance (A) had the most contribution equal to 36.17% followed by interaction of capacitance and gap voltage (A × B), and gap voltage (B) equal to 29.49% and 6.78%, respectively. The p-values showed strong significance (p < 0.05) of A and A × B, while B was a non-significant factor in MRR. Therefore, MRR is strongly affected by capacitance while the contribution of gap voltage was minor. Observing Table 7, ANOVA showed strong significance of both A and B from low p-values for kerf width. The contributions of each factor were equal to 46.01% and 31.47%, respectively. Nevertheless, A × B was not significant and its contribution was equal to 6.07%. Similarly, Table 8 shows the results of the ANOVA for the crater area. All factors (A, B and A × B) were significant. The contribution of A was dominant (93.92%) while contributions of B and A × B were equal to 3.15% and 2.54%, respectively. Average surface roughness, in Table 9, was significantly affected by all parameters (A and B) including their interaction (A × B). The p-values were less than 0.05 while A had the greatest contribution (61.37%) followed by B (15.76%) and A × B (12.17%). Lastly, from Table 10, only A had a high contribution (82.66%) and significance. On the contrary, p-values of B and A × B were higher than 0.05 which showed its low significance while their contributions were minimal (1.05% and 2.28%, respectively).
From ANOVA, good significance of capacitance was observed in all output parameters which are MRR, kerf width, crater area, average surface roughness and microhardness. On top of that, capacitance had a major contribution on each parameter. Gap voltage was significant for kerf width, crater size and average surface roughness and non-significant for MRR and microhardness. Despite the gap voltage having almost the same contribution with the interaction of two factors for crater size and average surface roughness, it showed the second most contribution after capacitance for kerf width, crater size and surface roughness. Meanwhile, interaction between capacitance and gap voltage was significant for MRR, crater area and average surface roughness. Based on the R2 values, the capacity of the input factors to explain the variance in the output variables can be ranked as follows: crater area (99.60%), average surface roughness (89.60%), microhardness (85.99%), kerf width (83.55%) and MRR (72.44%). Higher R2 values for crater area and average surface roughness indicate that the capacitance and gap voltage primarily influence these output factors. In contrast, the lower R2 values for MRR and kerf width suggest the potential presence of additional input factors affecting these variables.

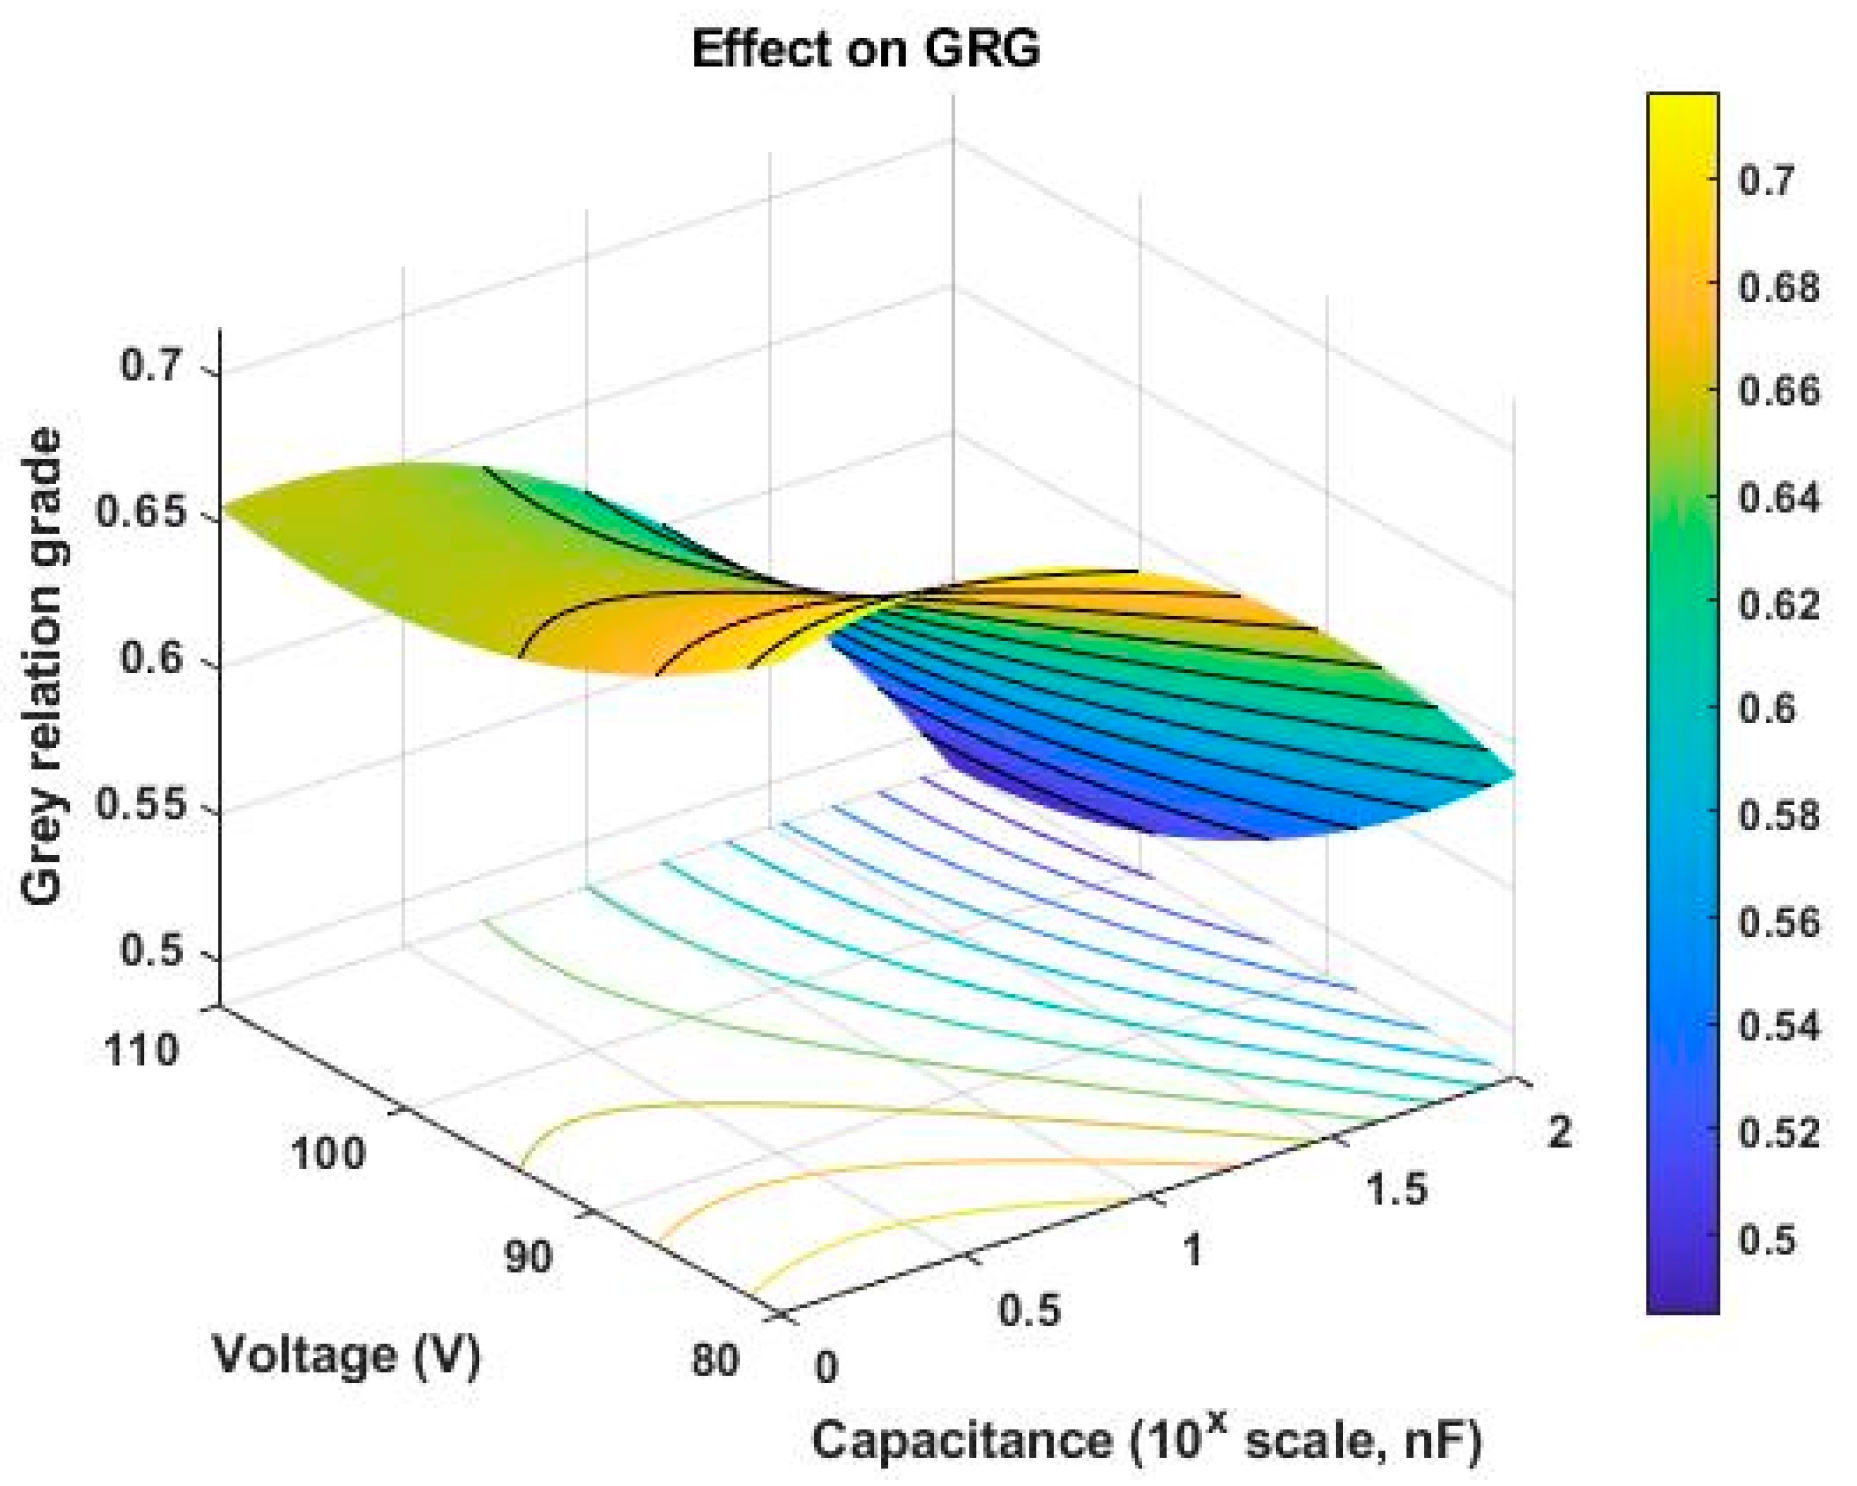
3.3. Grey Relation Analysis

In order to analyze the most optimal conditions for multiple output parameters, grey relation analysis (GRA) was utilized. Considering “smaller is better” and “large is better” criteria, MRR and microhardness values were normalized according to the “larger is better” formula where high values are desired, while kerf width, crater size and average surface roughness values were normalized according the “smaller is better” formula where low values are desired. The experimental results of each experiment, their grey relation coefficient for each output parameter, grey relation grade and ranks are shown in Table 11. By ranking the average grey relation grade of repeated experiments with the same conditions, the most optimal parameters were A1B1.
By analyzing the variance of grey relation grades (GRG) shown in Table 12, capacitance and gap voltage were significant, showing low p-values. Their contributions to GRG were equal to 64.72% and 18.22%, respectively. The regression model presented in Figure 8 showed big changes at different levels of capacitance, where the peak GRG was between level 1 and level 2 of capacitance. Meanwhile, GRG decreased with an increase in gap voltage level with a comparingly smaller slope having the peak GRG at gap voltage level 1.
From GRA, the peak GRG for multiple output parameters among performed experiments was A1B1. The means of GRG by Taguchi analysis are shown in Table 13, where analysis showed the most optimal parameter was predicted at A1B1, as well. Comparing the GRG of initial parameters, which are middle factors of capacitance and gap voltage (A2B2), to the most optimal GRG (A1B1), the improvement in GRG was equal to 11.9%. Table 14 shows the values of MRR, kerf width, crater size, average surface roughness and microhardness at initial parameters (A2B2), at individual optimal parameters and at peak GRG parameters.

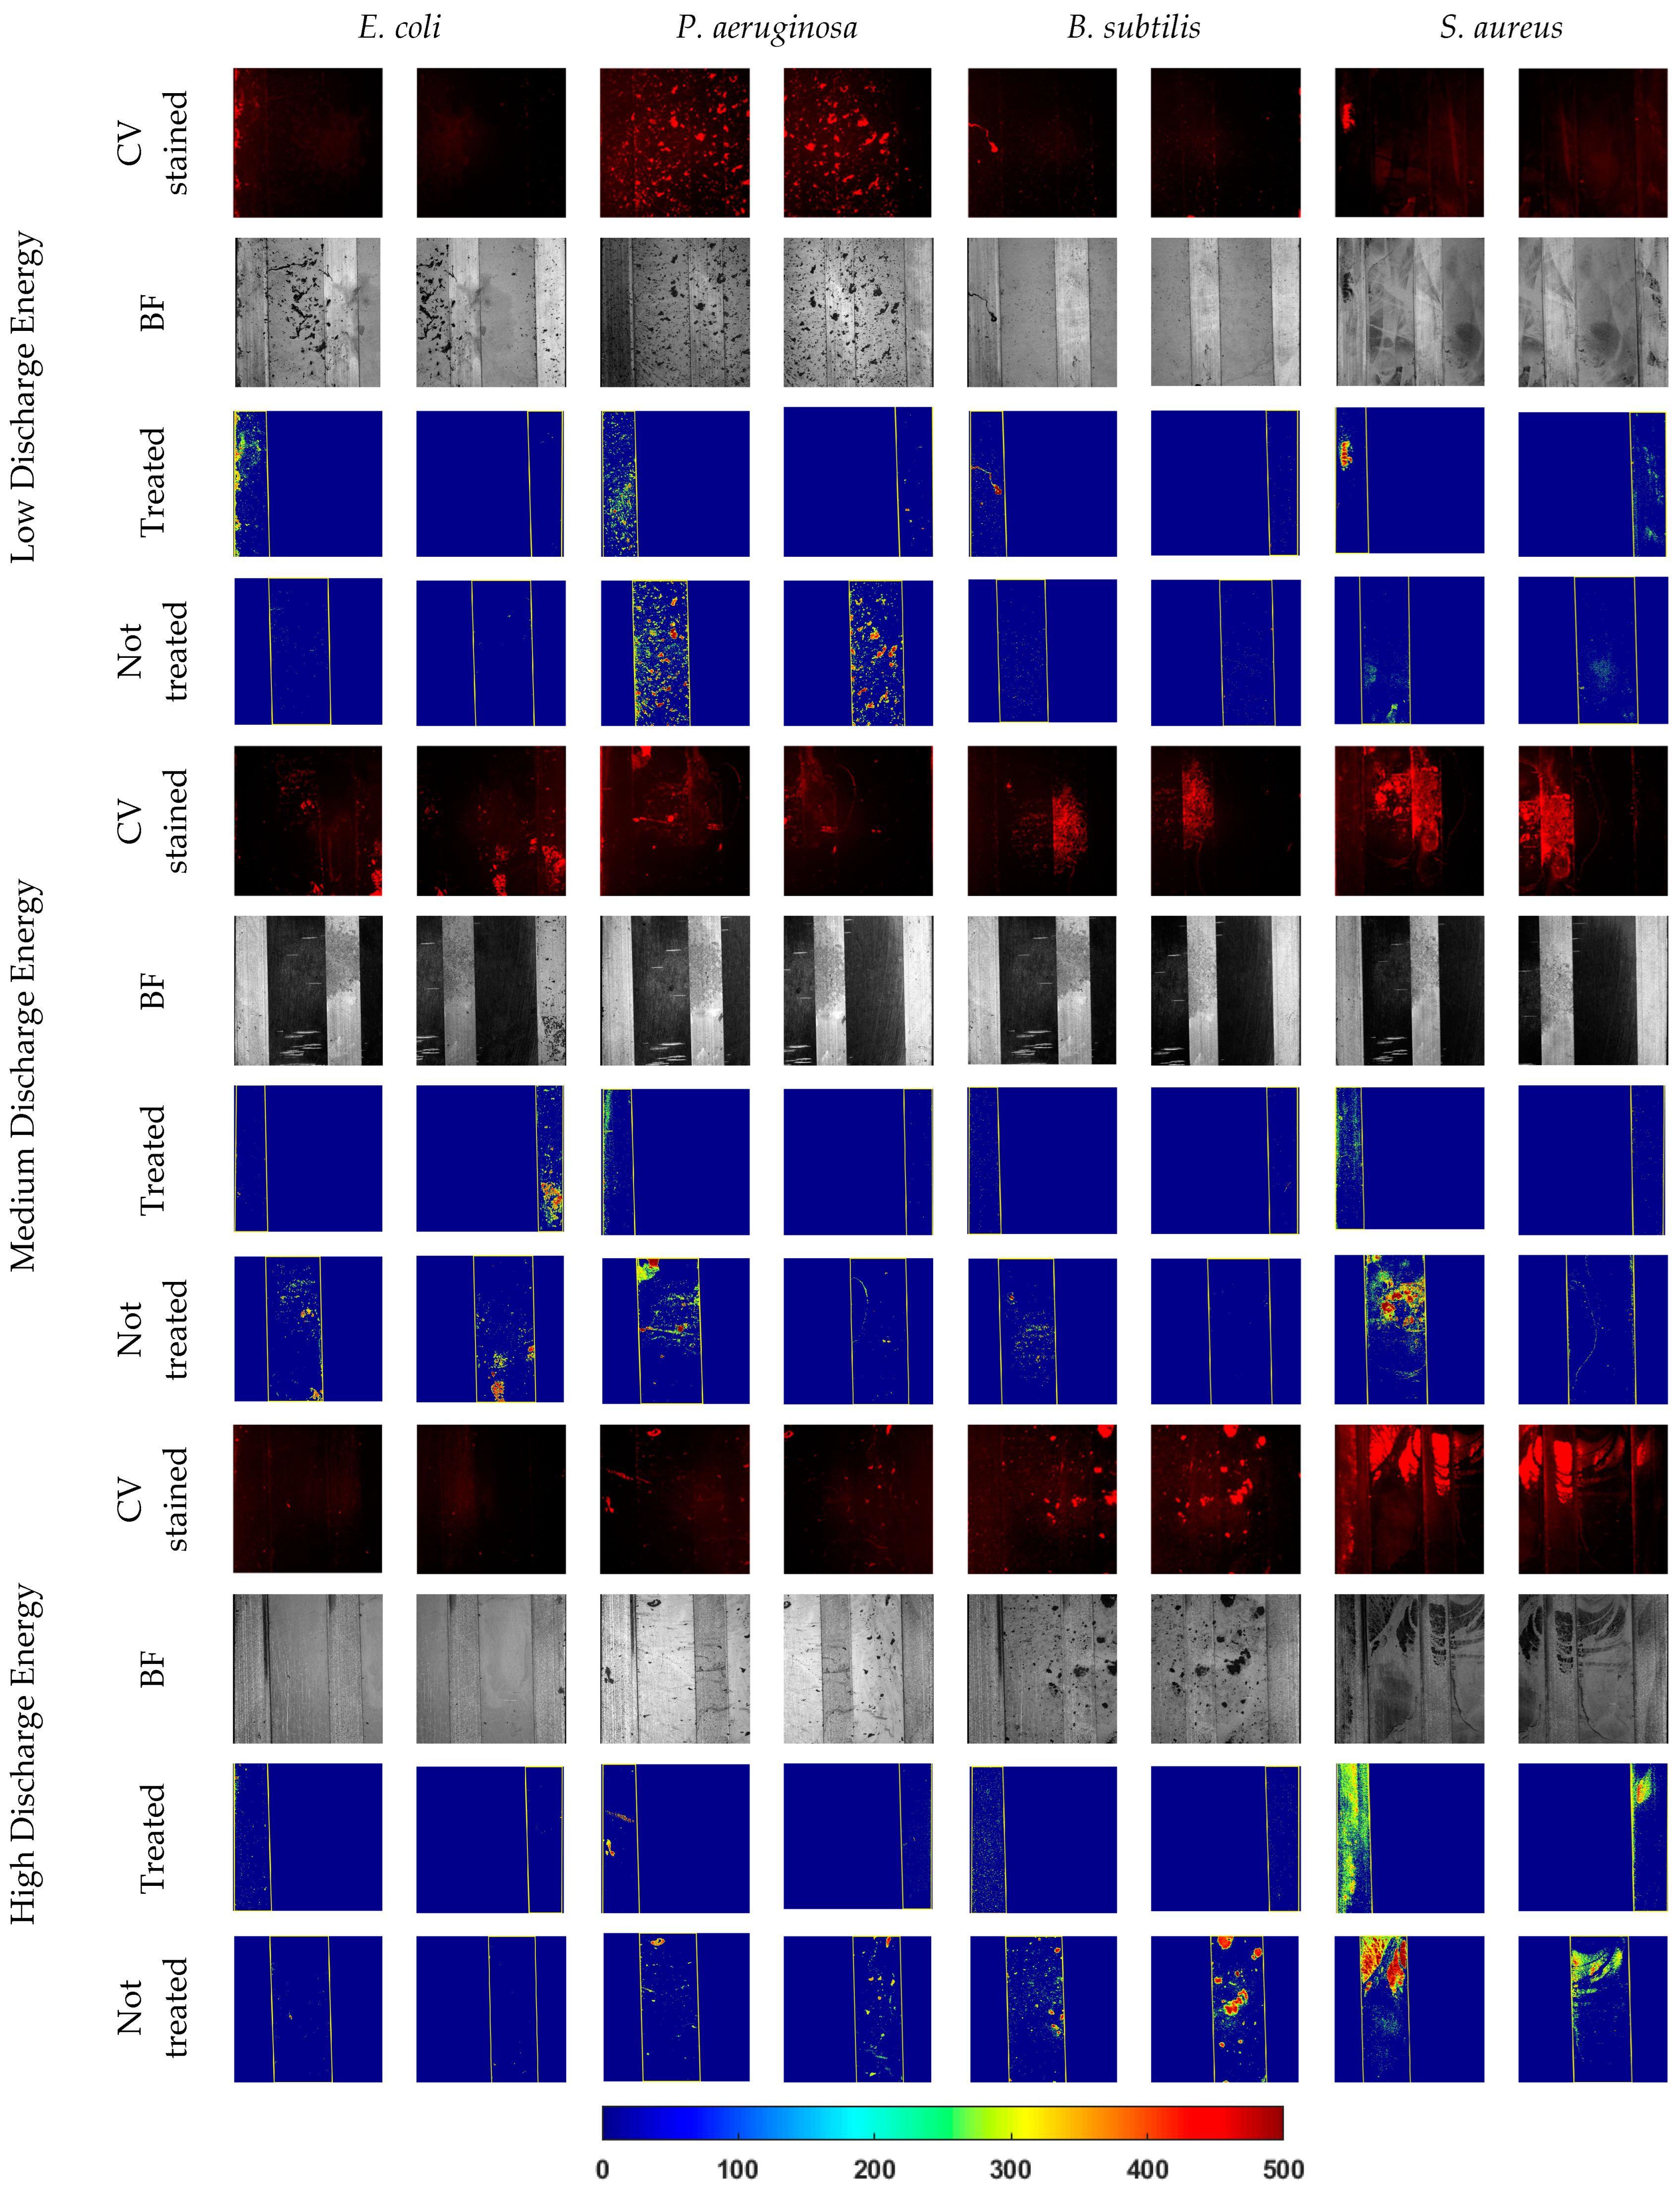
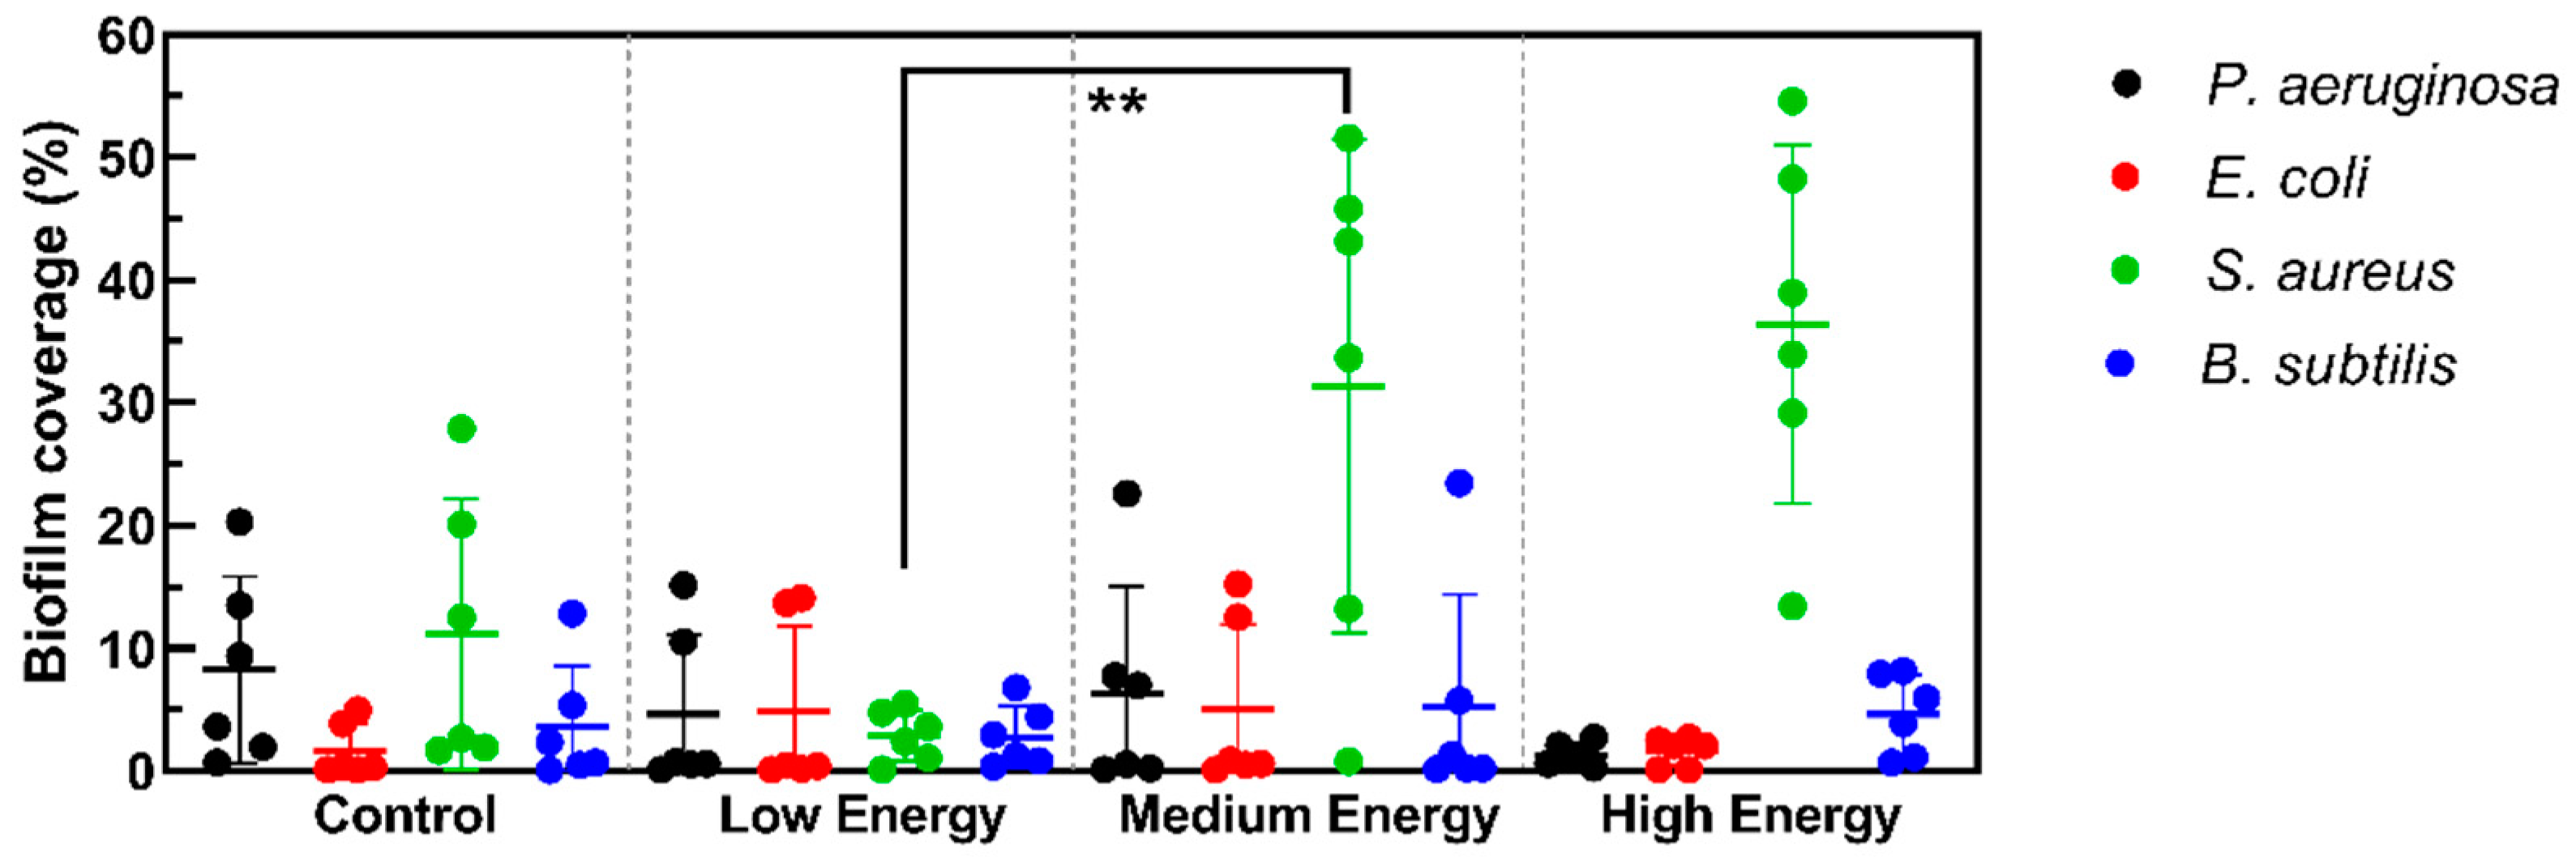
3.4. Antibacterial Response

The effects of various discharge-energy-leveled μ-WEDM treatment of the titanium alloy affected the prevalence of bacteria, Staphylococcus aureus, Escherichia coli, in addition to opportunistic pathogen Pseudomonas aeruginosa found in infections linked to healthcare circumstances. Bacillus subtilis will be used as a control, a nonpathogenic strain of bacteria that is commonly present in soil and human gastrointestinal systems. The complete procedure for testing and quantifying the amount of biofilm that forms on the alloy surfaces is depicted in Figure 6. Controlling discharge energy through capacitance and gap voltage, μ-WEDM is able to modify the surface roughness which is one of the most important parameters affecting biofilm formation. It was studied that increasing surface roughness in the micro scale affects bacteria adhesion accordingly due to increasing the contact area and, hence, increasing adhesion force. However, this correlation is opposite when surface roughness is in nanoscale. In that case, bacteria cover only the top pikes of the surface, having less contact area when the surface roughness increases in nanoscale, therefore preferring to adhere on a smoother surface [51]. Here, the correlation between surface roughness and bacteria was discovered for Ti-29Nb-13Ta-4.6Zr. From a previous analysis on regression models, the resulting surface roughness at low (1 nF and 80 V), medium (10 nF and 95 V) and high (100 nF and 110 V) discharge energy levels were equal to 0.348 μm, 0.820 μm and 1.440 μm, respectively.
Figure 9 shows the representative images of biofilm formation developed by four different bacteria strains, visualized through crystal violet (CV) staining, bright field (BF) microscopy and MATLAB biofilm detection, on μ-WEDM-treated surfaces at three different discharge energy levels. Figure 10 illustrates how the discharge energy level affects the amount of biofilm that forms on the alloy for each strain of bacteria. It should be noted that P. aeruginosa and E. coli showed minimal attachment toward high-energy-treated alloy surfaces which, according to Taguchi regression, had 1.440 μm surface roughness. The amount of biofilm developed is less than 3% of the total surface area.
Figure 10 further illustrates that different μ-WEDM-treated surfaces have varying propensities of attraction to different bacterial species. For example, it clearly shows that the proportion of biofilm coverage for S. aureus was lowest at low discharge energy where surface roughness was equal to 0.348 μm, while it was much higher at medium and high discharge energies where surface roughness was equal to 0.820 μm and 1.440 μm, respectively. Overall, our results seem to suggest that μ-WEDM treatment of Ti-29Nb-13Ta-4.6Zr alloy with the lowest discharge energy (1 nF and 80 V) will minimize the formation of biofilm induced by all four selected strains of bacteria.

4. Conclusions

The performance of μ-WEDM machining of the Ti-29Nb-13Ta-4.6Zr alloy was evaluated in terms of MRR, kerf width, crater size, surface roughness and microhardness by using Taguchi optimization, ANOVA and GRA, while its effect on the bacteria adhesion was investigated for B. subtilis, E. coli, P. aeruginosa and S. aureus bacteria strain. The following points were summarized from the study:
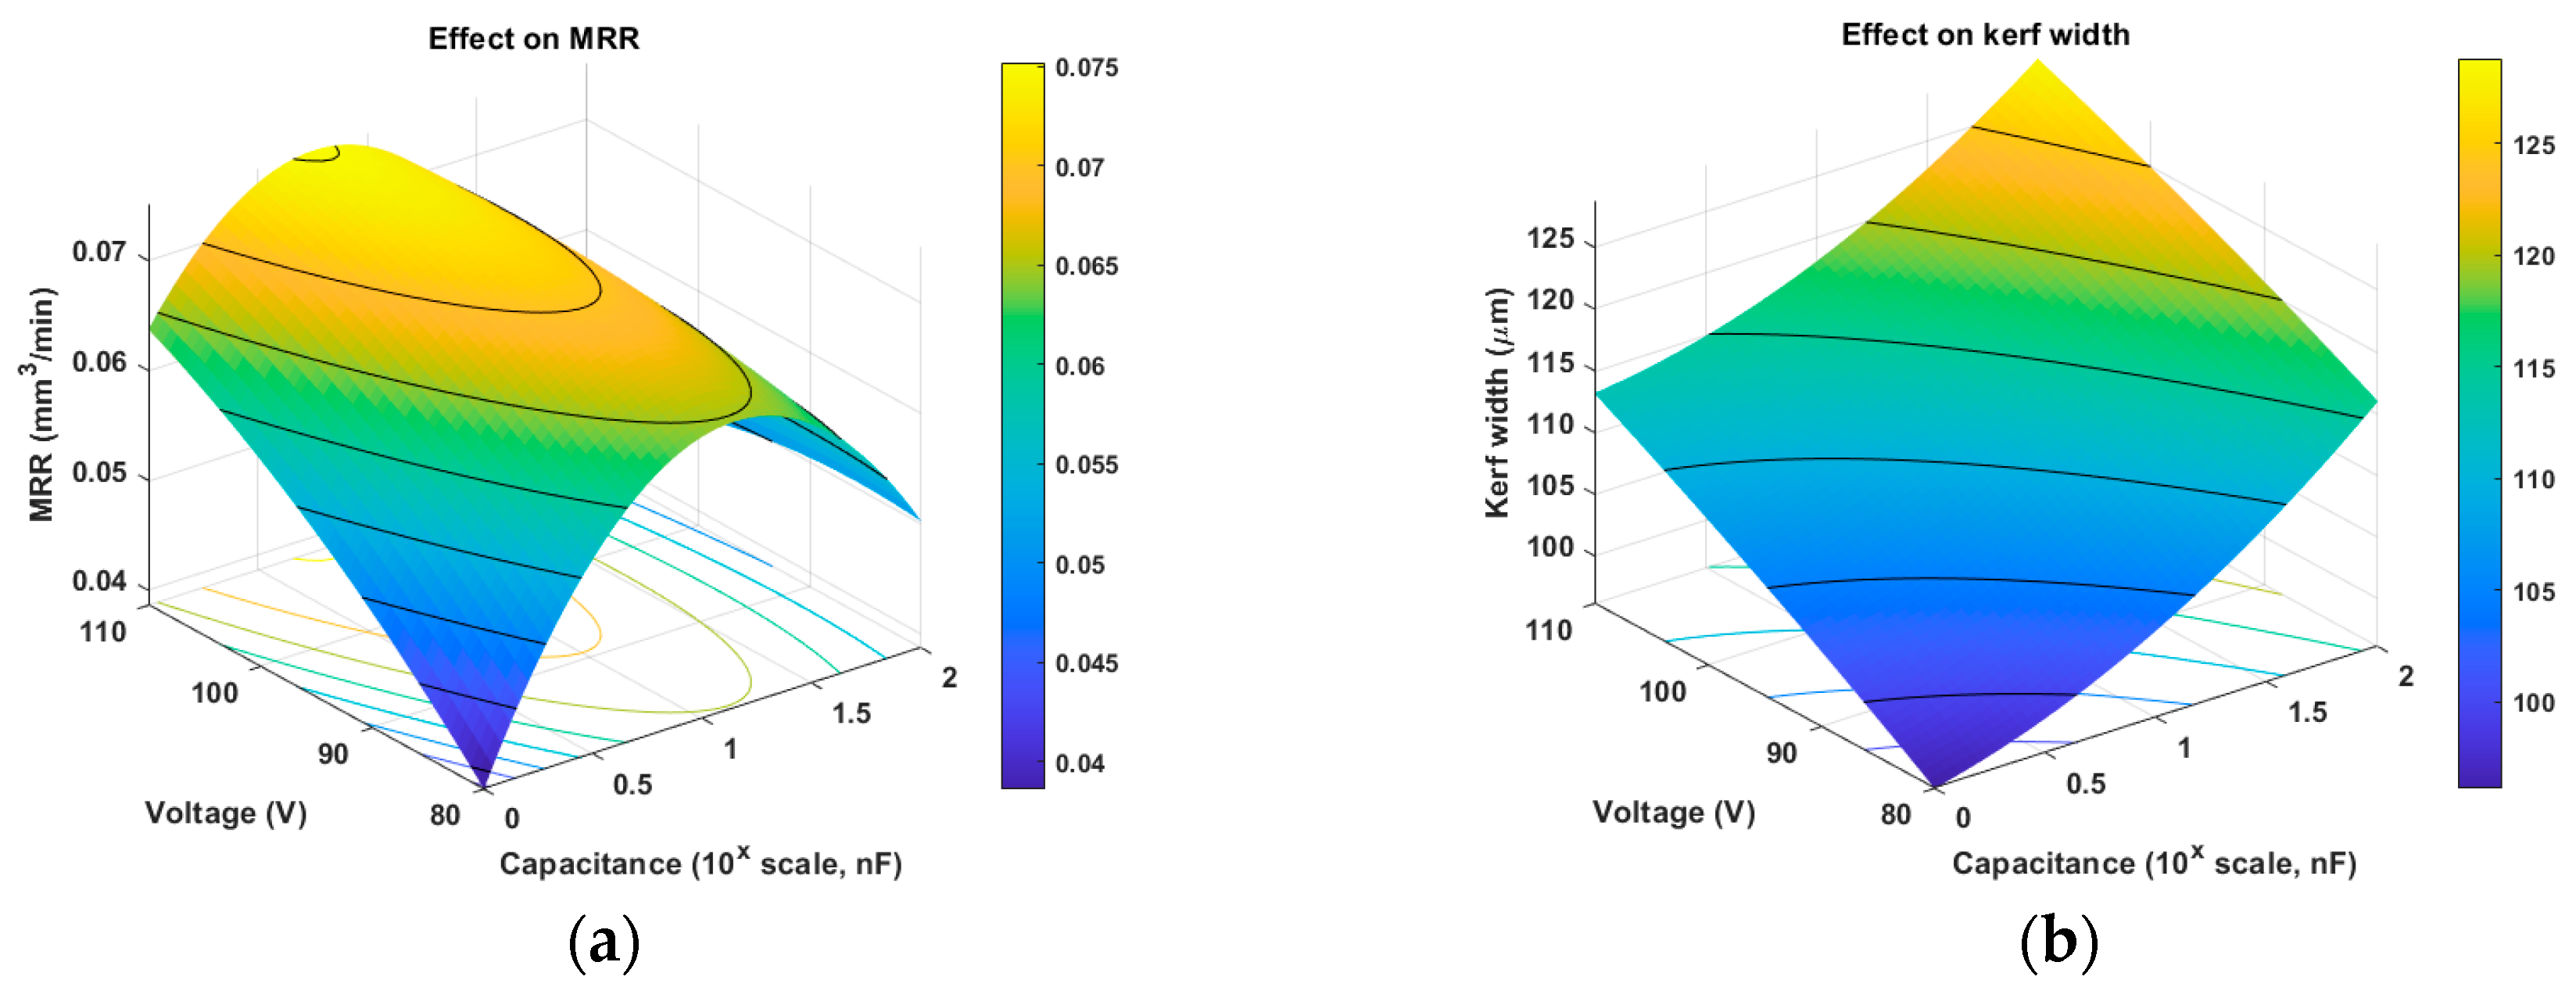
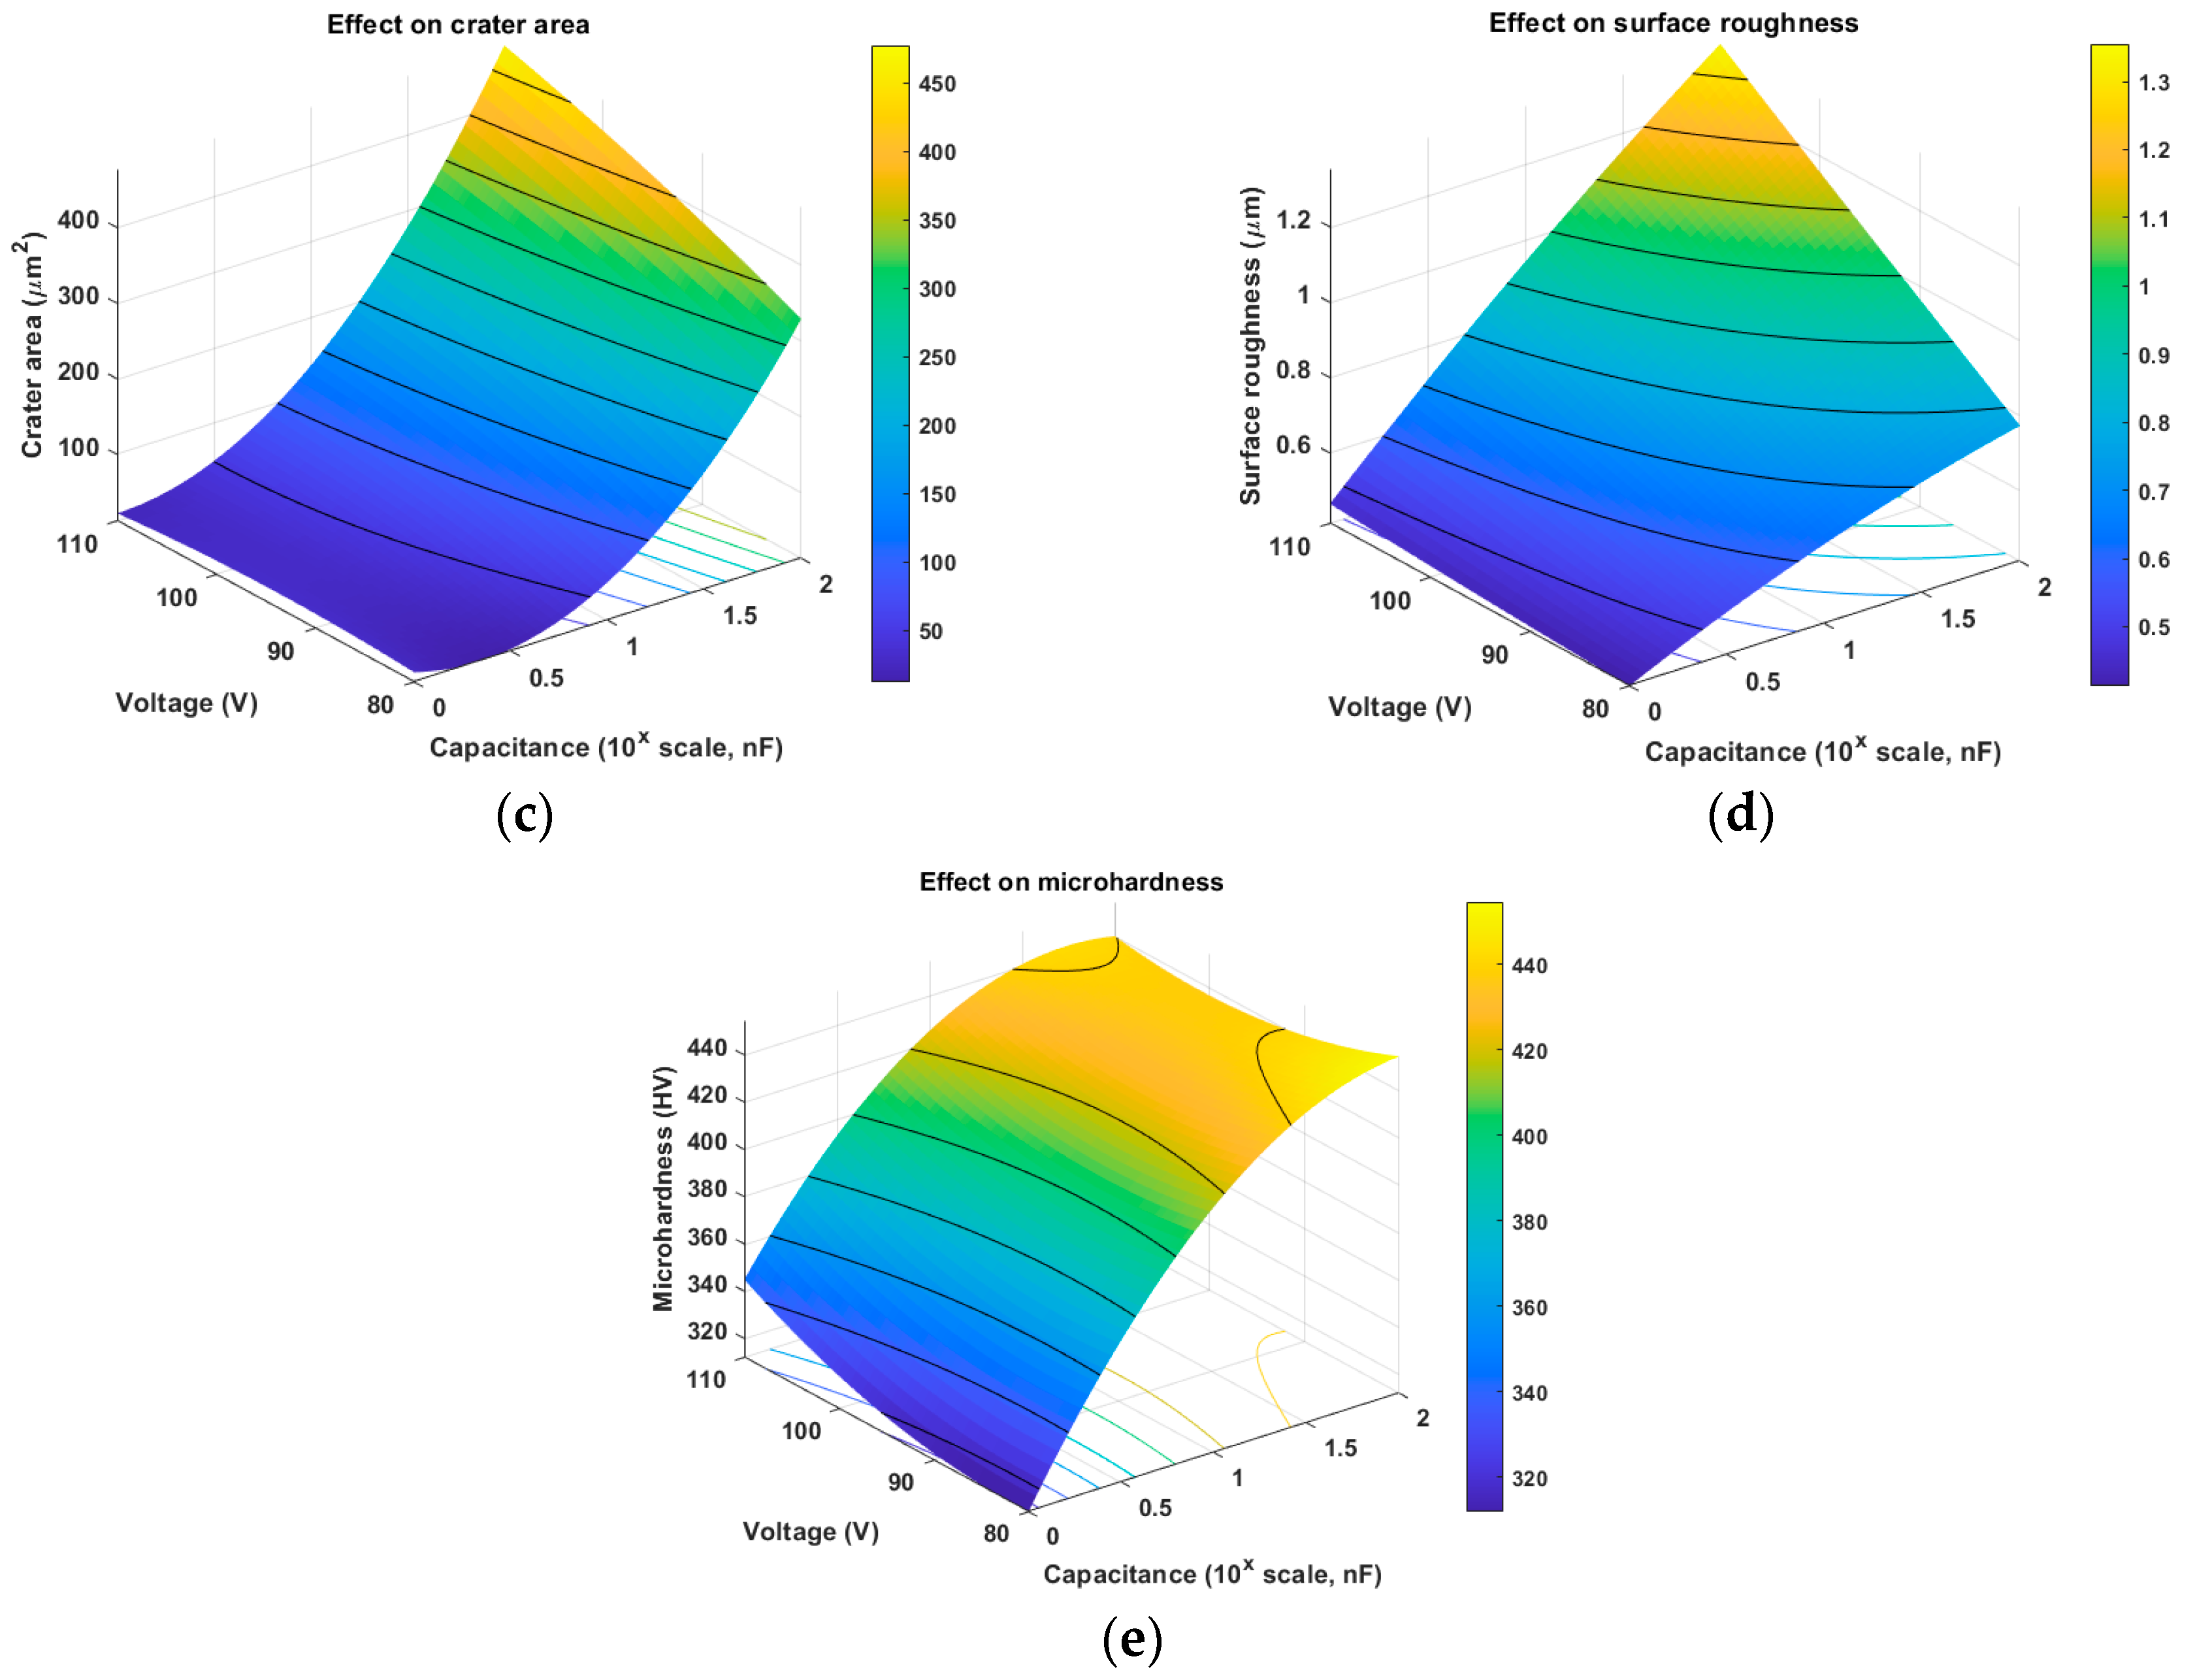
  • Kerf width, crater size, surface roughness and microhardness increased with discharge energy through capacitance and gap voltage. Capacitance had a significant effect for all outputs, gap voltage was significant for kerf width, crater size and surface roughness and their interactions were significant for crater area and surface roughness.
  • MRR had an increase from capacitance level 1 to level 2 following a drop at level 3. Meanwhile, increase in gap voltage contributed to a minor increase in MRR. Despite that, capacitance and the interaction of capacitance and gap voltage had a significant effect, while gap voltage was insignificant. The increase in discharge energy can benefit the amount of material removed per spark; however, insufficient debris removal results in poor machinability.
  • According to Taguchi optimization, 10 nF and 110 V resulted in MRR (0.0637 mm3/min). The optimal parameters were 1 nF and 80 V for kerf width (93.0 μm), crater area (21.8 μm2) and surface roughness (0.348 μm). Microhardness was highest at 100 nF and 110 V and equal to 442 HV.
  • The rank of output parameters of R2 were as follows: crater area (99.6%), surface roughness (89.60%), microhardness (85.99%), kerf width (83.55%) and MRR (72.44%). Crater area, having R2 equal to 99.6%, is strongly affected by capacitance and gap voltage, while MRR, with 72.44% of R2, might have other parameters influencing the results than capacitance and gap voltage.
  • GRA estimated the most optimal conditions for multiple output parameters. Given the same priority values for every output parameter, the most optimal conditions were at 1 nF and 80 V. Comparing GRG from the middle level parameters (10 nF and 95 V) to optimal (1 nF and 80 V), the total improvement was equal to 11.9%.
  • Analysis on biofilm formation of B. subtilis, E. coli, P. aeruginosa and S. aureus on treated surfaces observed improvement in antibacterial properties compared to untreated surfaces; however, specific observations also investigated a decrease of the antibacterial properties of a treated surface compared to untreated. It is suggested that the surface of Ti-29Nb-13Ta-4.6Zr can be treated by μ-WEDM with different discharge energy levels to adjust antibacterial properties accordingly against a specific bacterial strain. However, the least amount of total biofilm formation was achieved at the lowest surface roughness value equal to 0.348 μm obtained at 1 nF and 80 V.

Author Contributions

Conceptualization, A.P.; methodology, A.P and T.T.P.; software, S.A.; validation, T.T.P., A.P. and D.T.; formal analysis, S.A., S.O. and A.U.; investigation, S.A. and A.U.; resources, D.T. and T.T.P.; data curation, S.A. and A.U.; writing—original draft preparation, S.O., S.A. and A.U.; writing—review and editing, T.T.P., A.P. and D.T.; visualization, supervision, T.T.P., A.P. and D.T.; project administration, A.P.; funding acquisition, A.P. All authors have read and agreed to the published version of the manuscript.

Funding

This research study was funded by Nazarbayev University under the project “Multiscale Powder-Mixed EDM-Induced Functional Surfaces on Biomedical Alloys for Enhanced Mechanical, Electrochemical Corrosion, Tribological and Biological Performances”, grant number 11022021FD2917.

Data Availability Statement

The raw data supporting the conclusions of this article will be made available by the authors on request.

Conflicts of Interest

The authors declare no conflicts of interest.

References

  1. Filipović, U.; Dahmane, R.G.; Ghannouchi, S.; Zore, A.; Bohinc, K. Bacterial adhesion on orthopedic implants. Adv. Colloid Interface Sci. 2020, 283, 102228. [Google Scholar] [CrossRef] [PubMed]
  2. Tsakiris, V.; Tardei, C.; Clicinschi, F.M. Biodegradable Mg alloys for orthopedic implants—A review. J. Magnes. Alloys 2021, 9, 1884–1905. [Google Scholar] [CrossRef]
  3. Guo, Z.; Liu, R.; Wang, C.T.; He, Y.; He, Y.; Ma, Y.; Hu, X. Compressive Mechanical Properties and Shock-Induced Reaction Behavior of a Ti–29Nb–13Ta–4.6Zr Alloy. Met. Mater. Int. 2020, 26, 1498–1505. [Google Scholar] [CrossRef]
  4. Carlos, O.; Alejandro, D. Titanium as a Biomaterial for Implants. In Recent Advances in Arthroplasty; Samo, K.F., Ed.; IntechOpen: Rijeka, Croatia, 2012; Chapter 9. [Google Scholar]
  5. Gain, A.K.; Zhang, L.; Lim, S. Tribological behavior of Ti–6Al–4V alloy: Subsurface structure, damage mechanism and mechanical properties. Wear 2021, 464–465, 203551. [Google Scholar] [CrossRef]
  6. Lee, Y.T.; Welsch, G. Young’s modulus and damping of Ti-6Al-4V alloy as a function of heat treatment and oxygen concentration. Mater. Sci. Eng. A 1990, 128, 77–89. [Google Scholar] [CrossRef]
  7. Sidhu, S.S.; Singh, H.; Gepreel, M.A.-H. A review on alloy design, biological response, and strengthening of β-titanium alloys as biomaterials. Mater. Sci. Eng. C 2021, 121, 111661. [Google Scholar] [CrossRef]
  8. Bocchetta, P.; Chen, L.-Y.; Tardelli, J.D.; Reis, A.C.; Almeraya-Calderón, F.; Leo, P. Passive Layers and Corrosion Resistance of Biomedical Ti-6Al-4V and β-Ti Alloys. Coatings 2021, 11, 487. [Google Scholar] [CrossRef]
  9. Omarov, S.; Nauryz, N.; Talamona, D.; Perveen, A. Surface Modification Techniques for Metallic Biomedical Alloys: A Concise Review. Metals 2023, 13, 82. [Google Scholar] [CrossRef]
  10. Senopati, G.; Rahman Rashid, R.A.; Kartika, I.; Palanisamy, S. Recent Development of Low-Cost β-Ti Alloys for Biomedical Applications: A Review. Metals 2023, 13, 194. [Google Scholar] [CrossRef]
  11. Pesode, P.; Barve, S. A review—Metastable β titanium alloy for biomedical applications. J. Eng. Appl. Sci. 2023, 70, 25. [Google Scholar] [CrossRef]
  12. Niinomi, M. Mechanical properties of biomedical titanium alloys. Mater. Sci. Eng. A 1998, 243, 231–236. [Google Scholar] [CrossRef]
  13. Koizumi, H.; Ishii, T.; Okazaki, T.; Kaketani, M.; Matsumura, H.; Yoneyama, T. Castability and mechanical properties of Ti-15Mo-5Zr-3Al alloy in dental casting. J. Oral Sci. 2018, 60, 285–292. [Google Scholar] [CrossRef] [PubMed]
  14. Kaur, M.; Singh, K. Review on titanium and titanium based alloys as biomaterials for orthopaedic applications. Mater. Sci. Eng. C 2019, 102, 844–862. [Google Scholar] [CrossRef] [PubMed]
  15. Bolzoni, L.; Ruiz-Navas, E.M.; Gordo, E. Investigation of the factors influencing the tensile behaviour of PM Ti–3Al–2.5V alloy. Mater. Sci. Eng. A 2014, 609, 266–272. [Google Scholar] [CrossRef]
  16. Canumalla, R.; Jayaraman, T.V. Decision Science-Driven Assessment of Ti Alloys for Aircraft Landing Gear Beams. Aerospace 2024, 11, 51. [Google Scholar] [CrossRef]
  17. Xu, Y.F.; Yi, D.Q.; Liu, H.Q.; Wu, X.Y.; Wang, B.; Yang, F.L. Effects of cold deformation on microstructure, texture evolution and mechanical properties of Ti–Nb–Ta–Zr–Fe alloy for biomedical applications. Mater. Sci. Eng. A 2012, 547, 64–71. [Google Scholar] [CrossRef]
  18. Niinomi, M.; Hattori, T.; Morikawa, K.; Kasuga, T.; Suzuki, A.; Fukui, H.; Niwa, S. Development of Low Rigidity β-type Titanium Alloy for Biomedical Applications. Mater. Trans. 2002, 43, 2970–2977. [Google Scholar] [CrossRef]
  19. Niinomi, M.; Liu, Y.; Nakai, M.; Liu, H.; Li, H. Biomedical titanium alloys with Young’s moduli close to that of cortical bone. Regen. Biomater. 2016, 3, 173–185. [Google Scholar] [CrossRef]
  20. Niinomi, M. Fatigue performance and cyto-toxicity of low rigidity titanium alloy, Ti–29Nb–13Ta–4.6Zr. Biomaterials 2003, 24, 2673–2683. [Google Scholar] [CrossRef]
  21. Sotniczuk, A.; Kuczyńska-Zemła, D.; Kwaśniak, P.; Thomas, M.; Garbacz, H. Corrosion behavior of Ti-29Nb-13Ta-4.6Zr and commercially pure Ti under simulated inflammatory conditions–comparative effect of grain refinement and non-toxic β phase stabilizers. Electrochim. Acta 2019, 312, 369–379. [Google Scholar] [CrossRef]
  22. Rajabi, F.; Zarei Hanzaki, A.; Abedi, H.R.; Farghadany, E. Corrosion behavior of thermo-mechanically processed biomedical Ti-29Nb-13Ta-4.6Zr. J. Alloys Compd. 2017, 725, 23–31. [Google Scholar] [CrossRef]
  23. Gunawarman; Giatmana, D.D.; Ilhamdi; Affi, J.; Fonna, S.; Niinomi, M.; Nakai, M. Corrosion resistance of new beta type titanium alloy, Ti-29Nb-13Ta-4.6Zr in artificial saliva solution. IOP Conf. Ser. Mater. Sci. Eng. 2018, 352, 012008. [Google Scholar] [CrossRef]
  24. Li, S.J.; Yang, R.; Li, S.; Hao, Y.L.; Cui, Y.Y.; Niinomi, M.; Guo, Z.X. Wear characteristics of Ti–Nb–Ta–Zr and Ti–6Al–4V alloys for biomedical applications. Wear 2004, 257, 869–876. [Google Scholar] [CrossRef]
  25. Matos, G.R.M. Surface Roughness of Dental Implant and Osseointegration. J. Maxillofac. Oral Surg. 2021, 20, 1–4. [Google Scholar] [CrossRef]
  26. Ghimire, A.; Song, J. Anti-Periprosthetic Infection Strategies: From Implant Surface Topographical Engineering to Smart Drug-Releasing Coatings. ACS Appl. Mater. Interfaces 2021, 13, 20921–20937. [Google Scholar] [CrossRef]
  27. Liu, Y.; Rath, B.; Tingart, M.; Eschweiler, J. Role of implants surface modification in osseointegration: A systematic review. J. Biomed. Mater. Res. Part A 2020, 108, 470–484. [Google Scholar] [CrossRef] [PubMed]
  28. Al-Amin, M.; Abdul Rani, A.M.; Abdu Aliyu, A.A.; Abdul Razak, M.A.H.; Hastuty, S.; Bryant, M.G. Powder mixed-EDM for potential biomedical applications: A critical review. Mater. Manuf. Process. 2020, 35, 1789–1811. [Google Scholar] [CrossRef]
  29. Mughal, M.P.; Farooq, M.U.; Mumtaz, J.; Mia, M.; Shareef, M.; Javed, M.; Jamil, M.; Pruncu, C.I. Surface modification for osseointegration of Ti6Al4V ELI using powder mixed sinking EDM. J. Mech. Behav. Biomed. Mater. 2021, 113, 104145. [Google Scholar] [CrossRef] [PubMed]
  30. Bharat, N.; Bose, P.S.C. An overview on machinability of hard to cut materials using laser assisted machining. Mater. Today: Proc. 2021, 43, 665–672. [Google Scholar] [CrossRef]
  31. Alkahlan, B.; Tabbakh, T.; Kurdi, A.; Pramanik, A.; Basak, A.K. Formation and Characterization of the Recast Layer Formed on Inconel 718 during Wire Electro Discharge Machining. Materials 2023, 16, 930. [Google Scholar] [CrossRef]
  32. Chen, L.-Y.; Cui, Y.-W.; Zhang, L.-C. Recent Development in Beta Titanium Alloys for Biomedical Applications. Metals 2020, 10, 1139. [Google Scholar] [CrossRef]
  33. Öpöz, T.T.; Yaşar, H.; Murphy, M.F.; Ekmekci, N.; Ekmekci, B. Ti6Al4V Surface Modification by Hydroxyapatite Powder Mixed Electrical Discharge Machining for Medical Applications. In Proceedings of the 18th International Conference on Machine Design and Production, Eskişehir, Turkey, 3–6 July 2018; pp. 787–802. [Google Scholar]
  34. Büssemaker, H.; Meinshausen, A.-K.; Bui, V.D.; Döring, J.; Voropai, V.; Buchholz, A.; Mueller, A.J.; Harnisch, K.; Martin, A.; Berger, T.; et al. Silver-integrated EDM processing of TiAl6V4 implant material has antibacterial capacity while optimizing osseointegration. Bioact. Mater. 2024, 31, 497–508. [Google Scholar] [CrossRef] [PubMed]
  35. Jayakumar, K.; Suresh, T. Effect of wire materials on performance during WEDM of SS304. Mater. Today Proc. 2022, 62, 606–610. [Google Scholar] [CrossRef]
  36. Suresh, T.; Jayakumar, K.; Selvakumar, G.; Ramprakash, S. Experimental investigation on improvement of machinability of SS 304 through multipass cutting in WEDM. Arab. J. Sci. Eng. 2023, 48, 11577–11590. [Google Scholar] [CrossRef]
  37. Manoj, I.V.; Narendranath, S. Wire electric discharge machining at different slant angles during slant type taper profiling of microfer 4722 superalloy. J. Mater. Eng. Perform. 2022, 31, 697–708. [Google Scholar] [CrossRef]
  38. Zhang, T.; Xiao, H.; Zhang, Z.; Yao, B.; Yang, F. Effect of Y2O3 addition on microstructural characteristics and microhardness of laser-cladded Ti-6Al-4V alloy coating. J. Mater. Eng. Perform. 2020, 29, 8221–8235. [Google Scholar] [CrossRef]
  39. Naydenkin, E.V.; Mishin, I.P.; Ratochka, I.V.; Lykova, O.N.; Zabudchenko, O.V. The effect of alpha-case formation on plastic deformation and fracture of near β titanium alloy. Mater. Sci. Eng. A 2020, 769, 138495. [Google Scholar] [CrossRef]
  40. Guo, Z.; Huang, Y.; Sun, C.; He, Z.; Li, Y.; Qiu, H.; Yuan, D.; Zhang, J.; Chu, C.; Shen, B. Preparation and characterization of metastable β-type titanium alloys with favorable properties for orthopedic applications. J. Alloys Compd. 2023, 949, 169839. [Google Scholar] [CrossRef]
  41. Elius, M.; Richard, S.; Boyle, K.; Chang, W.S.; Moisander, P.H.; Ling, H. Impact of gas bubbles on bacterial adhesion on super-hydrophobic aluminum surfaces. Results Surf. Interfaces 2024, 15, 100211. [Google Scholar] [CrossRef]
  42. Knapic, D.; Minenkov, A.; Luczak, W.; Zrinski, I.; Kleber, C.; Hild, S.; Weth, A.; Hassel, A.W.; Mardare, A.I. Hindrance of osteoblast cell adhesion on titanium by surface nanostructuring. Surf. Interfaces 2024, 46, 103990. [Google Scholar] [CrossRef]
  43. Hu, Y.; Zhang, L.; Wang, Z. Experimental study on EDM of network microstructure titanium matrix composites. Mater. Manuf. Process. 2024, 1–13. [Google Scholar] [CrossRef]
  44. Somashekhar, K.P.; Mathew, J.; Ramachandran, N. Multi-objective optimization of micro wire electric discharge machining parameters using grey relational analysis with Taguchi method. Proc. Inst. Mech. Eng. Part C J. Mech. Eng. Sci. 2011, 225, 1742–1753. [Google Scholar] [CrossRef]
  45. Kuriachen, B.; Somashekhar, K.P.; Mathew, J. Multiresponse optimization of micro-wire electrical discharge machining process. Int. J. Adv. Manuf. Technol. 2015, 76, 91–104. [Google Scholar] [CrossRef]
  46. Ali, M.Y.; Banu, A.; Al Hazza, M.H. Analysis of kerf accuracy in dry micro-wire EDM. Int. J. Adv. Manuf. Technol. 2020, 111, 597–608. [Google Scholar] [CrossRef]
  47. Zhou, M.; Mu, X.; He, L.; Ye, Q. Improving EDM performance by adapting gap servo-voltage to machining state. J. Manuf. Process. 2019, 37, 101–113. [Google Scholar] [CrossRef]
  48. Jeswani, M.L. Roughness and wear characteristics of spark-eroded surfaces. Wear 1978, 51, 227–236. [Google Scholar] [CrossRef]
  49. Jahan, M.P.; Alavi, F.; Kirwin, R.; Mahbub, R. Micro-EDM induced surface modification of titanium alloy for biocompatibility. Int. J. Mach. Mach. Mater. 2018, 20, 274–298. [Google Scholar]
  50. Wang, X.; Li, C.; Guo, H.; Yi, S.; Kong, L.; Ding, S. Alternating Energy Electrical Discharge Machining of Titanium Alloy Using a WC-PCD Electrode. J. Manuf. Process. 2020, 60, 37–47. [Google Scholar] [CrossRef]
  51. Yang, K.; Shi, J.; Wang, L.; Chen, Y.; Liang, C.; Yang, L.; Wang, L.-N. Bacterial anti-adhesion surface design: Surface patterning, roughness and wettability: A review. J. Mater. Sci. Technol. 2022, 99, 82–100. [Google Scholar] [CrossRef]
Figure 1. The schematic diagram of μ-WEDM process.
Metals 14 00714 g001
Figure 2. The schematic illustration of kerf width.
Metals 14 00714 g002
Figure 3. Schematic diagram showing how antibacterial tests were performed, visualized and quantified.
Metals 14 00714 g003
Figure 4. Main effects plot of means for (a) MRR, (b) KW, (c) CS, (d) SR and (e) microhardness.
Metals 14 00714 g004
Figure 5. 3D plots of regression models for (a) MRR, (b) KW, (c) CS, (d) SR and (e) microhardness.
Metals 14 00714 g005aMetals 14 00714 g005b
Figure 6. SEM image analysis for the influence of capacitance on the surface morphology at voltage = 95 V and (a) capacitance = 1 nF; (b) capacitance = 10 nF; (c) capacitance = 100 nF.
Metals 14 00714 g006
Figure 7. AFM analysis for the influence of capacitance on the surface morphology at voltage = 95 V and (a) capacitance = 1 nF; (b) capacitance = 10 nF; (c) capacitance = 100 nF.
Metals 14 00714 g007
Figure 8. 3D plots of regression models for GRG.
Metals 14 00714 g008
Figure 9. Representative images of crystal violet-stained, bright field (BF) and MATLAB biofilms detection of bacterial biofilms for all bacterial strains on μ-WEDM-treated TNTZ surfaces with different discharge energy levels and untreated surfaces. Quantifications of the percentage of biofilm coverage on machined surfaces was estimated within the yellow box.
Metals 14 00714 g009
Figure 10. Comparison of the percentage of biofilm coverage for all four bacterial strains on three different energy-level-treated surfaces as well as untreated surfaces.
Metals 14 00714 g010
Table 1. Ultimate tensile strength and elastic modulus of titanium alloys.
MaterialAlloy TypeUTS (MPa)Elastic Modulus (GPa)Refs.
Cortical bone-119.4–150.614–21.8[9,10]
CP Tiα240–500100–115[9,11]
Ti-6Al-4V (annealed)α+β895–930110–114[9,10,12]
Ti-6Al-7Nbα+β900–1050105–114[9,11,12,13]
Ti-5Al-2.5Feα+β1020–1033110–112[9,11,12,14]
Ti-3Al-2.5Vα+β620–690100–107 [9,11,15]
Ti-6.5Al-3.3Mo-0.3Siα+β91165[16]
Ti-15V-3Cr-3Al-3Snβ124882 [16]
Ti-10V-2Fe-3Alβ965–1193 109.6[16]
Ti-29Nb-13Ta-4.6Zrβ91165[11]
Ti-35Nb-5Ta-7Zrβ590–597 55[9,11,17]
Ti-15Moβ874–92178–84 [9,10,11]
Ti-13Nb-13Zrβ970–104077–84[9,11]
Ti-12Mo-6Zr-2Feβ1060–110074–85[11]
Ti-15Mo-5Zr-3Alβ880–98075–88[9,11]
Table 2. EDS analysis of Ti-29Nb-13Ta-4.6Zr alloy before and after machining.
Surface ConditionTi (wt%)Nb (wt%)Ta (wt%)Zr (wt%)Si (wt%)O (wt%)C (wt%)W (wt%)
Pure TNTZ *52.2230.5212.494.77----
Not treated42.1924.4310.193.812.478.898.03-
Low-energy treated33.6027.8013.503.670.562.3516.102.42
Medium-energy treated35.7927.5212.894.070.531.7915.651.76
High-energy treated39.6626.9112.474.300.361.5413.021.74
* Calculations for “Pure TNZT” was based on “Not treated” by excluding Si, O and C elements to show the correlation between the composition and definition of the alloy.
Table 3. Experimental conditions for the μ-WEDM process.
ParameterValueUnit
Gap voltage80, 95, and 110V
Capacitance1, 10, and 100nF
Wire speed0.8377mm/s
Feed rate1.5μm/s
Wire tension8.25 g-wt
Depth of cut50μm
Wire diameter50μm
Workpiece polarityPositive
Table 4. Input parameters and their values for Taguchi design.
ParametersFactorLevel 1Level 2Level 3
Capacitance (nF)A110100
Gap Voltage (V)B8095110
Table 5. L27 orthogonal array and results.
Exp. No.Factors MRR (mm3/min)Kerf Width
(μm)
Crater Size (μm2)Average Surface Roughness (μm)Microhardness (HV)
AB
1110.026689.6190.457343
2110.034594.8220.276270
3110.030595.6240.311313
4120.0636116.6230.635312
5120.0582104.8330.324315
6120.0546104.8240.399349
7130.0665113.2280.504326
8130.0671113.2310.567316
9130.0663110.7340.468385
10210.0921112.4950.611409
11210.068995.6740.820436
12210.0670106.5660.720409
13220.0635111.51150.778363
14220.0749111.5890.761441
15220.0721112.4930.921423
16230.0421119.91230.931419
17230.0846119.11280.661433
18230.0645108.21330.832425
19310.0410118.33280.908446
20310.0394115.73130.496463
21310.0593117.53080.831459
22320.0550120.14341.142456
23320.0416117.54510.991432
24320.0411118.33920.876416
25330.0469135.04761.339429
26330.0509121.64731.421463
27330.0578139.24801.561435
Table 6. ANOVA for MRR.
SourceDFSS (×10−3)MS (×10−3)FpContribution
A22.451.2211.810.0036.17%
B20.460.232.210.146.78%
A × B42.000.504.820.0129.49%
Error181.860.10 27.56%
Total266.77 100%
R2 = 72.44%R2 (adj) = 60.19%
Table 7. ANOVA for kerf width.
SourceDFSSMSFpContribution
A21468734.1025.170.0046.01%
B21004502.1017.210.0031.47%
A × B419448.401.660.206.07%
Error1852529.20 16.45%
Total263191 100%
R2 = 83.55%R2 (adj) = 76.23%
Table 8. ANOVA for crater area.
SourceDFSSMSFpContribution
A2727.40363.692137.960.0093.92%
B224.4012.1971.640.003.15%
A × B419.704.9228.930.002.54%
Error183.100.17 0.40%
Total26774.50 100%
R2 = 99.60%R2 (adj) = 99.43%
Table 9. ANOVA for average surface roughness.
SourceDFSSMSFpContribution
A21.760.8851.600.0061.37%
B20.450.2313.250.0015.76%
A × B40.350.095.120.0112.17%
Error180.310.02 10.70%
Total262.87 100%
R2 = 89.30%R2 (adj) = 84.54%
Table 10. ANOVA for microhardness.
SourceDFSS (×103)MS (×103)FpContribution
A270.0135.0053.100.0082.66%
B20.890.440.670.521.05%
A × B41.930.480.730.582.28%
Error1811.870.66 14.01%
Total2684.69 100%
R2 = 85.99%R2 (adj) = 79.76%
Table 11. Calculation of GRG.
No. Exp.Grey Relation Coefficient Grey Relation GradeAverage Grey Relation Grade
MRRKerf WidthCrater AreaAverage Surface RoughnessMicrohardness
10.3331.0001.0000.8270.4460.7210.707
20.3620.8270.9881.0000.3330.702
30.3470.8050.9800.9610.3910.697
40.5340.4790.9840.7070.3900.6190.659
50.4910.6190.9460.9470.3950.680
60.4660.6190.9790.8750.4580.680
70.5610.5120.9650.7910.4130.6490.655
80.5670.5120.9510.7480.3960.635
90.5590.5400.9420.8180.5530.682
101.0000.5210.7520.7210.6410.7270.702
110.5850.8050.8090.6140.7810.719
120.5660.5940.8310.6610.6410.659
130.5330.5310.7070.6330.4910.5790.632
140.6550.5310.7670.6410.8140.681
150.6210.5210.7580.5730.7070.636
160.3960.4500.6900.5690.6870.5580.620
170.8130.4570.6790.6920.7630.681
180.5420.5720.6700.6090.7170.622
190.3900.4640.4280.5780.8500.5420.587
200.3830.4870.4400.7971.0000.621
210.4990.4710.4440.6090.9600.597
220.4680.4490.3570.5000.9320.5410.515
230.3930.4710.3480.5470.7570.503
240.3910.4640.3820.5900.6720.500
250.4200.3530.3350.4490.7390.4590.485
260.4420.4370.3370.4301.0000.529
270.4880.3330.3330.4020.7750.466
Table 12. ANOVA for GRG.
SourceDFSS (×10−3)MS (×10−3)FpContribution
A2109.5054.7736.700.0064.72%
B230.8015.4210.330.0018.22%
A × B42.000.500.330.851.18%
Error1826.901.49 15.87%
Total26169.30 100%
R2 = 84.13%R2 (adj) = 77.07%
Table 13. Means of GRG.
ParametersLevel 1Level 2Level 3DeltaRank
Capacitance0.6740.6510.5290.1451
Gap Voltage0.6650.6020.5870.0782
Total mean value of GRG0.618
Table 14. Means of GRG.
Initial ParametersTaguchi OptimizationGRA OptimizationInitial Parameters
Levels
LevelsA2B2 A1B1
MRR (mm3/min)0.0702 *A2B30.06370.03056
Kerf width (μm)111.8 *A1B193.093.0
Crater size (μm2)99.1 *A1B121.821.8
Average surface roughness (μm)0.820 *A1B10.3480.348
Microhardness (HV)409 *A3B3 442309
GRG0.632 *A1B10.7070.707
Improvement in GRG = 0.075 or 11.9%
* Value based on taking average three experiments with the same experimental conditions.
Disclaimer/Publisher’s Note: The statements, opinions and data contained in all publications are solely those of the individual author(s) and contributor(s) and not of MDPI and/or the editor(s). MDPI and/or the editor(s) disclaim responsibility for any injury to people or property resulting from any ideas, methods, instructions or products referred to in the content.

