1. Introduction
Due to ever-increasing production volumes and demand, the metalworking industry is developing rapidly. The need to process different materials and their thicknesses and shapes has greatly increased, which is a big challenge for the industry. Competition in the metalworking industry is becoming increasingly fierce [
1]. Recently, the metalworking industry has been looking for ways to achieve maximum process performance. This means an aspiration to produce a product as quickly as possible and at the lowest cost of materials while maintaining high quality [
2]. These goals can be achieved in two ways: the intelligent utilization of available technological capabilities and trying to switch to new technological processes. So, the question arises: how can we choose one of the many methods of metal processing to meet a company’s needs?
Conventional production methods are still widely used in metalworking companies, the principle of which is to remove a layer of metal as the workpiece or tool rotates. They have several advantages as they are firmly established in the manufacturing industry and have produced reliable results for many years. Since various interchangeable cutting tools are used during these technological processes, they are versatile and can be used to produce parts of complex shapes. However, they also have major drawbacks, such as being time-consuming and still requiring manual labor, and, most importantly, turning, milling, drilling, and other machining operations generate large amounts of production waste such as loose metal chips or metal shavings mixed with coolants used in machining operations [
3]. Furthermore, the manufacturing sector has been identified as a significant consumer of European electricity. Indeed, it is estimated that this sector utilizes approximately 25% [
4] of all electricity generated in the continent. This observation leads to the conclusion that the manufacturing sector is also responsible for a substantial proportion of the environmental pollution released during the production of electricity [
4]. As a result, there is a growing focus on sustainable manufacturing. The primary objective of this approach is to achieve the most efficient transformation of materials into final products through the use of environmentally friendly processes [
5].
Consequently, to process external and internal contours quickly, non-traditional processing methods (such as abrasive water jet cutting, laser cutting, electrochemical processing, etc.) are increasingly used as an alternative to conventional recycling processes. Compared to the previously mentioned conventional machining methods, the metalworking industry is characterized by wider application possibilities and higher productivity while maintaining the same, and often even higher, machining accuracy [
3,
6]. These methods differ from conventional processing methods in terms of their operation principle; in particular, there is no direct contact between the tool and the cut surface during processing. The material is processed under the influence of various types of energy, such as mechanical, chemical, and thermal, which depends on the chosen cutting method. Laser cutting is mainly a thermal process in which a focused laser beam is used to melt the material at a specific location [
7]. The high-power laser beam heats and fuses the material to be cut, which is pushed out from the cutting area by a coaxial gas stream, creating a gap. The operation, in general, is based on computer numerical control (CNC). The CNC controller can continuously monitor the laser-cutting head according to a pre-prepared cutting program, where the laser movement trajectory and the main cutting parameters are predicted [
8]. Laser-cutting machines for cutting sheet metal typically operate within a three-axis coordinate system. The
X-
Y axes are parallel to the surface of the processed workpiece and define the coordinates of the movement trajectory. The
Z axis, perpendicular to the surface of the workpiece, indicates the distance of the laser nozzle to the workpiece [
9].
The popularity of laser cutting has grown rapidly mainly due to its technical capabilities, allowing industrial lasers to be used in many fields, from precision watchmaking to the aerospace industry [
10]. However, although laser cutting offers new opportunities for mechanical processing, like other processes, it also has inevitable disadvantages related to the quality of the parts. During the laser-cutting process, high surface roughness, insufficient accuracy of dimensions and cut geometry, slag or temperature-affected zones are encountered.
Laser cutting is usually followed by other technological processes (e.g., forming, joining, coating). For this reason, the quality of the part’s laser processing is of the utmost importance, as surface defects can affect other operations and the accuracy and quality of the final product. As an example, during welding, an uneven cutting edge can make it difficult to position the part correctly, and the dimensional accuracy of the welded assembly can also decrease. Moreover, the quality of the cutting edges is also crucial during the final technological operations, such as powder-coating or galvanizing. The adhesion of the coating is directly dependent on the quality of the cutting edges, as evidenced by research studies [
11,
12]. Solving such laser-cutting quality problems is particularly important because the insufficient quality of manufactured parts can affect their durability and reliability [
13].
For this reason, scientists conduct various studies to determine the causes of quality defects in laser-processed parts [
14]. The main research direction is the evaluation of the influence of laser-cutting input parameters (cutting speed, laser power, type of auxiliary gas, laser beam pressure or focal length) on the quality of processed components and the search for the best parameter sets [
15]. However, it should be noted that the selection of parameters often becomes difficult when changing the cutting parameters, which improves the values of some quality characteristics but simultaneously worsens other characteristics. However, the selection of these parameters is often conducted through a trial-and-error approach, which is an ineffective method that may result only in increased operator time and material costs and ultimately may not achieve the optimal cutting quality [
14]. To avoid this, it is very effective to perform optimization, during which the values of the input parameters can be found with which the cutting quality would be optimal, i.e., all evaluated characteristics should meet at least the minimum requirements. For some time, analytical, numerical and experimental techniques were employed to investigate the laser-cutting process [
16,
17]. However, conventional optimization methods are often ineffective in improving the laser-cutting process due to the multitude of factors influencing the process. To fully identify and resolve quality issues and optimize the process, it is essential to conduct extensive research [
17]. Recently, to reduce the number of experimental trials, more advanced methods based on artificial intelligence (AI) have been used, which, even with limited data, are capable of identifying complex relationships between variables [
17]. It follows that artificial intelligence can be practically applied to the resolution of engineering problems, the monitoring of production processes, and the automatic correction of process parameters in the event of deviations beyond the established tolerance limits. Recent advancements in the field of AI have enabled the application of these techniques to the modelling and optimization of the laser-cutting process [
16]. For example, Ref. [
18] used ANNs to forecast surface roughness and cutting region temperature in relation to laser power, sheet thickness, and auxiliary gas pressure when processing Al6061T6 alloy. Results shows that a mean error value between predicted and experimental values was 0.66% for the cutting region temperature and 5.79% for the surface roughness [
18]. The creation of ANNs enabled a more comprehensive understanding of the relationships between surface roughness and cutting region temperature, as influenced by each of the parameters under investigation. In conclusion, the advancement of manufacturing processes can only be achieved through the implementation of advanced solutions such as the Internet of Things (IoT), machine learning, and artificial intelligence [
19,
20]. These methods, acting in synergy, can collect data on the quality characteristics of the laser-cutting process and, when deviations are observed, control the process parameters to bring the quality back to optimum [
21,
22].
Currently, the integration of such advanced tools into a real production environment is unfortunately still a challenging process because when creating optimization models, first, there is a need to know the influence of each process parameter on the product quality, and secondly, there is a need to understand the essence of the process perfectly. In the metalworking sector, several types of laser-cutting machines (such as CO
2 or fiber) are used, which differ in their principle of operation. Such a difference causes difficulties in the analysis of the quality characteristics of laser cutting since quality characteristics studies must be carried out separately for each type of laser. Since the first industrial use of laser cutting in 1967, when researchers tried to process a 1 mm thick steel plate with a 300 W CO
2 type laser [
23,
24], there have been obvious advances in laser processing—lasers are much more powerful, and more types of lasers are used in the manufacturing industry, which are classified according to the active medium where the laser beam is generated. The active material of the CO
2-type laser is a mixture of carbon dioxide (CO
2), nitrogen (N
2) and helium (He) gases, and the fiber-type laser is an optical fiber. CO
2 lasers have been used for cutting for a long time, but recently, the newer fiber-laser technology has become increasingly popular. The main characteristics that distinguish CO
2 and fiber lasers are wavelength (10.6 µm and 1.07 µm, respectively), energy efficiency (5–8% and 20–30%), maintenance (every 2000 h and every 10,000 h) and device area occupied (large and small) [
23]. It is important to mention that the laser’s wavelength greatly influences the efficiency of the process. A beam with a shorter wavelength is more easily absorbed by the material being cut, so fiber lasers, due to their ten-times shorter wavelength, have a higher cutting efficiency, acceleration, and maximum cutting speed [
8,
25]. In addition, the shorter wavelength of the fiber laser can cut various materials, such as copper, nickel and its alloys or composite materials [
23]. Among the advantages of fiber lasers, infrequent servicing can also be attributed to a reduction in service costs and device downtime. The advantages of the mentioned “fiber”-type lasers can be attributed to rare maintenance, which reduces service costs and device downtime. It has been established that fiber lasers can be a good alternative to other plate-metal processing technologies, such as coordinate stamping or guillotine cutting. It is often even superior because the high speed of cutting thin-plate metal creates less residual stress in the material than mechanical cutting. In addition, the laser can cut a variety of contours without the additional tools required to cut the contour using coordinate stamping [
25].
On the other hand, the main disadvantages of fiber lasers are their high cost and the deterioration of cutting quality when processing thicker materials [
23]. It is important to mention that when the thickness of the material exceeds 4 mm, the quality of the processing significantly decrease [
24,
26]. Consequently, in order to utilize this type of laser for processing such materials, it is essential to pay close attention to the cutting process with regard to the input parameters. Therefore, the main goal of this scientific article is to evaluate the influence of laser-cutting input parameters when cutting plates thicker than 4 mm and to find an optimal set of input parameters. A detailed review of the published sources showed that much less research had been conducted on fiber lasers than on CO
2 lasers. Further research is needed on the cutting quality of the first-type lasers. Considering this, it was decided in this research study to evaluate the influence of fiber-laser cutting input parameters when cutting plates thicker than 4 mm. The quality of the cut was the primary area where these parameters have a significant impact. Consequently, the primary objectives of the research were to measure the roughness of the cut surface, evaluate the accuracy of laser cutting, determine the kerf taper, evaluate the laser-cutting thermal effect for the material, and finally, create a laser-cutting quality optimization model based on artificial neural networks (ANNs).
2. Materials and Methods
Hot-rolled mild S355JR steel (EN 1.0045) specimens with thickness of 4 and 6 mm were used for laser-cutting experiments. This unalloyed structural steel can be used to produce parts that will be subjected to various loads due to its chemical composition and mechanical properties (
Table 1). Furthermore, S355JR steel has good weldability, allowing for a wide range of welding methods [
27]. Due to its widespread use in the metalworking industry, it was selected for further research.
Laser-cutting quality tests were performed using a 4 kW Prima Power Platino Fiber 1530 fiber-laser cutting machine(MASZYNERIA SP. Z O.O., Jelenia Góra, Poland).
A number of factors can significantly influence the quality of laser cutting, including laser power, cutting speed, auxiliary gas pressure, focal plane position (FPP), laser stand-off distance, and laser nozzle type and diameter. Despite the considerable influence that all these factors have on cutting, the present study focuses on examining the effects of laser power, cutting speed, and auxiliary gas pressure.
During the cutting experiments, these key process parameters were varied, while the values of the stand-off distance (1.2 mm), focal plane position (8 mm), and frequency (1000 Hz) remained constant. The laser-cutting process for both material thicknesses was performed using oxygen auxiliary gas and a conical copper laser nozzle of Ø1.5 mm diameter.
The choice of cutting parameters has a direct effect on the amount of linear energy transferred to the cutting zone. Linear energy is calculated according to Equation (1) [
29]:
where
El—linear energy, J/mm;
P—laser power, W;
t—machining time, s;
L—laser-cutting length, mm.
The machining time
t is calculated:
where
v—cutting speed, mm/min.
Inserting Equation (2) into Equation (1) gives a simplified Equation (3) for calculating linear energy:
The quality characteristics of the samples, such as surface roughness, cutting accuracy, kerf taper and heat-affected zone depth were measured to evaluate the influence of the laser-cutting parameters on the cut quality. First, the roughness of the side-cut surface of the samples cut with different parameters was determined using a Mitutoyo SJ-210 profilometer (Kawasaki, Japan). According to ISO 4287:1997 [
30], a measuring speed of 0.5 mm/s was chosen, and the measuring distance was
ln = 12.5 mm, divided into five equal sampling lengths of
lr = 2.5 mm each. The following roughness parameters were selected for the roughness measurement of laser-cut samples: average surface roughness
Ra, the average roughness depth
Rz, and the maximum roughness depth
Rz1max [
30]. The surface roughness of each sample was evaluated in the middle of its thickness. Also, measurements were performed twice, once on the longer side and once on the shorter side, and then the average roughness parameters (
Ra,
Rz and
Rz1max) were calculated for each sample.
The quality of laser cutting can also be assessed by analyzing dimensional accuracy. For this purpose, the 15 dimensions of the sample shown in
Figure 1 were chosen. For measuring the defined dimensions, a Mitutoyo CRYSTA-Apex 9106 (Kawasaki, Japan) coordinate-measuring machine with a measuring accuracy of 0.002 µm was used. The measurements were carried out in the laboratory at a constant temperature of 20 °C.
The dimensional deviation was calculated by comparing the measured dimension values with the nominal dimensions determined before cutting. The obtained cutting accuracy was compared with the dimensional tolerances specified in ISO 9013:2017 [
31] for parts produced by thermal cutting methods such as laser or plasma cutting. Since the laser cut is often not perpendicular, the selected dimensions were measured on the top and bottom surfaces of the sample. From these measurements, a kerf taper was calculated, which describes the difference in each measured dimension on both surfaces of the sample. The kerf taper angle was calculated using Equation (4) [
32]:
where
α—kerf taper angle, °;
TS—dimension value on the top surface, mm;
BS—dimension value on the bottom surface, mm;
t—thickness of the sample, mm. Based on the kerf taper angle value, the direction of the taper can be determined. A positive angle indicates that the cut tapers from the top to the bottom surface, while a negative angle indicates that the cut tapers from the bottom to the top surface.
In addition, to analyze the thermal effect of laser cutting on the metal alloy, six samples were selected for further analysis. The selection was based on the results of previous experiments on surface roughness, dimensional and geometric accuracy. Samples characterized by good, medium, and poor cutting quality were selected for further analysis. To evaluate the thermal impact on the metal alloy, smaller test pieces were taken from the selected samples and molded into epoxy resin. A LAM PLAN SMARTLAM 2.0 grinding machine was used to grind and polish the test pieces. Grinding was performed in four stages using different types of sandpaper (180, 600, 1500 and 2500) and by changing the grinding direction after each stage. Following this, a diamond emulsion was used to polish the surface to a mirror-like finish. After polishing, the surface of the test pieces was etched with Nital (3% nitric acid (HNO
3)). The heat-affected zone (HAZ) was analyzed, and microstructure images were observed using a Zeiss AXIO Scope. A1 microscope (Oberkochen, Germany). Finally, quality characteristics measurements of samples collected during the laser-cutting quality experiments were analyzed using artificial neural networks (ANNs) based on artificial intelligence (AI). This method was selected because conventional optimization methods are often ineffective in improving the laser-cutting process due to the multitude of factors influencing the process. To fully identify and resolve quality issues and optimize the process, it is essential to conduct extensive research. However, to reduce the number of experimental trials, more advanced methods based on artificial intelligence (AI) are used, which, even with limited data, are capable of identifying complex relationships between process input, process parameters, and output parameters—quality characteristics [
17]. This method simulates the neural network of the human brain for solving complex nonlinear problems. Thus, the data set containing the quality characteristics of the samples was transformed into an artificial neural network structure. The ANN has two main layers of neurons: an input layer, which defines the input variables, and the output layer, which defines the target values of the output parameters. Also, ANNs have hidden layers of neurons. The number of hidden layers depends on the complexity of the problem being solved [
16]. According to the algorithm shown [
17], the feed-forward ANN was designed using Matlab’s Neural Network Toolbox software (2017b (11.0)) add-on. Process optimization was performed to determine the appropriate laser-cutting parameters, including laser power, cutting speed, and auxiliary gas pressure, to achieve an optimal quality of laser-cut parts. The developed ANN was used to calculate the value of the objective function that should be minimized. This optimization model based on AI was applied to optimize the quality characteristics of both 4 and 6 mm thickness analysis. According to the laser-cutting parameter sets calculated during the optimization, control samples were cut, and the quality characteristics of these specimens were measured. The results were compared with the values predicted by the ANN, and the accuracy of the optimization model was evaluated.
3. Results and Discussion
To study the influence of the main laser-cutting parameters (laser power, cutting speed, oxygen auxiliary gas pressure) on the cutting quality, 24 cutting tests were performed on 4 and 6 mm thick mild steel plates. The selected values of the cutting parameters are listed in
Table 2 and
Table 3. One sample was cut using each set of parameters.
The data in
Table 2 show that the 4 mm thick samples were not cut in cutting test 4.10, although the linear cutting energy (65.14 J/mm), compared to other cutting tests, was sufficient to melt the material. However, the pressure of the auxiliary gas was too low to remove the molten material from the cut zone properly. Analyzing the 6 mm thick cutting test results in
Table 3, it is evident that when the laser power was reduced to 2 kW, the linear energy applied to the cutting zone was reduced to 41.38 J/mm.
As a result, sample 6.04 was not cut properly due to insufficient linear energy. Also, sample 6.06 was not cut when the cutting speed was increased to 3700 mm/min, but in this case, the linear energy was 64.86 J/mm. On the other hand, it can be observed that in the cutting test of the 6.03 sample, when the energy was lower (62.07 J/mm), the sample was successfully cut. Therefore, it can be concluded that although the linear energy obtained during the cutting process is sufficient, increasing the cutting speed has a greater influence on the proper removal of material from the cutting zone than the laser power. Similar findings regarding the unsuccessful laser-cutting process when increasing the cutting speed were observed in another research study [
33]. In this study, the effect of varying laser-cutting speeds on the machining of stainless- and carbon-steel plates with thicknesses ranging from 30 to 110 mm was investigated. When the cutting speed was too high, the sample was not cut properly.
3.2. Results of Cutting Accuracy Assessment
To investigate the effect of different laser-cutting parameters on the accuracy of the laser-cutting process, 15 dimensions of the lower and upper surfaces of each sample were measured, and the deviations of these dimensions from the nominal dimensions were calculated. Analyzing the curves in
Figure 6, which show the relationship between the dimensional deviation of 4 mm thick samples and the selected laser-cutting parameters, it can be seen that only the laser power has a significant effect on the accuracy of laser cutting.
As the power increases, the deviation of the sample’s dimensions from the nominal dimensions also increases, resulting in lower cutting accuracy. The reason for this may be that using a higher-power laser beam for cutting makes the material melt more easily, resulting in more material being removed from the cut area. Also, increasing the cutting speed or the auxiliary gas pressure does not significantly affect the dimensional accuracy.
When evaluating the influence of cutting parameters on the cutting accuracy of 6 mm thick samples (
Figure 7), the same effect of increasing laser power on cutting accuracy (as seen for 4 mm thick samples) is observed. However, in this case, a more significant influence of the auxiliary gas can be seen—as the auxiliary gas pressure increases, the cutting accuracy decreases. It is important to mention that the cutting of the 6 mm thick samples by increasing the auxiliary gas pressure was performed at a wider range of values of this parameter (from 0.6 bar to 4 bar) than the discussed 4 mm thick tests, where the auxiliary gas pressure was only increased to 1.5 bar. The dimensional deviation increases significantly when the pressure is increased to 4 bar, so it can be assumed that during such a cutting process, due to the high gas pressure, higher vibrations occur in the device, which reduces the cutting accuracy.
Figure 8 shows that the highest cutting accuracy for a 4 mm thick plate was achieved in test 4.04 (
P = 2.8 kW,
v = 3500 mm/min,
p = 0.5 bar). The average deviation of the sample dimensions from the nominal values was equal to 0.225 mm. However, the dimensional tolerance for laser cutting of 4 and 6 mm thick plates, according to ISO 9013:2017, is ±0.2 or ±0.25 mm, depending on the dimension being measured. Therefore, the accuracy of sample 4.04 only partially meets the requirements (five measured dimensional values are outside the tolerance limits). In contrast, the sample cut in test 4.09 had the lowest accuracy (average dimensional deviation equal to 0.3 mm) when the laser power was equal to 3.8 kW, the cutting speed was equal to 3500 mm/min, and the auxiliary gas pressure was equal to 0.3 bar.
Significantly higher dimensional accuracy was observed when analyzing the accuracy values obtained from the 6 mm thick samples (
Figure 9). For instance, sample 6.03 (
P = 3.0 kW,
v = 2900 mm/min,
p = 0.6 bar) had the smallest average dimensional deviation, equal to 0.096 mm. All dimensional measurements for this sample are within the tolerance limits. For the remaining 6 mm thick samples, the average dimensional deviation increases to 0.221 mm. This maximum value was measured at a laser power of 4.0 kW, a cutting speed of 2900 mm/min, and an auxiliary gas pressure of 4 bar during cutting test 6.11. It is important to note that all the measured dimensions of the top surface of this sample are within the tolerance limits (the deviation of the top surface is equal to 0.073 mm), but extremely poor accuracy is observed on the bottom surface of the sample (0.368 mm). It can be assumed that due to the high pressure of the auxiliary gas, the molten material was more easily removed from the cutting area, resulting in a wider cut kerf. Furthermore, when comparing the dimensional accuracy on different surfaces of the samples of both thicknesses studied, it was also noticed that the dimensional accuracy is higher on the top surface.
The results of the dimensional accuracy of 6 mm thick samples can be compared to similar research [
23]. In this study, the authors compared the cutting accuracy of CO
2 and fiber lasers when machining 6 mm thick S235JR steel. The cutting tests were performed with a linear energy of 55.4 J/mm. The linear energy value chosen by the authors is closest to the linear energy of specimen 6.03, which was 62.07 J/mm. The average dimensional deviation of this sample was 0.096 mm, which is greater than the dimensional deviation (0.066 mm) found during the authors’ fiber-laser study. However, as previously mentioned, this 6 mm thick sample was the most accurate, so it can be assumed that the lower linear energy leads to higher dimensional accuracy [
23]. When assessing the effect of material thickness on dimensional accuracy, the obtained results can be compared with another study [
34]. In this paper, the kerf width of AISI 304 stainless steel samples cut by CO
2 and fiber lasers with thicknesses ranging from 1 to 10 mm were measured. Analysis of the results showed that an increase in material thickness resulted in a wider kerf and lower dimensional accuracy [
34]. Conversely, the results for the 4 and 6 mm thick S355 steel samples were opposite, with the 6 mm samples being more accurate. This suggests that the material selection can have a significant effect on dimensional accuracy.
3.3. Results of the Kerf Taper Evaluation
The kerf taper was estimated using the measurement results of samples on different surfaces. This quality characteristic was determined by subtracting the value of the same dimension on the bottom surface from the dimension on the top surface. After evaluating the dependence curves of the kerf taper of the 4 mm thick specimens on the cutting parameters shown in
Figure 10, it can be observed that the choice of the cutting parameters also affects the cut geometry.
For instance, increasing the laser power reduces the kerf taper. Also, a lower cutting speed leads to a straighter cut shape. Conversely, increasing the auxiliary gas pressure from 0.3 bar to 1.5 bar does not significantly change the cut shape.
The curves in
Figure 11 show the relationship between the accuracy of the cutting geometry and the cutting parameters of the 6 mm thick samples and show the same tendency of the kerf taper variation as for the 4 mm thick samples. However, it is noticeable that increasing the auxiliary gas pressure over a wider range of values increases the taper of the cut. Therefore, it can be concluded that only a significant increase in pressure can affect the shape of the cut.
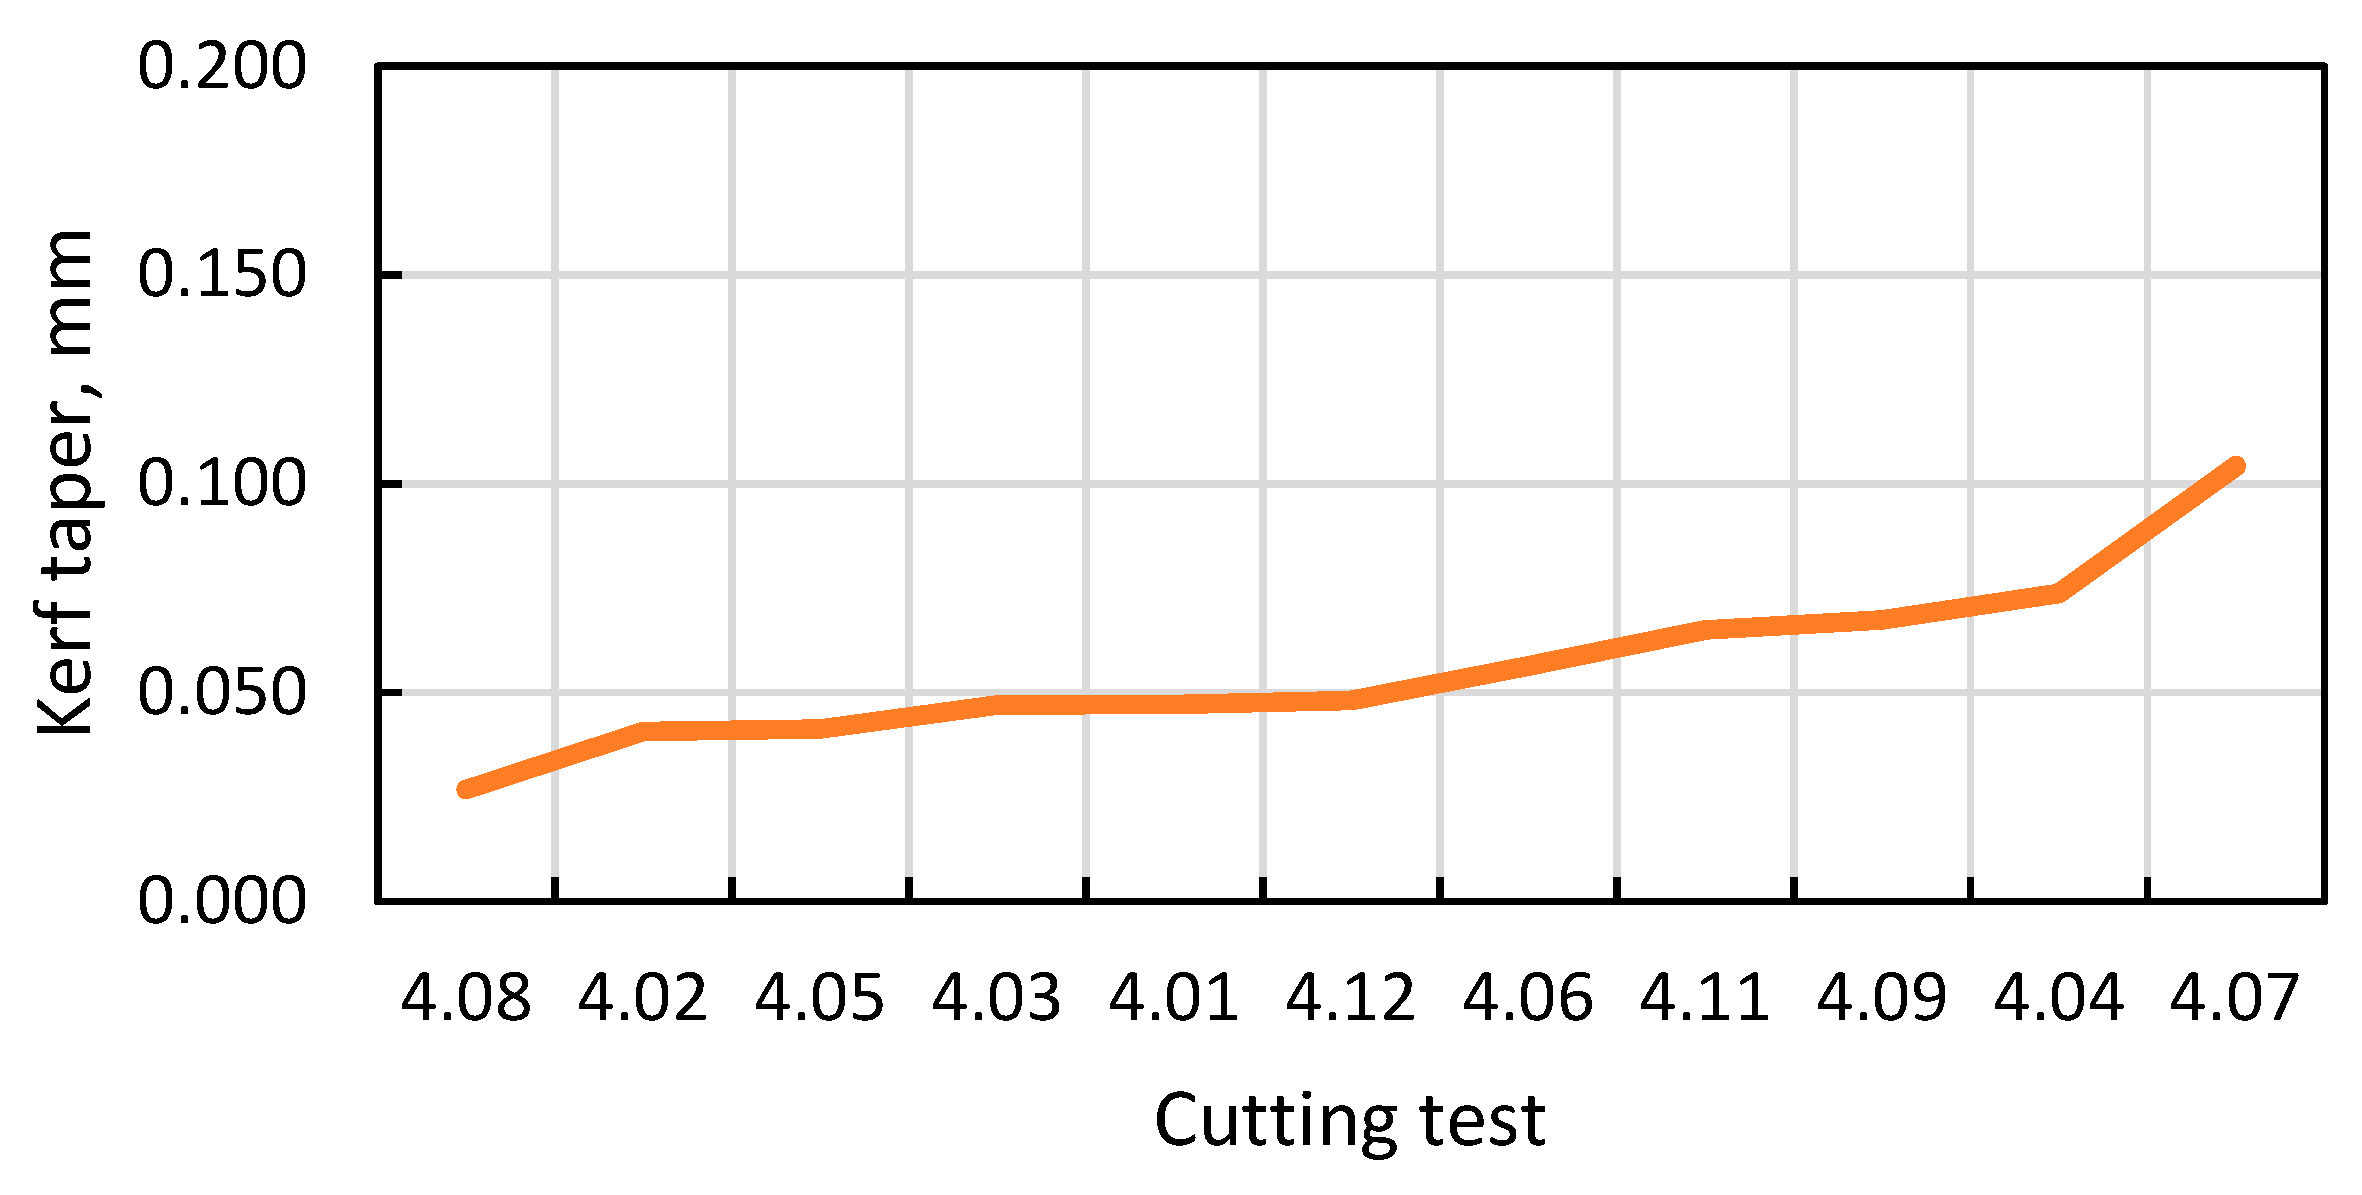
The smallest kerf taper (0.027 mm) and kerf taper angle (0.192°) were achieved during cutting test 4.08, when the laser power was equal to 3.8 kW, the cutting speed was 2900 mm/min, and the auxiliary oxygen gas pressure was 0.55 bar (
Figure 12). On the other hand, the most irregular cut was obtained when cutting sample 4.07 (
P = 3.8 kW,
v = 4500 mm/min,
p = 0.55). The kerf taper of this specimen is 0.104 mm, and the kerf taper angle is 0.747°. Comparing the cutting parameters of these two samples, it is noticed that the only difference is the cutting speed, which, when increased, resulted in an irregular cut geometry.
Also, the curves depicted in
Figure 13 show the variation of the kerf taper angle of the 6 mm thick samples. The most accurate cut geometry was achieved in test 6.08 (
P = 4.0 kW,
v = 2400 mm/min,
p = 0.6 bar) with a kerf taper of 0.15 mm and a kerf taper angle of 0.716°. Samples 6.09–6.12, where the auxiliary gas pressure was increased during cutting, showed the worst and the highest kerf taper cutting results. Therefore, it is not recommended to use a high pressure of auxiliary gas during cutting to achieve a straighter cut geometry. Comparing the accuracy of the cutting geometry of analyzed samples of different thicknesses, it is obvious that the accuracy of the cutting geometry decreases with the increase in the thickness of the processed material.
Comparing the results with other studies, the widening of the cut toward the bottom of the sample is unusual in laser-cutting studies. However, it should be noted that the type of laser used for cutting has the greatest influence on the shape of the cut. In their study, authors [
34] compared the cut geometry of AISI 304 stainless steel samples treated with CO
2 and fiber lasers and observed that the cut narrowing toward the bottom is typical for CO
2 lasers. These results can be confirmed by another study [
35] in which samples of aluminum AlMg
3, steel S235JR and stainless steel AISI 304 were treated with a CO
2 laser. The choice of material did not affect the shape of the cut. In all cases, a narrower cut was observed at the bottom of the specimen.
When analyzing the cutting geometry of the fiber laser, it was observed that the kerf geometry varies. It was observed that they widened towards both the top and bottom surfaces, and in some cases, the kerf even narrowed in the middle of the material [
34]. However, another fiber-laser study [
36] also found that the kerf narrowed towards the bottom surface. In this study, a 12 kW laser was used to cut a 25 mm thick plate of S235JR. Therefore, it can be assumed that when cutting thick materials with a fiber laser, the material to be cut absorbs a large amount of the energy applied to the cutting zone, which results in a different cut geometry than when cutting thinner materials. As a result, the taper of the kerf is determined not only by the parameters of the laser-cutting process but also by the type of laser used.
3.4. Results of the Laser Thermal-Effect Evaluation
The laser-cutting process is based on thermal energy output. Therefore, it is difficult to avoid high temperature exposure to the metal alloy during the cutting process. As a result of the aforementioned processes, a heat-affected zone (HAZ) is a phenomenon that is commonly identified in laser cutting. The material heats up during the process of laser cutting and then quickly cools down. As a consequence of this rapid cooling, changes in the crystal structure of the alloy are often observed; this is due to the remelting of material in the area of the workpiece that is affected by the temperature, in comparison with the uninfluenced part of the workpiece [
7,
37].
Therefore, six samples were selected for further laser thermal-effect analysis. The selection was based on the results of previous experiments on surface roughness, dimensional and geometric accuracy. Samples of both thicknesses were evaluated based on their respective values of these quality characteristics and were then compared to determine the overall best, medium and worst quality results. As a result, the selected samples were found to exhibit a range of cutting qualities, including good (4.03 and 6.02), medium (4.06 and 6.08) and poor (4.11 and 6.11).
The microstructure of low-carbon S355JR steel is composed of ferrite and pearlite grains due to the low carbon content of 0.23%. Analyzing the microstructure of the alloy after the laser-cutting process (
Figure 14), it is obvious that the high temperature affected the microstructure of the area near the cut. Although there are no clear structural changes in the alloy, three zones are visible in the laser-affected area of the re-melted metal alloy: the heat-affected zone (HAZ), the transition zone, and the temperature-unaffected zone— the base material.
Figure 15 shows microstructure images of the 4 mm thick samples. A narrow HAZ of approximately 33 µm thickness is visible. Ten HAZ measurements were taken for each evaluated sample, as shown in
Figure 16,
Figure 17 and
Figure 18.
As shown in
Figure 19, the average HAZ depth of the 4 mm thick samples varies from 26.281 µm to 39.835 µm. Although sample 4.03 had good surface roughness and dimensional accuracy results, this sample has the highest average HAZ depth (39.835 µm). Therefore, it can be concluded that although the quality of the laser-cut part is relatively good, the depth of the heat-affected zone may be higher.
When evaluating the influence of high temperature on the 6 mm thick samples, it is evident that the thermal effect on the microstructure (
Figure 20) is significantly higher than on 4 mm thick samples. In this case, the average depth of the heat-affected zone of the specimens is 205.665 µm. It is also important to note that the cutting speed for properly cut 6 mm thick samples was lower than 4 mm. This means that the contact time between laser and material was also longer. As a result, the greater thickness of the material resulted in a deeper heat-affected zone during the laser-cutting process.
It was found that the temperature-affected area of the 6 mm thick samples is smaller at the top of the laser cut. This is because the material melted on the top of the sample flows down, heating the bottom of the cut, where the thermal effect is larger. The HAZ depth values of the 6 mm thick samples are shown in
Figure 21,
Figure 22 and
Figure 23.
The heat-affected zone of the 6 mm thick samples ranges from 155.441 µm to 230.779 µm (
Figure 24). The largest heat-affected zone was found in sample 6.11 (230.779 µm), which value is like sample 6.08 (230.776 µm). This sample also had the worst cut quality and accuracy of all the 4 and 6 mm thick samples.
Comparing the HAZ depth of the 4 mm and 6 mm samples, it is clear that the 4 mm thick metal plate was affected by a lower amount of heat during the laser-cutting process. This is due to the different linear energy applied to the cut area during laser cutting, as shown in
Table 4. Specifically, the linear energy required to cut a 4 mm thick sample is lower than that required to machine a 6 mm thick material.
The heat-affected zone depth values can be compared with other studies. In one study [
37], the temperature effect of 8 mm thick S235JR steel was evaluated, and an average depth of heat-affected zone of 170 µm was determined. It is important to note that this study was performed using a CO
2 laser for cutting. This confirms that cutting thicker materials with a fiber laser has a greater temperature effect on the material than with a CO
2 laser. In another study [
38], a 6 mm thick C45 steel plate was processed by varying the laser power and cutting speed. It was found that the HAZ is thicker when high laser power and a low cutting speed are used for cutting [
38]. The same tendency is observed when comparing the cutting parameters of specimens 6.02 and 6.11. Both samples were cut at the same speed (
v = 2900 mm/min), but increasing the power (
P = 4 kW) resulted in a larger heat-affected zone in test 6.11.
3.5. Results of the Laser-Cutting Quality Optimization
The evaluation results of the laser-cutting quality characteristics were used to develop an artificial intelligence (AI)-based artificial neural network (ANN). The input parameters of the ANN were material thickness, laser power, cutting speed and auxiliary gas pressure. The output parameters were the obtained quality characteristics—average surface roughness
Ra, average dimensional deviation, and kerf taper (
Figure 25).
The experimental data obtained from fifteen cut samples were used to train the ANN, and the remaining six data sets were used to test the developed neural network. To select the neural network with the best structure, training was performed with two to twenty neurons in the hidden layer. The mean squared error (MSE) between actual and predicted values was calculated for all tested ANN structures. Calculations showed that a hidden layer of seven neurons provides the most accurate prediction. Therefore, this ANN structure was used for further laser-cutting quality optimization. To achieve optimal laser-cutting quality, a minimization problem was solved. The aim was to ensure the lowest average surface roughness (
Ra), the lowest average dimensional deviation (ADD), and the lowest kerf taper (KT). The developed ANN has been used to predict the values of these quality characteristics for a set of the laser-cutting parameters that have not been tested during the cutting tests. The objective function
Z is the sum of the estimated quality characteristics, which is calculated using Equation (5):
where
Ra—average surface roughness, µm;
ADD—average dimensional deviation, mm;
KT—kerf taper, mm;
t—thickness of the material, mm;
P—laser power, kW;
v—cutting speed, mm/min;
p—auxiliary gas pressure, bar. Based on the results of the cutting tests, the upper and lower limits of the cutting parameters for the optimization were determined according to material thickness:
To determine the cutting parameters that would result in an optimal cut quality, optimization was performed for each thickness. The solution for 4 mm thickness was found after 32 iterations with an objective function value of 1.853. Similarly, for a thickness of 6 mm, the calculations were carried out 33 times until the best solution of the objective function was found with a value of 1.718.
Table 5 shows the calculated optimum cutting parameters.
To assess the accuracy of the optimization using the obtained cutting parameters, the control samples 4.13 and 6.13 were cut and the quality characteristics were measured. The obtained results are presented in
Table 6.
Comparing the actual values of the quality characteristics with the predicted values generated by the artificial neural network model, it can be observed that the actual values of the quality characteristics differ from the predicted values. The differences are minimal in the context of surface roughness and kerf taper measurements, but further training of the ANN could enhance dimensional deviation prediction.
Comparing the quality characteristics of control samples 4.13 and 6.13 with other samples, it is observed that the optimization was performed by increasing the roughness of the cut surface, seeking to achieve better dimensional accuracy and lower kerf taper. It is important to mention that ANNs are based on a learning process. The accuracy of the developed artificial neural network in predicting the values of quality characteristics and performing process optimization increases with the amount of data used for training the network. To improve the accuracy of the optimization model, the measured actual quality characteristics of samples 4.13 and 6.13 can be included in the data set used to train the network.
In conclusion, fiber-laser processing of thicker materials can be effectively improved using AI-based optimization models. An artificial neural network trained with research data on quality characteristics at different cutting parameters can quickly identify complex relationships between quality characteristics and cutting parameters, enabling more efficient process control.


