Abstract
A positioning grid is a key clamping structure for fixing the transverse and axial positions of fuel assemblies in nuclear reactors, and it is generally prepared by the transverse stamping of a Zr-4 sheet. However, the texture formed in the processing process of Zr-4 sheets can affect formability, resulting in cracking in the stamping process. Therefore, the relationship between the formability of Zr-4 sheets and the normal Kearns factor (Fn) of basal texture was studied in this paper. The results showed that the Zr-4 sheet with an Fn equaling 0.720, prepared by an isobaric reduction rolling process, would crack in the stamping process. To avoid the cracking during stamping, the formability improvement of Zr-4 sheets based on texture optimization was discussed. By using the finite element model (FEM) and a visco plastic self-consistent (VPSC) model coupled simulation, the relationship between the initial textures and formabilities of Zr-4 sheet is established. It is found that the hardening exponents (n) decreased with increasing Fns in VPSC simulations. Meanwhile, as the Fn increases, cracks are prone to occur at the bottom corner of the stamped sheet in finite element simulation. Given the results from FEM and VPSC simulations, it is proposed that the Fn should be controlled to be less than 0.7 for preventing cracks in the sheet during stamping. Additionally, a new rolling process named non-isobaric reduction rolling was designed in which the Fn of the Zr-4 sheet is successfully reduced to 0.690. The stamping results indicate that the sheet is free of cracks under an Fn of 0.690. Therefore, texture optimization with the proposed rolling process can improve the formability of Zr-4 sheets, which effectively solves the cracking problem of Zr-4 sheets.
1. Introduction
Zirconium alloy has become the preferred material for positioning grids in nuclear reactors because of its good nuclear properties, low thermal neutron absorption cross-section, high tensile strength, good corrosion resistance and comprehensive mechanical properties [1,2,3,4,5,6]. A positioning grid is a key clamping structure for fixing the transverse and axial positions of fuel assemblies in nuclear reactors [7,8,9,10,11]. In recent years, transverse stamping using a multi-station progressive die has generally been used as the main method for the preparation of positioning grids with zirconium alloy [12,13,14,15,16]. However, due to the poor forming ability of zirconium sheets, cracks and other defects often occur in the stamping process, which results in serious harm to the safety of the nuclear fuel assembly operating system [17,18,19,20]. Studies have shown that the formability of the sheet is closely related to the initial texture of the material [21,22,23,24,25]. Mahesh Panchal et al. [26] studied the effect of the texture of magnesium alloy on formability. The results showed that a small fraction of extension twins during pre-twinning imparts significant improvement in the room temperature stretch formability. In addition, they discussed the effect of the initial microstructure and various deformation conditions on the contribution of twin and twin-orientation control during thermal treatment, as well as their influence on the room-temperature stretch formability. Vivek Kumar Barnwal et al. [27] studied the effect of microstructure and texture on the forming behavior of AA6061 aluminum alloy sheets. He found that certain critical texture components, such as the Cube {001}<100> texture component and Brass {011}<211> texture component, influence the forming behavior of AA6061 aluminum alloy significantly. What is more, intra-granular crack propagation in a particular sheet direction (transverse direction: TD) may lead to the reduced formability of AA-6061. Miller et al. [28] studied the effect of initial texture of three types on the formability of magnesium sheets. He believed that the dispersive texture was the main reason for the small anisotropic parameters and good formability. However, he interpreted that the formability depends on the activation of the prismatic slip during deformation. He Weijun et al. [29,30] used the cryo-rolling method to activate twinning, obtaining the weakened texture of the zirconium sheet and improving its performance. In addition, Kumar et al. [31] analyzed the forming limit curve of Zr-4 alloy and found that the change of the stress state and initial orientation of the sheet led to the forming limit curve of the sheet changing. Although many researchers have clearly proposed that the weakened texture can improve the formability of the sheet. But for now, there are few studies on the safety threshold of texture in zirconium sheets, and it is not clear whether a change in the processing technology of sheets can improve the formability of the sheets.
Therefore, this paper designed two kinds of rolling processes based on the texture weakening principle, adopting the same annealing process to obtain the finished sheet. What is more, the finite element method was employed to preliminarily obtain the relationship between the two finished textures and formability. Finally, the sheets obtained by the two processes were subjected to mechanical property experiments and stamping experiments, respectively, verifying that the texture of the sheet can improve the formability and solve the problem of cracking sheets.
2. Experiment Material and Method
A Zr-4 sheet with a thickness of 3.7 mm and a chemical composition of Zr-.2Sn-0.2Fe-0.1Cr (wt%) was used in this study. The as-received Zr-4 sheet underwent hot rolling and annealing to obtain a fully recrystallized microstructure. The rolling, transverse, and normal directions are denoted as RD, TD, and ND, respectively. The dimensions of samples were 80 mm (RD) × 50 mm (TD) × 3.7 mm (ND). The as-received sheet was selected for cold-rolled experiments for isobaric reduction by 29 passes and 2 rolls in the rolling mill. The thickness of sheet was 0.8 mm after rolling. Samples utilized for the electron backscattered diffraction (EBSD) experiment were cut into a uniform region of sheets prepared by cold-rolled processes.
The samples prepared by cold-rolled processes were vacuum-encapsulated in quartz tubes and placed in a vacuum environment of a box resistance furnace for an annealing experiment at 650 °C for 2 h. After annealing, the sample underwent EBSD experiments at a size of 8 mm (RD) × 5 mm (TD). After that, the sample was mechanically polished followed by electro-polishing in a solution containing 10% perchloric acid and 90% ethanol. The electro-polishing was carried out for 3 min at a voltage of 30 V and a temperature of −40 °C. Subsequently, the sample was washed with water for half an hour to eliminate the residual polishing liquid on the surface. The EBSD experiment was operated on a Zeiss Merlin Compact instrument with a HKL Channel 5 system using a working voltage of 30 KV and a scanning step size of 0.5 μm.
The Kearns factor is generally used to characterize the grain orientation of hexagonal close-packed structures [32]. The Kearns factor was developed to provide a means of resolving basal pole distributions into an effective fraction in each of the three principal directions of fabricated forms of zirconium and other hexagonal materials. The sum of Kearns factors in three direction is 1.0, and these factors were calculated from basal pole figures. If the basal pole was perfectly aligned in one direction, the Kearns factor was 1.0, and that of other directions was zero. If the basal poles had a random texture, the value of Kearns factor was 1/3 for all directions. The Kearns factor (F) was used to quantify the relation between grain orientations and sheet direction:
where Iφ is the average intensity at a tilt angle φ and sinφdφ is the surface element in polar coordinates. From Equation (1), the Kearns factor is an average function of a cos2-weighted polar, the change of which provides the evolution rate of grain orientation. The Kearns factors corresponding to RD, TD and ND are denoted as Fr, Ft, and Fn, respectively.
3. Experimental Results
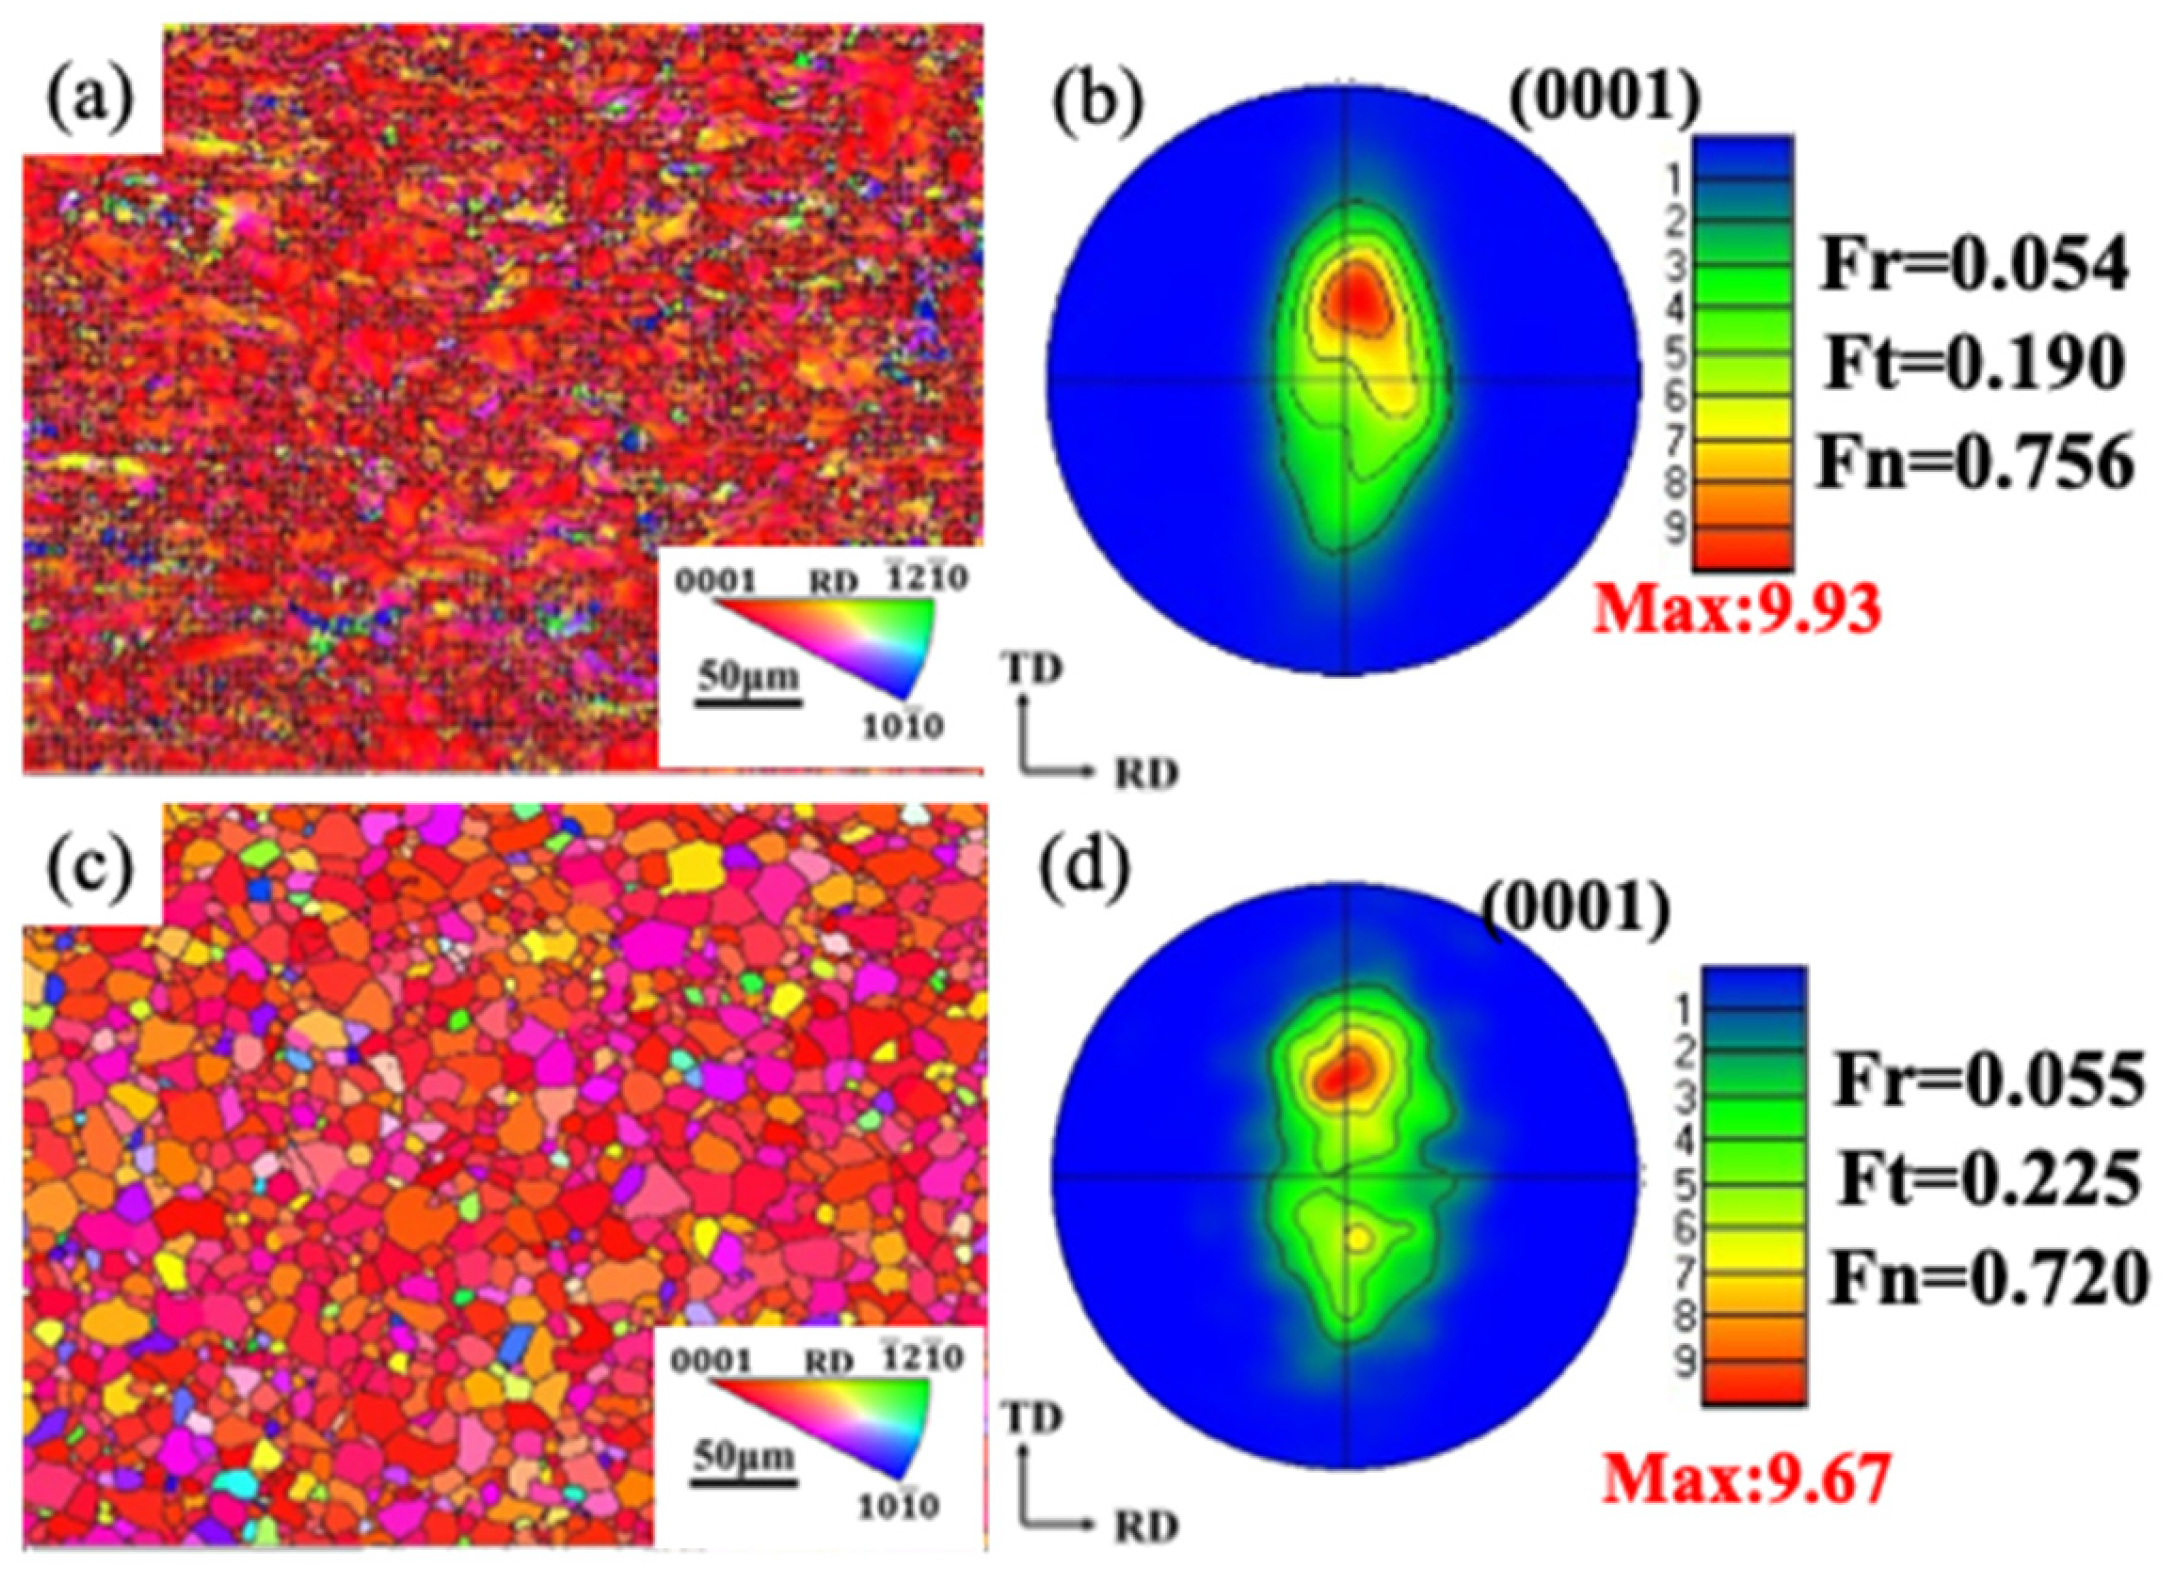
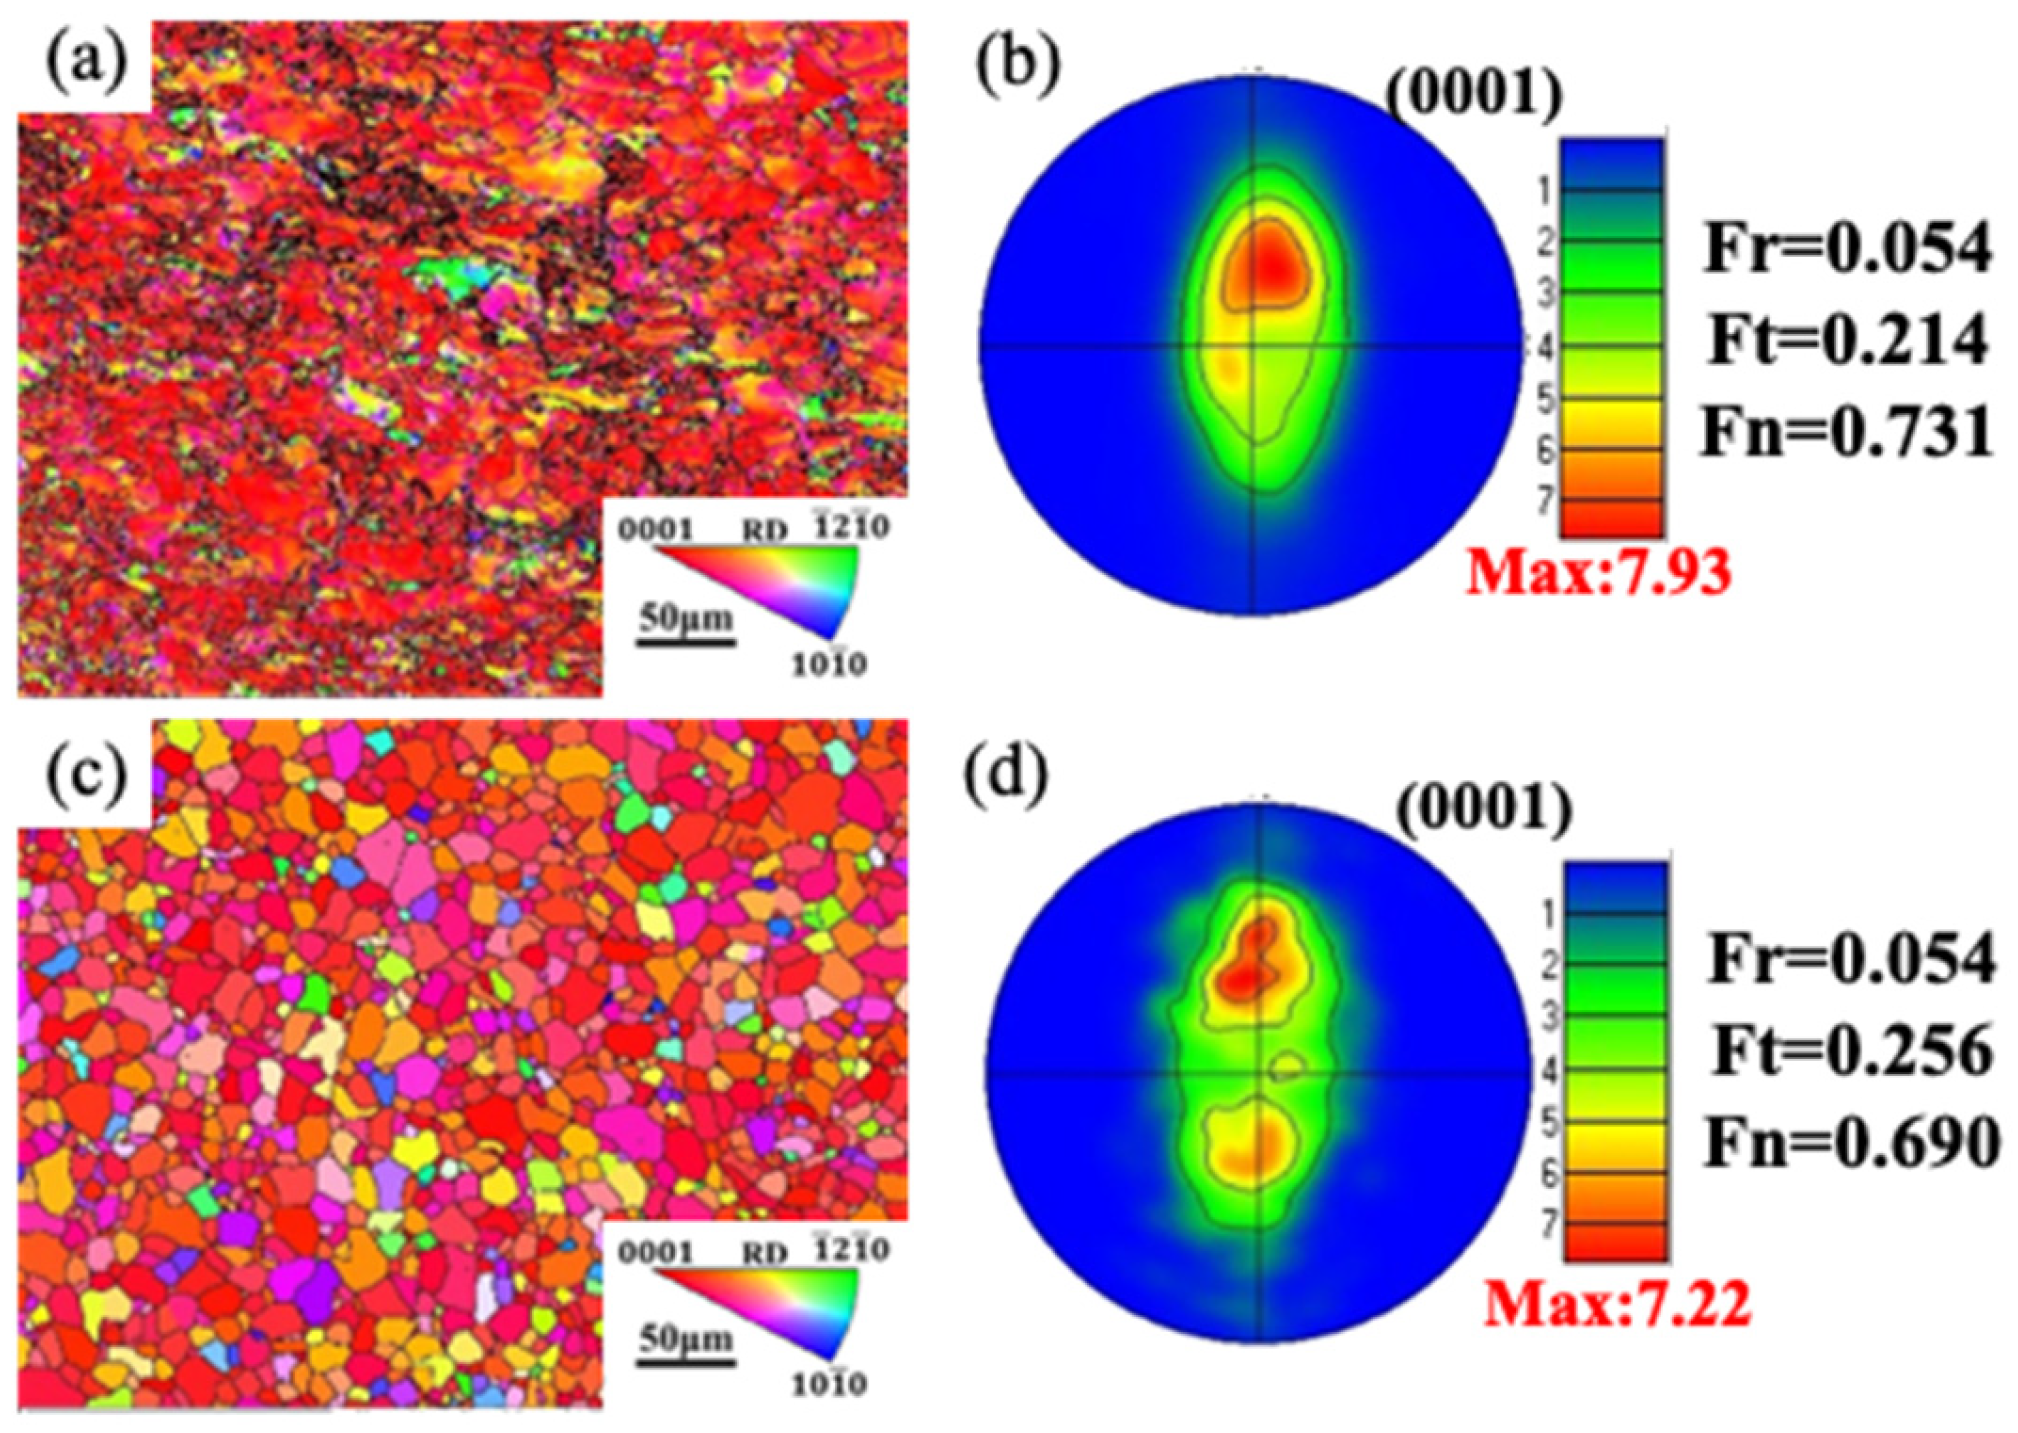
Figure 1 shows the microstructure, (0001) pole figures (PFs) and Kearns factors of the rolled sheet produced by isobaric reduction rolling processes and annealed at 650 °C for 2 h. The microstructure of the hot-rolled annealed sheet after rolling is distributed along RD. Almost all grains in the sheet produced by isobaric reduction rolling were broken and had a dispersed distribution, as displayed in Figure 1a. The deformation textures of the sheet produced by isobaric reduction rolling processes were close to basal texture, and the c-axis of most grains in the sheet was tilted from ND to TD. From Figure 1b, we can observe that the maximum pole density of the sheet after isobaric reduction rolling is 9.93, the normal Kearns factor (Fn) is 0.756, the transverse Kearns factor (Ft) is 0.190, and the rolling Kearns factor (Fr) is 0.054. After annealing, some damaged grains inside the sheet produced by isobaric reduction rolling grow and become uniform. Moreover, the orientations of most grains are red, and deformed structures basically disappear and instead become recrystallized grains, as displayed in Figure 1c. What is more, the annealing texture type of sheets produced by isobaric reduction rolling showed the typical bimodal texture of zirconium alloy. From Figure 1d, we can observe that the maximum pole density of the sheet produced by isobaric reduction rolling after annealing is 9.67, the Fn is 0.720, the Ft is 0.225, and the Fr is 0.055. The c-axis of most grains of sheets produced by isobaric reduction rolling after annealing will rotate from ND to TD.
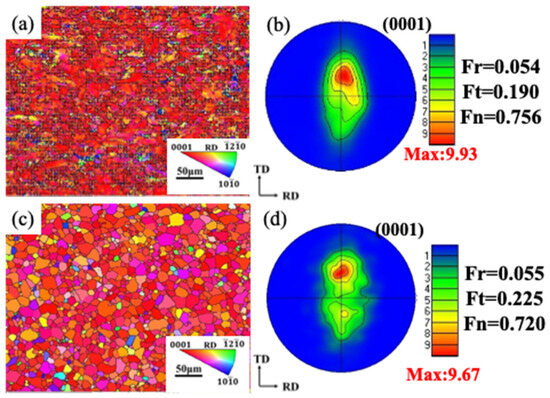
Figure 1.
(a,b) The microstructure, (0001) pole figures (PFs) and Kearns factors of the rolled sheet prepared by isobaric reduction rolling and (c,d) after annealing at 650 °C for 2 h.
Figure 2 shows misorientation distributions of the Zr-4 sheet after isobaric reduction rolling and annealing at 650 °C for 2 h. It can be seen from Figure 2 that when the sheet is prepared by isobaric reduction rolling, the fraction of the low angle grain boundaries (LAGBs) are 65.66%, and the average angle is 15.27 degrees. However, when the deformed sheet anneals at 650 °C for 2 h, the fraction of the low angle grain boundaries is 4.77%, and the average angle is 42.58 degrees. That is to say, the fraction of the low angle grain boundaries decreases, and the average angle increases during annealing. When the sheet was deformed by large deformation, the internal grains in sheet were broken, resulting in the low fraction of LAGBs and the small average angle. When the sheet anneals at 650 °C for 2 h, the grains are recrystallized, and LAGBs transformed into high angle grain boundaries, the fraction of LAGBs decreased, and the average angle of the grain increased.
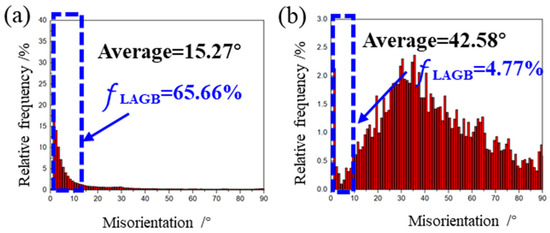
Figure 2.
Misorientation distributions of Zr-4 sheet for (a) isobaric reduction rolling; and (b) annealing at 650 °C for 2 h.
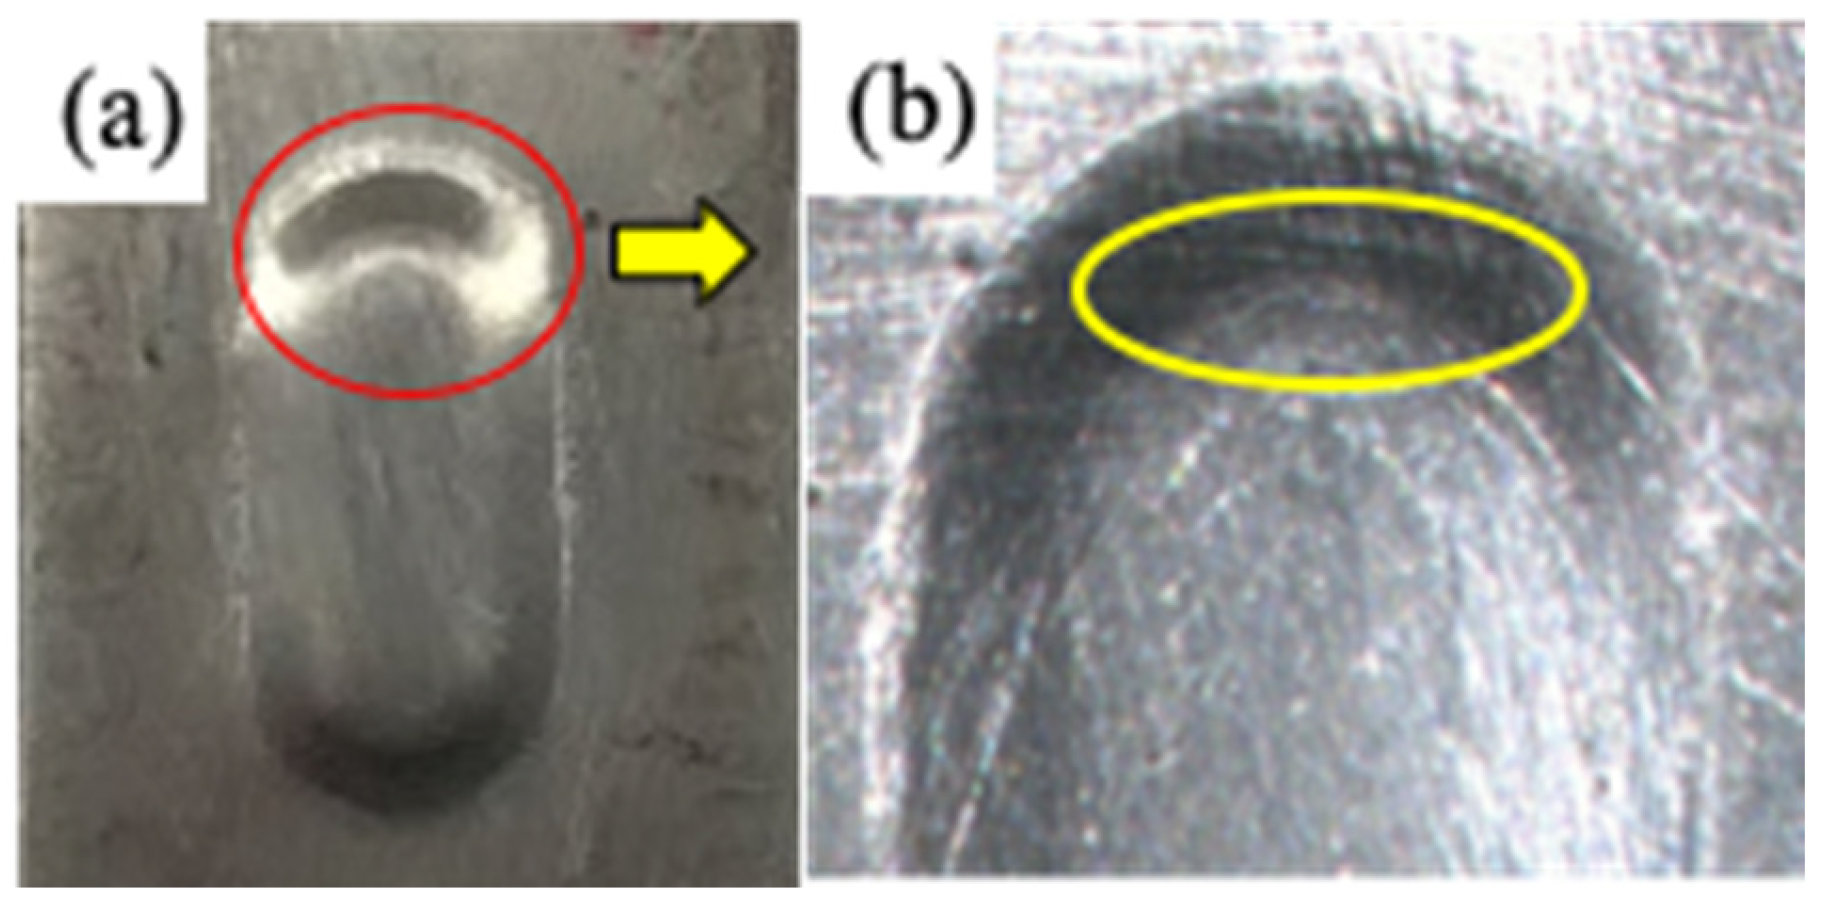
The sample was cut along the rolling direction of the cold-rolled Zr-4 sheet prepared by an isobaric reduction rolling process with a length of 30 mm, and along the transverse direction with a width of 20 mm. The sample was sealed by a vacuum double-layer tube for annealing at 650 °C for 2 h in a box-type resistance furnace, and then the stamping experiment along the rolling direction was carried out. Figure 3 shows the surface of a stamped product of the cold-rolled sheet produced by an isobaric reduction rolling process. As can be seen from the Figure 3, cracking occurs at the rounded corners of the stamped finished product (inside the yellow circle in Figure 3b). That is to say, when the Fn of the initial texture of the sheet is 0.720, the sheet has begun to crack.
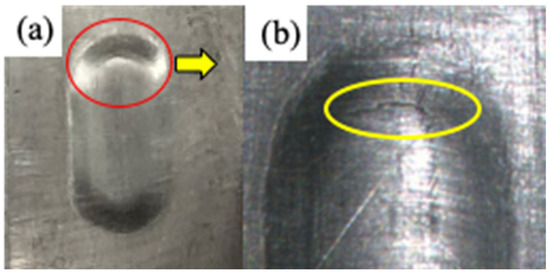
Figure 3.
The result of a stamped product of a cold-rolled sheet prepared by the isobaric reduction rolling process: (a) the stamped finished product; (b) the enlarged rounded corner.
4. Study on Textures Optimization for Formability Improvement
4.1. Prediction of Different Initial Textures on Hardening Index Based on VPSC Model
The VPSC model originated from Tome and Lebensohn and was further refined by Lebensohn and Tome. To improve the prediction accuracy, anisotropic behavior was employed to study the texture evolution of zirconium alloys [33,34]. The limitations and rate sensitivity of the VPSC model were also explored. Based on previous research, a well-developed VPSC model was implemented to simulate the evolution of the deformation behavior of the Zr-4 sheet during uniaxial tension. In the VPSC model, an initial yield stress was imposed as a boundary condition, along with an initial hardening rate and a saturation stress , and the solution for the flow stress as a function of accumulated strain gives the Voce hardening law:
The Voce hardening law was used to model the hardening of each deformation system in this work. The threshold stress evolves with the accumulated shear strain () in each grain as follows:
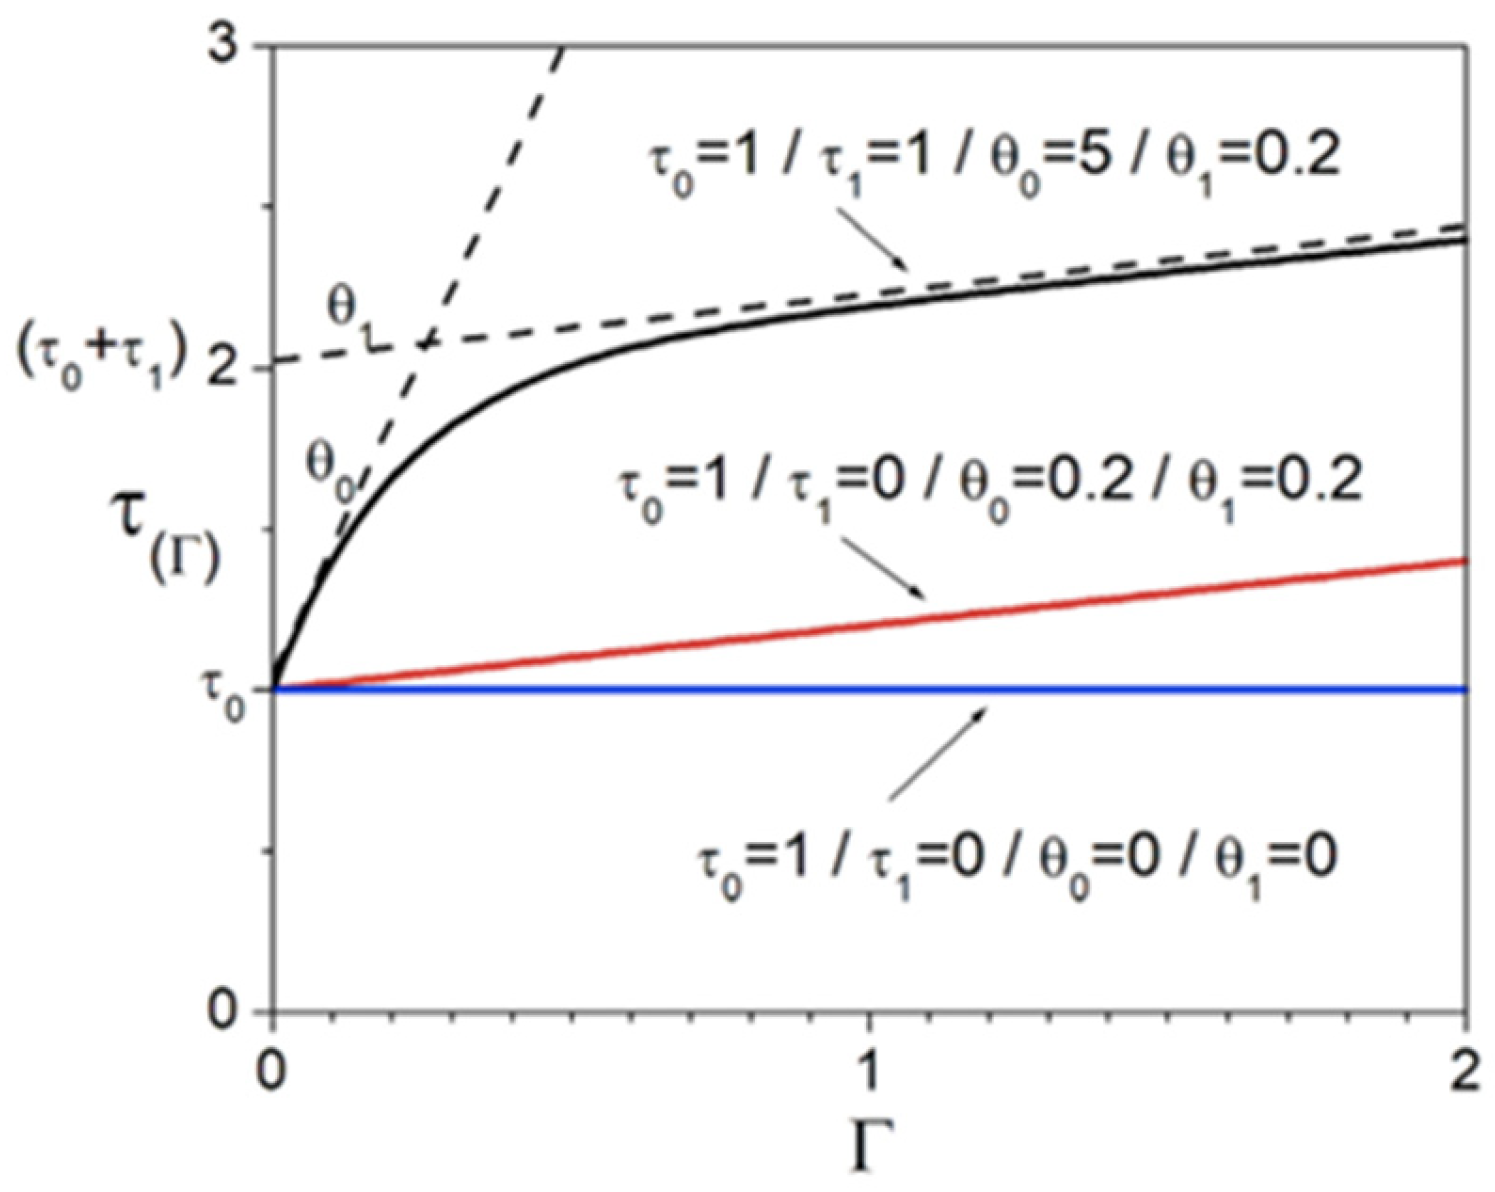
where τ0, θ0, θ1, and (τ0 + τ1) are the initial CRSS, the initial hardening rate, the asymptotic hardening rate, and the back-extrapolated CRSS, of various slip/twinning systems (s), respectively. The Voce hardening law is illustrated in Figure 4.
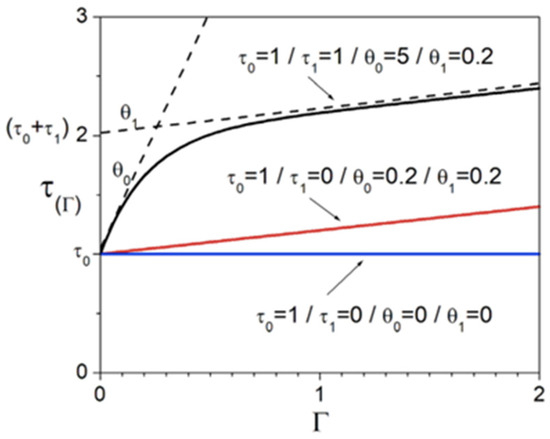
Figure 4.
Evolution of threshold stress versus accumulated shear in the grain given by the Voce law.
The hardening exponent(n) reflects the strengthening deformation ability and resisting instability of the Zr alloy sheet. The formability of the sheet is closely related to the hardening exponent [35]. Therefore, the hardening exponent (n) is one of the criteria for the formability of sheet. The value of the hardening exponent is largely attributed to the initial texture for Zr-4 sheets. To obtain the relationship between the initial texture and hardening exponent, a VPSC model is built to predict mechanical behavior under tension along the rolling direction. A typical bimodal texture with five different Fn values was used to illustrate the effect of the initial texture on the hardening exponent of mechanical properties. Figure 5 shows normal Kearns factors, ranging from 0.606 to 0.722, for a (0001) pole figure, used as the initial texture in the VPSC model. In the VPSC model, prismatic <a> ({10-10} <11-20>) slip, basal<a> ({0001} <11-20>) slip, pyramidal <c + a> ({10-11} <-1-123>) slip, and {10-12} <-1011> ETW are considered to be activated during tension. The parameters in the VPSC model used predicted the hardening exponents that are listed in Table 1. The initial texture obtained from five different initial textures are shown in Figure 5. After calculation, the predicted hardening exponents were obtained and are shown in Table 2. The results showed that the hardening exponents decreased with increasing normal Kearns factors. Normally orientated crystals with higher Fns are detrimental to the hardening ability, resulting in lower n values.
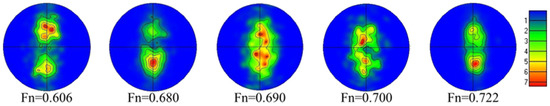
Figure 5.
(0001) pole figure and normal Kearns factors of different initial textures.

Table 1.
The parameters for VPSC model of Zr-4 sheet.
Table 2.
The relationship of normal Kearns factor and hardening exponent (n value).
4.2. Effect of Initial Texture with Different Fns on Formability in Stamping Process
In order to study the relationship between initial texture and formability, the stamping process was simulated based on Dynaform software 5.9.4. Figure 6 shows the finite element model including the punch, binder, blank and die. The blank was set as the shell element, while molds were set as the rigid element. The coulomb friction coefficient was assumed to be μ = 0.125 for both the upper and bottom surfaces of the blank. The material model is 36*MAT_3-PARAMETER_BARLAT. The Barlat89 yield criterion was selected during forming. Initial textures corresponding to mechanical hardening curves, prepared by two different rolling processes, were input into the hardening model in the finite element model. The forming limit curve was calculated with the Keeler model. The stamping process was divided into two parts, including a holding stage and a forming stage. The binder force was 20 KN and the binder velocity was 100 mm/s until closing with the die. The punch velocity was set to 350 mm/s.
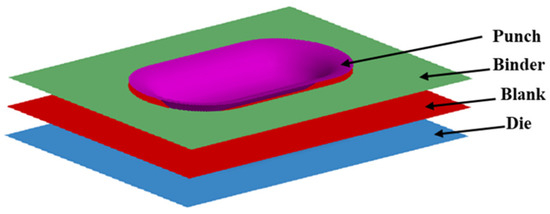
Figure 6.
Schematic diagram of finite element stamping model.
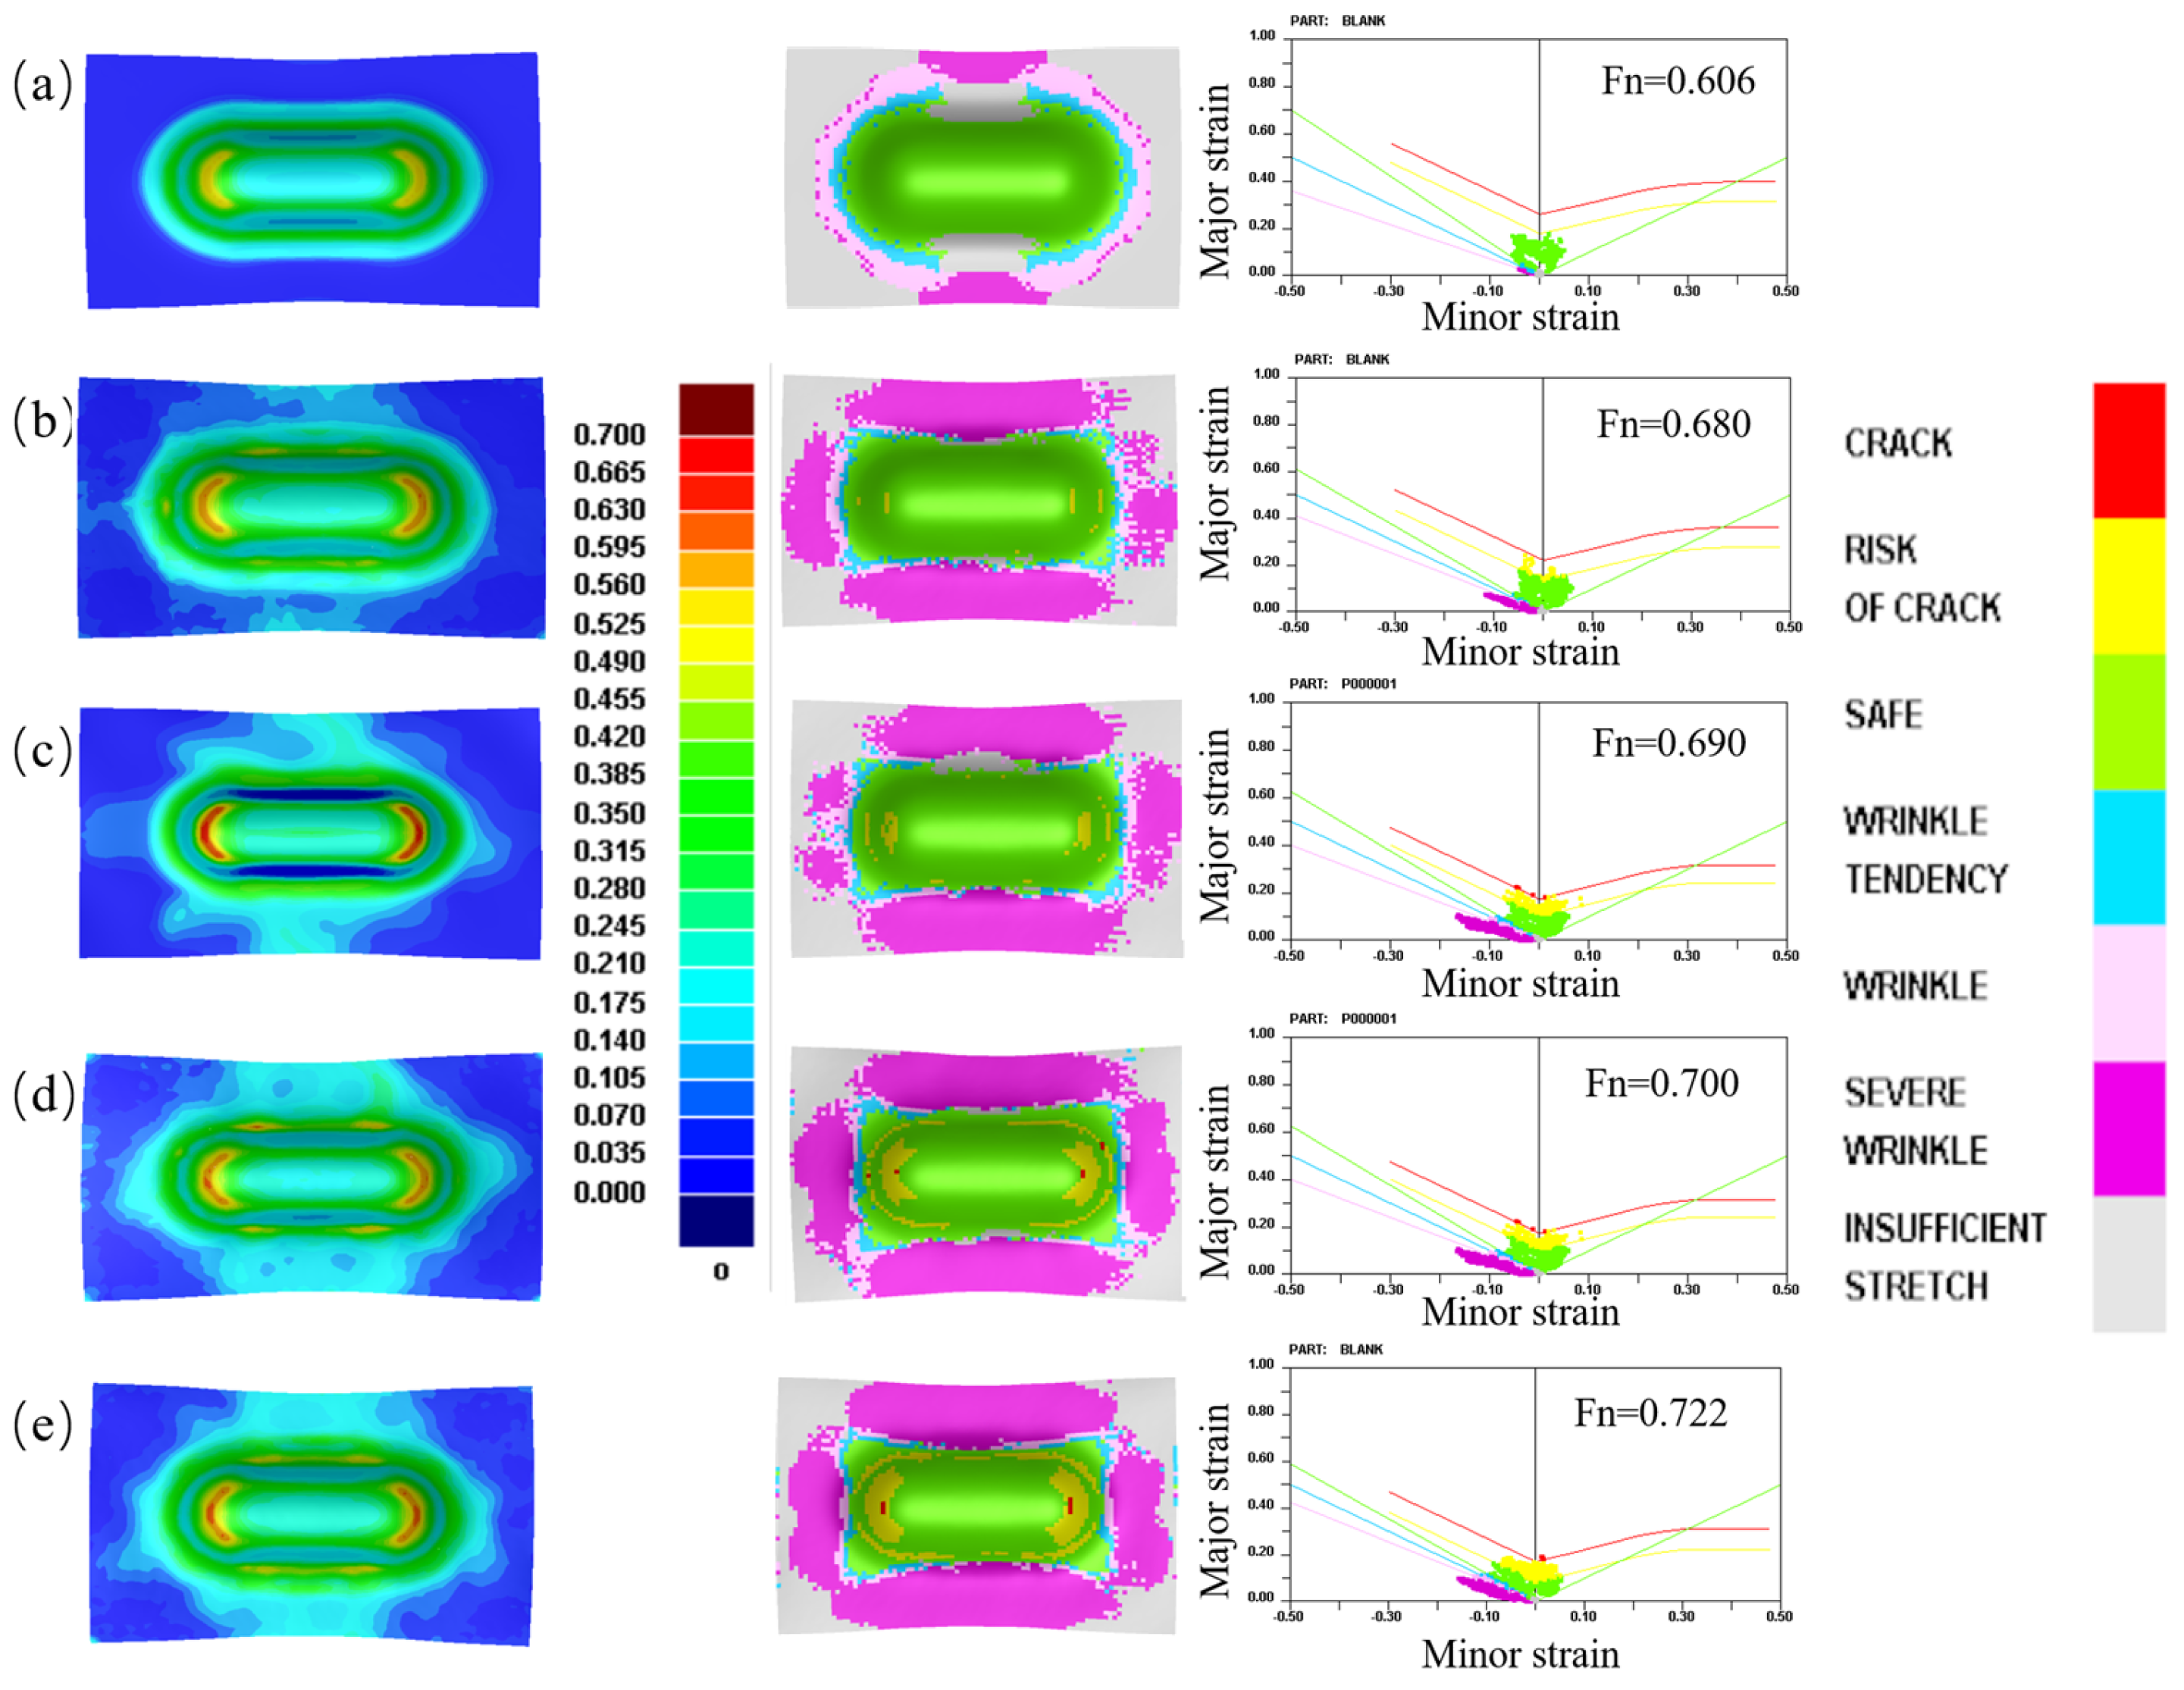
Figure 7 shows stamping simulation results and forming limit diagrams of Zr-4 sheets with different initial textures. The data of forming limit curve are based on the first principal strain(ε1) and the second principal strain (ε2) of the sheet under different strain paths in the FEM model. The forming depth of sheets with different initial textures can be realized by controlling the displacement of the punch. Initial textures corresponding to hardening exponents were input into the finite element model. The formability differences of sheets with different initial textures can be obtained.
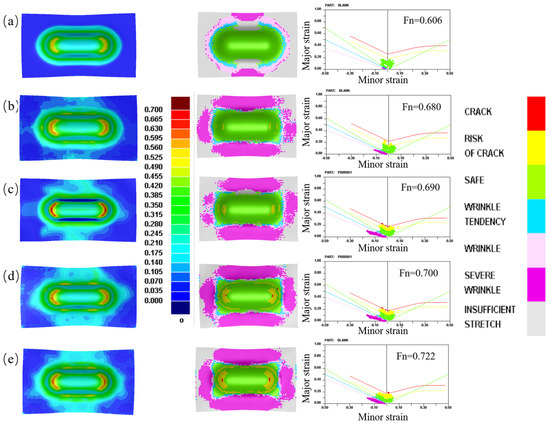
Figure 7.
Equivalent strain diagrams, forming limit maps and forming limit curves of Zr-4 sheets with different initial textures: (a) Fn = 0.606; (b) Fn = 0.680; (c) Fn = 0.690; (d) Fn = 0.700; (e) Fn = 0.722.
As can be seen from the simulation results in Figure 7, the red area shows the cracking area of the sheet, and the yellow and green areas show the cracking-risk area and the safe area. When the Fn of the initial texture is 0.606, the sheet is always in the safe area during the stamping process. When the Fns of the initial textures are 0.680 and 0.690, the bottom rounded corner of the sheet is at slight risk of cracking, but no cracking occurred. When the Fn of the initial texture is 0.700, a red cracking area appears at the bottom rounded corner of the sheet in the stamping process, and when the Fn of the initial texture of the sheet is 0.722, a red cracking area also appears at the bottom rounded corner of the sheet in the stamping process, and the red cracking area increases. Additionally, it can be seen from the results of the equivalent strain that with the increasing Fn of the initial textures, the equivalent strain increases. In other words, the area of the sheet involving the deformed process increases. However, it should be noted that although the wrinkling area in the forming limit maps increases, it does not mean that the wrinkling risk increases, because the strain path of the sheets does not change.
That is to say, as the Fn of the initial texture of the sheet increases, cracks gradually occur at the bottom of the rounded corner of the sheet. This indicates that when the sheet with different initial textures undergoes stamping and forming at the same depth, the lower the Fn of the initial texture, the smaller the risk of the sheet cracking, and the better the formability of the sheet. Therefore, the Fn of the sheet should be controlled to be less than 0.7 in order to prevent the sheet cracking.
5. Discussion
Based on study results, a non-isobaric reduction rolling process is designed. The as-received sheet was rolled through five passes of the non-isobaric reduction rolling process to obtain a cold-rolled sheet. Then, the cold-rolled sheet was annealed at 650 °C for 2 h. An EBSD test was conducted, and the results are shown in Figure 6. When the as-received sheet went through non-isobaric reduction rolling, local grains were broken and some large grains, which were difficult to deform, still maintained their original structure morphology, as shown in Figure 8a. The pole density of the sheet that underwent non-isobaric reduction rolling is 7.93, the Fn is 0.731, the Ft is 0.214, and the Fr is 0.054. as shown in Figure 8b. When the cold-rolled sheet was annealed at 650 °C for 2 h, the grains inside the sheet prepared by non-isobaric reduction rolling also grew, but the orientations of most grains were relatively random, and some grains of yellow and green orientations appeared. What is more, deformed structures were almost all produced instead of recrystallized grains, and a few hard-to-deform grains nucleated at the original grain boundaries and grew toward the local region with the highest stored energy, as shown in Figure 8c. The maximum pole density of the sheet produced by non-isobaric reduction rolling after annealing is 7.22, the Fn is 0.690, the Ft is 0.256, and the Fr is 0.054. The c-axis of most grains of the sheet produced by non-isobaric reduction rolling after annealing will rotate from ND to TD, as shown in Figure 8d.

Figure 8.
(a,b) The microstructure, (0001) pole figures (PFs) and Kearns factors of the rolled sheet prepared by non-isobaric reduction rolling and (c,d) annealed at 650 °C for 2 h.
Compared with textures after by isobaric reduction rolling, it can be found that the Fr maintains consistent, the Ft is lower for isobaric reduction rolling, and the Fn is higher for non-isobaric reduction rolling. This is because the c-axis of most grains of the sheet prodcued by isobaric reduction rolling will rotate from TD to ND under the effect of the rolling force, resulting in the increase in the Fn. However, due to the non-uniform deformation of the sheet in non-isobaric reduction rolling, a few hard-to-deform grains maintain their original orientation, away from ND, resulting in a small increase in the Fn of the deformed sheet produced by non-isobaric reduction rolling. As a result, the Fn of the sheet produced by isobaric reduction rolling is higher than that produced by non-isobaric reduction rolling.
Figure 9 shows the misorientation distributions of the Zr-4 sheet with non-isobaric reduction rolling and annealing at 650 °C for 2 h. It can be seen from Figure 9 that when the sheet is prepared by non-isobaric reduction rolling, the fraction of the low angle grain boundaries (LAGBs) is 69.25%, and the average angle is 13.66 degrees. However, when the deformed sheet anneals at 650 °C for 2 h, the fraction of the low angle grain boundaries is 5.01%, and the average angle is 43.42 degrees. Similarly, when the deformed sheet anneals at 650 °C for 2 h, the grains are recrystallized, and LAGBs are transformed into high angle grain boundaries, the fraction of LAGBs decreases, and the average angle of the grain increases. Additionally, we found that the fraction of LAGBs and the average angle of grains have no obvious differences between isobaric reduction rolling and non-isobaric reduction rolling. This is because the sheets are both rolled by large deformation, the cumulative deformation strain on the grains is the same, and the internal grains both undergo complete recrystallization. Therefore, the fraction of LAGBs and the average angle are similar.
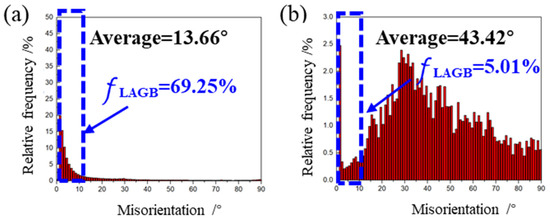
Figure 9.
Misorientation distributions of Zr-4 sheet for (a) non-isobaric reduction rolling; and (b) annealing at 650 °C for 2 h.
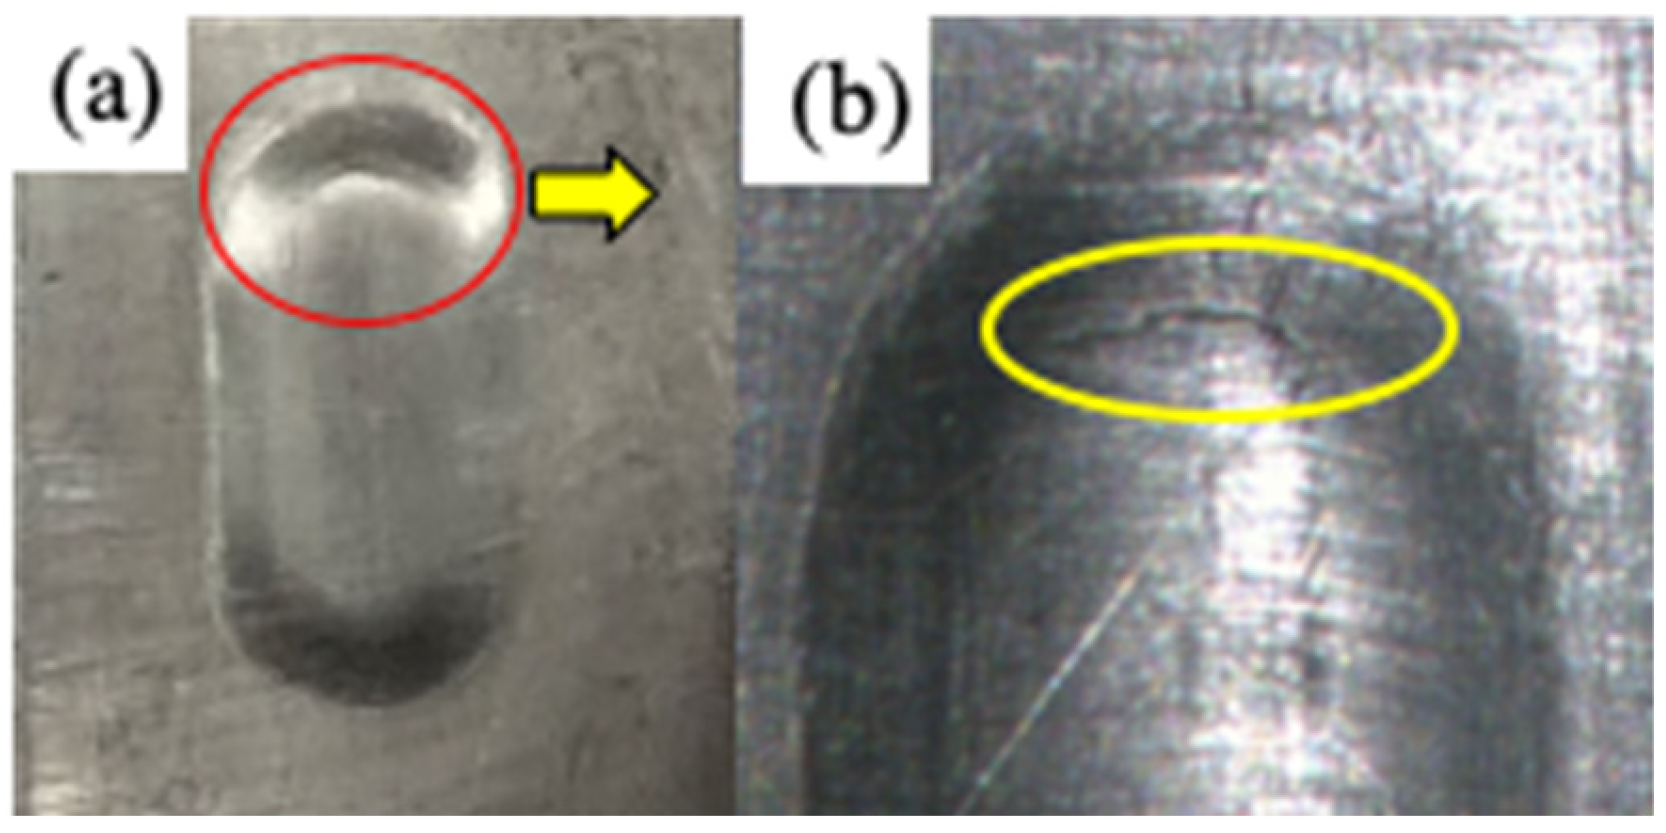
The stamping sample of the cold-rolled Zr-4 sheet prepared by the non-isobaric reduction rolling process has the same size of sample as the cold-rolled Zr-4 sheet prepared by the isobaric reduction rolling process. The sample was subjected to the same heat treatment experiment as the sample of the cold-rolled Zr-4 sheet prepared by the isobaric reduction rolling process. Figure 10 shows the surface of a stamped product of a cold-rolled sheet produced by the non-isobaric reduction rolling process. As can be seen from Figure 10, no cracking occurs at the rounded corners of the stamped finished product, which shown inside the red circle in Figure 10a and enlarged in the yellow circle in Figure 10b. That is to say, when the Fn of the initial texture of the sheet is 0.690, the sheet will not crack.
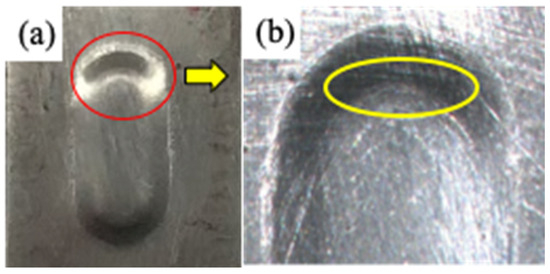
Figure 10.
The result of a stamped product of a cold-rolled sheet prepared by non-isobaric reduction rolling: (a) the stamped finished product; (b) the enlarged rounded corner.
The deformation of the sheet is uneven due to non-isobaric reduction rolling, and a small number of the hard-to-deform grains maintain their original orientation, and most of the c-axis of the grains rotates from TD to ND due to rolling deformation. While the deformation of the sheet is relatively uniform due to isobaric reduction rolling, the c-axis of almost all grains rotates from TD to ND due to rolling deformation. This is why the sheet prepared by non-isobaric reduction rolling has a lower Fn than the sheet produced by isobaric reduction rolling. After annealing, most of the grains in the sheet prepared by isobaric reduction rolling still maintain the red orientation, which similar to orientation of the cold-rolled sheet. The c-axis of a small number of grains changes their orientation, resulting in the texture of the sheet weakening after annealing. However, the orientation of some grains in the sheet produced by non-isobaric reduction rolling is different from the red orientation of the original cold-rolled sheet, and the c-axis of some grains inclines from ND to TD, resulting in a significant weakening of the sheet texture after annealing. This is because the annealing texture of cold-rolled sheets is different due to the different recrystallization mechanisms during the annealing process.
6. Conclusions
In this paper, finite element simulation and VPSC simulation were used to establish the relationship between different initial textures and the formability of the sheets, and a new rolling process was designed combined with the same annealing process. Then, the experimental results for sheet stamping without cracking were obtained. The main conclusions can be summarized as follows:
- (1)
- The sheet prepared by isobaric reduction rolling cracks in the stamping process.
- (2)
- Based on FEM and VPSC simulations, the Fn of the sheet should be controlled to be less than 0.7 in order to prevent the sheet cracking.
- (3)
- A new rolling process named non-isobaric reduction rolling was designed, and the result shows that the Fn of the sheet prepared by isobaric reduction rolling is higher than the sheet prepared by non-isobaric reduction rolling.
- (4)
- The fraction of LAGBs and the average angle of grains have no obvious differences between isobaric reduction rolling and non-isobaric reduction rolling.
- (5)
- The Fn of the initial texture prepared by non-isobaric reduction rolling is less than 0.7, and the sheet is free of cracking during stamping.
Author Contributions
Conceptualization, S.-H.Z. and H.-W.S.; methodology, H.L., S.-Y.D. and S.-F.C.; investigation, H.L.; writing—original draft preparation, H.L.; writing—review and editing, H.-W.S. and S.-F.C.; supervision, S.-H.Z.; funding acquisition, H.L. and S.-Y.D. All authors have read and agreed to the published version of the manuscript.
Funding
This research was funded by the National Funded Postdoctoral Researcher Program (funding number: GZC20231729) and the National Natural Science Foundation of China (grant number: 52105413).
Data Availability Statement
The raw data supporting the conclusions of this article will be made available by the authors on request.
Acknowledgments
The authors would like to thank Jun-Peng Li and Peng Liu for their help with the experiment of this work.
Conflicts of Interest
The authors declare no conflicts of interest.
References
- Ronald, B. Adamson. In Zirconium Production and Technology: The Kroll Medal Papers; ASTM International: West Conshohocken, PA, USA, 2010; pp. 321–355. [Google Scholar]
- Holt, R.A.; Limback, M.; Kammenzind, B.; Dean, S.W. In-reactor deformation of zirconium alloy components. J. ASTM Int. 2008, 5, 101354–101369. [Google Scholar] [CrossRef]
- Steinbrück, M.; Böttcher, M. Air oxidation of Zircaloy-4, M5® and ZIRLO™ cladding alloys at high temperatures. J. Nucl. Mater. 2011, 414, 276–285. [Google Scholar] [CrossRef]
- Nikulina, A.V.; Konkov, V.F.; Peregud, M.M.; Vorobev, E.E. Effect of molybdenum on properties of zirconium components of nuclear reactor core. Nucl. Mater. Energy 2018, 14, 8–13. [Google Scholar] [CrossRef]
- Jeong, Y.H.; Park, S.Y.; Lee, M.H.; Choi, B.K.; Baek, J.H.; Park, J.Y.; Kim, J.H.; Kim, H.G. Out-of-pile and in-pile perfomance of advanded zirconium alloys (HANA) for high burn-up fuel. J. Nucl. Sci. Technol. 2006, 43, 977–983. [Google Scholar] [CrossRef]
- Onimus, F.; Gelebart, L.; Brenner, R. Polycrystalline simulations of in-reactor deformation of recrystallized Zircaloy-4 tubes: Fast fourier transform computations and mean-field self-consistent model. Int. J. Plast. 2022, 153, 103272. [Google Scholar] [CrossRef]
- Han, F.Z.; Li, G.P.; Liu, C.Z.; Yuan, F.S.; Zhang, Y.D.; Ali, M.; Guo, W.B.; Gu, H.F. Anisotropic yielding behavior and associated mechanism of cold rolled and annealed Zircaloy-4 alloy thin sheets under tensile condition. Mater. Chem. Phys. 2020, 242, 122539. [Google Scholar] [CrossRef]
- Guo, W.B.; Li, G.P.; Yuan, F.S.; Han, F.Z.; Zhang, Y.D.; Ali, M.; Ren, J.; Yuan, G.H. Texture development and mechanical behavior of Zircaloy-4 alloy plates fabricated by cold rolling and annealing. Mater. Sci. Eng. A 2021, 807, 140846. [Google Scholar] [CrossRef]
- Deng, S.Y.; Song, H.W.; Zheng, C.; Zhao, T.Z.; Zhang, S.H.; Nielsen, K.B. Selection of deformation modes and related texture evolution in Zircaloy-4 during one pass cold pilgering. Mater. Sci. Eng. A 2019, 764, 138280. [Google Scholar] [CrossRef]
- Zhang, Y.D.; Li, G.P.; Liu, C.Z.; Yuan, F.S.; Han, F.Z.; Ali, M.; Guo, W.B.; Gu, H.F. The effect of three-dimensional loading and texture on deformation mechanism of Zircaloy-4 alloy: Using space Schmid factor model. Mater. Sci. Eng. A 2019, 761, 137992. [Google Scholar] [CrossRef]
- Xun, J.; Lin, G.Y.; Liu, H.Q.; Zhao, S.Y.; Chen, J.; Dai, X.; Zhang, R.Q. Texture Evolution and dynamic recrystallization of Zr-1Sn-0.3Nb-0.3Fe-0.1Cr Alloy During Hot Rolling. Acta Metall. Sin. Engl. Lett. 2020, 33, 215–224. [Google Scholar] [CrossRef]
- Li, J.H.; Cui, Y.; Wu, H.; Chen, G. Deformation mechanism of Zr-Sn-Nb-Fe cladding tube under various stress states. Mater. Sci. Eng. A 2020, 771, 138593. [Google Scholar] [CrossRef]
- Hiwarkar, V.D.; Sahoo, S.K.; Samajdar, I.; Narasimhan, K.; Krishna KV, M.; Dey, G.K.; Srivastava, D.; Tewari, R.; Banerjee, S. Annealing of cold worked two-phase Zr-2.5 Nb-Associated microstructural developments. J. Nucl. Mater. 2009, 384, 30–37. [Google Scholar] [CrossRef]
- Zou, L.; Li, H.; Wang, W.X.; Huang, Y.; Li, Y.T. A precision grinding technology for zirconium alloy tubes based on ultrasonic wall thickness automatic measurement system. Int. J. Adv. Manuf. Technol. 2022, 121, 4419–4429. [Google Scholar] [CrossRef]
- Murty, K.L.; Charit, I. Texture development and anisotropic deformation of zircaloys. Prog. Nucl. Energy 2006, 48, 325–359. [Google Scholar] [CrossRef]
- Murty, K.L. Zircaloy life prediction and new generation zircaloys for LWRs. Trans. Indian Inst. Met. 1997, 50, 533–562. [Google Scholar]
- Liu, H.; Deng, S.Y.; Chen, S.F.; Song, H.W.; Zhang, S.H.; Wang, B. Correlation of the anisotropic hardening behavior and texture features of cold rolled Zr-4 sheet under uniaxial tension. J. Mater. Sci. Technol. 2022, 119, 111–122. [Google Scholar] [CrossRef]
- Adamson, R.B.; Coleman, C.E.; Griffiths, M. Irradiation creep and growth of zirconium alloys: A critical review. J. Nucl. Mater. 2019, 521, 167–244. [Google Scholar] [CrossRef]
- Yang, H.L.; Kano, S.; Chai, L.J.; Shen, J.J.; Zhao, Z.S.; McGrady, J.; Duan, Z.G.; Abe, H. Interaction between slip and {10-12} tensile twinning in Zr alloy: Quasi in situ electron back scatter diffraction study under uniaxial tensile test. J. Alloys Compd. 2019, 782, 659–666. [Google Scholar] [CrossRef]
- Shi, H.G.; Li, J.X.; Mao, J.W.; Lu, W.J. The gradual disappearance and re-appearance of yield drop by modulating the pre-strain history in a new zirconium alloy: Dislocation decomposition and recombination. Scr. Mater. 2020, 188, 280–284. [Google Scholar] [CrossRef]
- Kaschner, G.C.; Tome, C.N.; Mccabe, R.J.; Misra, A.; Vogel, S.C.; Brown, D.W. Exploring the dislocation/twin interactions in zirconium. Mater. Sci. Eng. A 2007, 463, 122–127. [Google Scholar] [CrossRef]
- Liu, H.; Deng, S.Y.; Chen, S.F.; Song, H.W.; Zhang, S.H. Virtual design of formability for Zircaloy-4 sheet through texture control. IOP Conf. Ser. Mater. Sci. Eng. 2021, 1157, 012069. [Google Scholar] [CrossRef]
- Lei, C.Y.; Mao, J.Z.; Zhang, X.M.; Liu, J.X.; Wang, L.; Chen, D. A comparison study of the yield surface exponent of the Barlat yield function on the forming limit curve prediction of zirconium alloys with M-K method. Int. J. Mater. Form. 2021, 14, 467–484. [Google Scholar] [CrossRef]
- Lei, C.Y.; Mao, J.Z.; Zhang, X.M.; Wang, L.; Chen, D. Crack prediction in sheet forming of zirconium alloys used in nuclear fuel assembly by support vector machine method. Energy Rep. 2021, 7, 5922–5932. [Google Scholar] [CrossRef]
- Takuda, H.; Hatta, N. Numerical analysis of formability of a commercially pure zirconium sheet in some sheet forming processes. Mater. Sci. Eng. A 1998, 242, 15–21. [Google Scholar] [CrossRef]
- Panchal, M.; Ravi, K.R.; Kaushik, L.; Khatirkar, R.; Choi, S.-H.; Singh, J. Texture control techniques for improving room temperature formability of Mg alloys including pre-twinning: A review. Met. Mater. Int. 2023, 29, 3471–3489. [Google Scholar] [CrossRef]
- Huang, X.S.; Suzuki, K.; Chino, Y.; Mabuchi, M. Influence of initial texture on cold deep drawability of Mg-3Al-1Zn alloy sheets. Mater. Sci. Eng. A 2013, 565, 359–372. [Google Scholar] [CrossRef]
- Barnwal, V.K.; Raghavan, R.; Tewari, A.; Narasimhan, K.; Mishra, S.K. Effect of microstructure and texture on forming behavior of AA6061 aluminium alloy sheet. Mater. Sci. Eng. A 2017, 679, 56–65. [Google Scholar] [CrossRef]
- Miller, V.M.; Berman, T.D.; Beyerlein, I.J.; Pollock, T. Prediction of Magnesium Alloy Formability: The Role of Texture. In Magnesium Technology; Wiley: Hoboken, NJ, USA, 2016; pp. 257–262. [Google Scholar]
- He, W.; Chen, X.; Liu, N.; Luan, B.; Yuan, G.; Liu, Q. Cryo-rolling enhanced inhomogeneous deformation and recrystallization grain growth of a zirconium alloy. J. Alloys Compd. 2017, 699, 160–169. [Google Scholar] [CrossRef]
- He, W.; Chapuis, A.; Chen, X.; Liu, Q. Effect of loading direction on the deformation and annealing behavior of a zirconium alloy. Mater. Sci. Eng. A 2018, 734, 364–373. [Google Scholar] [CrossRef]
- Kearns, J.J. On the relationship among ‘f’ texture factors for the principal planes of zirconium, hafnium and titanium alloys. J. Nucl. Mater. 2001, 299, 171–174. [Google Scholar] [CrossRef]
- Lebensohn, R.A.; Tomé, C.N. A self-consistent anisotropic approach for the simulation of plastic deformation and texture development of polycrystals: Application to zirconium alloys. Acta Metall. Mater. 1993, 41, 2611–2624. [Google Scholar] [CrossRef]
- Tomé, C.N.; Lebensohn, R.A.; Kocks, U.F. A model for texture development dominated by deformation twinning: Application to zirconium alloys. Acta Metall. Mater. 1991, 39, 2667–2680. [Google Scholar] [CrossRef]
- Singh, S.K.; Limbadri, K.; Singh, A.K.; Ram, A.M.; Ravindran, M.; Krishna, M.; Reddy, M.C.; Suresh, K.; Prasad, K.S.; Panda, S. Studies on texture and formability of Zircaloy-4 produced by pilgering route. J. Mater. Res. Technol. 2019, 8, 2120–2129. [Google Scholar] [CrossRef]


Disclaimer/Publisher’s Note: The statements, opinions and data contained in all publications are solely those of the individual author(s) and contributor(s) and not of MDPI and/or the editor(s). MDPI and/or the editor(s) disclaim responsibility for any injury to people or property resulting from any ideas, methods, instructions or products referred to in the content. |
© 2024 by the authors. Licensee MDPI, Basel, Switzerland. This article is an open access article distributed under the terms and conditions of the Creative Commons Attribution (CC BY) license (https://creativecommons.org/licenses/by/4.0/).