Article

Phase Transformations after Heat Treating an As-Cast Fe-30Mn-8.8Al-0.3Si-0.15C Steel

by
Victor M. Lopez-Hirata
1,*,
Eduardo Perez-Badillo
1,
Maribel Leticia Saucedo-Muñoz
1,
Felipe Hernandez-Santiago
1 and
Jose David Villegas-Cardenas
2
1
ESIQIE, Metallurgy and Materials, Zacatenco, Instituto Politecnico Nacional, Mexico City 07300, Mexico
2
Engineering School, Materials Department, Coacalco, Universidad Politécnica del Valle de México, Tultitlan 54910, Mexico
*
Author to whom correspondence should be addressed.
Metals 2024, 14(7), 748; https://doi.org/10.3390/met14070748
Submission received: 30 May 2024 / Revised: 20 June 2024 / Accepted: 21 June 2024 / Published: 25 June 2024

Abstract

:
The phase transformations in an as-cast Fe-30Mn-8.8Al-0.3Si-0.15C steel were analyzed experimentally and numerically with a Calphad-based method during heat treatment. The nonequilibrium phases were determined using the Thermo-Calc Scheil module and the equilibrium phases with Themo-Calc based on the steel chemical composition. The precipitated phases were analyzed with TC-PRISMA using the chemical composition, nucleation site, and temperature among other factors. An ingot of this chemical composition was vacuum-melted using pure elements under an Ar gas atmosphere. As-cast steel specimens were annealed and solution-treated, quenched, and then aged at different temperatures. Heat-treated specimens were analyzed by different techniques. The results indicated that the microconstituents are the α and γ phases for the as-cast, homogenized, and quenched conditions. The main difference among these conditions is the distribution and size of the γ phase, which produced a change in hardness from 209 to 259 VHN. In contrast, the aging treatment at 750 °C caused a decrease in hardness from 492 to 306 VHN, which is attributable to the increase in volume fraction of the γ phase. On the other hand, the aging treatment at 550 °C promoted precipitation hardening from 259 to 649 VHN because of the κ precipitate formation. The calculated results for the different heat treatments with the Calphad-based method agreed well with the experimental ones. In addition, the intragranular precipitation of the κ phase could be simulated using the nucleation and growth and coarsening mechanisms based on a Calphad method.

1. Introduction

Steel has a wide application in the automotive sector because of its good mechanical properties, high formability, and low cost. Recently, the necessity of producing steels with a low density, causing a decrease in weight, has increased in order to improve fuel efficiency and to reduce carbon dioxide emissions [1]. The Fe-Mn-Al-C system is the basis for the development of low-density steels. These alloys offer good mechanical properties, such as high yield strength, ultimate tensile strength, elongation, fatigue properties, strength, and toughness at low and high temperatures. Additionally, these steels have shown good oxidation resistance at high temperatures and are susceptible to age hardening. These unique characteristics have identified these alloys as advanced high-strength steels [2,3]. Therefore, the Fe-Mn-Al-C alloys have different applications, such as cryogenic, aircraft, automotive, and chemical industries [4].
The Fe-Mn-Al-C system has been investigated for years [5,6,7,8,9,10]. Ferritic Fe-Al alloys are usually related to the binary Fe-Al equilibrium phase diagram [1]. Al is a strong ferrite-forming element; thus, the ferrite field dominates the diagram. The austenite is stable in a very narrow composition range at high temperatures. Several ordered phases composed of Fe and Al are present in this diagram. In the case of the Fe-Mn-C diagram [1,2], the Mn element is an austenite-forming element, and thus the γ austenite phase field is increased compared to the α ferrite phase. The eutectic reaction, which gives the pearlite microconstituent, is suppressed for these steels. Additionally, the Mn-rich M7C3 and M23C6 carbides become present with an increase in the carbon content. In contrast, for the Fe-C-Al diagram [1,11], the austenite phase field is shifted to higher temperatures and carbon contents to those corresponding to the binary Fe-C diagram. The ferrite phase is stable on the Fe-rich side, and a κ carbide is formed with an increase in carbon. This κ carbide has an L12 crystal structure [1,2]. The eutectic reaction of the Fe-C diagram is also not present in this case. In the Fe-Mn-Al-C phase diagrams, two important equilibrium lines appear: one corresponds to the solvus temperature of the κ carbide formation and the other is the disorder-to-order transition temperature of the ferrite-to-B2 phase [1]. The Fe-Mn-Al-C phase diagrams have been experimentally and numerically investigated. There is a good agreement between them. The equilibrium phases for the Fe-rich side are austenite, ferrite, M7C3, M23C6, and k carbide, depending on the compositions and temperature [1,2,12].
According to the dominant Fe phases, Fe-Mn-Al-C light alloys can be classified into four categories [2]: ferritic steels, ferrite-based duplex steels, austenite-based duplex steels, and austenite steels.
Optical microscope observations of austenite-containing light steels in the as-cast state indicate a mixture of austenite and ferrite as a dendritic structure because of the high degree of microsegregation [1,2]. TEM observations show that the austenite phase may transform into austenite and k carbides, while the ferrite region consists of ferrite and B2 phases. Hot working of as-cast austenite light steels produces recrystallized austenite grains. The intragranular or intergranular ferrite phase or k carbides may precipitate during slow cooling. The presence of coarse κ or ferrite phases resulted in a loss of toughness and strength after the slow cooling of these steels. Therefore, quenching is preferred after austenizing treatment. This precipitation has been extensively studied [1,2,13] in Fe-Mn-Al-C light alloys. These works show that the k, ferrite and B2 phases may be produced by different mechanisms depending on the composition, treatment temperature and time [1,13]. Thus, it is interesting to study the phase transformations in an as-cast Fe-30Mn-8.8Al-0.3Si-0.15C steel since there are no results for this type of composition.
In the case of light ferritic steels containing low C and high Al content, the stable phase is always ferrite. Thus, this phase is elongated during hot rolling and then it is recrystallized. The κ phase may precipitate in the ferrite matrix because of slow cooling [1,2].
The microstructure evolution of duplex steels is more complex than that of ferritic and austenitic steels [2].
The mechanical properties depend on the chemical composition of the light steel [1,2]. The austenitic light steel may present ultimate tensile strengths (UTSs) ranging from 600 to 1100 MPa with 40 to 95% elongations [2]. Austenite-based duplex steels may present UTS values above 1200 MPa with a decrease in elongation [1,2]. Ferrite-based duplex steels have properties similar to those of IF (Interstitial-Free) steels [1]. Likewise, ferritic steels exhibit UTS values between 220 and 600 MPa with elongations between 10 and 25% [2]. The presence of k carbides may considerably increase the UTS of steel, up to 1420 MPa, but it is accompanied by a very poor ductility [1,4].
In the case of Fe-Mn-Al-C steel density, every 1% increase in Al, C, and Mn content causes decreases of 0.101, 0.41, and 0.0085 g/cm3 [14]. The density of these steels range between 6.52 and 7.2 g/cm3. An increase in strength can come from different sources. For instance, the addition of Al and C promotes solid solution strengthening. Furthermore, an increase in C content of 0.1% increases the yield strength by about 20–30 MPa [14,15].
Therefore, an as-cast Fe-30Mn-8.8Al-0.3Si-0.15C steel is expected to present a low density with the presence of austenite γ phase giving toughness to this steel, while the α ferrite phase gives strength to this type of steel. In addition, the C content favors the precipitation of carbides, which causes the precipitation hardening of the α and γ phases. All these factors improve the mechanical properties of these steels.
The Calphad-based numerical methods [16,17] have become powerful tools to analyze different phase transformations not only in equilibrium conditions, but also in nonequilibrium states. For instance, Thermo-Calc software version 2023 b [17] enables us to analyze the phases formed during slow cooling and in the equilibrium state for multiphase and multicomponent alloy systems. In addition, the solidification process in the nonequilibrium condition can be analyzed with the Scheil module [16]. This analysis not only allows us to know the phase formation during solidification but also the microsegregation degree of the as-cast alloy. It is also possible to study the precipitation sequence and growth kinetics of carbides in either an austenite or ferrite matrix using TC-PRISMA [17]. All these results are essential to understand the mechanical behavior of light steels.
Therefore, the present work aims to analyze experimentally and numerically, with a Calphad-based method, the phase transformations that occur in an as-cast Fe-30Mn-8.8Al-0.3Si-0.15C steel, and after homogenizing and aging treatments, as well as their effect on the mechanical properties of this alloy.

2. Materials and Methods

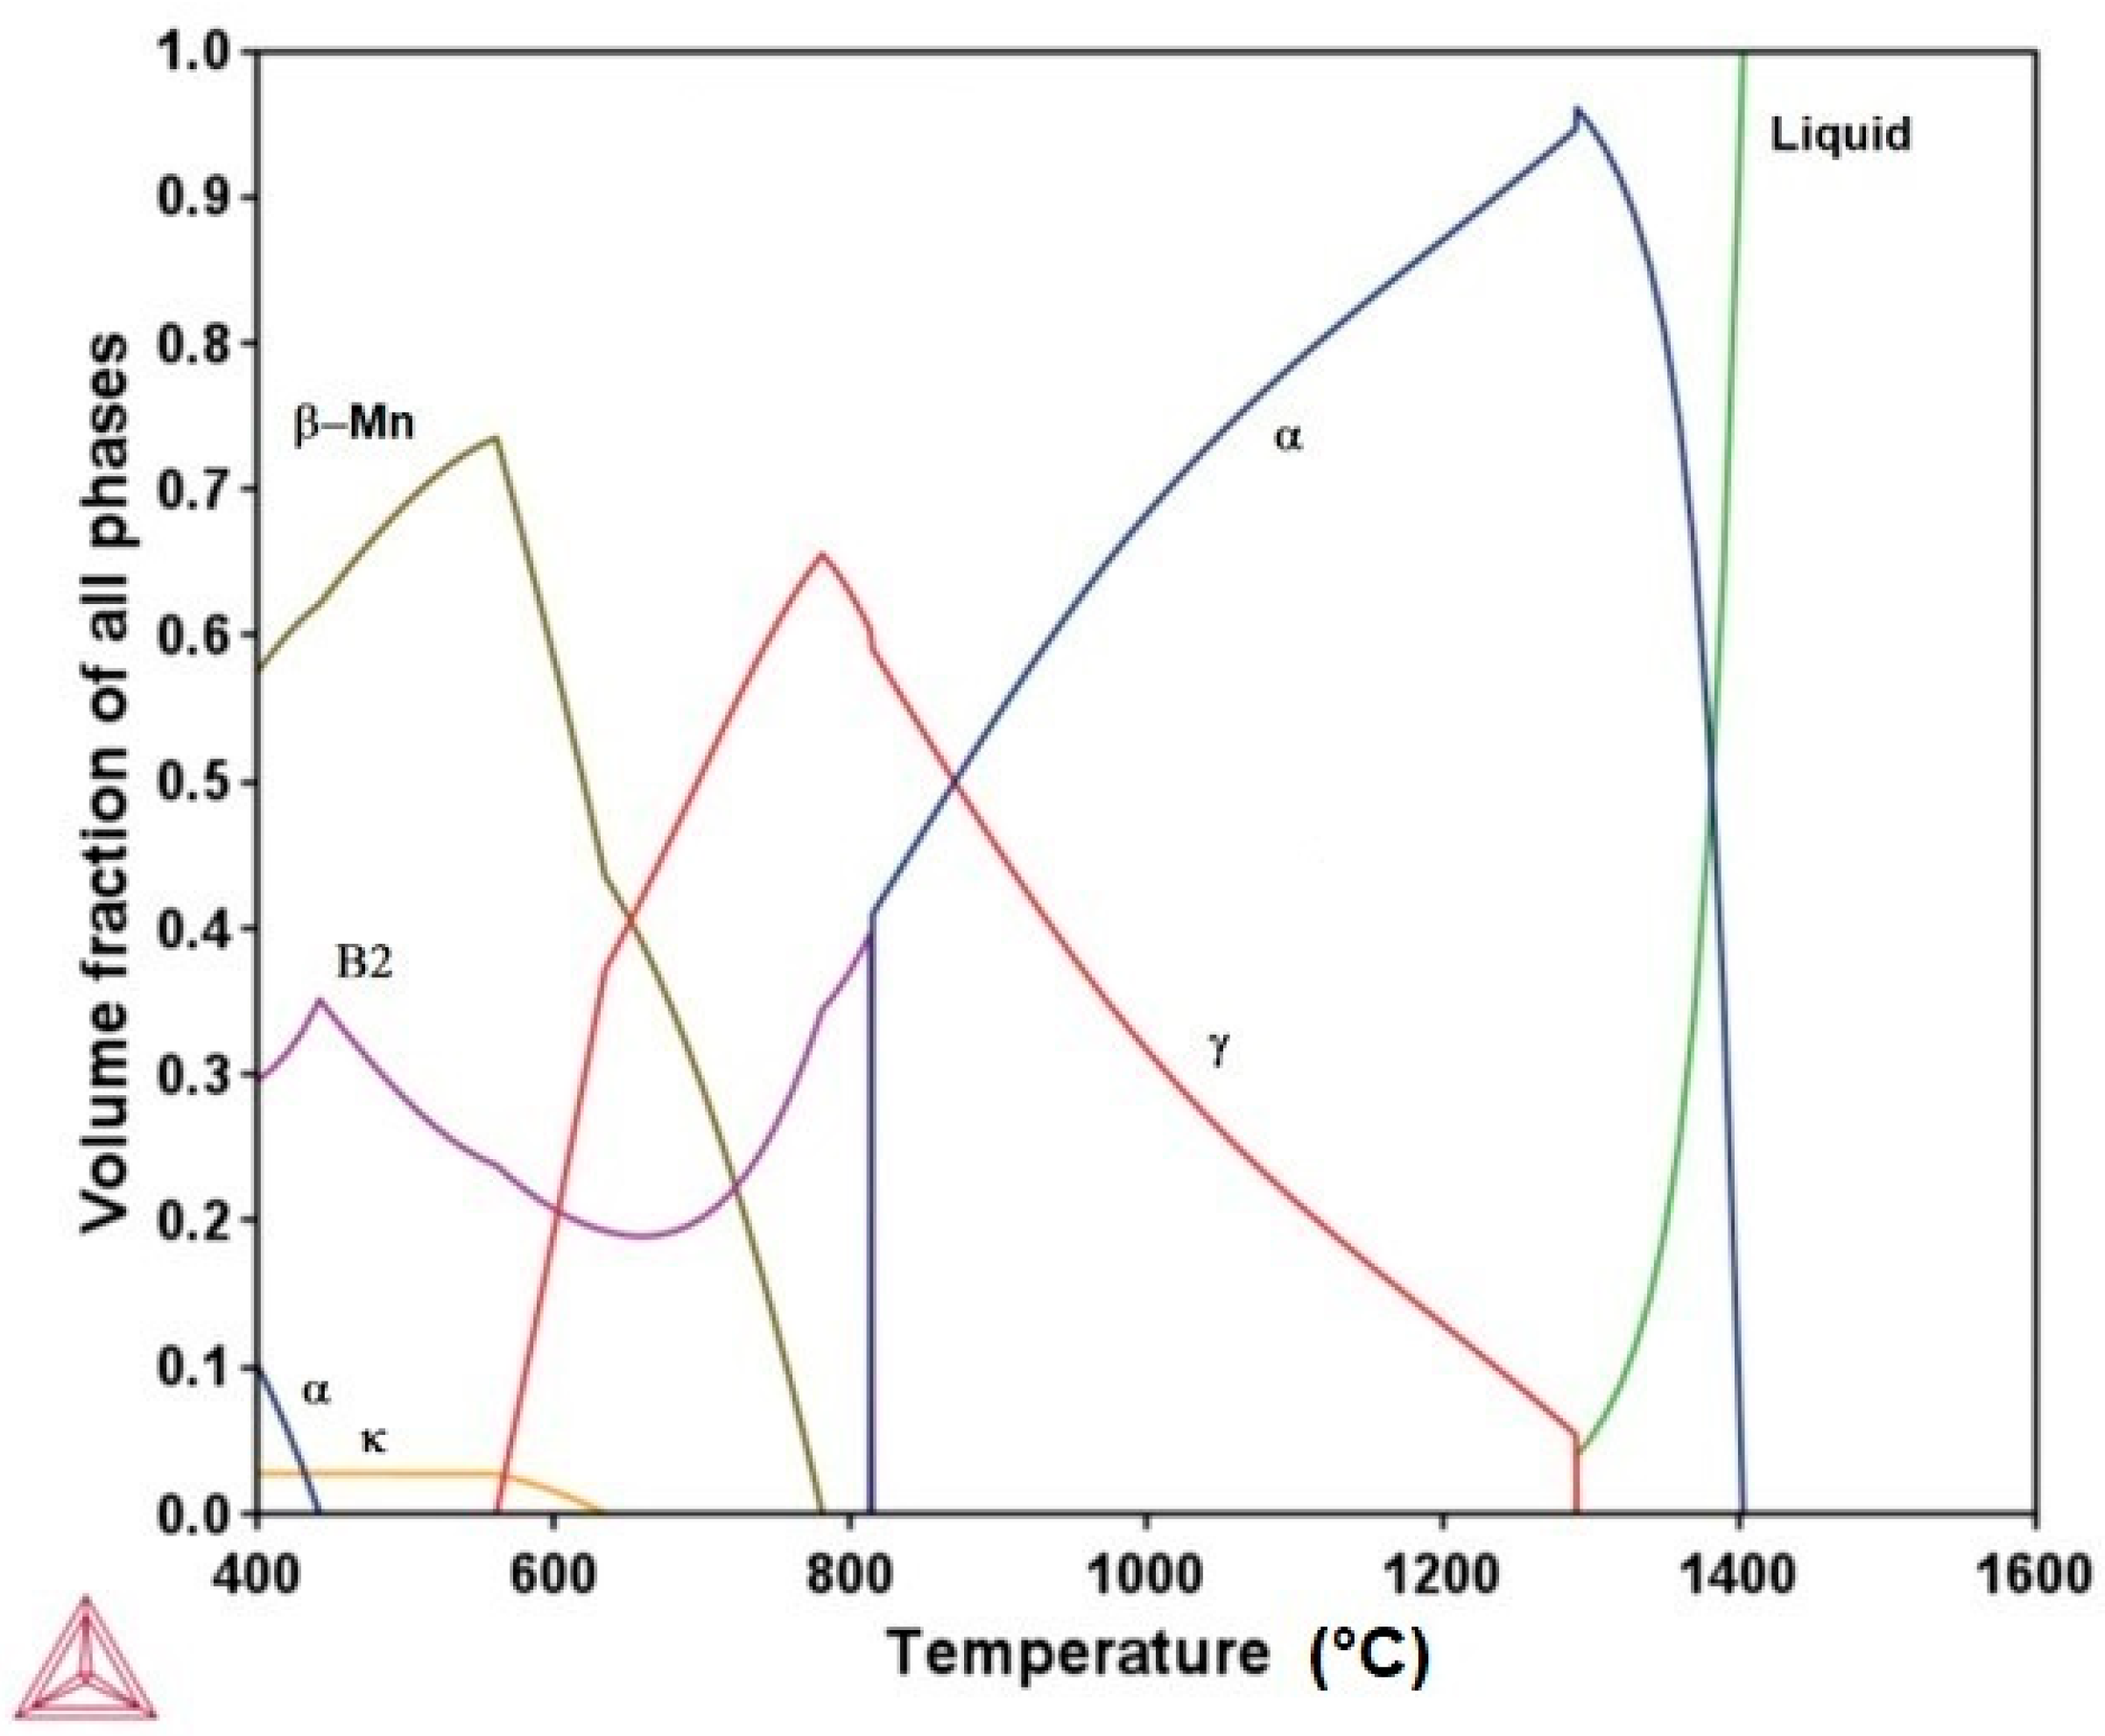
2.1. Numerical Methodology

Thermo-Calc TC software (Stockholm, Sweden) version 2023b [16], a Calphad-based method, was applied to analyze the phase transformations of the steel in equilibrium and nonequilibrium conditions. This software enables us to calculate the phases present in equilibrium and nonequilibrium states. These calculations are useful to analyze the phases and microconstituents that may be present in the as-cast or heat-treated conditions. The Thermo-Calc calculation is based on the free energy minimization to find the phases in equilibrium. In addition, the nonequilibrium phases formed during the solidification process can be calculated using the Scheil equations [16]. The precipitation of several phases, growth kinetics and kinetics diagrams, and TTP, can be analyzed by applying the TC-PRISMA software. The used information was, in general, the chemical composition and temperature. In addition, TC-PRISMA (Stockholm, Sweden) version 2023b [18] was utilized to study the precipitation of the κ phase in the γ austenite. The precipitation was considered to be intragranular, and the interfacial energy between the matrix and precipitate was calculated by the software. The Time–Temperature–Precipitation (TTP) diagram was calculated for this precipitation using Thermo-Calc (Stockholm, Sweden). The input data for this case also include the chemical composition of steel, temperature and time of aging, nucleation site, and initial microstructure. The TCFe11.tdb and MobFe6.mdb databases [16] were used for the calculations.

2.2. Experimental Methodology

An Fe-30Mn-8.8Al-0.3Si-0.15C steel was vacuum-melted using more than 99% pure elements in an Inductotherm induction melting furnace (London, UK). The chemical composition was verified by GBC Avanta atomic absorption spectroscopy (Ciudad de México, México), as shown in Table 1. The actual composition was very close to the nominal one. Steel specimens of about 10 mm × 10 mm × 10 mm were cut using a Minitom diamond disc-cutting machine (Copenhague, Denmark). The heat treatment of the present steel was as follows: homogenized at 1050 ± 2 °C for 5 h and furnace-cooled using a Carbolite electrical furnace (Derbyshire, UK). A solution treatment was carried out at 1050 ± 2 °C for 1 h and subsequently water-quenched, followed by aging at 550 and 750 ± 2 °C for 1, 50, 300, and 500 h. The heating ramp was as follows: room temperature to 500 °C at 20 °C min−1; 500 to 1050 at 10 °C min−1; and stabilization of 1 h. The as-cast and heat-treated steel specimens were metallographically prepared with emery paper up to 2000 grit numbers and alumina of 1 and 0.05 μm to obtain a polished surface. The polishing time was about 10 min for each alumina size. A nital etchant was used to reveal the steel microstructure. The sample observation was conducted with a Nikon (Tokyo, Japan) MA 200 optical microscope (OM) and a JEOL JSM 6300 scanning electron microscope SEM (Tokyo, Japan) at 20 kV, equipped with EDX microanalysis. X-ray diffraction analysis (XRD) of all specimens was carried out using Cu Ka radiation in a Bruker D8 Advance diffractometer (Boston, MA, USA) at 2°/min. The Vickers hardness was determined using a Future Tech F-810 (Kyoto, Japan) with a load of 300 g and 12 s.

3. Results and Discussion

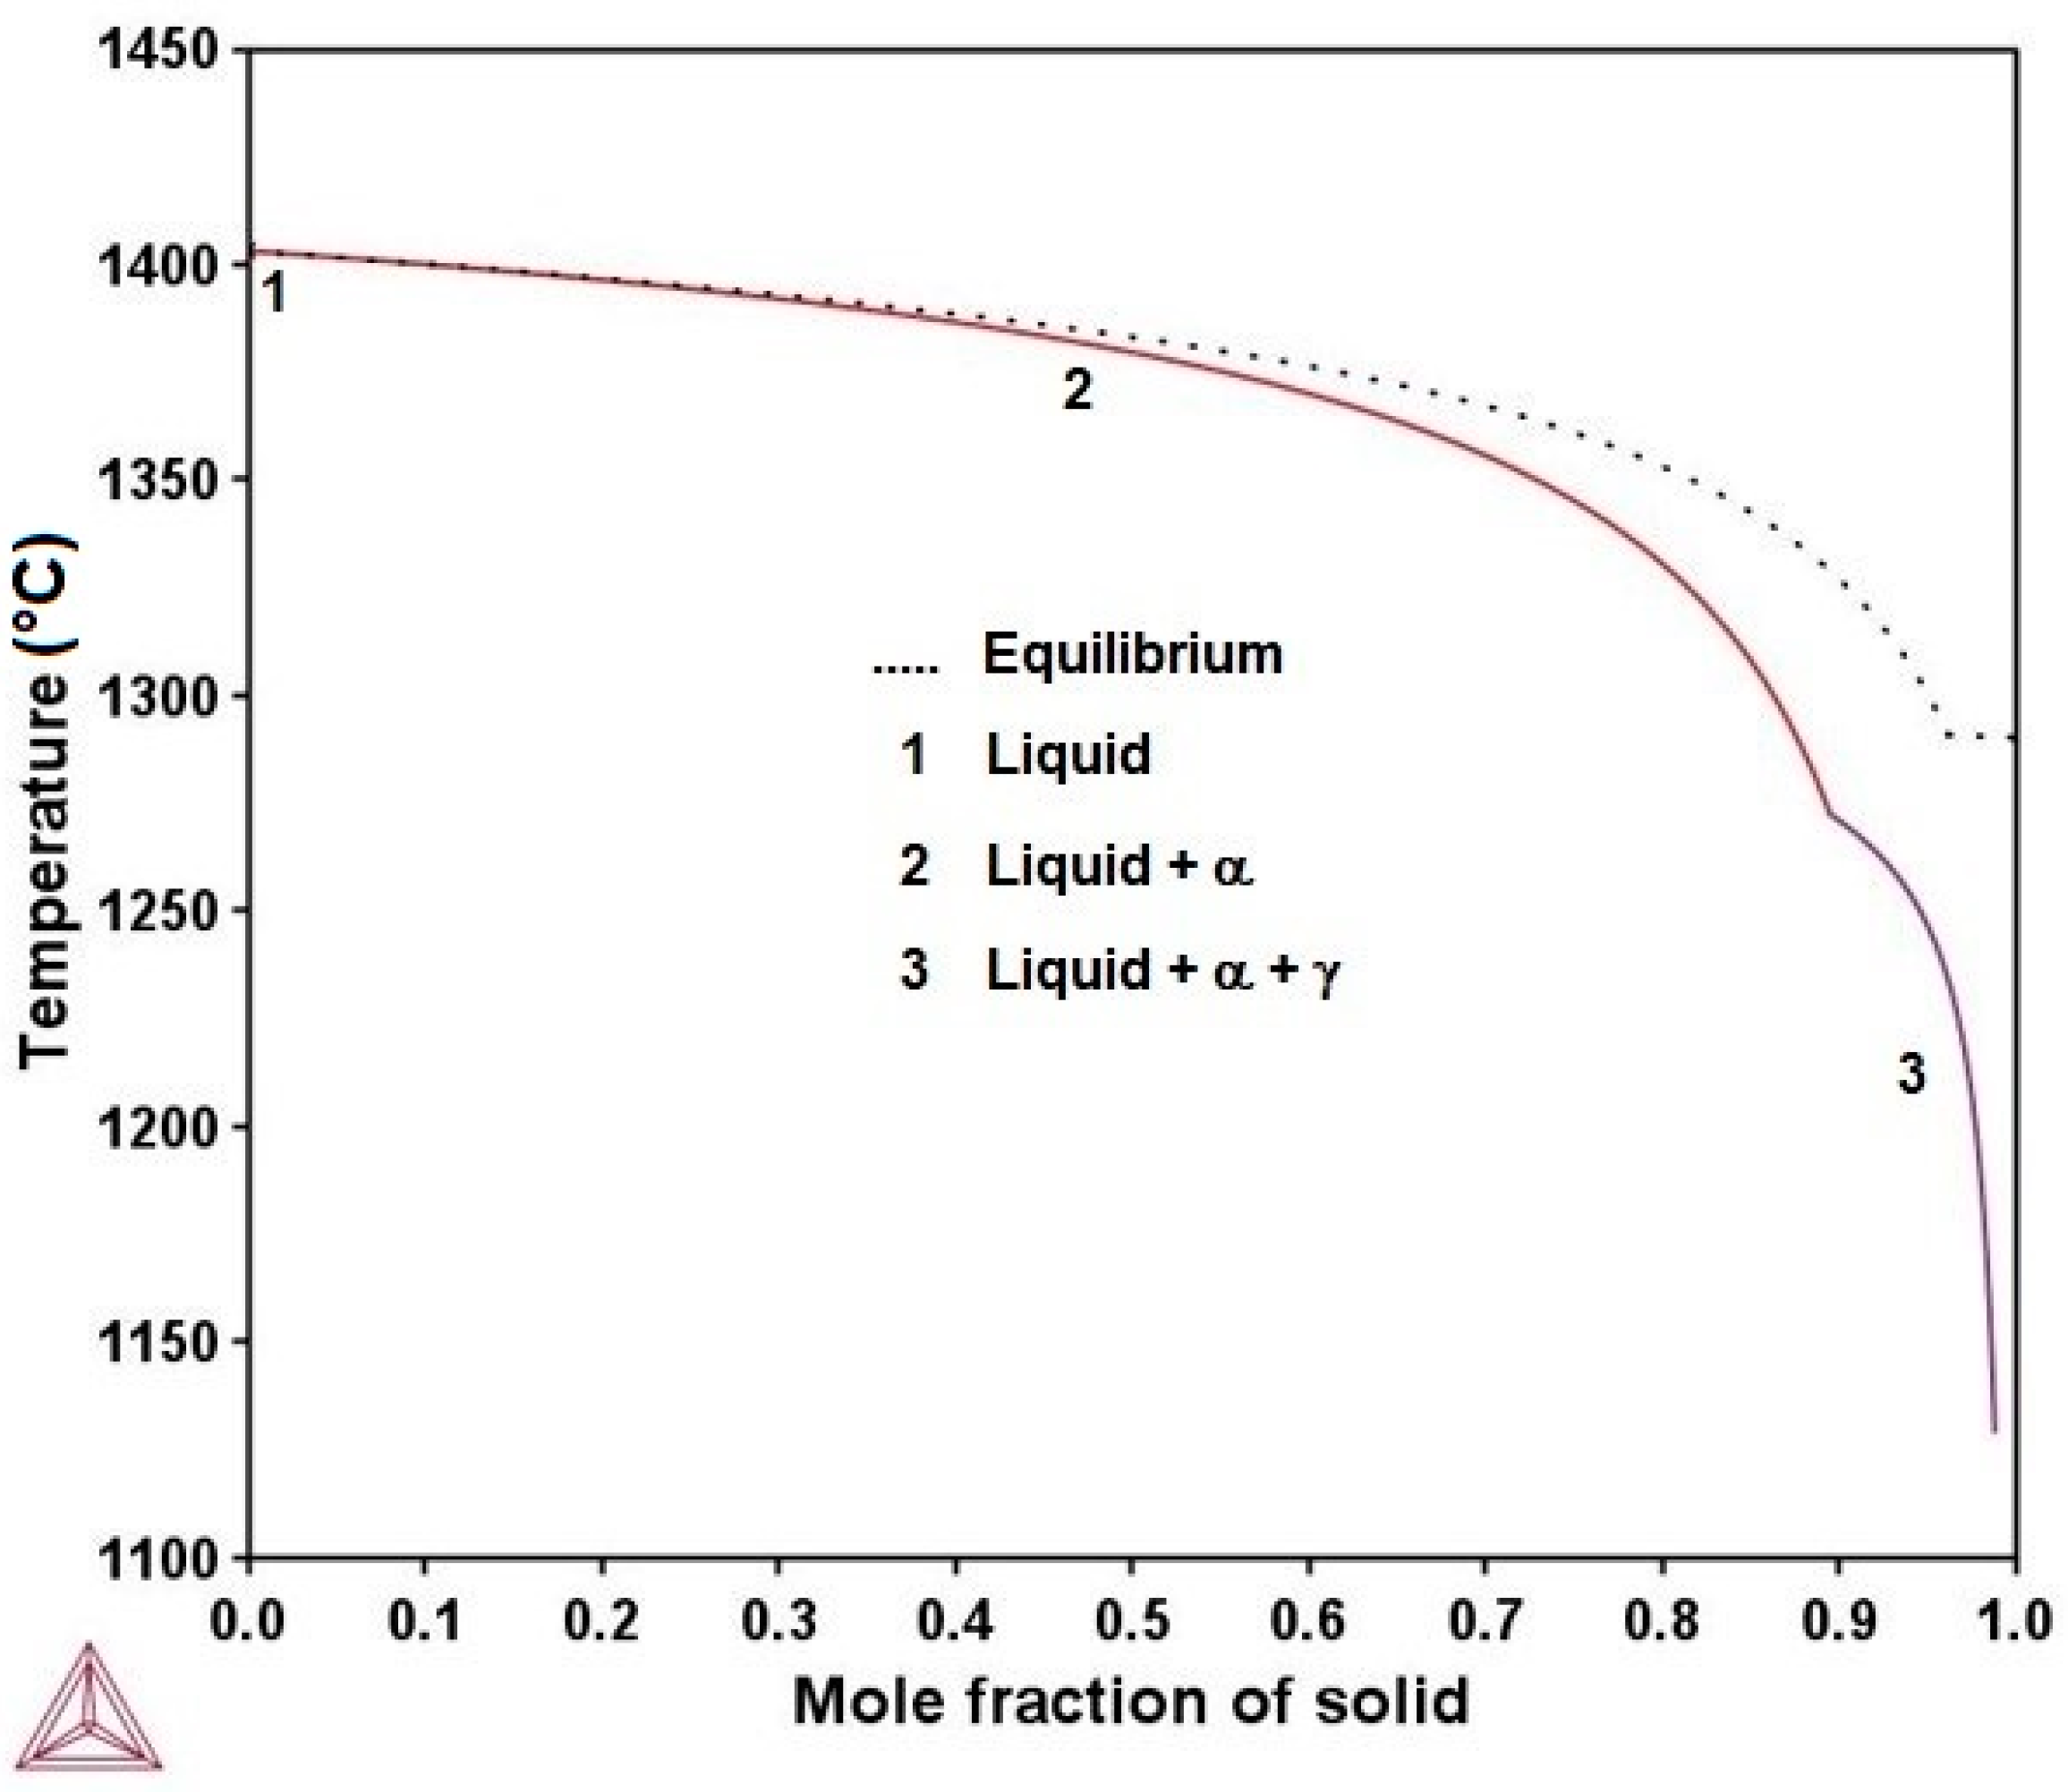
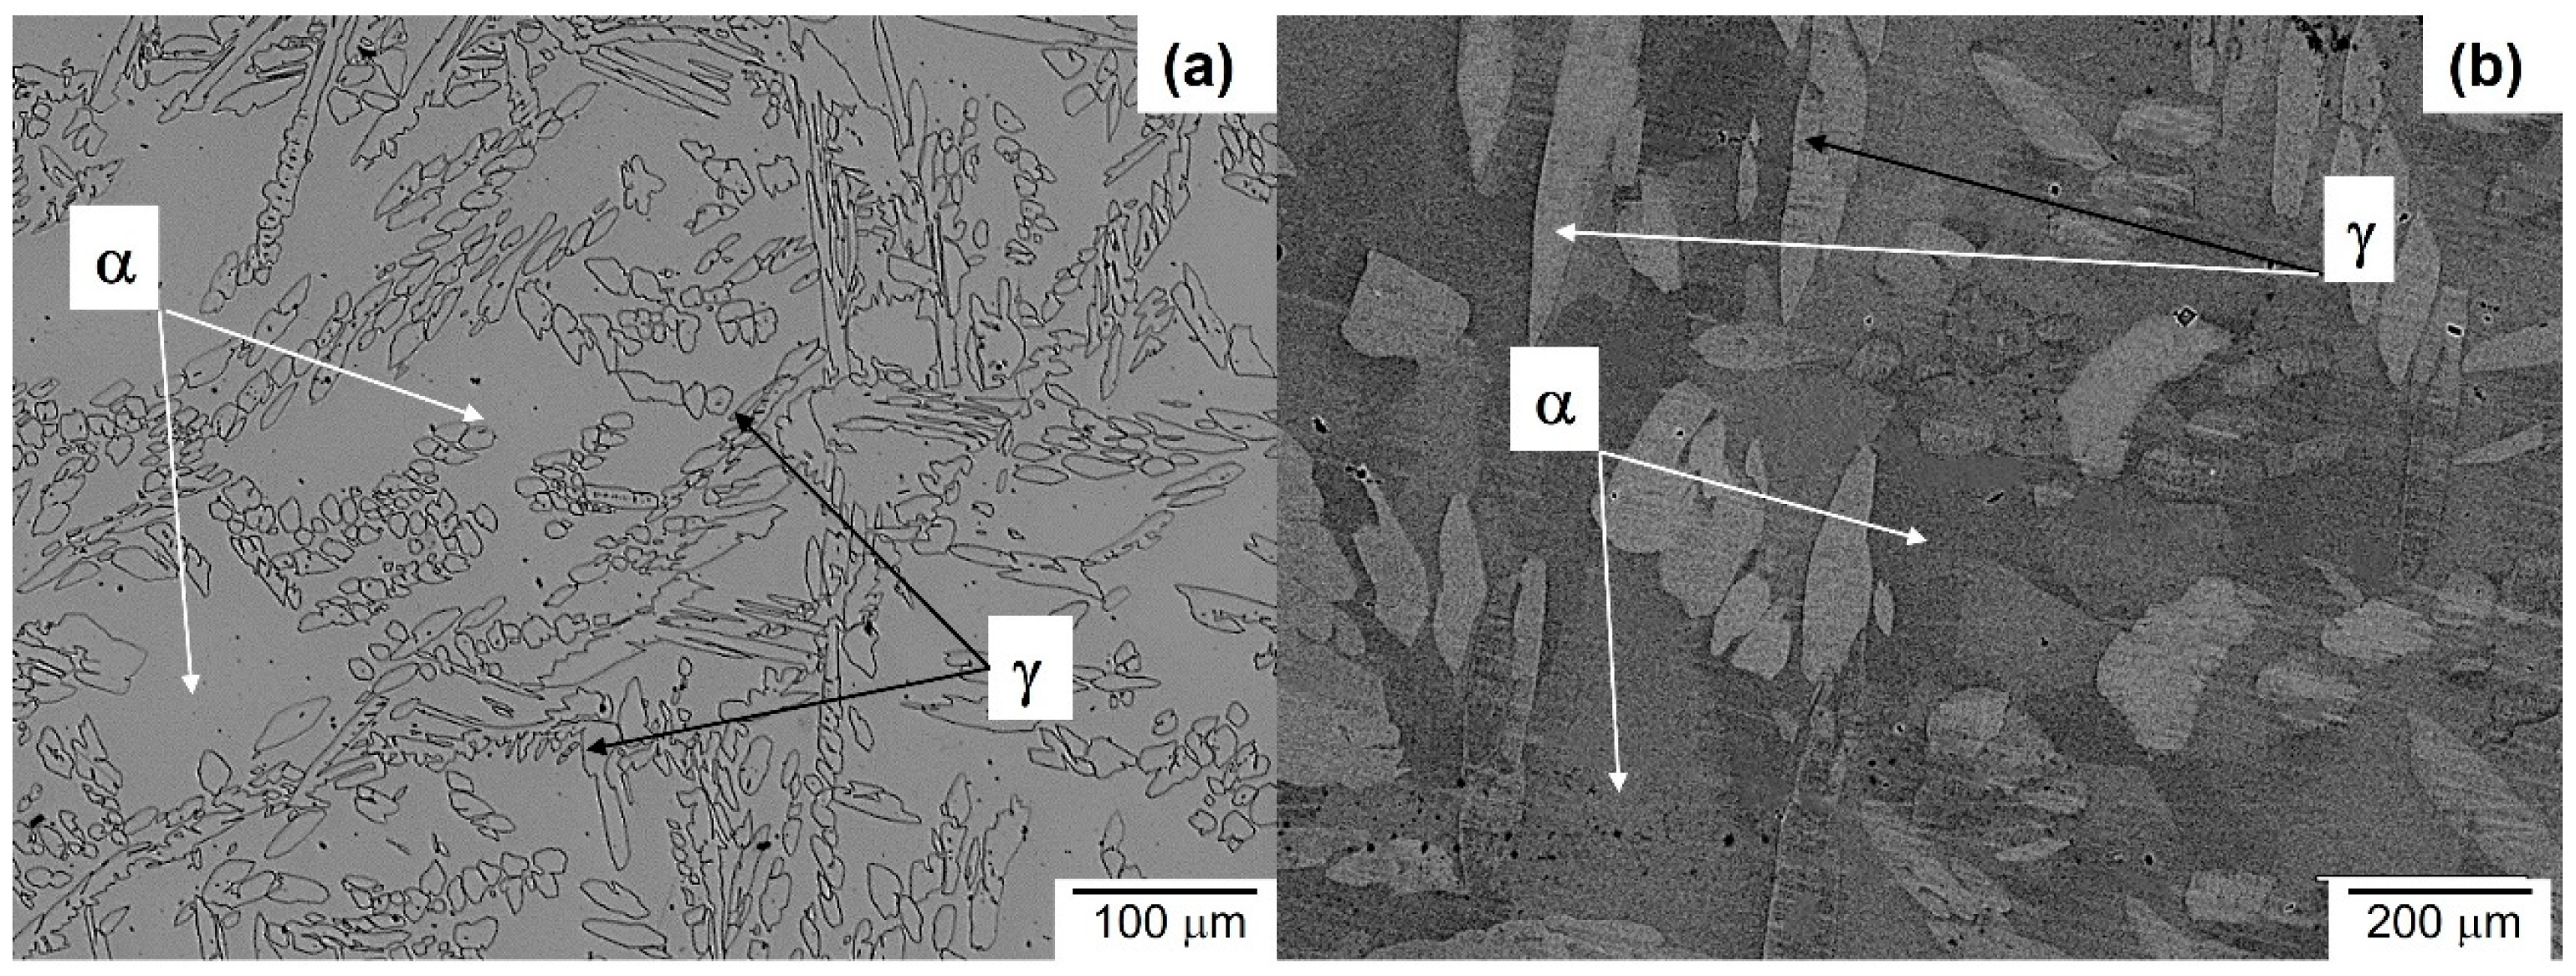
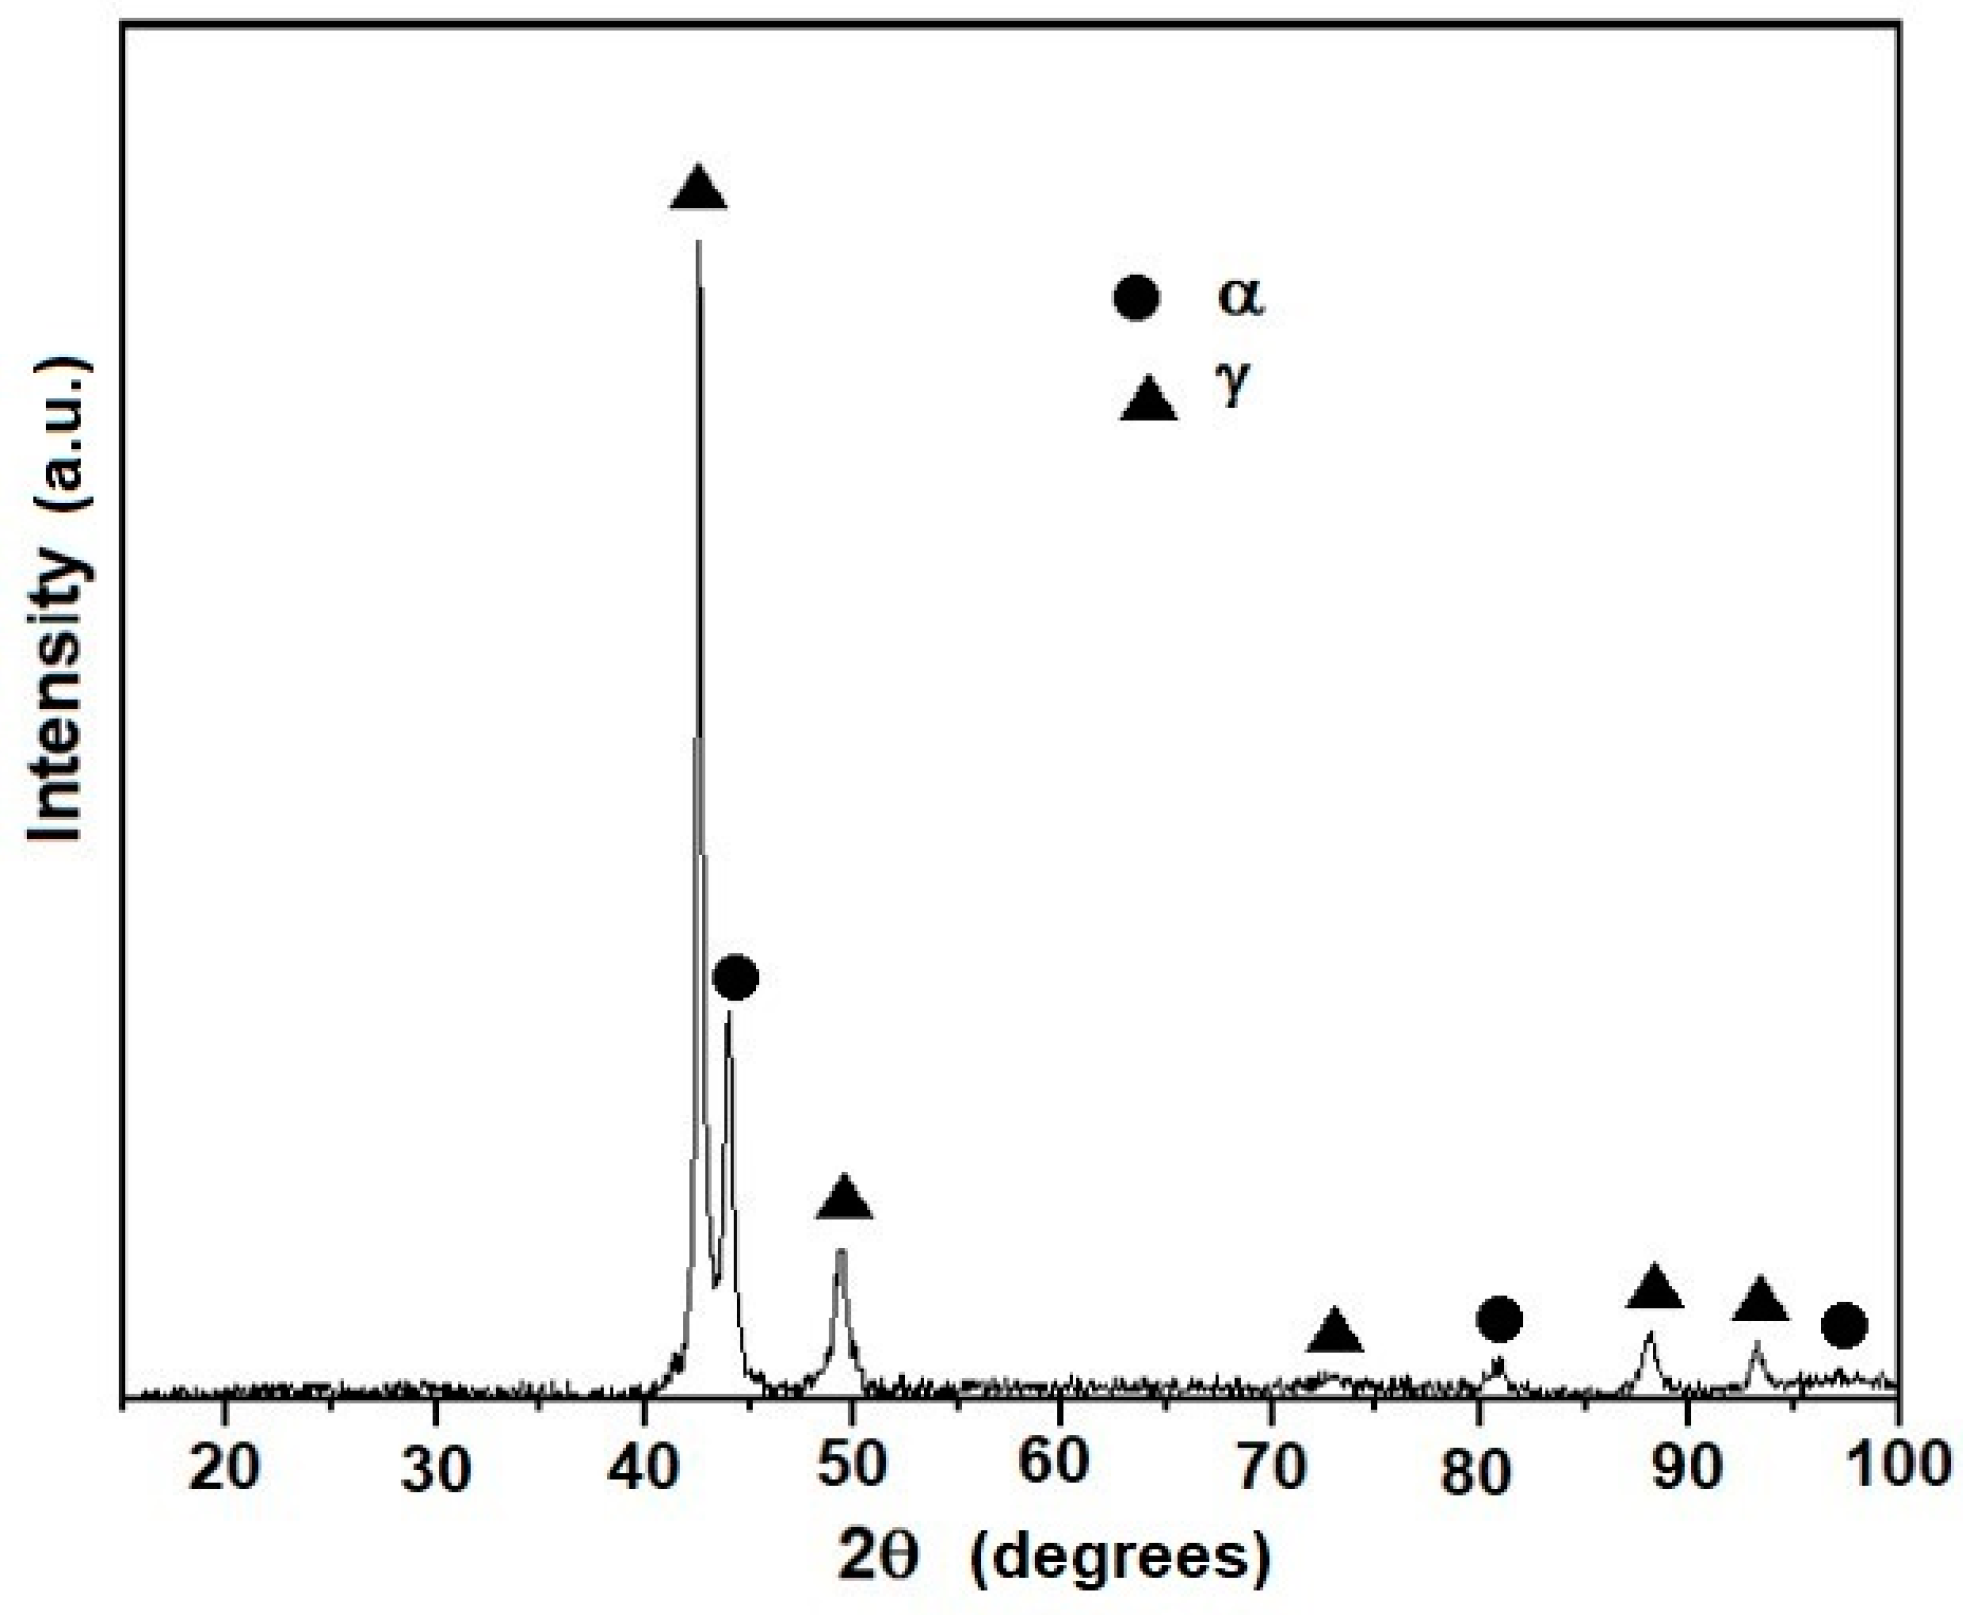
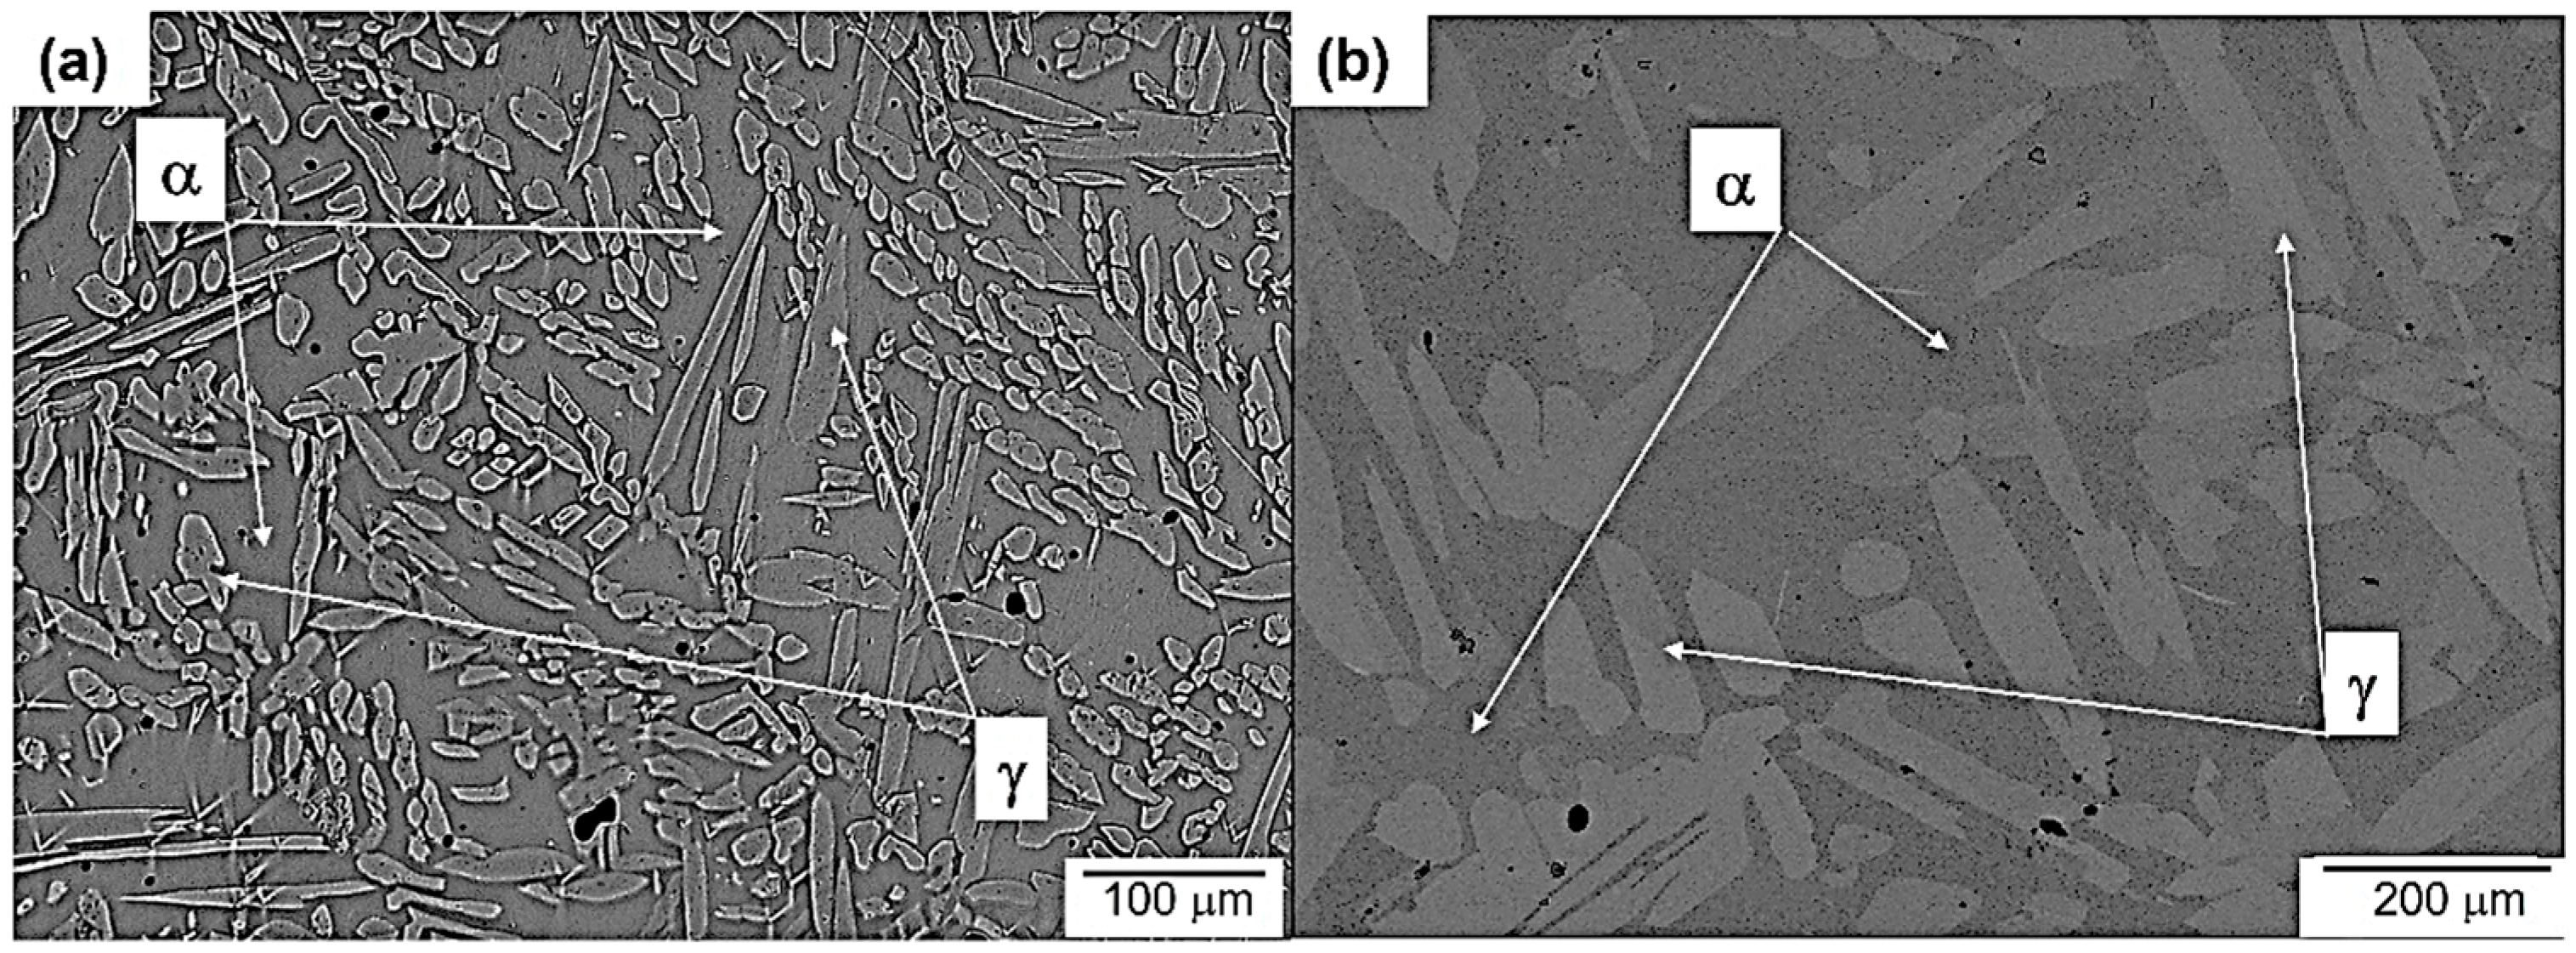
3.1. Microstructure Evolution of As-Cast Steel

Figure 1 shows the plot of temperature versus fraction mol of phases for the analyzed steel composition according to the Scheil analysis [16,17]. The liquidus temperature of this alloy is about 1404 °C, and the liquid phase is stable above this temperature. The first solid phase is the α ferrite phase. The second solid phase corresponds to the γ austenite phase. The volume fraction of the α phase is about 89.40 vol. %, while that of the γ phase is approximately 10.6 vol. %. The Thermo-Calc-calculated chemical composition at about 1200 °C is shown in Table 2. As expected, the C content of the fcc γ phase is higher than that of the bcc α phase, since the former phase dissolves more C because of the larger interstitial sites [1,4]. On the contrary, the Mn and Al contents are slightly higher for the α phase compared to the γ phase. The γ phase provides toughness due to its fcc crystalline structure, while the bcc α phase confers mechanical strength [1].
The OM and SEM micrographs of the as-cast steel are shown in Figure 2a,b, respectively. The larger irregular areas correspond to the α phase, while the fine plates are the γ phase. The quantitative metallography of Figure 2 indicates 80 vol. % α phase and 20 vol. % γ phase, which agrees well with Thermo-Calc results. The EDX SEM microanalysis at room temperature for the α and γ phases are also presented in Table 2. These results suggest that the solute content decreases with temperature compared to the Thermo-Calc-calculated ones at 1200 °C. The higher volume fraction of the γ phase indicates that the steel toughness was improved [2].
Figure 3 illustrates the XRD pattern of the as-cast steel and clearly shows the XRD peaks corresponding to the α and γ phases. Nevertheless, the XRD intensity of the γ phase is higher than that of the α phase. This fact may be attributed to a preferential orientation of the γ phase during the solidification process, but not to a higher volume fraction of this phase. The above results are in discrepancy with the 7.5% α phase and 92.5% γ phase reported for the as-cast Fe-30Mn-10Al-1C alloy in the literature [19]. Nevertheless, these authors suggested that the steel is mainly austenitic due to its higher C content.

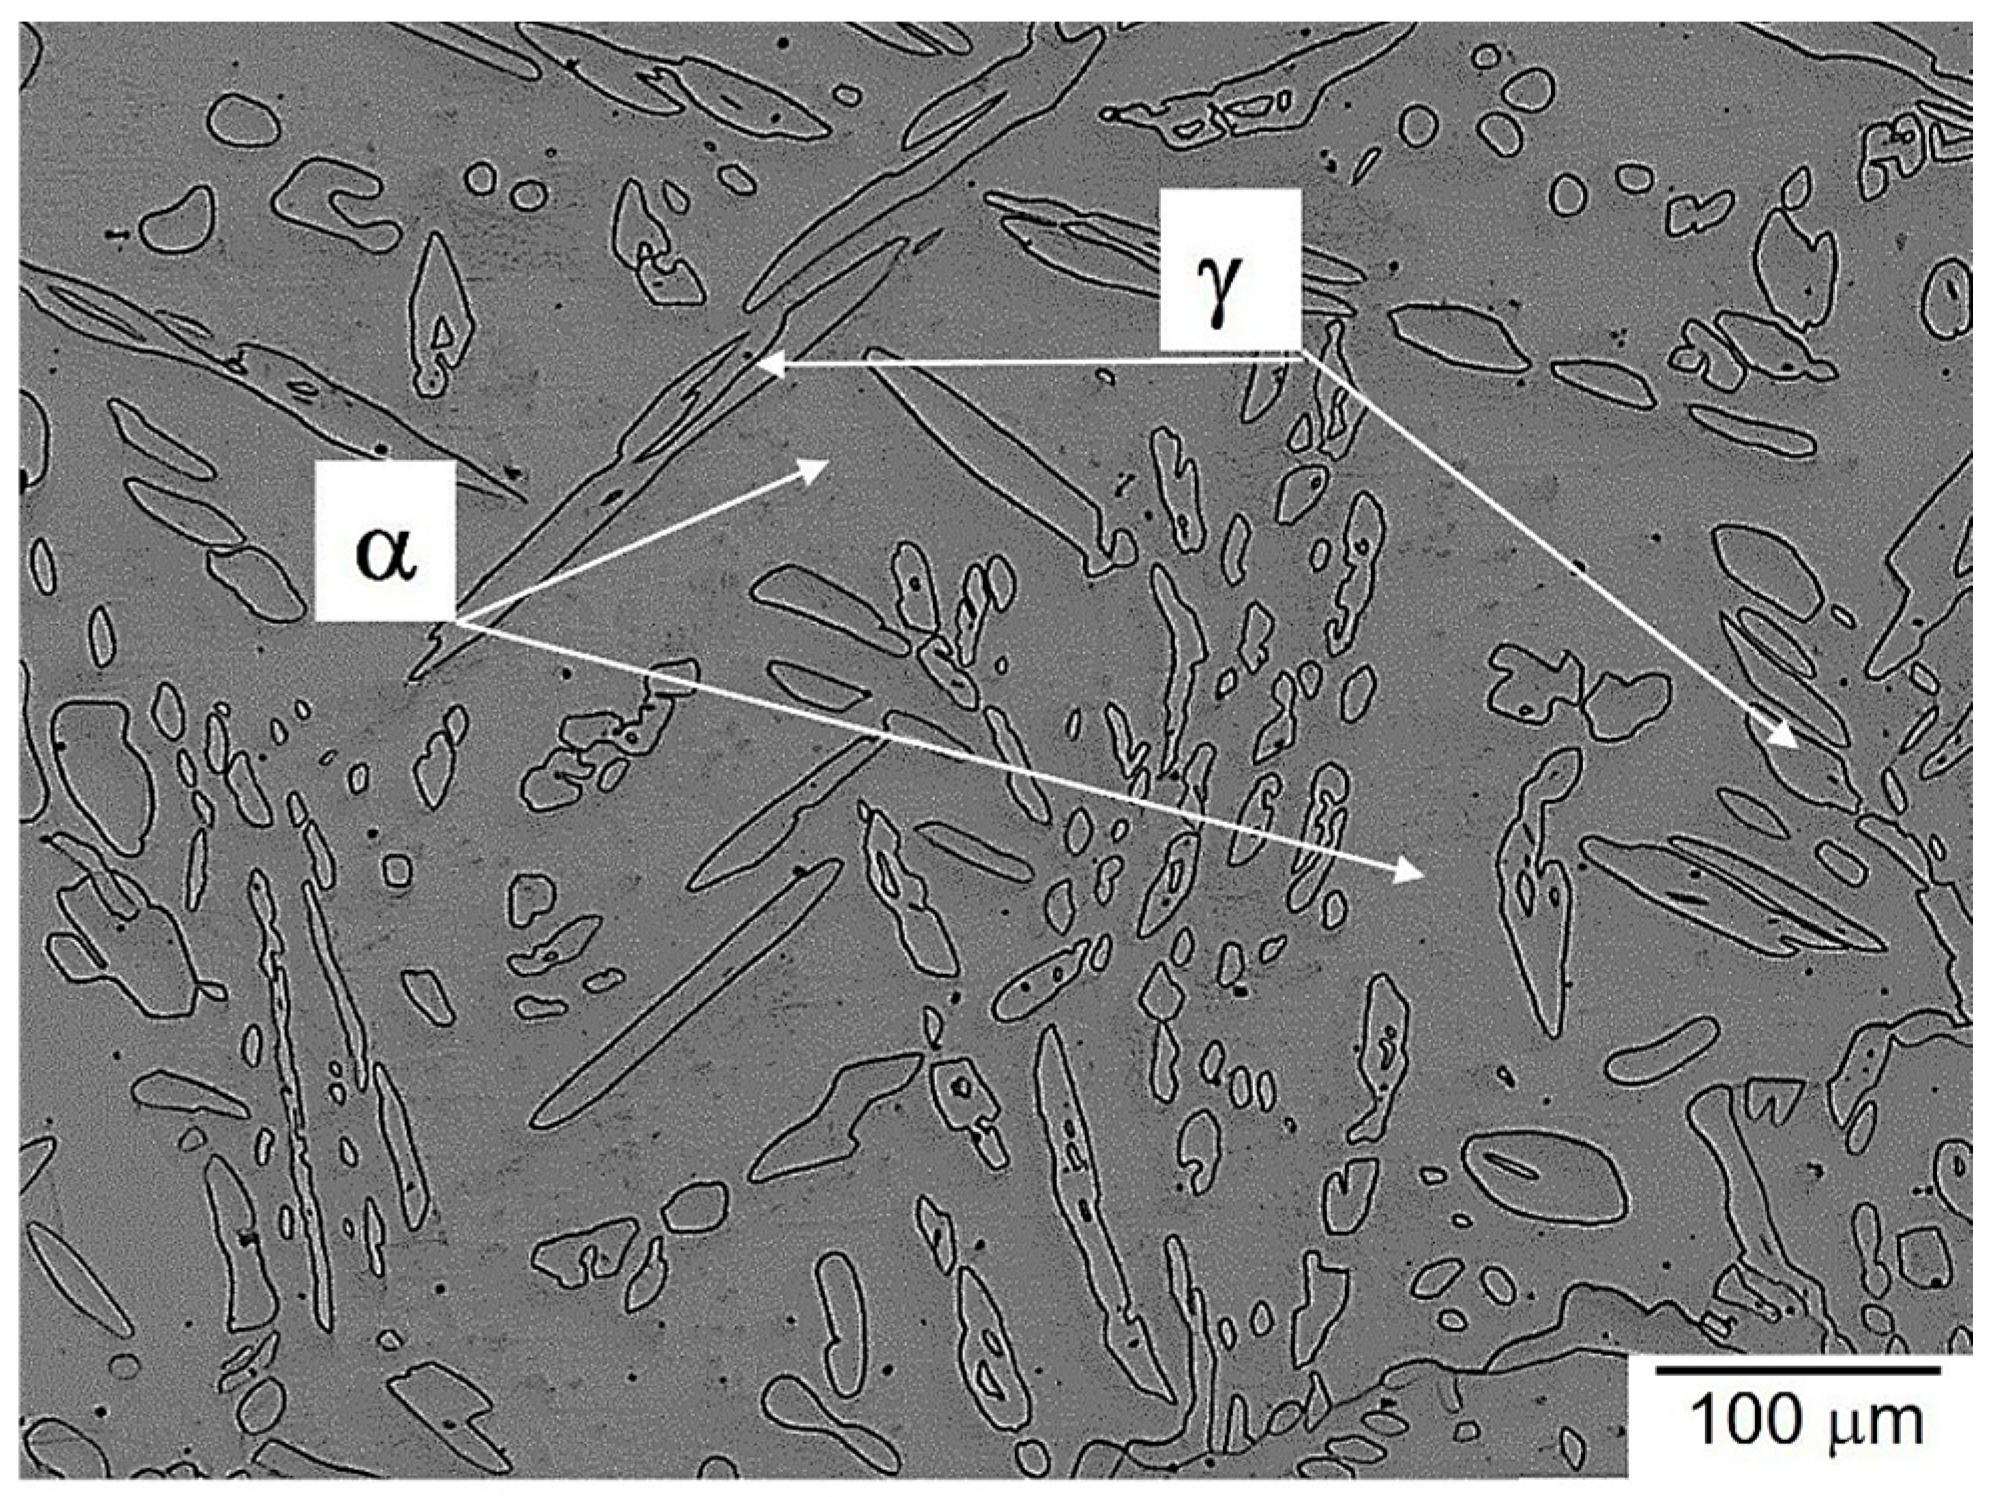
3.2. Microstructure Evolution of Homogenized Steel

The Thermo-Calc-calculated plot of the amount of equilibrium phases against temperature is shown in Figure 4 for the present steel composition. The liquid phase is present at temperatures higher than 1400 °C. The α phase appears below 1400 °C and its volume fraction increases to about 0.96 at about 1292 °C. The γ phase is formed below this temperature, and its volume fraction rises to 0.65 at 785 °C. A further decrease in temperature causes a reduction in the γ phase volume fraction with the formation of the bcc B2 phase, which presents a FeAl-type crystalline structure [1,2].
Figure 4 also shows the transformation of the α ferrite phase into the B2 phase at a temperature of approximately 812 °C. The Thermo-Calc-calculated chemical composition of the B2 phase is close to an (FeMn)Al intermetallic compound. The volume fraction of the latter phase decreases with temperature. A subsequent decrease in temperature promotes the formation of the β-Mn phase. The β-Mn phase has an A13-type crystalline structure [1]. The Thermo-Cal calculation indicates that this phase is composed not only of Mn but also Fe and Al. The κ phase is additionally formed at about 635 °C, and its volume fraction of 0.03 remains almost constant below 557 °C. The volume fractions of the B2 and β-Mn phases reach a maximum volume fraction at about 440 and 549 °C, respectively. This plot also indicates that the α phase appears at temperatures lower than 440 °C, and its volume fraction increases rapidly. The above results suggest that the equilibrium phases at low temperatures are the κ, α, B2, and β-Mn phases.
Figure 5a,b present the OM and SEM micrographs, respectively, corresponding to the steel homogenized at 1150 °C for 5 h and subsequently furnace-cooled. These micrographs present about 70% α phase and 30% γ phase. Both figures show that long γ phase plates are dispersed in the α phase. Some micropores, dark points, are observed in these micrographs. Likewise, Figure 6 presents the XRD pattern of the previous specimen. This XRD pattern also indicates that the fraction of the α phase is higher than that of the γ phase because of its higher XRD peak intensity. These phase percentages agree well with the Thermo-Calc-calculated results of the 78.6 vol. % α phase and 21.4 vol. % γ phase. Likewise, the Thermo-Calc-calculated chemical composition and EDX-SEM microanalysis for the α and γ phases are shown in Table 3. An increase in Fe content and a decrease in Mn content can be observed in both phases. The experimental results show a good agreement with the Thermo-Calc-calculated ones.

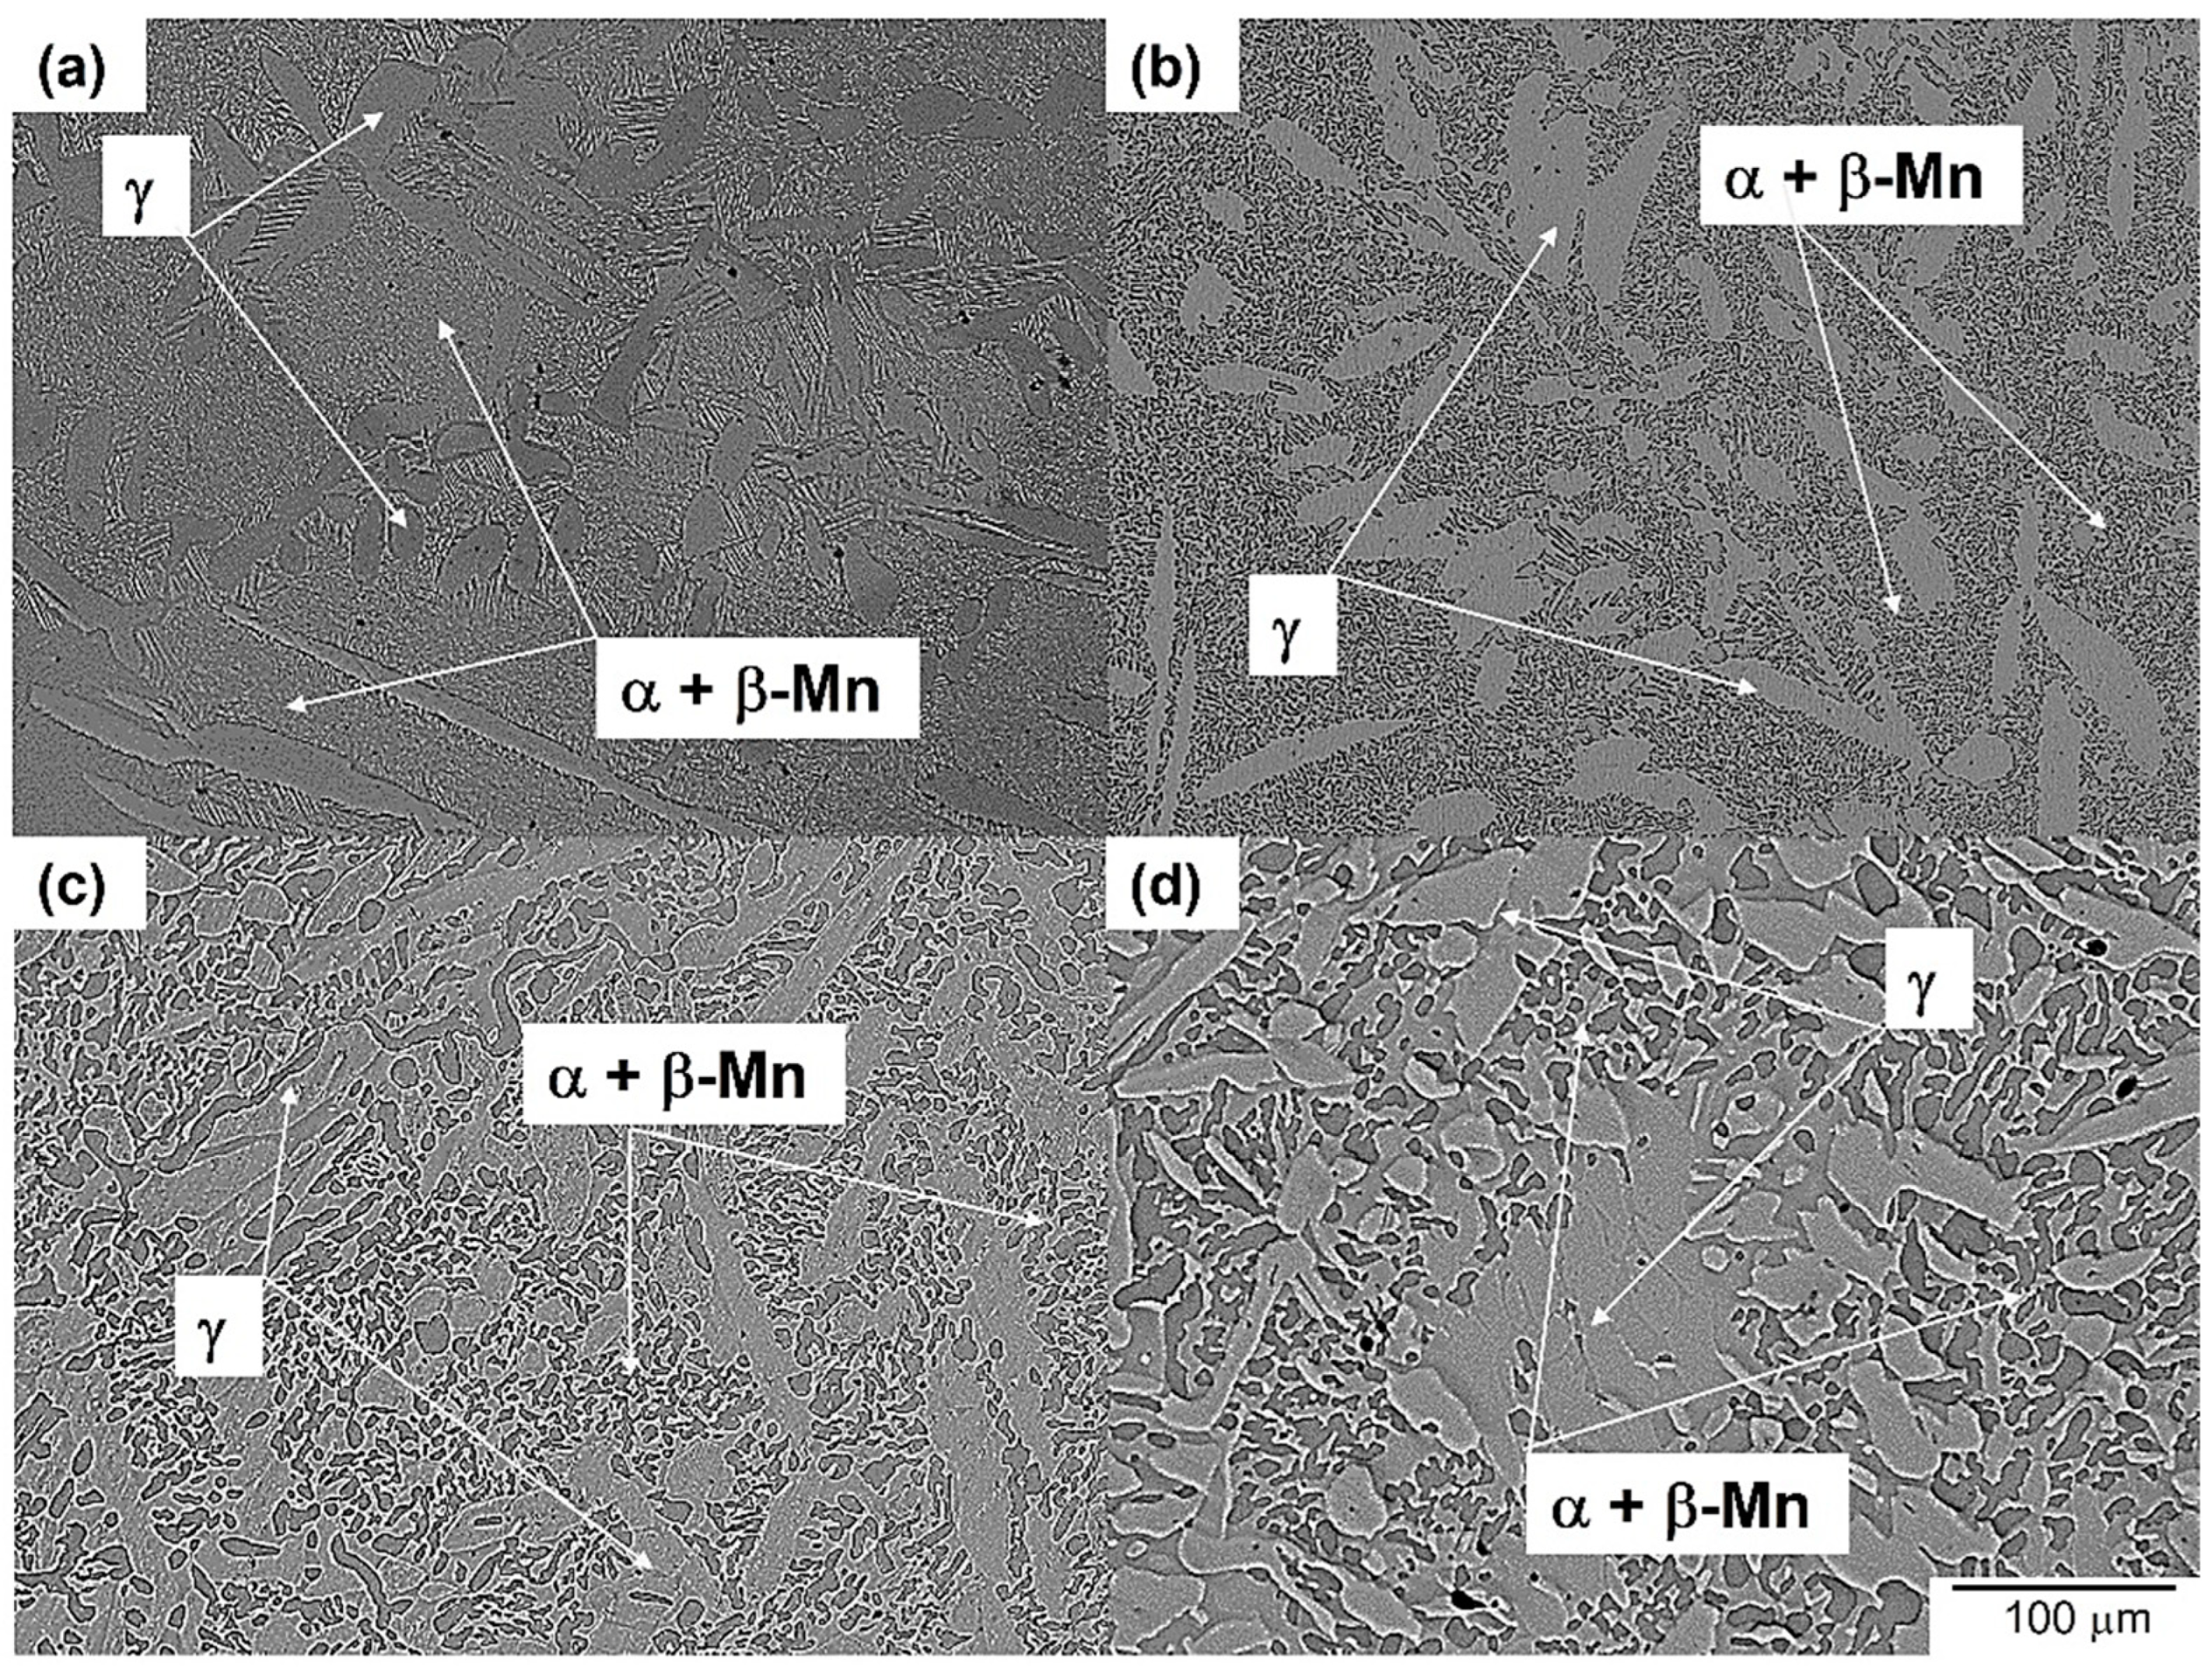
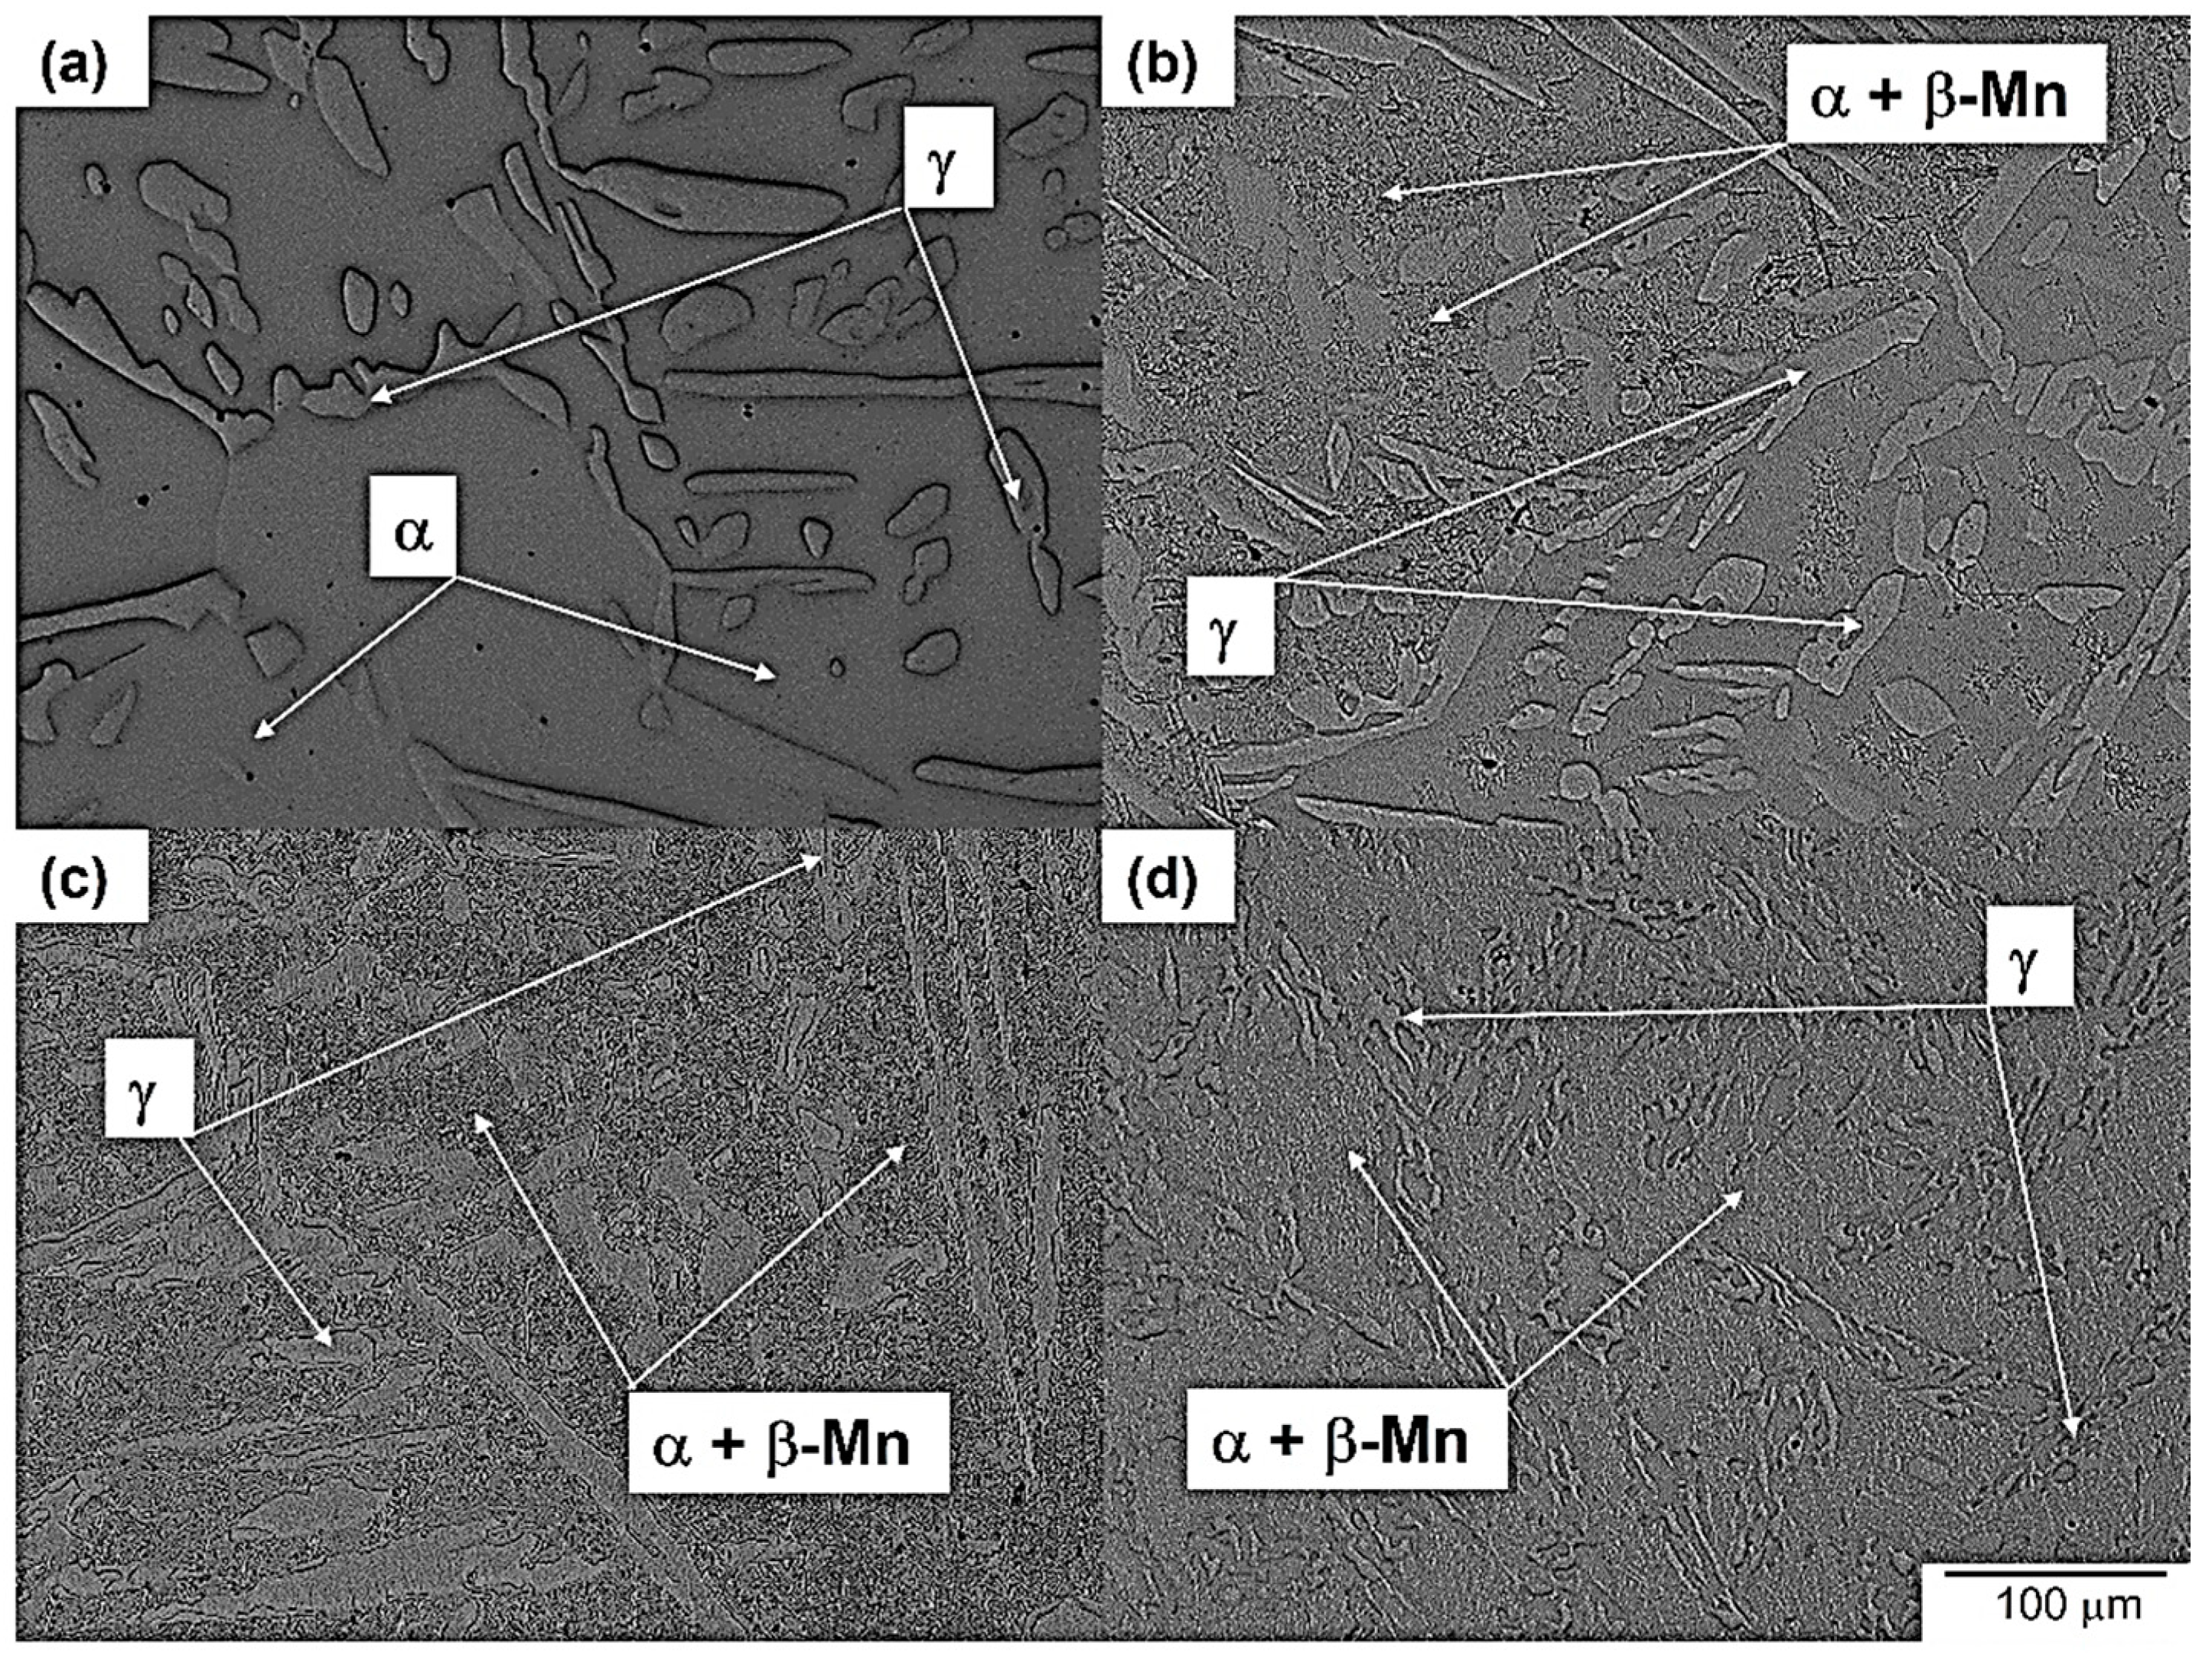
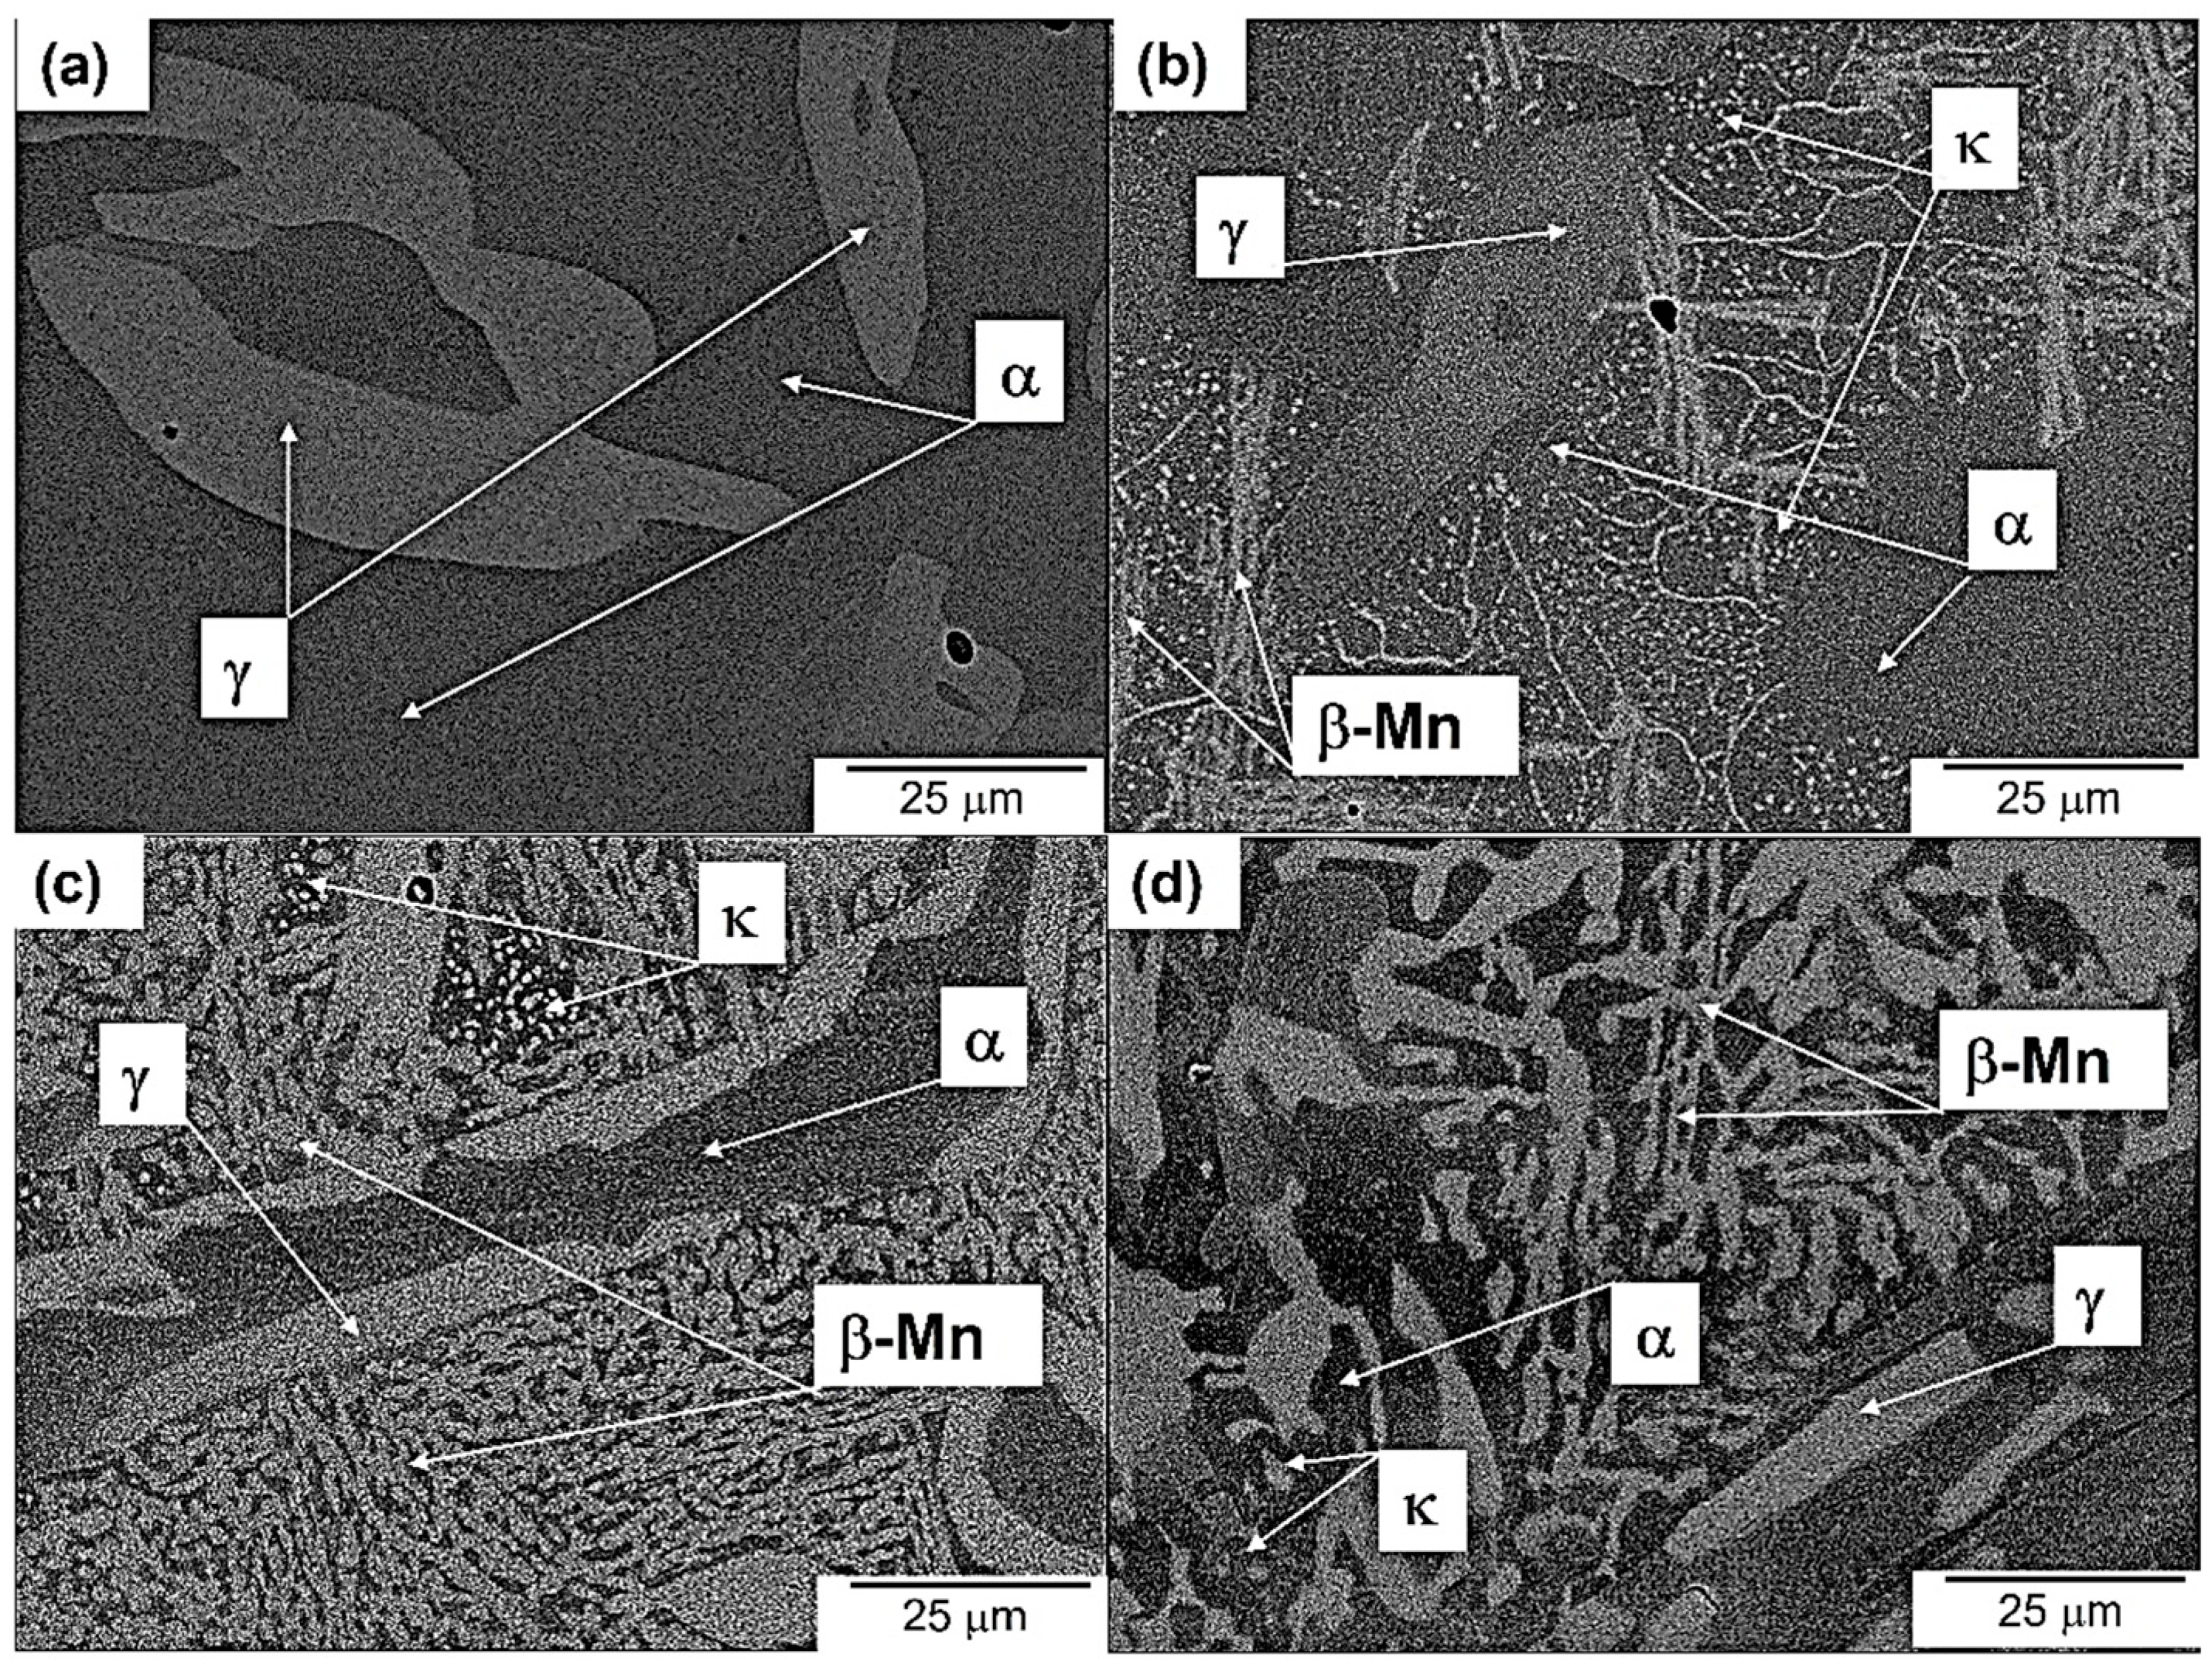
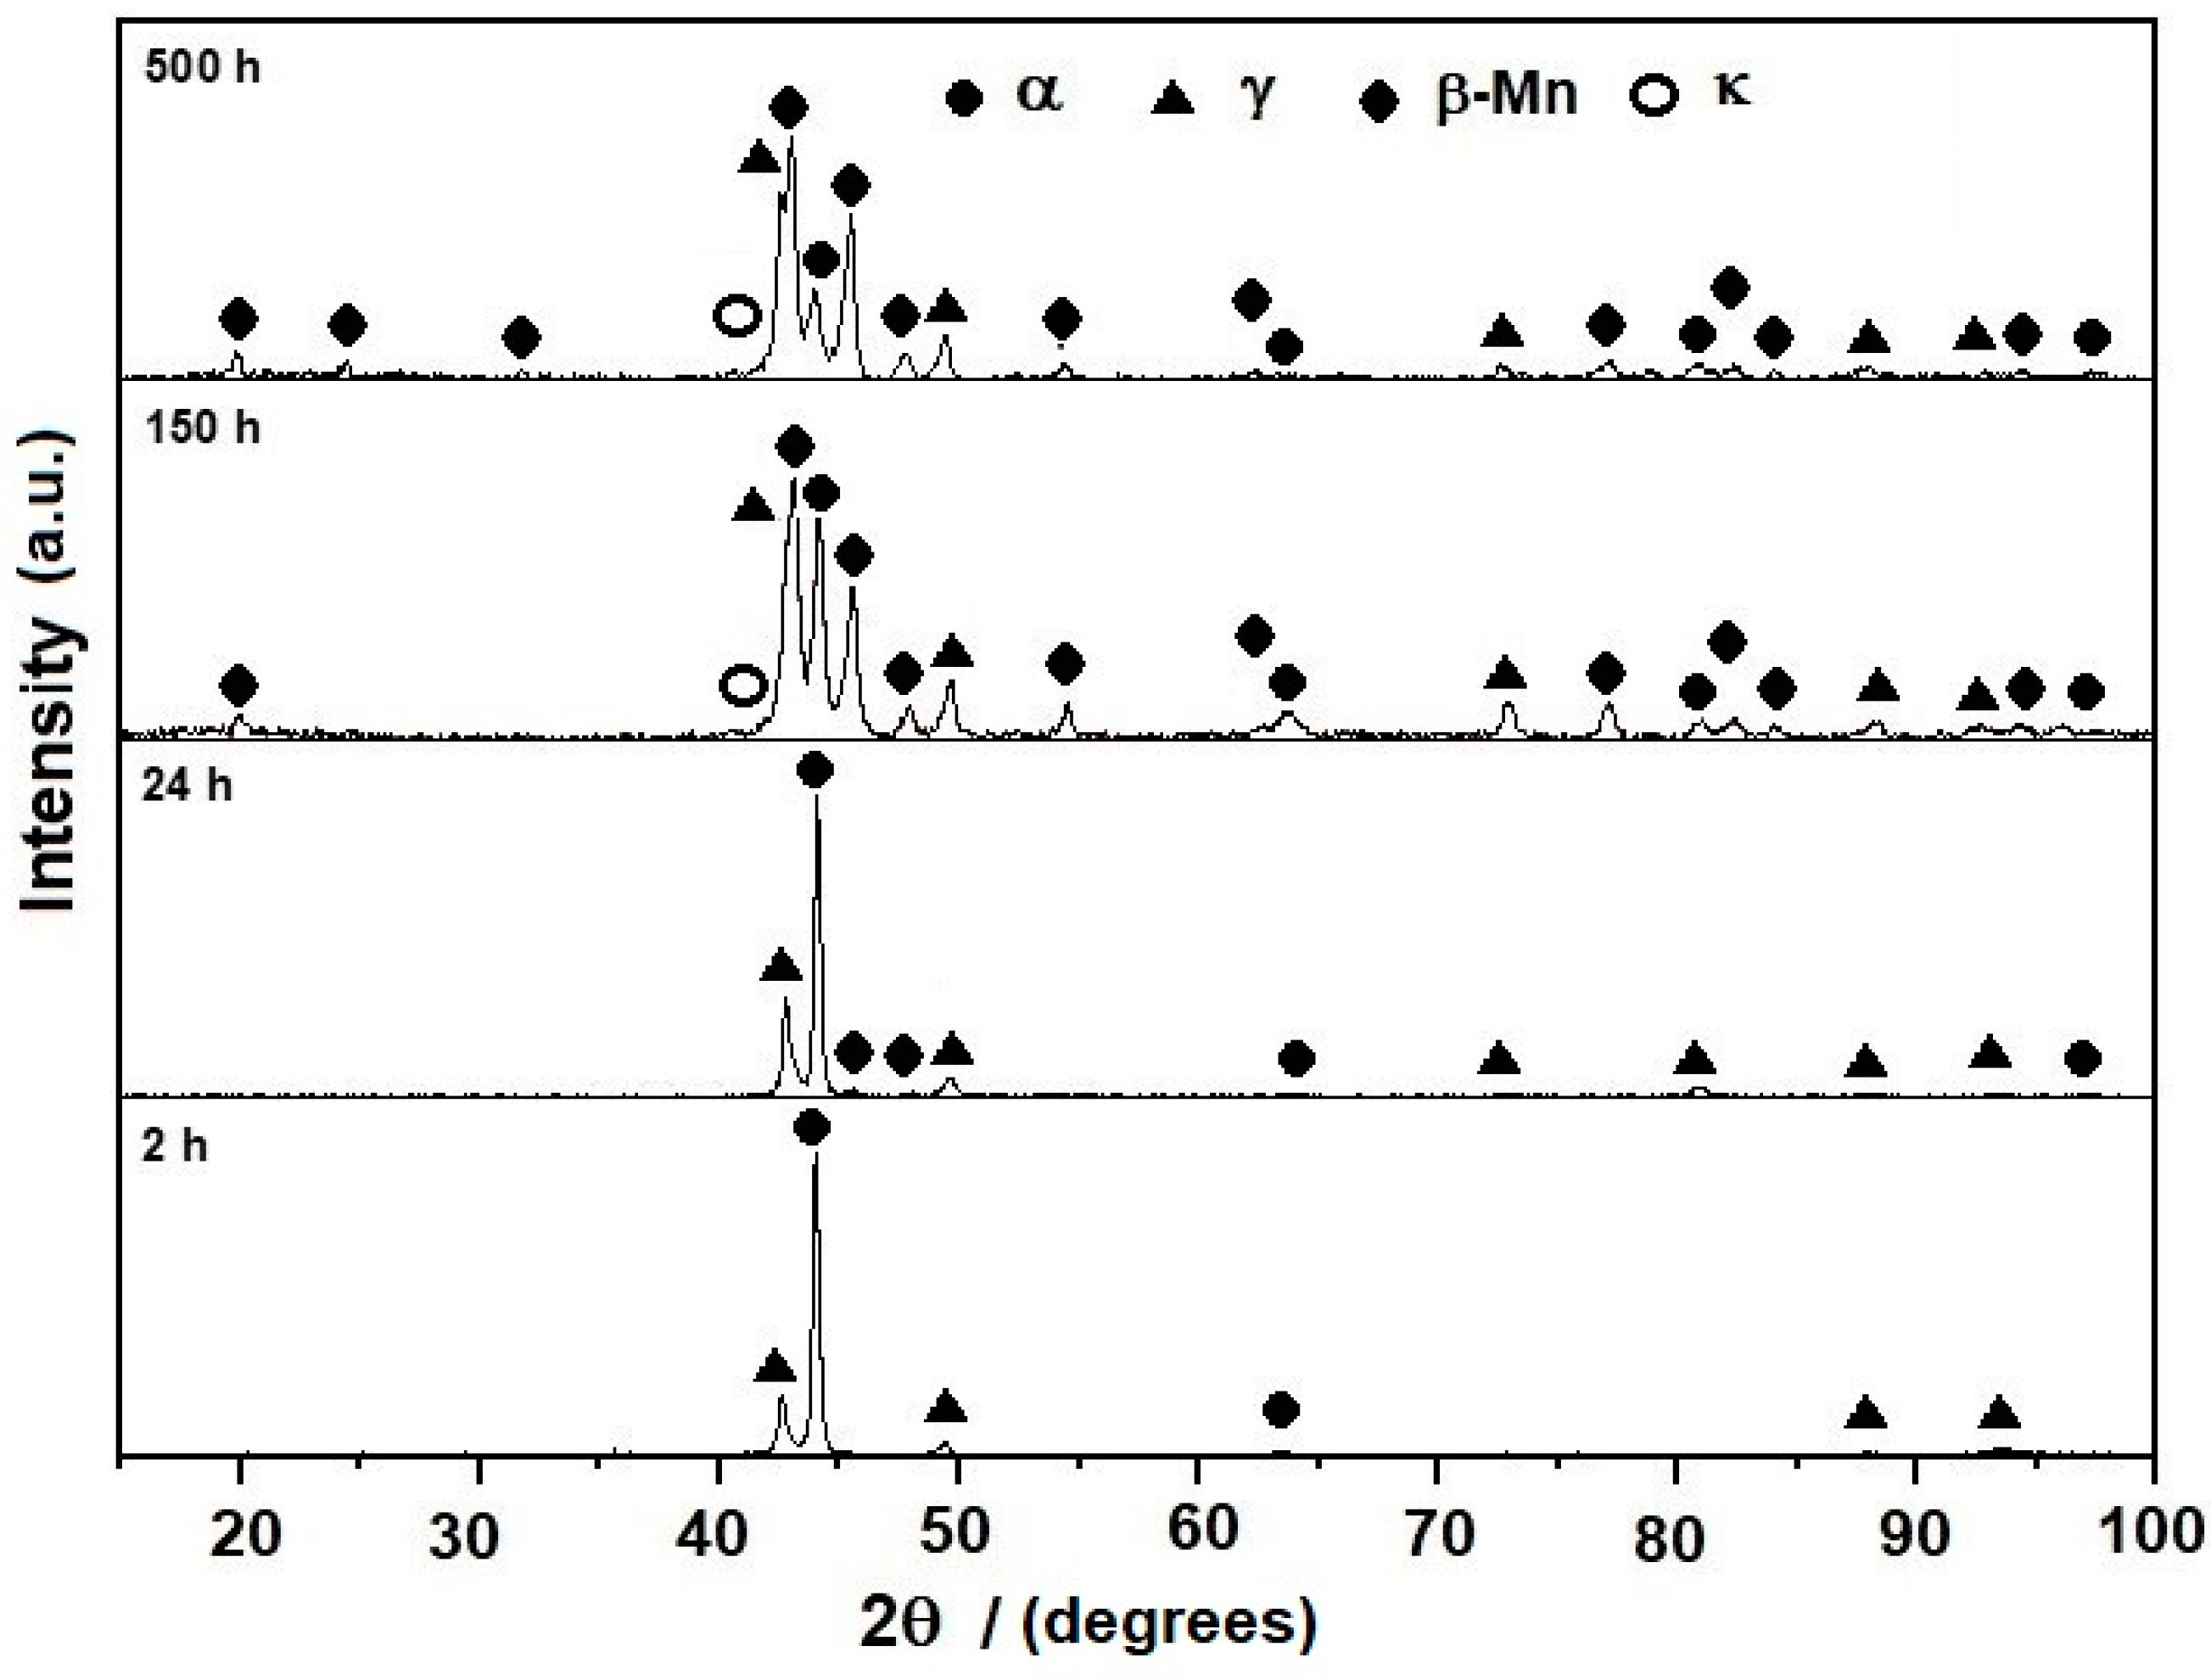
3.3. Microstructure Evolution of Aged Steel

The OM micrograph of the water-quenched steel from a temperature of 1050 °C is shown in Figure 7. The microstructure is very similar to that of Figure 4 and Figure 5; however, the γ phase is finer and more dispersed in the α phase than that of Figure 4.
Figure 8a–d present the OM micrographs for the present steel aged at 750 °C for 2, 24, 150, and 500 h, respectively. These micrographs show that the γ phase dominates as the aging time increases. This phase is also uniformly dispersed in the microstructure. The SEM micrographs corresponding to Figure 8a–d are shown in Figure 9a–d, respectively. The α phase shows an equiaxial phase and black color, the γ phase is elongated and has a dark gray color, and the β-Mn phase is also elongated and has a light gray color. This phase is brittle, and it can be formed by the decomposition of the γ phase into the α and β-Mn phases [1,20]. The α and γ phase volume fractions increase with aging time. An interesting point is the presence of the Widmanstätten structure for the β-Mn phase for short aging times. This microconstituent is usually associated with fast cooling rates, which occurred during the quenching of this specimen [21]. These observations are corroborated in the X-ray diffraction pattern for this aging condition, as shown in Figure 10. The XRD intensity of the γ phase clearly increased with aging time. This fact suggests an increase in its volume fraction. In contrast, the β-Mn phase drastically decreased with aging time.
Figure 11a–d show the OM micrographs for the present alloy aged at 550 °C for 2, 24, 150, and 500 h, respectively. These figures indicate that the volume fraction of the γ phase decreased with aging time. Figure 11c,d clearly show the presence of fine particles dispersed in the α phase. The SEM micrographs corresponding to Figure 11a–d are present in Figure 12a–d, respectively. These micrographs permit the identification of the microconstituents. That is, the microconstituents are the α and γ phases for short aging times, as shown in Figure 11a. As the aging progresses, β-Mn plates become present in the microstructure, as shown in Figure 11b,c. Additionally, small precipitates are evident in the α phase. These fine intragranular precipitates correspond to the κ phase. These SEM micrographs also indicate the coarsening process of the κ phase.
The XRD patterns corresponding to the alloy aged at 550 °C for different times are shown in Figure 13. These patterns indicate the presence of the α and γ phases for short aging times. The β-Mn phase appears after an aging time of 24 h, and its diffraction intensities increase with aging time, which suggests that its volume fraction also increases. The κ phase is more evident after an aging time of 150 h. The above-reported phases agree well with the Thermo-Calc-calculated plot of Figure 4. This plot suggests the presence of the κ phase for aging treatments at temperatures lower than 635 °C. Different works [1,4,22] pointed out that the phase decomposition of the γ phase by spinodal decomposition promoted the formation of the κ and α phases. These authors also reported that the first stages of decomposition may occur during the quenching process. The κ precipitates present a cube-shaped morphology for short aging at temperatures lower than 650 °C, and it changes to a plate-like morphology for prolonged aging [4]. The κ precipitation was simulated in the γ phase using TC-PRISMA (Stockholm, Sweden).
The Time–Temperature–Precipitation (TTP) diagram for the intragranular κ phase precipitation is present in Figure 14. The precipitation of the κ phase shows three stages: nucleation, growth, and coarsening. The interfacial free energy between the precipitate and matrix was determined to be about 0.083 Jm−2, corresponding to a coherent interface. The Thermo-Calc-calculated chemical composition of the κ phase is close to (FeMn)3AlC, which agrees with the expected composition reported in the literature [1]. Figure 14 also shows that the growth kinetics for the intragranular κ precipitation is fastest at a temperature of 540 °C, according to the nose of the “C” curve. In addition, the precipitate size starts at 2 nm, increasing up to 20 nm after aging at 550 °C for 200 h. The precipitation is in the coarsening stage after 50 h of aging.

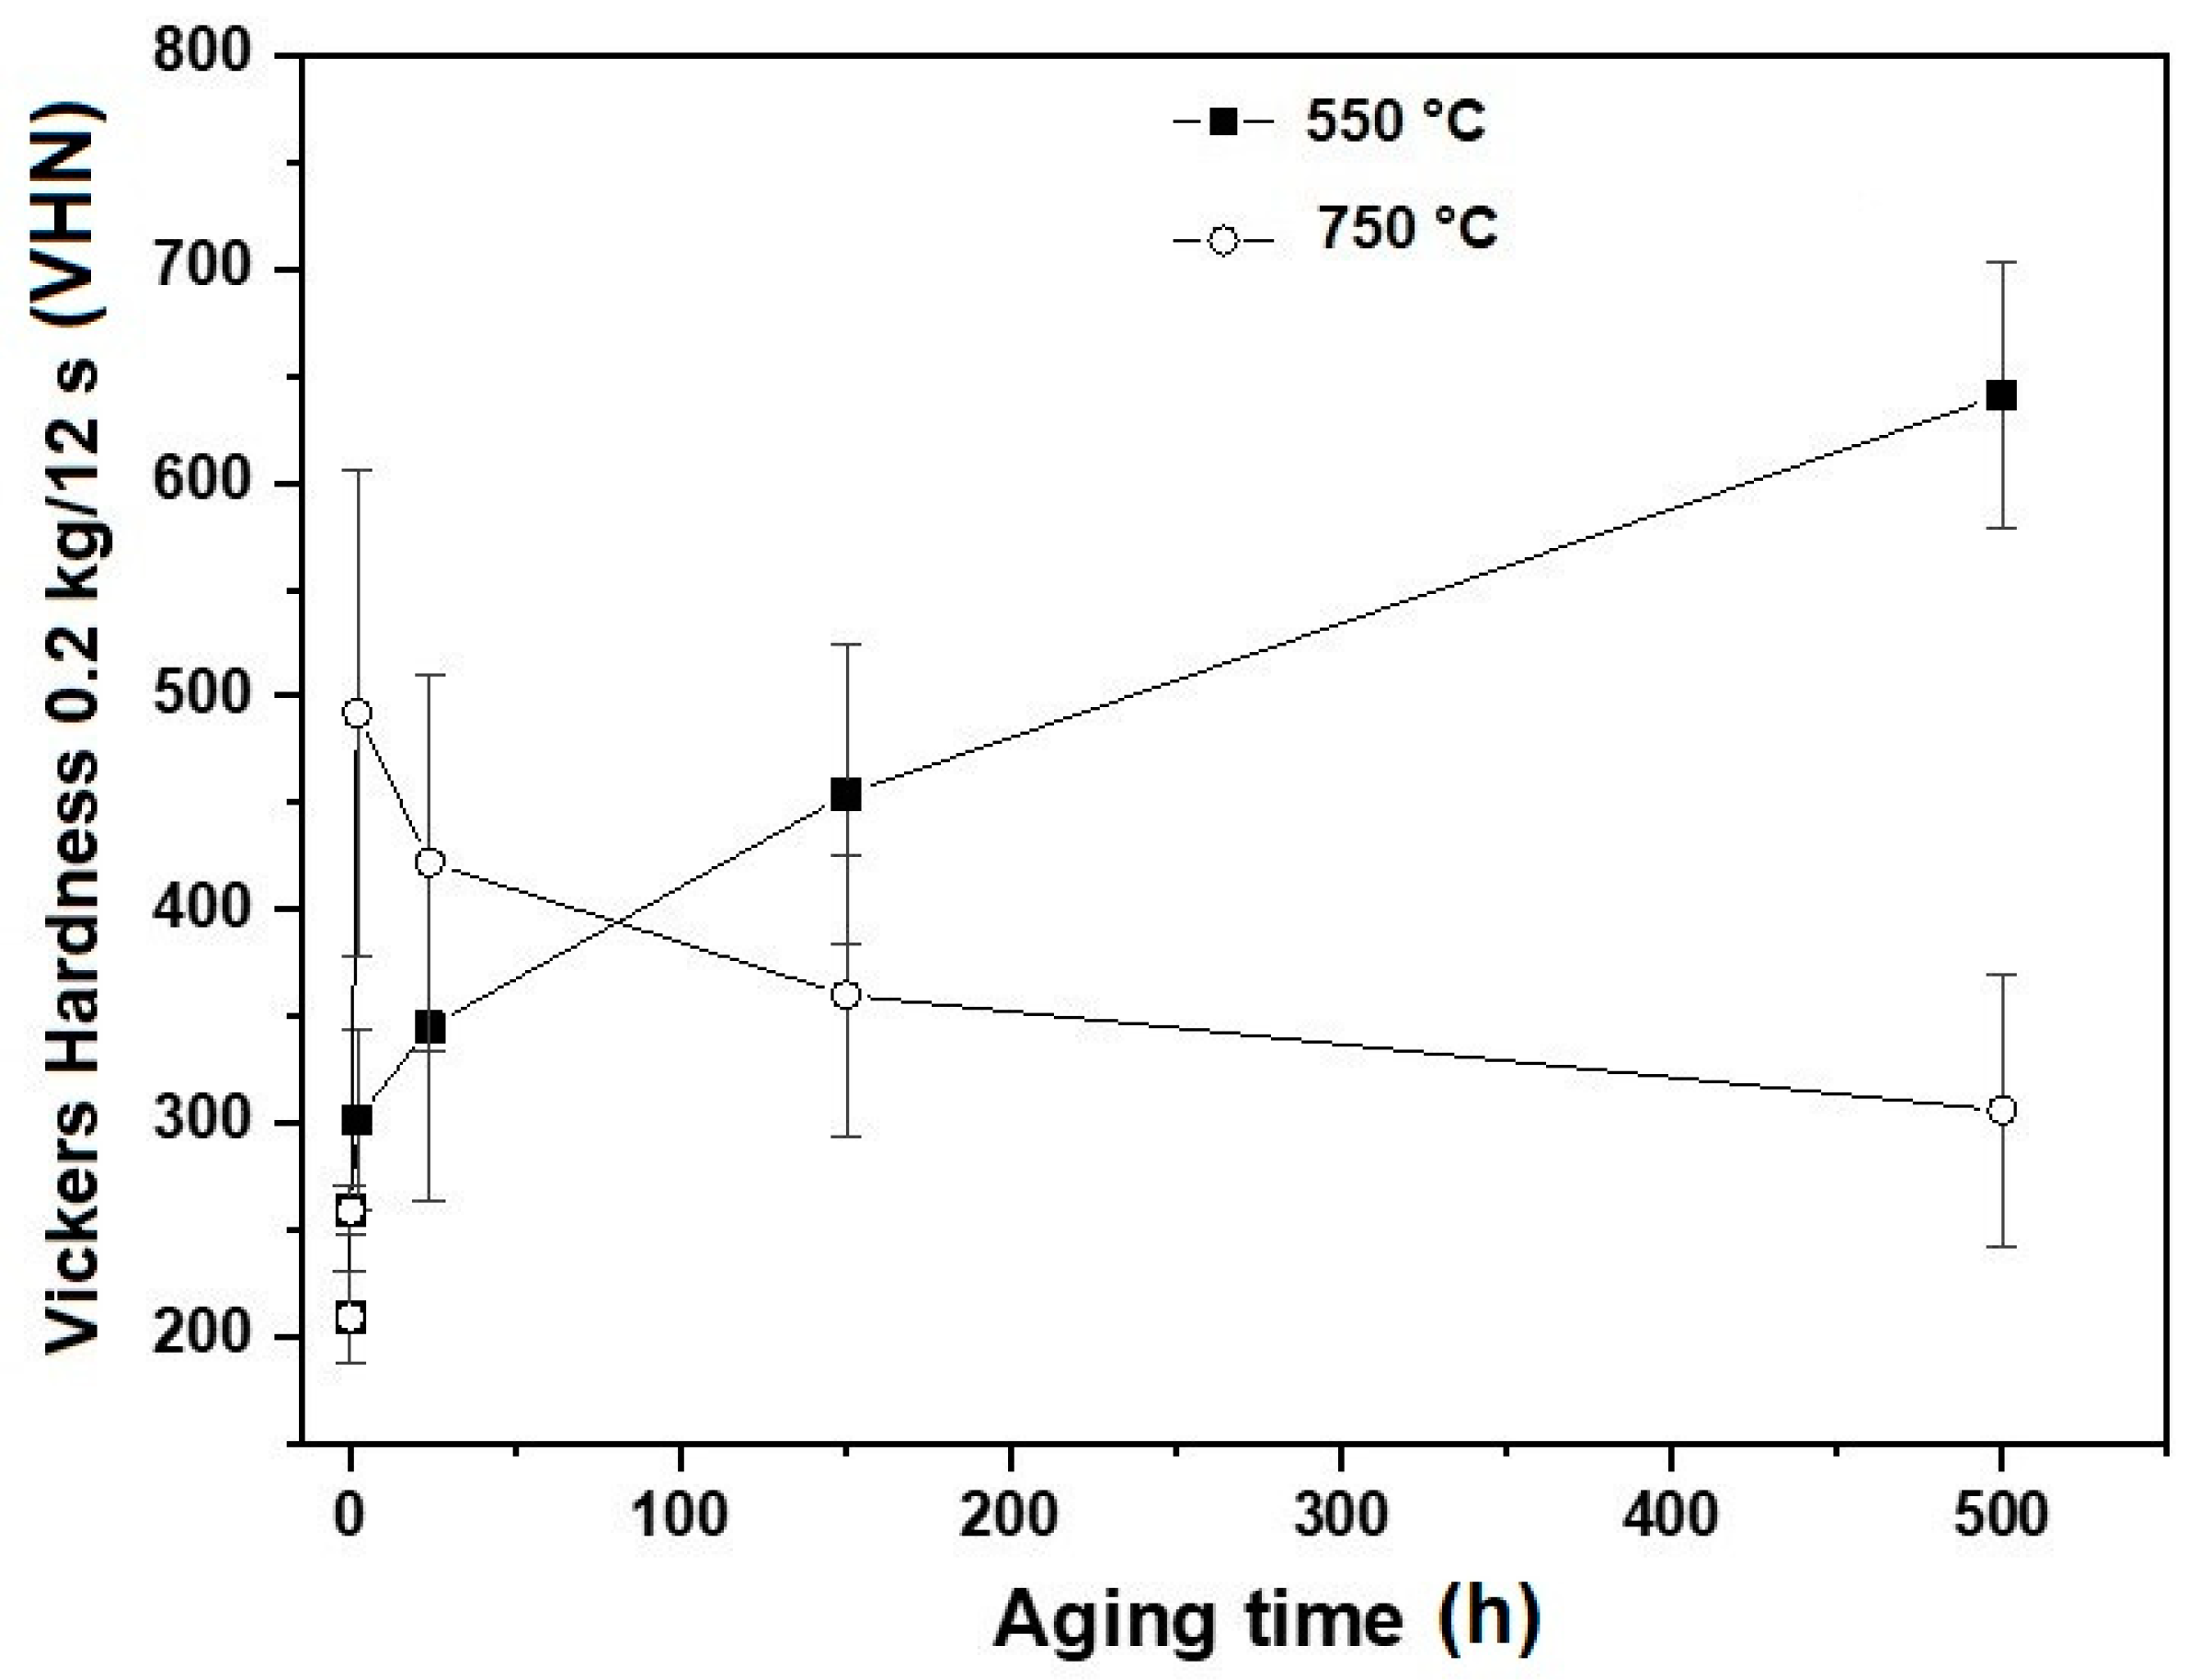
3.4. Relationship beween Mechanical Properties and Microstructure

The Vickers hardness value for the as-cast steel was about 209 ± 10 VHN, while that corresponding to the homogenized steel was approximately 218 ± 10 VHN. In the aged steel case, the initial hardness for the as-quenched steel was about 259 ± 10 VHN. The increase in hardness for the as-quenched steel, in comparison with the other two conditions, seems to be related to the finer size and higher dispersion of the γ phase in the α phase.
The aging curves plotting Vickers hardness against time at 550 and 750 °C are shown in Figure 15. In the case of the 750 °C aging, there is a sudden increase for short aging times. This fact seems to be caused by the formation of the β-Mn phase, which has been reported to be hard and brittle [21]. A decrease in hardness with a longer aging time can be attributable to the increase in the volume fraction of the γ phase and the reduction in the β-Mn phase. On the other hand, the increase in hardness for aging at 550 °C results from the aging hardening corresponding to the κ phase. The precipitation of the κ phase can occur in both ways intragranular and intergranular. The former is associated with age hardening and the latter with a loss of ductility [1,2,3,4].
In general, the mechanical behavior of the studied steel is hard but brittle. This behavior is associated with the presence of β-Mn, which has been reported to cause a brittle behavior [1,2,3,4,5].

4. Conclusions

A phase transformation study was carried out during the heat treatment of as-cast Fe-30Mn-9Al-0.3Si-0.15C steel, and the conclusions are as follows:
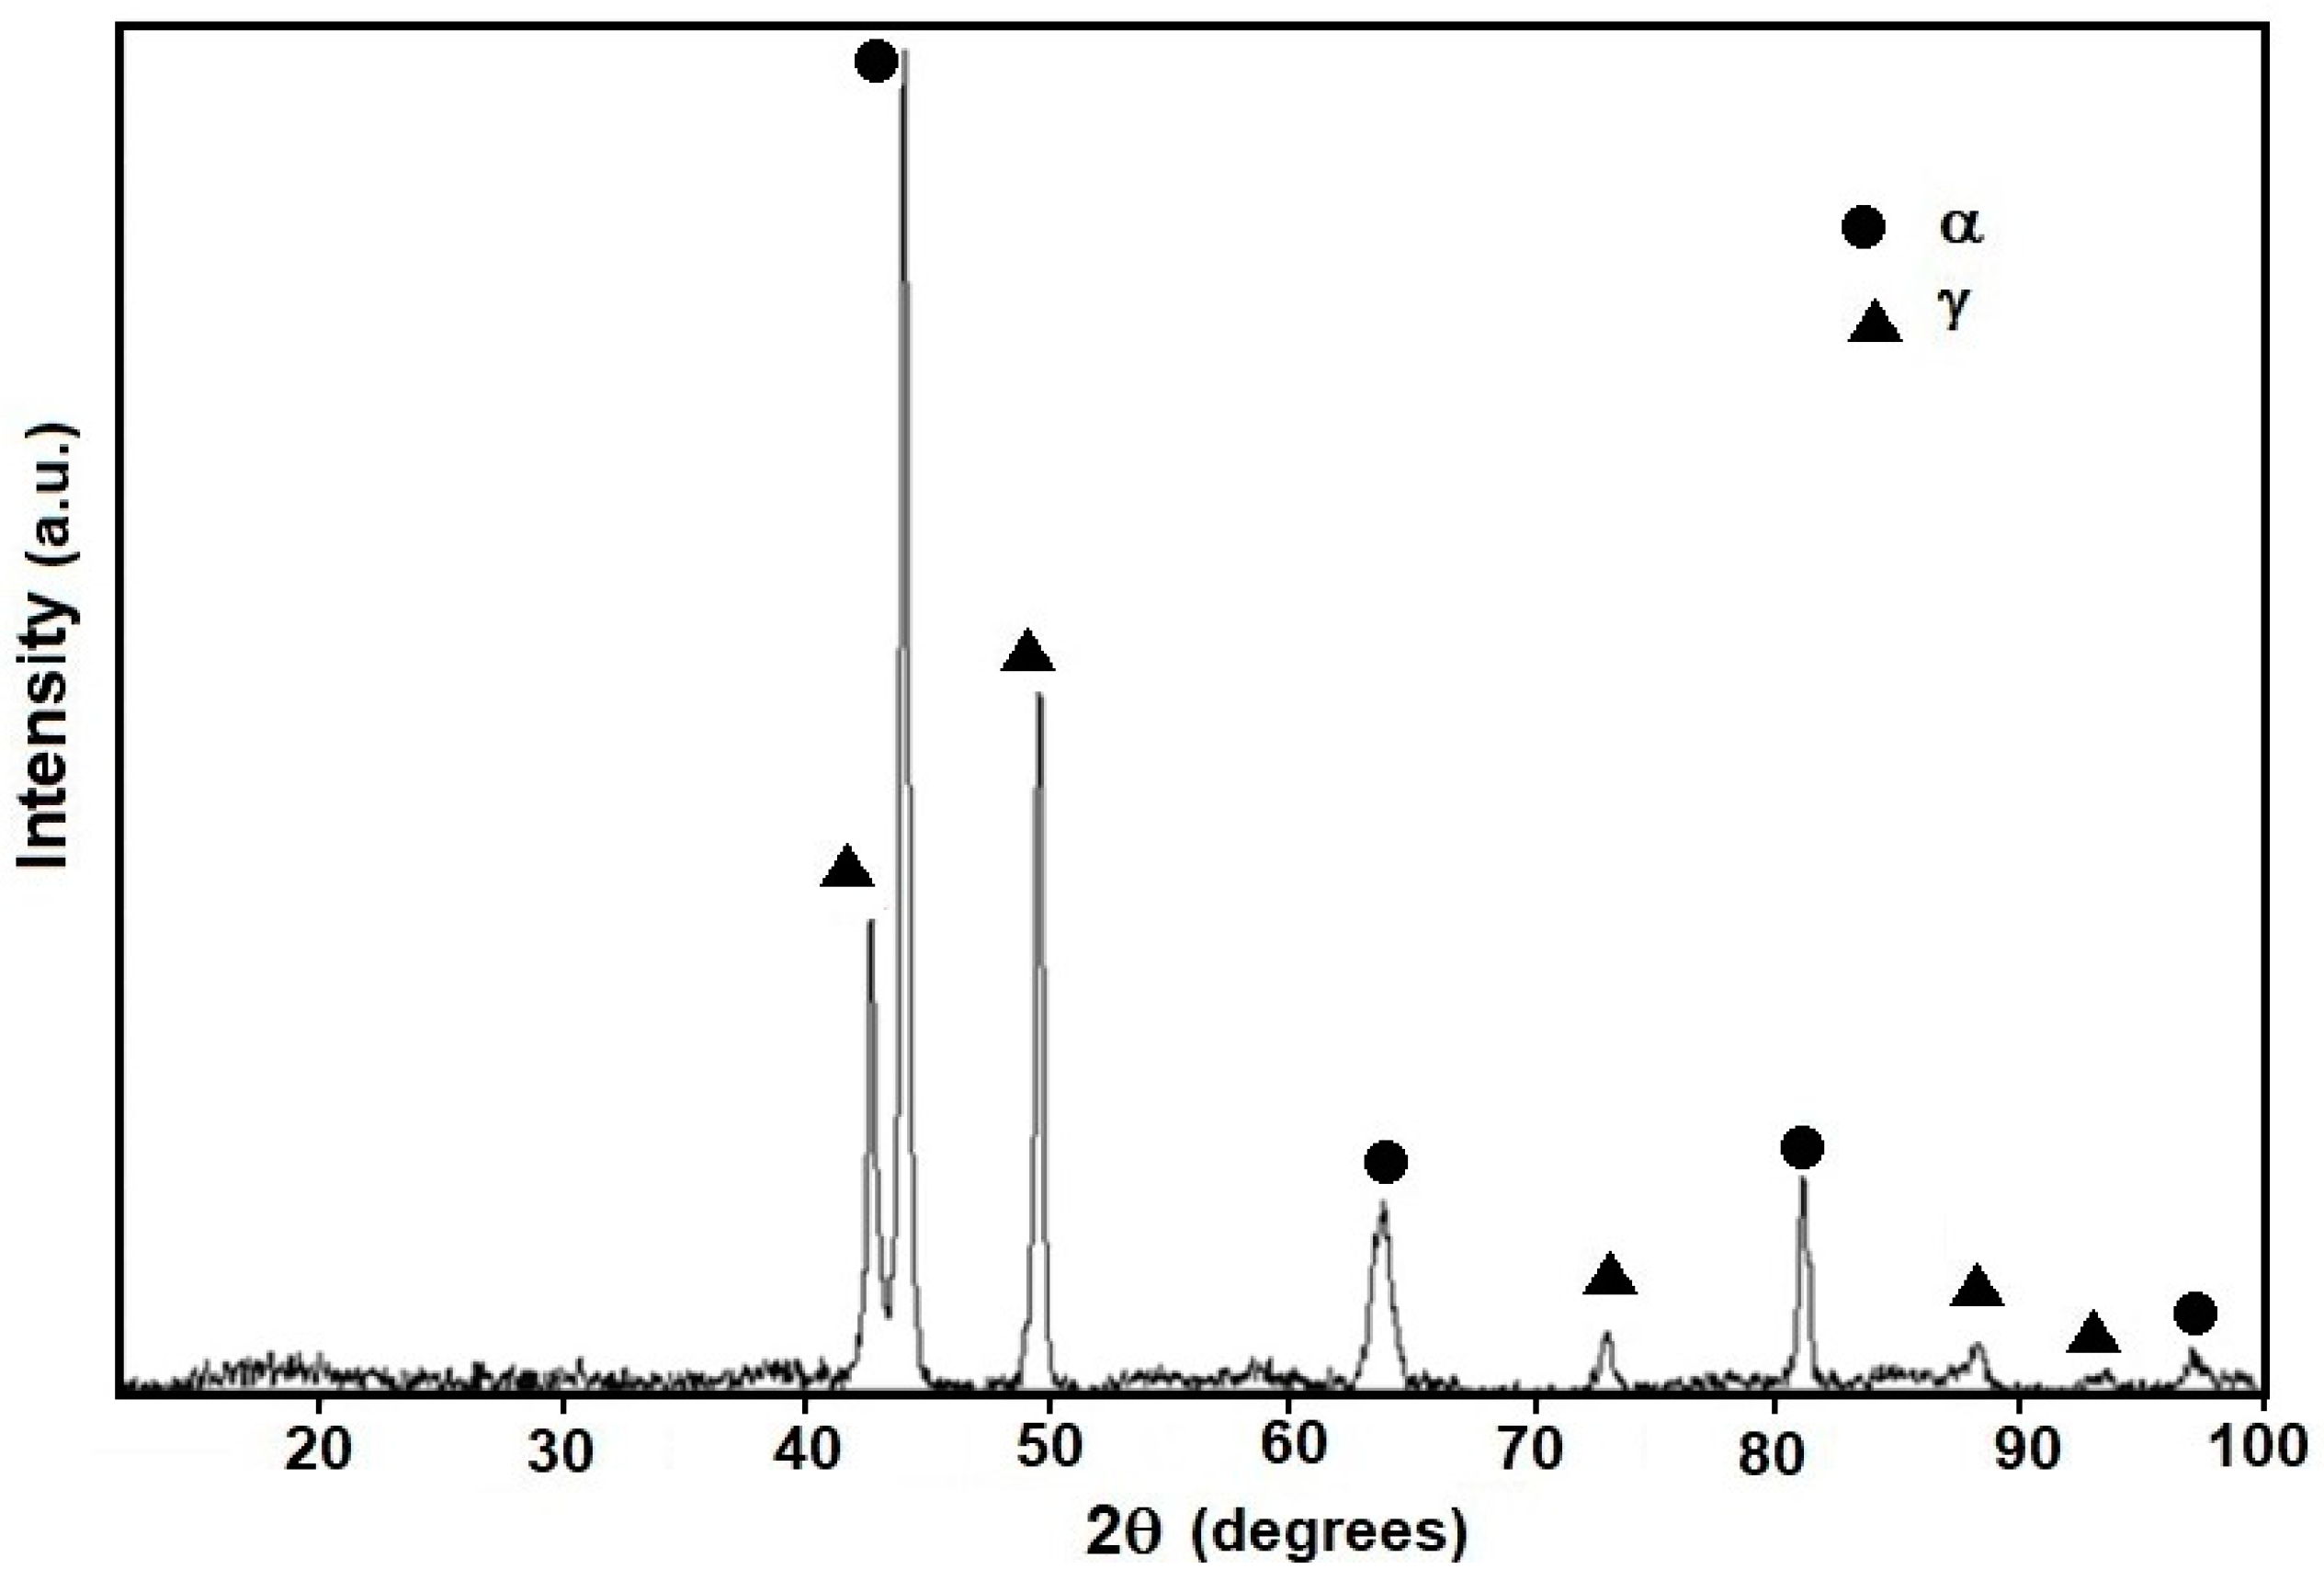
  • The microconstituents for the as-cast, homogenizing, and quenching conditions are the α and γ phases. The volume fractions of these phases and their compositions are in good agreement with those predicted by Thermo-Calc. The Vickers hardness increased from 209 VHN in the as-cast condition to 259 VHN in the as-quenched state due to a finer dispersion of the γ phases.
  • The aging treatment at 750 °C promoted a decrease in hardness, mainly attributed to an increase in the ductile γ phase, which is softer and tougher than the α phase.
  • The aging treatment at 550 °C caused the steel to age-harden because of the formation of fine intragranular κ precipitates, leading to an increase in hardness of up to about 630 VHN.
  • TC-PRISMA simulation enabled us to follow the intragranular precipitation growth kinetics of the κ phase based on nucleation, growth, and coarsening mechanisms.

Author Contributions

Conceptualization, V.M.L.-H. and E.P.-B.; methodology, E.P.-B. and M.L.S.-M.; software, V.M.L.-H. and E.P.-B.; validation, F.H.-S. and V.M.L.-H.; formal analysis, E.P.-B. and F.H.-S., V.M.L.-H. and J.D.V.-C.; investigation, E.P.-B. and M.L.S.-M.; writing—original draft preparation, V.M.L.-H., M.L.S.-M. and E.P.-B.; writing—review and editing, J.D.V.-C. All authors have read and agreed to the published version of the manuscript.

Funding

This research received no external funding.

Data Availability Statement

The raw data supporting the conclusions of this article will be made available by the authors on request.

Acknowledgments

The authors acknowledge the financial support from PIN-SIP-Beifi.

Conflicts of Interest

The authors declare no conflicts of interest.

References

  1. Zambrano, O.A. A General perspective of Fe-Mn-Al-C steels. J. Mater. Sci. 2018, 53, 14003–140062. [Google Scholar] [CrossRef]
  2. Ding, H.; Liu, D.; Cai, M.; Zhang, Y. Austenite-based Fe-Mn-Al-C lightweight steels: Research and Prospective. Metals 2022, 12, 1572. [Google Scholar] [CrossRef]
  3. Chen, S.; Rana, R.; Haldar, A.; Ray, R.K. Current state of Fe-Mn-Al-C low density steels. Prog. Mater. Sci. 2017, 89, 345–391. [Google Scholar] [CrossRef]
  4. Frommeyer, G.; Brux, U. Microstructures and mechanical properties of high-strength Fe-Mn-Al-C light-weight TRIPLEX steels. Steel Res. Int. 2006, 77, 627–633. [Google Scholar] [CrossRef]
  5. Bai, S.; Chen, Y.; Liu, X.; Lu, H.; Bai, P.-K.; Li, D.-Z.; Huang, Z.-Q.; Li, J.-Y. Research status and development prospect of Fe-Mn-C-Al system low-density steels. J. Mater. Sci. Technol. 2023, 25, 1537–1559. [Google Scholar] [CrossRef]
  6. Ren, P.; Chen, X.P.; Yang, M.J.; Liu, S.M.; Cao, W.Q. Effect of early stage of κ-carbides precipitation on tensile properties and deformation mechanism in high Mn–Al–C austenitic low-density steel. Mater. Sci. Eng. A 2022, 857, 144132. [Google Scholar] [CrossRef]
  7. An, Y.F.; Chen, X.P.; Mei, L.; Ren, P.; Wei, D.; Cao, W.Q. Precipitation transformation pathway and mechanical behavior of nanoprecipitation strengthened Fe–Mn–Al–C–Ni austenitic low-density steel. J. Mater. Sci. Technol. 2024, 174, 157–167. [Google Scholar] [CrossRef]
  8. Baniz, A.; Gomez, A.; Dutta, A.; Savirov, I.; Petrov, R.H. The Effect of nano-sized κ-carbides on the mechanical properties of an Fe-Mn-Al-C alloy. Mater. Charact. 2023, 205, 113364. [Google Scholar] [CrossRef]
  9. Gutierrez-Urrutia, I. Low density Fe–Mn–Al–C steels: Phase structures, mechanisms, and properties. ISIJ Int. 2021, 61, 16–25. [Google Scholar] [CrossRef]
  10. Cheng, P.; Li, X.; Yi, H. The κ-carbides in low-density Fe-Mn-Al-C steels: A review on their structure, precipitation and deformation mechanism. Metals 2020, 10, 1021. [Google Scholar] [CrossRef]
  11. Palm, M.; Inden, G. Experimental determination of phase equilibria in the Fe-Al-C system. Intermetall 1995, 3, 443–454. [Google Scholar] [CrossRef]
  12. Chin, K.-G.; Lee, H.-J.; Kwak, J.-H.; Kang, Y.-H.; Lee, B.-Y. Thermodynamic calculation on the stability of (Fe,Mn)3AlC carbide in high aluminum steels. J. Alloys Compd. 2010, 55, 217–223. [Google Scholar] [CrossRef]
  13. Man, T.; Wang, W.; Zhou, Y.; Liu, T.; Lu, H.; Zhao, X.; Zhang, M.; Dong, H. Effect of cooling rate on the precipitation behavior of κ-carbide in Fe-32Mn-11Al-0.9C low density steel. Mater. Lett. 2002, 314, 131778. [Google Scholar] [CrossRef]
  14. Wang, H.; Wang, C.; Liang, J.; Godfrey, A.; Wang, Y. Effect of alloying content on microstructure and mechanical properties of Fe-Mn-Al-C low density steels. Mater. Si Eng. 2023, 876, 145675. [Google Scholar] [CrossRef]
  15. Lv, X.; Wang, X.; Lang, A.; Qiao, J. Synergistic effect of Al and Ni on microstructure evolutions and mechanical properties of Fe-Mn-Al-C low density steels. Metals 2024, 14, 495. [Google Scholar] [CrossRef]
  16. Shi, P.; Engstrom, A.; Hoglund, l.; Sundman, B.; Agren, J. Thermo-calc and DICTRA Enhance Materials Design and Processing. Mater. Sci. For. 2005, 475–479, 3339–3347. [Google Scholar]
  17. Thermo-Calc, Thermo-Calc Versión 2023b. Available online: https://thermocalc.com/products/thermo-calc/ (accessed on 20 June 2024).
  18. PRISMA, Thermo-Calc versión 2023b. Available online: https://thermocalc.com/products/add-on-modules/precipitation-module-tc-prisma/ (accessed on 20 June 2024).
  19. Chang, S.C.; Hsiau, Y.H.; Hang, M.T. Tensile and fatigue properties of Fe-Mn-AI-C alloys. J. Mater. Sci. 1989, 24, 1117–1128. [Google Scholar] [CrossRef]
  20. Sato, K.; Tagawa, K.; Inoue, Y. Modulated properties structure and magnetic of age-hardenable Fe-Mn-AI-C alloys. Met. Trans. A 1990, 24, 5–11. [Google Scholar] [CrossRef]
  21. Kostorz, G. Phase Transformations in Materials, 2nd ed.; Wiley-VCH: Weinheim, Germany, 2001; pp. 309–408. [Google Scholar]
  22. Cheng, W.-C. PhasetTransformations of an Fe-0.85C-17.9Mn-7.1Al austenitic steel after quenching and annealing. JOM 2014, 66, 1809–1820. [Google Scholar] [CrossRef]
Figure 1. Thermo-Calc-calculated plot of temperature vs. fraction mol of the steel.
Metals 14 00748 g001
Figure 2. (a) OM micrograph and (b) SEM micrograph of the as-cast steel.
Metals 14 00748 g002
Figure 3. XRD of the as-cast steel.
Metals 14 00748 g003
Figure 4. Thermo-Calc-calculated plot of amount of equilibrium phases versus temperature for the steel.
Metals 14 00748 g004
Figure 5. (a) OM micrograph and (b) SEM micrograph of the 1050 °C-homogenized steel.
Metals 14 00748 g005
Figure 6. XRD of the 1050 °C-homogenized steel.
Metals 14 00748 g006
Figure 7. OM micrograph of the quenched steel.
Metals 14 00748 g007
Figure 8. OM micrograph of the steel aged at 750 °C for (a) 2, (b) 24, (c) 150, and (d) 500 h.
Metals 14 00748 g008
Figure 9. SEM micrograph of the steel aged at 750 °C for (a) 2, (b) 24, (c) 150, and (d) 500 h.
Metals 14 00748 g009
Figure 10. XRD patterns of the steel aged at 750 °C for 2, 24, 150, and 500 h.
Metals 14 00748 g010
Figure 11. OM micrograph of the steel aged at 550 °C for (a) 2, (b) 24, (c) 150, and (d) 500 h.
Metals 14 00748 g011
Figure 12. SEM micrograph of the steel aged at 550 °C for (a) 2, (b) 24, (c) 150, and (d) 500 h.
Metals 14 00748 g012
Figure 13. XRD patterns of the steel aged at 550 °C for 2, 24, 150, and 500 h.
Metals 14 00748 g013
Figure 14. TC-PRISMA-calculated TTP diagram for the κ phase.
Metals 14 00748 g014
Figure 15. Aging curves of the steel at 550 and 750 °C.
Metals 14 00748 g015
Table 1. Chemical composition of the analyzed steel.
ElementFeMnAlSiC
mass %60.6930.318.840.310.15
Table 2. Volume percent of phases and their composition in the as-cast condition.
MethodPhaseVol. % % Al% C% Mn% Fe
Thermo-Calcα89.47.980.1344.9946.88
γ10.66.280.6142.9749.07
Experimentalα80.08.25---32.2958.09
γ20.07.25---35.4457.45
Table 3. Volume percent of phases and their composition in the homogenized condition.
MethodPhaseVol. %% Al% Mn% Fe
Thermo-Calcα78.69.5328.4461.74
γ21.47.3634.2857.50
Experimentalα70.07.3732.2958.09
γ30.09.0629.7356.33
Disclaimer/Publisher’s Note: The statements, opinions and data contained in all publications are solely those of the individual author(s) and contributor(s) and not of MDPI and/or the editor(s). MDPI and/or the editor(s) disclaim responsibility for any injury to people or property resulting from any ideas, methods, instructions or products referred to in the content.

