Article

Study on the Influence of Surface Roughness and Temperature on the Interface Void Closure and Microstructure Evolution of Stainless Steel Diffusion Bonding Joints

1
Department of Materials Science and Engineering, Xi’an University of Technology, Xi’an 710048, China
2
Shaanxi Province Key Laboratory for Electrical Materials and Infiltration Technology, Xi’an 710048, China
3
Engineering Research Center of Conducting Materials and Composite Technology, Ministry of Education, Xi’an 710048, China
*
Author to whom correspondence should be addressed.
Metals 2024, 14(7), 812; https://doi.org/10.3390/met14070812
Submission received: 23 May 2024 / Revised: 27 June 2024 / Accepted: 8 July 2024 / Published: 12 July 2024

Abstract

:
Austenitic stainless steel diffusion bonding was performed, and the effects of the surface roughness and bonding temperature on the interface microstructure and mechanism of hole closure were investigated. The bonded interface microstructure was analyzed. The influence of surface roughness and temperature on cavity evolution, bonding rate, and axial deformation rate was studied. The mechanism of interfacial void closure in the stainless steel diffusion bonding process was revealed. With the increase in temperature and the decrease in surface roughness, the size of the interface void and the bonded area decreased. The bonding rate can reach more than 95% when the surface roughness value is 0.045 μm and the temperature is at or higher than 750 °C. The analytical equations of interfacial bonding rate δ and axial deformation rate ε produced by the deformation mechanism were established, and the laws of the deformation mechanism and diffusion mechanism within interfacial hole closure were obtained.

1. Introduction

Diffusion bonding, as a solid-state joining process, forms a joint between two different surfaces by atom diffusion and micro-deformation and is widely used in the nuclear, aerospace, electronics, and petrochemical industries to bond most engineering metals and alloys [1,2,3,4,5,6]. Stainless steel is an essential engineering structural material with a low corrosion rate and excellent mechanical properties [7,8,9]. Diffusion bonding of stainless steel solves the problems of joint precipitates, deterioration of heat-affected zone performance, and serious deformation of welded joints caused by the metallurgical characteristics of the traditional fusion welding process [10]. It can effectively improve the mechanical properties of joints [11]. The main factors affecting the performance of stainless steel diffusion-bonded joints include bonding temperature, holding time, surface roughness, and bonding pressure [12].
To ensure the reliability of stainless steel diffusion-bonded joints, relevant experiments have been conducted to study the influence of bonding parameters on the bonding interface microstructure and joint properties [13,14,15,16,17,18]. Diffusion bonding of 304 stainless steel foil and Ti6Al4V foil under vacuum conditions showed that the bonding temperature has an important effect on the interface structure and joint performance [13]. The thickness of the intermetallic compound layer increased with the increase in diffusion temperature and the extension of the time for which the stainless steel/carbon steel was diffusion-bonded [14]. The shear strength of the joint increased with the increase in bonding temperature [15]. Gietzelt et al. [16] studied the influence of the bonding temperature and contact pressure on the deformation and mechanical properties of AISI 304. They showed that increasing the short peak superposition of the contact pressure can cause the elongation at fracture to reach a reasonable value related to the macroscopic deformation and promote the roughness of the surface. Li et al. [17] studied the influence of surface roughness on the pore shrinkage process and mechanism of the diffusion bonding interface of Ti-6Al-4V alloy and found that the contribution of the power law creep mechanism to pore shrinkage increased first and then decreased with the increase in roughness. The contribution of plastic deformation and surface source mechanism to pore shrinkage hardly changed with the surface roughness. Meanwhile, the interface source mechanism depends on the external pressure. Ma et al. [18] proposed the dynamic conditions of the plastic deformation mechanism, surface source mechanism, interface source mechanism, and creep mechanism in the process of diffusion joints. The pore closure model in the process of diffusion joints based on these dynamic conditions was derived. At low diffusion temperature and pressure, or in a short time, the interfacial source mechanism dominated the diffusion bonding, and the creep mechanism occurred at a certain stage and continued until the end of diffusion bonding. Therefore, it can be found that the bonding temperature [19] has an important effect on the microstructure and properties of the interface under different surface qualities, and the bonding temperature also determines the atomic diffusion process of recrystallization across the interface as well as the extent of bulk diffusion into the interfacial voids [20,21].
Prior research has extensively explored the impacts of bonding temperature, holding time, and bonding pressure. However, surface roughness, which has a significant effect on the initial interface contact, interface hole evolution, and interface diffusion bonding, has not been involved. This study uniquely emphasizes surface roughness, a factor that significantly affects the initial interface contact and subsequent bonding quality. By providing a detailed analysis of how surface roughness and temperature affect pore evolution, bonding rate, and axial deformation, the research offers valuable insights that can lead to the development of more reliable and efficient bonding processes. The quantitative relationship between the interfacial bonding rate δ and the specimen deformation rate ε was obtained. These research results will provide a theoretical basis and abundant experimental data for producing reliable joints in stainless steel diffusion bonding.

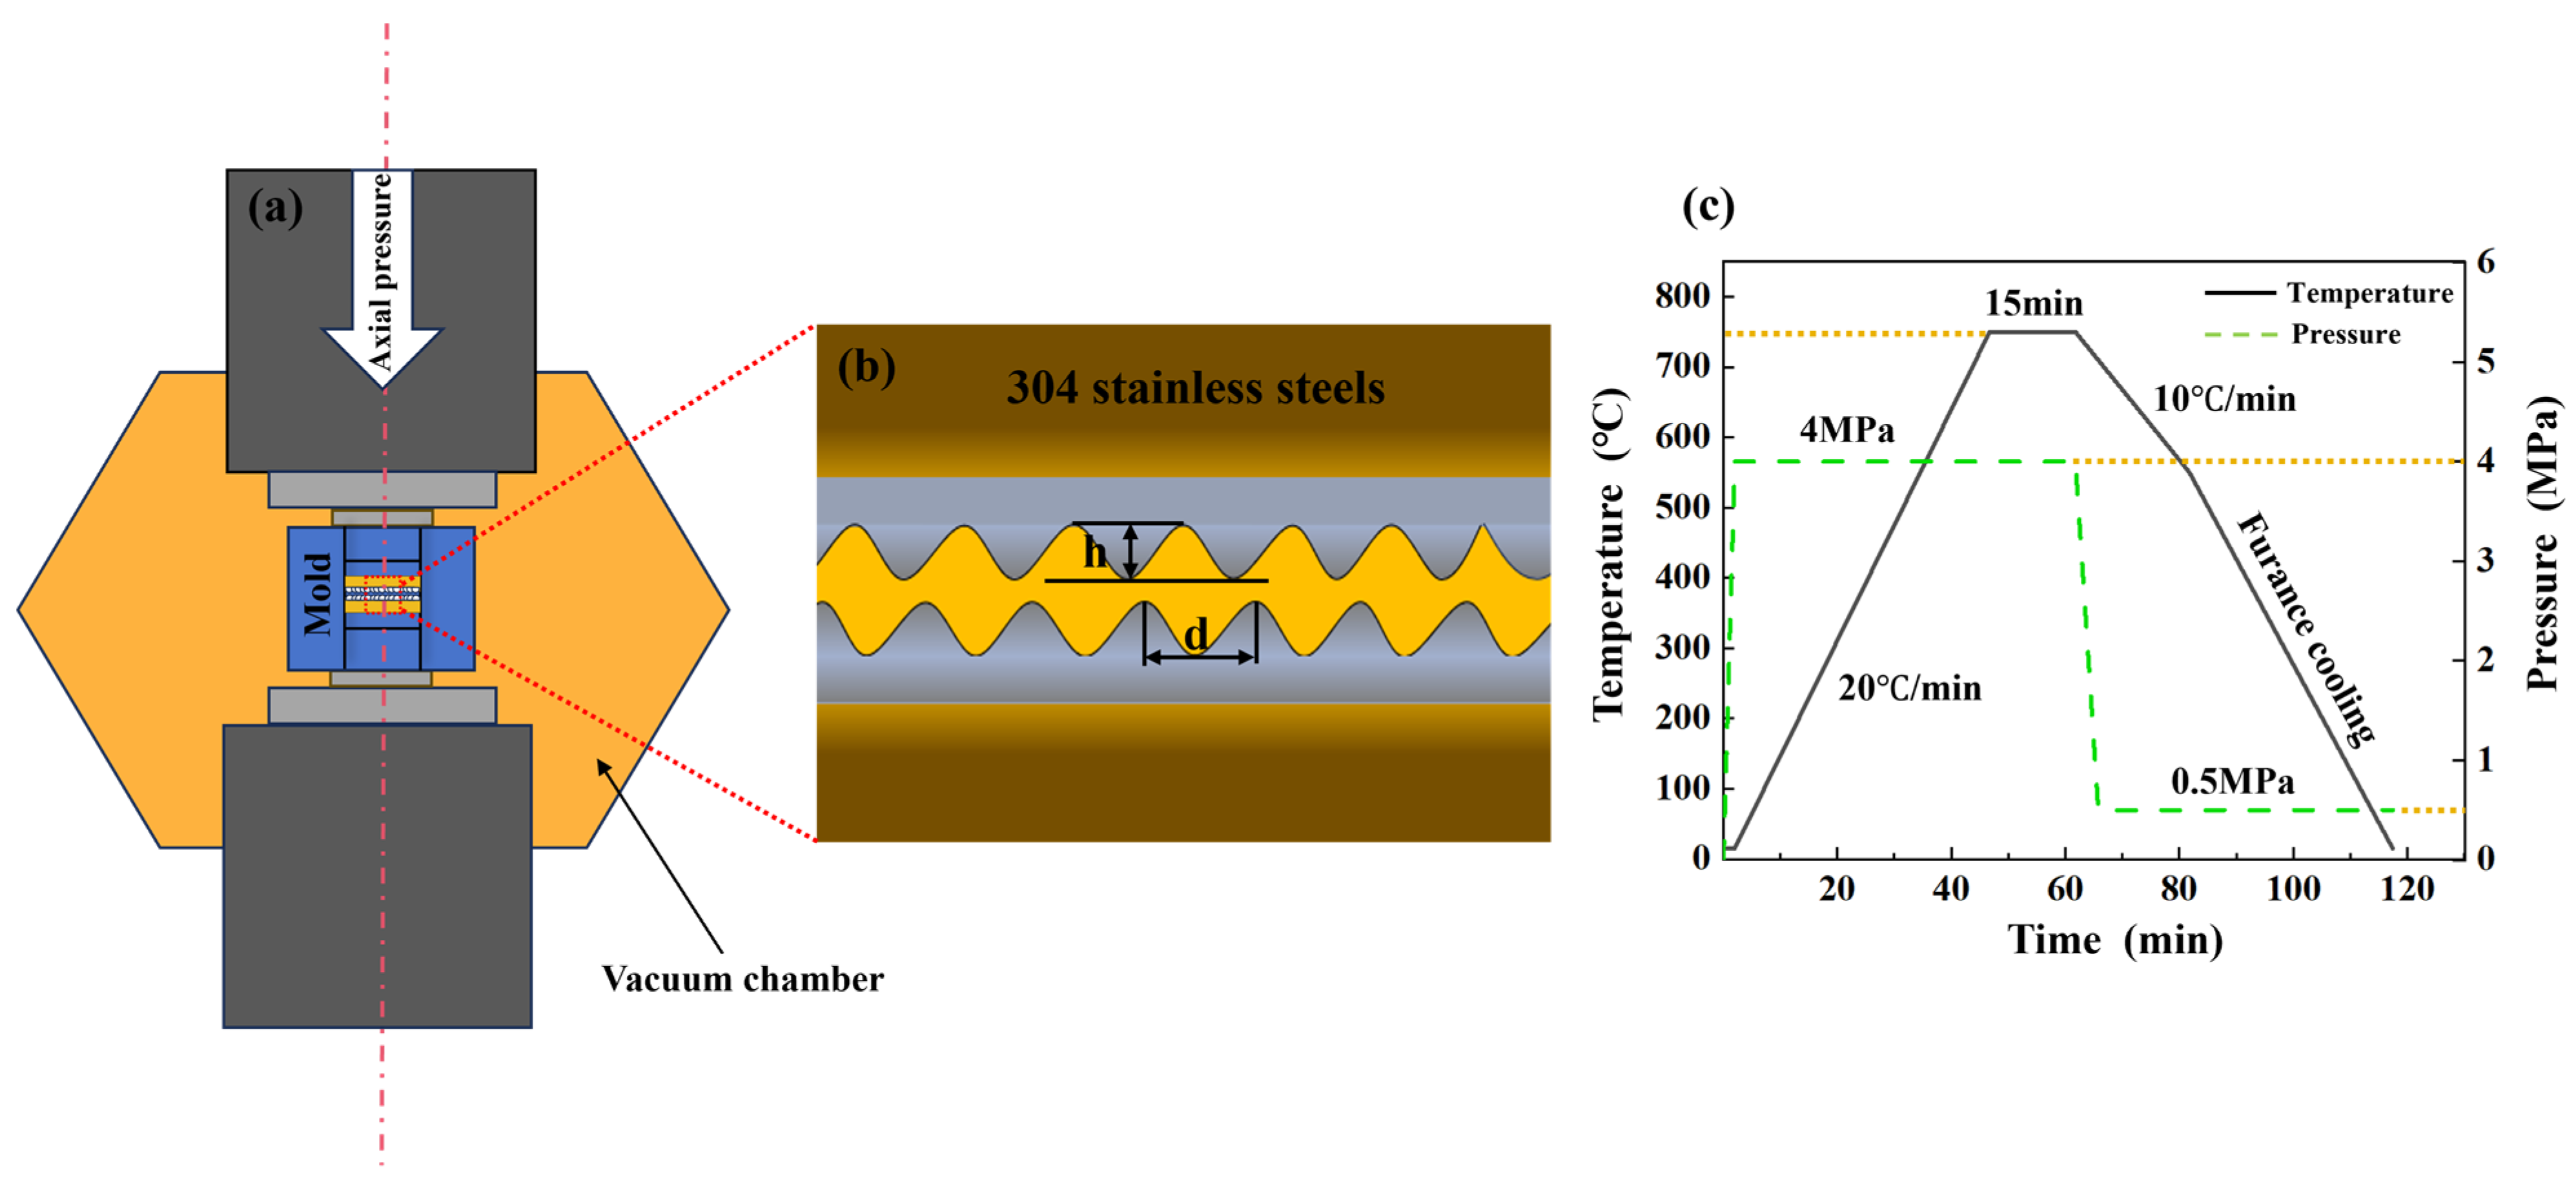
2. Experimental and Procedures

2.1. Materials and Experimental Parameters

In this experiment, 304 austenitic stainless steel plates were used for vacuum diffusion bonding. The exact composition and standard ranges of 304 stainless steel substrates are given in Table 1. The bonding temperature was in the temperature range of 700 to 775 °C (interval of 25 °C) (0.6Tm, 304 austenitic stainless steel melting temperature Tm ≈ 1398 °C). A constant pressure of 4 MPa was used and the vacuum degree was 3 × 10⁻³ Pa during the diffusion bonding process. The holding time was 15 min.
The schematic diagram of the experimental process is shown in Figure 1. Specimens for diffusion bonding were cut into thin plates with dimensions of 36 mm × 36 mm × 3 mm. The assembly diagram is shown in Figure 1a. Before diffusion bonding, the surface of the sample was roughened with 100-mesh, 400-mesh, 800-mesh, and 1500-mesh SiC sandpaper in the same direction and then cleaned with ultrasonic cleaner in alcohol solution and dried with hot air. The morphology of the sandpaper ground surface and the measurement of specific roughness values, Ra and Sq, were observed by laser confocal microscope. The two samples roughened by SiC sandpaper of the same particle size were stacked along the same grinding direction, as shown in Figure 1b’s schematic diagram of the interface structure design; they were then placed into the FHP-828 hot-pressing vacuum-sintering furnace. The thermocouple was inserted into the middle part of the mold to ensure the uniformity of temperature in the furnace. We aligned the mold containing the sample with the lower graphite table and applied 4 MPa pressure provided by the upper graphite indenter. After the vacuum degree in the furnace was pumped to less than 10−3 Pa by the vacuum pump, the sample was heated to 700 °C, 725 °C, 750 °C, and 775 °C at a heating rate of 20 °C/min and kept at the bonding temperature for 15 min so that the overall temperature of the sample was uniform. The pressure was then released and the bonded sample was cooled in the furnace. A schematic diagram of the process parameters is shown in Figure 1c. After bonding at different temperatures, a detailed metallographic examination was carried out along the interface bonding line.

2.2. Microstructure Characterization

After the diffusion bonding, a specimen was machined with a DK77 wire cutter, and the bonded interface was polished with 100~2000-mesh SiC grit paper and then mechanically polished with a diamond polisher to a standard mirror finish. The interface was chemically etched with Keller’s reagent (170 mL H2O, 20 mL HF, 10 mL HNO3) for interfacial etching, which was used for subsequent metallographic observations. The morphology of the rough surface polished with SiC sandpaper was observed by laser confocal microscopy. The axial deformation rate of the sample was measured with a stereological microscope. We observed the joint interface morphology using an OLYMPUS GX71 inverted optical metallurgical microscope. The microstructures and holes at the bonded interface were analyzed using precision scanning electron microscopy (SEM, EDS, TESCAN VEGA3 XMU) as well as elemental distribution at the interface. Nano Measure software (1.02.0005) was used to measure the size of the hole, and then the interfacial bonding ratio was calculated. The axial height of the specimen before and after bonding was measured using a type microscope, and the axial deformation rate was calculated as the ratio of the change in height before and after bonding.

3. Results and Discussion

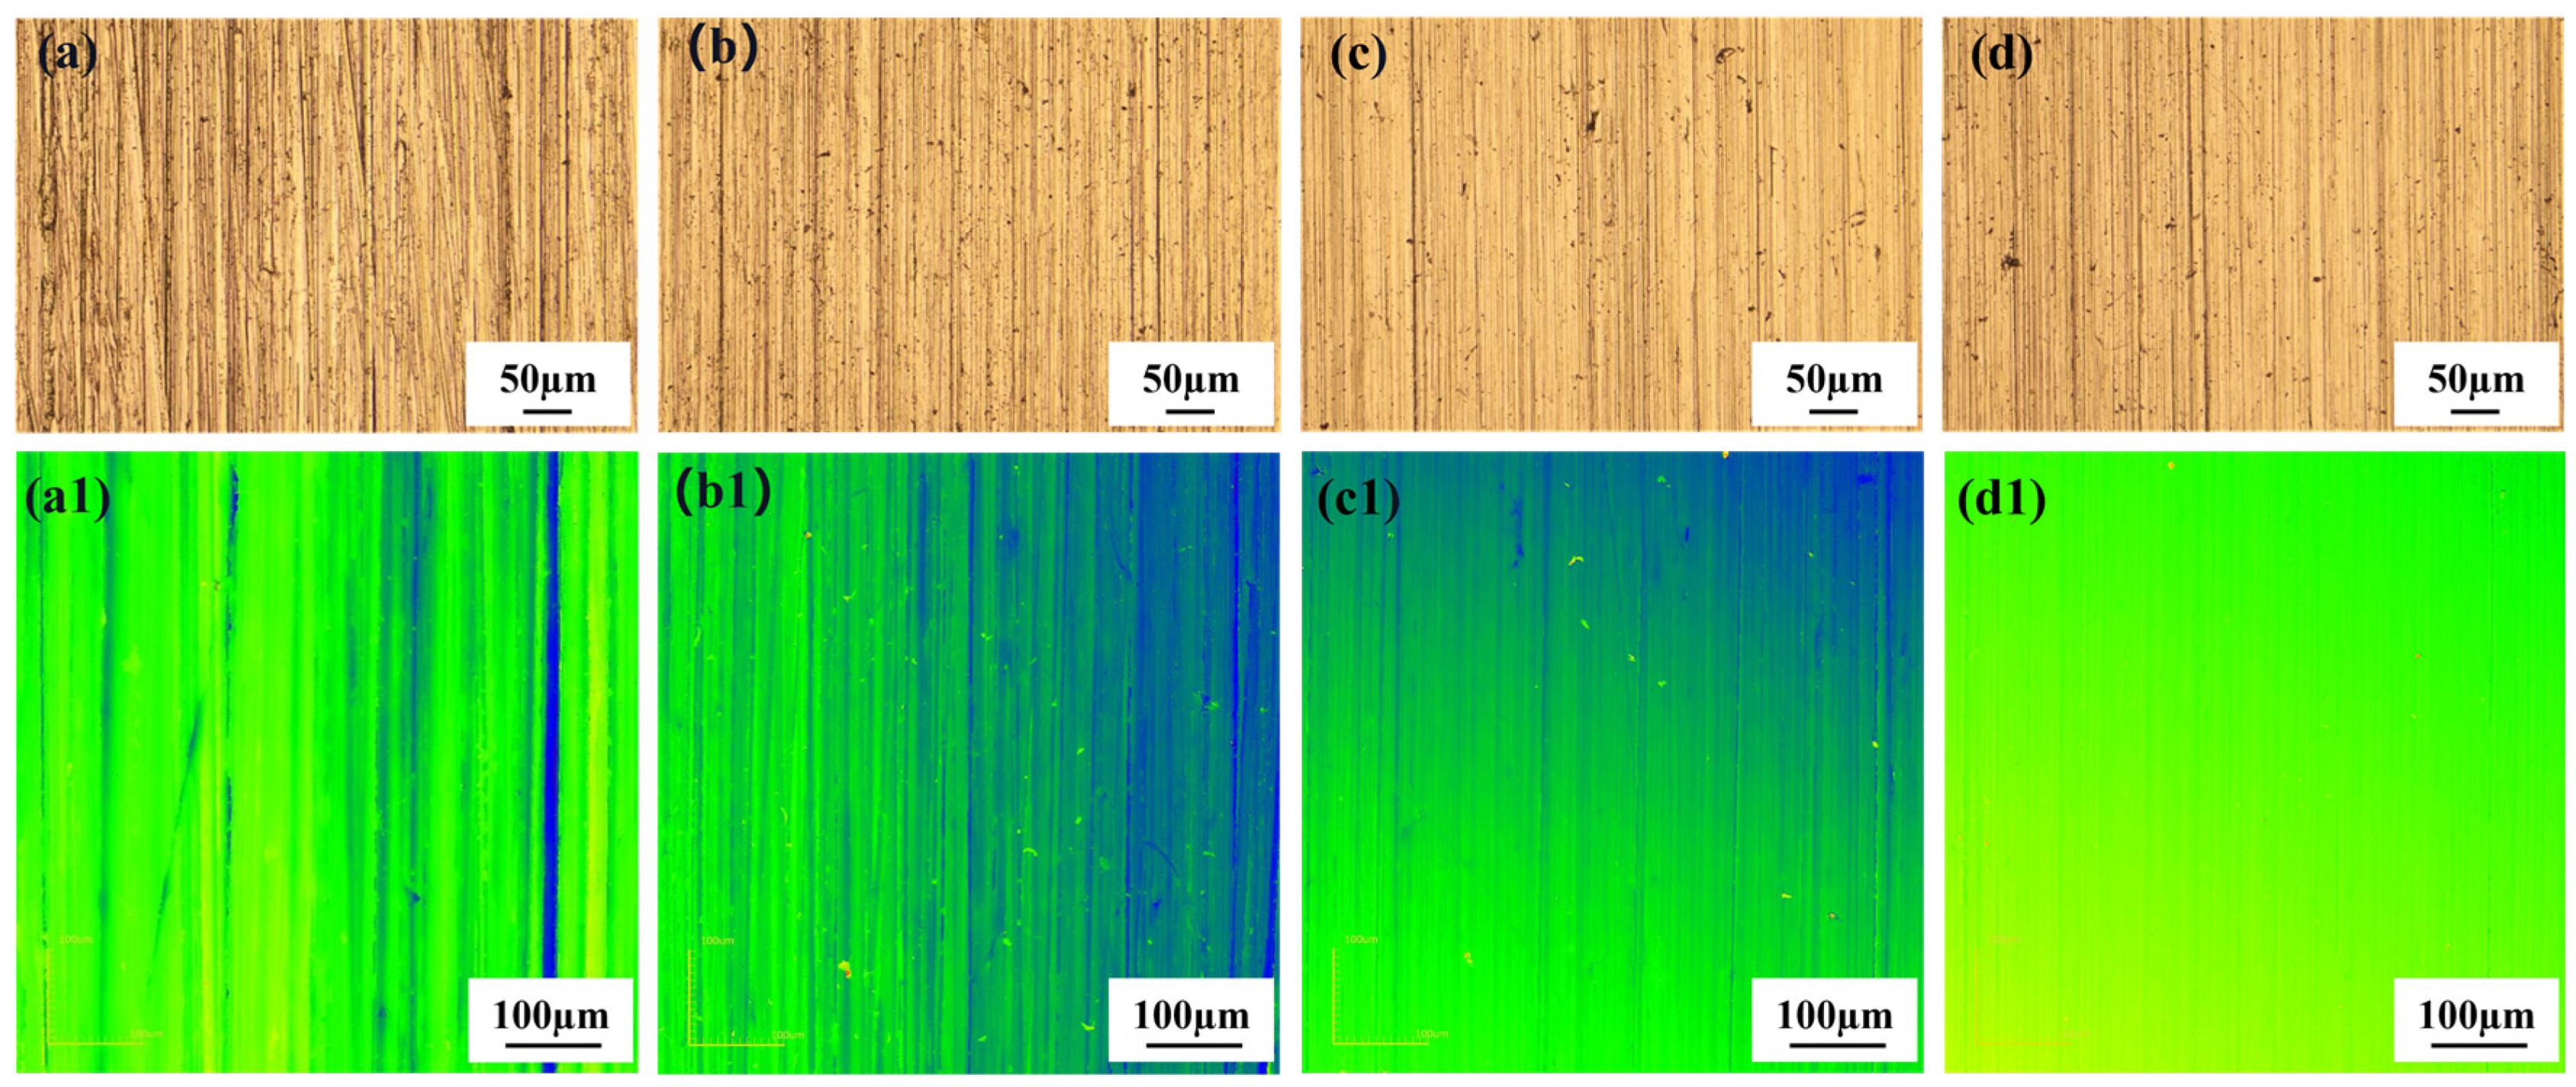
3.1. Initial Surface Characterization

The surface state of the samples before bonding has an important influence on the quality of the joint interface. Using the same bonding parameter process, the interface morphology of the samples corresponding to the different surface roughness values was quite different. Although existing research has addressed this issue, it has not been specific. The diffusion bonding of stainless steel with different surface roughness values and its effect on interfacial structure was therefore investigated in this paper. Figure 2 shows the optical micromorphology and laser confocal morphology of the surface of the sample after grinding with SiC sandpaper of different particle sizes. The surface was undulating and uneven on the microscopic scale, and the polished surface was a series of long parallel ridges with grinding grooves. As the grain size of SiC sandpaper decreased, the depth of the grinding grooves gradually decreased, and the surface uniformity increased.
The roughness parameters, Ra and Sq, of the surface ground with SiC sandpaper of different particle sizes were measured at three positions on the specimen surface by laser confocal microscopy. The calculated average values are shown in Table 2. Ra was the arithmetic mean roughness, representing the absolute value of the roughness at the reference length, and Sq was the root mean square deviation of the contour surface. With the increase in mesh number of SiC sandpaper, the grinding crack depth decreases gradually. The value of Ra and Sq also decreased gradually with the increase in sandpaper mesh number.

3.2. Microstructure of the Diffusion Bonding Interface

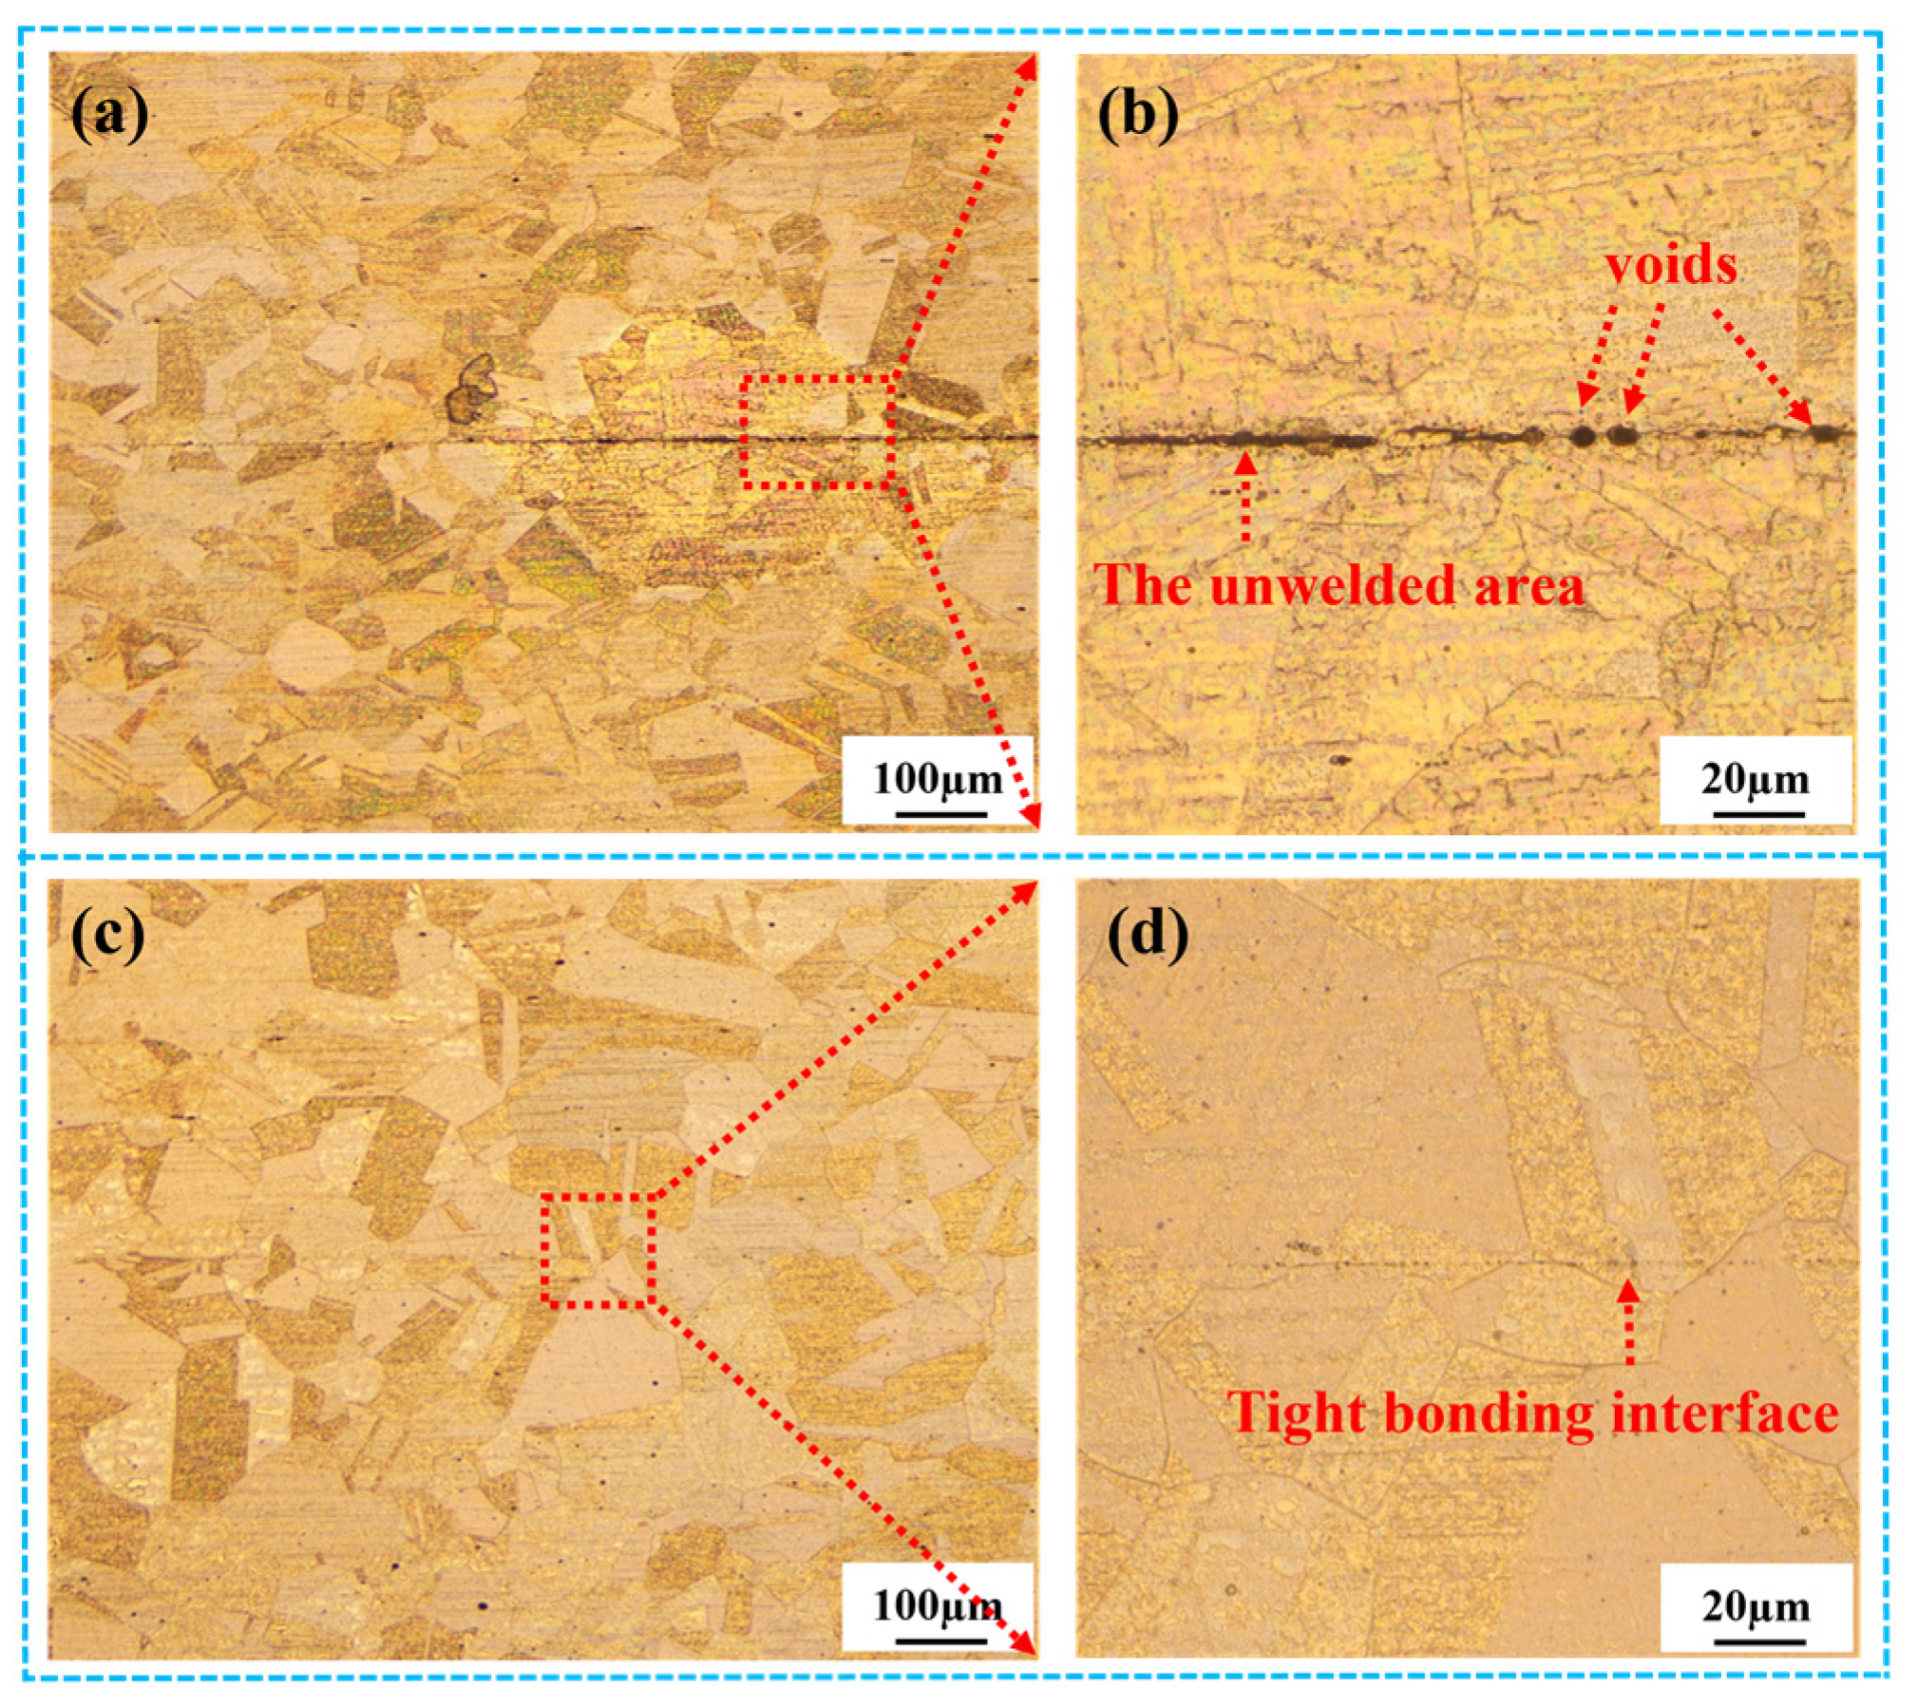
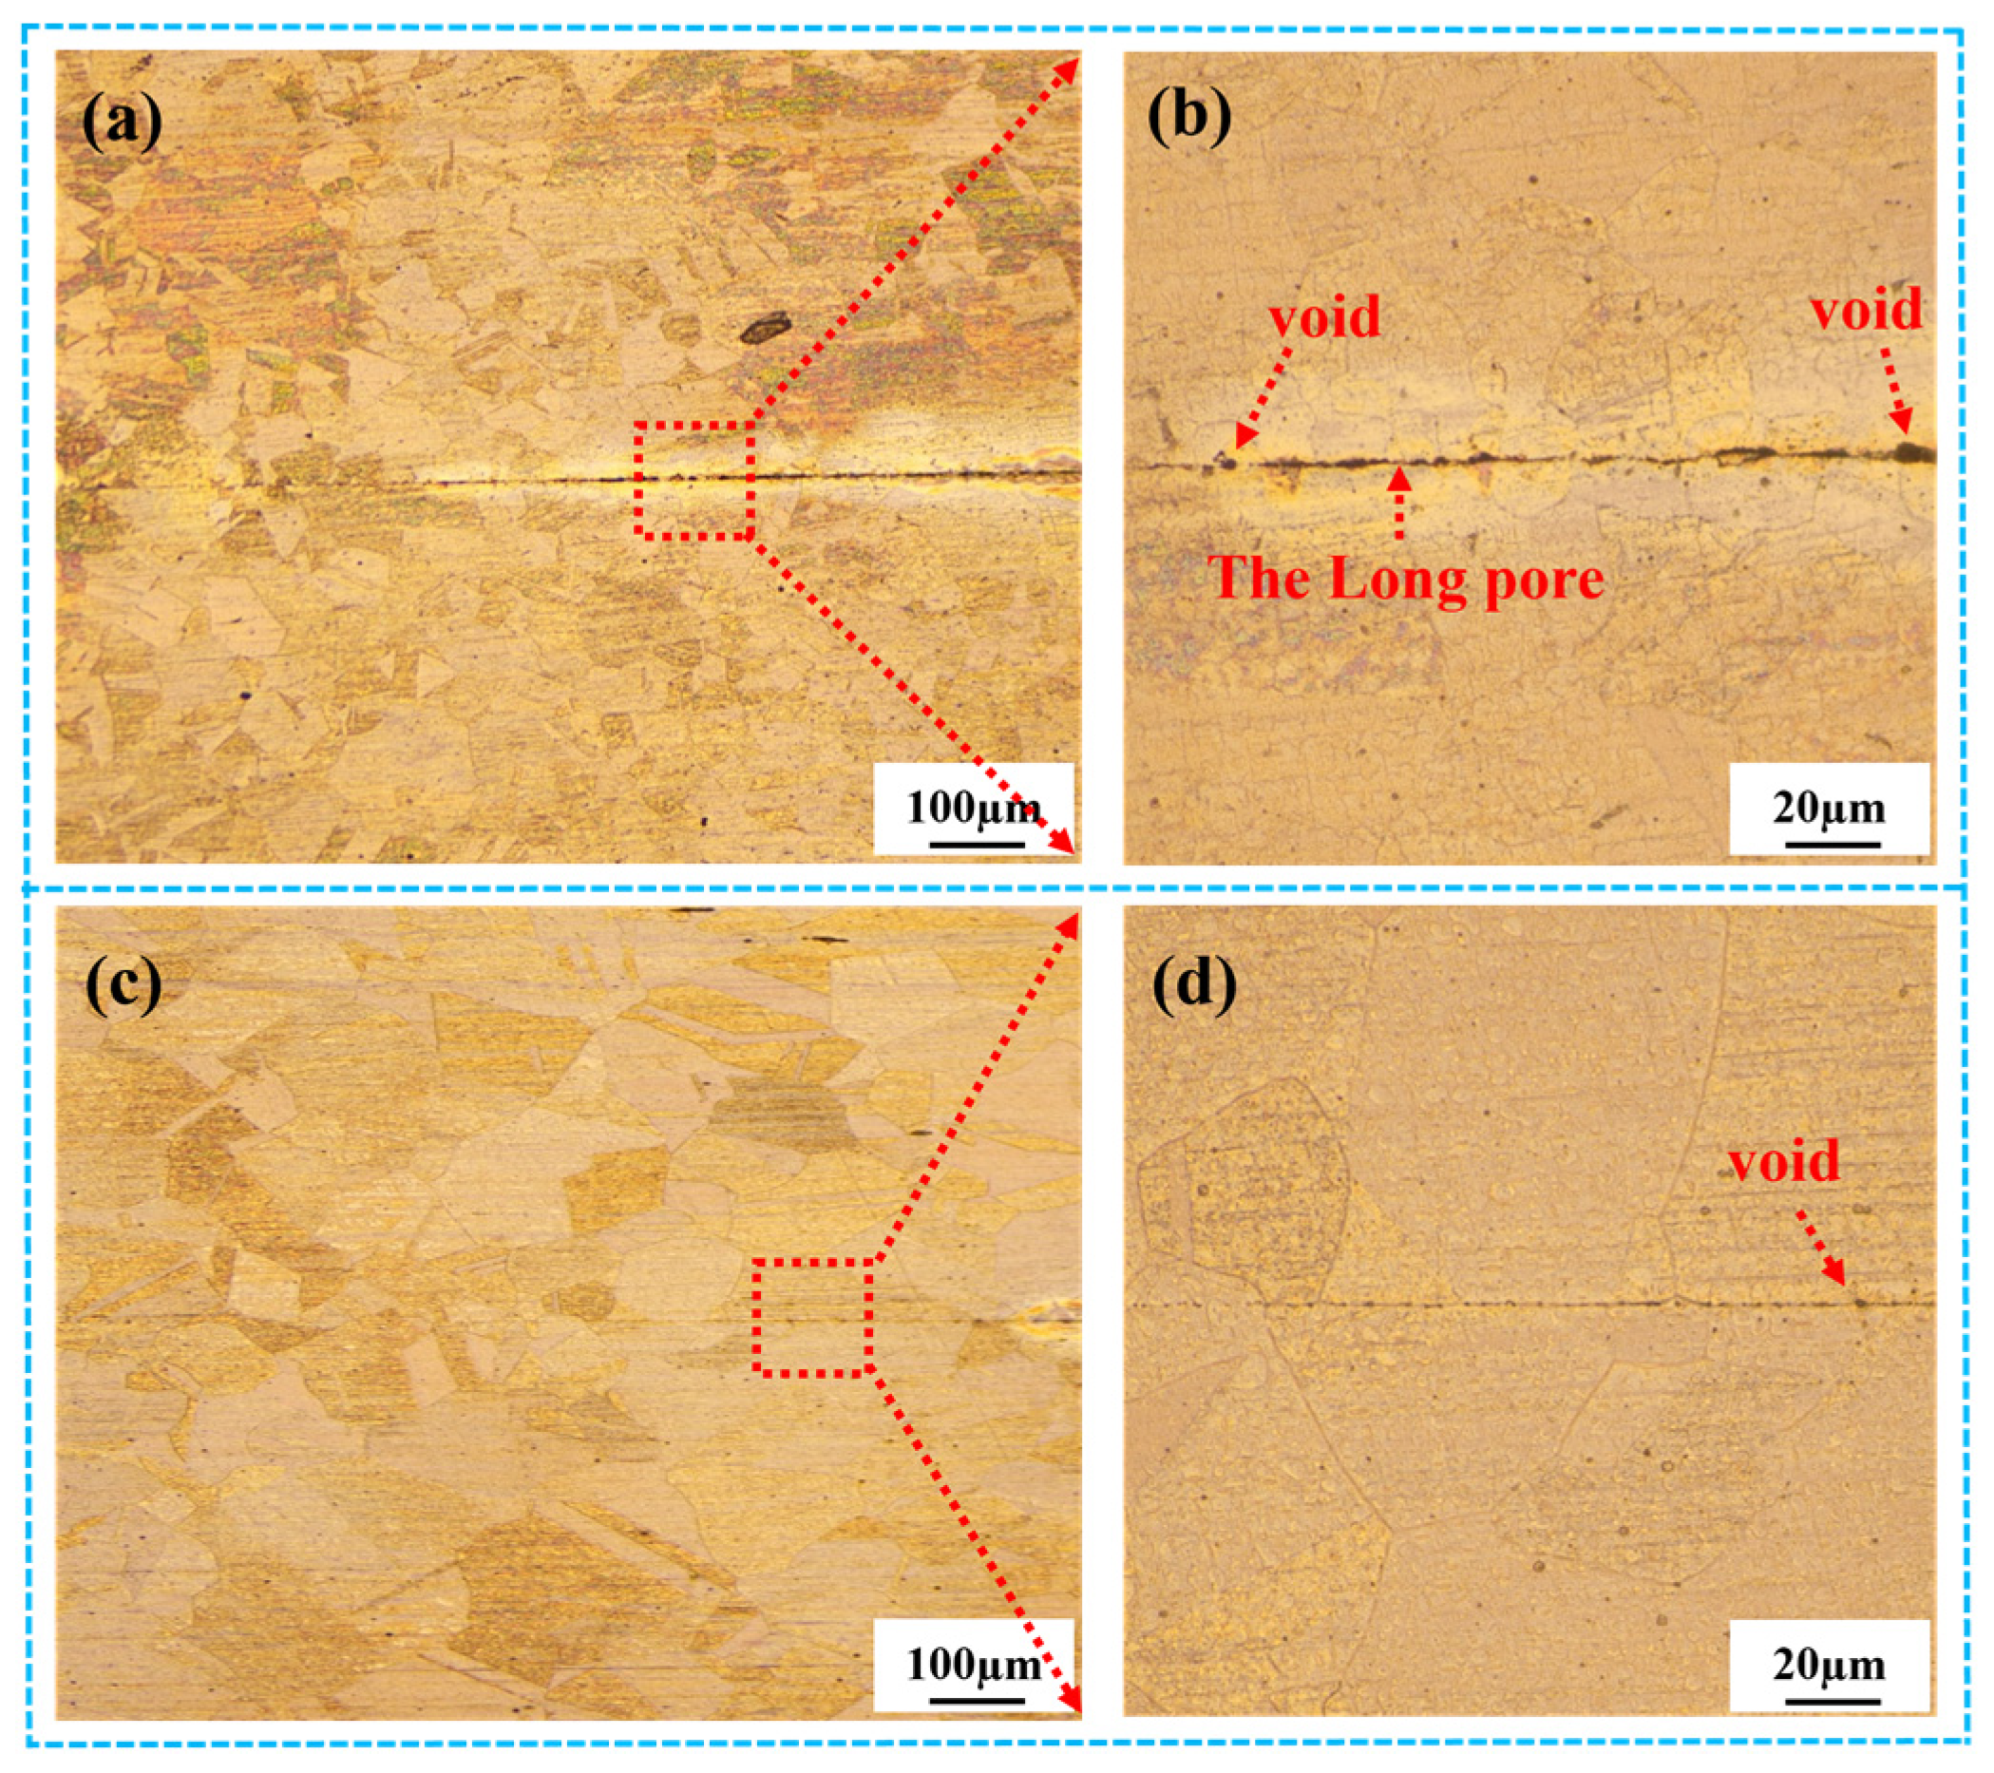
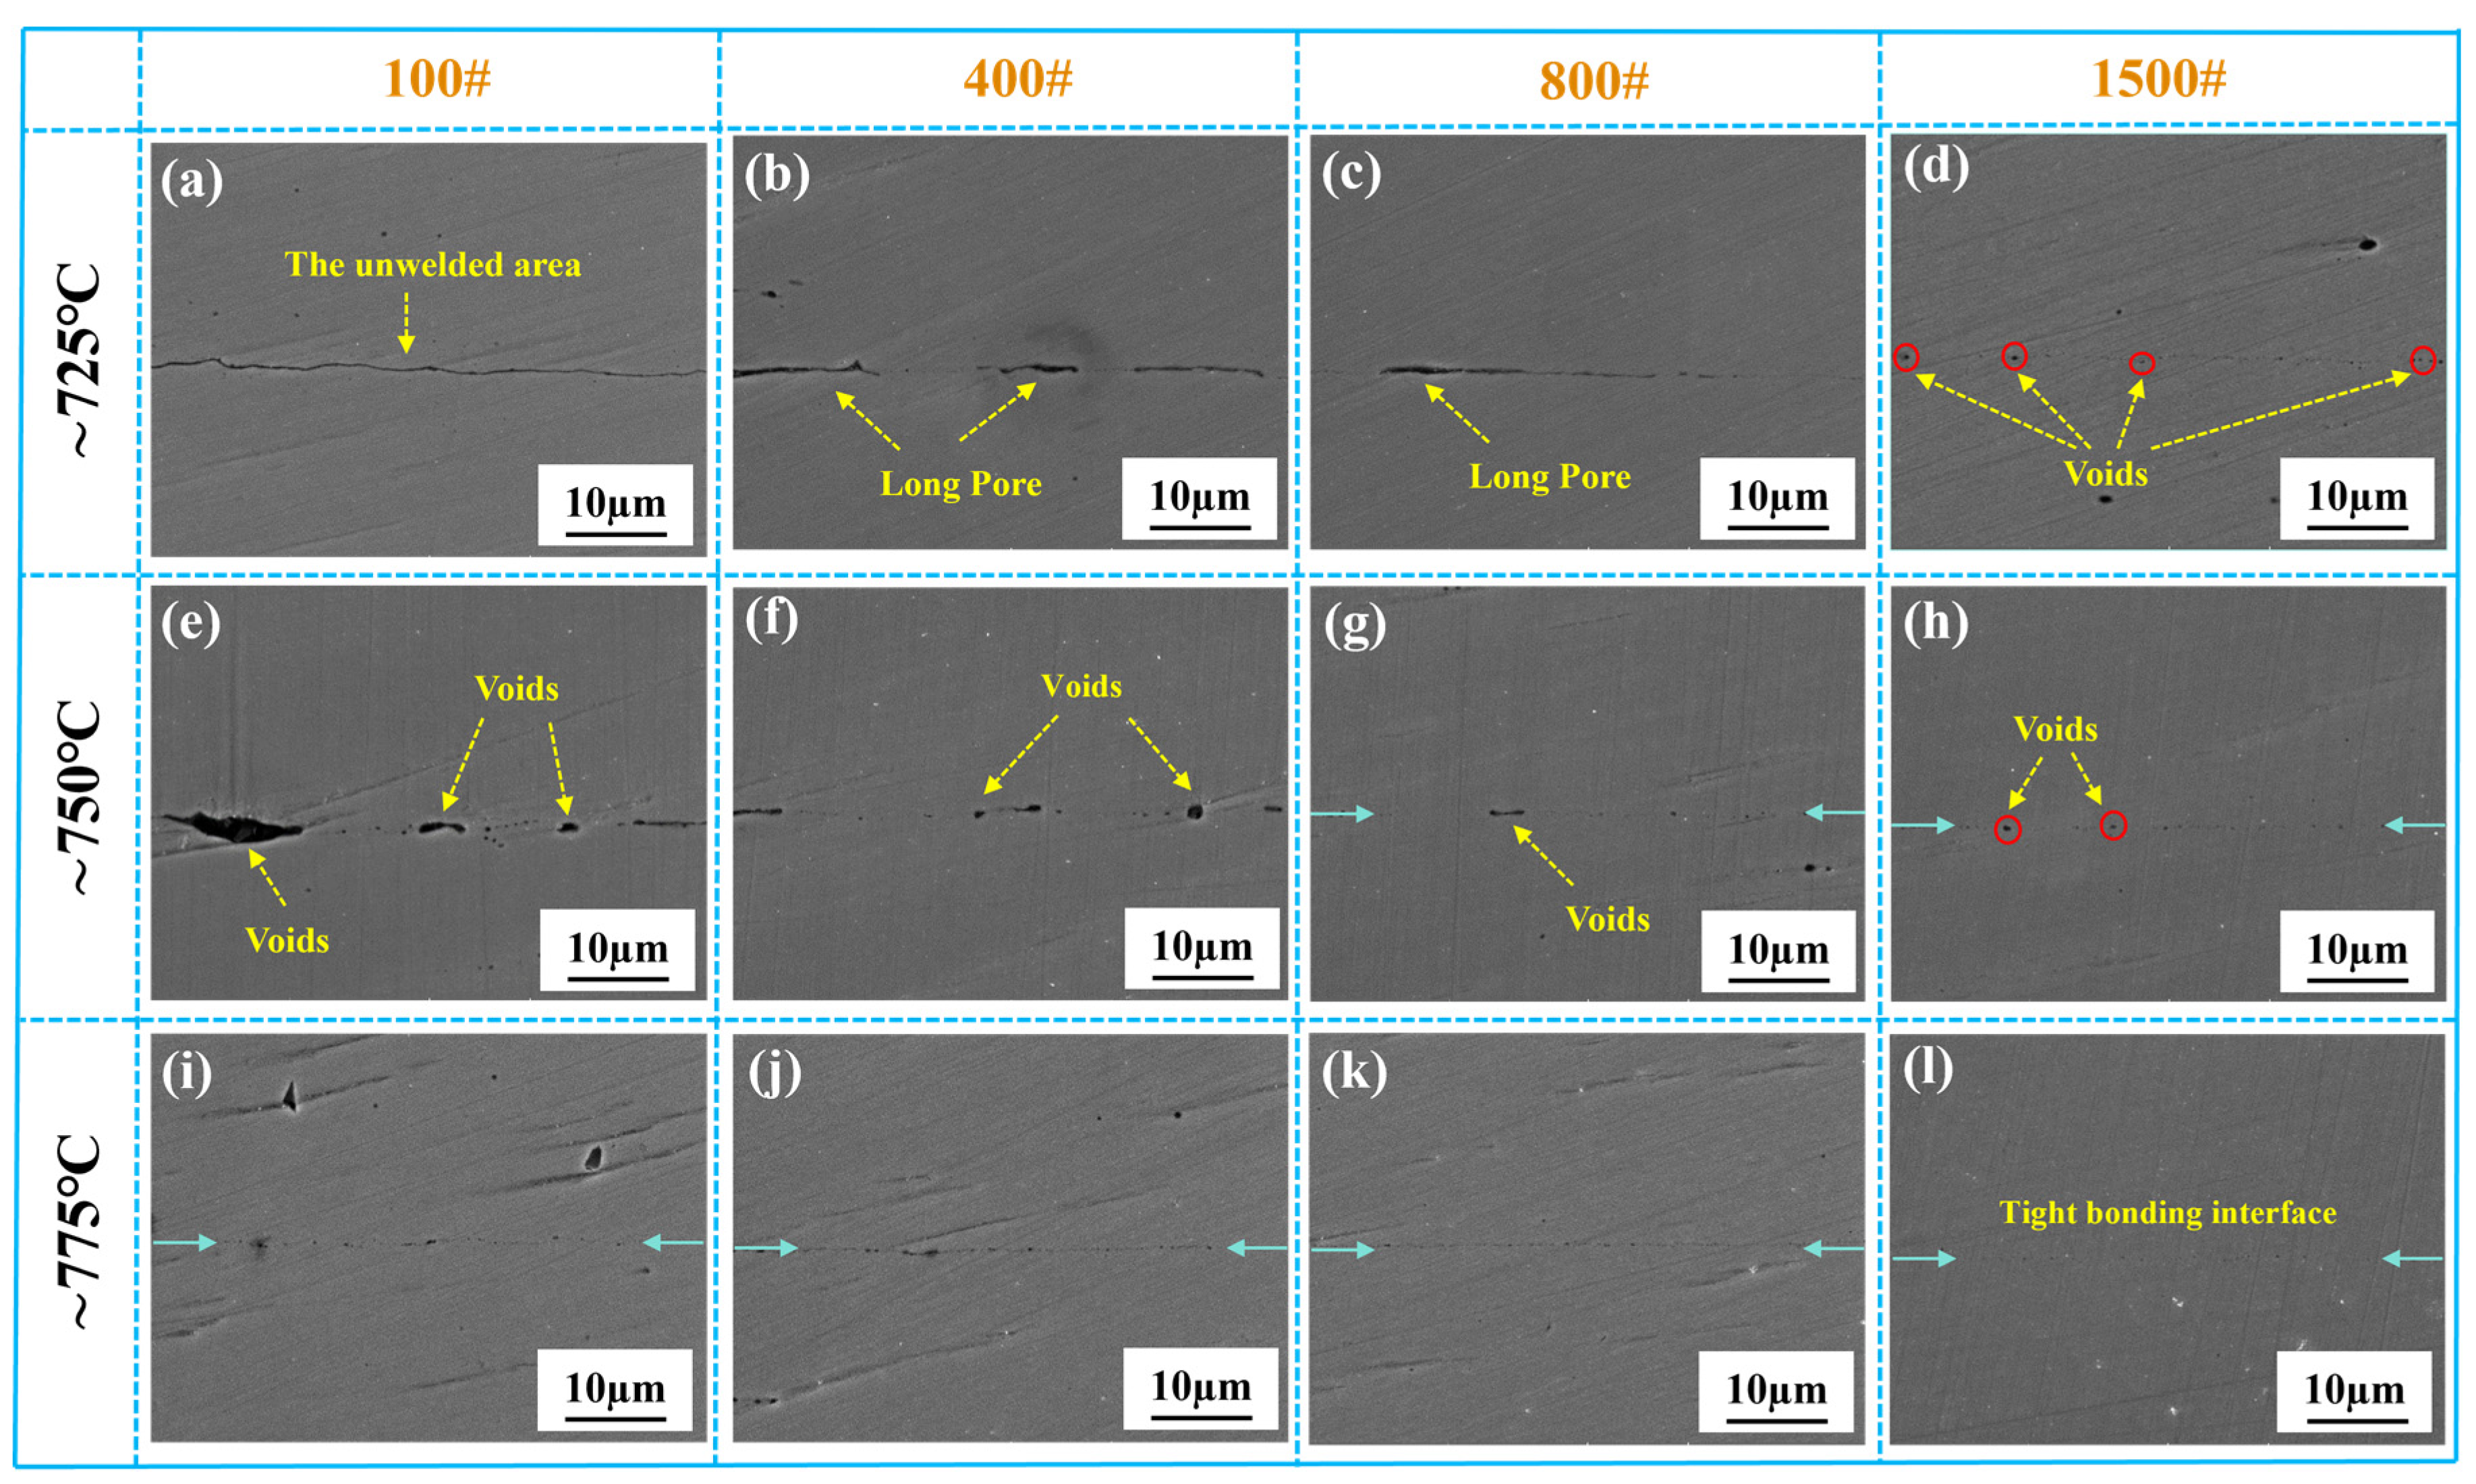
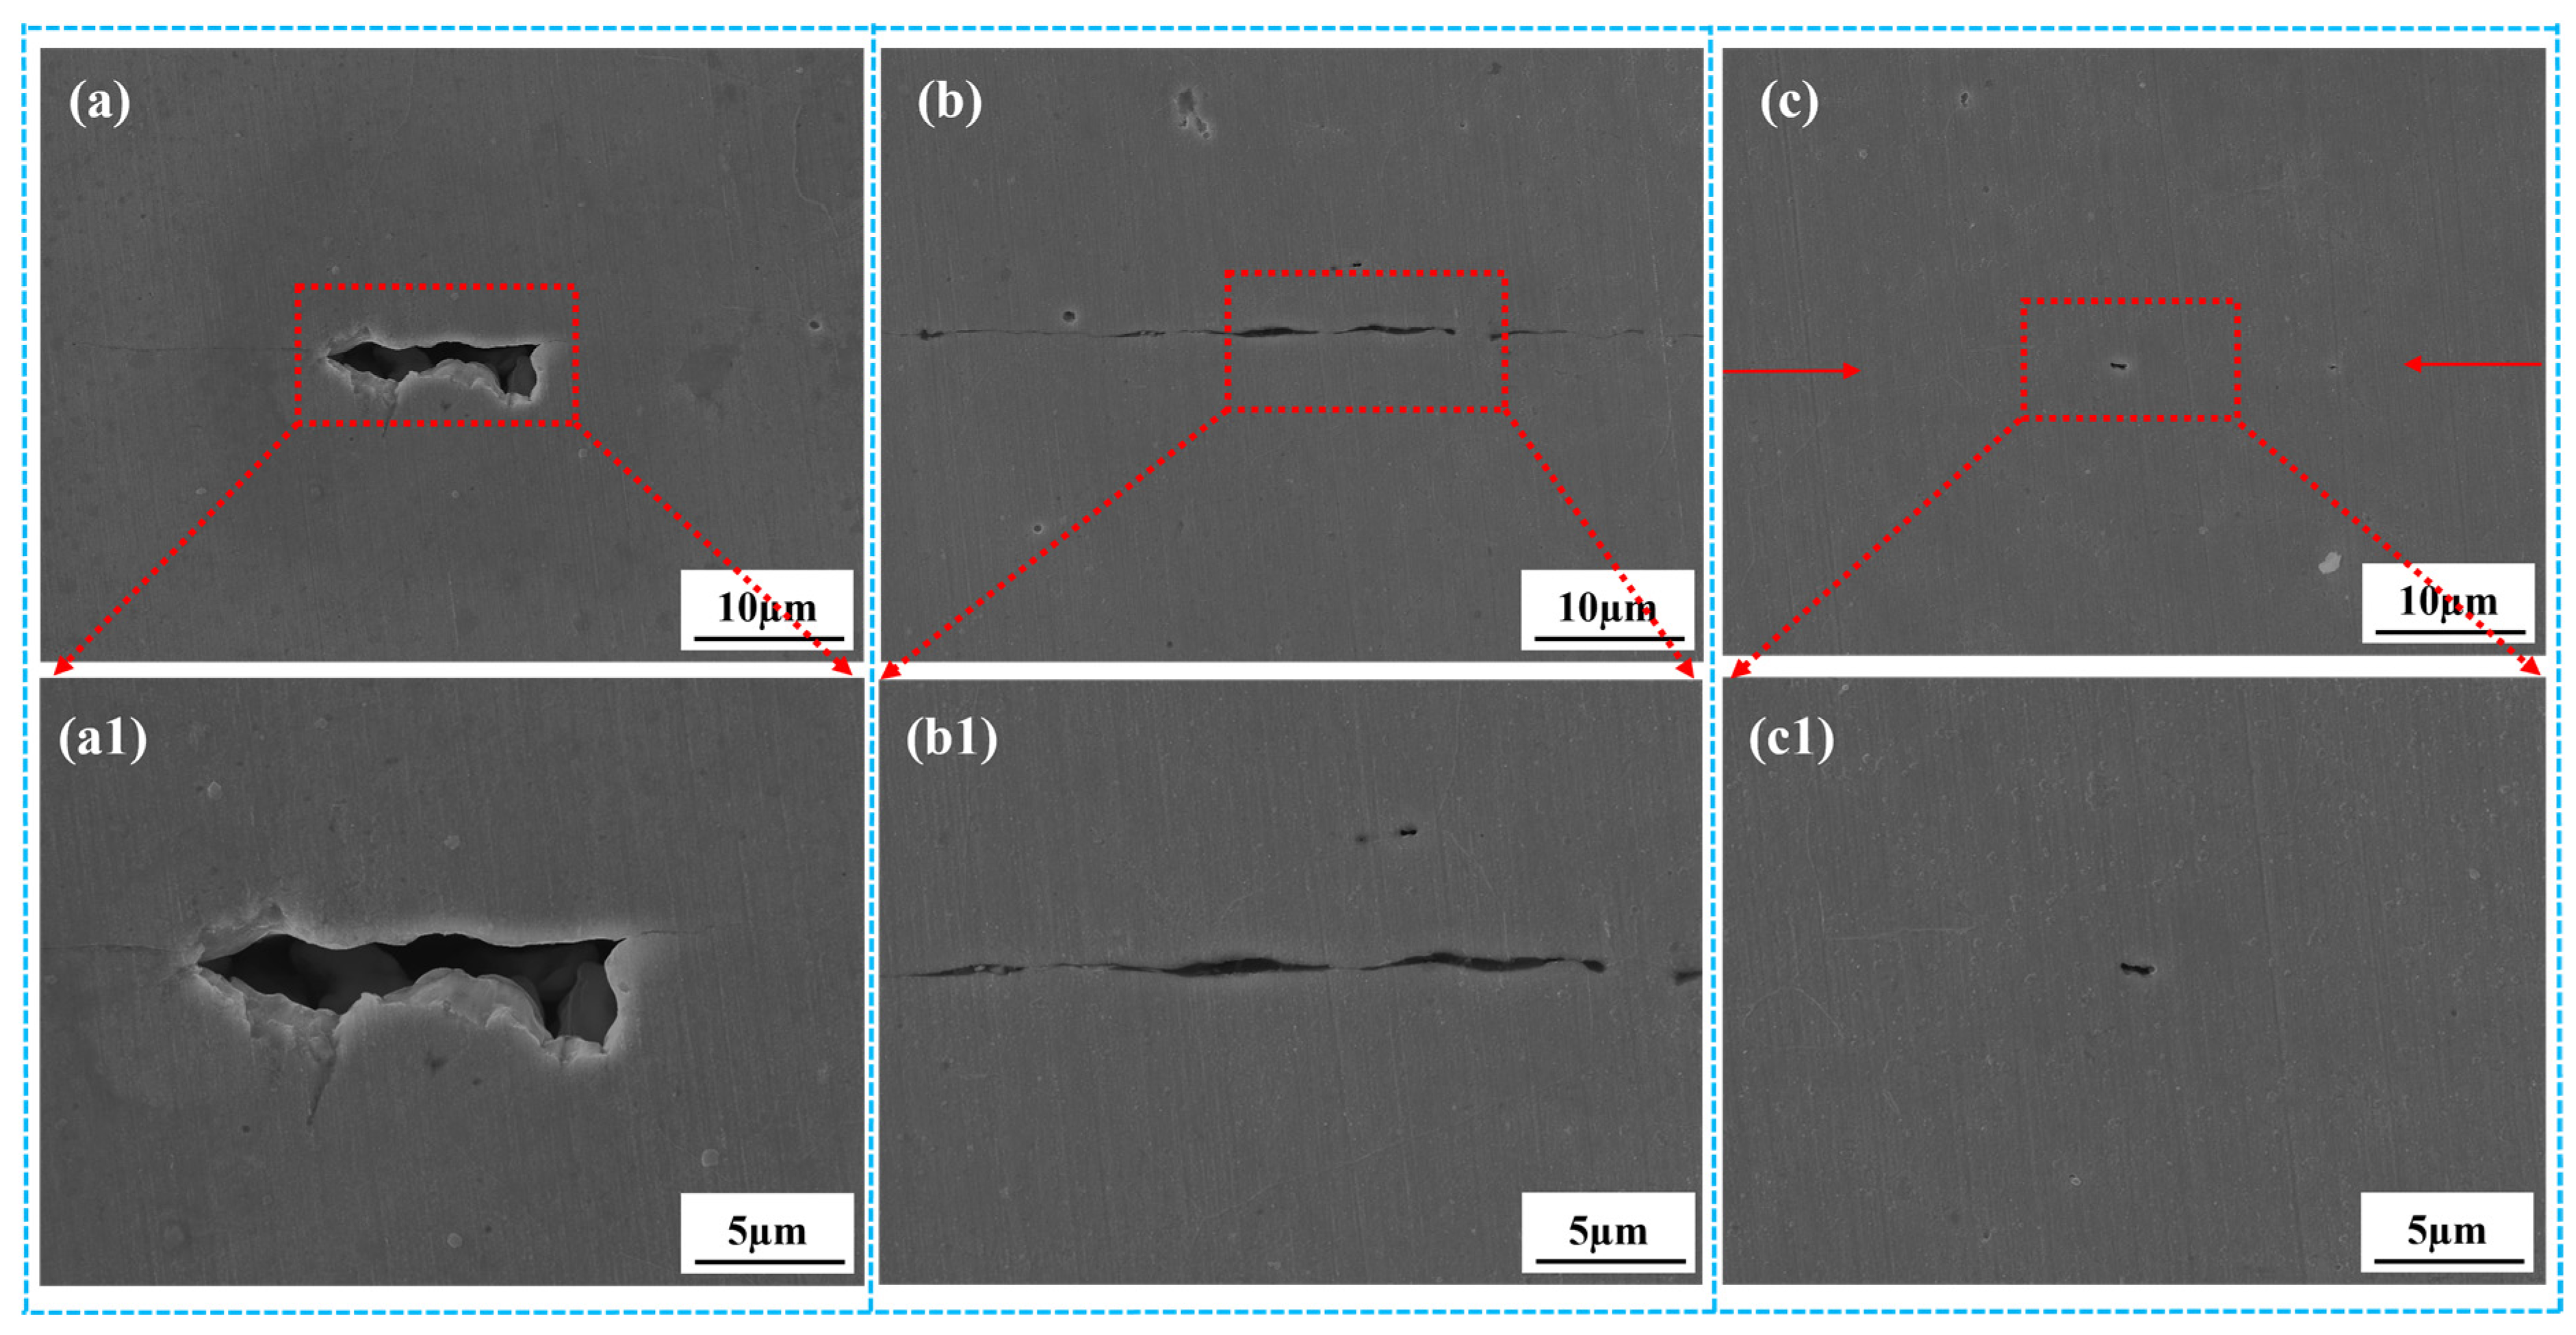
3.2.1. Optical Microstructure of the Stainless Steel Bonding Interface

The stainless steel was bonded by vacuum diffusion to study the effect of bonding temperature and surface roughness on the joint interface quality. Figure 3 shows the microstructure of the joint interface with different roughness values and bonding temperatures. With the decrease in surface roughness and the increase in bonding temperature, the pore size of the interface decreased gradually, and the proportion of the complete bonding area increased gradually. At lower bonding temperatures, some unbonded regions and micropores were observed at the interface. At higher bonding temperatures, the unbonded zone was significantly reduced due to deformation and atomic diffusion in the interface region, and the size of micropores decreased with the increase in temperature.
Figure 3(a1) shows that the surface roughness of the interface was 0.38 μm, the bonding temperature was 700 °C, and there were long pores and large unbonded areas. Figure 3(a1,d1) have the same surface roughness, and when the bonding temperature was 775 °C, the porosity reduced, but the interface was not fully combined. As shown in Figure 3(a1–a4), when the bonding temperature was constant, the proportion of the interface binding area gradually increased with the decrease in surface roughness. The above analysis shows that both surface roughness and bonding temperature have important effects on the microstructure of the interface. Only when the surface roughness is small enough and the bonding temperature is high enough can a fully trans-granular bonding interface be realized, as shown in Figure 3(c3,d3,c4,d4).
In order to further analyze the influence of temperature on the interface morphology, the sample was chemically etched to better show the grain boundaries. The microstructures of stainless steel diffusion-bonded interfaces at temperatures of 725 °C and 775 °C were compared for surface roughness after grinding with 800-grit SiC sandpaper, as shown in Figure 4. The morphology of the interface changed at different bonding temperatures. When the bonding temperature was 725 °C, there were still large unwelded areas and holes at the interface, as shown in Figure 4b. The hole size and unwelded area decreased with the increase in the bonding temperature. When the bonding temperature was 775 °C or higher, interfacial trans-crystallization could be observed, and tight bonding was achieved, as shown in Figure 4d.
Figure 5 shows the interface microstructure under the grinding surface of 400# and 1500# sandpaper at a bonding temperature of 750 °C after holding for 15 min with a pressure of 4 MPa. When the surface roughness was large (~0.194 µm), circular and elliptical holes could be observed on the bonding interface, and the pore size was not uniform. The formation of pores prevented the diffusion of atoms on the interface, and there was a large unwelded area, as shown in Figure 5b. When the surface roughness was small (~0.045 µm), there were only tiny circular pores at the interface, as shown in Figure 5d. When the interface hole was completely closed, it was difficult to distinguish the interface area from the non-interface area.

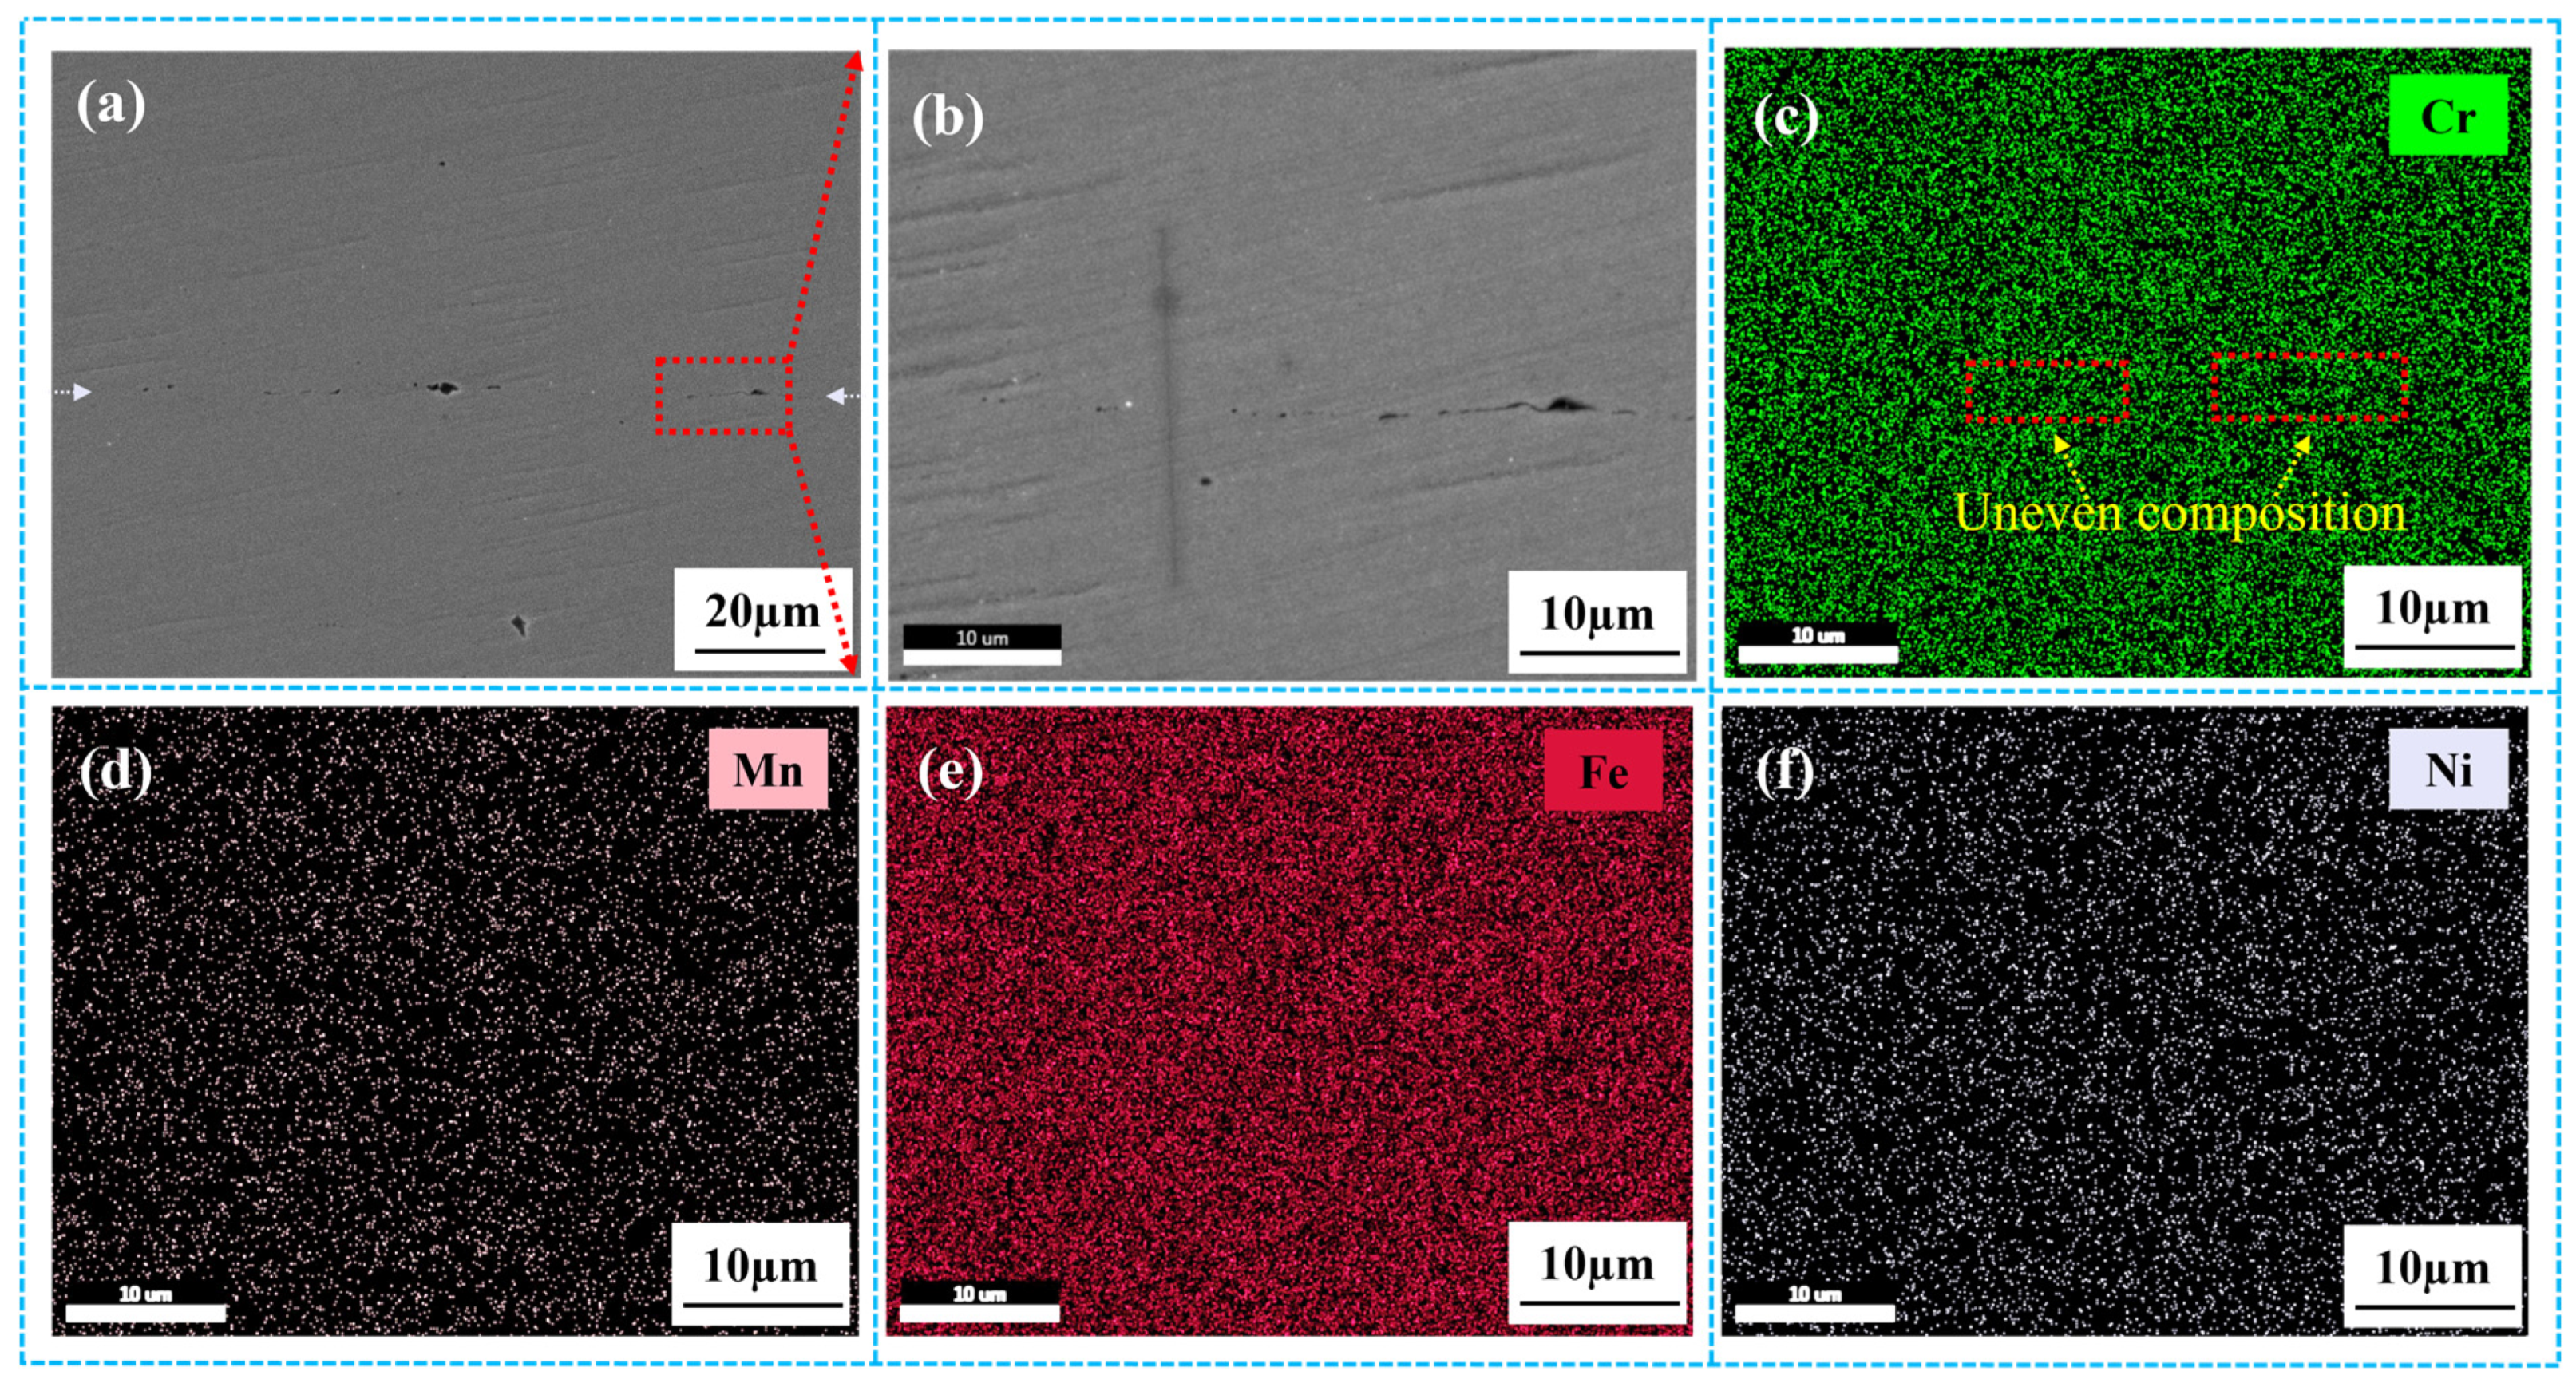
3.2.2. Microstructure and Elemental Analysis

The above optical microstructure analysis showed that insufficient atomic diffusion leads to obvious unbonded areas and holes in the joint when the bonding temperature is lower than 700 °C. Therefore, diffusion-bonded interfaces at 725 °C, 750 °C, and 775 °C with different roughness values were analyzed in more detail by SEM. Figure 6 shows the evolution process of pore size and morphology with the change in bonding temperature and surface roughness. As the surface roughness decreased, the cracks and holes at the interface decreased significantly. As the bonding temperature increased, the number of holes decreased and the interface tended to be completely bonded. When the bonding temperature reached 775 °C, the holes almost disappeared, as shown in Figure 6i. The comprehensive analysis showed that a defect-free joint could be obtained when the surface roughness was less than 0.045 μm and the bonding temperature was higher than 775 °C.
Due to the randomness in the formation of defects, the obtained shapes of defects are not the same. Figure 7a–c shows high-magnification electron microscope images of defects with different shapes. Figure 7(a1–c1) is a higher-magnification image of the local defect area. To analyze the effects of joint temperature and surface roughness on the microstructure and interface defects, the interface morphology with different parameters was observed at a higher ratio. Element line scanning and surface scanning were carried out on the bonding interface. Element line scanning and surface scanning were carried out on the diffusion interface polished with 1500-mesh sandpaper, and the bonding temperature was 775 °C. The result is shown in Figure 8. The contents of elements observed at the interface were relatively uniform, indicating that the bonding was good. In the surface scanning, the distribution of elements was balanced, and Fe, Cr, Mn, Ni, and other elements were evenly diffused at the interface. Element analysis of the incomplete bonded interface is shown in Figure 9a–f, detailing surface scanning position and element distribution. The interface was sanded with 800-mesh sandpaper at a bonding temperature of 750 °C. It was observed that the Cr element was not evenly distributed at the interface.

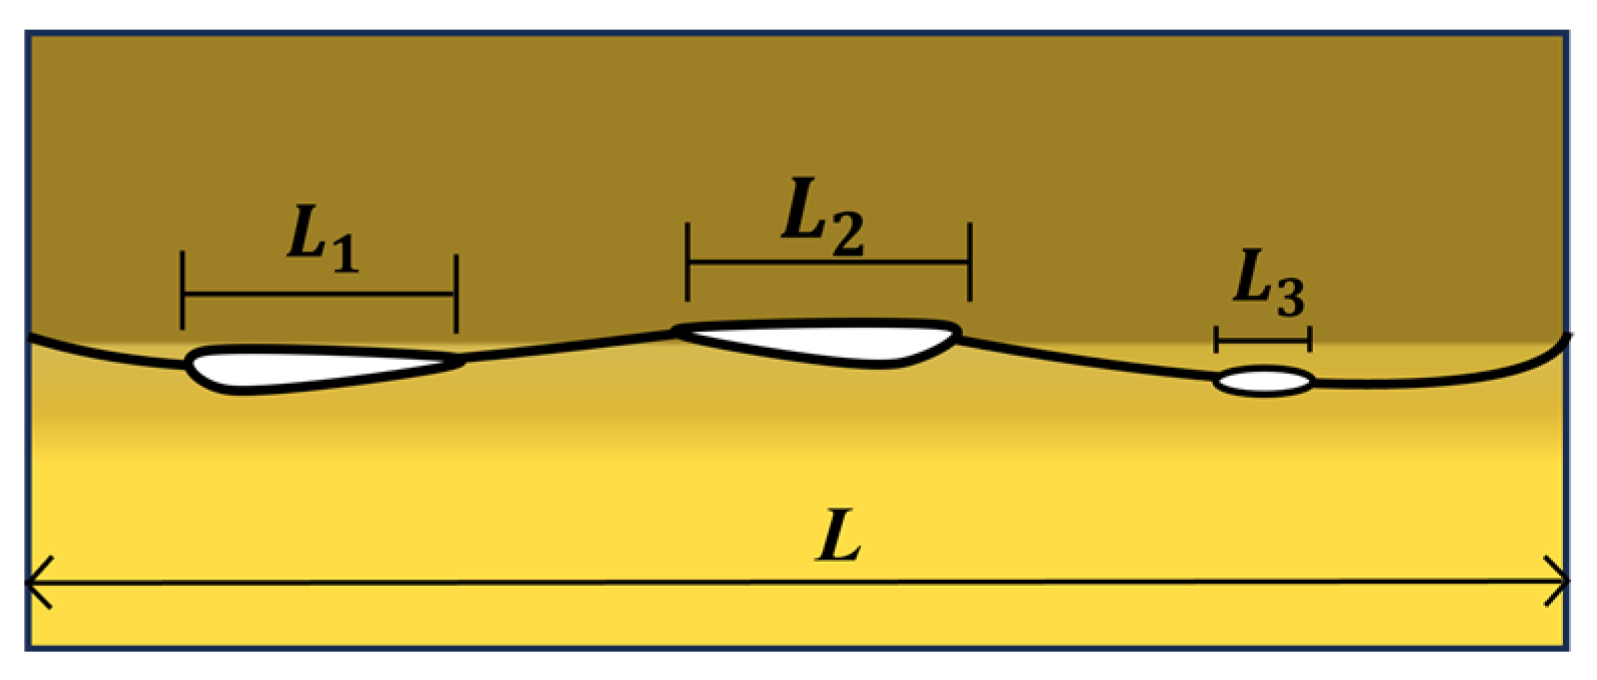
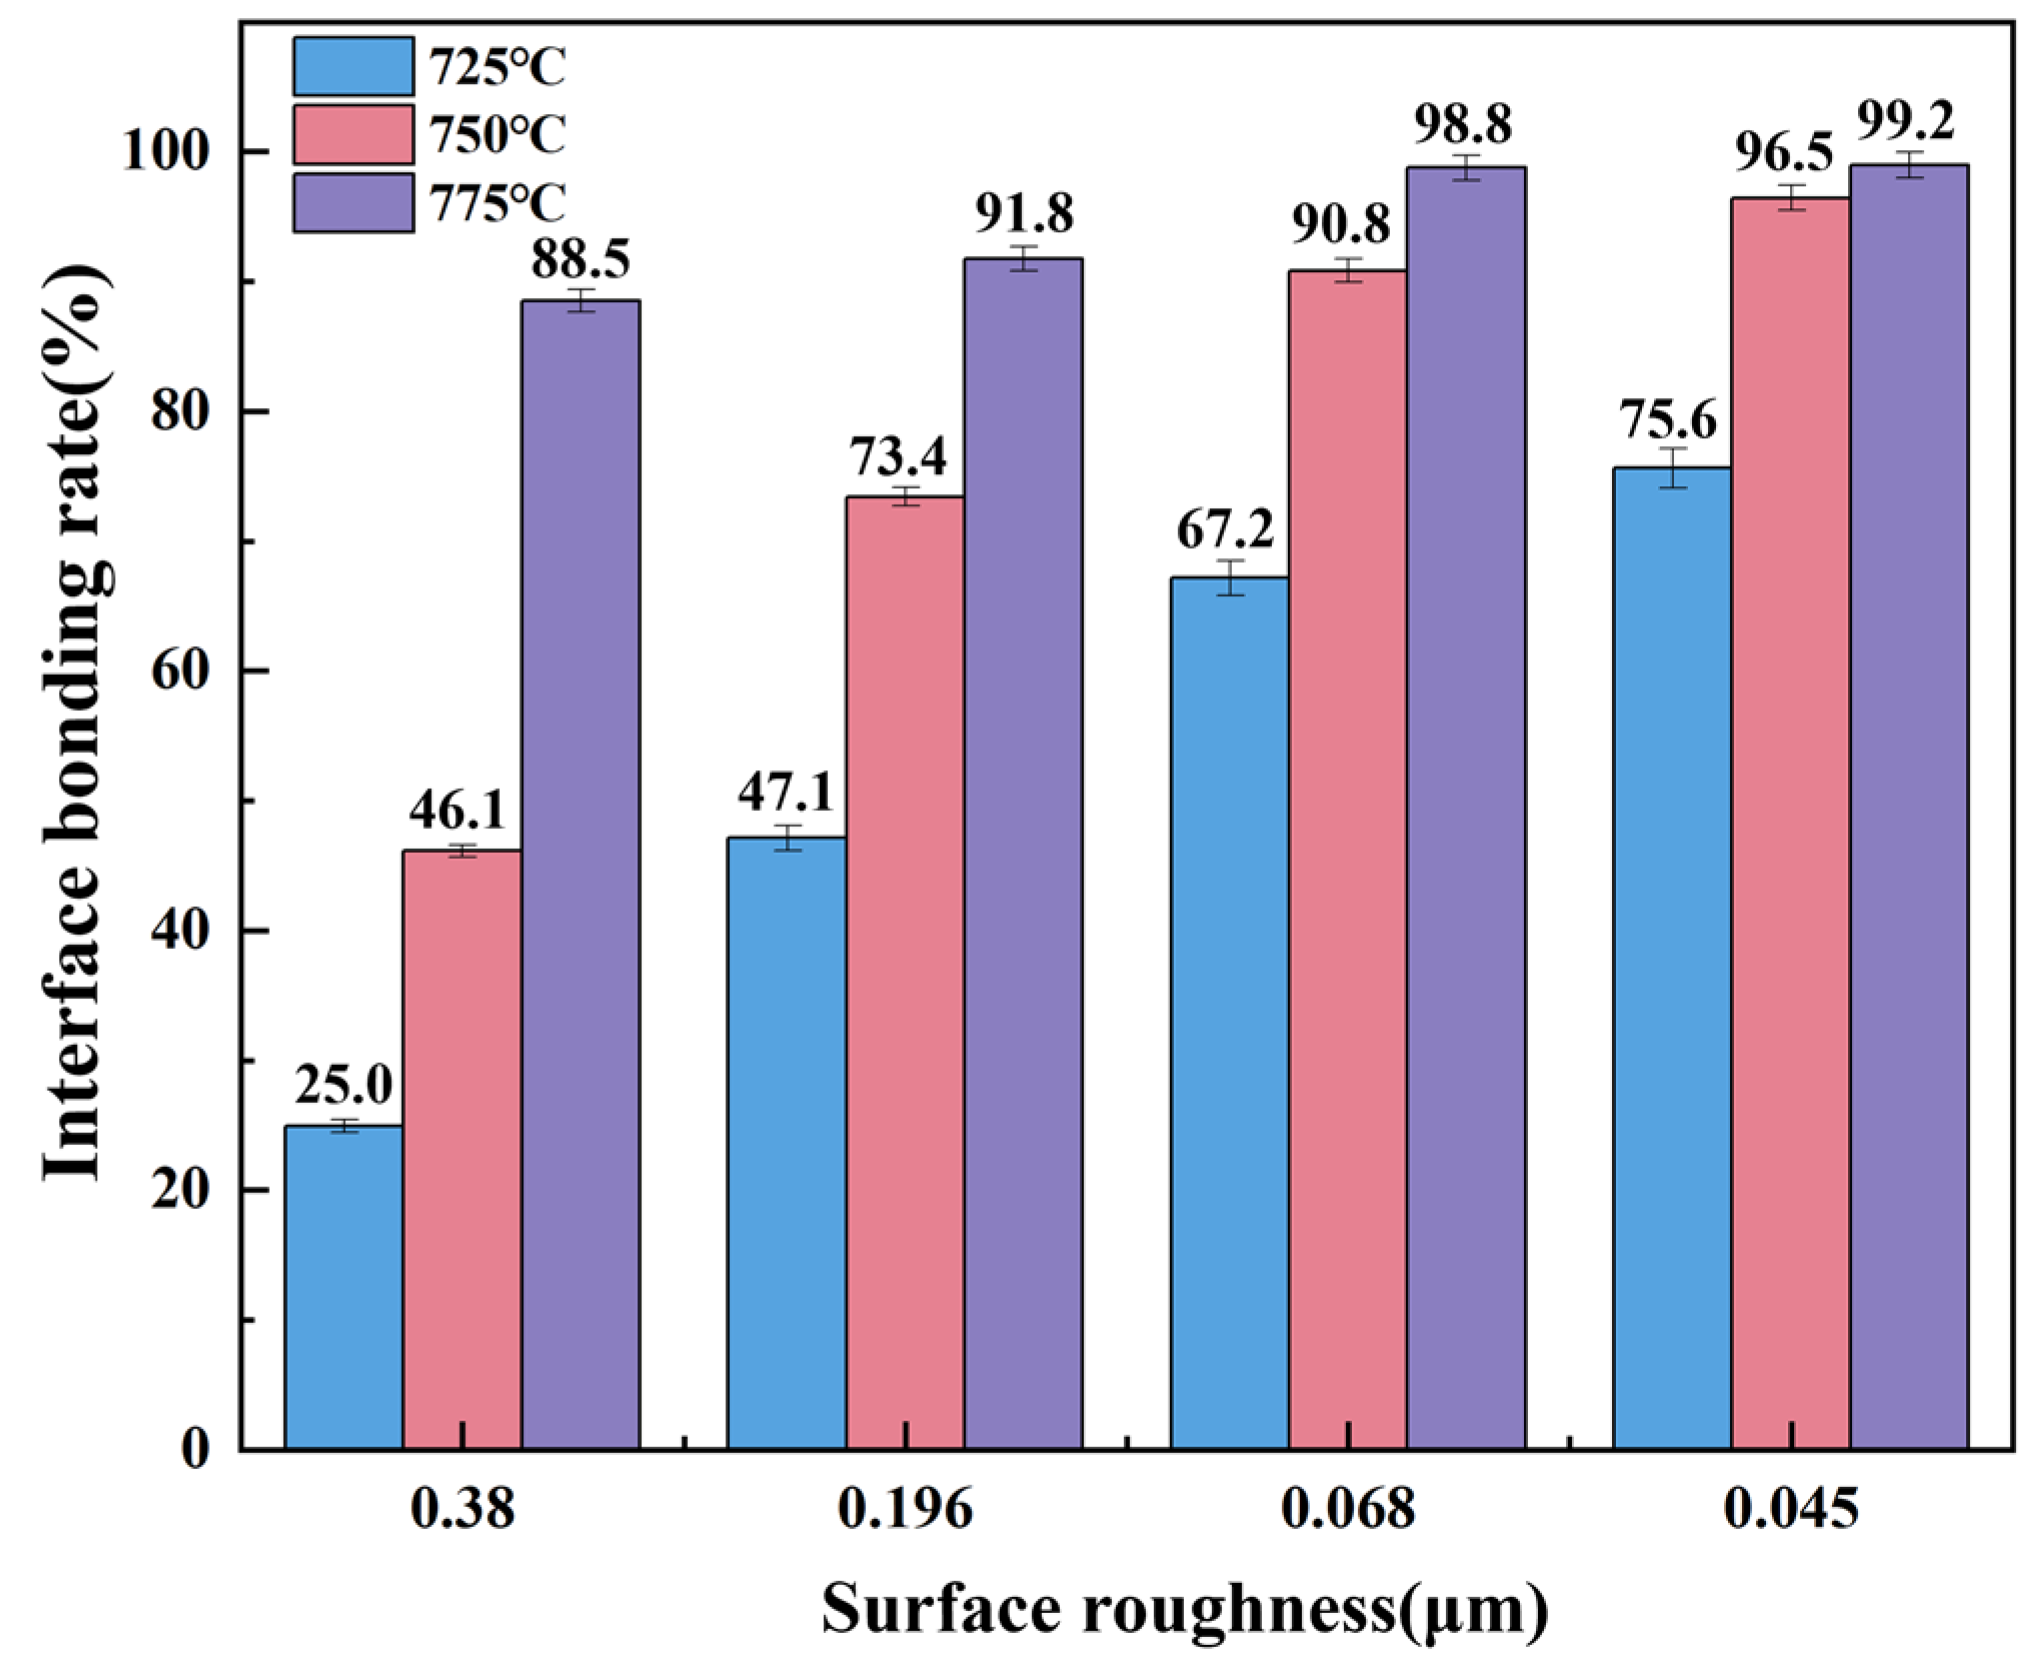
3.2.3. Interface Bonding Rate under Different Bonding Parameters

FESEM microscopy was used to evaluate the characteristics of interface bonding and study the influence of different bonding temperatures and surface roughness on the interface microstructure. The interface bonding rate was an important basis for judging the quality of diffusion bonding, indicating the degree of interface diffusion bonding. The high bonding rate means that the quality of the diffusion bond was better, which helped to improve the joint performance of the tensile shear load capacity. Nano-measure software was used to measure the size of SEM graphics and interface holes as well as the length of holes along the interface. A measurement diagram of the bonding rate is shown in Figure 10. Void length (horizontal length of pores along the interface) was represented by the sum of the length of the entire pore in the direction of the bonding interface. The calculation formula was as follows:
V o i d   l e n g t h = L 1 + L 2 + L 3 + + L n
L1, L2, L3… Ln is the length of a single hole, and the sum is the total length of the hole. The formula of interface bond rate was further calculated [22]:
i n t e r f a c e   b o n d i n g   r a t e = T o t a l   l e n g t h v o i d   l e n g t h T o t a l   l e n g t h × 100 %
The interface bonding rate was calculated under different surface roughness and bonding temperatures, as shown in Figure 11. At a bonding temperature of 725 °C, there were long pores and holes on the interface, and atomic diffusion was insufficient at this temperature. When the surface roughness Ra was 0.38 μm, the bonding rate was only 24.95%. The interface bonding rate increased with the decrease in surface roughness. When the bonding temperature was 775 °C, the interface bonding rate increased to 88.52%. When the surface roughness value was reduced to Ra 0.045 μm, the interface holes disappeared, the bonding rate reached 99.54%, and the joint interface achieved preferable diffusion bonding. The bonding rate increased with the increase in temperature. The atomic diffusion rate was positively correlated with temperature, and the creep rate was accelerated with the increase in temperature during the creep stage related to temperature and action time after plastic deformation was completed.
With the decrease in surface roughness, the bonding rate increased and the quality of interface bonding improved continuously. This is because the smaller roughness made the bonding interface’s ridge-to-ridge contact area larger and more conducive to the diffusion process of atoms. As a result, the bonding rate increased as the roughness decreased, making it easier to obtain a reliable metallurgical bond and obtain a reliable bonded joint. In addition, for the two groups of samples with a surface roughness of Ra 0.068 μm and Ra 0.045 μm, with the increase in bonding temperature in the temperature range of 750 °C to 775 °C, the growth rate of the interface bonding rate was slightly lower than that from 725 °C to 750 °C. It might be that the interfacial atomic energy suddenly increased at a critical temperature between 725 °C and 750 °C, which accelerated the diffusion process. In this temperature range, the flow stress of the material decreased rapidly, thus accelerating the creep process.
Based on the above results, the bonding process of the interface was analyzed with different surface roughness values, as shown in Figure 12. Under the same bonding temperature, the original contact area of the interface increases with the decrease in the surface roughness; the contact area of the bonding interface’s ridge-to-ridge area became larger with a smaller roughness value, which was conducive to the diffusion and migration of atoms, so that diffusion bonding was easier to achieve and reliable welded joints could be obtained. When the roughness was large, the pores generated by physical contact caused by pressure were large, which affected the degree of interface bonding in the diffusion process, as shown in Figure 12a. When the roughness was small, the pores formed in the physical contact stage were smaller, and the interface bonding degree was larger in the atomic diffusion stage. When the temperature was higher than 750 °C and the roughness was less than 0.068 µm, the interface achieved a good combination, and the final stainless steel interface bonding rate reached more than 98%.

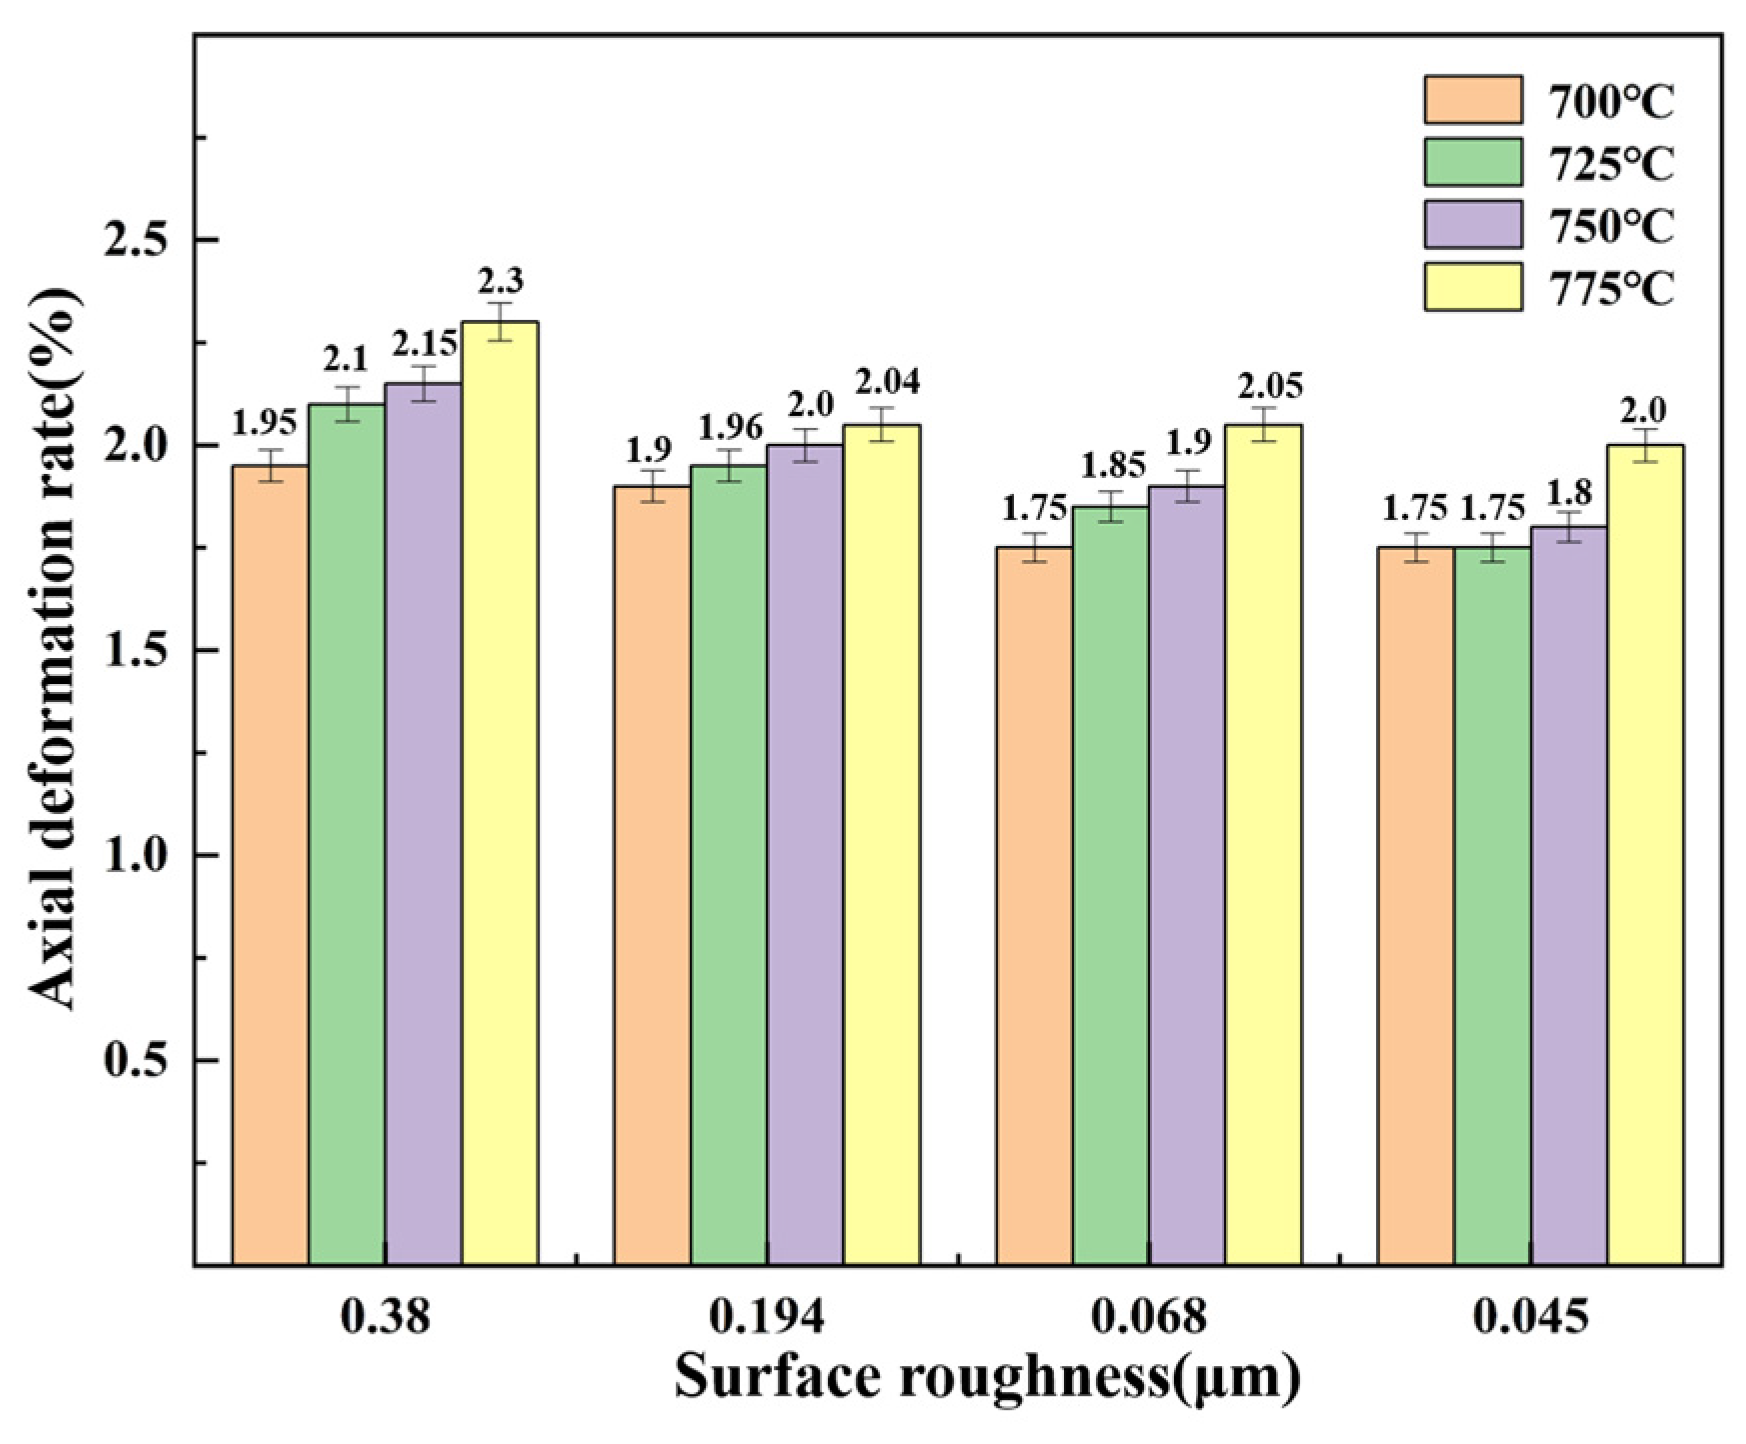
3.3. Axial Deformation Rate of Stainless Steel Diffusion-Bonded Joint

To fully study the formation and evolution mechanism of the diffusion bonding interface, it was necessary to study the axial deformation rate of the joint in the process of diffusion bonding. Due to the diffusion and migration of atoms at high temperatures and the plastic deformation caused by pressure during the diffusion bonding process, the sample would have different degrees of axial deformation. The axial height of the bonded sample was measured with a stereological microscope before and after bonding, and the bonding deformation rate of the sample was calculated by the following Formula (3):
ε = ( H 1 H 2 ) / H 1
where ε is the deformation rate, and H1 and H2 are the measured axial height of the sample before and after bonding, respectively.
The axial deformation rate of the joints after diffusion bonding is shown in Figure 13. Interestingly, at different bonding temperatures, the overall effect of different surface roughness on the axial deformation rate was not very large, but it showed a decreasing trend. The axial deformation rate of the sample increased and decreased by around 2.0% and only slightly changed at 775 °C. The axial deformation rate tended to decrease with the decrease in surface roughness. This might be because the smaller the initial pore half-height of the joint interface, the smaller the axial deformation through parallel ridge contact in the plastic deformation stage, i.e., the smaller the axial deformation rate. However, it is worth noting that less roughness would make the contact area between the bonding interface ridges larger, which is more conducive to the diffusion of atoms.

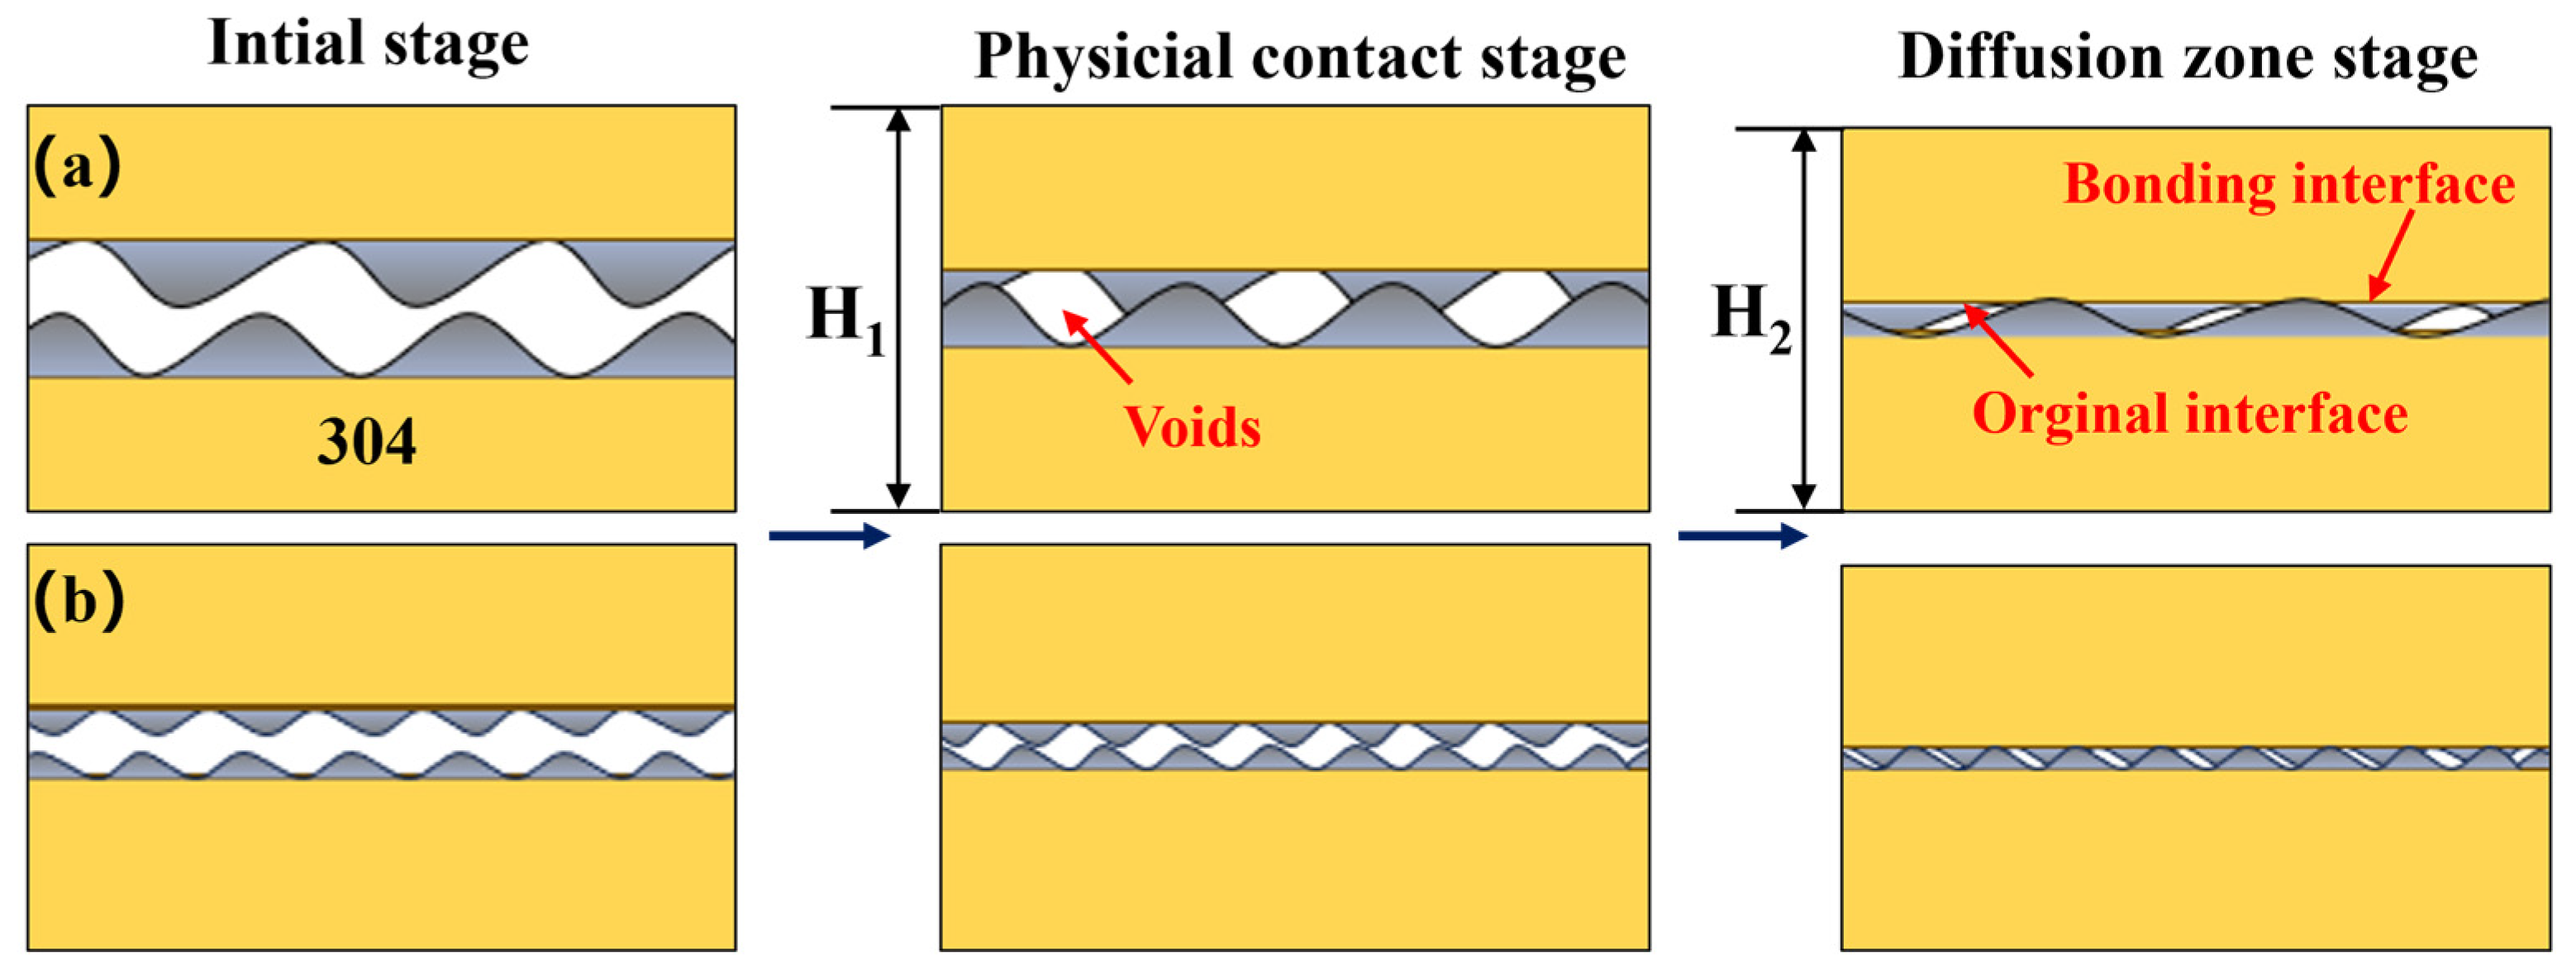
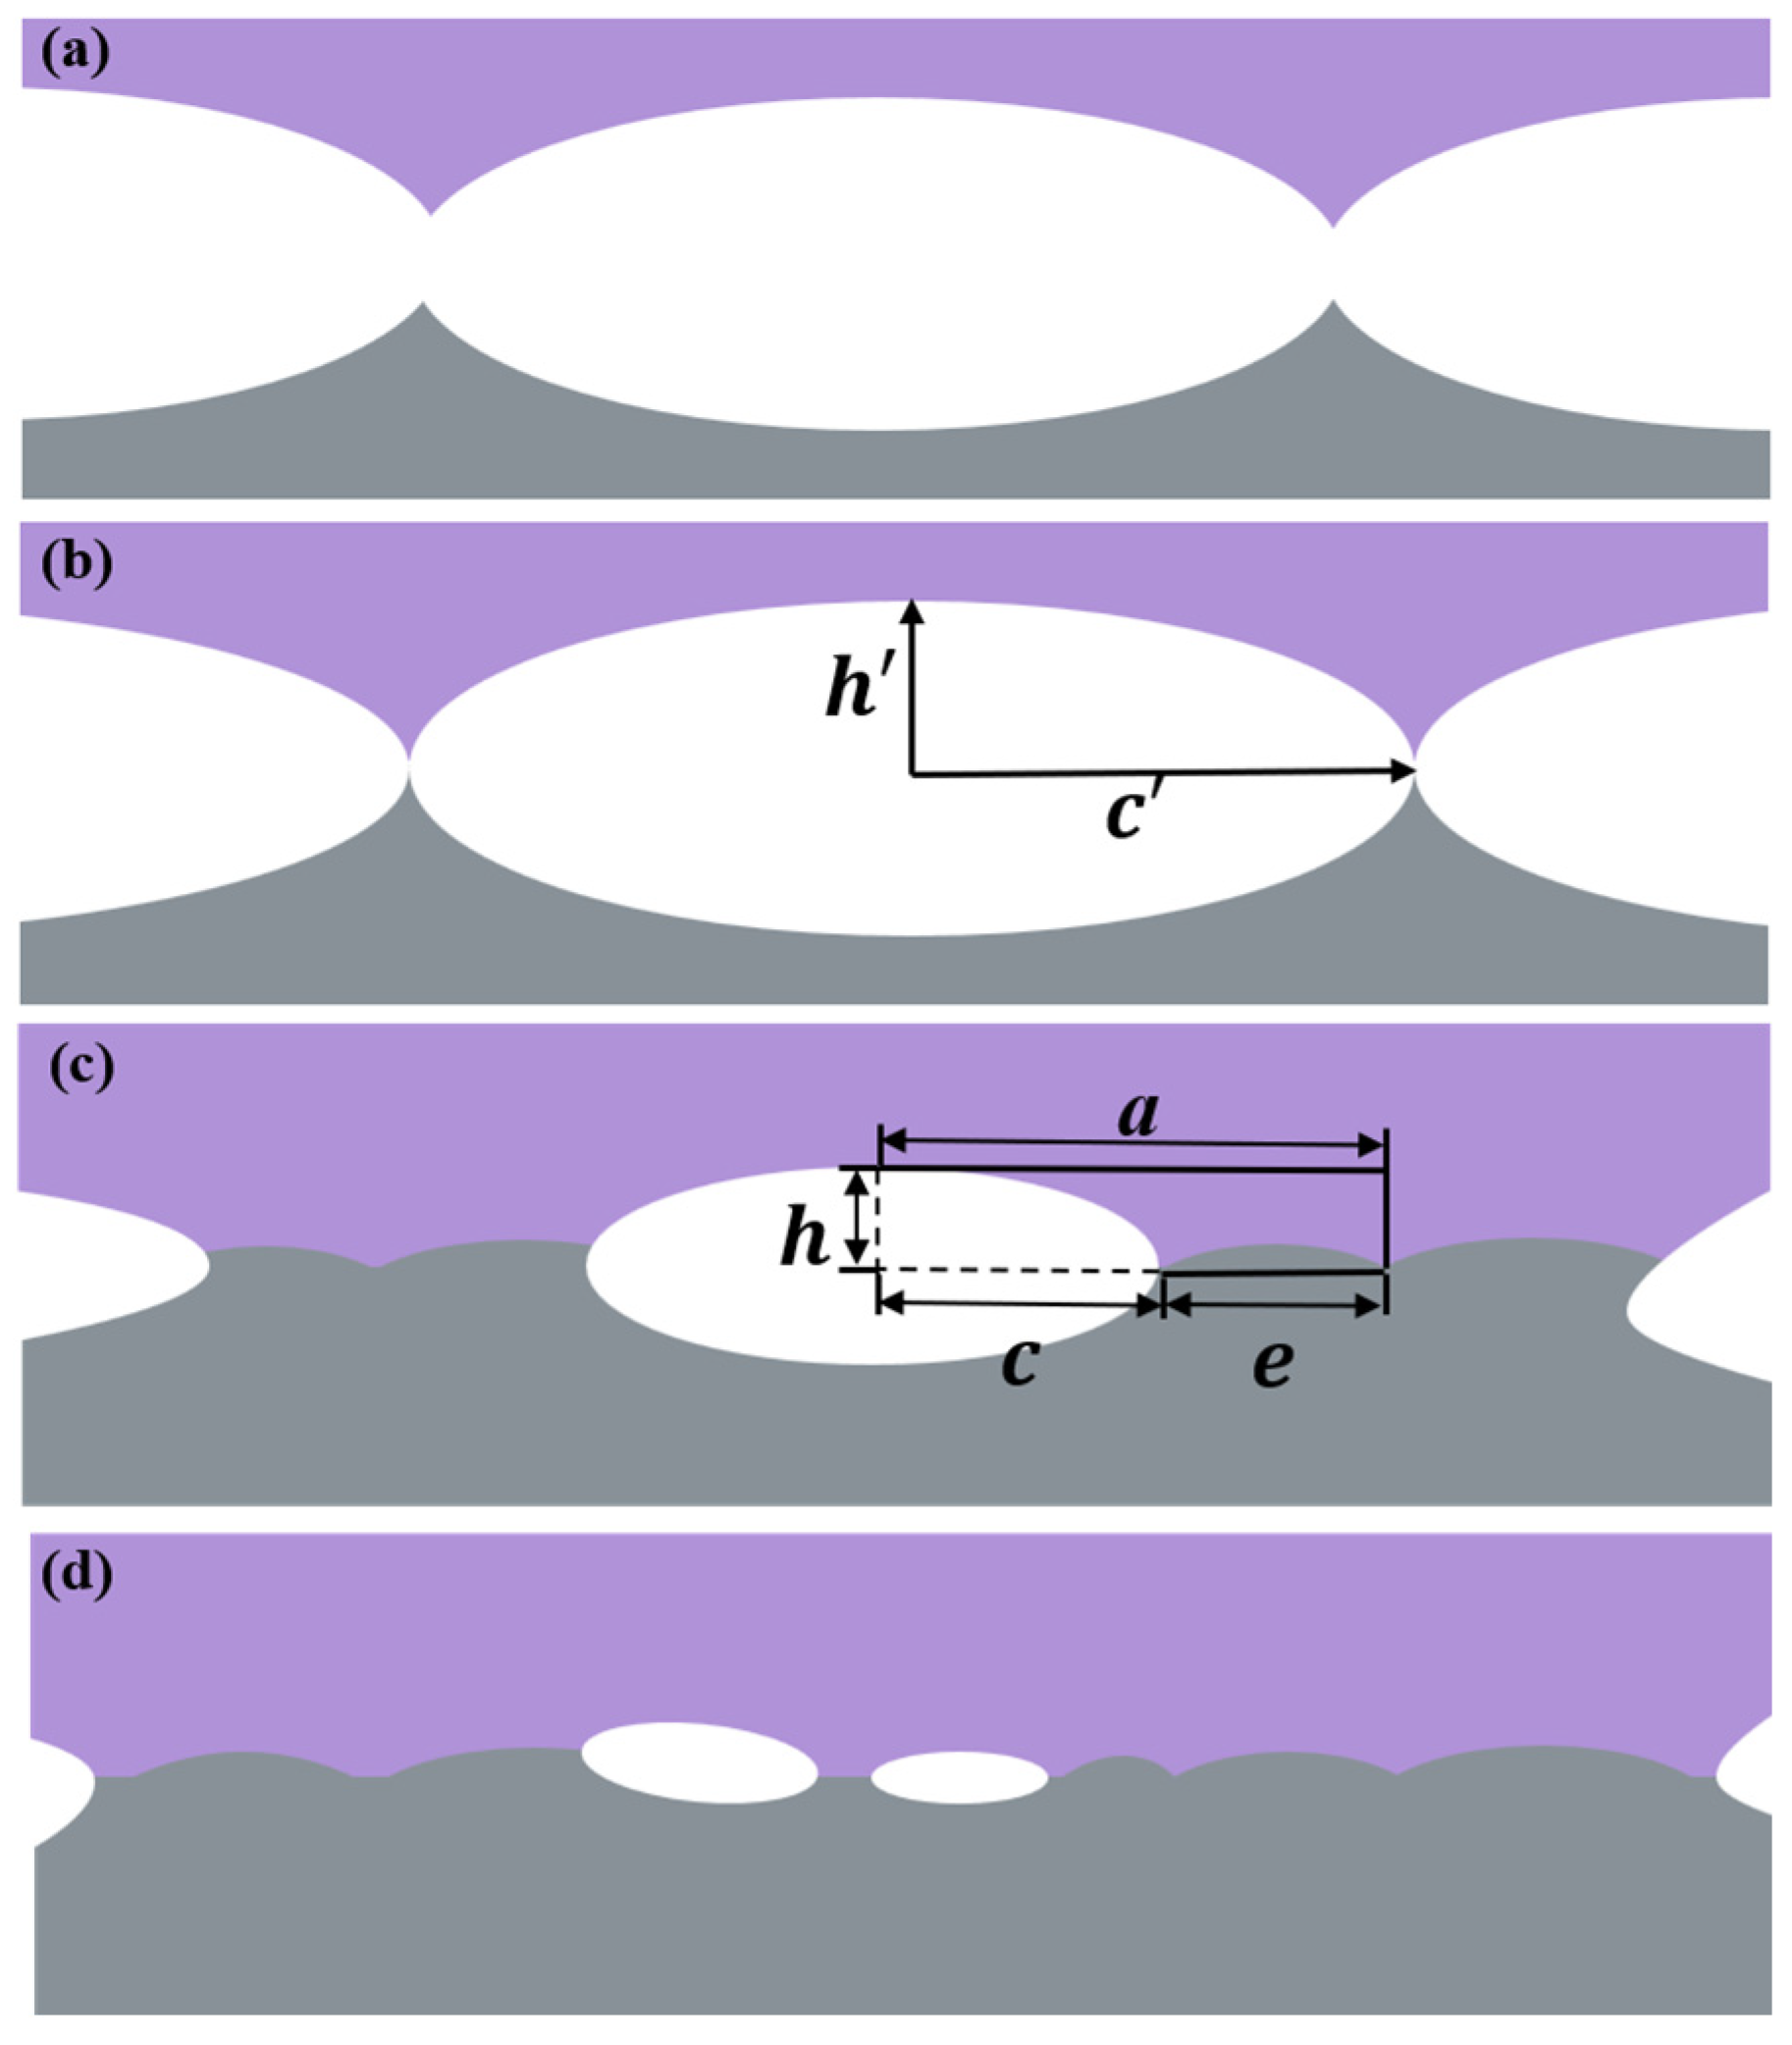
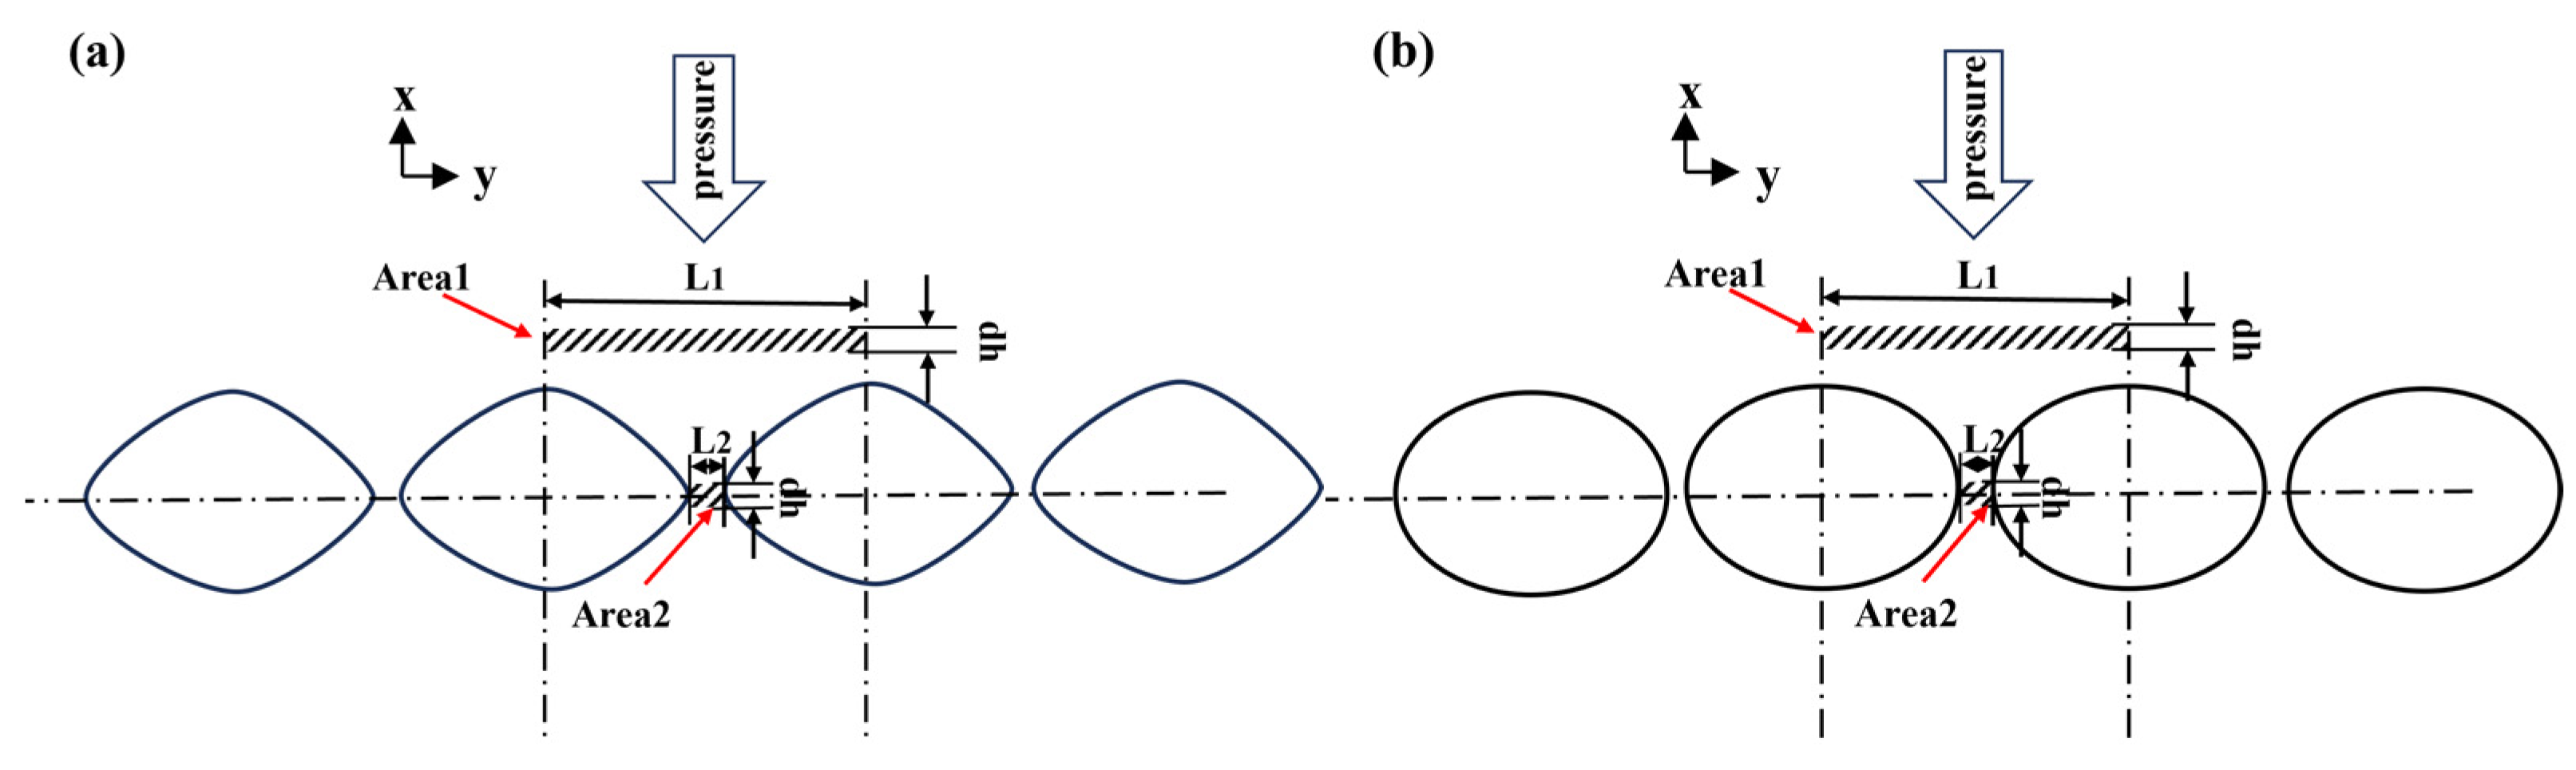
3.4. Mechanism of Hole Closure at Diffusion Bonding Interfaces

The limitation of the early proposed models for hole closure is that they include only a small subset of the many possible joining mechanisms [23] and are not generalizable by using a specific model applied to a particular metal or alloy. As a result, the following model is proposed to describe the hole closure mechanism. Hua [24] et al. proposed that the elliptical voids under EST will undergo elastic and plastic deformation phases when they are closed, and only a small amount of elastic deformation in the minor axis direction occurs in the elastic phase. In the plastic phase, the elliptical voids’ width decreases, compressing the surface of the voids so that it completes the bonding, and the bonding of the interfacial voids can be realized by decreasing the aspect ratio. In contrast, in this paper, the proposed model includes both plastic deformation mechanisms and creep mechanisms. In the plastic deformation stage, the interfaces contact each other under axial pressure and undergo a certain amount of plastic deformation, and in the creep stage, the atoms diffuse, leading to metallurgical bonding and therefore a reliable interfacial bond.

3.4.1. Mechanisms of Plastic Deformation

In contrast to the straight-edged ridges described in Derby & Wallach’s model [25], our research model suggests that the contact surface is composed of long triangular ridges, an assumption based on the appearance of grooved or machined surfaces and the heights and wavelengths of the contours of these ridges, which depend on the surface roughness resulting from the surface treatment techniques used before joining. The rate of diffusion bonding is thought to be such that the ridges of two adjacent surfaces make contact, flattening them to achieve close interfacial contact and, thus, bonding. The model used in this paper assumes that when the interface is joined, the two sets of ridge tips are in contact, forming a series of parallel elliptical cylinders of infinite lengths between them [26]. The modeling of the cross-sectional closure perpendicular to the longitudinal axis, by nature of its symmetry, requires that only a quarter of the elliptical cross-section be taken into account. Figure 14 shows the model of the parallel-section ridge. Ridge-to-ridge contact results in a maximum calculated joining time, and shorter joining times may occur in experiments.
The diffusion bonding process of austenitic stainless steel can be separated into two stages: the plastic deformation stage of hole formation and the shrinkage stage of the hole. The hole formation phase is transient and ceases when the contact area at the joint interface can support the applied load and the local stress on the ridge is reduced below the yield strength of the austenitic stainless steel. Subsequently, through plastic deformation and atomic diffusion, the interfacial holes shrink and disappear over time during the hole shrinking phase. At the beginning of diffusion bonding, the actual contact area of the bonding interface is much smaller than the theoretical contact area. In cases in which the stress at the actual bonding interface is greater than the maximum yield strength of the base material, plastic deformation will occur. Concerning the movement of the interface and the diffusion of atoms through the interface, it should be noted that the movement after the formation of the interface is a continuous process. In the plastic deformation stage, the upper surface is subjected to the action of external load, and the first contact is with the micro-convex on the two surfaces, followed by the other parts of the micro-convex. The interface is formed by the upper and lower parts, which coincides with the first part of the matched surface closure stage of the diffusion joining process without an intermediate layer, as proposed by Mo et al. [27]. When the stress at the joint interface is lower than the yield strength of the matrix, the plastic deformation ends. The plastic deformation stage will produce a large number of dislocations, which will cause the atoms to move violently along the dislocation tube at high temperatures [28].
In the subsequent creep stage, it is mainly affected by the bonding temperature, and a higher bonding temperature will generate more activation vacancies, which is conducive to the movement of atoms [29]. Atoms diffuse through an interface, a process by which atoms above and below the interface diffuse each other. The study by Zhang et al. [30] found that different heights of micro-protrusions lead to different degrees of atomic diffusion, especially for micro-protrusions of tens of microns or several microns, and differences in diffusion distances lead to different degrees of atomic diffusion.
Assuming that the ridges of the joint interface are in contact, the initial porosity of the joint interface can be represented as an ellipse, as shown in Figure 15b. The half-height h’ of the elliptical pore is approximately twice the value of Ra, and the half-length c’ of the elliptical pore is approximately 0.5 times the value of Rλq. Ra is the arithmetic mean surface profile difference and Rλq is the root mean square surface profile wavelength.
The dynamic conditions of the initial plastic deformation are as follows: when σ > σ Y , the initial plastic deformation stage starts; when σ = σ ¯ , the initial plastic deformation stage stops, where σ is the stress at the joint interface (MPa), σ Y is the yield strength of the material (MPa), and σ ¯ is the average stress at the joint interface (MPa).
As shown in Figure 15c,e is half the bond length in the joint interface. h and c represent half the height and half the length of the pore, respectively, and a is equal to the sum of e and c. The length of the pore is equal to the height of the pore. A circular pore can be considered as a special case of an elliptical pore where the height is equal to the length. Therefore, the stress at the interface is [17]
σ = p a γ e
where γ is the surface energy in (J/m2), and p is the diffusion bonding pressure in MPa.
During the initial phase of diffusion bonding, the actual bonding surface at the joint interface is very limited, which leads to stresses at the joint interface exceeding the yield strength of the material. As a result, the initial plastic deformation phase proceeds. Note that σ needs to be greater than 0, and p needs to be greater than γ/a.
If the slip line region near the joint interface is continuous, the interfacial stress through the hole is given by the following equation according to the slip line field theory [31]:
σ ( x ) = 2 K 1 + ln 1 + x r A
where K is the shear yield strength of the material (MPa), K = σ Y / 3 , and r A is the radius of curvature of the pore neck (μm). Therefore, the average stress in the joint interface is given by
σ ¯ = 0 e σ ( x ) d x e
It can be obtained by integrating the above equation:
σ ¯ = 2 K 1 + r A e ln 1 + e r A
where rA = h 2 / c and c = a e .
The initial plastic deformation mechanism is instantaneous and independent of the joining time. The initial plastic deformation stops when the stress in the joint interface is less than the yield strength of the material. In this case, when the plastic deformation ceases near the yield point, it is possible to calculate the height and joint length of the pores at the joint interface. In this way, the length of the bonded joint interface at the end of the initial plastic deformation can be calculated according to the following equation:
e y i e l d = p a γ 2 K 1 + h y i e l d 2 e y i e l d a e y i e l d ln 1 + e y i e l d a e y i e l d h y i e l d 2
According to the volume constancy during the initial plastic deformation of the materials at the joint interface, the pore height after the initial plastic deformation can be solved by the following equation:
h y i e l d = h a π 4 c a π 4 a e y i e l d
The iterative solution method can be used to calculate the pore height and joint length of the joint interface at the time of mechanism termination. In addition, the pore state after the initial plastic deformation determines the initial conditions of the other mechanisms.

3.4.2. Creep Mechanism

After the completion of plastic deformation, the creep phase occurs. The steady-state creep stage is the one that takes the longest time and contributes the most to the bonding rate. The strain rate ε ˙ in this stage was usually characterized by the BMD (Bird–Mukherjee–Dorn) [32] equation of Equation (10) or the SD (Sherby–Dorn) [33] equation of Equation (11) with the power-law form.
ε ˙ K T D E b = A b d P σ G n
D = D 0 e x p ( Q R T )
where A is a constant related to the material, E is the Young’s modulus, b is Platt’s vector, k is Boltzmann’s constant, T is the Kelvin temperature, σ is the applied stress, d is the grain diameter, p is the exponent of the reciprocal of a grain size, D is the diffusion coefficient, D0 is the frequency factor, Q is the diffusion activation energy, and R is the universal gas constant.
ε = C σ n ˙ e x p ( Q R T )
In general, BMD equations are useful in determining rate-controlling deformation mechanisms. BMD equations are essentially an extended form of the basic Norton equations (the basic Norton equations describe the relationship between strain rate and stress for elastic–plastic materials. Different mechanical properties of materials can be simulated by adjusting the rheological constant η. These equations are widely used in the field of materials science and engineering to study and analyze the elastic–plastic behavior of various materials). The creep parameters n, p, and Q are commonly used to determine the working creep mechanism.
To analyze the role of the creep mechanism in the process of diffusion bonding interface hole closure, this paper establishes a two-dimensional model of diffusion bonding interface holes, as shown in Figure 16, on the basis of the following assumptions:
(1) Diffusion-bonded joints, regardless of the geometry of the interface holes, can be divided into two typical regions based on force characteristics. Region 1 is a certain distance from the bonding interface and does not contain interface holes; the stress in this region is the nominal stress of bonding, so the deformation of it and the bonded part of the overall macro-deformation are the same. Region 2 is the interface bonding zone; the length of the region’s changes are equal to the plastic deformation and creep mechanism of the role of the bonding rate.
(2) At a given stage t1 of the bonding process, the lengths of region 1 and region 2 are l1 and l2, respectively, and the thicknesses of both regions are unit thickness dh.
(3) During the interfacial bonding process, regions 1 and 2 always have the same organization (phase composition, grain size, etc.) and are at the same temperature.
(4) In the analysis of the creep mechanism, the stage that contributes most to closing the holes in the diffusion bonding interface and deforming the workpiece, the minimum strain rate stage is used to describe the entire creep stage, the initial stage of decreasing creep rate is ignored, and the third stage of increasing creep rate is ignored.
(5) the effect of the volume change in the interface holes on the macroscopic thickness of the workpiece is neglected; this is due to the fact that in the thickness direction of the vertical bonded line (the y direction shown in Figure 15a,b), the size of the region containing the interface holes is generally only 0.1 μm~10 μm, which is much smaller than the size of the workpiece to be bonded (generally more than 10 mm).
Based on the assumed conditions (1) and (2), it is known that the interfacial bonding ratio δ of the specimen at the moment t = t1 during the interfacial bonding process can be expressed as
f = l 2 / l 1
The interfacial bonding ratio δ will directly affect the ratio of strain rates in regions 1 and 2. Based on the assumption (3), it can be seen that regardless of whether one of the configurations in Equation (10) or Equation (11) is used, the ratio of strain rates in region 1 and region 2 to the interfacial compressive stress in the direction of bonding pressure (in the y-direction in Figure 16) is as follows:
ε ˙ 1 / ε ˙ 2 = σ 1 / σ 2 n
where ε ˙ i (i =1, 2) is the compressive strain rate of region i in the direction of the bonding pressure, and σi is the compressive stress applied to the interface in that direction.
Under constant bonding pressure, σ 1 / σ 2 can be expressed under two-dimensional conditions according to the length relationship of the region shown in Figure 16:
σ 1 / σ 2 = l 2 / l 1
By substituting Equations (13) and (15) into Equation (14), the following can be obtained:
ε ˙ 1 / ε ˙ 2 = f n
Based on the definitions of strain and strain rate, it can be seen that the strain rate ε ˙ 1 , ε ˙ 2 in regions 1 and 2 of the creep phase can be expressed as
ε ˙ 1 = 1 l 1 d l 1 d t
ε ˙ 2 = 1 l 2 d l 2 d t
This is obtained by substituting Equation (13) into Equation (18):
ε ˙ 2 = 1 f l 1 d f l 1 d t = 1 f d f d t + 1 l 1 d l 1 d t
Substituting Equations (16) and (18) into Equation (19) gives the following:
ε ˙ 1 f n = 1 δ d f d t + ε ˙ 1
The strain rate ε ˙ 1 in region 1 of Equation (20) is actually a variable of time t. This results in a small change in the compressive stress σ1 in region 1, since the deformation of the bonded part during the diffusion bonding process tends to be small (less than 5%). On the other hand, the strain rate ε ˙ 1 in region 1 varies less because the bonding temperature T remains constant for a general diffusion bonding process, as shown by the creep eigen structure Equation (10) or Equation (11). For computational convenience, the initial strain rate ε ˙ 10 of the creep process is used to replace the variable ε ˙ 1 of t in Equation (20), and Equation (20) can be rewritten as
ε ˙ 10 f n = 1 δ d f d t + ε ˙ 10
For a particular process of the diffusion bonding interface, since the bonded workpiece has a definite material, dimensions, bonding temperature T, and bonding load P, it is clear from Equation (10) or (11) that ε ˙ 10 in Equation (20) is a constant. Equation (20) is a simple differential equation of the bonding rate δ around t. Solving Equation (21) based on the method of separated variables yields
n ε ˙ 10 t = ln 1 f n 1 + C
where C is the constant of integration.
This is because at the initial moment of creep, at the moment t = 0, the bonding rate of the interface depends on the closure rate produced by the plastic mechanism, f = fP. Based on this initial condition, it is known that
C = ln 1 f P n
Substituting Equation (23) into Equation (22), the following relationship between the bonding rate δ and ε ˙ 10 can be obtained:
1 f p n 1 f n = e n t ε ˙ 10
In addition, since the diffusion bonding process is a slow micro-strain process, the strain rate hardly varies with time and can be considered a uniform strain process. The term ( ε ˙ 10 t ) in Equation (24) can be equated to the strain generated in the specimen during interfacial bonding ε, from which Equation (24) can be written as
1 f P n 1 f n = e n ε
Finally, δ P = σ P σ T is brought into Equation (25) to obtain an expression of the bonding rate in the deformation regime:
1 f n = 1 σ P σ T n e n ε
This expression provides a quantitative relationship between the interface bonding rate δ produced by the deformation mechanism and the deformation rate ε of the specimen. The definition and units of variables in the above equation are shown in Table 3.
From this, it can be found that the influence of the bonding rate and deformation rate is related to the material’s own high-temperature yield strength σT and the material’s own constant n in addition to the selected bonding compressive stress and bonding temperature. Interfacial bonding experiments were conducted with different roughness values, using Equation (26), and although the deformation mechanism was not affected by the surface roughness, the contact area of the interfacial atom diffusion bonding interface became larger and more conducive to the diffusion of interfacial atoms as the surface roughness decreased. It can be illustrated that at the stage of the deformation mechanism, the surface roughness did not have an effect, but at the stage of diffusion of atoms at the interface, the smaller the roughness, the larger the contact area between the ribs and ridges of the joining interface, which is more conducive to the diffusion of atoms. Thus, in specimens with different interface roughness and under the same bonding conditions, the smaller the surface roughness, the greater the interface bonding rate, and the specimen deformation rate is reduced.

4. Conclusions

Vacuum diffusion bonding of the 304 austenitic stainless steel was carried out with different surface roughness values and bonding temperatures. The microstructure at the bonded interface was analyzed. The influence of surface roughness and bonding temperature on interfacial void evolution, bonding rate, and axial deformation rate was studied. The effects of different surface roughness and temperature on the mechanism of hole closure are revealed. The main conclusions are as follows:
(1) The average void size of the interface decreased to less than 0.5 μm as the surface roughness Ra decreased from 0.38 μm to 0.045 μm. The void and defect sizes of the interface decreased significantly with the increase in the bonding temperature. The bonding rate gradually increased with the decrease in the surface roughness (Ra) value, and the bonding rate reached more than 95% with a surface roughness value of 0.045 μm at 750 °C.
(2) The element distribution was balanced, and Fe, Cr, Mn, Ni and other elements were uniformly diffused on the interface. At the stage of interfacial atom diffusion, the smaller roughness increased the contact area between the ridge and the crest of the bonding interface, which was more helpful for the atom diffusion process; and consequently, the bonding rate increased.
(3) The overall effect of surface roughness on the axial deformation rate was not very large, but it had a tendency to become smaller; when the surface roughness Ra was 0.38 μm, the axial deformation rates at 700 °C, 725 °C, 750 °C, and 775 °C bonding temperatures were 1.95%, 2.1%, 2.15%, and 2.3%, respectively. When the surface roughness Ra was 0.045 μm, the axial deformation rates at 700, 725, 750, and 775 °C bonding temperatures were 1.75%, 1.75%, 1.8%, and 2.0%, respectively.
(4) Mathematical equations of interface bonding rate δ and axial deformation rate ε were established within the range of parameters studied, and it was found that the factors affecting the interfacial bonding rate and deformation rate were related to the high-temperature yield strength of the material and the constant of the material in addition to the selected compressive stress and bonding temperature.

Author Contributions

Validation, M.M.; Investigation, S.Z. and L.J.; Resources, Q.L.; Data curation, L.J. and Q.L.; Writing—original draft, S.Z.; Writing—review & editing, Y.W.; Visualization, Y.W.; Supervision, M.M. All authors have read and agreed to the published version of the manuscript.

Funding

This work was supported by the GF project (No. 80923020104) and the Natural Science Basic Research Program of Shaanxi (No. 2023-JC-YB-311).

Data Availability Statement

All data are included in the article.

Acknowledgments

Thanks to Yaru Li and Linghao for their contribution to the data analysis.

Conflicts of Interest

We declare that we do not have any commercial or associative interests that represent a conflict of interest in connection with the work submitted. All authors of this manuscript have directly participated in the planning, execution, and/or analysis of this study. The contents of this manuscript are not now under consideration for publication elsewhere and have not been published previously.

References

  1. Saranam, V.R.; Mullany, B.; Tabei, A.; Srenevas, S.; Evans, C.; Paul, B.K. Surface topographical effects in the diffusion bonding of 316 stainless steel. J. Mater. Process. Technol. 2021, 296, 117173. [Google Scholar] [CrossRef]
  2. Lin, T.; Li, C.; Chen, Y.; Chen, L.; Si, X.; Qi, J.; Cao, J. Role of nanostructured Ni surface layer in enhanced Hastelloy alloy diffusion bonding at temperatures far beyond recrystallization. Scr. Mater. 2024, 239, 115826. [Google Scholar] [CrossRef]
  3. Li, W.; Liang, Y.; Bai, Y.; Lin, T.; Li, B.; Fu, Z.; Feng, J. Realizing high-strength diffusion bonding of copper at ultra-low temperatures via single point diamond turning and spark plasma sintering. Mater. Sci. Eng. A 2022, 857, 144116. [Google Scholar] [CrossRef]
  4. Yang, J.; He, Y.; Zhang, X.; Yang, W.; Li, Y.; Li, X.; Chen, Q.; Chen, X.; Du, K.; Yan, Y. Improving the electrical conductivity of copper/graphene composites by reducing the interfacial impurities using spark plasma sintering diffusion bonding. J. Mater. Res. Technol. 2021, 15, 3005–3015. [Google Scholar] [CrossRef]
  5. Huang, W.C.; Tsai, C.H.; Lee, P.T.; Kao, C. Effects of bonding pressures on microstructure and mechanical properties of silver–tin alloy powders synthesized by ball milling for high-power electronics packaging. J. Mater. Res. Technol.-JMRT 2022, 19, 3828–3841. [Google Scholar] [CrossRef]
  6. Dunkerton, S.B. Diffusion bonding—An overview. In Diffusion Bonding 2; Springer: Berlin/Heidelberg, Germany, 1991; pp. 1–12. [Google Scholar] [CrossRef]
  7. Singh, A.K.; Quraishi, M. The effect of some bis-thiadiazole derivatives on the corrosion of mild steel in hydrochloric acid. Corros. Sci. 2010, 52, 1373–1385. [Google Scholar] [CrossRef]
  8. Ghelichkhah, Z.; Dehkharghani, F.K.; Sharifi-Asl, S.; Obot, I.; Macdonald, D.D.; Farhadi, K.; Avestan, M.S.; Petrossians, A. The inhibition of type 304LSS general corrosion in hydrochloric acid by the New Fuchsin compound. Corros. Sci. 2021, 178, 109072. [Google Scholar] [CrossRef]
  9. Li, Q.; Li, J.; He, G. Compressive properties and damping capacities of magnesium reinforced with continuous steel wire. Mater. Sci. Eng. A-Struct. Mater. Prop. Microstruct. Process. 2017, 680, 92–96. [Google Scholar] [CrossRef]
  10. Hinojos, A.; Mireles, J.; Reichardt, A.; Frigola, P.; Hosemann, P.; Murr, L.E.; Wicker, R.B. Joining of Inconel 718 and 316 Stainless Steel using electron beam melting additive manufacturing technology. Mater. Des. 2016, 94, 17–27. [Google Scholar] [CrossRef]
  11. Gietzelt, T.; Toth, V.; Huell, A.; Messerschmidt, F.; Dittmeyer, R. Systematic Investigation of the Diffusion Welding Behavior of the Austenitic Stainless Steel 304. Adv. Eng. Mater. 2014, 16, 1381–1390. [Google Scholar] [CrossRef]
  12. Kurt, B.; Orhan, N.; Kaya, M. Interface characterisation of diffusion bonded Ti–6Al–4V alloy and austenitic stainless steel couple. Mater. Sci. Technol. 2009, 25, 556–560. [Google Scholar] [CrossRef]
  13. Gao, D.; Li, C.; Zhang, C.; Yang, B.; Lin, T.; Chen, L.; Si, X.; Qi, J.; Cao, J. Microstructure and wettability of the micro-laminated Ti6Al4V/304 stainless steel composite fabricated by diffusion bonding. J. Mater. Res. Technol. 2023, 27, 3788–3796. [Google Scholar] [CrossRef]
  14. Zhang, Q.; Yu, M.; Zhang, B.; Li, H. Growth behavior of interface microstructure between stainless steel and carbon steel during bonding process. Mater. Today Commun. 2022, 33, 104647. [Google Scholar] [CrossRef]
  15. Li, P.; Li, C.; Dong, H.; Wu, B.; Ma, Y.; Zou, C.; Yang, Y. Vacuum diffusion bonding of TC4 titanium alloy to 316L stainless steel with AlCoCrCuNi2 high-entropy alloy interlayer. J. Alloys Compd. 2022, 909, 164698. [Google Scholar] [CrossRef]
  16. Gietzelt, T.; Walter, M.; Toth, V.; Messerschmidt, F.; Blem, M. Comprehensive study of the influence of the bonding temperature and contact pressure regimes during diffusion bonding on the deformation and mechanical properties of AISI 304. Adv. Eng. Mater. 2021, 23, 2100188. [Google Scholar] [CrossRef]
  17. Li, H.; Li, M.Q.; Kang, P.J. Void shrinking process and mechanisms of the diffusion bonded Ti–6Al–4V alloy with different surface roughness. Appl. Phys. A 2016, 122, 18. [Google Scholar] [CrossRef]
  18. Ma, R.F.; Li, M.Q.; Li, H.; Yu, W.X. Modeling of void closure in diffusion bonding process based on dynamic conditions. Sci. China Technol. Sci. 2012, 55, 2420–2431. [Google Scholar] [CrossRef]
  19. Negemiya, A.A.; Rajakumar, S.; Balasubramanian, V. High-temperature diffusion bonding of austenitic stainless steel to titanium dissimilar joints. Mater. Res. Express 2019, 6, 066572. [Google Scholar] [CrossRef]
  20. Dwivedi, D.K. Dissimilar Metal Joining; Springer Nature: Dordrecht, The Netherlands, 2023; pp. 245–267. [Google Scholar]
  21. Leo, J.R.d.O.; Fitzpatrick, M.E. Development of a Diffusion Bonding Route for Joining Oxide-Dispersion-Strengthened (ODS) Steels for Nuclear Applications. Metall. Mater. Trans. A-Phys. Metall. Mater. Sci. 2024, 55, 827–838. [Google Scholar] [CrossRef]
  22. Sharma, G.; Dwivedi, D.K. Diffusion bonding of 304 austenitic stainless-steel using pressure pulses. Mater. Today 2021, 44, 2135–2141. [Google Scholar] [CrossRef]
  23. Ferguson, B.; Ramulu, M. Surface tracking of diffusion bonding void closure and its application to titanium alloys. Int. J. Mater. Form. 2020, 13, 517–531. [Google Scholar] [CrossRef]
  24. Hua, L.; Liu, Y.; Qian, D.; Xie, L.; Wang, F.; Wu, M. Mechanism of void healing in cold rolled aeroengine M50 bearing steel under electroshocking treatment: A combined experimental and simulation study. Mater. Charact. 2022, 185, 111736. [Google Scholar] [CrossRef]
  25. Derby, B.; Wallach, E.R. Theoretical model for diffusion bonding. Met. Sci. 1982, 16, 49–56. [Google Scholar] [CrossRef]
  26. Hill, A.; Wallach, E. Modelling solid-state diffusion bonding. Acta Met. 1989, 37, 2425–2437. [Google Scholar] [CrossRef]
  27. Mo, D.-F.; Song, T.-F.; Fang, Y.-J.; Jiang, X.-S.; Luo, C.Q.; Simpson, M.D.; Luo, Z.-P. A Review on Diffusion Bonding between Titanium Alloys and Stainless Steels. Adv. Mater. Sci. Eng. 2018, 2018, 8701890. [Google Scholar] [CrossRef]
  28. Cao, M.; Wang, C.-J.; Deng, K.-K.; Nie, K.-B.; Liang, W.; Wu, Y.-C. Effect of interface on mechanical properties and formability of Ti/Al/Ti laminated composites. J. Mater. Res. Technol.-JMRT. 2021, 14, 1655–1669. [Google Scholar] [CrossRef]
  29. Sauvage, X.; Dinda, G.; Wilde, G. Non-equilibrium intermixing and phase transformation in severely deformed Al/Ni multilayers. Scr. Mater. 2007, 56, 181–184. [Google Scholar] [CrossRef]
  30. Zhang, Z.; Chen, J.; Wang, J.; Han, Y.; Yu, Z.; Wang, Q.; Zhang, P.; Yang, S. Effects of solder thickness on interface behavior and nanoindentation characteristics in Cu/Sn/Cu microbumps. Weld. World 2022, 66, 973–983. [Google Scholar] [CrossRef]
  31. Chen, H.; Cao, J.; Liu, J.; Song, X.; Feng, J. Contributions of atomic diffusion and plastic deformation to the diffusion bonding of metallic glass to crystalline aluminum alloy. Comput. Mater. Sci. 2013, 71, 179–183. [Google Scholar] [CrossRef]
  32. Johnson, W.; Sowerby, R.; Venter, R.D. Plane-Strain Slip-Line Fields for Metal-Deformation Processes; British Library Cataloguing in Publication Data; British Library: London, UK, 2013. [Google Scholar] [CrossRef]
  33. Sargent, P.M.; Ashby, M.F. Deformation maps for titanium and zirconium. Scr. Met. 1982, 16, 1415–1422. [Google Scholar] [CrossRef]
Figure 1. Schematic diagram of the experimental process: (a) assembly schematic diagram, (b) interface structure design, (c) process parameters.
Metals 14 00812 g001
Figure 2. Optical micromorphology and laser confocal images of stainless steel surfaces with different roughness after grinding with SiC sandpaper (a,a1) 100#, (b,b1) 400#, (c,c1) 800#, (d,d1) 1500#.
Metals 14 00812 g002
Figure 3. The morphology of the diffusion bonding interface using different surface roughness values and bonding temperatures (a1a4) 700 °C-100#, 400#, 800#, 1500#, (b1b4) 725 °C-100#, 400#, 800#, 1500#, (c1c4) 750 °C-100#, 400#, 800#, 1500#, (d1d4) 775 °C-100#, 400#, 800#, 1500#.
Metals 14 00812 g003
Figure 4. The micromorphology of the sample after polishing with 800-grit sandpaper at different temperatures: (a,b) 725 °C, (c,d) 775 °C.
Metals 14 00812 g004
Figure 5. The microstructure of the diffusion-bonded interface at 750 °C with different surface roughness values: (a,b) 400#, (c,d) 1500#.
Metals 14 00812 g005
Figure 6. The microstructure and interface defects of the joint prepared at different temperatures with different surface roughness values (ad) 725 °C-100#, 400#, 800#, 1500#, (eh) 750 °C-100#, 400#, 800#, 1500#, (il) 775 °C-100#, 400#, 800#, 1500#.
Metals 14 00812 g006
Figure 7. High-magnification electron microscope images of defects with different shapes (aa1) large visible holes, (bb1) linear unbonded, (cc1) micropore.
Metals 14 00812 g007
Figure 8. Element analysis of bonding interface shown through (a,b) element line scanning, (ch) surface scanning position, and element distribution.
Metals 14 00812 g008
Figure 9. Element analysis of the incompletely bonded interface (af): surface scanning position and element distribution.
Metals 14 00812 g009
Figure 10. Hole length measurement method diagram.
Metals 14 00812 g010
Figure 11. The bonding rate of the joint interface with different surface roughness values and bonding temperatures.
Metals 14 00812 g011
Figure 12. Diagram of diffusion interface bonding with different surface roughness values (a) large surface roughness, (b) small surface roughness.
Metals 14 00812 g012
Figure 13. Axial deformation rate of diffusion-bonded joints with different roughness values and bonding temperatures.
Metals 14 00812 g013
Figure 14. Modeling representation of parallel ridges in section.
Metals 14 00812 g014
Figure 15. Stages of pore closure: (a) the surface geometry of the sample prior to diffusion bonding, when the upper and lower interfaces have not yet bonded to each other; (b) the initial geometry at the pore formation stage, when contact between the ridges occurs; (c) interface pore geometry after the pore formation stage, when grain growth and recrystallization beyond the interface have occurred; and (d) pore geometry during the pore closure stage.
Metals 14 00812 g015
Figure 16. Modeling of interfacial pores under deformation mechanisms: (a) sine wave model, (b) elliptic model.
Metals 14 00812 g016
Table 1. Chemical composition (wt%) of the 304 SS substrates.
Chemical ElementsFeCrNiMnSiCPS
ConcentrationBal.18.38.52.01.00.080.0450.030
Standard rangesBal.18.00~20.008.00~11.002.01.00.080.0450.030
Table 2. Surface roughness parameters of samples ground with different SiC sandpapers.
SampleGrit of SiC Paper Ra   ( μ m ) Sq   ( μ m )
1100#0.380.52
2400#0.1940.235
3800#0.0680.101
41500#0.0450.07
Table 3. The definition and units of variables in the above equation.
Nomenclature
Ra the   arithmetic   mean   roughness ,   μ m εthe deformation rate, %
Sq square   deviation   of   the   contour   surface ,   μ m Rλqsquare surface profile wavelength
#grit of SiC paper σ Y the yield strength of the material, MPa
Void lengthhorizontal length of pores along the interface σ the stress at the joint interface, MPa
H1sample axial height before bonding, mm σ ¯ the average stress at the joint interface, MPa
H2sample axial height after bonding, mmhhalf the height of the pore
ehalf the bond length in the joint interfacechalf the length of the pore
aequal to the sum of e and ch’half-height of the elliptical pore
γthe surface energy, (J/m2)pbonding load, MPa
Kthe shear yield strength of the material, MPa r A the   radius   of   curvature   of   the   pore   neck ,   μ m
Aa constant related to the material E Young’s modulus
bPlatt’s vectorkBoltzmann’s constant
Tthe Kelvin temperatureσthe Kelvin temperature
dthe grain diameterpthe exponent of the reciprocal of a grain size
D0the frequency factorDthe diffusion coefficient
Rthe universal gas constantQthe diffusion activation energy
ηthe rheological constantδthe interfacial bonding ratio
f(variable) interface bonding rate ε ˙ i the compressive strain rate of region i
σ 1 the compressive stress in region 1 ε ˙ 10 the initial strain rate
σTmaterial’s high-temperature yield strength C the constant of integration
nthe material’s own constant
Disclaimer/Publisher’s Note: The statements, opinions and data contained in all publications are solely those of the individual author(s) and contributor(s) and not of MDPI and/or the editor(s). MDPI and/or the editor(s) disclaim responsibility for any injury to people or property resulting from any ideas, methods, instructions or products referred to in the content.

