Article

The Brittle Fracture of Iron and Steel and the Sharp Upper Yield Point Are Caused by Cementite Grain Boundary Walls

by
Thomas L. Altshuler
Department of Mechanical Engineering, Northeastern University, Boston, MA 02115, USA
Metals 2024, 14(8), 871; https://doi.org/10.3390/met14080871 (registering DOI)
Submission received: 27 June 2024 / Revised: 23 July 2024 / Accepted: 23 July 2024 / Published: 29 July 2024
(This article belongs to the Special Issue Mechanical Properties, Fatigue and Fracture of Metallic Materials)

Abstract

:
Brittle fractures of iron and steel above twinning temperatures are caused by cementite grain boundary wall cracks. These were revealed by an Atomic Force Microscope (AFM). At temperatures below the ductile–brittle transition (DBT), cracks must propagate longitudinally within cementite walls until the stress is sufficiently high for the cracks to propagate across ferrite grains. Calculations using these concepts correctly predict the stress and temperature at the DBT required for fractures to occur. At temperatures above the DBT for hypoeutectoid ferritic steels, dislocations must be emitted across the walls transversely for plastic deformation to continue. This is responsible for the upper yield point at the elastic limit in these steels followed by a large drop in stress to the lower yield point. Here, the walls completely surround all of the grains. Where the walls are segmented, such as in iron, dislocations can pass around the walls, resulting in a gradual change from elastic to plastic deformation. The Cottrell atmosphere theory of yielding is not supported experimentally. It was the best available until later experiments, including those using the AFM, were performed. Methods are presented here giving yield strength versus temperature and also the parameters for the Hall–Petch and Griffith equations.

1. Introduction

The unique properties of steel are caused by cementite grain boundary walls.
Steel has unique properties not found in other metals. Steel has a sharp upper yield point at the elastic limit followed by a rapid drop in stress to the lower yield point. Steel has a transition from ductile deformation to brittle fracture. This occurs at approximately −5° Celsius, the ductile-to-brittle transition temperature (DBTT). Petch [1] found a correlation between yielding and grain size of steel. Cottrell [2] explained that the upper yield point of steel was caused by the breaking away of edge dislocations from solute carbon atoms. This conclusion was reached when viewing metallographically prepared specimens of steel with an optical microscope. With an Atomic Force Microscope (AFM) that viewed surfaces in three dimensions, Altshuler [3] found grain boundary walls in AISI 1018 steel rather than the expected grooves from etching the steel. Altshuler [4] also found cracks in the grain boundary walls, probably caused by thermal expansion differences in adjacent grains when cooling the steel from austenite to room temperature.
The purpose of this manuscript is to show that cementite grain boundary walls in steel and iron are responsible for the unique mechanical properties of these metals. Since the Cottrell atmosphere of yielding is not supported experimentally, an alternative theory of yielding of steel and iron is presented. Also, it is recognized that grain boundary wall cracks are responsible for the DBTT. In order to provide experimental justification for this new theory of yielding and for calculation of the DBTT, three hypotheses must be satisfied, namely:
1. 
Brittle grain boundary walls present in iron and ferritic hypoeutectoid steels consist of cementite with a high degree of probability.
2. 
The sharp upper yield point at the elastic line, followed by a rapid drop in stress to the lower yield point for ferritic hypoeutectoid steels, is caused by dislocations being emitted transversely across the cementite grain boundary walls that completely surround each grain.
3. 
Cracks in the grain boundary walls are primarily responsible for the brittle behavior of iron and steel at temperatures below the ductile–brittle transition temperature.
As a guide to understand the structure of this manuscript, the manuscript is divided into three major parts. Each part presents the results and discussion to satisfy the three hypotheses.

2. Materials and Methods

2.1. Specimen Composition and Preparation

The Polycrystalline AISI 1018 steel was provided by Peterson Steel Corp. (Worcester, MA, USA), and the Polycrystalline iron, 14 ppm C, was provided by the GoodFellow Corporation, Corapolis, PA, USA. These were austenized for 75 min at 1650 °F and furnace-cooled by Connecticut Metallurgical. This steel had no texture which was revealed from micrographs which are not included in this manuscript. This heat treatment was identical to that performed for AISI 1018 steel examined by Altshuler [3,4] for the correlation of the results. The Polycrystalline iron, 10 ppm C (FePX2) specimens were annealed for one hour at 500 °C in a vacuum greater than 5 × 10⁻⁷ torr by Altshuler [5]. The single-crystal pure iron was grown from Ferrovac “E” by Dr. D.F. Stein [6] and subsequently purified by him using a ZrH2 treatment to a purity of 0.005 ppm C. Preparation of the specimens were described by Altshuler [5]. The composition of the iron and steel is given in Table 1.

2.2. Metallographic Specimens

Metallographic preparation and optical microscopy of the Polycrystalline AISI 1018 steel and Polycrystalline Pure Iron was performed at Massachusetts Materials Research. Dr. Donald Chernoff performed Atomic Force Microscopy on the specimens. These specimens were polished and then etched with 2% nital (2% HNO3 and 98% ethanol) for 4 s. The specimens were then indented with a Knoop diamond using a 100 g force HK 158 (ASTM E384-17).
An annealed pure iron rod (Polycrystal iron, 14 ppm C) was not mechanically deformed. It was indented with a Knoop diamond 100 g force HK 67.9 (ASTM E384-17) which also served as a reference for the micrographs. These specimens were examined with an optical microscope by Massachusetts Materials Research and then examined using an Atomic Force Microscope (AFM) by Dr. Donald Chernoff.
The Rockwell hardness of specimen A was HRBW-69 and the average Knoop microhardness was HK 158 with a 100 g load. A 0.125 diameter ASTM E8 sub-size tensile specimen was machined from a rod of Polycrystal iron, 10 ppm C after annealing. It was tensile-tested.
The specimen characteristics are given in Table 2. The Single crystal iron [5] refers to the Single crystal iron, 0.005 ppm C and Single crystal iron, 44 ppm C given in Table 1.

2.3. Mechanical Tests

Polycrystal AISI 1018 steel
Specimen preparation and testing was performed by Massachusetts Materials Research. An MTS Sintech 30 G tensile testing machine frame running Admet Software Version 5.17.13 was used for mechanical testing. The extensometer used was an MTS Extensometer, Model #632.13E- 20, ½ inch gauge length, Class B2 (ASTM E8). Two tensile tests, labeled A and B, were performed at room temperature at a strain rate of 1.67 × 104 cm/cm s. Engineering stress and strain was used.
Testing resolution: stress ≈ 10−5 MPa, strain rate ≈ 5 × 10⁻⁶ cm/cm. The typical tests had 15,000 data points.
Polycrystal iron FePX2 and single-crystal iron FeSX1 and FeSX3
A complete description of the specimen preparation and tests performed is given by Altshuler [5]. He prepared all specimens and performed all of the tests. Tests were conducted using a semi-automatic compression testing machine for testing up to 21 specimens at cryogenic temperatures without requiring the cryostat to return to room temperature, as shown in Figures 12 and 14. Tests were performed at a strain rate of 5 × 10⁻⁴ cm/cm s.

2.4. Atomic Force Microscopy

The author used a Digital Instruments Stand Alone Atomic Force Microscope with a NanoScope V controller operating in contact mode, as shown in Figures 6 and 7. Specimens were cleaned with ethanol and air-dried. The probe tips were 3-sided Si3N4, with a radius = 10 nm, height = 20 µm, and side angle = 60° to 70°.
Dr. Chernoff used a Bruker Dimension Icon Atomic Force Microscope operated by a NanoScope V controller. It functioned in tapping mode (resonant frequency 300 MHz). Probes were changed when indicated by scanning conditions and/or tip tests. Specimens were cleaned using First Contact strippable polymer coating (https://www.photoniccleaning.com/, accessed on 25 January 2020). Tapping force could not be measured directly. Probe tips were 3-sided silicon, with a radius = 7 nm, height = 14 µm, front angle 0°, back angle 35°, and side angle 15°.

3. Results

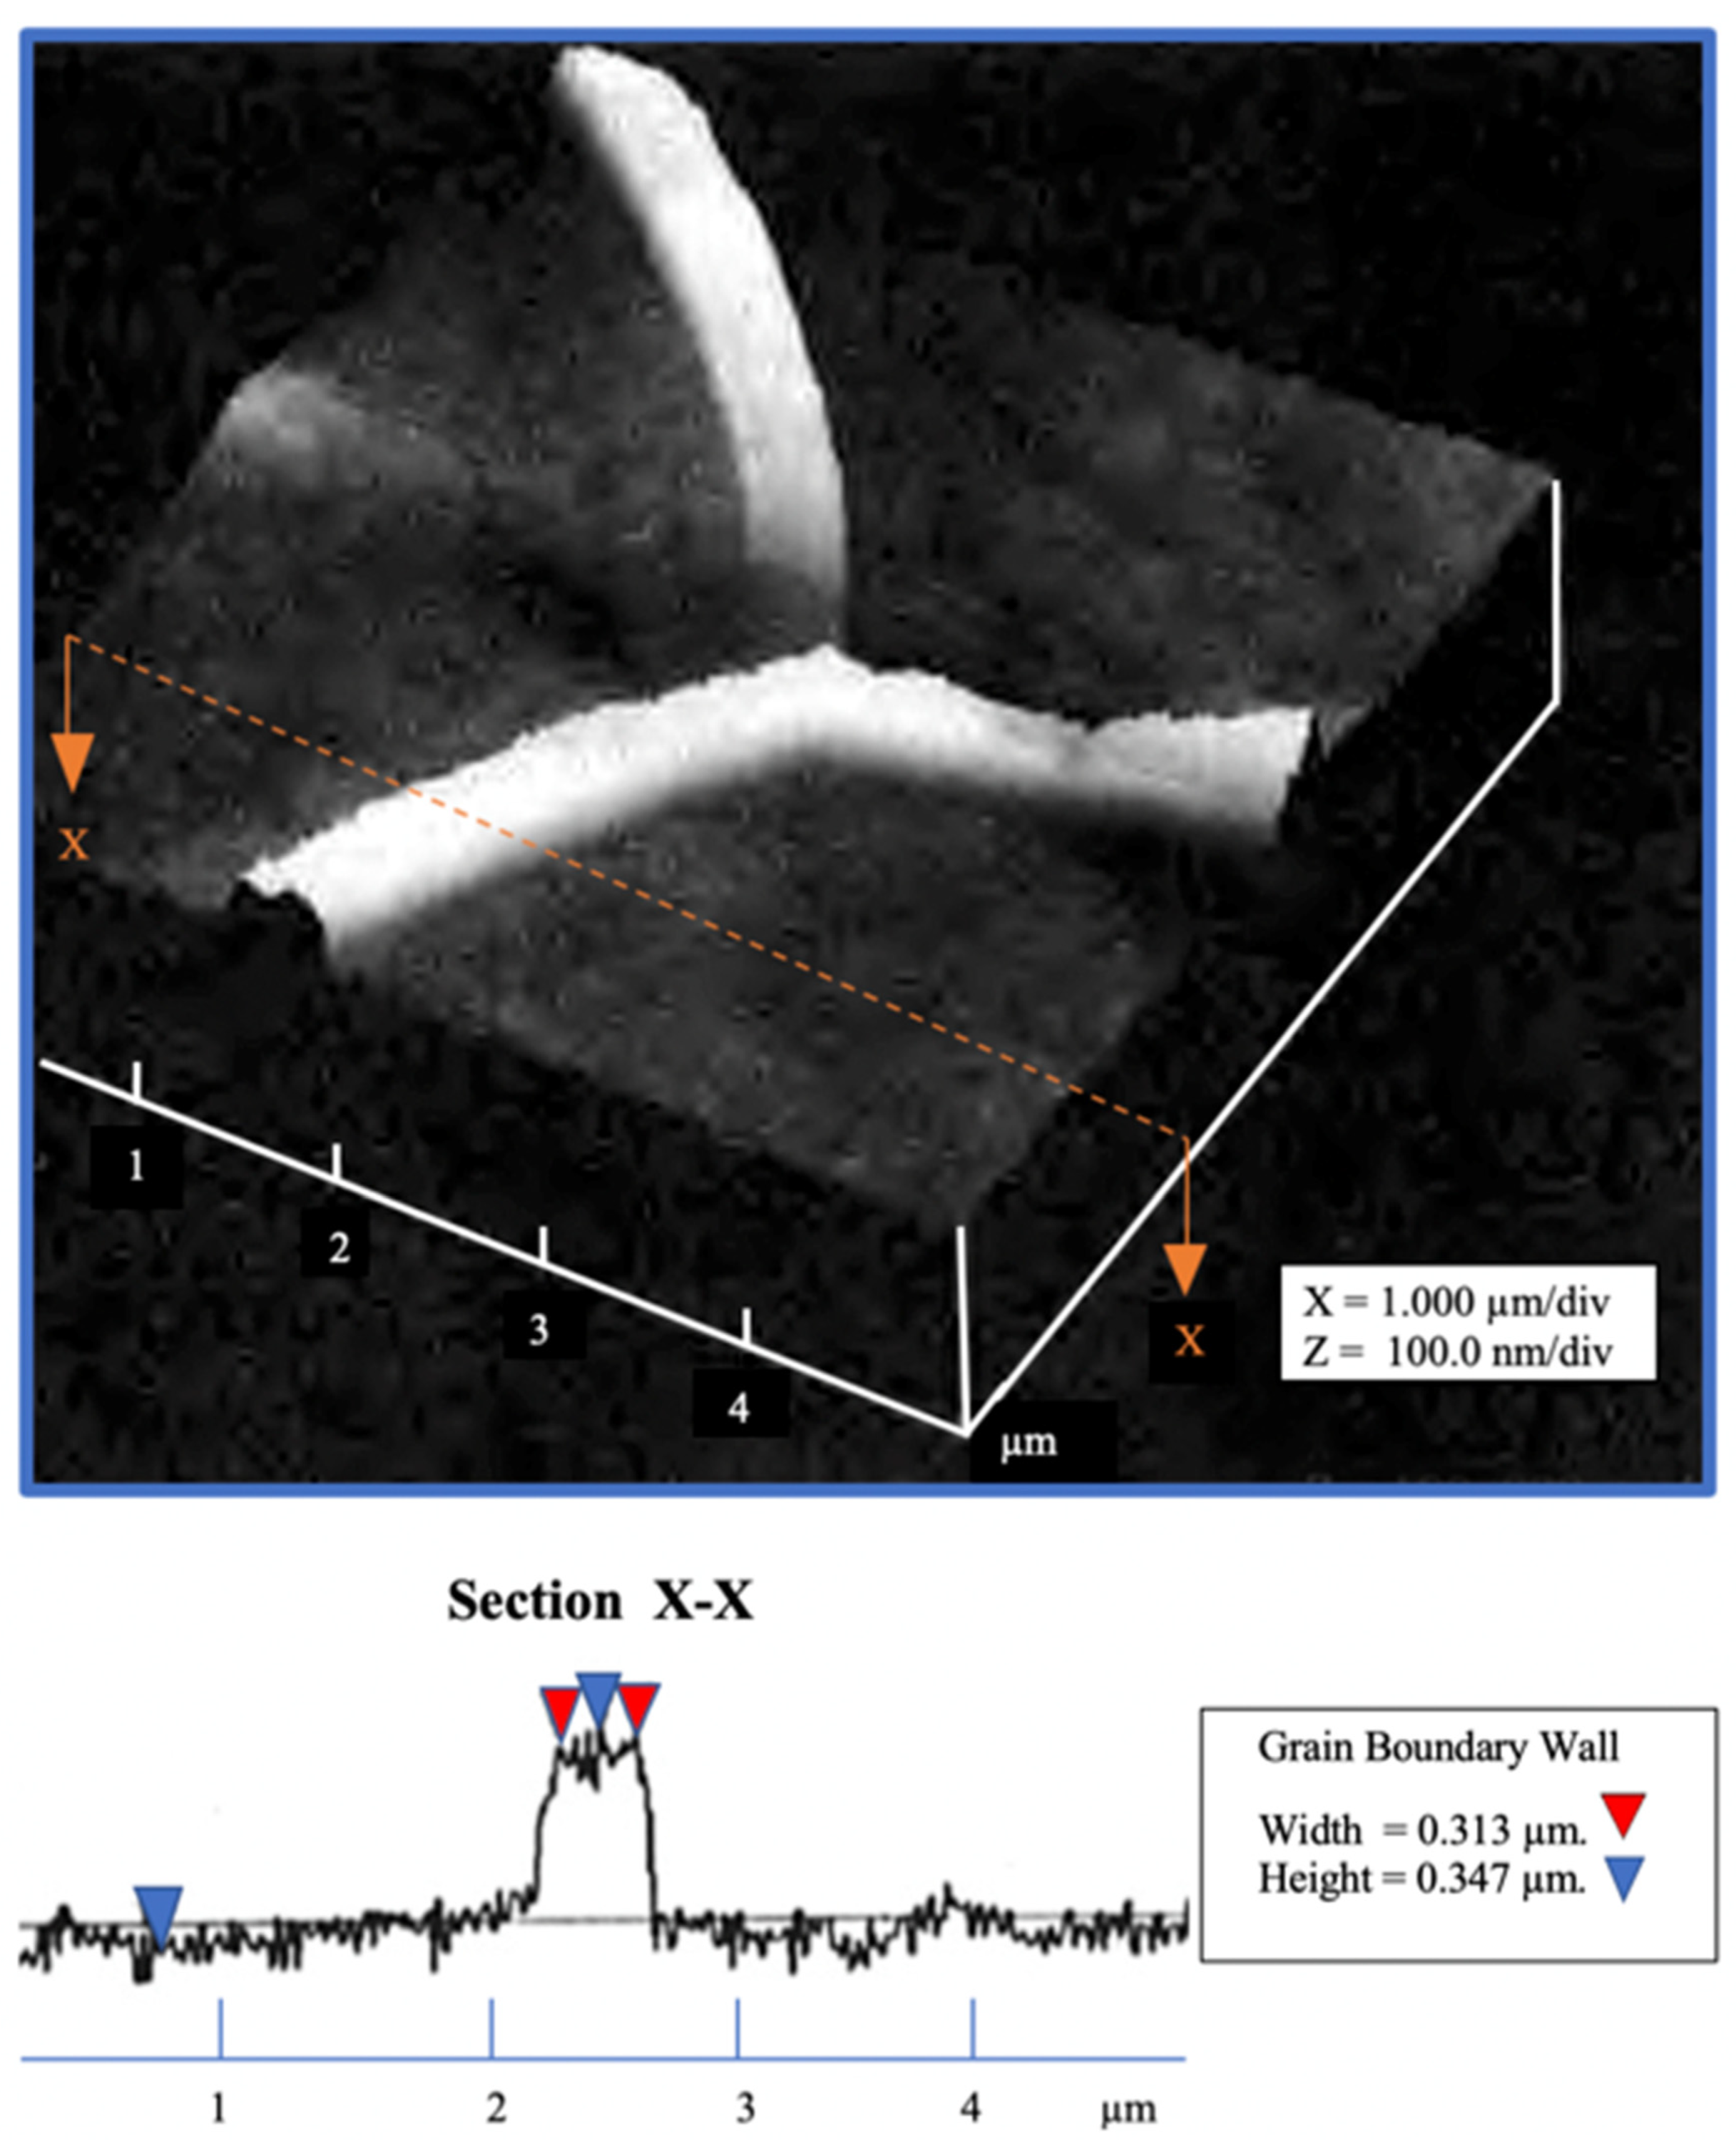
3.1. Atomic Force Microscopy (AFM) of Polycrystal AISI 1018 Steel

  • These examinations were performed on specimens that were not mechanically deformed.
Figure 1 presents an AFM scan of AISI 1018 steel similar to the AFM contact mode scan, as presented by Altshuler (Figure 14 in [3]). In both cases, the grain boundary wall height is the same as that of the pearlite platelets. This can be seen as the many light-colored lines in a grain; see the height bar to the right of the scanned figure. Nital was used where each grain was etched at a different rate depending upon the crystallographic orientation of the grain. The grain boundary wall and the pearlite platelets were not appreciably etched by nital.
Figure 2 shows the center portion of the micrograph in Figure 1. A cross-sectional view of the grain boundary between two grains that were etched to about the same depth is seen within the white circle. A cross-sectional view of the grain boundary between two grains etched to about the same depth is seen within the white circle. The purpose of the circle is to make it easier to see a line that crosses a cementite grain boundary wall. This line shows the location of the cross section which is shown in the graph to the right of the AFM scan. The grains were etched to about 20 nm below the top of the grain boundary wall. The lines on either side of the grain boundary wall, which establish its width, were placed halfway between the top and bottom of the wall. It is believed that the probe tip fractured the wall while scanning because of a longitudinal crack in the wall, which resulted in a sharp top. The best estimate for wall width in Figure 2 is 56 nm.
Figure 3 presents a cross-sectional view of the center portion of Figure 1. The best wall thickness is estimated to be about 59 nm. The platelets in pearlite all seem to have approximately the same width and are evenly spaced at 250 nm between platelets. Shlyakhova’s (Figure 2b in [7]) shows that the grain boundary width is estimated to be around 70 nm. Also, he observed a pearlite platelet separation of 260 nm.
  • Pearlite platelets
Figure 4 shows another region of the AISI 1018 steel in which the grain boundary walls can be seen surrounding each ferrite grain.
Figure 5 enlarges the lower right portion of Figure 4 with a cross-section line within the white circle between two adjoining grains. A cross-sectional view of the grain boundary between two grains that were etched to about the same depth is seen within the white circle. The purpose of the circle is to make it easier to see a line that crosses a cementite grain boundary wall. The circles are colored the same as the cross sections for identification. This line shows the location of the cross section which is shown in the graph below the AFM scan. The best estimate of the actual wall width is 50 nm at its base. Here, the top of the wall is pointed where the wall was fractured.
Figure 6 shows three cementite grain boundary walls using the probe in contact mode, Altshuler [4]. The walls were not fractured, similar to the pearlite platelets that have no cracks; see Figure 3.
In Figure 7, the probe in contact mode did not fracture the cementite wall. The grain boundary wall is shown by (arrow 1). A branched longitudinal crack in the wall is shown by (arrow 2). This indicates that the wall was brittle. In tapping mode, the AFM probe broke the walls at the cracks, as shown in Figure 2, Figure 5 and Figure 9.

3.2. Atomic Force Microscopy of Polycrystal Iron, 14 ppm C

Polycrystalline iron, 14 ppm C, was examined by an AFM, as shown in Figure 8. A grain boundary wall is visible between the center grain and the left one. No grain boundary wall can be seen between the center grain and the right grain.
The grain boundary wall between the top two grains in Figure 8 is shown in Figure 9; see the line enclosed within the white circle. A cross-sectional view of the grain boundary between two grains that were etched to about the same depth is seen within the white circle. The purpose of the circle is to make it easier to see a line that crosses a cementite grain boundary wall. This line shows the location of the cross section which is shown in the graph to the right of the AFM scan. The wall thickness was estimated to be 103 nm after subtracting the probe radius on both sides of the wall.

3.3. Tensile Tests of Polycrystal AISI 1018 Steel

The annealed AISI 1018 steel, Specimen A, was tested to failure. Figure 10 shows the engineering stress–strain curve until the extensometer was removed. Testing was then continued. The ultimate tensile strength was 486 MPa and total elongation was 38%. The stress and strain values that follow were taken from the data tables generated by the computer of the tensile testing machine. Two other tests were performed with similar results.

3.4. Tensile Tests of Polycrystal Iron, 14 ppm C

Two tensile tests were performed on Polycrystal iron, 14 ppm C. These were conducted as with the tests performed on Polycrystal AISI 1018 steel. As shown in Figure 11, deformation continued until the specimen broke at a strain of 0.0698. A similar specimen, Specimen D, broke in the grips in the Ripple Stress Region. Prior to failure, the engineering stress–strain curve was like Specimen C.

4. Discussion about Grain Boundary Walls

4.1. Cementite Grain Boundary Walls

In steel, cementite (Fe3C), which is the θ phase, appears to be formed at the grain boundaries of AISI 1018 steel as shown with the AFM scans in Figure 1, Figure 2, Figure 3, Figure 4, Figure 5, Figure 6, Figure 7, Figure 8 and Figure 9. This hypothesis was proposed by Altshuler [3,4] as a result of the first AFM examination of steel. This concept can be supported by the following arguments. If the grain boundaries consisted only of disordered atoms of pure iron, the boundaries should etch at a more rapid rate than the grains themselves. Thus, the grain boundaries should be depressed compared to the adjacent grains, which is generally believed to be true. However, the grain boundaries form walls which are at a height equal to that of the pearlite platelets above the ferrite portion of the grains as measured by the AFM scans. This means that the walls must be ionic crystals that etch at the same low rate as that of the cementite platelets. These walls must also consist of carbide since the amount of carbon in the steel is by far the most abundant element present that could form an ionic crystal with iron; see Table 1. The surface of the steel was observed with an optical microscope using differential interference contrast, as suggested by Martin Wells personal communication, February 1993. Both the pearlite platelets that consist of cementite and the grain boundary walls rotate polarized light by the same amount. Thus, they probably consist of the same intermetallic compound. There are also cracks within the walls which indicate that they might be cementite, as shown in Figure 2. McMahon and Cohen [8] observed cracks in carbide particles in the grain boundaries of iron.
Published observations of cementite in grain boundaries
The following observations show that cementite exists in the grain boundaries. Also, it is shown how the grain boundary walls of cementite could form so that they completely surround each grain, and that cementite may be the dominant factor of yield strength.
The following discussion shows why the grain boundary walls completely surround each grain in hypoeutectoid steels. This is due to the formation of these walls as steel cools from 900 °C to room temperature, which occurs in the following sequence:
  • At 900 °C, the steel grains are austenite.
  • At 822 °C, ferrite nuclei begin to form with the subsequent growth of grains.
  • 727 °C is the eutectoid temperature. The solute carbon is 0.0218 wt.%.
  • At 716 °C, the solute carbon is 0.019 wt.% in AISI 1018 steel. The ferrite grains are fully formed.
  • At ~715 °C, the solute carbon is below 0.019 wt.% and the excess carbon atoms diffuse to the grain boundaries and combine with iron atoms, forming Fe3C (cementite).
  • At 639 °C, the grain boundary walls are fully formed at the point where AISI 1018 has a carbon concentration of 781 ppm; see Section 4.2. As the temperature drops, pearlite platelets begin to grow from the grain boundaries.
  • At ~400 °C, the pearlite platelets have essentially completed their growth.
  • At 20 °C, the ferrite grains have less than 0.5 ppm carbon in solid solution, as per Hume-Rothery [9].
Sequence of formation of cementite grain boundary walls and pearlite growth versus temperature
Published work by various authors substantiates the sequence of grain boundary wall formation and pearlite platelet growth. Offerman [10] showed, with a monochromatic beam of hard X-rays, that when steel with up to 2 wt.% carbon is cooled from austenite at 900 °C to 600 °C in one hour, ferrite nuclei form rapidly at 822 °C. New nuclei of ferrite continued to form until pearlite started to grow at 685 °C. Therefore, grains of ferrite were already formed prior to the formation of cementite. This shows why cementite walls are formed and completely surround each grain. Then, pearlite grows from whatever solute carbon atoms remain within the ferrite grains due to the diffusion of carbon atoms along grain boundaries, according to K. Lu [11]
Nucleation and growth of cementite at grain boundaries
Sixin Zhao [12] showed that Widmanstätten ferrite grows at the grain boundaries of austenite upon cooling at 707 °C. Pandith [13] describes the nucleation and growth of cementite at high Gibbs free energy sites, thus lowering that energy. Marko Vogric’s (Figure 6 in [14]) shows the SEM micrographs of cementite dendrite nucleating at austenite grain corners and propagating along grain boundary edges. These dendrites thicken and form a continuous film as they grow while the steel cools from austenite to room temperature. This is an explanation for the formation of cementite grain boundary walls, as shown in Figure 5 and Figure 6. Song [15] examined ultrafine ferrite grains in plain carbon Fe-Mn steel (3.1% C). The ultrafine grains (0.9–2.2 µm) and subgrains (0.6–1.5 µm) had particles of cementite at the junctions between three adjoining grains where the Gibbs free energy is highest. These particles are shown in white at the junctions between grains, see Song’s (Figure 2 on page 6 in [15]). He also noted some fine white lines at grain boundaries where the angular difference in the crystallographic orientation of the grains was between 2° and 15° that presumably grew from the particles. The white lines are believed to be cementite wall segments. The black lines with grain crystallographic misorientation between 15° and 63° probably consist of etched ferrite grain boundaries.
Formation and growth of pearlite platelets at the grain boundaries
Bhadeshia’s (Figure 18 in [16]) described the process for the formation of pearlite platelets that grow from the grain boundaries. He stated that pearlite evolves with the nucleation of ferrite at the austenite–ferrite grain boundary wall. It appears, from his TEM micrograph, that the pearlite platelets were attached to a wall. Shaojie Lv et al. [17] showed that during cooling, the concentration of carbon increased in austenite as carbon concentration decreased in ferrite. The dilatometer reading showed the peak carbon concentration shifting towards austenite.
The hypothesis “Brittle grain boundary walls present in iron and ferritic hypoeutectoid steels consist of cementite with a high degree of probability.” is shown to be valid.

4.2. Grain Boundary Walls Completely Surround the Grains or Are Segmented

It was observed in Figure 1 and was also observed by Altshuler’s (Figure 14 in [3]), that grain boundary walls do completely surround all of the ferrite grains. This observation is confirmed in the discussion that follows.
Carbon content that is required for cementite grain boundary walls to surround all of the grains.
Assume that the grain boundary walls consist of cementite. To estimate the percent of carbon in the grain boundary walls, assume that each grain consists of a hexagonal prism whose edges are at the center of the grain boundary wall. Let (D) be the grain diameter. Let the height of the hexagonal prism equal (D). Let the length of an edge of the hexagonal face be Lo.
Lo = 0.275 D
Let Co be the total carbon in the steel. Then, the carbon by weight within the cementite grain boundary walls that is needed to completely surround all of the grains is (Cow). Here, Cow < Co for this condition to exist where any excess carbon goes into pearlite.
Cow = 0.207 t/D
Polycrystal AISI 1018 Steel, 1900 ppm C.
The cementite grain boundary walls completely surround all of the grains.
The AISI 1018 steel grain diameter was 15.9 µm. From Figure 2, it can be seen that the grain boundary wall thickness (t) = 56 nm. From Equation (2), the weight percent of carbon in the grain boundaries was 781 ppm. This assumed that the grain boundaries consist of cementite which completely surround each grain. The excess carbon, (1900 − 729) = 1170 ppm, would go into the platelets of pearlite for AISI 1018 steel containing 1900 ppm carbon, as shown in Table 1. Calculations were made showing that the percent of platelets to the pearlite area was 22.4% in Figure 1 and Figure 2. Therefore, cementite grain boundary walls do indeed completely surround each grain in hypoeutectic steels.
Polycrystal pure iron, 14 ppm C.
The grain boundary wall width (t) was 117 nm, as shown in Figure 9. For the grain diameter D = 127 µm, from Equation (2), the amount of carbon required for cementite walls to completely surround each grain would be 191 ppm. Since the amount of carbon in the iron (Co) = 14 ppm, then the percent of the grain boundaries that have cementite walls is Co/Cow = 7.3%.
These walls are segmented, consistent with Figure 8.
Polycrystal pure iron, 10 ppm C.
We assume that the grain boundary wall width (t) was 0.117 µm like that of Polycrystal 14 ppm C, examined with the AFM. For a grain diameter D = 28.4 µm, from Equation (2), the amount of carbon required for cementite walls to completely surround each grain would be 853 ppm. Since the amount of carbon in the iron (Co) = 10 ppm, then the percent of the grain boundaries that have cementite walls is Co/Cow = 1.2%.
These walls are segmented.

5. Discussion about Plastic Deformation of Iron and Steel

5.1. Stress–Strain Curves for AISI 1018 Steel 1900 ppm Carbon

The stress–strain curve, as shown in Figure 10, is given to show the unique properties of steel and that these properties are real. Two other tests showed similar results. Here are the upper and lower yield points of Polycrystal AISI 1018 steel with a grain diameter of 15.9 µm.
For Specimen A, the modulus of elasticity was 2.66 × 10⁵ MPa for AISI 1018 steel. In Figure 10, the upper yield point occurs along the elastic line at a stress of 351.8 MPa. The modulus of elasticity was reported to be 1.88 × 10⁵ MPa, measured between 131 MPa and 269 MPa. Then, there was a drop in stress to 328.2 MPa caused by pent-up dislocations being emitted through the grain boundary walls followed by a rapid multiplication of dislocations. This caused an extremely rapid drop in stress to the Breakthrough Stress at 211.1 MPa. This stress was well below the Lüders region and the lower yield point. The reason for this was that the specimen elongated much faster than the crosshead movement of the tensile testing machine, thereby relaxing the tension stress elastically. At the Breakthrough Stress, the stress was not sufficiently large to cause dislocations to continue to move. Therefore, the stress needed to rise while deforming the specimen elastically until plastic flow could continue. At that point, deformation continued into the Lüders region to a strain of 0.010 which ended in the lower yield point at 294 MPa. Then, the stress rose to a plateau of 317 MPa. The rise in stress was 19.7 MPa. Plastic flow then continued at a constant value until a strain of 0.022 was reached and then gradually increased. The average upper yield point of the three tests was 368.9 MPa. The average of the lower yield point of the three tests was 296.7 MPa. The average difference between the upper and lower yield points of the three tests was 77.3 MPa.

5.2. Stress–Strain Curves for Polycrystalline Iron, 14 ppm Carbon

For Specimen C, the modulus of elasticity was 1.69 × 10⁵ MPa for Polycrystal iron, 14 ppm C, as shown in Figure 11. The tensile stress–strain curve showed that there was a gradual change from elastic deformation to plastic deformation to a yield stress of 202.7 MPa at 0.2% offset. There was no yield point since the grain boundary walls were segmented instead of completely enclosing each grain; see Figure 8. Here, the grain size was 127 µm. For plastic deformation to occur, dislocations passed between the cementite wall segments and through the disordered atoms at the grain boundaries. At the end of the ripple region, the stress jump = 34.7 MPa.

5.3. Stress-Strain Curves for Polycrystalline Iron, 10 ppm Carbon

Figure 12 shows the deformation in compression for polycrystalline iron, 10 ppm. There was plastic deformation prior to the upper yield point followed by a gradual drop in stress to the lower yield point. The difference between the upper and lower yield points at 293 K was 17 MPa, as per Altshuler’s (Figure C69 in [5]). Gradual yielding from elastic deformation to plastic deformation was observed by Lucon [18] at NIST, see Lucon’s (Figure 9 in [19]) for pure iron containing 14 ppm carbon. SiGao’s (Figure 2 in [18]) showed a gradual change from elastic to plastic deformation for pure iron containing 20 ppm carbon. The average lower yield strength was = 215 MPa for the four national laboratories (Figure 25 in [19]). This was close to the lower yield point σly = 204 MPa for the Polycrystal iron, 10 ppm C, Altshuler’s (Figure C69 in [5]).
Compression and tensile tests were performed on Polycrystal iron 10 ppm C at various temperatures from 293 K to 2.19 K, as per Altshuler [5]. The grain size diameter averaged 28.4 µm. The elastic constant was 1.959 × 10⁵ MPa at 293 K and 2.059 × 10⁵ MPa at 4.2 K, Altshuler’s (Figure C4 in [5]). There was twinning as well as plastic deformation in tension tests at 77 K and 20.4 K, Altshuler’s (Figure C3 in [5]). Compression testing suppressed fracture compared to tensile testing.
The symbols in the figure help identify the type of stress measured. The extrapolated yield stress is shown as the red dashed curve.
The extrapolated yield stress consisted of a straight-line extending from the flow stress at 10% strain towards and intersecting the elastic line. That extrapolated yield stress was used for compression tests at low temperatures to estimate the lower yield point where specimens would fracture in tension, as per Altshuler [5]. It is shown in Figure 12 as the red dashed curve. The stress rose as the temperature dropped from room temperature to 10 K. After that, the stress remained constant at 2.19 K, which was a real phenomenon with a probability of 95%. The extrapolated lower yield stress σy is given by Equation (3) for a grain size of 28.4 µm.
σy = 859 − 2.958T + 0.001812T2

5.4. Single-Crystal Iron, 0.005 ppm C and 44 ppm C

Compression tests were performed on single crystals of high-purity iron provided by Stein [6]. The iron crystals initially had 40 ppm carbon. The elastic constant was 1.740 × 10⁵ MPa at 293K and 1.837 × 10⁵ MPa at 4.2K, as per Altshuler (Figure C4 [5]), along the compression axis.
Figure 13 shows the stress–strain curves of single-crystal iron 0.005 ppm C and single-crystal iron 44 ppm C at 293 K, as per Altshuler (Figure C28 [5]). Both crystals had the same crystallographic orientation and were tested along the same compression axis. These crystals were machined in the same way with extreme care which did not introduce work hardening that would affect the testing results, as per Altshuler [5]. These tests eliminate the effect of grain boundaries and can therefore show the effect of solute carbon atoms on the critical resolved shear stress. Both crystals have the same other impurity elements. It is estimated that the 0.005 ppm carbon crystals could pin dislocations at every 281 unit cells, which is insufficient to significantly pin dislocations in terms of stress. Pure iron has 0.5 ppm carbon in solid solution at 0 °C, as per Hume-Rothery [9]. Therefore, the 44 ppm carbon single-crystal would have sufficient carbon atoms that could pin dislocations every 22 unit cells. For the 0.2% yield offset, the difference between the 44 ppm C and 0.005 ppm C single crystals was 7.3 MPa at 293 K. At 77 K, the difference was −12.7 MPa, as per Altshuler (Figure C29 [5]). These differences are very small compared to the difference between the upper and lower yield points of AISI 1018 steel, which was 77.3 MPa.
The data points in Figure 14 show the published results of the yield stress reported by Stein [6] with 0.005 ppm C, Allen [20] with 27 ppm C, and Harding [21] with 15 ppm C. The symbols for these data points serve as identification of the referenced sources of the tests. The tests by Altshuler [5] were performed in compression, while the tests by other authors were performed in tension. The testing direction 1 ¯ 49 for all of the compression tests were identical, as per Altshuler [5]. Here, σo is the 0.2% yield stress and T is the absolute temperature for the single-crystal iron, shown by the red dashed curve and Equation (4). The experimental results for this curve are considered to be the most reliable since the preparation of the specimens and tests were performed by Altshuler [5]. The lower values of the yield stress are considered to be closest to the frictional stress of dislocations.
σo = 997 − 6.196T + 0.009739T2

5.5. Cottrell Atmosphere Pinning of Dislocations

The pinning of dislocations by the Cottrell atmosphere, as per Cottrell [2], was not observed. This can be seen from the discussion of the yielding of both pure single-crystal iron with 0.005 ppm carbon and single-crystal iron with 44 ppm carbon in Section 5.4. Takeda [22] states that solid solution strengthening by nitrogen and carbon would have a negligibly small influence on the yield strength of ferritic iron. For steel that has cementite grain boundary walls that completely surround all the grain, the Cottrell atmosphere pinning of solute atoms is not the dominant cause for yielding.
These arguments support the following hypothesis:
  • 2. “The sharp upper yield point at the elastic line, followed by a rapid drop in stress to the lower yield point for ferritic hypoeutectoid steels, is caused by dislocations being emitted transversely across cementite grain boundary walls that completely surround each grain.”

6. Discussion and Calculations about the Fracturing of Iron and Steel

The determination of the ductile brittle transition temperature is dependent upon the carbon content of the iron and steel. When there is sufficient carbon to form grain boundary walls that completely surround all of the grains, then cracks within the grains can propagate from grain to grain within the cementite grain boundary walls until a fracture occurs. This is the condition that exists with steel. In the case of iron, where there is insufficient carbon to form grain boundary walls that completely surround each grain, cracks must propagate through ferrite grains to cause a fracture. This requires considerably more stress than fracture propagation through cementite. Therefore, for the stress to reach a high enough level for brittle fractures in iron, the temperature must drop low enough for the onset of plastic deformation to rise to the brittle fracture stress; see Figure 12. The following discussion will show the difference in the ductile brittle transition temperatures of steel and iron; see Section 6.3 and Section 6.4.

6.1. Equations for the Ductile Brittle Transition (DBT) of Iron and Steel

Let:
  • C = total carbon content of iron or steel
  • c = crack half length
  • D = grain diameter
  • E = elastic constant
  • Gc = toughness
  • ky = material constant (Hall–Petch coefficient)
  • kic = critical stress intensity factor
  • L = crack length
  • Lo = edge of a grain
  • T = temperature, degrees Kelvin
  • t = grain boundary wall thickness
  • Y = crack geometry factor
  • γp = surface energy for plastic deformation at the crack tip/unit area
  • γs = surface energy for a brittle crack/unit area
  • ν = Poisson’s ratio
  • θ = angle between the grain boundaries of two adjoining grains
  • σy = lower yield stress
  • σo = frictional stress
  • σc = critical fracture stress
  • ξ = factor related to grain size D relative to Dmin
Cracks in the brittle grain boundary walls, as shown in Figure 7, are responsible for creating the brittle behavior of hypoeutectioid ferritic steels and pure iron at temperatures above twinning. It will be shown in the following discussion that predictions based upon the propagation of these cracks can be made to determine correctly the ductile–brittle transition temperature (Tc) for these metals.
The transition from the ductile deformation to the brittle fracture of iron and steel uses a combination of the Hall–Petch [1] Equation (5) and the Griffith [23] Equation (6).
Hall–Petch equation      σy = o + ky/D
Griffith equation      σc = (2E γs/πc)1/2
For metals, Irwin [24] and Orowan [25] added a term for the plastic deformation of the crack tip. Here, (γs) is the surface energy of the sharp crack end and (γp) is due to the plastic deformation required for the propagation of the crack resulting in a blunted end, as per Tanaka’s (Figure 5 [26]).
σc = (2E (γs + γp)/πc)1/2
kic = Yσc (πc)1/2
For a penny-shaped crack inside an infinite body Y = 2/π
Pure mode I toughness is defined as follows: Gc = kic2(1-ν2)/E
By combining Equations (7)–(9) Gc = 2Y2(1 − ν2)(γs + γp)
For Y = 2/π and ν = 0.291    GC = 0.7419(γs + γp)
The length (L) of an internal crack can be obtained by Equation (11) by combining Equations (7) and (10) as follows:
L = 2c = 1.716EGc/σc2
The length (L) of an internal crack can be obtained by Equation (12) by combining Equations (10) and (11) as follows:
L = 1.273E(γs + γp)/c2

6.2. Relationship of the Ductile–Brittle Transition Temperature and Stress with Grain Size

Cementite grain boundary walls that surround every grain in steels
A crack that is in a wall at one edge of a grain must grow longitudinally within the cementite wall, extending along adjoining grains until the crack is sufficiently long to propagate through ferrite. Three factors govern the externally applied stress needed for a crack within a cementite boundary wall to propagate. These are:
1.
Thermally activated stress to move dislocations in order to provide stress at the grain boundary.
Let σo = thermally activated stress. For iron and steel, this is the Peierls–Nabarro force, which causes a large increase in stress as temperature decreases; see Figure 13 and Equation (4). A single crystal was used without having carbon, cracks, or grain–boundary interactions. Proof of the Peierls–Nabarro force in body-centered cubic materials was given by Altshuler [5].
2.
Stress perpendicular to a crack, thereby opening the crack in order that it propagates.
Let σp = σc be the stress perpendicular to the crack. This stress is given in Equation (7).
3.
The difference in the angle between the grain boundaries of two adjoining grains.
If cementite grain boundary walls enclose every grain, then θ is the angular change in direction as a grain boundary wall continues from one grain to its adjoining grain. Let σc = the stress at the crack that is perpendicular to the crack face. Then,
σc. = σy (1 + cos 2θ)/2
By using the data of Figure 14 and combining Equations (7) and (13), the yield stress for the crack to continue to propagate is given in Equation (14).
σy = σo + [ 2E (γs + γp)/2πc ]1/2/(1 + cos 2θ)
Cementite wall segments in steel
From Equation (13), if θ = ±30°, the stress for continued crack growth increases by 33%. If θ = ±60°, the stress increases by 400%. Let σccem be the stress needed for a crack to continue to propagate through cementite. Let σcFe = the stress needed for the crack to propagate through ferrite. The stress must then increase for the continued propagation of the crack by (σcFe/σccem) = (γs + γp)/γs = 27.5/2.05 = 1341%; see the first paragraph of Section 6.4. This means that a crack must proceed along the cementite walls of adjoining grains until the stress increases to 1341% of the stress required for the crack to propagate through a ferrite grain. Here, the crack length is much greater than the grain boundary edge Lo.
Cementite wall segments in iron
Here, a crack must stop at the ends of the segment until the stress increases to the point where it will proceed through ferrite. The length of the cementite grain boundary wall segment is affected by the grain size and carbon content. For larger grains, the segments are smaller than the grain edge. By rearranging Equation (11), the result is shown in Equation (15). The crack length L = 2c that extends to the ends of the segment which is smaller than the grain edge Lo.
Gc = 0.5827 L σc2/E
According to Pacyna and Mazur [27], toughness passes through a minimum at a certain grain size Dmin. This can be seen in Reiser and Hartmaier’s (Figure 6b in [28]). Here, the segments need to be larger than the grain edge length Lo for the toughness to increase. Then, the crack size L must extend along the edges of several adjoining grains. When the crack length equals the segment size, the carbon content in the iron is shown in Equation (16), which is equivalent to Equation (2).
Cmin = 0.207 t/D
where:
  • Co = total carbon content in the iron
  • Cmin = carbon content of iron where the segment size equals Lo
  • ξ = factor related to grain size D relative to Dmin
If the carbon content in the steel C0 is greater than Cmin, then the length of the grain boundary segment will exceed the edge length of one grain according to Equation (17).
L = Lo ξ Co/Cmin
A rough approximation would be that ξ = 1.0.
Calculations for determining the externally applied stress for crack propagation can be found using Equation (17). For cementite grain boundary segments that are smaller than the grain boundary edge Lo, the angle θ = 0. Therefore, the change in the external stress decreases slightly with decreasing grain size. This agrees with the findings of Werner et al. [29], where αFe fracture toughness is not affected by grain size. Werner states that this does not apply to α-brass. This is due to the fact that brass has no cementite walls and cracks form for other reasons. When the grain boundary segments exceed the grain boundary edge Lo, as is the case when the grain diameter D is smaller than Dmin, then there is a large increase in stress for propagation due to a large θ for the crack to continue propagating. This behavior can be seen in Reiser and Hartimaier’s (Figure 6b in [28]).

6.3. Determination of the Hall–Petch Constants

For hypoeutectioid ferritic steels and irons, the Hall–Petch equation can be rearranged as:
k y = ( σ y σ o )     D
The yield stress σy is given in Equation (3). The frictional stress is given in Equation (4). Using a grain diameter of 28.4 µm, these parameters result in Equation (19) for the material constant (ky) and Figure 15.
ky = −736 + 17.3T − 0.0422T2
Cracks in grain boundary walls can be used to correctly predict the temperature and stress at the ductile–brittle transition. The hypothesis:
  • 3. “Cracks in the grain boundary walls are primarily responsible for the brittle behavior of iron and steel at and below the ductile–brittle transition temperature.” appears to have validity.

6.4. Determine Fracturing of Polycrystal AISI 1018 Steel, 1900 ppm C

Cementite grain boundary walls completely surround all of the grains.
Determine the surface energies of cracks: γs.
For AISI 1018 steel, the grains are surrounded by brittle grain boundary walls that have longitudinal cracks. With sufficient stress, it is reasonable that these cracks would grow within the walls longitudinally from grain to grain until the cracks are sufficiently large that they could fracture across the ferrite grains transversely. According to Chiou and Carter’s (Table 6 in [30]), γs = 2.05 J/m2, which is at {001}, which is at {001}, the most stable fracture plane. Pure ferrite shows both brittle and plastic deformation at the crack tip. Schönecker et al. (Figure 1 in [31]) theoretically determined γs = 2.527 J/m2 at 0 K and γs = 2.457 J/m2 at 250 K. Suzudo et al. (Table 1 in [32]) state that cleavage occurs along the {100} plane with γs = 2.542 J/m2. According to Chao, his (Figure 4 in [33]) shows that Gc = 20.4 J/m2 for 1018 steel. From Equation (10), (γs + γp) = 27.5 J/m2 and γp = 25 J/m2 = 25 MPa µm.
Determine the Ductile—Brittle Transition
The ductile–brittle transition temperature (DBTT) for AISI 1018 steel was 5 °C according to Chao et al. [33]. As shown by Altshuler [2], the lower yield point of Polycrystal AISI 1018 steel σy = 294 MPa at 23 °C extrapolates to 290 J/m2 at 5 °C using yield point versus temperature data from Badaruddin et al. [34]. Here, the cementite grain boundary walls completely surround every grain in this steel. Cracks in these walls can propagate longitudinally within the cementite grain boundary walls from grain to grain. For cementite, γs = 2.05 J/m2. For a stress of 290 MPa and E = 212.66 GPa, as per Koo [35] for the cementite {100} plane, the crack length needed for propagation in the wall would be L = 6.6 µm; see Equation (12). Although this is larger than the average length of a wall edge of 4.371 µm, there could be grains with an edge of 6.6 µm or greater. As the stress increases to 290 MPa, the crack will grow longitudinally within the cementite wall until the stress required to propagate in the wall becomes greater than required for trans-granular fracture across the adjoining ferrite grain. To determine the crack length for fracture into ferrite, let E = 2.023 × 10⁵ MPa for Polycrystal AISI 1018 steel. Using Gc = 20.4 J/m2, (γs + γp) = 27.5 J/m2, and σc = σy = 290 MPa from Equation (11), the internal crack length L = 84.2 µm is required for the crack to propagate through a ferrite grain.
For DP590 steel, 0.08% C, the cementite grain boundaries probably were segmented. Therefore, a crack would propagate until it reaches the segment ends. Then, the stress must rise until the stress is sufficient for the crack to continue to grow into the ferrite grain. Assume the fracture stress σc was 400 MPa at −95 °C similar to that for ferrite, as shown in Figure 13, and E = 200 GPa. For Gc = 20.4 J/m2 as reported by Chao [33]. Then Equation (11) yields a crack length L of 2.15 µm. That should be the segment length.
For low-carbon steels, (0.15%C-0.3%Si-1.5%Mn), the cementite walls surround all the grains. As per Inoui’s (Equation (2) in [36]), for a crack to propagate through ferrite:
σc = 1.41 [2E (γs + γp)/π(1 − ν)D ]1/2
Using Poisson’s ratio, ν = 0.291, E = 2.10 × 10⁵ MPa, (γs+ γp) = 27.5 J/m2, D = 28.4 µm, and from Equation (19), σc = 602.5 MPa. The crack length L equals 20.3 µm as per Equation (12) for fracture. The average length of the edge of a grain is about 8 µm. Therefore, the crack must propagate along cementite grain boundary walls from grain to grain until the steel fractures across ferrite grains.

6.5. Determination of Fracturing Polycrystal Pure Iron, 10 ppm C

Segmented Grain Boundary Walls
Determine the surface energy of cracks in Polycrystal iron, 10 ppm C
The fracture toughness of iron with 99.999% purity is 32 J/m2 at 77 K and 68 J/m2 at 173 K as per Hohenwater [37] for iron with 90 ppm C, with a grain diameter D of approximately 5 µm. From Equation (2) and by using t = 0.056 µm, the carbon content would have to be 2,312 ppm for cementite walls to completely surround all of the grains. Therefore, the cementite walls are segmented. When extrapolating the fracture toughness to 20.4 K, Gc = 21.2 and (γs + γp) = 28.6 MPa µm.
Determination of fracturing polycrystal pure iron, 10 ppm C
In pure iron, the segmented cementite grain boundary walls probably have cracks for the same reason that AISI 1018 steel contains cracks in the walls. This is due mainly to thermal expansion differences between adjoining grains when the iron cools from austenitic temperatures to room temperature. From Altshuler (Figure C3 [5]), at Tc = 20.4 K, σc = σy = 750 MPa. From Equation (12), when E = 2.061 × 10⁵ MPa, as per Altshuler (Figure C4 [5]), and (γs + γp) = 28.6 J/m2, the crack length (L) was 13.3 µm. This length was close to the average edge length of a grain Lo = 11.4 µm from Equation (1), where D = 28.4 µm. From Figure 13 and Equation (3), σc = σy = 799.6 MPa and the crack length was 11.7 µm. Tension tests at 20.4 K caused the twinning and fracture of the test specimen. Compression tests, on the other hand, suppress crack opening and are considered a true measure of initial dislocation motion. The reason for using Equation (3) is that the extrapolated yield stress is derived from the compression tests and has approximately the same value as the tension tests.
These arguments support the following hypothesis:
“Cracks in the grain boundary walls are primarily responsible for the brittle behavior of iron and steel at temperatures below the ductile–brittle transition temperature.”

6.6. Fracture Toughness and Ductile–Brittle Transition Temperature in the Published Literature

Tanaka’s (Figure 3a in [26]) shows that αFe has brittle failure at Tc = 101 K for Fe-9%Cr (18 ppm carbon) tested at a strain rate of 4.4 × 10⁻⁴ with the activation enthalpy H = 0.21 ev. Since the activation enthalpy (H) must be the same for both plastic and brittle failure, Tc can be determined.
This agrees with Altshuler [5], who obtained an activation enthalpy of 0.21 ev and a strain rate of 5 × 10⁻⁴ at 100 K.
Inoue et al.’s (Figure 14a in [36]) give the maximum tensile stress t = 1674 MPa near the notch tip on the Charpy specimen for polycrystal iron, 0.15% C, with an effective grain diameter D = 18 µm. The effective fracture stress c = y 560 MPa. This is between the extrapolated and compression yield stress shown in Figure 13.
Taolong Xu et al.’s [38] discuss micro crack propagation across pearlite platelets in ferrite–pearlite gas transmission pipeline steel. David Görzen et al.’s (Figures 3 and 4 in [39]) showed fatigue crack initiation at the grain boundaries. Kai Zhai et al. [40] state that fractures occur easily in pearlite between a cementite particle and its interface with the ferrite matrix. These results are consistent with crack propagation in grain boundary walls.

7. Conclusions

(a)
Polycrystalline ferritic hypoeutectoid steels have sufficient carbon for cementite (Fe3C) walls to completely surround all of the grains.
(b)
Iron does not have sufficient carbon for cementite walls to completely surround all of the grains. Therefore, the cementite walls are segmented if carbon exceeds 0.5 ppm.
(c)
For annealed ferritic hypoeutectoid steels, the upper yield point is at the elastic limit. It is then followed by a sharp drop in stress to the lower yield point. This is caused by the dislocations being emitted through cementite grain boundary walls.
(d)
Yielding in pure iron differs from that of steels since there is a gradual change from elastic to plastic deformation. This is caused by dislocations passing around the cementite wall segments.
(e)
Cracks in cementite grain boundary walls are the primary cause of fractures of hypoeutectoid steels and iron.
(f)
If the cementite grain boundary walls completely surround all of the grains, a crack propagates longitudinally within the walls, an intergranular fracture.
(g)
If the cementite grain boundary walls are segmented, then cracks grow to the end of the segment and stop.

Funding

Thomas L. Altshuler paid commercial laboratories, by Baxter and Chernoff, to perform specified experiments from his personal funds #000. He purchased the materials, designed the experiments specifying the methods that were used, and interpreted the data. All other experimental work was conducted by him. He purchased ownership and the rights to publish the data obtained from the experiments. He obtained permission to publish the results of the data obtained. He subsequently wrote this manuscript.

Data Availability Statement

The raw and processed data required to reproduce these findings can be made available by contacting the author.

Acknowledgments

The author wishes to thank Robert Rose for his very helpful suggestions that were used in the preparation of this manuscript. The author also wishes to thank Carolyn R. Currie for her suggestions in improving the clarity of this manuscript.

Conflicts of Interest

The author declare that he has no known competing financial interests or personal relationships that could have appeared to influence the work reported in this paper.

References

  1. Petch, N.J. The cleavage strength of polycrystals. J. Iron and Steel Inst. 1953, 174, 25–28. [Google Scholar]
  2. Cottrell, A.H.; Bilby, B.A. Dislocation theory of yielding and strain ageing of iron. Proc. Phys. Soc. 1949, 62, 49. [Google Scholar] [CrossRef]
  3. Altshuler, T.L. Atomic-Scale Materials Characterization. Adv. Mater. Process. 1991, 140, 18–23. [Google Scholar]
  4. Altshuler, T.L. Examination of Plain Carbon Steels Using an Atomic Force Microscope. Atomic Force Microscopy/Scanning Tunneling Microscopy; Cohen, S.H., Ed.; Springer Science + Business Media LLC: Berlin/Heidelberg, Germany, 1994; pp. 167–180. [Google Scholar]
  5. Altshuler, T.L. Deformation Processes in Body Centered Cubic Materials. Ph.D. Thesis, Oxford University Department of Materials Science, Oxford, UK, 1964. [Google Scholar]
  6. Stein, D.F.; Low, J.R.; Seybolt, A.U. The mechanical properties of iron single crystals containing less than 5 × 10⁻³ ppm carbon. Acta Metall. 1963, 11, 1253. [Google Scholar] [CrossRef]
  7. Shlyakhova, G.V.; Zuev, L.B.; Popova, E.A. Studying carbon steel by atomic force microscopy. AIP Conf. Proc. 2018, 2053, 030063. [Google Scholar] [CrossRef]
  8. McMahon, C.J.; Cohen, M., Jr. The fracture of polycrystalline iron. In Proceedings of the First International Conference on Fracture, Sendai, Japan, 12–17 September 1965; Volume 2, pp. 779–812. [Google Scholar]
  9. Hume-Rothery, W. Iron and its Interstitial Solid Solutions. In The Structure of Alloys of Iron; Pergamon Press: Oxford, UK, 1966. [Google Scholar]
  10. Offerman, S.E.; Van Dijk, N.H.; Sietsma, J.; Grigull, S.; Lauridsen, E.M.; Margulies, L.; Poulsen, H.F.; Rekveldt, M.T.; Van der Zwaag, S. Grain Nucleation and Growth during Phase Transformations. Science 2002, 298, 1003–1005. [Google Scholar] [CrossRef]
  11. Lu, K.; Huo, C.-F.; He, Y.; Yin, J.; Liu, J.; Peng, Q.; Guo, W.-P.; Yang, Y.; Li, Y.-W.; Wen, X.-D. Grain Boundary Plays a Key Role in Carbon Diffusion in Carbon Irons Revealed by a ReaxFF Study. J. Phys. Chem. C 2018, 40, 23191–23199. [Google Scholar]
  12. Zhao, S.; Min, N.; Li, W. Formation of Widmanstätten Ferrite and Grain Boundary Ferrite in a Hypereutectoid Pearlitic Steel. Metals 2022, 12, 493. [Google Scholar] [CrossRef]
  13. Pandit, A. Theory of Pearlite Transformation in Steels. Ph.D. Thesis, University of Cambridge Department of Materials Science and Metallurgy, Cambridge, UK, 2011. [Google Scholar]
  14. Vogric, M.; Kozeschnik, E.; Svoboda, J.; Führer, M.; Kreyca, J.; Wei, W.; Povoden-Karadeniz, E. Kinetic Modeling of Grain Boundary Cementite Evolution. Metall. Mater. Trans. A 2022, 53, 3759–3773. [Google Scholar] [CrossRef]
  15. Song, R.; Ponge, D.; Kaspar, R.; Raabe, D. Microstructure and crystallographic texture of an ultrafine grained C-Mn steel and their evolution during warm deformation and annealing. Acta Mater. 2005, 53, 845–858. [Google Scholar] [CrossRef]
  16. Bhadeshia, K.D.N. Interpretation of the Microstructure of Steels. 2008. Available online: https://www.phase-trans.msm.cam.uk/2008/Steel_Microstructure (accessed on 27 May 2024).
  17. Lv, S.; Wu, H.-H.; Wang, K.; Zhang, C.; Zhu, J.; Wang, S.; Wu, G.; Gao, J.; Yang, X.-S.; Mao, X. Phase field simulation of eutectoid microstructure during austenite-pearlite phase transformation. J. Mater. Res. Technol. 2023, 26, 8922–8933. [Google Scholar] [CrossRef]
  18. Gao, S.; Chen, M.; Chen, S.; Kamikawa, N.; Shibata, A.; Tsuji, N. Yielding Behavior and Its Effect on Uniform Elongation of Fine Grained IF Steel. Mater. Trans. 2014, 55, 73–77. [Google Scholar] [CrossRef]
  19. Lucon, E.; Abiko, K.; Lambrecht, M.; Rehmer, B. Tensile Properties of Commercially Pure, High Purity, and Ultra-High Purity Iron: Results of an International Round Robbin; NIST Technical Note 1879; US Department of Commerce, National Institute of Standards and Technology: Gaithersburg, MD, USA, 2015.
  20. Allen, N.P.; Hopkins, B.E.; McLennan, J.E. The Tensile Properties of Single Crystals of High-Purity Iron at Temperatures from 100 to −253 degrees C. Proc. R. Soc. Lond. Ser. A Math. Phys. Sci. 1956, 234, 221–246. [Google Scholar]
  21. Harding, J. The Yield and Fracture Behaviour of High-Purity Iron Single Crystals at High Rates Crystals at High Rates of Strain. Proc. R. Soc. Lond. Ser. A Math. Phys. Sci. 1967, 299, 464–490. [Google Scholar]
  22. Takeda, T.; Nakada, N.; Tsuchiyama, T.; Takaki, S. Effect of Interstitial Elements on Hall-Petch Coefficient of Ferritic Iron. ISIJ Int. 2008, 48, 1122–1125. [Google Scholar] [CrossRef]
  23. Griffith, A.A. The Phenomena of Rupture and Flow of Solids. Philos. Trans. R. Soc. Lond. 1921, 221, 163–198. [Google Scholar]
  24. Irwin, G.R. Fracture Dynamics. In Fracturing of Metals; American Society for Metals: Cleveland, OH, USA, 1948; pp. 147–166. [Google Scholar]
  25. Orowan, E. Fracture and Strength of Solids. Rep. Prog. Phys. 1948, XII, 185. [Google Scholar] [CrossRef]
  26. Tanaka, M.; Wilkinson, A.J.; Roberts, S.G. Ductile-brittle transition of polycrystalline iron- chromium alloys. J. Nucl. Mater. 2008, 378, 305–311. [Google Scholar] [CrossRef]
  27. Pacyna, J.; Mazur, A. The influence of grain size upon the fracture toughness of hot-work tool steel. Scand. J. Met. 1983, 12, 22–28. [Google Scholar]
  28. Reiser, J.; Hartmaier, A. Elucidating the dual role of grain boundaries as dislocation sources and obstacles as its impact on toughness and brittle-to-ductile transition. Sci. Rep. 2020, 10, 27939. [Google Scholar] [CrossRef]
  29. Werner, E. Der Einfluß der Korngröße, des Legierungsgehaltes und einer Kaltumformung auf die Bruchzähigkeit, Impact pf grain size on toughness and brittle-to-ductile transition. Z. Metallkd. 1988, 79, 585–590. [Google Scholar]
  30. Chiou, W.C., Jr.; Carter, E.A. Structure and Stability of Fe3C Cementite from First Principles. 2002, pp. 87–100. Available online: www.sciencedirect.com (accessed on 27 May 2024).
  31. Schönecker, S.; Li, X.; Börje, J.; Kwon, S.K.; Vitos, L. Thermal surface free energy and stress of iron. Sci. Rep. 2015, 5, 14860. [Google Scholar] [CrossRef] [PubMed]
  32. Suzudo, T.; Ebihara, K.; Tsuru, T.; Mori, H. Cleavage along {110} in bcc iron emit dislocations from the curved crack fronts. Sci. Rep. 2022, 12, 1970. [Google Scholar] [CrossRef] [PubMed]
  33. Chao, Y.J.; Ward, J.D., Jr.; Sands, R.G. Fracture Impact Energy and Ductile-Brittle Transition Temperature of Dual-Phase 590 Steel. SAE Trans. 2005, 114, 708–712. [Google Scholar]
  34. Badaruddin, M.; Wardono, H.; Zulhanif; Supriadi, H.; Salimor, M. Experimental investigation of mechanical properties of cold-drawn AISI 1018 steel at high-temperature steady-state conditions. J. Mater. Res. Technol. 2020, 8, 1893–1904. [Google Scholar] [CrossRef]
  35. Koo, B.W.; Chang, Y.J.; Hong, S.-P.; Kang, C.S. Experimental Measurement of Young’s Modulus from a Single Crystalline Cementite. Scr. Mater. 2014, 82, 25–28. [Google Scholar] [CrossRef]
  36. Inoue, T.; Qiu, H.; Ueji, R.; Kimura, Y. Ductile-to-Brittle Transition and Brittle Fracture Stress of Ultrafine-Grained Low Carbon Steel. Materials 2021, 14, 1634. [Google Scholar] [CrossRef] [PubMed]
  37. Hohenwarter, A.; Pippan, R. Fracture of ECAP-deformed iron and the role of extrinsic toughening mechanisms. Acta Mater. 2013, 61, 2973–2983. [Google Scholar] [CrossRef]
  38. Xu, T.; Wang, W.; Jiang, H. Study of micro crack propagation mechanism of ferrite-pearlite gas transmission pipeline steel with lamellar structure. Sci. Rep. 2022, 12, 18642. [Google Scholar] [CrossRef]
  39. Görzen, D.; Blinn, B.; Beck, T. Influence of the C Content on the Fatigue Crack Initiation and Short Crack Behavior of Cu Alloyed Steels. Metals 2023, 13, 1024. [Google Scholar] [CrossRef]
  40. Zhai, K.; Zhang, Y.; Yue, J.; Qiu, Y.; Zhou, X.; Zhao, K.; Yu, X.; Zheng, J.; Li, S.; Pin, D. Fracture surface microstructure and new fracture mechanism in the pearlite structure. J. Mater. Res. Technol. 2024, 31, 1885–1895. [Google Scholar] [CrossRef]
Figure 1. AISI 1018 steel, AFM tapping mode. Copyright ©2020 by Thomas L. Altshuler.
Metals 14 00871 g001
Figure 2. AISI 1018 steel cross-section, AFM tapping mode. Copyright ©2020 by Thomas L. Altshuler.
Metals 14 00871 g002
Figure 3. Pearlite platelets in AISI 1018 steel, AFM tapping mode. Copyright ©2020 by Thomas L. Altshuler.
Metals 14 00871 g003
Figure 4. AISI 1018 steel, AFM tapping mode. Copyright ©2020 by Thomas L. Altshuler.
Metals 14 00871 g004
Figure 5. AISI 1018 steel cross-section grain boundary wall, AFM tapping mode. Copyright ©2020 by Thomas L. Altshuler.
Metals 14 00871 g005
Figure 6. Three grain boundary walls, AFM contact mode. Published with permission from Springer Science [4].
Metals 14 00871 g006
Figure 7. AISI 1018 steel, AFM contact mode. Published with permission from Springer Science [4].
Metals 14 00871 g007
Figure 8. Polycrystalline iron, 14 ppm C, AFM tapping mode. Copyright ©2020 by Thomas L. Altshuler.
Metals 14 00871 g008
Figure 9. Specimen #3: Section scan across grain boundary pure iron, AFM tapping mode. Copyright ©2020 by Thomas L. Altshuler.
Metals 14 00871 g009
Figure 10. AISI 1018 steel, Specimen A, tensile test.
Metals 14 00871 g010
Figure 11. Polycrystal iron, 14 ppm C, tensile test.
Metals 14 00871 g011
Figure 12. Pure polycrystal 10 ppm carbon stress versus temperature.
Metals 14 00871 g012
Figure 13. Single-crystal iron, 0.005 ppm C and 44 ppm C, compression test at 293 °K.
Metals 14 00871 g013
Figure 14. 0.2% yield offset single-crystal iron, tension and compression tests.
Metals 14 00871 g014
Figure 15. Material constant ky for iron.
Metals 14 00871 g015
Table 1. Composition of steel and iron, ppm.
MetalAlCCrCoCuMnMoNiPSSi
Polycrystal AISI 1018 steel 30019001100 5007300100 60131400
Polycrystal iron, 14 ppm C1.514.42.46.70.90.610.221.5 69
Polycrystal iron, 10 ppm C [5]<1510557<0.01<52020710
Single-crystal iron, 0.005 ppm C 1000.005100 1001010040020 60
Single-crystal iron, 44 ppm C [6]10044100 1001010040020 60
Table 2. Specimen characteristics.
Metal, Specimen LabelGrain SizeHardnessSpecimen Size
Polycrystal AISI 1018 steel 15.9 µmKnoop 158Tensile: ¼ in. diameter ASTM E8 sub-size
Polycrystal iron, 14 ppm C127 µmKnoop 67.9Tensile: 1/8 in. diameter ASTM E8 sub-size
Polycrystal iron,10 ppm C [5]28.4 µmVickers 78.5Compression axis 1 ¯ 49 , Cylinder
0.050-inch diameter, 0.100 inch height
Single-crystal iron [5] Vickers 53.8
Disclaimer/Publisher’s Note: The statements, opinions and data contained in all publications are solely those of the individual author(s) and contributor(s) and not of MDPI and/or the editor(s). MDPI and/or the editor(s) disclaim responsibility for any injury to people or property resulting from any ideas, methods, instructions or products referred to in the content.

