Article

Machine-Learning-Assisted Design of Novel TiZrNbVAl Refractory High-Entropy Alloys with Enhanced Ductility

1
School of Materials Science and Engineering, Jiangsu University, Zhenjiang 212013, China
2
School of Materials Science and Physics, China University of Mining and Technology, Xuzhou 221116, China
3
Institute of Materials, Shanghai University, Shanghai 200444, China
*
Author to whom correspondence should be addressed.
Metals 2024, 14(8), 894; https://doi.org/10.3390/met14080894
Submission received: 11 July 2024 / Revised: 1 August 2024 / Accepted: 2 August 2024 / Published: 5 August 2024
(This article belongs to the Special Issue Numerical and Experimental Advances in Metal Processing)

Abstract

:
Refractory high-entropy alloys (RHEAs) typically exhibit excellent high-temperature strength but limited ductility. In this study, a comprehensive machine learning strategy with integrated material knowledge is proposed to predict the elongation of TiZrNbVAl RHEAs. By referring to the ductility theories, a set of cost-effective material features is developed with various mathematical forms of thermodynamic parameters. These features are proven to effectively incorporate material knowledge into ML modeling. They also offer potential alternatives to those obtained from costly first-principles calculations. Based on Pearson correlation coefficients, the linear relationships between pairwise features were compared, and the seven key features with the greatest impact on the model were selected for ML modeling. Regression tasks were performed to predict the ductility of TiZrNbVAl, and the CatBoost gradient boosting algorithm exhibiting the best performance was eventually selected. The established optimized model achieves high predictive accuracies exceeding 0.8. These key features were further analyzed using interpretable ML methods to elucidate their influences on various ductility mechanisms. According to the ML results, different compositions of TiZrNbVAl with excellent tensile properties were prepared. The experimental results indicate that Ti44Zr24Nb17V5Al10 and Ti44Zr26Nb8V13Al9 both exhibited ultimate tensile strengths of approximately 1180 MPa and elongations higher than 21%. They verified that the ML strategy proposed in this study is an effective approach for predicting the properties of RHEAs. It is a potential method that can replace costly first-principles calculations. Thermodynamic parameters have been shown to effectively predict alloy ductility to a certain extent.

1. Introduction

Nuclear fission offers a substantial energy potential that surpasses that of traditional renewable sources such as hydroelectric power [1]. Advanced fourth-generation nuclear reactors emphasize safety, economic viability, and sustainability. In order to guarantee the stable and self-sustained operation of fission reactions, increased requirements and challenges have been put forth for structural materials [2,3]. The structural material selection needs to simultaneously address multiple key properties including irradiation resistance, corrosion resistance, and creep resistance. In recent years, there has been widespread research interest in RHEAs due to their excellent fracture toughness [4,5,6], irradiation resistance [7,8,9], and outstanding high-temperature strength. However, poor ductility limited their applications [10,11], and some alloys even show catastrophic fracture with low elongation during tensile testing at room temperature [12,13,14]. Therefore, improving the ductility of RHEAs is of crucial significance.
Lai and Sheikh et al. [15,16] proposed that reducing the valence electron concentration (VEC) can improve the ductility of RHEAs. Based on this thought, Ti42.5Zr42.5Nb5Mo5Ta5 with an elongation of approximately 14.9% and tensile strength of around 907 MPa and Hf0.5Nb0.5Ta0.5Ti1.5Zr with an elongation of about 20% and tensile strength of approximately 1000 MPa were fabricated. Nguyen et al. [17] designed Ti45Zr25Nb25Ta5 according to the atomic misfit mechanism, achieving a tensile elongation of 18% and a tensile strength exceeding 900 MPa. Both of these mechanisms for enhancing ductility are achieved through solid solution strengthening. Huang et al. [18] employed a phase-transformation-induced approach by changing the Ta content to produce Ta0.4HfZrTi HEA with an elongation of around 30% and a tensile strength of about 1100 MPa, which was characterized as a dual-phase microstructure consisting of interwoven HCP lamella plates embedded in a BCC matrix. Wang et al. [19] adjusted the Co content and introduced V to fabricate an Al18Co22Fe20Ni35V5 eutectic HEA with an elongation of 16.1% and a tensile strength of 1157 MPa. Although these studies have achieved promising results in improving the performance of HEAs, there still remains a challenge in effectively identifying the most promising candidate compositions. In order to accelerate the research and development of high-performance materials, researchers have predominantly concentrated on employing computational approaches, such as high-throughput calculation of phase diagrams (CALPHAD) and density functional theory (DFT) [20,21]. Li et al. [22] designed a Ti30Zr30Hf16Nb24 RHEA with excellent phase stability using the CALPHAD method. After cold rolling and recrystallization annealing, the alloy exhibited a yield strength of approximately 800 MPa and a fracture elongation of up to 34%. Through DFT analysis, Lee et al. [23] demonstrated that compared to NbTaTiV, NbTaTiVZr exhibits lower Fermi level electron density, larger lattice distortion, and stronger charge transfer, indicating higher strength and lower ductility of NbTaTiVZr. However, CALPHAD is often limited by the availability of thermodynamic databases for vast compositional space, while DFT frequently requires long simulation time due to its small cell size. Therefore, effectively applying theoretical models to practical HEA alloy design still remains a challenge.
In recent years, with the development of materials genome engineering, data-driven methods represented by machine learning (ML) have been playing an increasingly important role in materials research and development [24,25,26,27]. Catal et al. [28] constructed a database based on 11 different elements and utilized machine learning to design Ti8Nb21Zr27Ta13Mo19V12, Ti10Nb19Zr15Ta43Mo7V6, and Ti10Nb20Zr37Mo21V12 RHEAs with high-temperature strength and good room temperature ductility. However, due to the wide distribution of elements in different alloys and the limited sample data, using elements as feature values for prediction is likely to result in poor model robustness and significant prediction bias. Therefore, alternative approaches must be considered. In earlier work, Mustafi et al. [29] demonstrated that reducing the atomic size difference in alloys can to some extent improve the ductility of multi-principal element alloys. Ye et al. [20] indicated that controlling the atomic size difference and mixing enthalpy within the ranges of 0–5% and −15 kJ/mol to −5 kJ/mol, respectively, can promote the formation of single-phase solid solutions in alloys. Additionally, parameters such as VEC and electronegativity can also influence some physical properties of alloys. Accordingly, Mei and Vazquez et al. [30,31] calculated the thermodynamic parameters of HEAs and used these parameters as features to construct a database. The machine learning model established using this database exhibited high accuracy.
In this study, we constructed a database containing 97 samples based on thermodynamic parameters as features. A machine learning model was built to predict the tensile elongation of the TiZrNbVAl RHEAs. RHEAs with excellent tensile properties predicted by ML were prepared using arc melting, and their microstructure and tensile properties were investigated.

2. Alloy Design and Experimental Methods

Figure 1 illustrates the process of design strategy and experimental validation for high-ductility RHEAs: (i) collecting a total of 97 sets of data for five-element alloys produced by arc melting, and transforming the alloy compositions into multiple thermodynamic parameters to establish the dataset; (ii) establishing ML models and selecting key features; (iii) narrowing down the prediction range to forecast the elongation of TiZrNbVAl RHEAs; (iv) experimental validation and testing.

2.1. Dataset Establishment

The original dataset is crucial for the accuracy of model predictions. Theoretically, the more data are collected, the more beneficial the data are for improving model performance. In this work, the effects of post-processes on the properties of TiZrNbVAl RHEAs were not considered; therefore, the collected data in the dataset are all from the quinary alloys without post-processes. A total of 97 sets of data for five-element alloys produced by arc melting were collected, with elongation as the target value, encompassing 17 elements including Al, Si, Ti, V, Cr, Mn, Fe, Co, Ni, Nb, Fe, Ta, Mo, Cu, Sn, Hf, and W.
The thermodynamic parameters of these 97 alloys would be calculated and used as features to establish a database. Currently known thermodynamic parameters such as atomic size differences, VEC, and mixing enthalpy can influence the ductility of alloys. In order to conduct a more comprehensive exploration, the feature space was expanded in this work, additional thermodynamic parameters were included, and their means and standard deviations were calculated. The following formulas are used to calculate the features of different quinary alloys [32]:
  • Average atomic size:
    a = i = 1 n c i r i
    where ci and ri are the atomic percentage and atomic radius of the ith element, respectively.
  • Standard deviation on the atomic size:
    σ a = i = 1 n c i ( 1 r i a ) 2
  • Average melting point of the contained elements:
    T m = i = 1 n c i T i
    where Ti is the melting temperature of the ith element.
  • Standard deviation on the melting point:
    σ T = i = 1 n c i ( 1 T i T m ) 2
  • Mixing enthalpy:
    Δ H m i x = 4 i j c i c j H i j
    where Hij and cj are the binary mixture enthalpy of the ith and jth elements and the atomic percentage of the jth element, respectively.
  • Standard deviation on the mixing enthalpy:
    σ H = i j c i c j ( H i j Δ H m i x ) 2
  • Mixing entropy:
    Δ S m i x = k b i = 1 n c i ln c i
    where kb is the Boltzmann constant (kb ≈ 1.380649 × 10⁻²³ J/K).
  • Pauling electronegativity:
    χ = i = 1 n c i χ i
    where χ i is electronegativity of the ith element.
  • Standard deviation on the Pauling electronegativity:
    σ χ = i = 1 n c i ( χ i χ ) 2
  • Average VEC:
    V E C = i = 1 n c i V E C i
    where VECi is the number of valence electrons of the ith element.
  • Standard deviation on the VEC:
    σ V E C = i = 1 n c i ( V E C i V E C ) 2
In summary, the above formulas have transformed all elemental features of the dataset into thermodynamic parameters. Adopting this method can transform the various elemental features contained in different alloys into a few fixed thermodynamic parameters, which can facilitate the establishment of subsequent models and improve model robustness.

2.2. Model Construction

Numerous studies have shown that keeping too many closely related feature descriptors can result in redundancy, ultimately hindering the effectiveness of algorithms [33]. Additionally, it may result in overfitting during the training process and diminish the generalization ability of the model. In order to reduce the essentially similar features in the initial feature set, the Pearson correlation coefficient matrix was introduced to visualize the interrelationships among these features.
After data preprocessing and feature dimension reduction, the performance of ML models was evaluated using the hold-out method, with 80% of the data randomly selected as the training set and the remaining 20% as the test set. A total of eight ML models, including Linear Regression, Ridge Regression, Lasso Regression, Support Vector Regression (SVR), Random Forest Regression (RFR), Multilayer Perceptron Regression (MLPR), CatBoost Regression, and XGBoost Regression were simulated, and their performance was assessed using Mean Absolute Error (MAE) and Mean Squared Error (MSE). The model error was calculated using the formula error = 1 n | ε p r e d i c t ε e x p e r i m e n t | ε e x p e r i m e n t × 100 % , where εpredict and εexperiment are the predicted elongation and measured elongation, respectively.

2.3. Composition Analysis and Selection

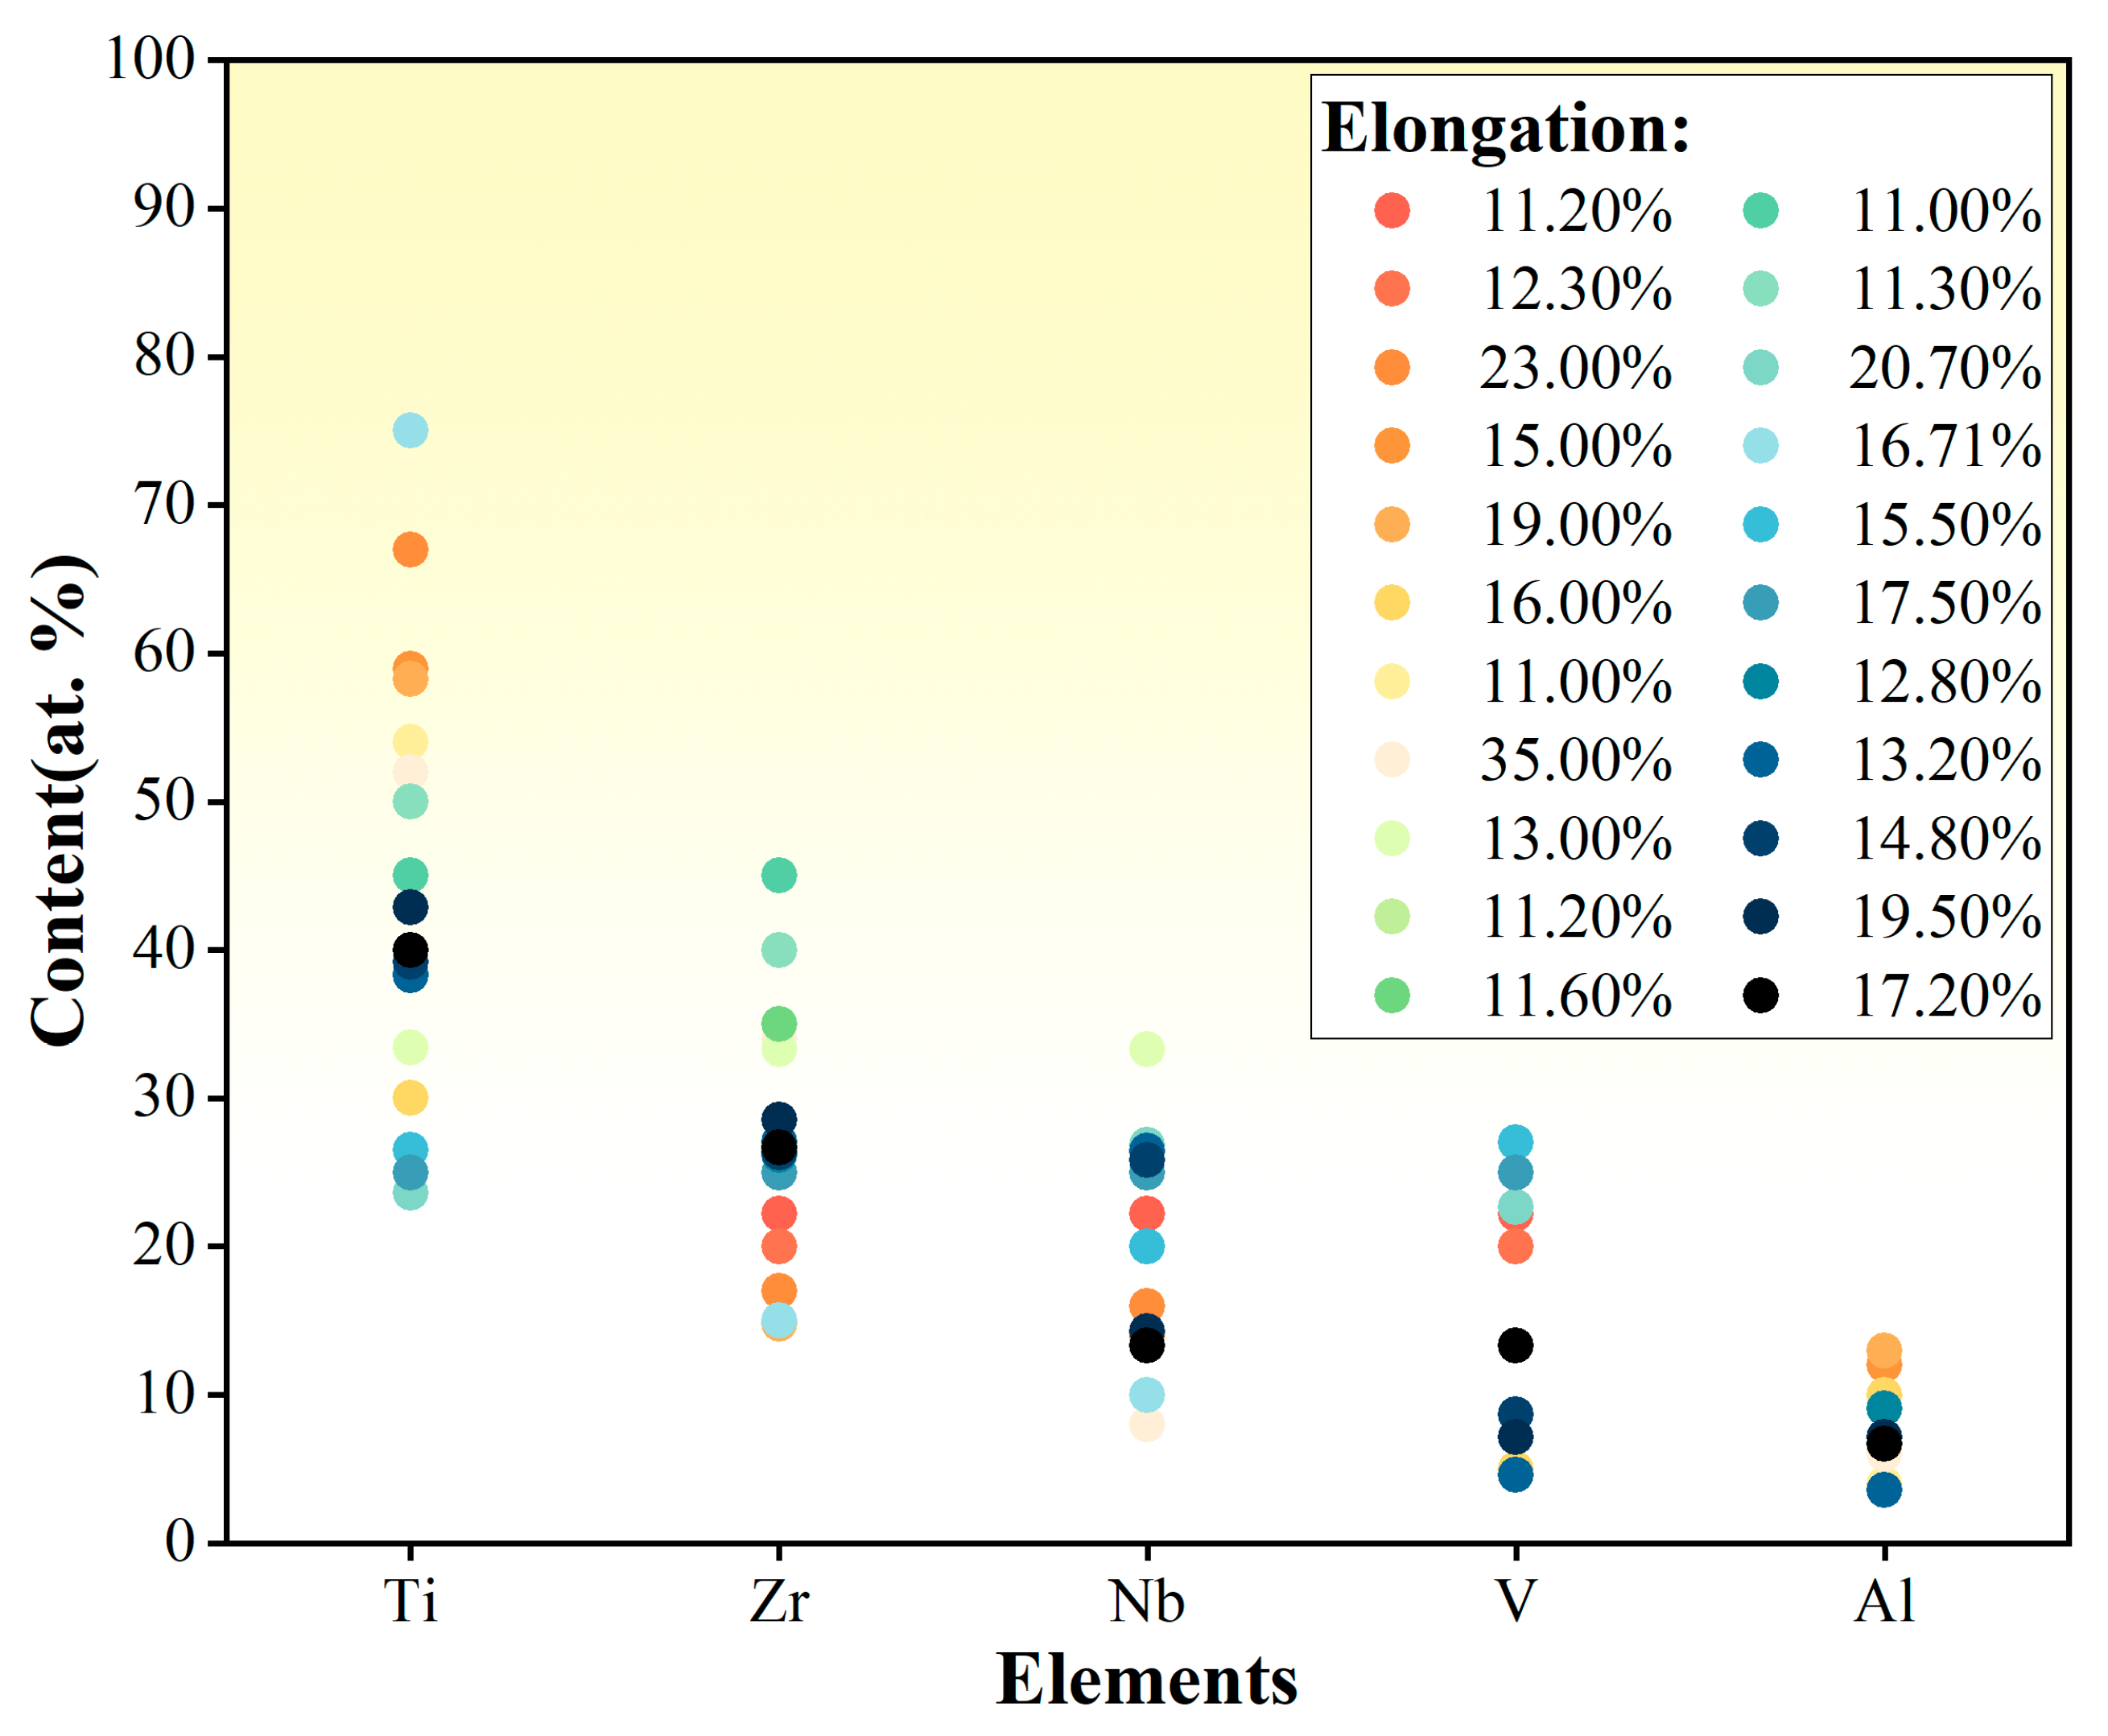
Through literature research, it was found that there are 22 types of alloys containing at least three elements of Ti, Zr, Nb, V, and Al that exhibit an elongation higher than 10% [13,34,35,36,37,38,39,40,41,42]. In order to reduce the number of alloys to be predicted, the distribution of the elements in these alloys was analyzed as shown in Figure 2. The content ranges of each element are as follows: Ti (25–75 at. %), Zr (15–45 at. %), Nb (8–35 at. %), V (4–27 at. %), Al (4–13 at. %). This is consistent with previous research, which indicates that the content of Al should be less than 15% [43], and the content of Ti should exceed 25% to ensure uniform deformability [34]. In summary, the content ranges of Ti, Zr, Nb, V, and Al were restricted to 5–45 at. %, 5–45 at. %, 5–30 at. %, 5–30 at. %, and 1–15 at. %, respectively. Ultimately, the number of alloys to be predicted was reduced to 184,481.
Using the most reliable ML model, predictions for the elongation of TiZrNbVAl alloys with various compositions were obtained. The predicted results would be thoroughly reviewed to identify the composition combinations with the best ductility.

2.4. Experimental Validation

Based on the predicted results, several distinctive alloy compositions were selected for experimental validation. Each alloy was prepared by vacuum arc melting using pure titanium (99.9 wt. %), zirconium (99.9 wt. %), niobium (99.9 wt. %), vanadium (99.9 wt. %) and aluminum (99.9 wt. %) in a water-cooled copper crucible. The ingot was turned over and remelted at least six times to ensure the alloy composition was homogeneous. Then the ingot was poured into a copper mold to obtain the cuboid ingot with a nominal size of 10 mm × 5 mm × 70 mm. Subsequently, specimens of approximately 8 mm × 8 mm × 5 mm were cut from the as-cast ingots. All the specimens were polished to #7000 grit by SiC papers and then polished using diamond particles with a size of 1.5 µm. All the specimens were cleaned in an ultrasonic water bath using alcohol and dried before tests.
Phase identification was conducted on an X-ray diffractometer (XRD). Spectra were collected in the 2θ range from 20° to 80° with a step of 0.01°. The XRD equipment model is HyPix-7000 (Rigaku, Tokyo, Japan). Microstructure was characterized by scanning electron microscopy (SEM) and transmission electron microscopy (TEM). The SEM equipment model is Nova NanoSEM 450 (FEI, Hillsboro, OR, USA), and the TEM equipment model is JEM-2100Plus (JEOL, Tokyo, Japan). The SEM specimens were corroded in a solution of Kroll reagent (80 mL of H2O, 15 mL of HNO3, and 5 mL of HF). The TEM specimens were prepared using ion beam thinning, with the equipment model being PIPS II 695 (Gatan, Pleasanton, CA, USA).
The ingots obtained from arc melting were cut into sheet specimens with nominal dimensions of 8 mm × 1.2 mm × 62 mm using an electrical discharge machine. The specimens were then polished to #600 grit by SiC papers for a static tensile test using a universal material testing machine at a strain rate of 5 × 10⁻⁴ s−1. At least three specimens were tested for each alloy. SEM was employed to observe the samples’ tensile fracture morphologies.

3. Results

3.1. Machine Learning Results

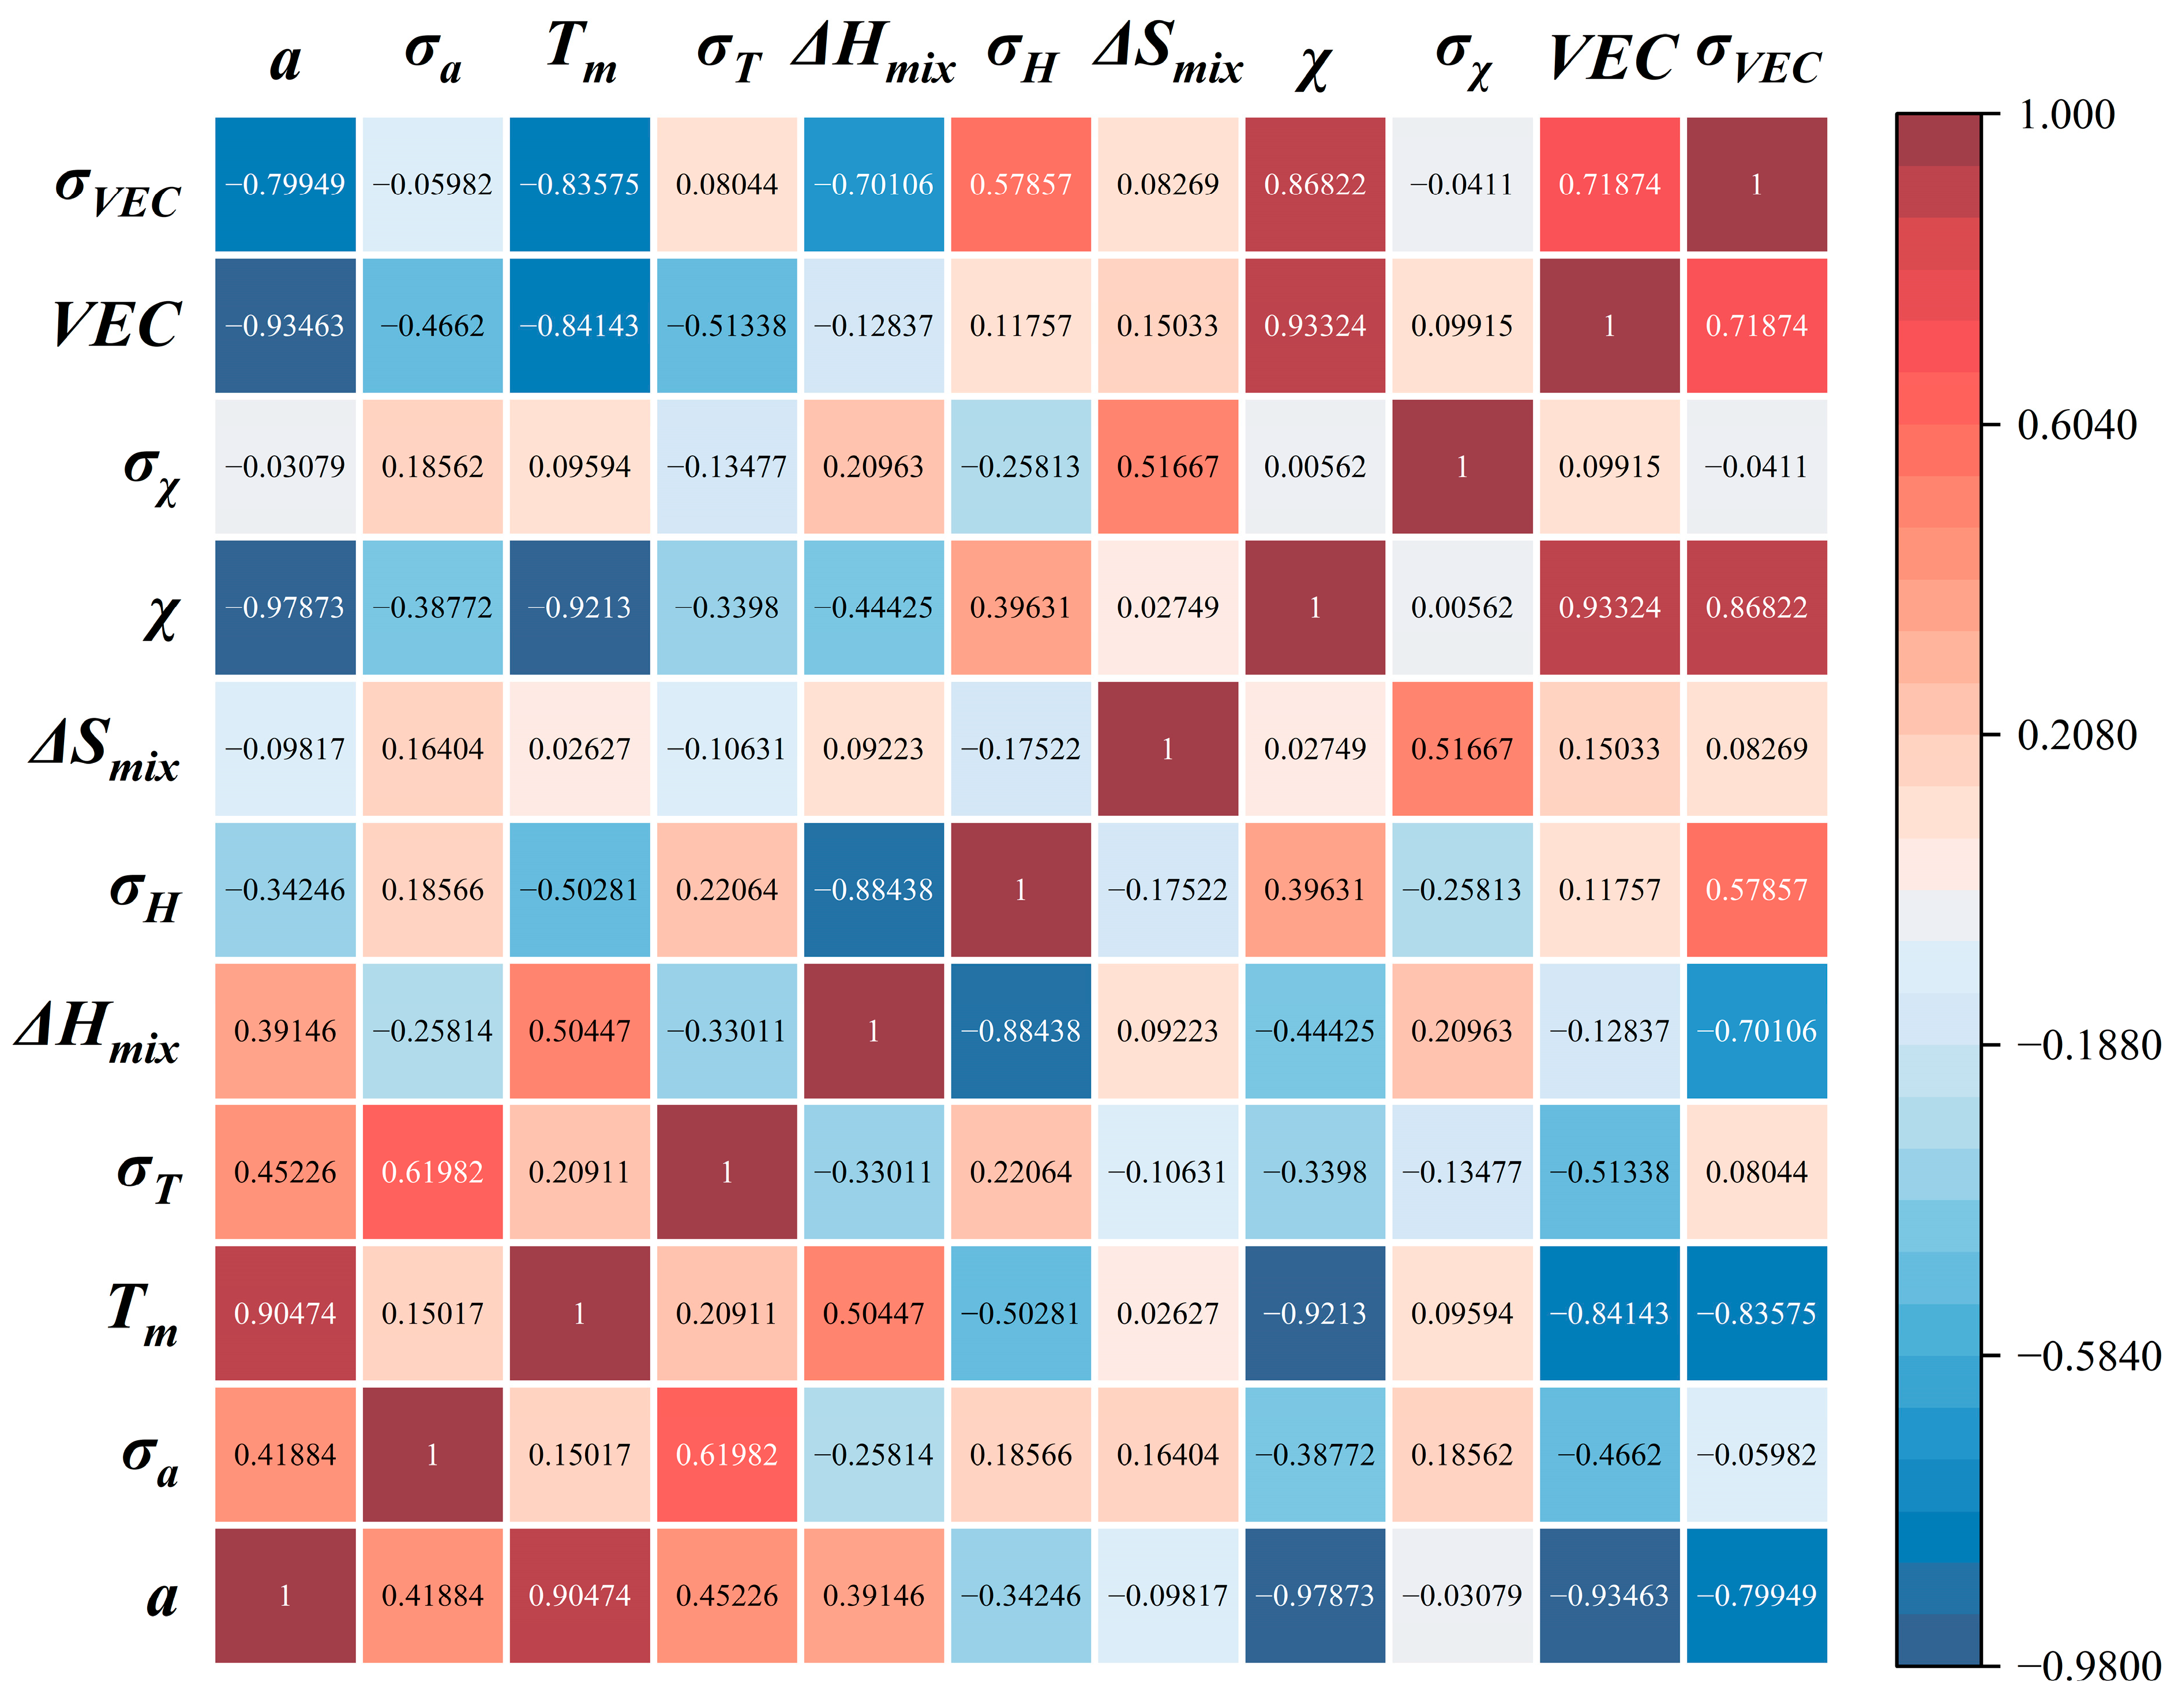
Computing the Pearson correlation coefficient between any two features helps to measure their linear correlation. Figure 3 illustrates the Pearson correlation coefficients between any two features. The red and blue colors indicate positive and negative correlations, respectively, while the intensity of the color used indicates the strength of the correlation. Alternatively, the numerical values in the figure can be used to assess the correlations between pairs of features. The features a, Tm, χ, and VEC exhibited high correlation, but VEC had a lower correlation with the other features. Therefore, VEC was retained among these four features. Similarly, feature σH was removed from ΔHmix and σH. Ultimately, among the 11 features, σa, σT, ΔHmix, ΔSmix, σχ, VEC, and σVEC were retained.
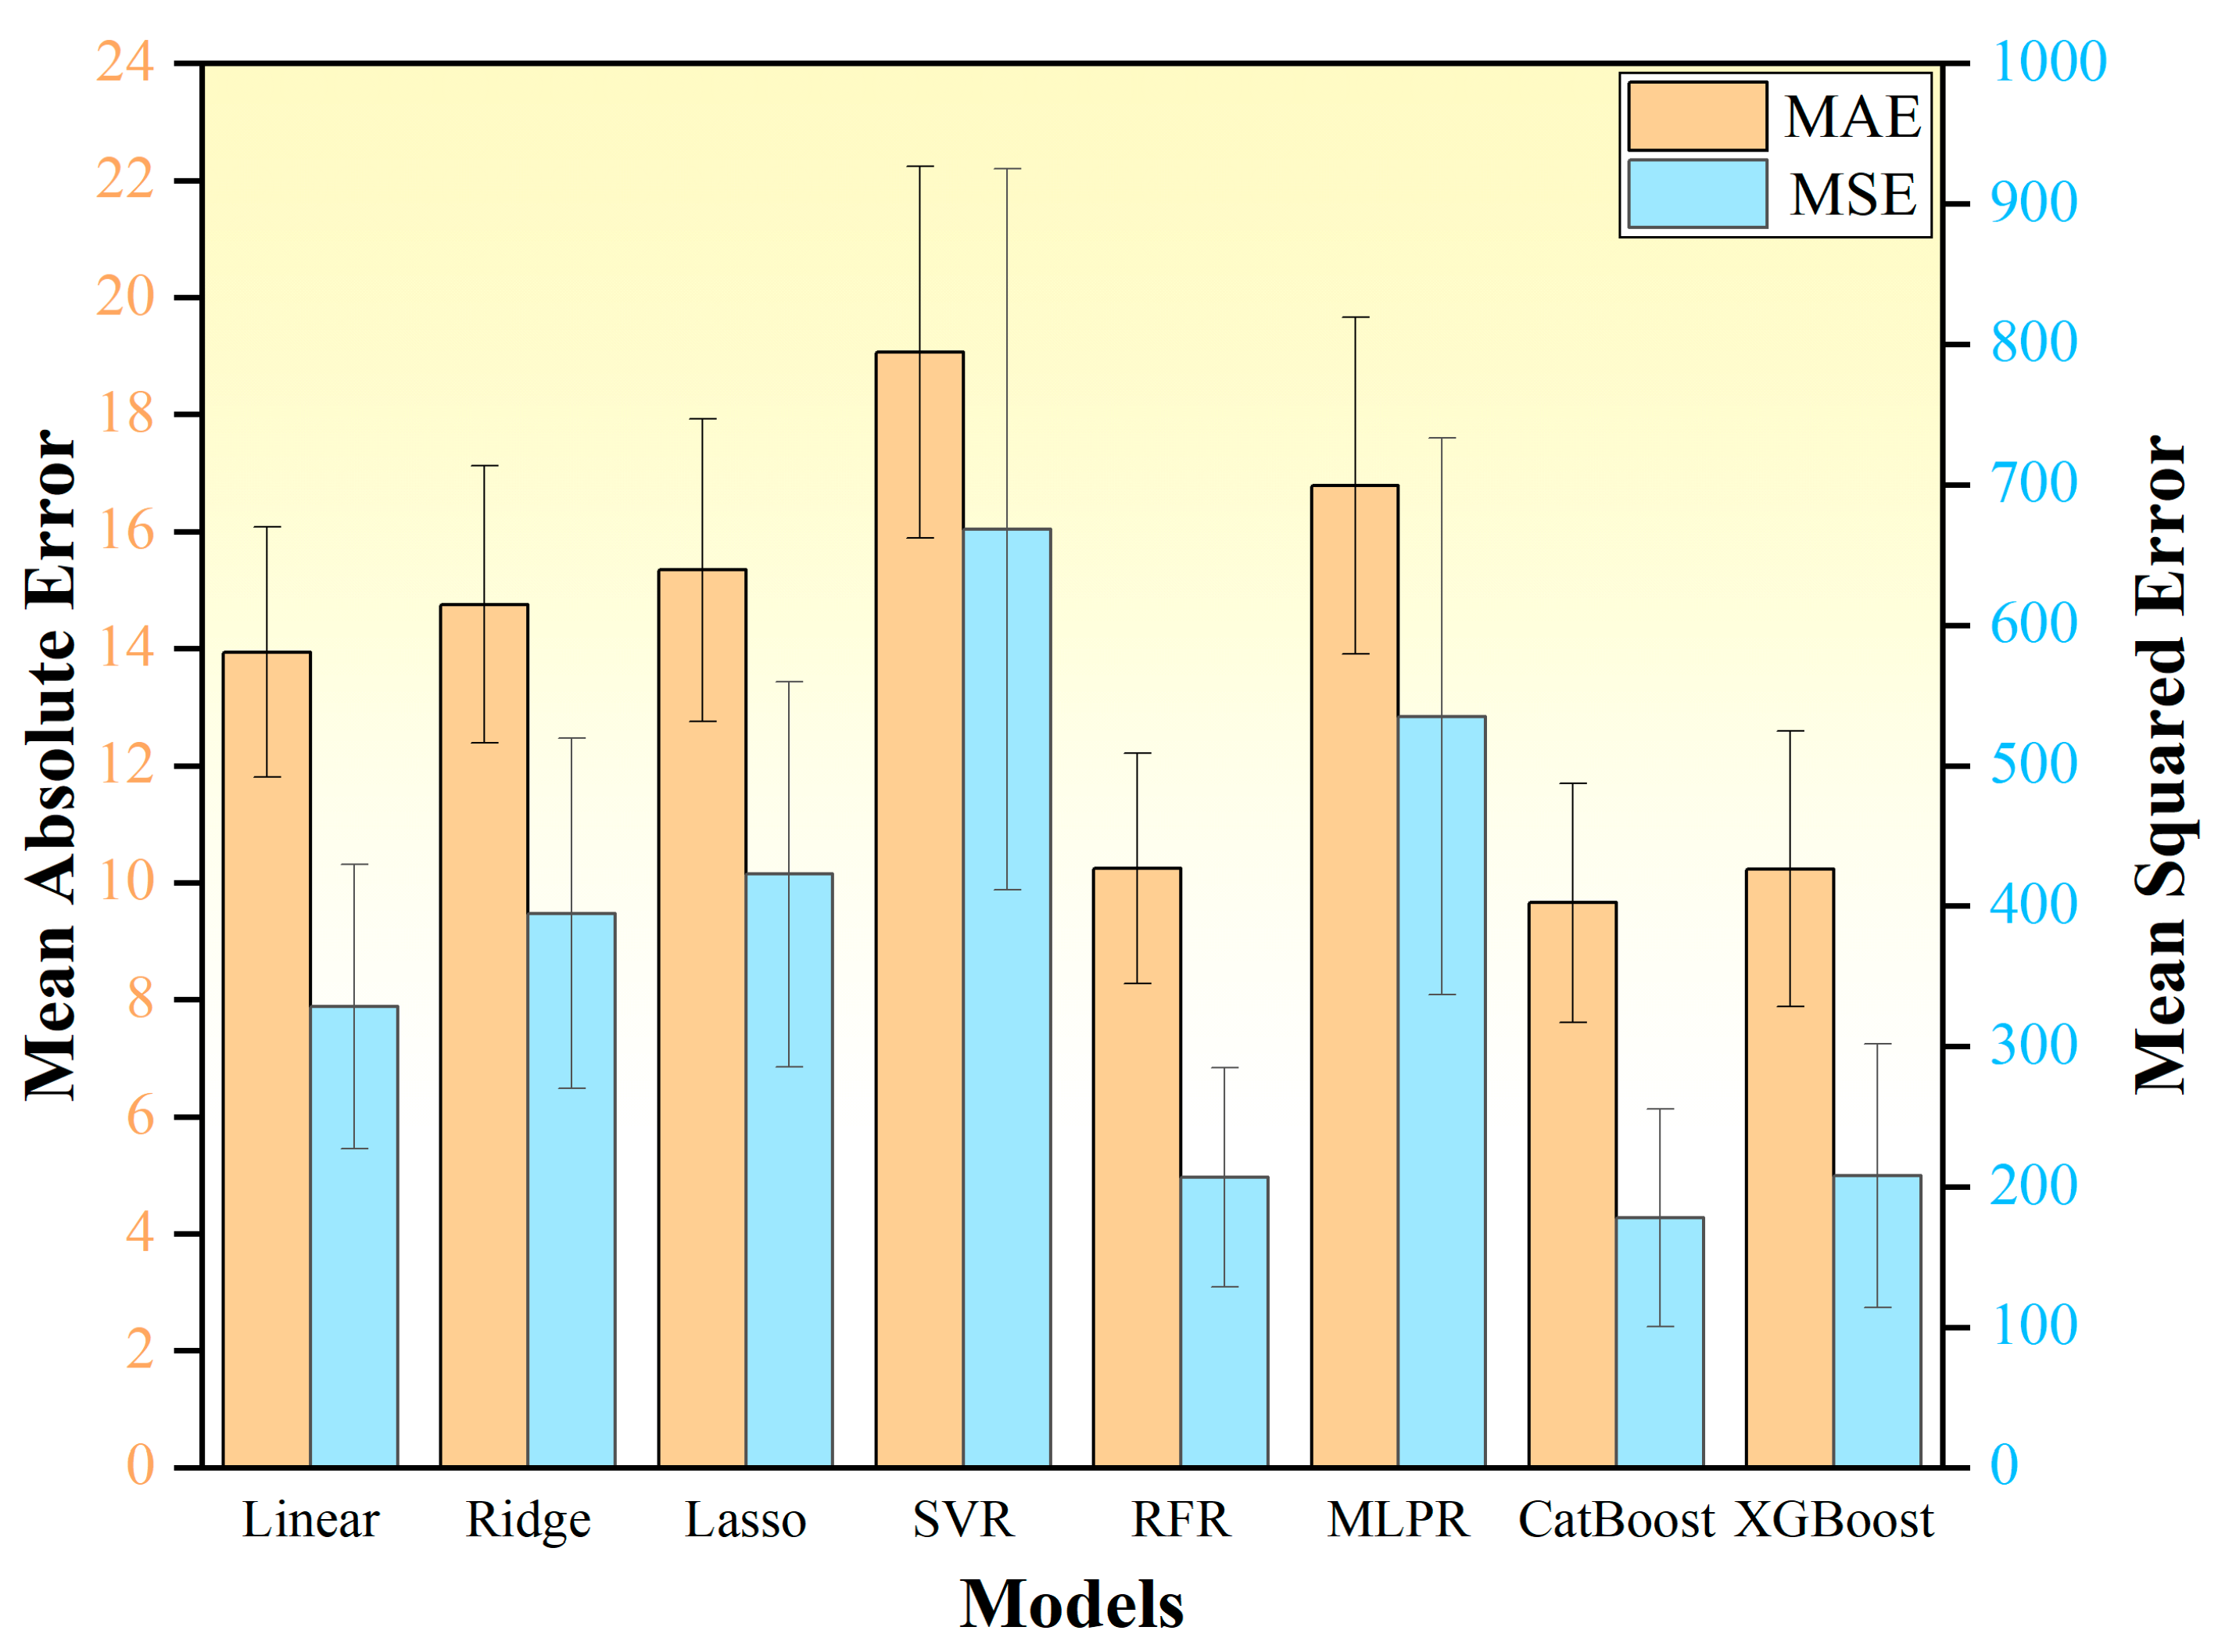
To eliminate the impact of random partitioning on model performance evaluation, the random partitioning was repeated 50 times for modeling assessment. The average results of the model errors from the 50 repetitions were taken as the predicted errors of each model. Figure 4 illustrates the MAE and MSE of the eight different models, and the CatBoost Regressor model exhibits the smallest errors in MAE and MSE. Therefore, in this study, the CatBoost Regressor model was selected. This model achieved an R2 of 0.8016 on the test set.
Figure 5 demonstrates the performance of the ML model, showing a good agreement between the predicted results and the actual elongation, with an error rate of 9.47%. This indicates the robustness of the CatBoost Regressor model. Utilizing the trained model, the elongation of 184,481 different compositions was predicted. Table 1 shows the top five alloys with predicted elongation and their corresponding thermodynamic parameters.

3.2. Experimental Validation

Based on the elongation prediction model proposed above, the five possible compositions with the best elongation properties were obtained, and they were Ti44Zr24Nb17V5Al10, Ti45Zr26Nb8V12Al9, Ti44Zr26Nb8V13Al9, Ti38Zr30Nb17V5Al10, and Ti42Zr30Nb9V10Al9. To validate the predictive results of ML, three ingots with compositions of Ti44Zr24Nb17V5Al10, Ti44Zr26Nb8V13Al9, and Ti38Zr30Nb17V5Al10 were fabricated, as the remaining two compositions were relatively similar to these three. Then they were cut into sheet specimens for tensile testing.
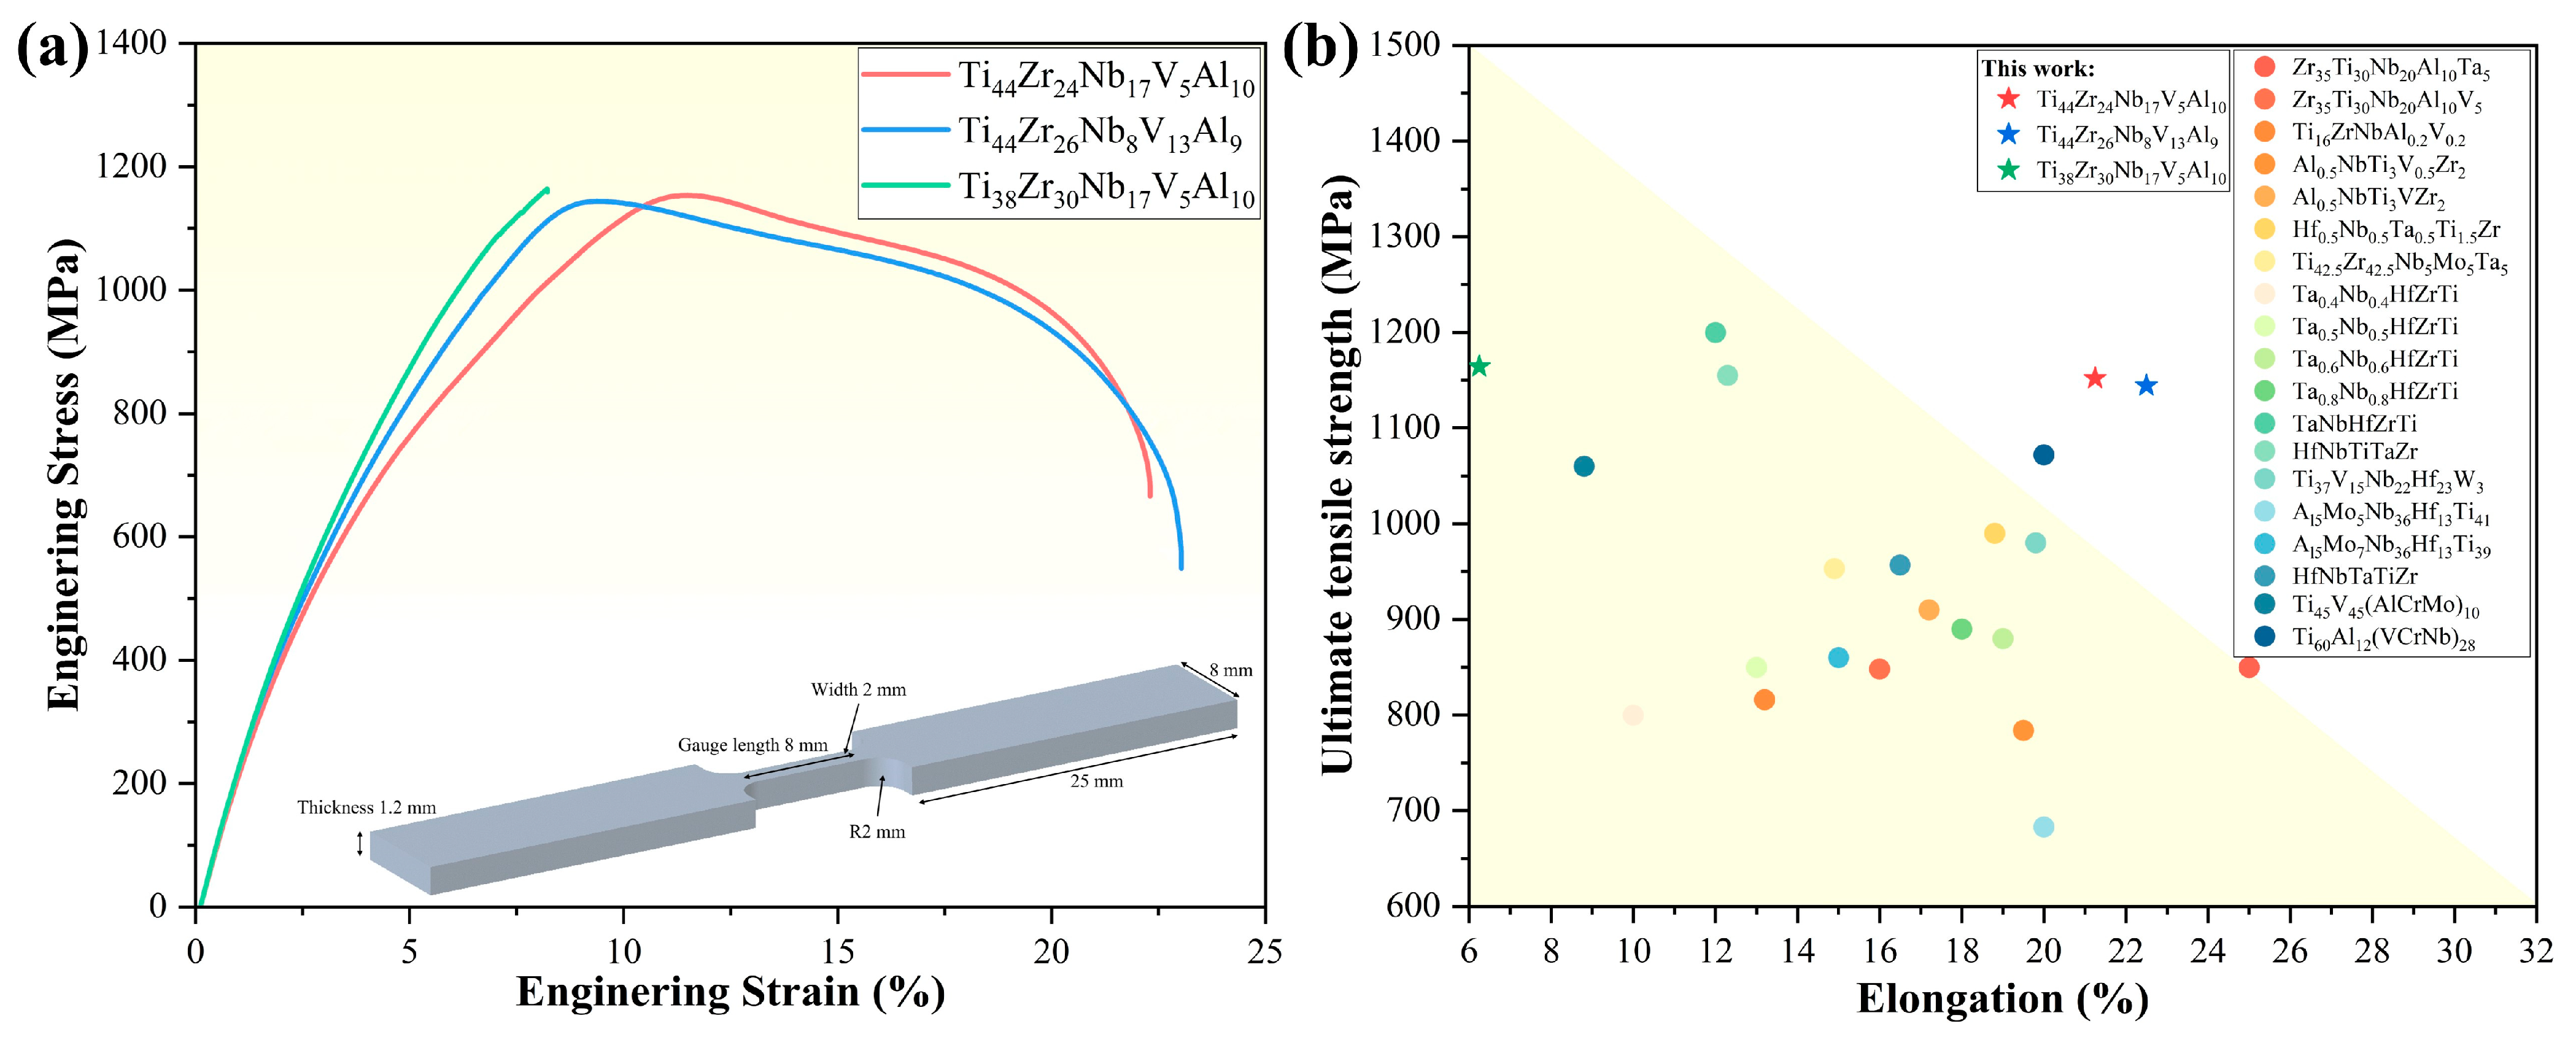
The stress–strain curves for the Ti44Zr24Nb17V5Al10, Ti44Zr26Nb8V13Al9, and Ti38Zr30Nb17V5Al10 RHEAs are depicted in Figure 6a. The ultimate tensile strength of these alloys was approximately 1180 MPa, with average fracture elongation of 21.25%, 22.5%, and 6.25%, respectively. Figure 6b illustrates the distribution of ultimate tensile strength and elongation of 18 quinary alloys with a single BCC crystal structure from different studies [4,15,16,35,41,42,44,45,46,47,48,49]. These alloys were all prepared by arc melting without post-treatment. Most of these alloys were located within the shaded area, whereas in this experimental design, Ti44Zr24Nb17V5Al10 and Ti44Zr26Nb8V13Al9 were situated outside the shaded region, indicating a synergistic enhancement in both ultimate tensile strength and elongation.
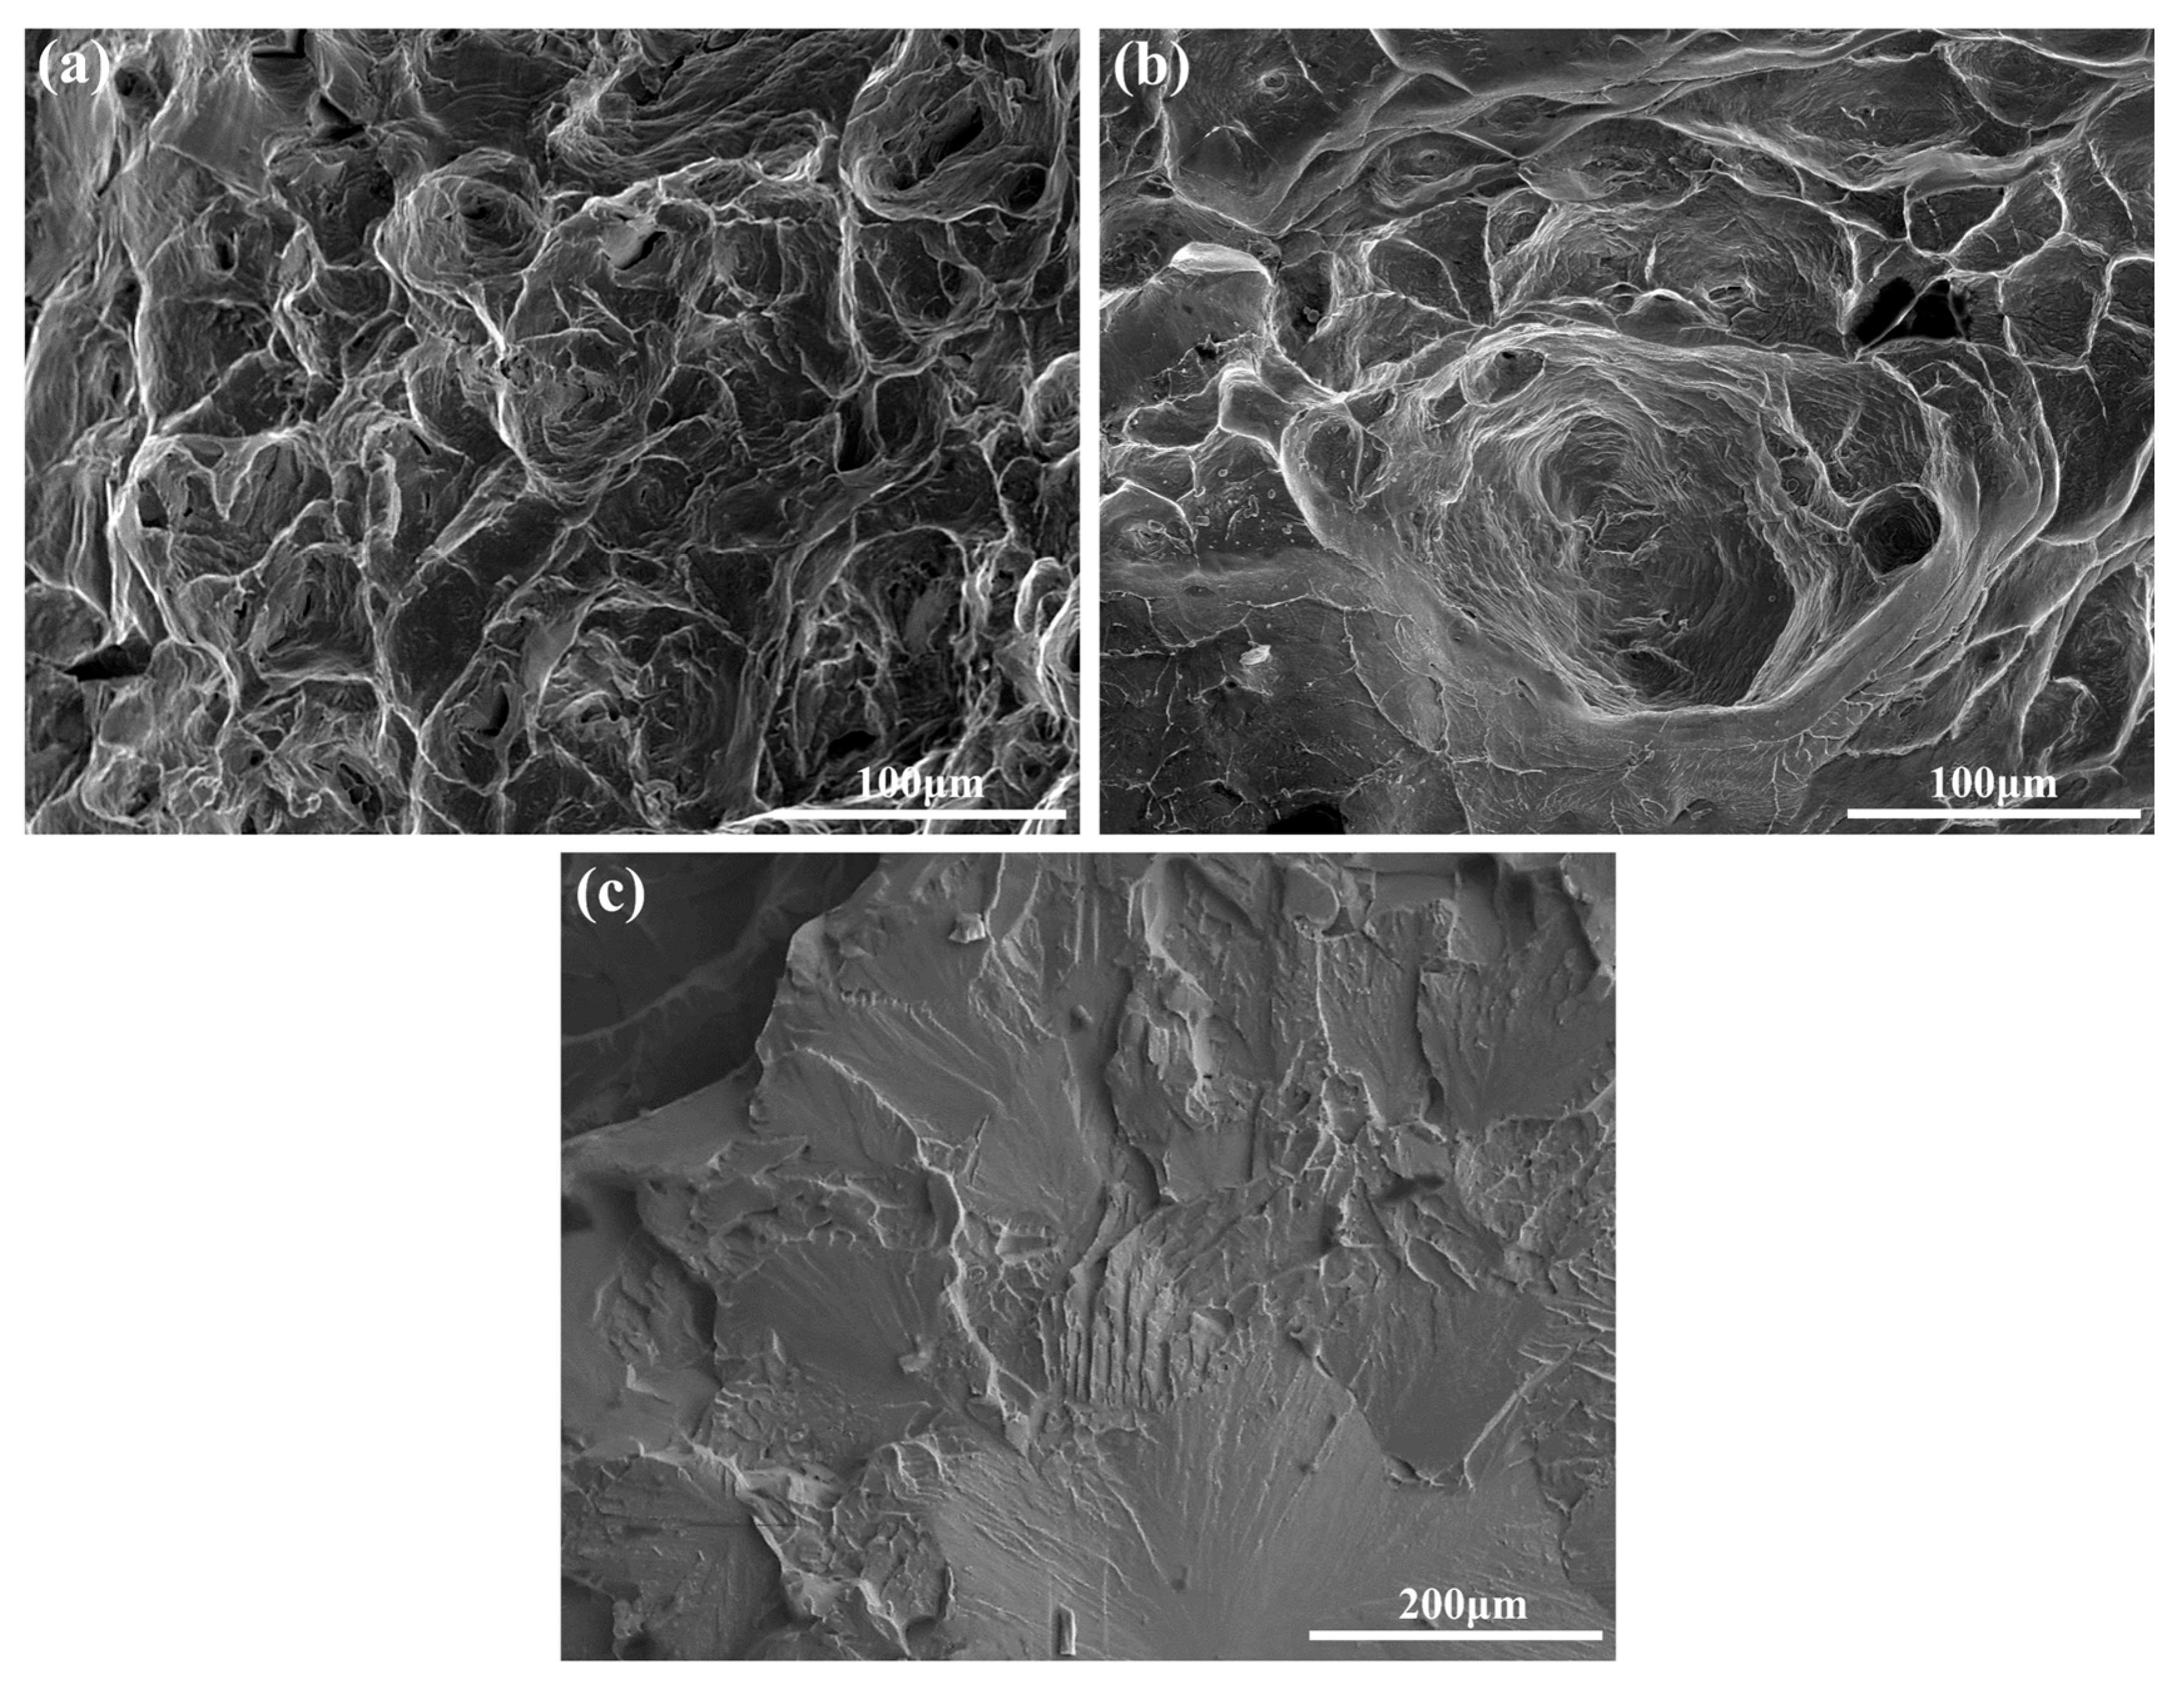
The fracture morphologies of the three RHEAs after tensile testing are illustrated in Figure 7. The fracture surfaces of Ti44Zr24Nb17V5Al10 and Ti44Zr26Nb8V13Al9 show the presence of dimples, as seen in Figure 7a,b. However, in the case of Ti38Zr30Nb17V5Al10, cleavage steps and river-like patterns were observed.

4. Discussion

4.1. Influence of Thermodynamic Parameters

For analyzing the effects of features on the ductility of RHEA, nine RHEA samples containing the Al element were randomly selected from studies, and the features of these samples are shown in Table 2. The elemental compositions of these nine RHEAs are similar to the TiZrNbVAl RHEAs studied in this paper, consisting of four refractory elements and Al. Their elongation ranges from 8.8% to 29%. To further analyze the relationship between each feature and the elongation, the SHapley Additive exPlanations (SHAP) diagram was employed. This method is rooted in the Shapley value derived from cooperative game theory, enabling the evaluation of the impacts of each feature on the model output. The detailed calculation method for SHAP can be found in Ref. [50].
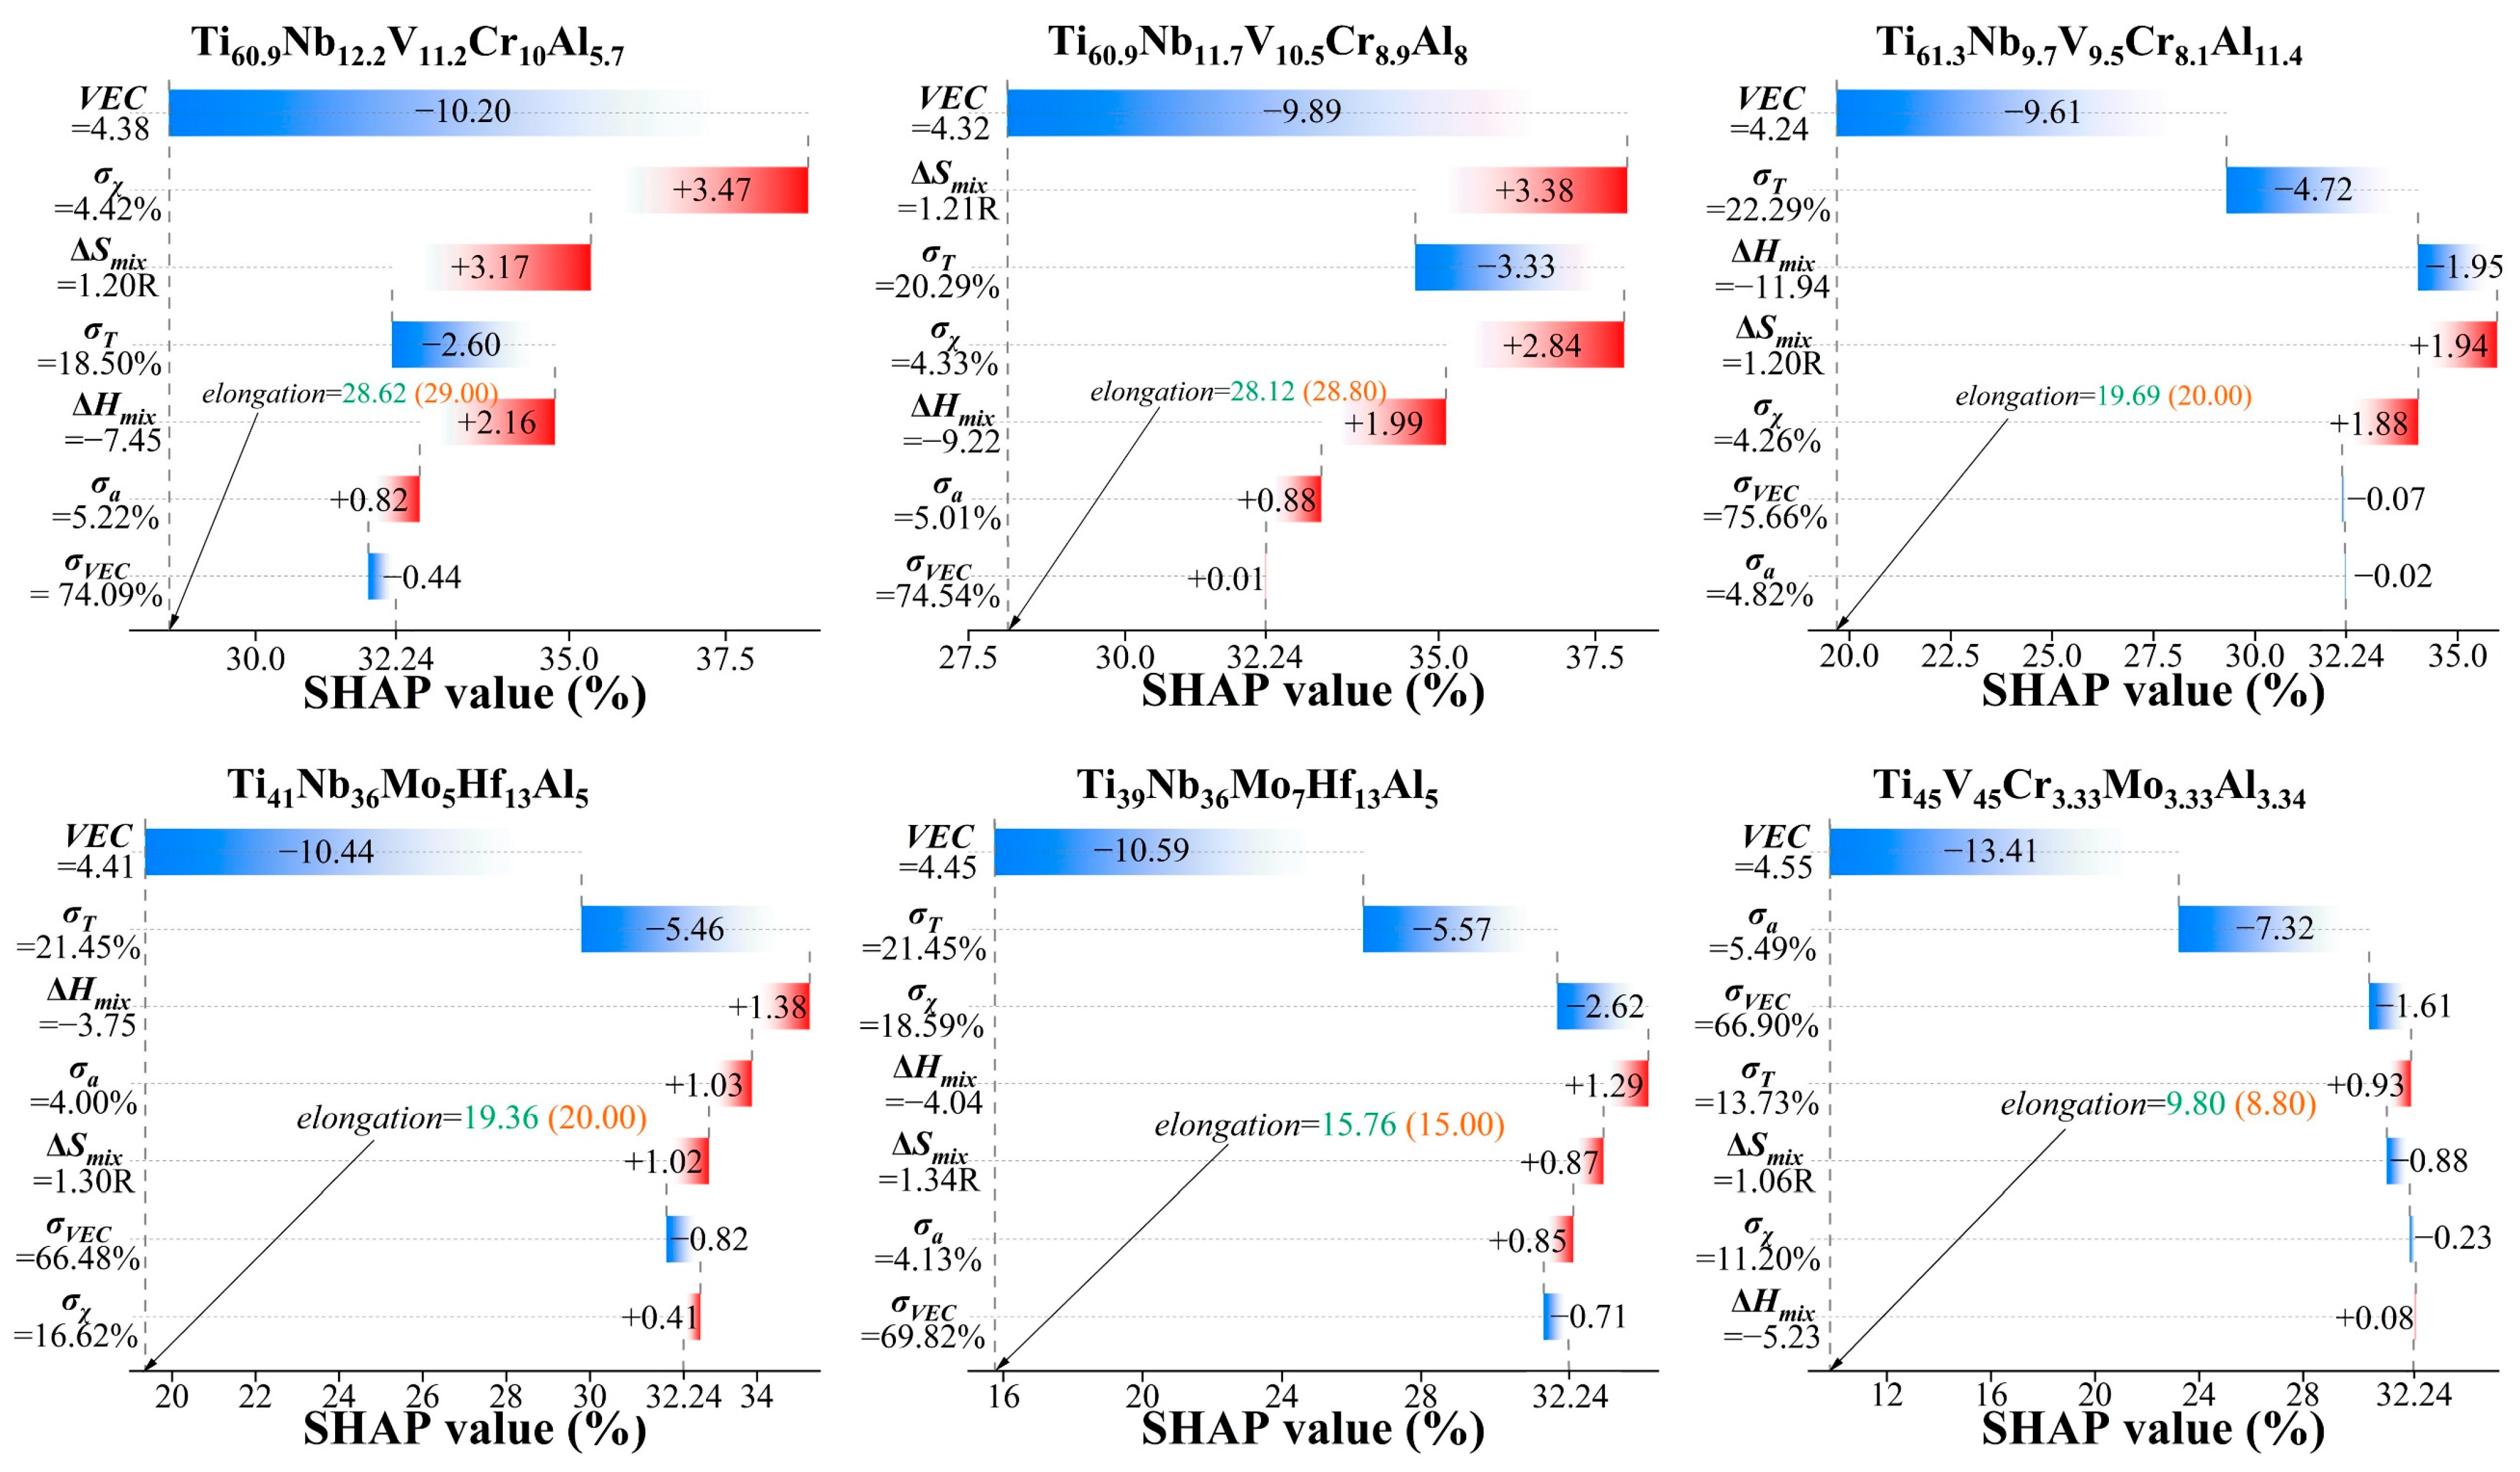
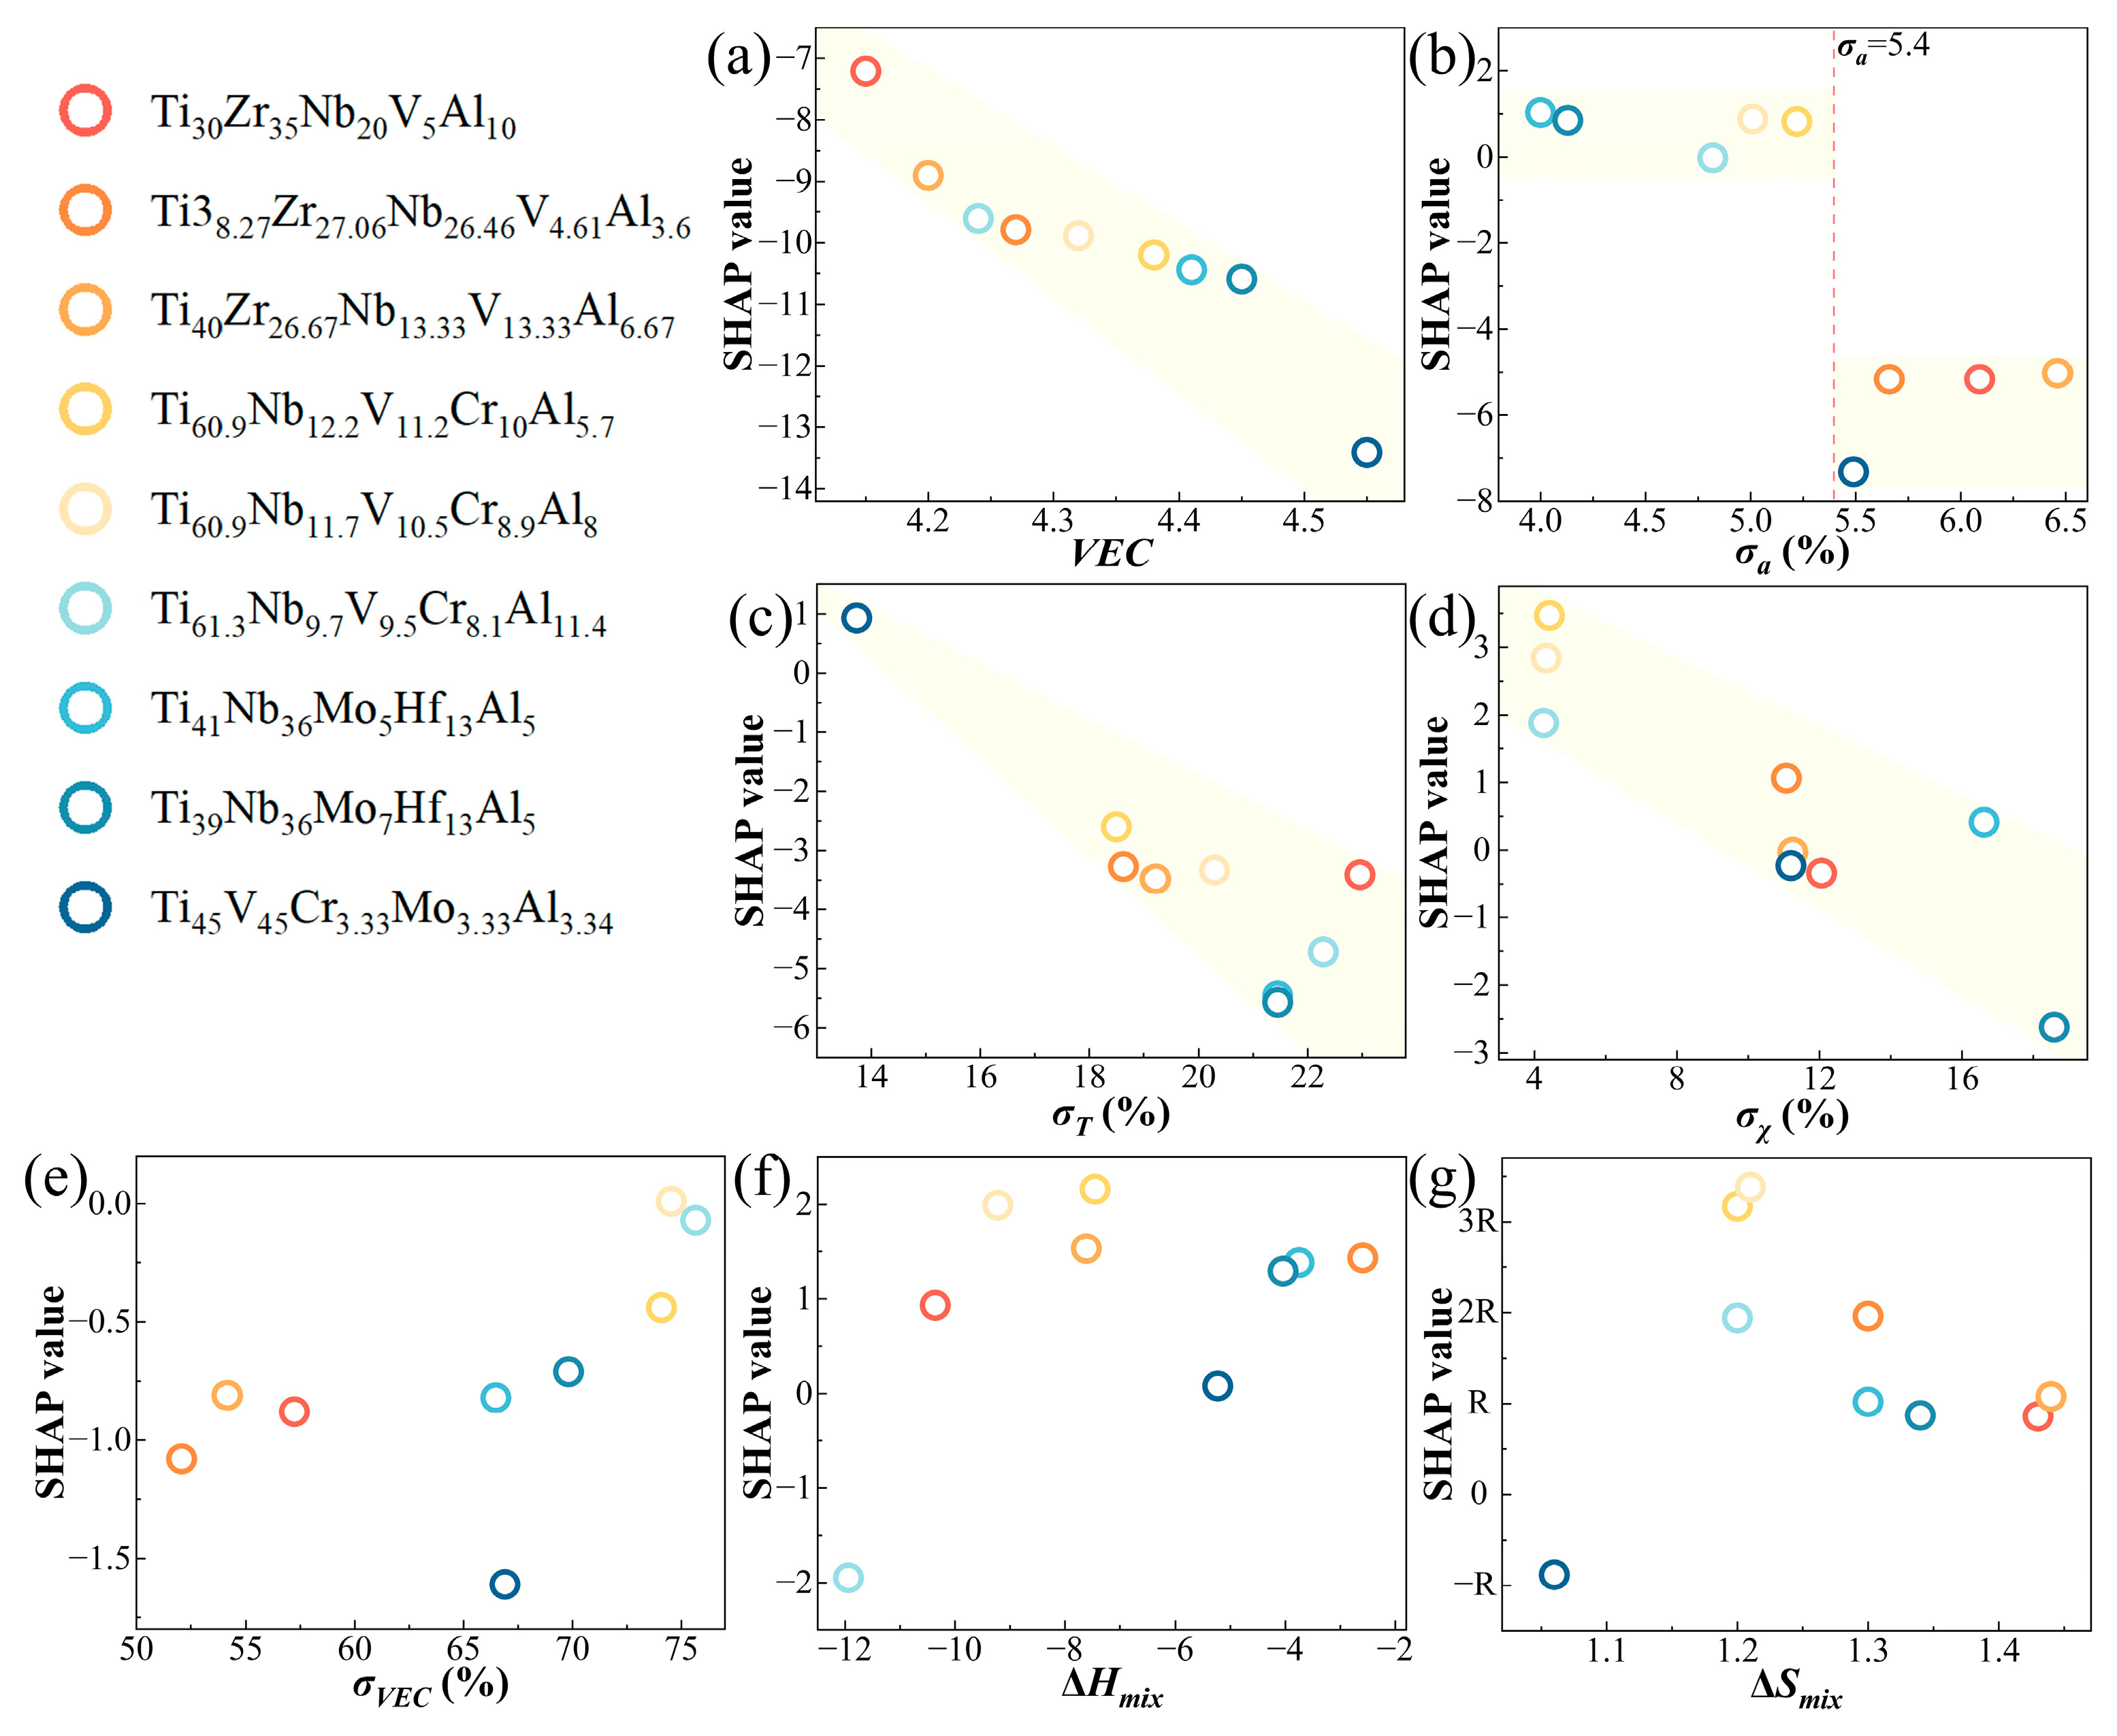
Figure 8 depicts the SHAP waterfall plot of the nine RHEA samples containing Al as shown in Table 2. Here, the green number is the predicted elongation, and the orange is the experimental elongation. The x-axis represents the SHAP value, while the y-axis represents each feature value of the samples. In feature ranking, the influence decreases sequentially from the top feature to the bottom feature. Blue color indicates a negative impact of a certain feature on the prediction, while red color indicates a positive impact. E[f(x)] represents the baseline value of SHAP, with the mean value of this model being 32.24. Taking the Ti30Zr35Nb20V5Al10 alloy as an example, from bottom to top, the negative impact of σλ = 12.06% is 0.34, the positive impact of ΔSmix = 1.43 R is 0.86, the negative impact of σVEC = 57.23% is 0.88, the positive impact of ΔHmix = −10.36 is 0.93, the negative impact of σT = 22.96% is 3.41, the negative impact of σa = 6.09% is 5.17, and finally, the top VEC = 4.15 results in a negative impact of 7.21. The final SHAP value of the sample is calculated as elongation = E[f(x)] − 0.34 + 0.86 − 0.88 + 0.93 − 3.41 − 5.17 − 7.21 = 17.02, indicating a predicted elongation of 17.02% for the sample. The elongations predicted by the ML model for these nine alloys were 17.02%, 16.84%, 16.60%, 28.62%, 28.12%, 19.69%, 19.36%, 15.76%, and 9.80%, respectively. The error rates between the experimental and predicted elongations for alloys Ti38.27Zr27.06Nb26.46V4.61Al3.6 and Ti45V45Cr3.33Mo3.33Al3.34 are 29.34% and 11.36%, respectively, while the error rates for the remaining seven RHEA samples are all less than 10%. This also serves as another validation of the accuracy of the ML model. It is obvious that the absolute values of VEC are consistently the largest in the nine individual SHAP plots, indicating that among these seven features, VEC has the most significant impact on the elongations of aluminum-containing RHEAs. Moreover, the smaller the VEC, the less negative impact it has on the elongations of RHEAs, as shown in Figure 9a. In other words, a smaller VEC corresponds to a higher fracture elongation. It is consistent with the findings of Sheikh et al. [16]. In order to further investigate the impact of other thermodynamic parameters on the elongation of RHEAs, a plot illustrating the relationship between SHAP value and thermodynamic parameters values was generated, as shown in Figure 9b–g. When σa is less than 5.4%, the impact of the standard deviation on the atomic size is near the zero axis or has a relatively minor positive effect (absolute SHAP value less than 2). When σa exceeds 5.4%, this feature exhibits a significant negative impact (absolute SHAP value greater than 5), as shown in Figure 9b. Furthermore, from the perspective of Figure 9c,d, it can be observed that the larger the features σT and σχ, the smaller their SHAP values. However, the three features σVEC, ΔHmix, and ΔSmix do not exhibit a clear linear or categorical relationship with the elongation of RHEAs.

4.2. Density and Phase Analysis

The density of a solid solution can be estimated using the rule of mixtures:
ρ mix = ( i = 1 n c i A i ) / ( i = 1 n c i A i / ρ i )
where Ai and are ρi the atomic weight and density of the ith element.
The calculated density was 5.66, 5.62, and 6.24 g/cm3 for Ti44Zr24Nb17V5All0, Ti44Zr26Nb8V13Al9, and Ti38Zr30Nb17V5Al10 RHEAs, respectively. At the same time, we also measured the density of the RHEAs based on Archimedes’ principle. When using this method to measure the volume of metals, small, often undetectable air bubbles may adhere to the surface of the samples, leading to an overestimation of the measured volume and thus introducing measurement error. Furthermore, due to the small volume of the samples, the accuracy of the volumetric reading in the graduated cylinder presents a challenge, and any deviation in the readings may also contribute to measurement error. The densities of the Ti44Zr24Nb17V5Al10, Ti44Zr26Nb8V13Al9, and Ti38Zr30Nb17V5Al10 RHEAs, as measured by the aforementioned method, were 5.65 g/cm3, 5.57 g/cm3, and 6.14 g/cm3, respectively. The experimental values are generally consistent with the calculated values.
The XRD results of the Ti44Zr24Nb17V5Al10, Ti44Zr26Nb8V13Al9, and Ti38Zr30Nb17V5Al10 RHEAs are shown in Figure 10. These alloys all showed a single BCC crystal structure with lattice constants of 3.3510 Å, 3.3513 Å, and 3.3482 Å, respectively. Additionally, a single-phase BCC solid solution can also be roughly predicted using thermodynamic standards. When average valence electron concentration VEC < 6.87 [51], mixing enthalpy −15 kJ/mol ≤ ΔHmix ≤ 5 kJ/mol, the entropy enthalpy ratio Ω ≥ 1.1( Ω = T m Δ S m i x | Δ H m i x | ), and the standard deviation on the atomic size σa ≤ 6.6% [52], a single-phase BCC solid solution is easily formed. The features of Ti44Zr24Nb17V5Al10, Ti44Zr26Nb8V13Al9, and Ti38Zr30Nb17V5Al10 all meet the above criteria.
Ren et al. [53] pointed out that the microstructure and properties of multi-component HEAs are primarily determined by the mixing entropy and mixing enthalpy. Generally, HEAs tend to form a single solid solution phase, but when the influence of mixing enthalpy is significant, intermetallic compounds may also exist in HEAs [54,55]. Zhang et al. [27] indicated that controlling the content of Ti in the alloy can reduce the fraction of Laves phases and provide an opportunity to form a single-phase BCC solid solution. However, due to the negative binary mixing enthalpies of Al with the other four elements (Ti, Zr, Nb, and V), which are −30 kJ/mol, −44 kJ/mol, −18 kJ/mol, and −16 kJ/mol, respectively, as well as the significant size difference between Zr (162 nm) and other atoms, brittle intermetallic compound phases are easily formed. Although this improves the strength and hardness, it reduces the room temperature ductility. Therefore, the single-phase structure of TiZrNbVAl RHEAs prepared in this study ensured their sufficient ductility.
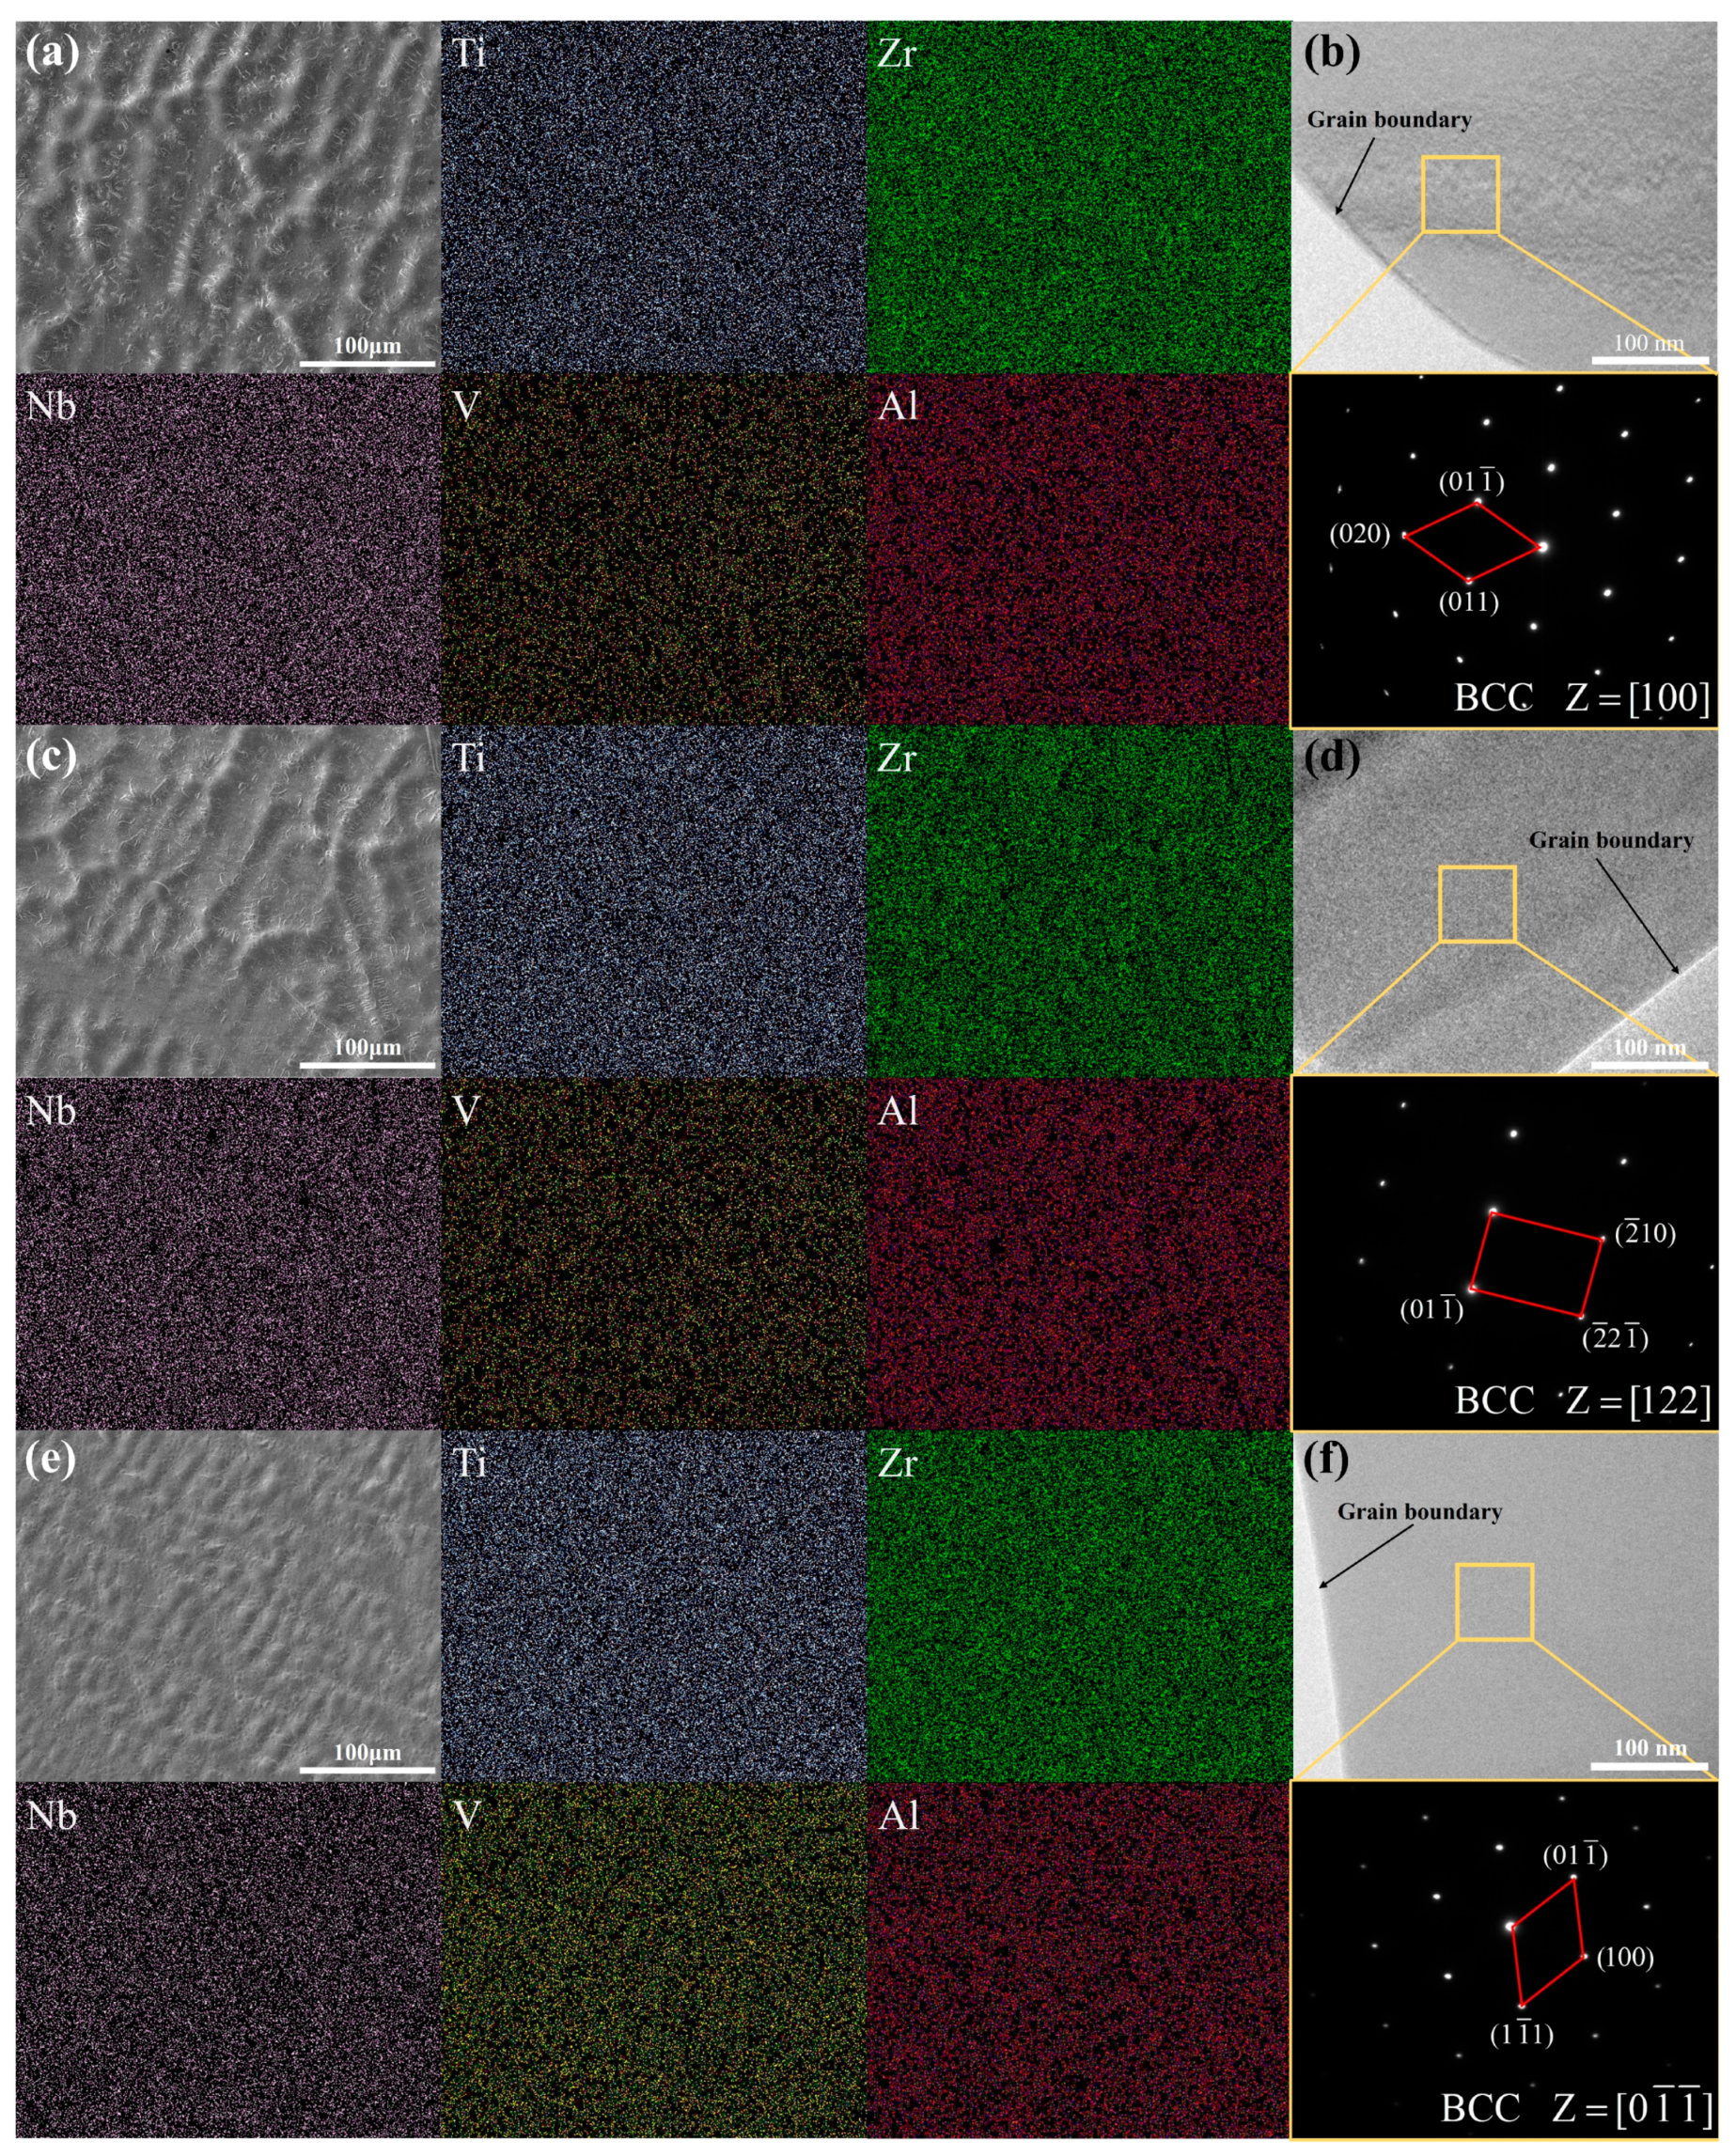
The microstructures of Ti44Zr24Nb17V5Al10, Ti44Zr26Nb8V13Al9, and Ti38Zr30Nb17V5Al10 RHEAs after chemical etching are shown in Figure 11a,c,e, respectively, revealing a dendritic-like morphology for each alloy. No significant element segregation was observed upon examination of the EDS mapping of the alloys. To further analyze the microstructure of the as-cast Ti44Zr24Nb17V5Al10, Ti44Zr26Nb8V13Al9, and Ti38Zr30Nb17V5Al10 RHEAs, transmission electron microscopy (TEM) characterization was conducted. As depicted in Figure 11b,d,f, the bright-field images and corresponding selected area electron diffraction (SAED) patterns of these three RHEAs indicate the presence of only a single BCC crystal structure in the alloys.

5. Conclusions

In this work, various ML models were compared in predicting the elongation of TiZrNbVAl RHEAs using an approach combining ML and thermodynamics. The RHEAs Ti44Zr24Nb17V5Al10, Ti44Zr26Nb8V13Al9, and Ti38Zr30Nb17V5Al10 with a BCC single-crystal structure were prepared, followed by a detailed investigation of their microstructures and mechanical properties.
  • By using Pearson correlation plots to select features, the risk of overfitting due to excessive feature variables was reduced. A CatBoost ML model was chosen based on a comparison with MAE and MSE, and it performed better with limited data in the dataset. The goodness of fit (R2) for this ML model was 0.8016, with an error rate of 9.47%.
  • According to the SHAP plots, the effect of VEC on the elongation of RHEAs was most pronounced, with a decrease in VEC leading to an enhancement in alloy ductility. The thermodynamic parameters σT and σχ exhibited a negative correlation with ductility. Generally, higher ductility was observed when σa was less than 5.4%. Balancing the relationships among these features should be considered for simultaneously improving the strength and toughness of RHEAs.
  • According to the predictions of the ML model, high-strength and high-toughness Ti44Zr24Nb17V5Al10 and Ti44Zr26Nb8V13Al9 RHEAs were discovered, with their ultimate tensile strengths both being around 1180 MPa and average fracture elongations of 21.25% and 22.5%, respectively.

Author Contributions

Conceptualization, X.Z.; methodology, X.Z. and Z.W.; software, Z.W. and J.Z.; validation, Z.W., J.Z. and Y.J.; investigation, Y.J., S.C. and D.W.; resources, X.Z. and Y.L.; data curation, S.C. and D.W.; writing—original draft, Z.W.; writing—review and editing, X.Z. and Y.L.; supervision, X.Z. and Y.L.; funding acquisition, X.Z. All authors have read and agreed to the published version of the manuscript.

Funding

This research was funded by the National Natural Science Foundation of China (Grant No. 52105349) and the College Student Innovation and Practice Fund of Artificial Intelligence and Intelligent Manufacturing of Jiangsu University (ZXJG2023053). The APC was funded by the National Natural Science Foundation of China (Granted No. 52105349).

Data Availability Statement

The original contributions presented in the study are included in the article, further inquiries can be directed to the corresponding author.

Conflicts of Interest

The authors declare no conflict of interest.

References

  1. Hao, J.; Zhang, Y.; Wang, Q.; Ma, Y.; Sun, L.; Zhang, Z. Enhanced plasticity in a Zr-rich refractory high-entropy alloy via electron irradiation. J. Nucl. Mater. 2024, 590, 154876. [Google Scholar] [CrossRef]
  2. Moschetti, M.; Burr, P.; Obbard, E.; Kruzic, J.J.; Hosemann, P.; Gludovatz, B. Design considerations for high entropy alloys in advanced nuclear applications. J. Nucl. Mater. 2022, 567, 153814. [Google Scholar] [CrossRef]
  3. Sadeghilaridjani, M.; Ayyagari, A.; Muskeri, S.; Hasannaeimi, V.; Salloom, R.; Chen, W.Y.; Mukherjee, S. Ion irradiation response and mechanical behavior of reduced activity high entropy alloy. J. Nucl. Mater. 2020, 529, 151955. [Google Scholar] [CrossRef]
  4. Fan, X.J.; Qu, R.T.; Zhang, Z.F. Remarkably high fracture toughness of HfNbTaTiZr refractory high-entropy alloy. J. Mater. Sci. Technol. 2022, 123, 70–77. [Google Scholar] [CrossRef]
  5. Wei, S.; Kim, S.J.; Kang, J.; Zhang, Y.; Zhang, Y.; Furuhara, T.; Park, E.S.; Tasan, C.C. Natural-mixing guided design of refractory high-entropy alloys with as-cast tensile ductility. Nat. Mater. 2020, 19, 1175–1181. [Google Scholar] [CrossRef]
  6. Gludovatz, B.; Hohenwarter, A.; Catoor, D.; Chang, E.H.; George, E.P.; Ritchie, R.O. A fracture-resistant high-entropy alloy for cryogenic applications. Science 2014, 345, 1153–1158. [Google Scholar] [CrossRef]
  7. Tian, Y.; Zhou, W.; Tan, Q.; Wu, M.; Qiao, S.; Zhu, G.; Dong, A.; Shu, D.; Sun, B. A review of refractory high-entropy alloys. Trans. Nonferrous Met. Soc. China (Engl. Ed.) 2022, 32, 3487–3515. [Google Scholar] [CrossRef]
  8. Zhang, H.; Zhu, Z.; Huang, H.; He, T.; Yan, H.; Zhang, Y.; Lu, Y.; Wang, T.; Li, T. Microstructures, mechanical properties, and irradiation tolerance of the Ti–Zr–Nb–V–Mo refractory high-entropy alloys. Intermetallics 2023, 157, 107873. [Google Scholar] [CrossRef]
  9. Yang, L.; Ge, H.; Zhang, J.; Xiong, T.; Jin, Q.; Zhou, Y.; Shao, X.; Zhang, B.; Zhu, Z.; Zheng, S.; et al. High He-ion irradiation resistance of CrMnFeCoNi high-entropy alloy revealed by comparison study with Ni and 304SS. J. Mater. Sci. Technol. 2019, 35, 300–305. [Google Scholar] [CrossRef]
  10. Stepanov, N.D.; Yurchenko, N.Y.; Skibin, D.V.; Tikhonovsky, M.A.; Salishchev, G.A. Structure and mechanical properties of the AlCrxNbTiV (x = 0, 0.5, 1, 1.5) high entropy alloys. J. Alloys Compd. 2015, 652, 266–280. [Google Scholar] [CrossRef]
  11. Yurchenko, N.; Panina, E.; Salishchev, G.; Stepanov, N. Structure and mechanical properties of near-eutectic refractory Al-Cr-Nb-Ti-Zr high entropy alloys. IOP Conf. Ser. Mater. Sci. Eng. 2021, 1014, 012058. [Google Scholar] [CrossRef]
  12. He, J.Y.; Liu, W.H.; Wang, H.; Wu, Y.; Liu, X.J.; Nieh, T.G.; Lu, Z.P. Effects of Al addition on structural evolution and tensile properties of the FeCoNiCrMn high-entropy alloy system. Acta Mater. 2014, 62, 105–113. [Google Scholar] [CrossRef]
  13. Zhang, Y.; Bu, Z.; Yao, T.; Yang, L.; Li, W.; Li, J. Novel BCC Ti-Al-Nb-Zr medium-entropy alloys with ultrahigh specific strength and ductility. J. Alloys Compd. 2023, 936, 107873. [Google Scholar] [CrossRef]
  14. Senkov, O.N.; Miracle, D.B.; Chaput, K.J.; Couzinie, J.P. Development and exploration of refractory high entropy alloysA review. J. Mater. Res. 2018, 33, 3092–3128. [Google Scholar] [CrossRef]
  15. Lai, W.; Liu, H.; Yu, X.; Yi, Y.; Li, W.; Zhou, S.; Cui, S.; Wang, X. A design of TiZr-rich body-centered cubic structured multi-principal element alloys with outstanding tensile strength and ductility. Mater. Sci. Eng. A 2021, 813, 141135. [Google Scholar] [CrossRef]
  16. Sheikh, S.; Shafeie, S.; Hu, Q.; Ahlström, J.; Persson, C.; Veselý, J.; Zýka, J.; Klement, U.; Guo, S. Alloy design for intrinsically ductile refractory high-entropy alloys. J. Appl. Phys. 2016, 120, 164902. [Google Scholar] [CrossRef]
  17. Nguyen, V.T.; Qian, M.; Shi, Z.; Song, T.; Huang, L.; Zou, J. Compositional design of strong and ductile (tensile) Ti-Zr-Nb-Ta medium entropy alloys (MEAs) using the atomic mismatch approach. Mater. Sci. Eng. A 2019, 742, 762–772. [Google Scholar] [CrossRef]
  18. Huang, H.; Wu, Y.; He, J.; Wang, H.; Liu, X.; An, K.; Wu, W.; Lu, Z. Phase-Transformation Ductilization of Brittle High-Entropy Alloys via Metastability Engineering. Adv. Mater. 2017, 29, 1701678. [Google Scholar] [CrossRef]
  19. Wang, X.; An, Z.; Cai, J.; Jiang, C.; Su, H.; Luo, X.; Li, Z.; Wu, S.; Yang, L.; Long, H.; et al. Design of novel AlCoFeNiV high-entropy alloys with high-strength and high-ductility. Mater. Charact. 2023, 203, 113059. [Google Scholar] [CrossRef]
  20. Ye, Y.F.; Wang, Q.; Lu, J.; Liu, C.T.; Yang, Y. High-entropy alloy: Challenges and prospects. Mater. Today 2016, 19, 349–362. [Google Scholar] [CrossRef]
  21. Miracle, D.B.; Senkov, O.N. A critical review of high entropy alloys and related concepts. Acta Mater. 2017, 122, 448–511. [Google Scholar] [CrossRef]
  22. Li, T.; Wang, S.; Fan, W.; Lu, Y.; Wang, T.; Li, T.; Liaw, P.K. CALPHAD-aided design for superior thermal stability and mechanical behavior in a TiZrHfNb refractory high-entropy alloy. Acta Mater. 2023, 246, 118728. [Google Scholar] [CrossRef]
  23. Lee, C.; Song, G.; Gao, M.C.; Ouyang, L.; An, K.; Fensin, S.J.; Liaw, P.K. Effects of Zr addition on lattice strains and electronic structures of NbTaTiV high-entropy alloy. Mater. Sci. Eng. A 2022, 831, 142293. [Google Scholar] [CrossRef]
  24. Lu, W.; Xiao, R.; Yang, J.; Li, H.; Zhang, W. Data mining-aided materials discovery and optimization. J. Mater. 2017, 3, 191–201. [Google Scholar] [CrossRef]
  25. Liu, Y.; Zhao, T.; Ju, W.; Shi, S. Materials discovery and design using machine learning. J. Mater. 2017, 3, 159–177. [Google Scholar] [CrossRef]
  26. Taylor, C.D.; Tossey, B.M. High temperature oxidation of corrosion resistant alloys from machine learning. NPJ Mater. Degrad. 2021, 5, 38. [Google Scholar] [CrossRef]
  27. Zhang, Z.; Li, M.; Cavin, J.; Flores, K.; Mishra, R. A Fast and Robust Method for Predicting the Phase Stability of Refractory Complex Concentrated Alloys using Pairwise Mixing Enthalpy. Acta Mater. 2022, 241, 118389. [Google Scholar] [CrossRef]
  28. Catal, A.A.; Bedir, E.; Yilmaz, R.; Swider, M.A.; Lee, C.; El-Atwani, O.; Maier, H.J.; Ozdemir, H.C.; Canadinc, D. Machine learning assisted design of novel refractory high entropy alloys with enhanced mechanical properties. Comput. Mater. Sci. 2024, 231, 112612. [Google Scholar] [CrossRef]
  29. Mustafi, L.; Nguyen, V.T.; Lu, S.L.; Song, T.; Murdoch, B.J.; Fabijanic, D.M.; Qian, M. Microstructure, tensile properties and deformation behaviour of a promising bio-applicable new Ti35Zr15Nb25Ta25 medium entropy alloy (MEA). Mater. Sci. Eng. A 2021, 824, 141805. [Google Scholar] [CrossRef]
  30. Mei, W.; Zhang, G.; Yu, K. Predicting elastic properties of refractory high-entropy alloys via machine-learning approach. Comput. Mater. Sci. 2023, 226, 112249. [Google Scholar] [CrossRef]
  31. Vazquez, G.; Singh, P.; Sauceda, D.; Couperthwaite, R.; Britt, N.; Youssef, K.; Johnson, D.D.; Arróyave, R. Efficient machine-learning model for fast assessment of elastic properties of high-entropy alloys. Acta Mater. 2022, 232, 117924. [Google Scholar] [CrossRef]
  32. Zhou, Z.; Zhou, Y.; He, Q.; Ding, Z.; Li, F.; Yang, Y. Machine learning guided appraisal and exploration of phase design for high entropy alloys. NPJ Comput. Mater. 2019, 5, 128. [Google Scholar] [CrossRef]
  33. Chen, L.; Jarlöv, A.; Seet, H.L.; Nai, M.L.S.; Li, Y.; Zhou, K. Exploration of V–Cr–Fe–Co–Ni high-entropy alloys with high yield strength: A combination of machine learning and molecular dynamics simulation. Comput. Mater. Sci. 2023, 217, 111888. [Google Scholar] [CrossRef]
  34. Huang, T.D.; Wu, S.Y.; Jiang, H.; Lu, Y.P.; Wang, T.M.; Li, T.J. Effect of Ti content on microstructure and properties of TixZrVNb refractory high-entropy alloys. Int. J. Miner. Metall. Mater. 2020, 27, 1318–1325. [Google Scholar] [CrossRef]
  35. Ma, Y.; Zhang, Y.; Zhang, Z.; Liu, L.; Sun, L. Two novel Zr-rich refractory high-entropy alloys with excellent tensile mechanical properties. Intermetallics 2023, 157, 107872. [Google Scholar] [CrossRef]
  36. Yao, T.T.; Zhang, Y.G.; Yang, L.; Bu, Z.Q.; Li, J.F. A metastable Ti–Zr–Nb–Al multi-principal-element alloy with high tensile strength and ductility. Mater. Sci. Eng. A 2022, 851, 143646. [Google Scholar] [CrossRef]
  37. Hu, S.; Li, T.; Su, Z.; Liu, D. Research on suitable strength, elastic modulus and abrasion resistance of Ti–Zr–Nb medium entropy alloys (MEAs) for implant adaptation. Intermetallics 2022, 140, 107401. [Google Scholar] [CrossRef]
  38. Wang, J.; Bai, S.; Tang, Y.; Li, S.; Liu, X.; Jia, J.; Ye, Y.; Zhu, L. Effect of the valence electron concentration on the yield strength of Ti–Zr–Nb–V high-entropy alloys. J. Alloys Compd. 2021, 868, 159190. [Google Scholar] [CrossRef]
  39. Calderon-Moreno, J.M.; Vasilescu, C.; Drob, S.I.; Ivanescu, S.; Osiceanu, P.; Drob, P.; Popa, M.; Preda, S.; Vasilescu, E. Microstructural and mechanical properties, surface and electrochemical characterisation of a new Ti-Zr-Nb alloy for implant applications. J. Alloys Compd. 2014, 612, 398–410. [Google Scholar] [CrossRef]
  40. Jiang, Y.; Wang, X.G.; Jiang, Z.Q.; Chen, M.; Sun, M.; Zhang, X.F. Phase transition and mechanical performance evolution in TiVZr-Nbx alloys. J. Alloys Compd. 2023, 937, 168458. [Google Scholar] [CrossRef]
  41. Wang, H.; Chen, W.; Fu, Z.; Chu, C.; Tian, Z.; Jiang, Z.; Wen, H. Lightweight Ti-Zr-Nb-Al-V refractory high-entropy alloys with superior strength-ductility synergy and corrosion resistance. Int. J. Refract Met. Hard. Mater. 2023, 116, 106331. [Google Scholar] [CrossRef]
  42. Wang, T.; Jiang, W.; Wang, X.; Jiang, B.; Rong, C.; Wang, Y.; Yang, J.; Zhu, D. Microstructure and properties of Al0.5NbTi3VxZr2 refractory high entropy alloys combined with high strength and ductility. J. Mater. Res. Technol. 2023, 24, 1733–1743. [Google Scholar] [CrossRef]
  43. Yurchenko, N.; Panina, E.; Tojibaev, A.; Novikov, V.; Salishchev, G.; Zherebtsov, S.; Stepanov, N. Effect of B2 ordering on the tensile mechanical properties of refractory AlxNb40Ti40V20−x medium-entropy alloys. J. Alloys Compd. 2023, 937, 168465. [Google Scholar] [CrossRef]
  44. Yuan, Y.; Wu, Y.; Yang, Z.; Liang, X.; Lei, Z.; Huang, H.; Wang, H.; Liu, X.; An, K.; Wu, W.; et al. Formation, structure and properties of biocompatible TiZrHfNbTa high-entropy alloys. Mater. Res. Lett. 2019, 7, 225–231. [Google Scholar] [CrossRef]
  45. Zýka, J.; Málek, J.; Veselý, J.; Lukáč, F.; Čížek, J.; Kuriplach, J.; Melikhova, O. Microstructure and room temperature mechanical properties of different 3 and 4 element medium entropy alloys from HfNbTaTiZr system. Entropy 2019, 21, 114. [Google Scholar] [CrossRef] [PubMed]
  46. Huang, W.; Hou, J.; Wang, X.; Qiao, J.; Wu, Y. Excellent room-temperature tensile ductility in as-cast Ti37V15Nb22Hf23W3 refractory high entropy alloys. Intermetallics 2022, 151, 107735. [Google Scholar] [CrossRef]
  47. Huang, R.; Wang, W.; Li, T.; Zhang, L.; Amar, A.; Chen, X.; Ren, Z.; Lu, Y. A novel AlMoNbHfTi refractory high-entropy alloy with superior ductility. J. Alloys Compd. 2023, 940, 168821. [Google Scholar] [CrossRef]
  48. Di, Y.; Wang, M.; Zhang, L.; Yan, H.; Zhang, Y.; Lu, Y. A novel Ti45V45(AlCrMo)10 lightweight medium-entropy alloy with outstanding mechanical properties. Mater. Lett. 2023, 339, 134089. [Google Scholar] [CrossRef]
  49. Liao, Y.C.; Ye, W.T.; Chen, P.S.; Tsai, P.H.; Jang, J.S.C.; Hsieh, K.C.; Chen, C.Y.; Huang, J.C.; Wu, H.J.; Lo, Y.C.; et al. Effect of Al concentration on the microstructural and mechanical properties of lightweight Ti60Alx(VCrNb)40-x medium-entropy alloys. Intermetallics 2021, 135, 107213. [Google Scholar] [CrossRef]
  50. Jas, K.; Dodagoudar, G.R. Explainable machine learning model for liquefaction potential assessment of soils using XGBoost-SHAP. Soil Dyn. Earthq. Eng. 2023, 165, 107662. [Google Scholar] [CrossRef]
  51. Guo, S.; Ng, C.; Lu, J.; Liu, C.T. Effect of valence electron concentration on stability of fcc or bcc phase in high entropy alloys. J. Appl. Phys. 2011, 109, 103505. [Google Scholar] [CrossRef]
  52. Yang, X.; Zhang, Y. Prediction of high-entropy stabilized solid-solution in multi-component alloys. Mater. Chem. Phys. 2012, 132, 233–238. [Google Scholar] [CrossRef]
  53. Ren, M.X.; Li, B.S.; Fu, H.Z. Formation condition of solid solution type high-entropy alloy. Trans. Nonferrous Met. Soc. China (Engl. Ed.) 2013, 23, 991–995. [Google Scholar] [CrossRef]
  54. Zhang, W.; Liaw, P.K.; Zhang, Y. Science and technology in high-entropy alloys. Sci. China Mater. 2018, 61, 2–22. [Google Scholar] [CrossRef]
  55. Tan, Y.; Li, J.; Tang, Z.; Wang, J.; Kou, H. Design of high-entropy alloys with a single solid-solution phase: Average properties vs. their variances. J. Alloys Compd. 2018, 742, 430–441. [Google Scholar] [CrossRef]
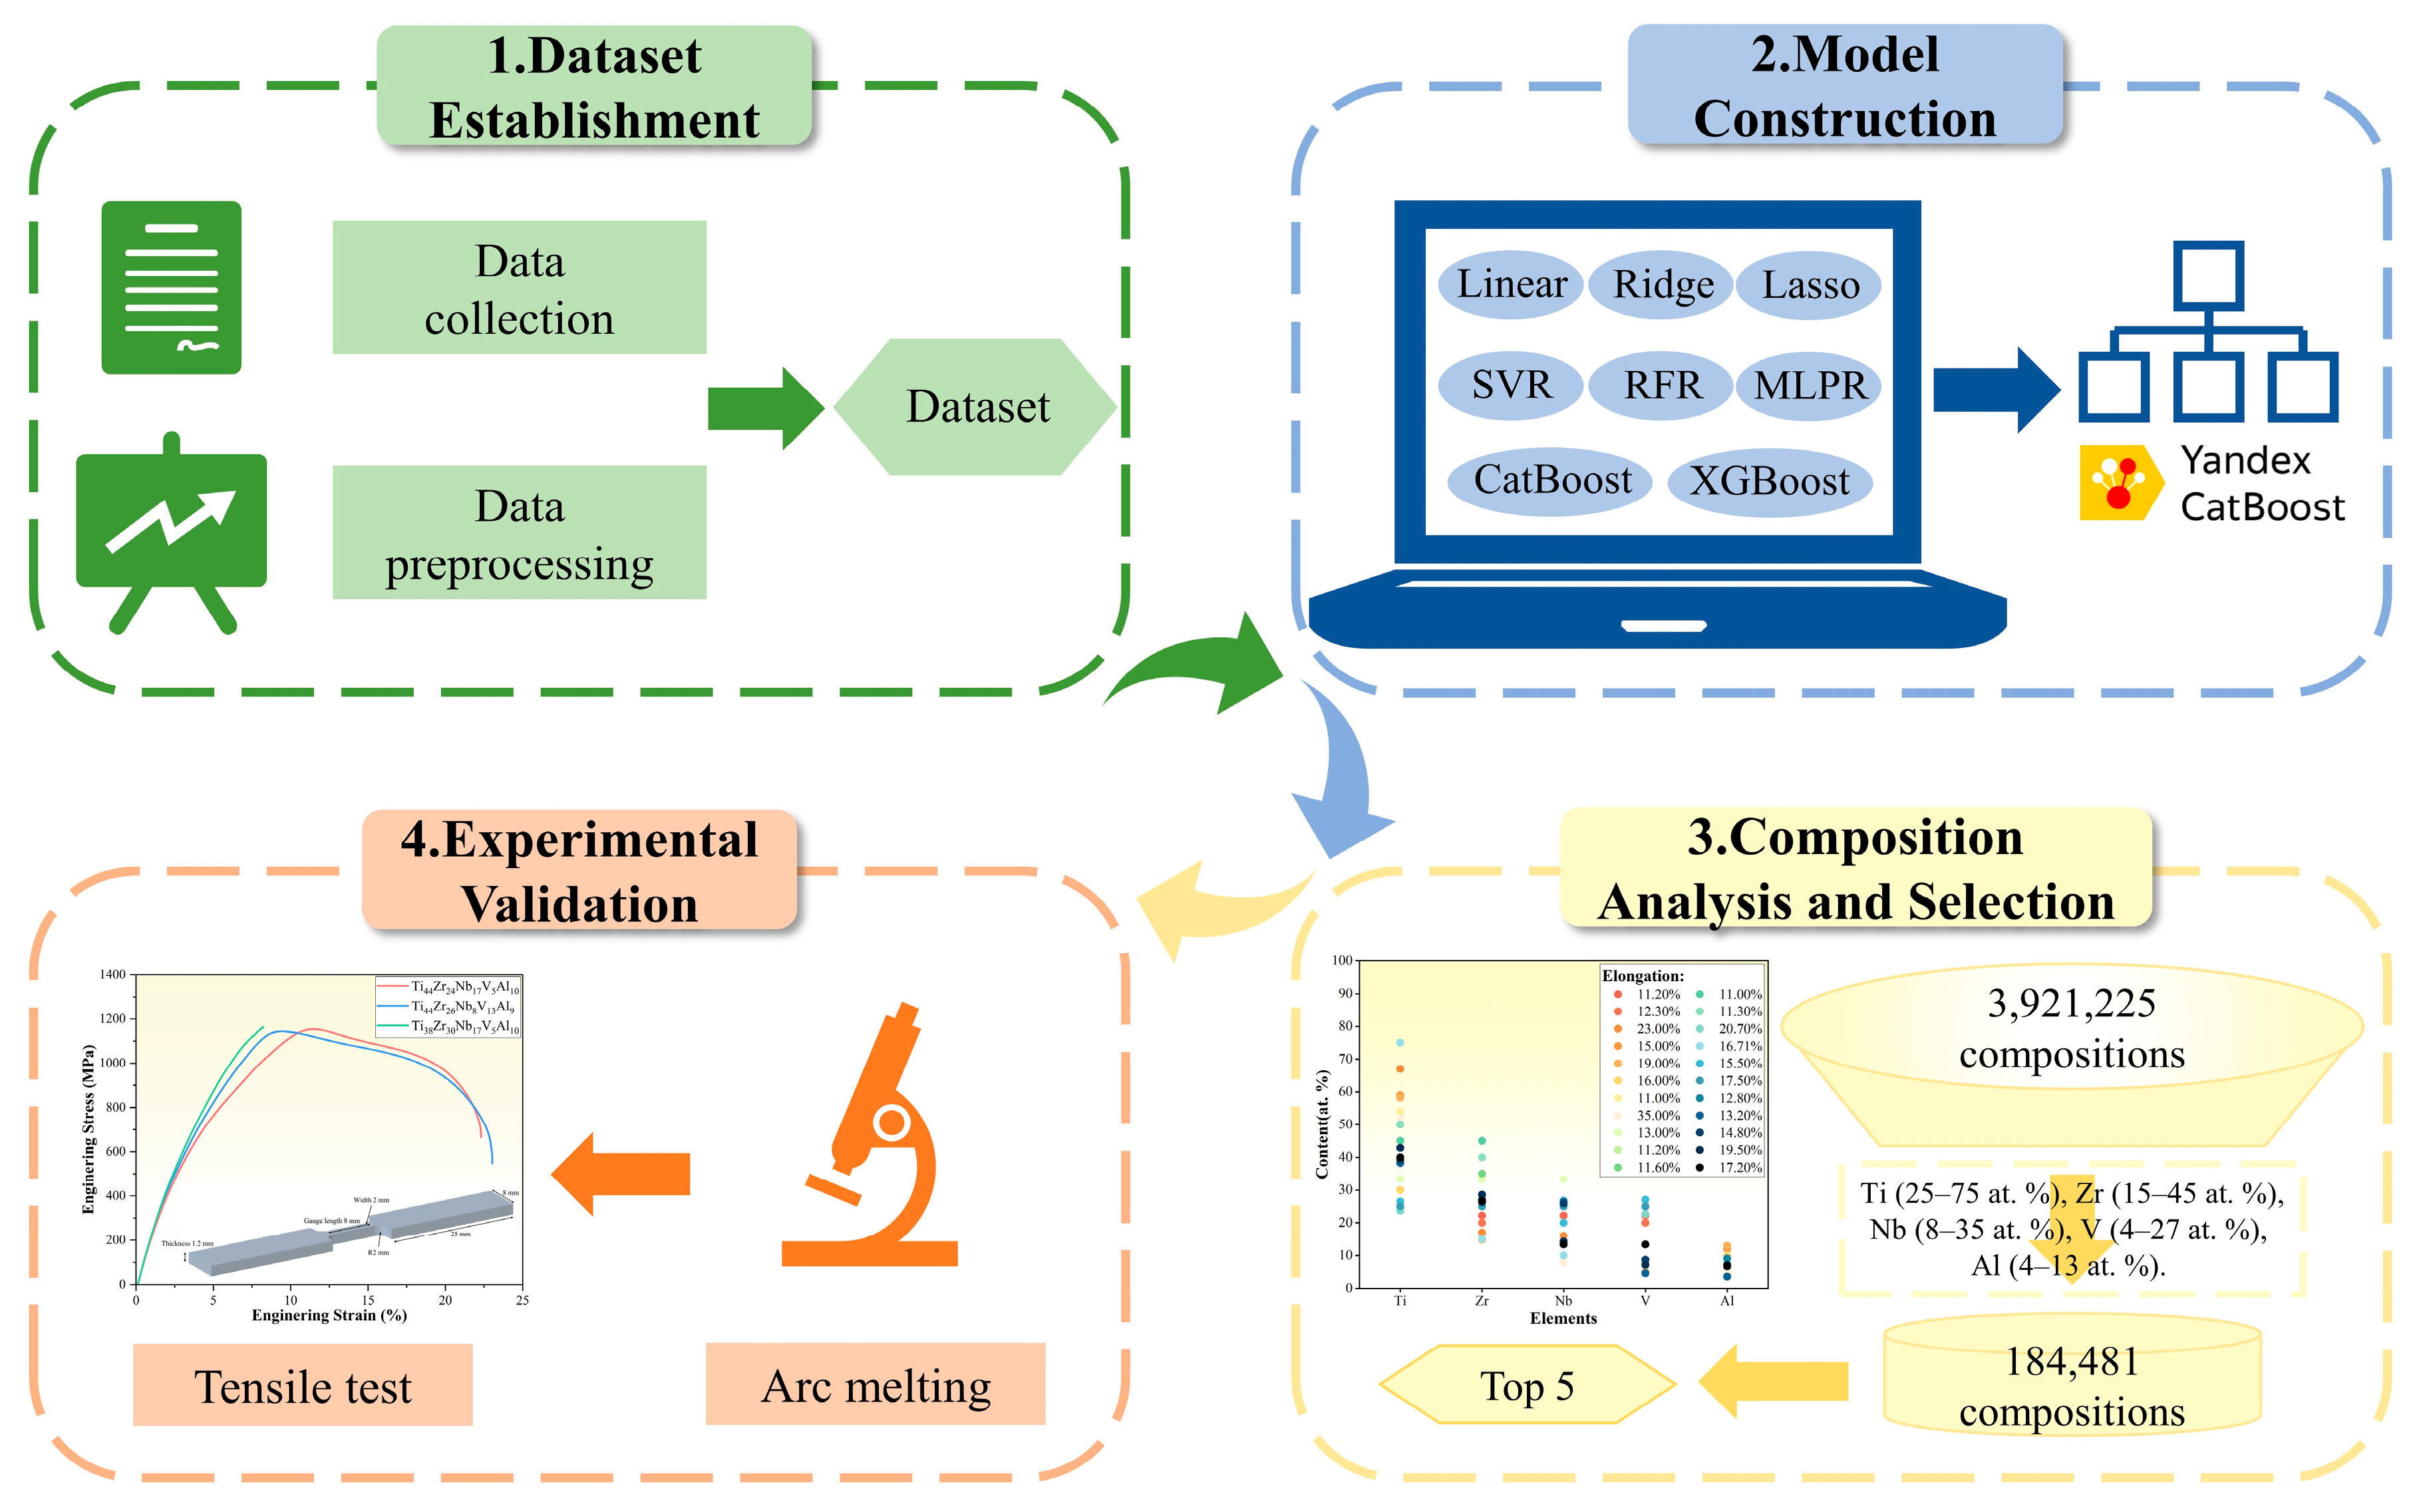
Figure 1. Flowchart of TiZrNbVAl RHEA with improved elongation based on ML model.
Metals 14 00894 g001
Figure 2. Alloying element distribution of 22 TiZrNbVAl components with elongation of more than 10%.
Metals 14 00894 g002
Figure 3. Pearson correlation map between any two features in the initial 11 features. The colors red and blue are used to represent positive and negative correlations, respectively. The intensity of the color shows the correlation strength.
Metals 14 00894 g003
Figure 4. Eight distinct models were assessed for their performance using the MAE and MSE as evaluation metrics.
Metals 14 00894 g004
Figure 5. The performance of the ML model based on the initial dataset.
Metals 14 00894 g005
Figure 6. (a) Tensile engineering stress–strain curves of Ti44Zr24Nb17V5Al10, Ti44Zr26Nb8V13Al9, and Ti38Zr30Nb17V5Al10 at room temperature. (b) The comparison of ultimate tensile strength and elongation of the alloys collected and three RHEAs in this work.
Metals 14 00894 g006
Figure 7. Tensile fracture morphologies of (a) Ti44Zr24Nb17V5Al10, (b) Ti44Zr26Nb8V13Al9, and (c) Ti38Zr30Nb17V5Al10.
Metals 14 00894 g007
Figure 8. SHAP waterfall plots for nine randomly selected RHEA samples. The green number is the predicted elongation, and the orange in parenthesis is the experimental elongation.
Metals 14 00894 g008aMetals 14 00894 g008b
Figure 9. The relationship between the SHAP value and (a) VEC, (b) σa, (c) σT, (d) σχ, (e) σVEC, (f) ΔHmix, and (g) ΔSmix of the nine RHEA samples.
Metals 14 00894 g009
Figure 10. XRD patterns of Ti44Zr24Nb17V5Al10, Ti44Zr26Nb8V13Al9, and Ti38Zr30Nb17V5Al10 RHEAs.
Metals 14 00894 g010
Figure 11. SEM images–EDS mapping and TEM images–SAED patterns of (a,b) Ti44Zr24Nb17V5Al10, (c,d) Ti44Zr26Nb8V13Al9, (e,f) Ti38Zr30Nb17V5Al10.
Metals 14 00894 g011
Table 1. Five RHEAs with the highest elongation predicted by the ML model.
AlloyElongationσaσTΔHmixΔSmixσχVECσVEC
Ti44Zr24Nb17V5Al1024.42%5.48%22.81%−10.201.39 R10.61%4.1255.28%
Ti45Zr26Nb8V12Al924.00%6.26%19.90%−10.541.38 R11.00%4.1152.72%
Ti44Zr26Nb8V13Al923.89%6.36%19.89%−10.561.40 R11.06%4.1253.44%
Ti38Zr30Nb17V5Al1023.89%5.82%22.67%−10.481.41 R11.42%4.1255.28%
Ti42Zr30Nb9V10Al923.88%6.27%20.14%−10.561.39 R11.41%4.1051.96%
Table 2. Thermodynamic parameters of 9 refractory high-entropy alloy samples containing Al element.
AlloyElongationσaσTΔHmixΔSmixσχVECσVECReferences
Ti30Zr35Nb20V5Al1016.00%6.09%22.97%−10.361.43 R12.06%4.1557.23%[13]
Ti38.27Zr27.06Nb26.46V4.61Al3.613.20%5.66%18.63%−2.591.3 R11.07%4.2752.08%[41]
Ti40Zr26.67Nb13.33V13.33Al6.6717.20%6.46%19.21%−7.611.44 R11.25%4.2054.16%[42]
Ti60.9Nb12.2V11.2Cr10Al5.729.00%5.22%18.50%−7.451.20 R4.42%4.3874.09%[49]
Ti60.9Nb11.7V10.5Cr8.9Al828.80%5.01%20.29%−9.221.21 R4.33%4.3274.54%[49]
Ti61.3Nb9.7V9.5Cr8.1Al11.420.00%4.82%22.29%−11.941.20 R4.26%4.2475.66%[49]
Ti41Nb36Mo5Hf13Al520.00%4.00%21.45%−3.751.30 R16.62%4.4166.48%[47]
Ti39Nb36Mo7Hf13Al515.00%4.13%21.45%−4.041.34 R18.59%4.4569.82%[47]
Ti45V45Cr3.33Mo3.33Al3.348.80%5.49%13.73%−5.231.06 R11.20%4.5566.90%[48]
Disclaimer/Publisher’s Note: The statements, opinions and data contained in all publications are solely those of the individual author(s) and contributor(s) and not of MDPI and/or the editor(s). MDPI and/or the editor(s) disclaim responsibility for any injury to people or property resulting from any ideas, methods, instructions or products referred to in the content.