Article

Parametric Study of Vanadium Extraction Process from Refining Tailings of Crude Titanium Tetrachloride

1
School of Metallurgy Engineering, Jiangsu University of Science and Technology, Zhangjiagang 215600, China
2
Zhangjiagang Industrial Technology Research Institute, Jiangsu University of Science and Technology, Zhangjiagang 215600, China
*
Author to whom correspondence should be addressed.
Metals 2024, 14(8), 912; https://doi.org/10.3390/met14080912
Submission received: 15 July 2024 / Revised: 4 August 2024 / Accepted: 6 August 2024 / Published: 12 August 2024
(This article belongs to the Section Extractive Metallurgy)

Abstract

:
The recovery of vanadium from titanium tetrachloride tail residue is a resource-efficient and environment-friendly method for treating hazardous vanadium-containing solid waste. In this study, to maximize the recovery rate of vanadium in the vanadium extraction process, the independent calcination and leaching factors were optimized using response surface methodology, in terms of calcination temperature (750–950 °C), calcination time (60–180 min), leaching liquid–solid ratio (5–25 mL/g), and leaching time (30–150 min). The results revealed that the calcination temperature was the most effective parameter for vanadium recovery, while the liquid–solid ratio was the least effective factor. Additionally, the optimal conditions were identified as a calcination temperature of 937 °C, a calcination time of 150 min, a leaching solid-to-liquid ratio of 17.4 mL/g, and a leaching time of 150 min. The maximum predicted recovery rate of vanadium by the model regression equation reached 93.1% and showed high credibility consistent with the experimental recovery rate of 93%.

1. Introduction

Vanadium is a strategically important rare metal that is widely used in various fields such as the steel industry, aerospace, new energy, and the chemical industry due to its unique physicochemical properties [1,2,3,4,5]. Titanium tetrachloride (TiCl4) is the main intermediate product in the production of sponge titanium by the Kroll process, as well as the production of titanium dioxide by the chloride method [6,7,8]. However, titanium concentrate or high-titanium slag in the raw material is often accompanied by impurities with a high content of vanadium. The vanadium-containing impurities have a boiling point close to that of TiCl4, as well as infinite miscibility. This results in an increase in both the oxygen content and Brinell hardness of the titanium sponge, and the brownish V2O5 can seriously affect the color of the titanium dioxide, thereby affecting the processing performance and quality of the titanium products [7,9]. Hence, the presence of vanadium-containing impurities should be removed to obtain refined titanium tetrachloride, and the large amount of vanadium-containing tailings generated by this process will lead to wasted resources and serious environmental pollution [7]. Therefore, it is crucial to use tailings from titanium tetrachloride refining for resource recycling and environmental preservation.
Most of the existing studies have focused on the extraction of vanadium from converter slag [10,11,12,13], with limited research on the recovery of vanadium from refining V-containing tailings of titanium tetrachloride. Sun et al. [14] used V-containing tailings of titanium tetrachloride as the raw material, and Na2CO3 as the leaching agent. Under the conditions of Na:V = 1.2:1, the ratio of the liquid volume to the solid mass (L/S) was 6:1, and at leaching at 60 °C for 80 min, the vanadium leaching rate can reach 85%. Liu et al. [15] used a combined acid–base method to recover vanadium from V-containing tailings of titanium tetrachloride and showed that the vanadium recovery could reach more than 75% under optimal conditions. Owing to the complex composition and low grade of tailings, the vanadium extraction process involves multiple complex chemical and physical reactions, which are influenced by various factors such as raw material properties, calcination conditions, and leaching parameters. These factors jointly determine the extraction efficiency and purity of vanadium. However, the aforementioned studies all relied on traditional single-factor experiments, overlooking the quantitative relationship between the vanadium recovery rate and the calcination and leaching parameters. This resulted in incomplete optimization results, low vanadium recovery rates, and insufficient resource utilization [16]. Response surface methodology (RSM) is a widely applied statistical analysis technique for modeling and experimental optimization [17,18]. It employs multivariate quadratic regression equations to fit the functional relationship between factors and response values and seeks optimal process parameters through the analysis of the regression equations. In addition, there have been reports on the use of RSM to optimize calcination and leaching parameters in the vanadium extraction process. Wang et al. [16] employed RSM to model and optimize the calcination factors in the CaO/MgO composite calcination–acid leaching process for vanadium extraction, achieving a vanadium leaching rate of 90.87%. Xiong et al. [19] utilized RSM to optimize the leaching conditions in the atmospheric acid leaching process of converter vanadium slag, ultimately achieving a vanadium extraction rate of 86.09%, which provides important guidance for our research. Therefore, optimizing the parameters of the vanadium extraction process from refined crude titanium tetrachloride tailings is crucial for improving the recovery rate and purity of vanadium, as well as reducing energy consumption and costs.
In this study, the raw materials underwent mineralogical analysis first, followed by vanadium extraction experiments which were carried out through a series of processes including water washing, sodium salt composite calcination, and water leaching. As part of this process, calcination and leaching experiments were optimized using response surface methodology (RSM) and Box–Behnken experimental design (BBD) [20,21]. Finally, the quantitative relationship between the multi-factor parameters and the vanadium recovery rate during the calcination and leaching processes was systematically investigated. Through this research, we aim to provide valuable references and insights for technological innovation and industrial development of the vanadium extraction process from refined crude titanium tetrachloride tailings.

2. Experimental Section

2.1. Raw Materials

The vanadium-containing tailings from refined titanium dioxide used in this experiment were obtained from CITIC Titanium Industry Co., Ltd. (Jinzhou, China). The chemicals used in the experiment (Na2CO3 and NH4Cl) were all analytical grade (Sinopharm Chemical Reagent Co., Ltd., Shanghai, China, purity > 99.5%) and were dried in an oven at 105 °C for 24 h before use. Distilled water was used for all the experiments.

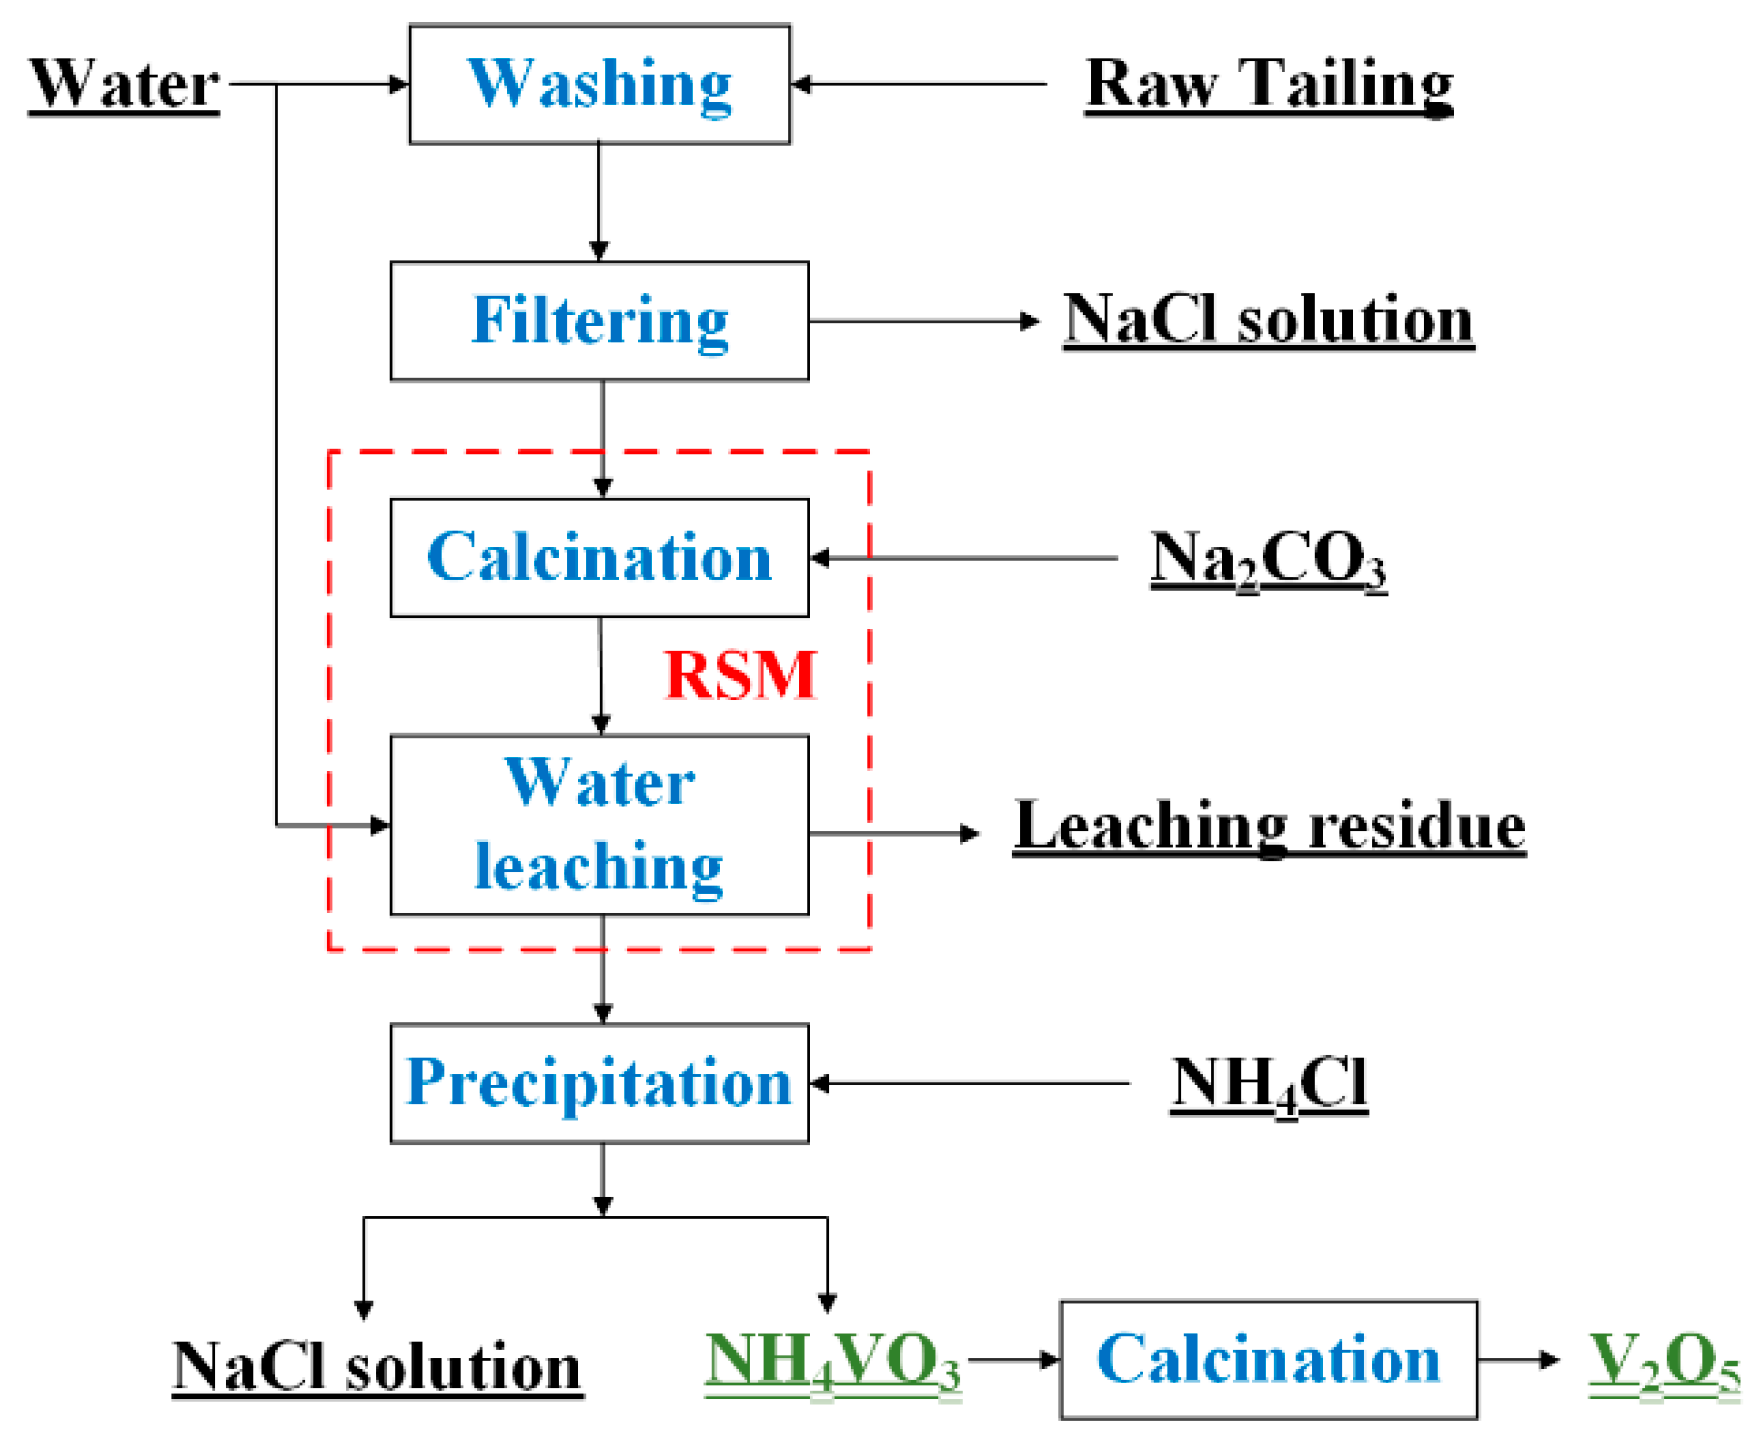
2.2. Experimental Procedures

A schematic diagram of the vanadium extraction process from the refining tailings of crude titanium tetrachloride is shown in Figure 1. The water washing process was first used to remove Cl from the tailings by placing deionized water and tailings at a liquid–solid ratio of 10:1 mL/g in a beaker. After stirring for 30 min at room temperature, the mixture was filtered twice and the residue was dried in an oven at 105 °C for 4 h. Figure 2 depicts the particle size distribution of the tailings, which can be respectively represented by the d(0.1), d(0.5), and d(0.9) values of 4.04 µm, 12.484 µm, and 33.476 µm. The particle size distribution of the vanadium-containing tailings is predominantly concentrated within the range of 5 to 30 μm (with overall particles measuring less than 100 μm in size). The specific surface area of the tailings is 0.251 m²/g, accompanied by an average surface area particle size D[3,2] is 5.977 μm and a volume average particle size D[4,3] is 16.476 μm.
During the calcination process, 10 g of water-washed tailings and a certain amount of analytical grade Na2CO3 were mixed thoroughly and heated from room temperature to 750–950 °C in a muffle furnace at a heating rate of 10 °C/min, and the temperature was maintained for 60-180 min. The amount of Na2CO3 added was determined by the stoichiometric number of NaVO3, and considering the appropriate excess amount, the final ratio of added sodium to vanadium was taken to be 1.05. The NaCO3 additive was combined with residual NaCl during calcination, and the furnace door was kept aside to ensure an air atmosphere. After calcination, the vanadium-containing residue samples were cooled down to room temperature and then ground into powders. A total of 2 g of the sample was taken for water leaching by increasing the leaching liquid–solid ratio from 5 mL/g to 25 mL/g, and the leaching time from 30 min to 150 min. The vanadium recovery rate was the standard for evaluation of the effects of calcination and leaching factors and was calculated using Equation (1):
ƞ = m 1 c 1 m 2 c 2 m 1 c 1 × 100 %
in which ƞ represents the recovery rate of vanadium, m1 is the quality of the vanadium-containing tailing after washing, c1 is the vanadium content in the tailing after washing, m2 is the quality of the leaching residue, and c2 is the vanadium content in the leaching residue.
The leached V-containing solution was mixed with analytically pure NH4Cl with a molar ratio mNH4Cl/mV of 1 and added to the beaker under stirring. Next, the reaction slurry was filtered to yield NH4VO3 precipitate, which was then calcined in an oven at 105 °C for 4 h to yield the final product V2O5. In addition, the byproducts in this process were recycled to yield enriched NaCl and high-iron residue for reuse.

2.3. Experimental Design and Data Analysis

A four-factor, three-level BBD was developed using Design Expert 8.0 (Stat-Ease lnc. Minneapolis, MN, USA) using response surface methodology to optimize the two main operating variables, calcination, and leaching, and to establish a mathematical model. As shown in Table 1, leaching time (A), liquid–solid ratio (B), calcination time (C), and calcination temperature (D) were employed as influencing factors, while vanadium recovery rate was utilized as the response value. Here, the levels of factor codes were set at three levels in parentheses, i.e., minimum (−1), central (0), and maximum (1).
In order to obtain the optimum calcination and leaching conditions for vanadium extraction, a total of twenty-nine experiments were designed and carried out by BBD to demonstrate the interrelationships between the various factors. Table 2 shows the BBD in the form of a 29 full factorial design and obtained experimental results of the recovery rate at each assay. The predicted multivariate regression model for vanadium recovery rate under optimal conditions can be expressed by Equation (2):
Y i = α 0 + i = 1 z α i β i + i = 1 z α i i β i 2 + i i j z j z α i j β i β j + + e
where Y is the response, i represents the linear coefficient, j is the quadratic coefficient, β refers to the regression coefficient, z is the number of factors studied and optimized experimentally, and e is the random error.

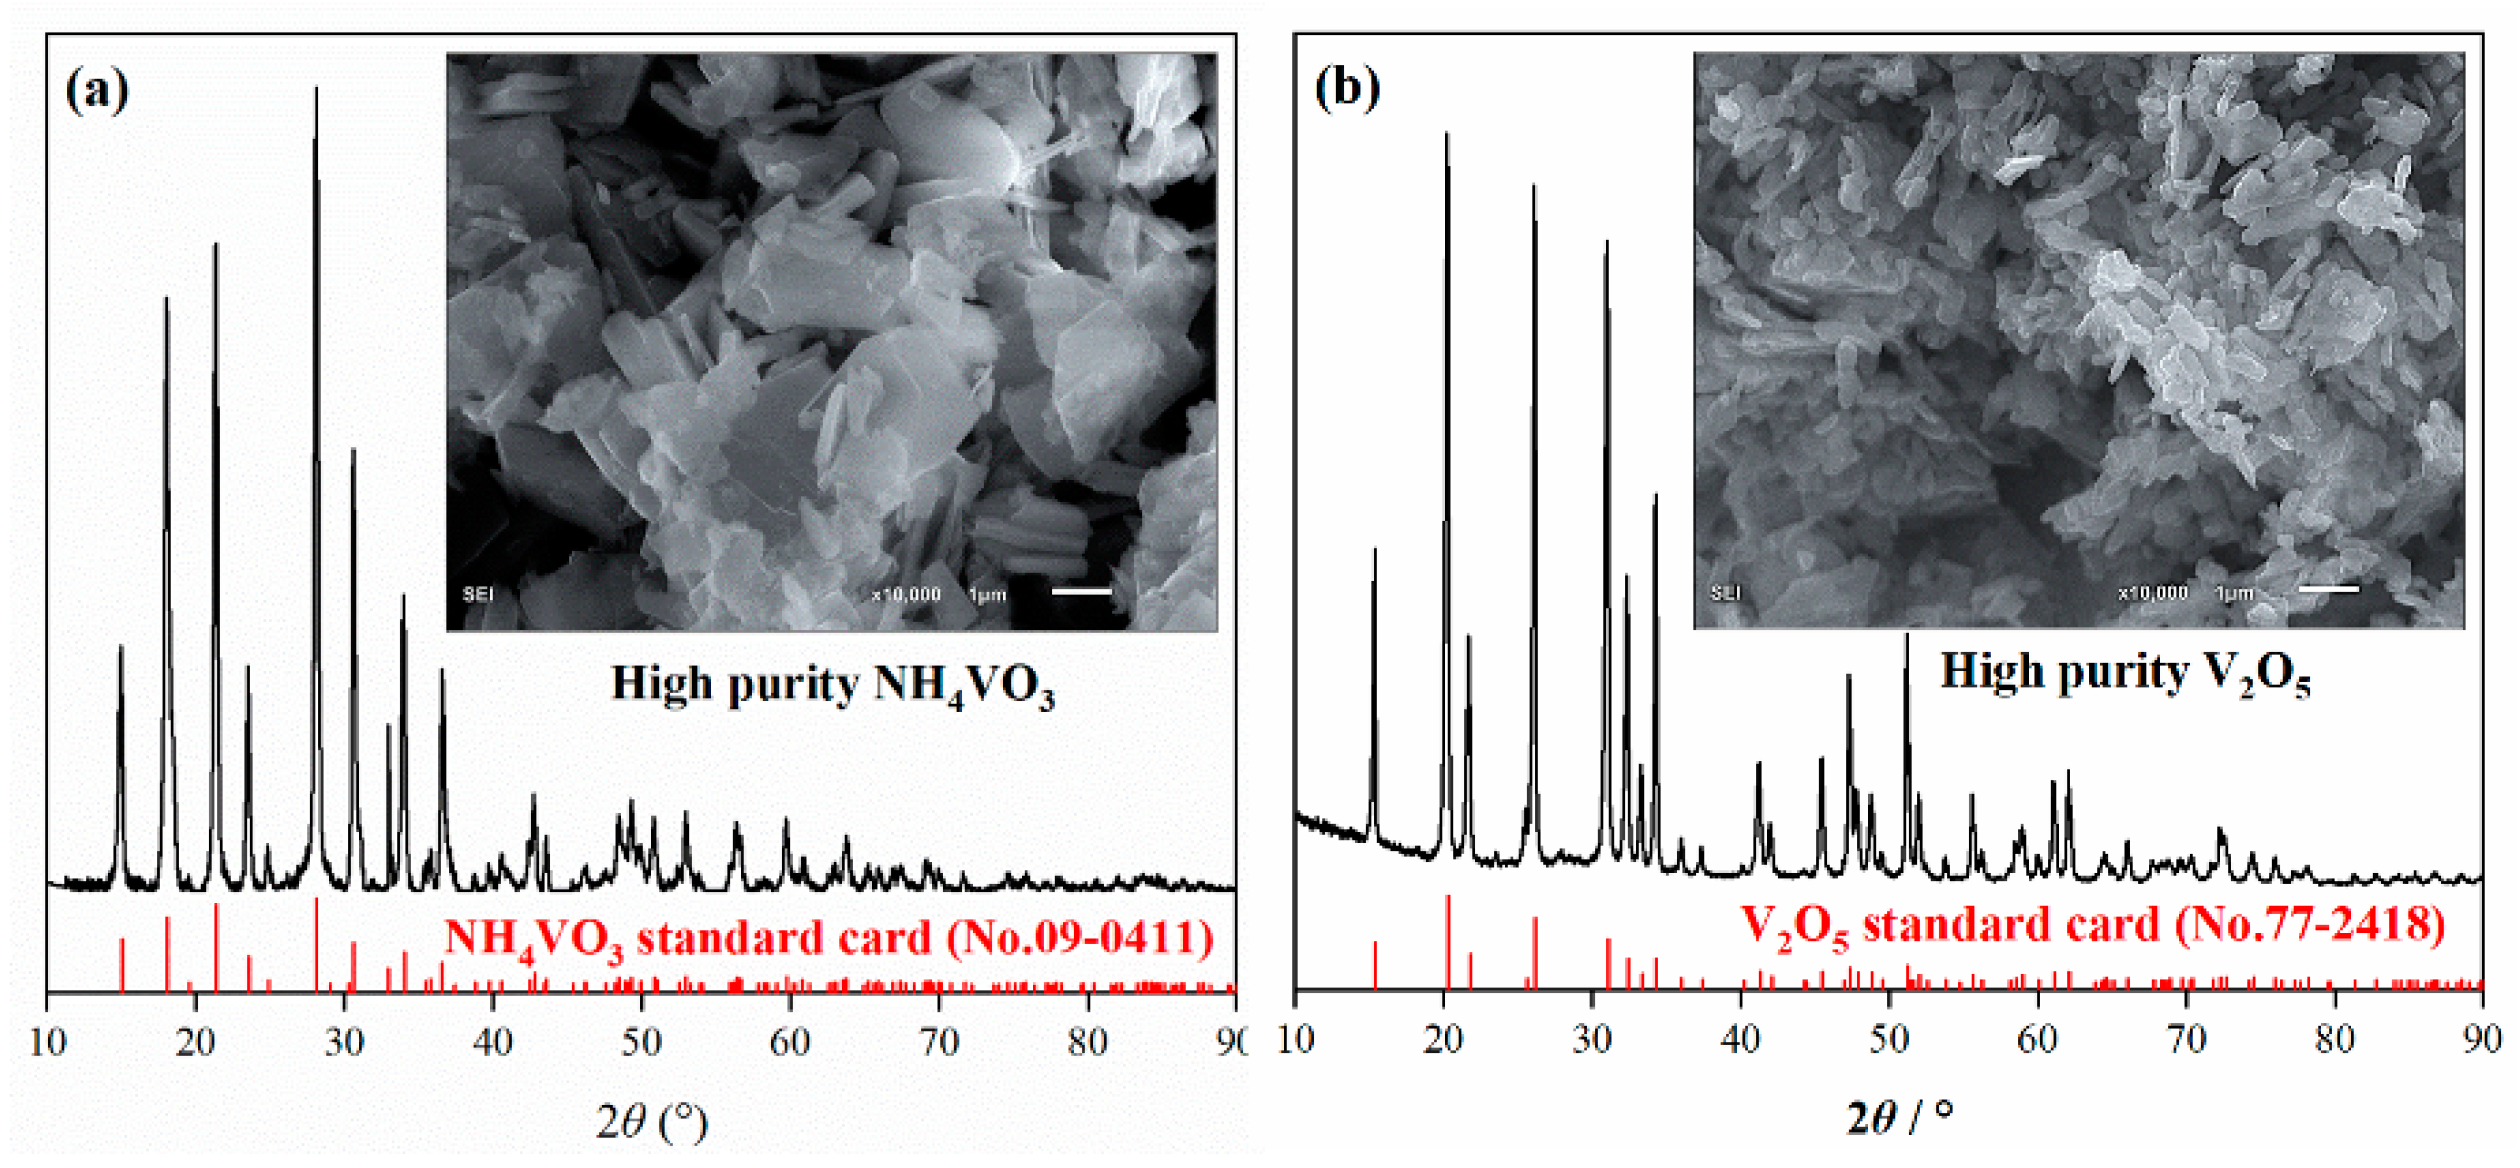
2.4. Characterization

The chemical composition of the samples was determined by the X-ray fluorescence (XRF, Axios, Panalytical, Nieuw-Vennep, The Netherlands) melting method. Chlorine and carbon in the samples were measured using inductively coupled plasma optical emission spectrometry (ICP-OES, Avio 200, PerkinElmer, Waltham, MA, USA), and carbon–sulfur analysis (HIR-944, Wuxi High-speed Analyzer, Wuxi China), respectively. The mineralogical composition was determined by X-ray diffraction analysis (XRD, Ultima IV, Rigaku, Tokyo, Japan) using Cu Kα radiation at a scanning rate of 5°/min, and the diffraction pattern was collected within a 2θ range of 10°–90°. The particle size distribution of the tailings was determined by a laser diffraction particle size analyzer (Mastersizer Hydro 2000MU, Malvern, K). The microscopic morphology of the vanadium products was analyzed by scanning electron microscopy (SEM, JSM-6510, JOEL, Tokyo, Japan).

3. Results and Discussions

3.1. Mineralogical Analysis of Titanium Tetrachloride Tail Residue

The excessive NaCl concentrations can significantly reduce the efficiency of the oxidation calcination process and the precipitation rate of NH4VO3. This is due to the fact that during the calcination process, excess sodium reacts with silicates to form sodium silicate (Na2SiO3), which encapsulates the phase and thus inhibits further leaching of vanadium [22]. It is therefore appropriate to first use the water washing process to remove the excess NaCl, and to improve the vanadium grade in the tailings. The chemical composition and XRD analysis of raw refining tailings of crude titanium tetrachloride and washed tailings are shown in Table 3 and Figure 3.
According to the phase analysis of Figure 3, the main phases in tailings were hematite (Fe2O3), halite (NaCl), iron silicate (Fe2SiO4), anatase (Ti0.72O2), and vanadium oxide (VO2). The NaCl peak in the tailing slag after water washing basically disappears, indicating that NaCl in the tailing slag is almost completely removed, and the purpose of water dechlorination is achieved. The high salt wastewater produced by this process has a single pollutant and low concentration, which can be recycled after replenishing new water, so that the total wastewater volume is greatly reduced, and the final concentrated brine can be treated by evaporation and crystallization methods. In Table 3, compared to vanadium-containing slag from the converter, the content of Cl and Na in this tailing was 35.44 wt.% and 6.67 wt.%, which is much higher than that of converter slag containing 0.1 wt.% to 0.5 wt.% of Na [23,24]. After the water washing process, nearly 80% of the NaCl in the slag was removed whereas 1.52 wt.% sodium still exists in the tailing after the washing process according to Table 3. In order not to introduce additional cations, the subsequent vanadium extraction process is suitable for sodium calcination, which is the present industrial method of treating vanadium-bearing slag from the converter.

3.2. Evolution of the Phase of the Vanadium Tailing at Different Calcination Temperatures

The XRD phase analysis of vanadium tailing with a calcination temperature range of 750 °C~950 °C and a calcination time of 2 h was carried out, and the results are shown in Figure 4. It can be seen from the figure that the main phases of the calcined tailing are Fe2O3 and Na2Ti9O19, and there are also small amounts of NaVO3, VO2, and Na2SiO3. With the increase in temperature, the diffraction peaks of VO2 with the 2θ angle of 27°~28° decreased obviously, and the diffraction peaks of VO2 almost disappeared when the temperature was 850 °C. The diffraction peaks of NaVO3 with the 2θ angle of 23°~27° increased obviously with the increase in temperature, and the amount of sodium metavanadate increased obviously, which was favorable for the improvement of the vanadium leaching rate. In summary, increasing the temperature is favorable to the improvement of the vanadium leaching rate, but too high a temperature will make the material sinter and affect production.

3.3. Statistical Results and Regression Model Equation

The response of each experimental factor was predicted by a regression equation with variance classified as fractional, linear, quadratic, and interactive. To assess the adequacy and relative importance of the second-order polynomial function, the model coefficients were estimated by multiple regression analysis. The quadratic response model was determined based on the experimental results, analysis of variance, and fitting. As shown in Table 4, larger F-values, representing the significance of the entire process, resulted in a more significant effect of the factors. The P-value, referring to the acceptance of the original hypothesis, was less than 0.01, suggesting a highly significant regression equation. According to the magnitude of the F-value, the influence of each factor on the vanadium recovery rate varied in the following order: D > D2 > C > C2 > A > B > B2 > A2 >AB > BD > AD > BC > CD.
The final model in terms of actual factors and coded factors for the leaching efficiency of vanadium can be represented by Equations (3) and (4), respectively.
YV = −331.89115 + 0.032403A + 0.31258B + 0.23819C + 0.85780D − 0.00139583AB + 0.000040972AC + 0.00005583AD − 0.0005125BC + 0.000445BD + 0.000045CD − 0.00022025A2 − 0.012729B2 − 0.000928C2 − 0.0004698D2
YV = 88.16 + 1.45A + 1.22B + 2.99C + 7.63D − 0.84AB + 0.15AC + 0.34AD − 0.31BC + 0.45BD + 0.27CD − 0.79A2 − 1.27B2 − 3.34C2 − 4.70D2
The relationship between the experimental and predicted values of the vanadium recovery rate is presented in Figure 5. The experimental values were equally distributed on both sides of the fitted straight line and on the line, indicating experimental values very close to the theoretical simulations derived from the model.

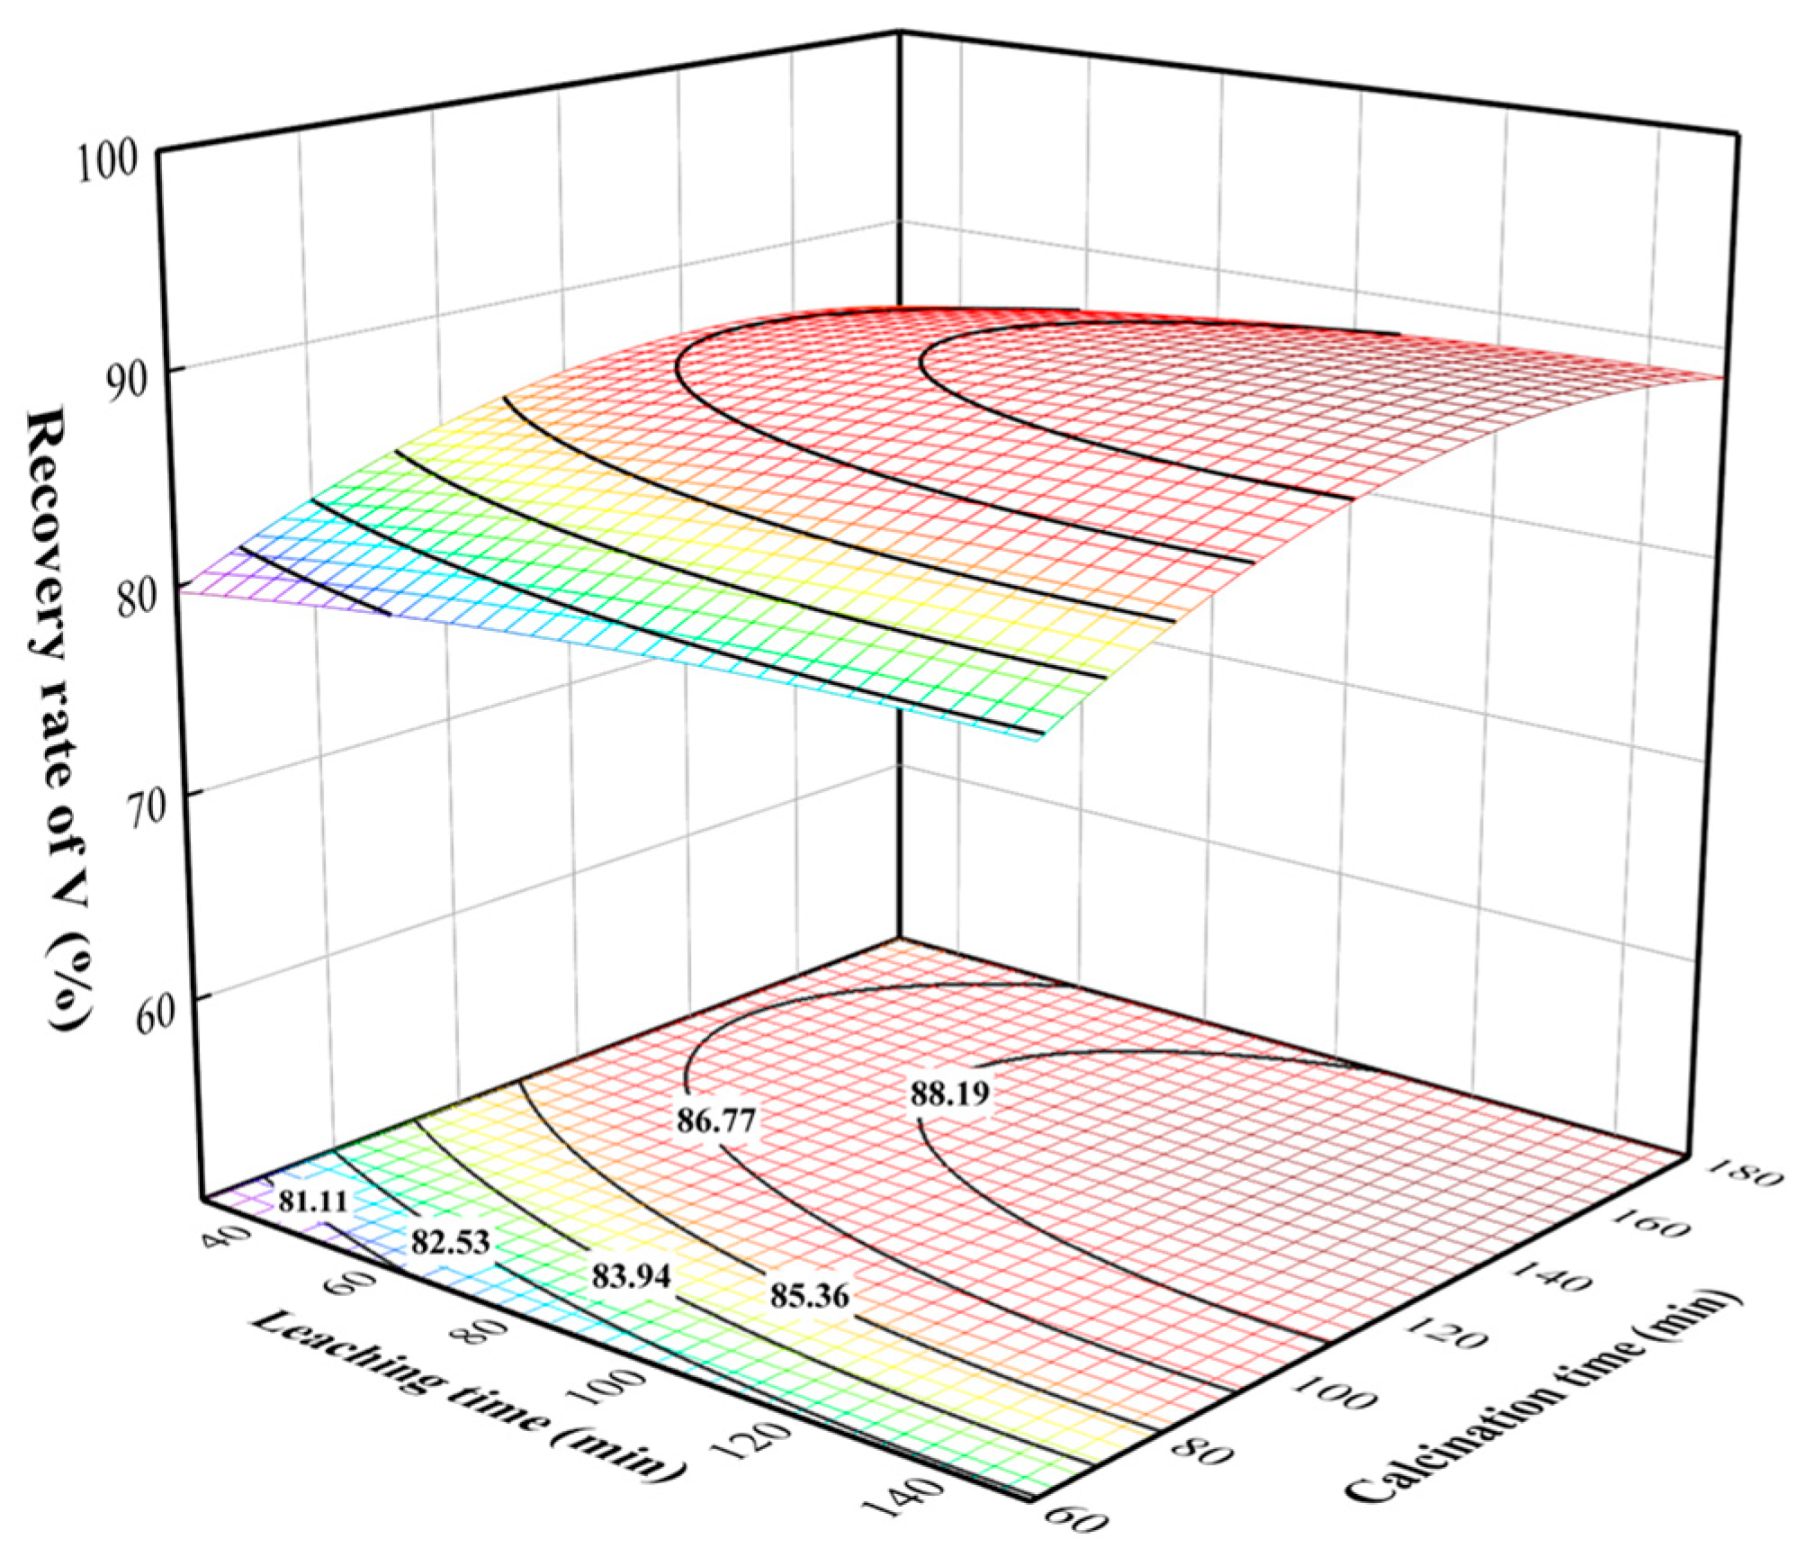
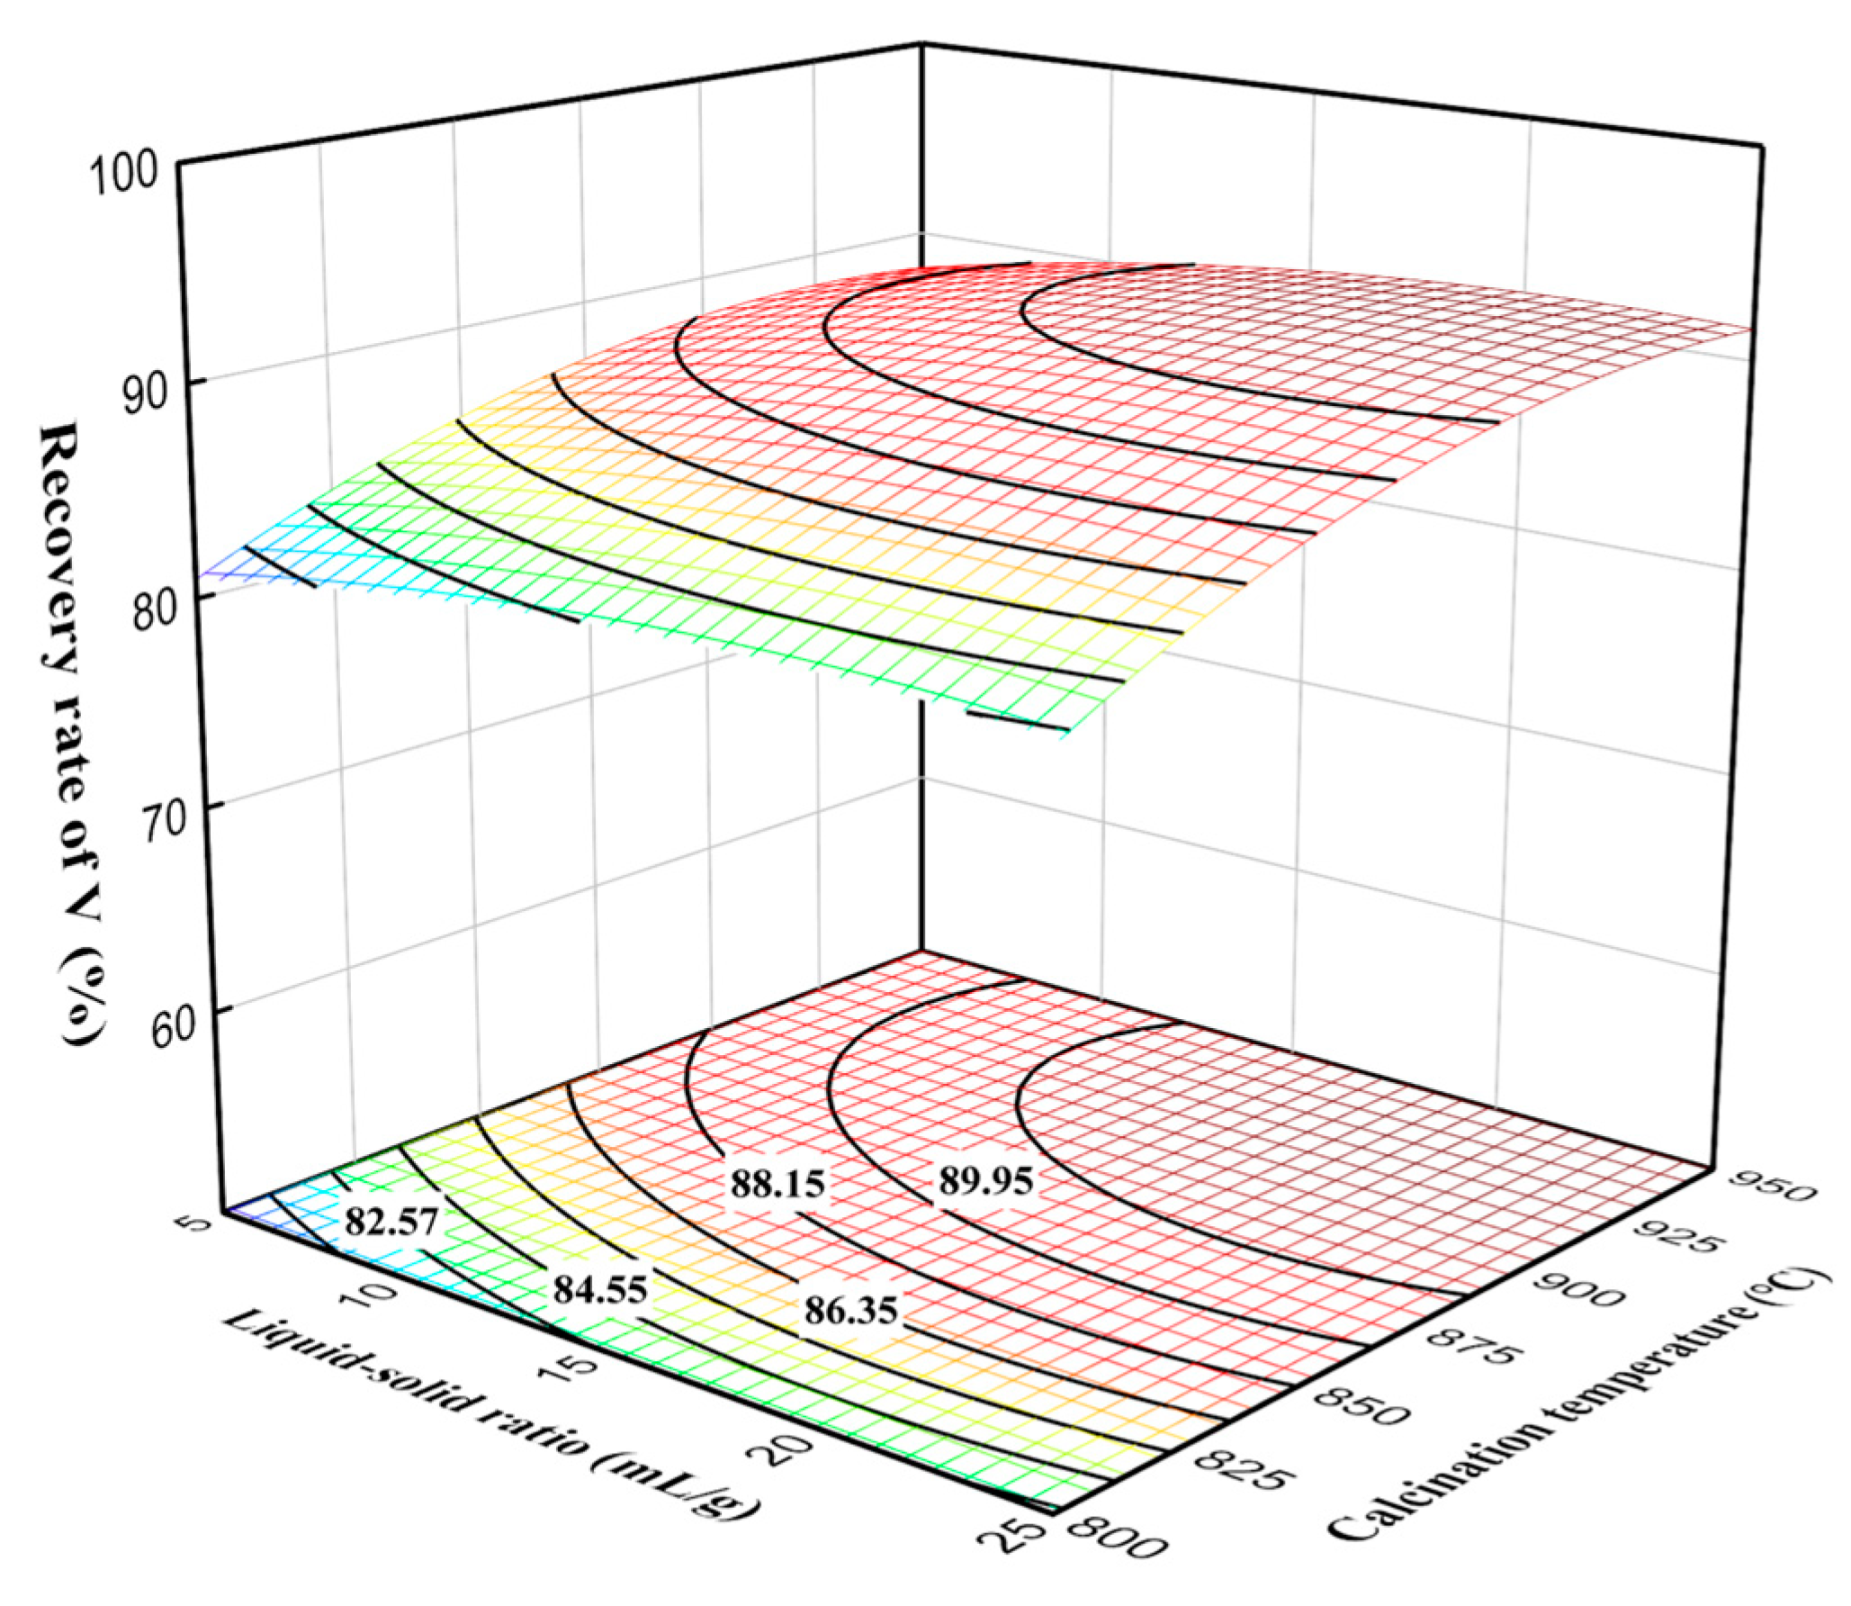
3.4. Processes Analysis of Calcination and Leaching Process

The three-dimensional surface and contour plots of the effect of the interaction of various factors on the vanadium recovery rate were drawn using the Model Graph Function. The three-dimensional surface and contour plots showing the effects of leaching time and calcination time on the vanadium recovery rate are illustrated in Figure 6. Here, the leaching time and calcination time were fixed at 850 °C and 120 min, respectively. The data revealed an increase in recovery rate with calcination time at a leaching time of 90 min, while it declined at a calcination time exceeding 120 min. The latter can be attributed to the sintering phenomenon, which hindered the leaching of vanadium at the long calcination time, resulting in decreased vanadium recovery rates. The vanadium recovery rate slowly incremented with the leaching time, indicating the positive effect of leaching time on the vanadium recovery rate.
The three-dimensional surface and contour plots of the effects of calcination time and calcination temperature on the vanadium recovery rate at a leaching time of 90 min and the liquid–solid ratio of 15 mL/g are given in Figure 7. The effect of calcination time on the vanadium recovery rate was smaller at lower calcination temperatures, while that on the vanadium recovery rate was larger at higher calcination temperatures. Thus, elevated calcination temperatures provided more suitable reaction conditions for the sodium calcination reaction, as well as increased the adequacy of the calcination reactions [25]. The main chemical reactions during the sodium calcination and water leaching process of the vanadium-containing tailings can be described by Equations (5)–(9) [26]. As a result, the influences of calcination time and calcination temperature on the vanadium recovery rate were more significant, and reasonable control can significantly improve the vanadium recovery rate.
4VO2 + O2 = 2V2O5
V2O5 + Na2CO3 = 2NaVO3 + CO2
2Fe2SiO4 + 2Na2CO3 + O2 = 2Fe2O3 + 2Na2SiO3 + 2CO2
NaVO3 + H2O = H2VO4 + Na+
Na2SiO3 + H2O = H2SiO42− + 2Na+
As shown in Figure 8, the vanadium recovery rate increased slowly with the liquid–solid ratio, indicating that the liquid–solid ratio had a positive effect on the vanadium recovery rate. At the liquid-to-solid ratio of 15 mL/g, the vanadium recovery rate increased rapidly with calcination temperature. However, the trend of vanadium recovery rate at a calcination temperature of 850 °C increased very slowly. This can be explained by the sintering of vanadium phases with silicon phases, which reduced the diffusion of oxygen, resulting in no significant improvement in leaching efficiency. Additionally, excessively high temperatures can lead to over-sintering phenomena and the formation of liquid phases, causing the oxidized vanadium to be re-encapsulated by silicate and other low-melting-point liquid phases, thereby affecting the leaching of vanadium and subsequently impacting production [22].

3.5. Process Optimization

For numerical optimization, the maximum and minimum values must be provided for each parameter. Thus, the optimization method was based on a multi-response approach with any combination of four factors: leaching time, liquid–solid ratio, calcination time, and calcination temperature. A maximum vanadium recovery rate of 93.1% was obtained by statistical analysis at a leaching time of 150 min, a liquid-to-solid ratio of 17.4 mL/g, a calcination time of 150 min, and a calcination temperature of 937 °C. The predicted values were tested and the actual recovery of vanadium under the optimal conditions was determined as 93%. The experimental results agreed well with the predicted values of the model. The leaching product NH4VO3 and roasted V2O5 were both high-purity products with low-impurity contents (Figure 9). The grade of V2O5 determined by chemical analysis was 99.7%.

3.6. Comparison of Processes for Extracting Vanadium from Secondary Sources

The vanadium extraction tailings are byproducts generated after the sodium calcination and water leaching processes of vanadium slag. As a valuable secondary resource, their comprehensive utilization is of great significance for improving resource utilization efficiency and reducing environmental pollution. For the re-extraction of vanadium from vanadium-containing tailings, the main processes include acid leaching, alkaline hydrothermal leaching, etc. A comparison of the processes for extracting vanadium from three types of tailings, vanadium-containing tailings from refined titanium tetrachloride (VCTR), vanadium-containing tailings from Pangan (PVCT), and vanadium-containing tailings from Chenggang (CVCT), is shown Table 5. Yang et al. [27] extracted 82% of vanadium from VCTR under optimal conditions through the process of manganizing calcination and acid leaching. Ma et al. [28] achieved a vanadium leaching rate (ƞ) of over 95% through the direct alkaline leaching process under suitable process conditions.

4. Conclusions

A new environmentally friendly method of water washing, calcination, and water leaching processes to extract vanadium from titanium tetrachloride tail residue was optimized in the present study, and the following conclusions can be drawn:
(1)
Titanium tetrachloride vanadium-containing tailings with high NaCl contents were found to be suitable for the application of the water washing process to remove nearly 80% of the NaCl.
(2)
Among the experimental factors, calcination temperature was the most effective factor in the recovery of vanadium, while the liquid–solid ratio was less effective. The final model established by RSM and BBD in terms of coded factors for the recovery of vanadium can be represented by the following formula: YV = 88.16 + 1.45A + 1.22B + 2.99C + 7.63D − 0.84AB + 0.15AC + 0.34AD − 0.31BC + 0.45BD + 0.27CD − 0.79A2 − 1.27B2 − 3.34C2 − 4.70D2 (R2 = 0.9886).
(3)
The optimal conditions for vanadium recovery were determined as a leaching time of 150 min, a solid-to-liquid ratio of 17.4 mL/g, a calcination temperature of 937 °C, and a calcination time of 150 min. Under the optimum conditions, the maximum predicted recovery rate of vanadium reached 93.1% with the experimental recovery rate achieving a 93% and 99.7% V2O5 grade as tested by chemical analysis.

Author Contributions

Conceptualization, W.D.; methodology, W.D., T.Y., H.C. and D.J.; data curation, T.Y.; formal analysis, W.D.; investigation, H.C.; writing—original draft, T.Y.; writing—review and editing, W.D. and Z.C.; supervision, Z.C. and D.J.; funding acquisition, W.D. and T.Y. All authors have read and agreed to the published version of the manuscript.

Funding

The authors would like to acknowledge the financial support of the Natural Science Foundation of Jiangsu Province (No. BK20210888), the Zhangjiagang scientific and technological projects (ZKYY2319), and the Graduate student scientific research innovation projects in Jiangsu Province (KYCX24_4183).

Data Availability Statement

The original contributions presented in the study are included in the article, and further inquiries can be directed to the corresponding author.

Conflicts of Interest

The authors declare no conflicts of interest.

References

  1. Li, C.; Jiang, T.; Wen, J.; Yu, T.; Li, F. Review of Leaching, Separation and Recovery of Vanadium from Roasted Products of Vanadium Slag. Hydrometallurgy 2024, 226, 106313. [Google Scholar] [CrossRef]
  2. Wen, J.; Jiang, T.; Yu, T.; Chen, B.; Li, L. Clean and Efficient Extraction of Vanadium from Vanadium Slag: Effect of Manganese on the Phase Composition and Vanadium Extraction Process. J. Clean. Prod. 2022, 367, 133077. [Google Scholar] [CrossRef]
  3. Liu, S.; Wang, L.; Chen, J.; Ye, L.; Du, J. Research Progress of Vanadium Extraction Processes from Vanadium Slag: A Review. Sep. Purif. Technol. 2024, 342, 127035. [Google Scholar] [CrossRef]
  4. Du, W.T.; Wang, Y.; Liang, X.P. System Assessment of Carbon Dioxide Used as Gas Oxidant and Coolant in Vanadium-Extraction Converter. JOM 2017, 69, 1785–1789. [Google Scholar] [CrossRef]
  5. Du, W.-T.; Jiang, Q.; Chen, Z.; Liang, X.-P.; Wang, Y. Experimental Characterization of CO2 and CaCO3 Used in a Pyrometallurgical Vanadium-Extraction Process. JOM 2019, 71, 4925–4930. [Google Scholar] [CrossRef]
  6. Zhu, F.; Ma, S.; Ma, Z.; Qi, L.; Peng, W.; Li, K.; Qiu, K. Preparation of TiCl4 from Panzhihua Ilmenite Concentrate by Boiling Chlorination. J. Mater. Res. Technol. 2023, 23, 2703–2718. [Google Scholar] [CrossRef]
  7. Du, G.; Li, Z.; Zhang, J.; Mao, H.; Ma, S.; Fan, C.; Zhu, Q. Chlorination Behaviors for Green and Efficient Vanadium Recovery from Tailing of Refining Crude Titanium Tetrachloride. J. Hazard. Mater. 2021, 420, 126501. [Google Scholar] [CrossRef] [PubMed]
  8. Vyboishchik, A.; Popov, M. Production of Pigments on the Basis of Titanium Tetrachloride. MATEC Web Conf. 2021, 346, 02037. [Google Scholar] [CrossRef]
  9. Zhu, F.; Li, L.; Zhang, D.; Ma, S.; Ma, Z.; Qiu, K. Separation and Rectification of Chloroacetyl Chloride from TiCl4. Processes 2021, 9, 287. [Google Scholar] [CrossRef]
  10. Ma, J.; Ma, B.; An, Y.; Wang, C.; Wang, B.; Gao, M.; Feng, G. Recovery of Vanadium from Rapid-Cooling Converter Vanadium Slag by Sodium Roasting and Water Leaching. JOM 2024. [Google Scholar] [CrossRef]
  11. Xiang, J.; Luo, M.; Lu, X.; Bai, L.; Zhu, Z.; Huang, Q.; Zhang, S.; Guo, K.; Lv, X. Recovery of Vanadium from Vanadium Slag by Composite Additive Roasting–Acid Leaching Process. J. Iron Steel Res. Int. 2023, 30, 1426–1439. [Google Scholar] [CrossRef]
  12. Yu, J.; Ma, B.; Zhao, S.; Yao, Z.; Wang, C.; Wang, B.; Gao, M.; Feng, G. Vanadium Extraction from Water-Cooled Vanadium Converter Slag via Salt-Free Roasting and Acid Leaching. Process Saf. Environ. Prot. 2023, 172, 727–737. [Google Scholar] [CrossRef]
  13. Xiang, J.; Huang, Q.; Lv, X.; Bai, C. Multistage Utilization Process for the Gradient-Recovery of V, Fe, and Ti from Vanadium-Bearing Converter Slag. J. Hazard. Mater. 2017, 336, 1–7. [Google Scholar] [CrossRef]
  14. Sun, C.; Li, M.; Gao, G.; Li, L. Crude Titanium Tetrachloride Organic Refining Vanadium Tailings Vanadium Technology. J. Process Eng. 2019, 1, 6. [Google Scholar] [CrossRef]
  15. Liu, B.; Wang, N.; Yuan, J.; Huang, Y.; Chen, J.; Tian, Y. Comprehensive Utilization of Vanadium Removal Waste from Titanium Tetrachloride Purification. Environ. Prot. Chem. Ind. 2009, 29, 58–61. [Google Scholar] [CrossRef]
  16. Wang, X.; Xiang, J.; Pei, G.; Li, L.; Huang, Q.; Lv, X. Application of Response Surface Methodology for Roasting Optimization in Composite Roasting—Acid Leaching Vanadium Extraction Process. Chem. Eng. Res. Des. 2021, 172, 254–263. [Google Scholar] [CrossRef]
  17. Peng, H.; Wang, F.; Li, G.; Guo, J.; Li, B. Highly Efficient Recovery of Vanadium and Chromium: Optimized by Response Surface Methodology. ACS Omega 2019, 4, 904–910. [Google Scholar] [CrossRef]
  18. Wen, J.; Jiang, T.; Liu, Y.; Xue, X. Extraction Behavior of Vanadium and Chromium by Calcification Roasting-Acid Leaching from High Chromium Vanadium Slag: Optimization Using Response Surface Methodology. Miner. Process. Extr. Metall. Rev. 2019, 40, 56–66. [Google Scholar] [CrossRef]
  19. Xiong, Y.; Wang, L.; Wang, L.; Li, S.; Yang, G.; Cao, C.; Liu, S.; Nie, Y.; Jia, L. Optimization and Kinetic Analysis of Direct Acid Leaching of Vanadium from Converter Vanadium Slag under Atmospheric Pressure. Miner. Eng. 2023, 198, 108091. [Google Scholar] [CrossRef]
  20. Hout, S.; Salem, Z.; Tassalit, D.; Tigrine, Z.; Aburideh, H.; Boukendakji, H. Assessing Desalination Pretreatment Conditions towards Pilot Scale-up Using Box-Behnken Experimental Design. Water Environ. J. 2021, 35, 473–485. [Google Scholar] [CrossRef]
  21. Zhou, S.; Dong, M.; Ding, X.; Xue, X.; Yang, H. Application of RSM to Optimize the Recovery of Ammonia Nitrogen from High Chromium Effluent Produced in Vanadium Industry Using Struvite Precipitation. J. Environ. Chem. Eng. 2021, 9, 106318. [Google Scholar] [CrossRef]
  22. Deng, R.; Xiao, H.; Xie, Z.; Liu, Z.; Yu, Q.; Chen, G.; Tao, C. A Novel Method for Extracting Vanadium by Low Temperature Sodium Roasting from Converter Vanadium Slag. Chin. J. Chem. Eng. 2020, 28, 2208–2213. [Google Scholar] [CrossRef]
  23. Lee, J.; Kurniawan; Kim, E.; Chung, K.W.; Kim, R.; Jeon, H.-S. A Review on the Metallurgical Recycling of Vanadium from Slags: Towards a Sustainable Vanadium Production. J. Mater. Res. Technol. 2021, 12, 343–364. [Google Scholar] [CrossRef]
  24. Qiu, Y.; Shi, J.; Yu, B.; Xiao, P.; Zhao, F.; Ma, W.; Li, J.; Liu, C. Review and Perspective of Vanadium Extraction Techniques from Converter Vanadium-Bearing Slag. Chem. Ind. Eng. Progress. 2021, 40, 5281–5292. [Google Scholar] [CrossRef]
  25. Li, H.-Y.; Fang, H.-X.; Wang, K.; Zhou, W.; Yang, Z.; Yan, X.-M.; Ge, W.-S.; Li, Q.-W.; Xie, B. Asynchronous Extraction of Vanadium and Chromium from Vanadium Slag by Stepwise Sodium Roasting–Water Leaching. Hydrometallurgy 2015, 156, 124–135. [Google Scholar] [CrossRef]
  26. Gilligan, R.; Nikoloski, A.N. The Extraction of Vanadium from Titanomagnetites and Other Sources. Miner. Eng. 2020, 146, 106106. [Google Scholar] [CrossRef]
  27. Yang, Q.; Qing, H.; Zhang, J.; Zhang, Z.; Ju, D.; Zhang, J.; Du, W. Study on the Preparation of V2O5 by Manganization Roasting of Vanadium-Containing Tailings from Titanium Tetrachloride Refining Process. Metal. Mine 2024, 571, 01036. [Google Scholar] [CrossRef]
  28. Qu, J.; Weng, X.; Li, G.; Hu, Y.; Ma, N.; Dou, Z. Study on Calcified Alkaline Leaching of Vanadium Extraction Tailings from Vanadium Titanium-magnetite Metallurgy. China Nonferrous Metall. 2024, 53, 129–138. [Google Scholar] [CrossRef]
  29. Li, H.; Ren, Q.; Tian, J.; Tian, S.; Wang, J.; Zhu, X.; Shang, Y.; Liu, J.; Fu, L. Efficient Recovery of Vanadium from Calcification Roasted-Acid Leaching Tailings Enhanced by Ultrasound in H2SO4-H2O2 System. Miner. Eng. 2024, 205, 108492. [Google Scholar] [CrossRef]
  30. Ma, N.; Chen, L.; Qu, J.; Zhang, Y. Study on Comprehensive Utilization of Titanium Tetrachloride Refined Tailings. Nonferrous Met. 2017, 7, 62–66+71. [Google Scholar] [CrossRef]
Figure 1. A schematic diagram of the vanadium extraction process from the refining tailings of crude titanium tetrachloride.
Metals 14 00912 g001
Figure 2. Particle size distribution of raw tailing.
Metals 14 00912 g002
Figure 3. XRD pattern of refined vanadium-containing tailings from crude titanium tetrachloride.
Metals 14 00912 g003
Figure 4. XRD pattern of samples at various temperatures.
Metals 14 00912 g004
Figure 5. Predicted values versus experimental values of vanadium recovery rate.
Metals 14 00912 g005
Figure 6. Effect of leaching time and calcination time interaction on vanadium recovery rate.
Metals 14 00912 g006
Figure 7. Effect of calcination time and calcination temperature interaction on vanadium recovery rate.
Metals 14 00912 g007
Figure 8. Effect of liquid–solid ratio and calcination temperature interaction on vanadium recovery rate.
Metals 14 00912 g008
Figure 9. The morphology and XRD patterns of (a) NH4VO3 and (b) V2O5 products.
Metals 14 00912 g009
Table 1. Design matrix for experimental factors and levels.
CodeFactorsLevels
Minimum (−1)Central (0)Maximum (1)
ALeaching time (min)3090150
BLiquid–solid ratio (mL/g)51525
CCalcination time (min)60120180
DCalcination temperature (°C)750850950
Table 2. Arrangement of BBD for experimental variables and obtained results.
Run no. Experimental Design FactorsThe Recovery Rate of V (%)
A (min)B (mL/g)C (min)D (°C)ExperimentalPredicted
1150 (1)15 (0)120 (0)950 (1)91.5992.08
290 (0)15 (0)180 (1)750 (−1)75.6575.21
390 (0)15 (0)120 (0)850 (0)88.1788.16
4150 (1)5 (−1)120 (0)850 (0)87.0087.17
5150 (1)15 (0)120 (0)750 (−1)75.4376.16
6150 (1)15 (0)60 (−1)850 (0)81.9082.35
730 (−1)5 (−1)120 (0)850 (0)82.4082.59
830 (−1)15 (0)120 (0)750 (−1)73.1173.93
990 (0)25 (1)180 (1)850 (0)85.5887.44
1090 (0)5 (−1)60 (−1)850 (0)79.5979.04
1130−1)15 (0)60 (−1)850 (0)79.4079.74
1290 (0)25 (1)120 (0)750 (−1)75.6675.34
13150 (1)25 (1)120 (0)850 (0)89.1387.93
1490 (0)5 (−1)180 (1)850 (0)85.0185.62
1590 (0)15 (0)120 (0)850 (0)88.1788.16
1690 (0)5 (−1)120 (0)750 (−1)74.2373.79
1730 (−1)15 (0)120 (0)950 (1)87.9388.51
1890 (0)15 (0)120 (0)850 (0)88.2388.16
1990 (0)15 (0)120 (0)850 (0)88.0888.16
2030 (−1)25 (1)120 (0)850 (0)87.8886.70
21150 (1)15 (0)180 (1)850 (0)89.2488.61
2290 (0)15 (0)60 (−1)950 (1)85.0784.49
2390 (0)25 (1)120 (0)950 (1)91.3391.48
2490 (0)15 (1)180 (1)950 (1)91.6791.00
2530 (−1)15 (0)180 (1)850 (0)86.1585.41
2690 (0)25 (1)60 (−1)850 (0)81.3982.09
2790 (0)5 (−1)120 (0)950 (1)88.1288.15
2890 (0)15 (0)60 (−1)750 (−1)70.1369.78
2990 (0)15 (0)120 (0)850 (0)88.1588.16
Table 3. Chemical composition of the vanadium-containing tailings (wt.%).
TailingFeClNaSiTiAlVCZrNbOthers
Raw32.7435.446.675.385.603.643.781.471.300.903.07
Washed47.547.821.529.9611.364.667.262.202.651.543.47
Table 4. Analysis of variance for response surface quadratic model of vanadium recovery rate.
SourceSum of SquaresDegree of FreedomMean SquareF-ValueP-Value
Model1037.76874.1386.50<0.0001
A25.29125.2929.51<0.0001
B17.81117.8120.790.0004
C106.921106.92124.77<0.0001
D697.691697.69814.16<0.0001
A24.0814.084.760.0467
B210.51110.5112.260.0035
C272.38172.3884.46<0.0001
D2143.161143.16167.06<0.0001
Lack of fit11.99101.20413.29<0.0001
Residual12.00140.86--
Pure error0.01240.0029R20.9886
Cor total1049.7628-R2adj0.9771
Table 5. Comparison of processes for extracting vanadium from secondary sources.
Raw MaterialMethodCalcinationLeachingƞ (%)Ref.
Temperature/
Time (°C/min)
ReagentTemperature/
Time/L:S (°C/min)
VCTRBlank calcination- alkaline leaching650/120Na2CO380/60/6:185[14]
VCTRCombined acid–alkali method leachingNaOH + HCl60/60/—75[15]
VCTRManganese calcination–acid leaching850/120H2C2O450/30/10:182.16[27]
PVCTUltrasound H2O2 synergistic enhanced leachingH2O250/30/10:163.64[29]
VCTRDirect alkali leachingNaOH120/180/5:195[28]
CVCTDirect calcified alkali leachingCaO +
NaOH
160/60/6:182.25[30]
Disclaimer/Publisher’s Note: The statements, opinions and data contained in all publications are solely those of the individual author(s) and contributor(s) and not of MDPI and/or the editor(s). MDPI and/or the editor(s) disclaim responsibility for any injury to people or property resulting from any ideas, methods, instructions or products referred to in the content.

