Article

Simulation of Localized Stress Impact on Solidification Pattern during Plasma Cladding of WC Particles in Nickel-Based Alloys by Phase-Field Method

1
School of Mechanical Engineering and Automation, University of Science and Technology Liaoning, Anshan 114051, China
2
School of Materials and Metallurgy, University of Science and Technology Liaoning, Anshan 114051, China
*
Authors to whom correspondence should be addressed.
Metals 2024, 14(9), 1022; https://doi.org/10.3390/met14091022 (registering DOI)
Submission received: 20 July 2024 / Revised: 26 August 2024 / Accepted: 5 September 2024 / Published: 7 September 2024

Abstract

:
As materials science continues to advance, the correlation between microstructure and macroscopic properties has garnered growing interest for optimizing and predicting material performance under various operating conditions. The phase-field method has emerged as a crucial tool for investigating the interplay between microstructural characteristics and internal material properties. In this study, we propose a phase-field approach to couple two-phase growth with stress–strain elastic energy at the mesoscale, enabling the simulation of local stress effects on the solidified structure during the plasma cladding of WC particles and nickel-based alloys. This model offers a more precise prediction of microstructural evolution influenced by stress. Initially, the phase field of WC-Ni binary alloys was modeled, followed by simulations of actual local stress conditions and their impacts on WC particles and nickel-based alloys with ProCAST and finite element analysis software. The results indicate that increased stress reduces grain boundary migration, decelerates WC particle dissolution and diffusion, and diminishes the formation of reaction layers and Ostwald ripening. Furthermore, experimental validation corroborated that the model’s predictions were consistent with the observed microstructural evolution of WC particles and nickel-based alloy composites.

1. Introduction

Nickel-based alloys are indispensable in industries requiring high mechanical properties and corrosion-resistant materials, including the aerospace, automotive, and marine sectors [1]. Although these alloys are robust, the performance of critical components can be compromised under the extreme operating conditions of steel production, including high temperatures, heavy loads, and intense friction. Therefore, enhancing these alloys through surface modification technologies is crucial to improving their performance in harsh environments. Ceramic particles with high hardness, excellent thermal stability, and strong wear resistance (such as Tic, WC, and Z r O 2 ) are utilized as superior composite coating additives [2,3,4]. Due to the excellent wettability between WC and nickel-based alloys, WC is considered an ideal reinforcing material. By incorporating WC particles into nickel-based alloys, the wear resistance, hardness, and overall performance of the developed coatings are significantly enhanced, thereby boosting their stability and reliability under such demanding conditions [5,6,7].
Plasma cladding technology employs high-energy plasma beams to melt metal powder, which is then metallurgically combined with the substrate material to form high-performance composite coatings. Within a high-temperature plasma melt pool, WC particles and nickel-based alloys exhibit cellular alloy reaction layers, eutectic structures, and carbides, significantly impacting the mechanical properties of the coating [8,9].
Due to the temperature influence during the experiment, systematically studying the state of WC particles and nickel-based alloys throughout the entire solidification process is challenging. Additionally, limitations in experimental methods make it difficult to reveal the changes and formation of their microstructures. However, numerical simulation can effectively compensate for these shortcomings. Currently, microstructure simulation methods include cellular automata [10,11,12], phase-field modeling [13,14,15], and the Monte Carlo method [16,17,18], among others. Cellular automata (CA) demonstrate notable simplicity in modeling microstructural evolution, attributed to their high computational efficiency and independence from mesh structure dependencies. Nevertheless, CA exhibit limitations in addressing complex interface morphology and multi-physics field interactions and are particularly deficient in capturing the effects of grain boundary morphology. The Monte Carlo (MC) method enhances the predictive accuracy of microstructural evolution by leveraging statistical sampling techniques, making it particularly effective for systems characterized by pronounced stochastic behavior. Nevertheless, this method is computationally intensive and demands a substantial number of samples. It also exhibits inherent limitations in addressing coupled fields, such as stress and temperature. Moreover, due to its sharp interface model, the MC method struggles to accurately simulate interfacial properties of grain boundaries, resulting in less precise simulations of solid-state diffusive phase transitions compared with the phase-field method. Consequently, its application in modeling multiphysics interactions during solidification is constrained. The phase-field method is distinguished by its ability to incorporate continuously varying field variables across interfaces, enabling a more precise representation of interfacial morphological migration and microstructural changes without the need for the explicit tracking of interfaces [19]. Additionally, it can self-couple temperature, flow fields, and stress, enabling the simulation of the evolution of many complex microstructures. This is beyond the capability of cellular automata and Monte Carlo methods. Therefore, this study employs the phase-field method to investigate the influence of the local stress field during the solidification process of surface overlay welding.
The phase-field model, as an effective mathematical tool, was initially introduced to describe the microstructure transformation of materials without explicitly tracking complex interface boundaries. This method not only conserves significant computing resources but also greatly simplifies model complexity. The phase-field model proposed by Karma and Rappel [20] successfully simulated the anisotropy and tip-branching phenomenon during dendritic growth, providing an important theoretical basis for understanding microstructural evolution during solidification. Chen [21] and Moelans et al. [22] discussed in detail the foundations and applications of phase-field models, emphasizing their effectiveness in addressing interface dynamics issues in materials science. Echebaria et al. [23] study further improved the phase-field model to more accurately describe grain growth under varying temperature and composition conditions. Tegze et al. [24] coupled the phase-field method with multiple physical fields, such as fluid dynamics and electromagnetic fields, enabling a more comprehensive description of the various physical phenomena in the solidification process. In recent years, phase-field modeling has seen substantial advancements in coupling multiple physical fields and in simulating a diverse range of complex physical phenomena. Wang et al. [25] effectively demonstrated the integration of phase-field methods with Monte Carlo simulations and fluid dynamics to achieve a thorough understanding of microstructural evolution under coupled thermal and mechanical conditions, which is vital for materials operating in complex environments. Munoz et al. [26] advanced phase-field models to provide more accurate characterizations of grain growth across varying temperatures and compositions, thereby more effectively simulating metal solidification, crystal growth, and phase transformations, which in turn enhances the predictive capabilities of these models for industrial applications.
Previous studies have not specifically employed the phase-field model to investigate the localized stress–strain effects occurring during the solidification of WC particles in nickel-based alloy composite coatings. In this study, we introduce a numerical model that couples the phase-field method with elastic strain energy to simulate the effects of localized stresses on microstructural evolution, enabling a more detailed analysis of stress-induced microstructural changes. Unlike earlier models that oversimplify stress effects, our approach facilitates a more precise observation of the interplay between the local stress field and microstructural development during solidification. Integrating the macroscopic stress data derived from ProCAST 2019 simulations with a phase-field model yields a more accurate representation of the effects of localized stresses during solidification. This approach, which links macroscopic stress distribution to microstructural evolution, offers deeper insights into the stress mechanisms influencing microstructural changes. The feasibility and accuracy of the phase-field model are validated through a rigorous comparison of simulation results with SEM experimental data. This study serves as a crucial reference for comprehensively understanding the stress mechanisms between WC particles and nickel-based alloys during solidification, thereby offering theoretical support for the optimization and design of related materials.

2. Phase-Field Models

2.1. Phase-Field Model

The development of the phase-field model integrates the simulation of grain growth via the phase-field method with the consideration of elastic strain energy. This approach disregards the chemical reactions and phase transitions among other metals (Cr, Fe, etc.) in nickel-based alloys and WC particles. Firstly, the nickel-based alloy is simplified to pure Ni, constructing a binary system consisting of WC particles and Ni. By introducing field variables and establishing a two-phase growth system, elastic strain energy under varying stress conditions is introduced into the phase-field model. Solving partial differential equations allows for the simulation of the influence of local stress and the grain evolution process of WC particles and nickel-based alloys during the plasma cladding solidification process.

2.2. Phase Field

By utilizing the phase-field method to establish a grain growth model, we initially consider WC particles and nickel-based alloys as two distinct phases during plasma cladding, namely, phase α (WC particles) and phase β (Ni). By employing the multi-order parameter two-phase-field model proposed by Fan and Chen [27], a series of orientation field variables ψ 1 α ( r ) ,   ψ 2 α ( r ) ,   ,   ψ p α ( r ) , ψ 1 β ( r ) ,   ψ 2 β ( r ) ,   ,   ψ q β ( r ) , and the component field C(r) are defined. Here, p and q denote the number of orientation field variables for phases α and β , respectively, with ψ representing the characteristics of the corresponding phase grains. The orientation field variables are non-conservative, describing the orientation of different grains in polycrystalline materials. Simultaneously, these orientation field variables continuously vary in space, with values ranging from 0 to 1. Within a grain, only one orientation field variable ψ attains a value of 1, while all other orientation field variables ψ are 0. At the grain boundary, the orientation field variable ψ transitions continuously from 0 to 1. The component field variable C(r) is conservative, with values of C α and C β in the α and β phase grains, respectively, and intermediate values between C α and C β at the grain boundaries.
In this model, the total chemical free energy comprises local free energy, interfacial gradient energy, and elastic energy. According to diffusion interface theory and continuum field theory, the total free energy F in a two-phase system can be expressed as
F = [ f 0 ( C ( r ) ; ψ i α ( r ) ; ψ i β ( r ) ) + k c 2 ( C ( r ) ) 2 + k i α 2 ( ψ i α ( r ) ) 2 + k i β 2 ( ψ i β ( r ) ) 2 + f e l a s t ] d r 3
Here, f 0 denotes the local free energy; C ( r ) signifies the component field variable; ψ i α ( r ) and ψ i β ( r ) represent the gradient terms of the orientation field variables for the α and β phases; k c , k i α , and k i β denote the corresponding gradient energy coefficients; and f e l a s t signifies the elastic energy density.
The interfacial energy σ g b between phase α and phase β in the system can be expressed as
σ g b = + [ Δ f ( ψ i α , ψ i β , C ) + k c 2 ( d C d x ) 2 + k i α 2 ( d ψ i α d x ) 2 + k i β 2 ( d ψ i β d x ) 2 ] d x
The driving force of microstructural evolution is derived from the reduction in system free energy. The evolution dynamics of these field variables are described by the Allen–Cahn [28] and Cahn–Hilliard [29] equations.
d ψ i α ( r , t ) t = L i α ( σ ) δ F δ ψ i α ( r , t ) + ς α ( r , t )
d ψ i β ( r , t ) t = L i β ( σ ) δ F δ ψ i β ( r , t ) + ς β ( r , t )
d C ( r , t ) t = M [ δ F δ C ( r , t ) ] + ς C ( r , t )
L i α ( σ ) and L i β ( σ ) are kinetic coefficients associated with grain boundary mobility, while M is the kinetic coefficient associated with the atomic diffusion coefficient. ς α ( r , t ) and ς β ( r , t ) represent the noise terms considering thermal fluctuations. We set the thermal noise term to ς = 0.001 (where i = α , β , and C). In practical applications, local stress can alter the total free energy of the system, indirectly impacting the interfacial energy and consequently affecting the migration rate L. Increasing stress decreases the migration rate between phase interfaces. Here, we tensorize L, which can be obtained as
L ( σ ) = L 0 e ( μ σ k )
Here, L 0 represents the reference mobility, μ signifies the stress sensitivity factor, k denotes a material-specific physical constant, and σ refers to the local stress. To facilitate numerical solutions, we construct the free energy density function f 0 , defined as
f 0 = f ( C ) + i = 1 p f ( C , ψ i α ) + i = 1 q f ( C , ψ i β ) + k = α β i = 1 p i = 1 q f ( ψ i k , ψ i k )
f ( C ) is a function of the concentration C, and f ( C , ψ i α ) and f ( C , ψ i β ) describe the combined relations between the orientation field ψ and the concentration field C(r). Moreover, f ( ψ i k , ψ i k ) is coupled with the orientation field ψ .
f ( C ) = A 2 ( C C m ) 2 + D α 4 ( C C α ) 4 + D β 4 ( C C β ) 4 + B 4 ( C C β ) 4
f ( C , ψ i α ) = γ α 4 ( C C β ) 2 + δ α 4 ( ψ i α ) 4
f ( C , ψ i β ) = γ β 4 ( C C β ) 2 + δ α 4 ( ψ i β ) 4
f ( ψ i k , ψ i k ) = ε 2 ( ψ i α ) 2 ( ψ i β ) 2
In the aforementioned equation, C α and C β represent the concentrations of phase α and phase β at equilibrium, respectively, while D α , D β , δ , C m = C β + C α 2 , A, B, γ α , γ β , and ε denote the relevant parameters.

2.3. Elastic Strain Energy

Solid-state phase transitions occur during the solidification of binary alloys. As the interface between the two phases advances and solute atoms continue to diffuse, significant changes in phase-field variables and solute concentration are observed near the interface. Simultaneously, differences in lattice parameters between the new phase and the parent phase generate an elastic field between them. Both phenomena manifest themselves as strains that result in significant changes near the phase interface. The elastic strain energy changes the total free energy of the system and influences the evolution of phase and solute fields in a way that is long range. Therefore, it is essential to account for the elastic strain energy in the elastic field near the two-phase interface and integrate it into the governing equations during the two-phase solidification process. The elastic strain energy can be expressed as follows:
f e l a s t = ε k l e l C i j k l ε i j e l
where ε k l e l and ε i j e l represent the elastic strain components and C i j k l is the position-dependent elastic tensor. The elastic strain can be expressed as follows:
ε i j e l = ε i j ε i j 0
where denotes the total strain energy and ε i j 0 represents the position- and component-dependent eigenstrain. We consider the total strain energy ε i j as follows: the intrinsic strain ε i j e l linearly related to stress, the intrinsic strain ε i j C due to component inhomogeneity, and the intrinsic strain ε i j t in the presence of a temperature gradient. Thus, the total strain can be expressed as follows:
ε i j = ε i j t + ε i j C + ε i j e l
By introducing the Kronecker delta, denoted by δ i j ( i = j , δ i j = 1 , δ i j 1 , and δ i j = 0 ), and the coefficient of thermal expansion ζ , the temperature-induced eigenstrain ε i j t is defined as follows:
ε i j t = ζ T δ i j
According to Vegard’s law, which states that the lattice constant is linearly related to the solid solution concentration, the intrinsic strain ε i j C due to component inhomogeneity can be expressed as follows:
ε i j C = ε 0 ( C C m ) δ i j
Here, ε 0 represents the lattice expansion coefficient of the element with respect to the matrix element [30]. The total strain in the system can be expressed as follows:
δ ε i j = 1 2 [ u i r i + u j r j ]
u represents the displacement field, and r denotes the position vector.
σ i j e l = C i j k l ε i j e l = C i j k l ( ε i j ε i j t ε i j C )
Assuming that phases α and β are linearly elastic and obey Hooke’s law, the stress can be expressed as follows:
f e l a s t = ( ε k l ε k l t ε k l c ) C i j k l ( ε i j ε i j t ε i j c )
Assuming that the rate of reaching mechanical equilibrium is much faster than the chemical reaction rate, we solve the mechanical equilibrium equation to obtain the elastic energy, expressed as [31]
σ i j e l r j = 0 i n V

2.4. Solving Parameters
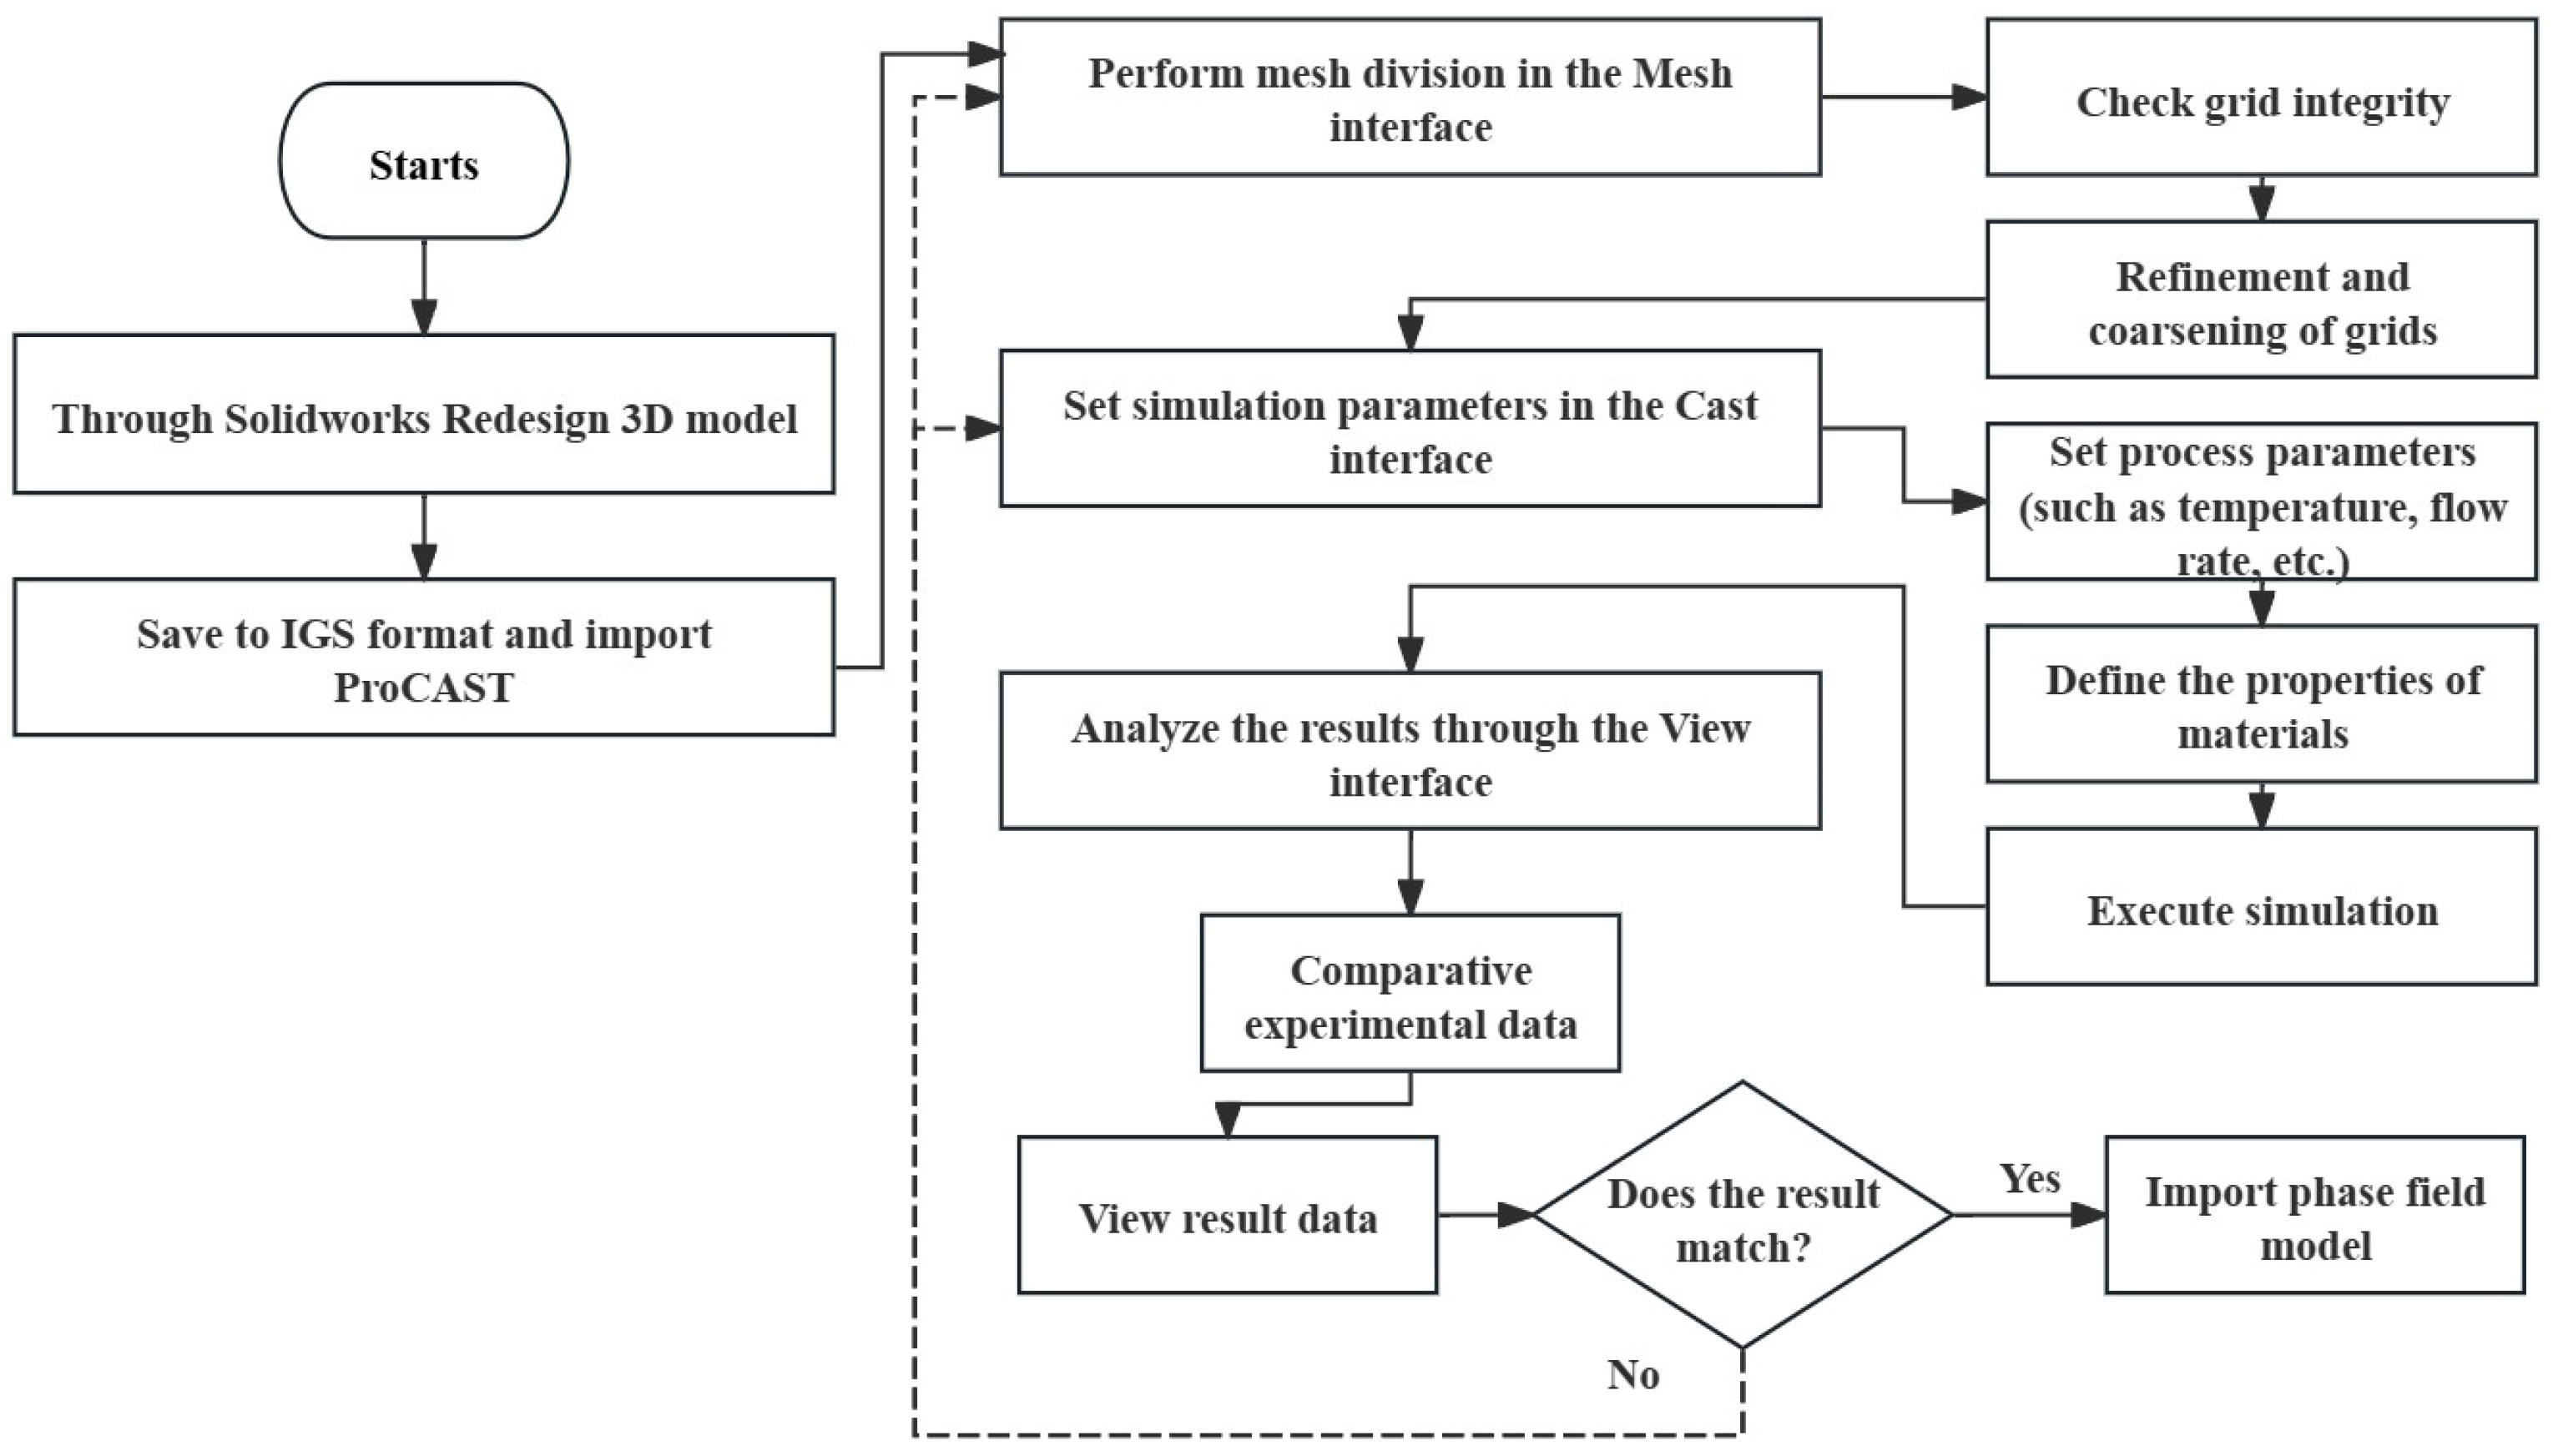
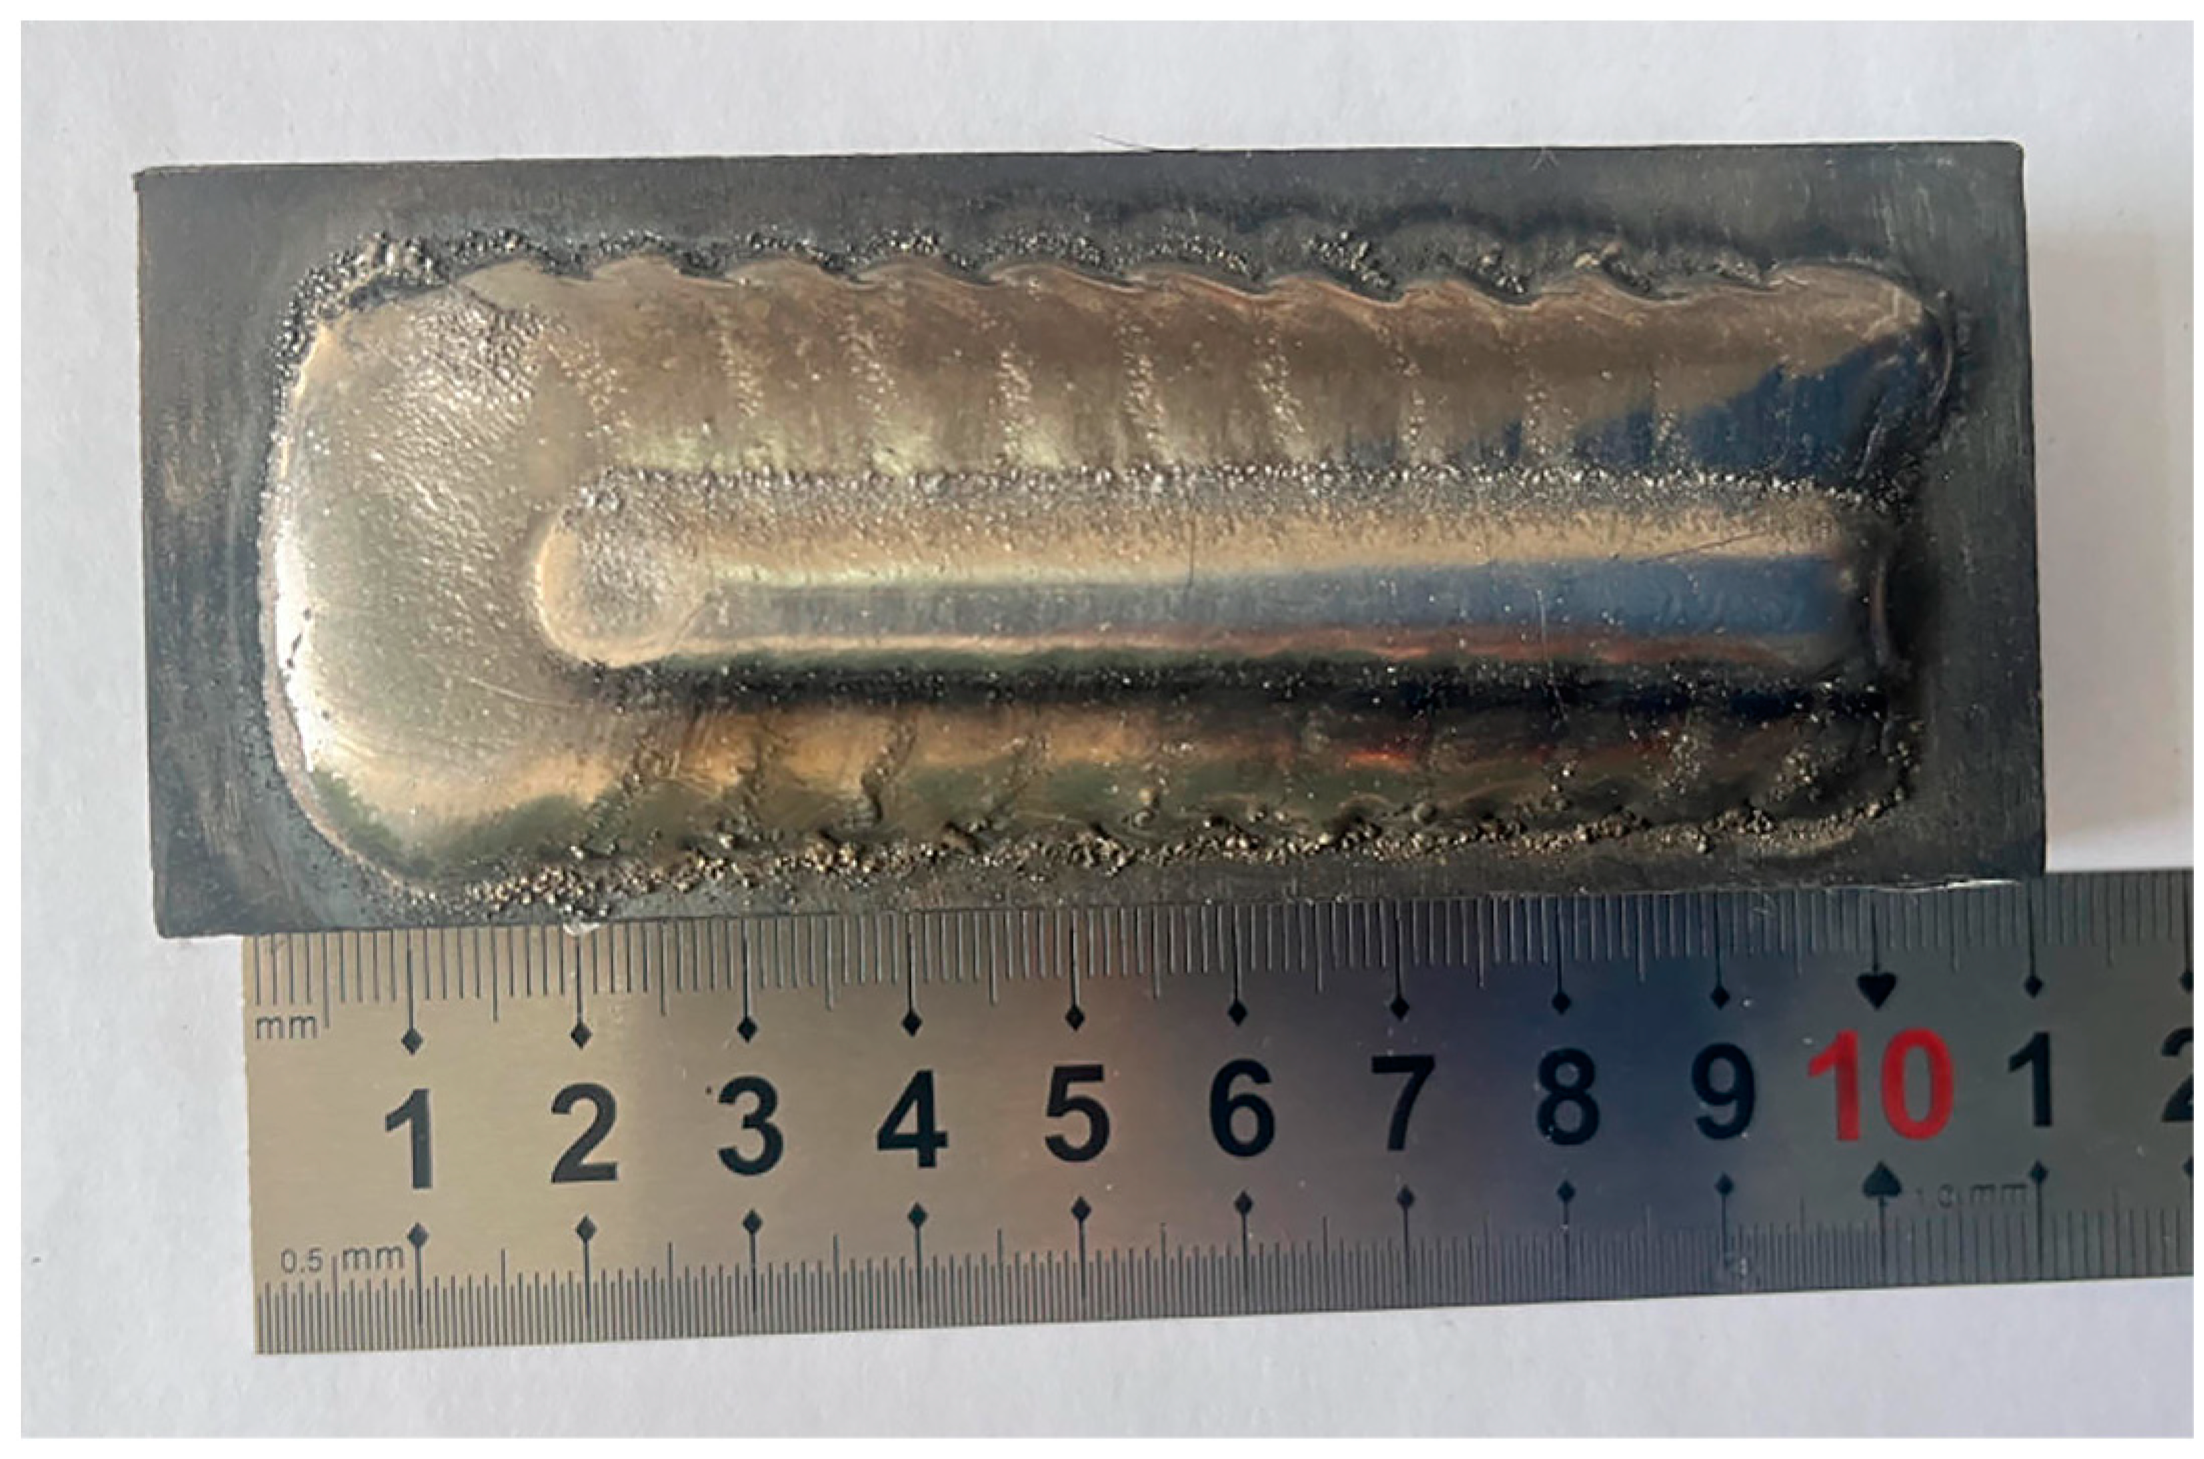
The phase-field method serves as a powerful tool for modeling the evolution of complex microstructures. By solving the variational problem of the generalized free energy function, it is feasible to simulate the motion and phase transition phenomena at phase interfaces across continuous time and space scales. This approach is particularly well suited for addressing the dynamic behavior of phase interfaces in multiphase materials.
Among the various methods for solving variational problems, common techniques include finite difference methods [32,33,34], Fourier spectral methods [35,36,37], and finite element methods [38,39]. The finite difference method is widely used due to its concise theoretical foundation, simple meshing, and ease of constructing and programming discrete equations. The finite difference method is characterized by significant localization, providing high adaptability and accuracy in addressing variational problems with substantial local variations. In contrast, the Fourier spectral method excels at handling problems with periodic boundary conditions, while the finite element method demonstrates its unique and powerful capability in addressing problems with complex geometries and non-uniform material properties. Thus, the finite difference method is chosen as the primary research tool in this study.
We apply Equation (1) to Equations (3)–(5) to solve the equations by using the Euler–Lagrange equations:
δ F δ ψ = d d x ( F v ( ψ x ) ) + F v ψ
From the above equation, with F v = f 0 + k c 2 ( C ( r ) ) 2 + k i α 2 ( ψ i α ( r ) ) 2 + k i β 2 ( ψ i β ( r ) ) 2 + f e l a s t , the following expression can be derived:
d ψ i α ( r , t ) t = L i α ( σ ) [ f 0 ψ i α k i α 2 ψ i α + f e l a s t ψ i α ] + ς α ( r , t )
d ψ i β ( r , t ) t = L i β ( σ ) [ f 0 ψ i β k i β 2 ψ i α + f e l a s t ψ i β ] + ς β ( r , t )
d C ( r , t ) t = M [ f 0 C k c 2 C + f e l a s t C ] + ς C ( r , t )
The numerical solution of the system of equations is achieved by discretizing the Ginzburg–Landau and Cahn–Hilliard equations in both space and time. Spatially, we employ the finite difference method (FDM) to partition the solution region into a discrete grid, replacing the continuous solution region with a finite number of grid nodes. We utilize the nine-point lattice discrete Laplace operator [40], which can be expressed as follows:
2 ψ i = 1 Δ x 2 [ 1 2 j m m ( ψ j ψ i ) + 1 4 k n m ( ψ k ψ i ) ]
Here, ψ i represents the field variable at lattice point i, Δ x is the spatial step size, and j and k denote the nearest and next-nearest neighbor lattice points of lattice point i. In this study, we employ a square lattice to describe the micro-evolutionary process, resulting in the values of mm and nm both being 4.
For temporal discretization, we employ the explicit Euler method, which can be expressed as follows:
ψ i ( t + Δ t ) = ψ i ( t ) + d ψ i d t × Δ t
In the above equation, Δ t represents the time step.
This study aims to investigate the impact of localized stress on the microstructural evolution of WC grains during the solidification of nickel-based alloys by using the phase-field method and to compare the results with experimental observations. The influence of varying levels of localized stress on grain growth and the solidification characteristics of grains during Ostwald ripening are examined. Therefore, we assume that the kinetic processes of the microstructural evolution of grains are entirely governed by the kinetic coefficients. Parameters such as gradient energy coefficients and grain boundary mobility coefficients are referenced from the Al2O3−ZrO2 two-phase system [27]. The specific parameters for the phase-field simulation are detailed in Table 1.
To visualize the microstructure generated by the computer simulation, the following functions are defined:
φ ( r ) = 0.75 ( i = 1 p [ ψ i α ( r ) ] 2 ) + i = 1 q [ ψ i β ( r ) ] 2

3. Macro-Simulation

In this section, ProCAST finite element software is utilized to simulate the local stress during the solidification process of plasma cladding. By analyzing the temperature field and equivalent stress field of the casting, the equivalent stress at different positions during solidification is introduced into the phase field. Consequently, the effect of local stress on WC particles at various positions is determined. The flowchart of the simulation using ProCAST is illustrated in Figure 1.

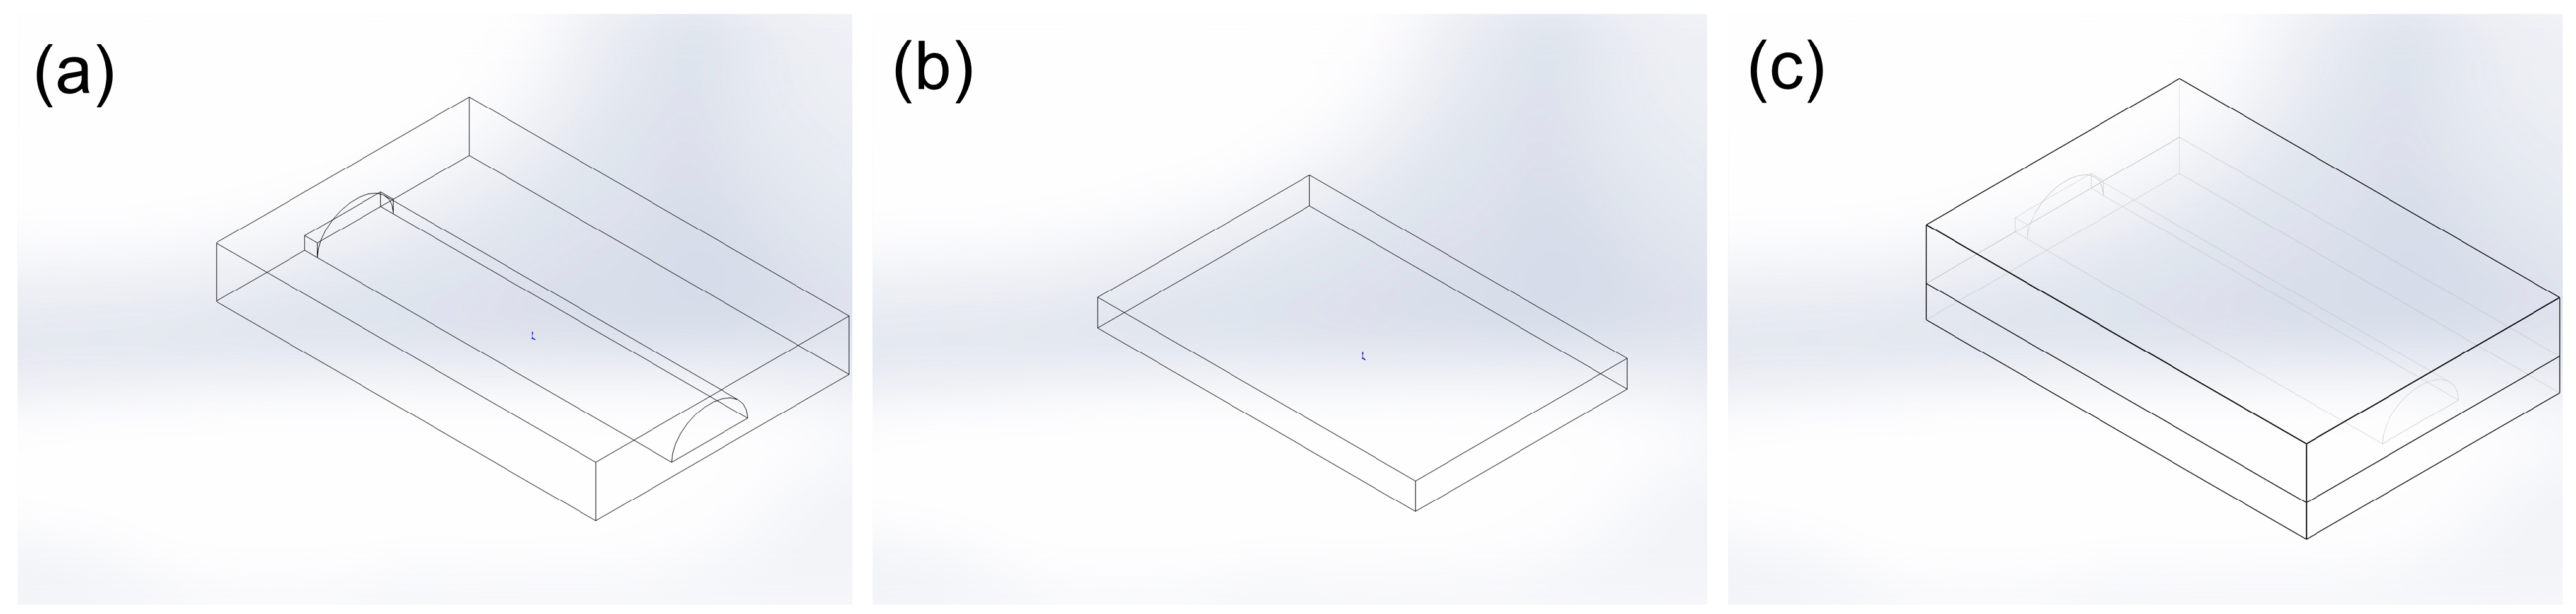
3.1. Model Establishment and Grid Partitioning

To mitigate the difference in material properties between the cladding layer and the substrate during the experimental process, a nickel-based alloy transition layer is initially prepared on the substrate, followed by a WC-enhanced nickel-based alloy hard layer on the surface of the transition layer, as shown in Figure 2. To realistically simulate the experimental process and facilitate the simulation, we use a nickel-based alloy as the substrate for Ni40A-45 wt.% WC casting. Firstly, 3D modeling is performed by using SolidWorks 2020, as shown in Figure 3. Here, Figure 3a denotes the upper mold size, 60 mm × 40 mm × 8 mm; Figure 3b represents the lower mold size, 60 mm × 40 mm × 4 mm; the middle oval long casting bar is for the casting with a size of 56 mm × 12 mm × 5 mm; and the small rectangle indicates the casting mouth size, 2 mm × 12 mm × 2 mm.
The 3D solid model is then imported into ProCAST for mesh division. To ensure the accuracy of the simulation results, the casting mesh is finely detailed. The total number of 2D surface mesh elements is 6956, and the total number of 3D mesh cells is 59,447, as shown in Figure 4.

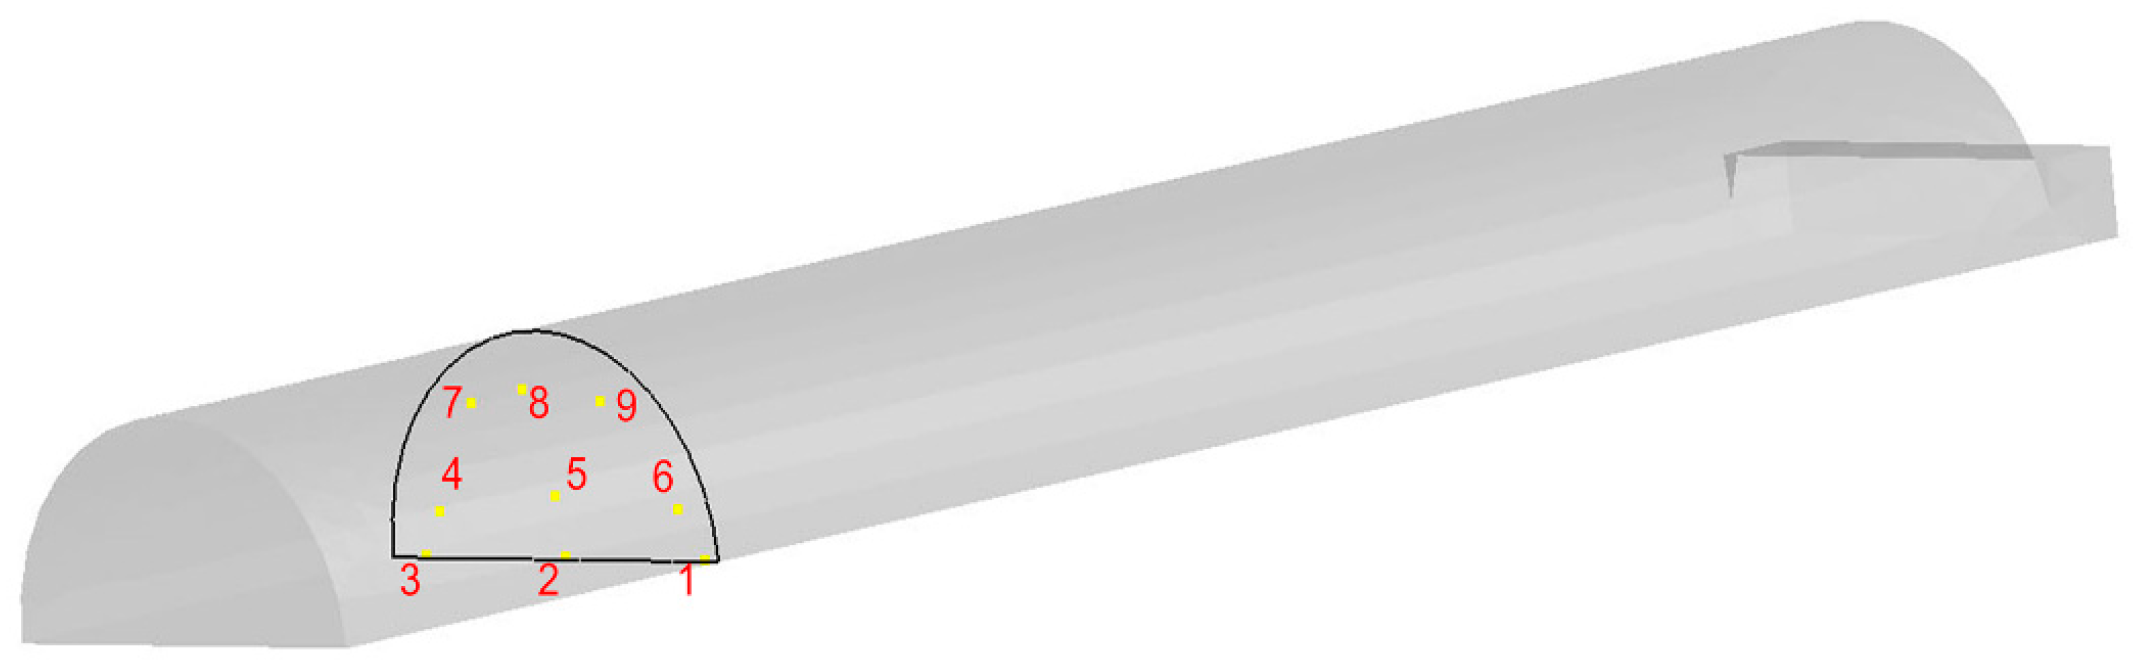
3.2. Boundary Conditions

ProCAST contains only a limited selection of commonly used materials and does not include Ni40A-45 wt.% WC for plasma cladding or Ni40A metal materials for the cladding layer. However, we can utilize the thermodynamic database to input the basic elemental ratios of the casting and the required metal molds. This allows us to generate data to view the phase diagrams of the materials, coefficients of thermal expansion, Young’s modulus, Poisson’s ratio, and other relevant material properties, as shown in Table 2. The upper mold material is set as Resin Bonded Sand, while the lower mold and casting materials are selected as Ni40A and Ni40A-45 wt.% WC. Additionally, to better simulate the experiment, the properties of the casting material are set to be elastic–plastic.
At the beginning of casting, the bottom plate is preheated to 200 °C for 30 min, while the casting temperature is automatically calculated based on the thermodynamic database data, yielding a temperature of 1362 °C, which we round to 1400 °C. The casting time is set to 6 s, and the heat transfer coefficients vary for different contact materials. For the heat transfer coefficient between the molds, we use h = 500; for the coefficient between the casting and the upper mold, we use h = 1000; and for the coefficient between the casting and the lower mold, we use h = 2000. Additionally, we set the boundary conditions, with the periphery of the mold being naturally cooled by air.

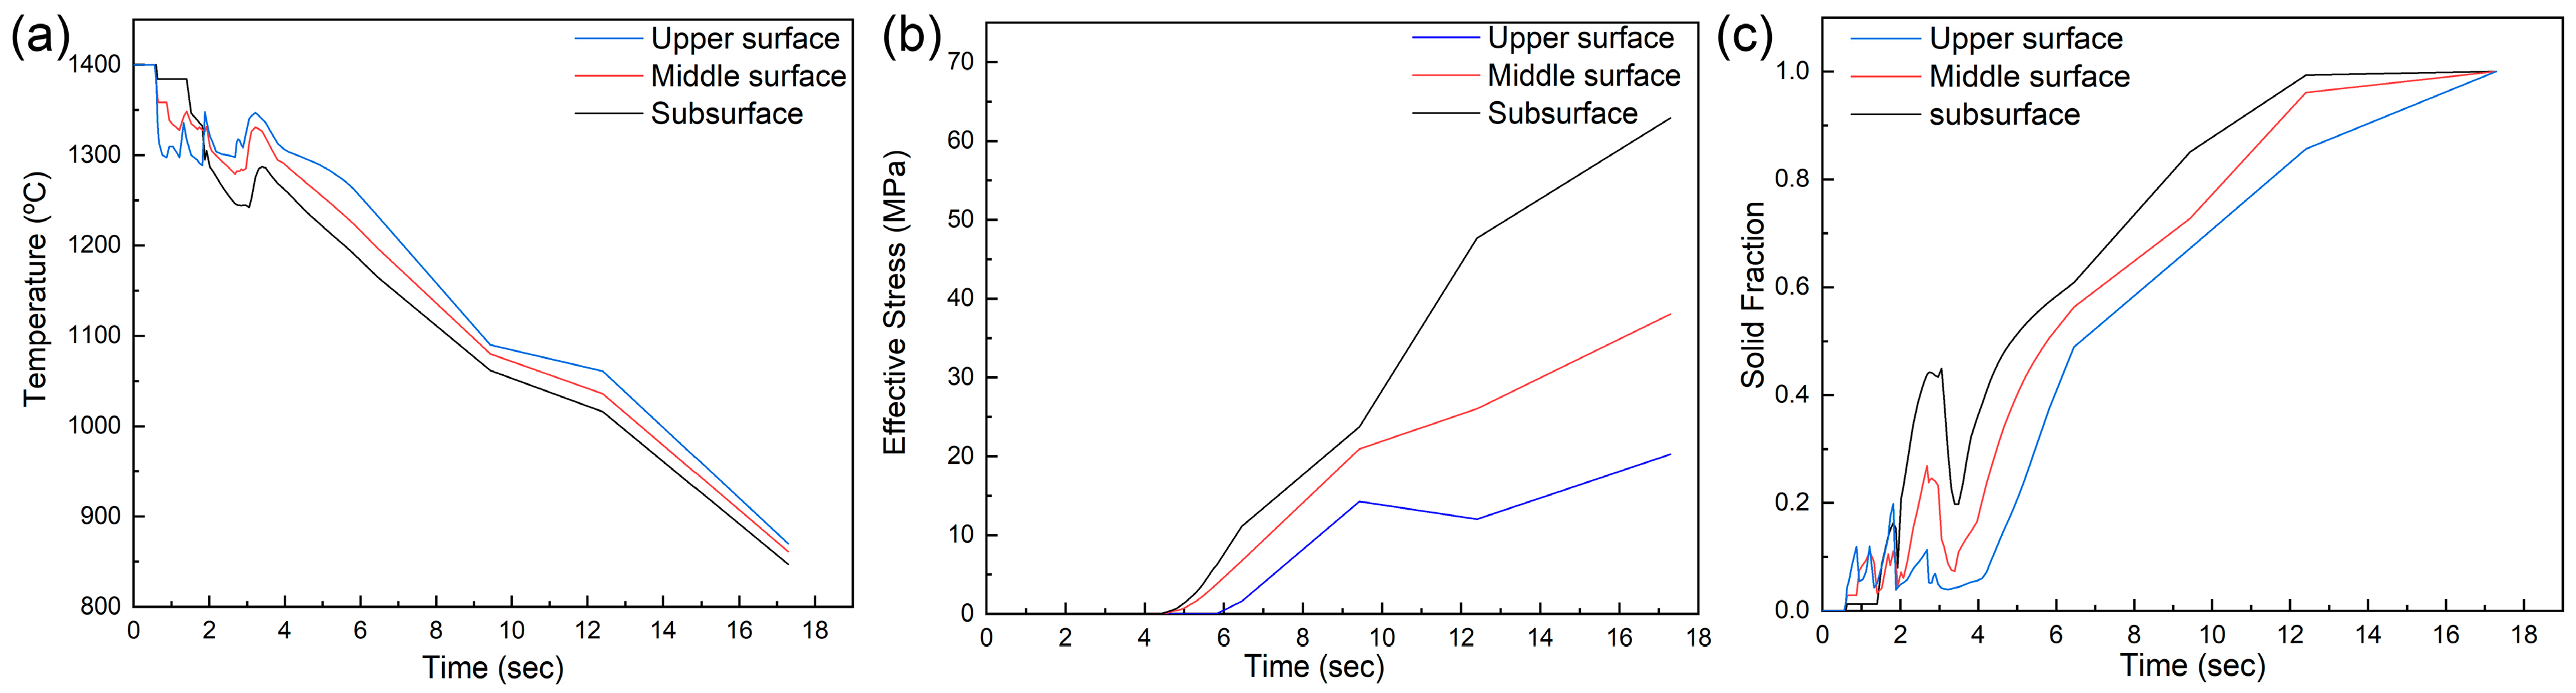
3.3. Analysis of the Process

By configuring the material properties, flow rate and boundary conditions, we can obtain the calculation results of the solidification process of the casting. To facilitate the analysis of subsequent stress values, we randomly select a cross-section during the solidification process of Ni40A-45 wt.% WC and choose three points in the upper, middle, and lower layers near the cross-section, as depicted in Figure 5.
The equivalent stress-versus-temperature curves for each point can be plotted by using the Viewer interface of ProCAST. To ensure more accurate stress values, we take the average temperature and stress for each layer, as shown in Figure 6. From Figure 6a, it is evident that the temperature gradient exists across the cross-section during the same time period, with the upper layer having the highest temperature and the lower layer having the lowest temperature. Simultaneously, the effective stress during solidification increases as the temperature decreases.
From the curves of the upper layers in Figure 6a,b between 10 s and 12 s, it can be concluded that when the temperature changes slowly, the effective stress during solidification not only does not increase but also decreases. Figure 6c shows that the solidification rate of the lower layer is higher compared with the middle and upper layers during the same time period. Additionally, Figure 6b indicates that the effective stress is relatively higher at locations with a higher solidification rate. The effective stress changes drastically at the beginning of solidification and then tends to level off over time.

4. Simulation Results and Discussion

The phase-field simulation of the WC-Ni binary system is conducted in a two-dimensional region by using a square grid with periodic boundaries to simulate grain growth under varying stresses. The spatial step is set to Δ x = 20, and the time step size of Δ t = 0.1 is selected to ensure numerical stability. A square grid of 300 × 300 is used for the simulation. The number of orientation field variables is set to p = q = 36 [42], and the initial values of the orientation field variables are normally distributed random numbers between −0.001 and 0.001.
The selection of stress parameters was determined through a comprehensive comparison of experimental data and simulation results. As depicted in Figure 7a, during the cladding process at a preheating temperature of 200 °C, the WC particles in the Ni40A-45 wt.% WC composite predominantly concentrate in the middle layer. Figure 7b reveals that under low-magnification backscattered imaging from a scanning electron microscope, the upper layer of the cladding exhibits only sporadic distributions of WC particles, with the lower layer showing an almost complete absence of these particles. Moreover, as observed in Figure 7a,b, most WC particles exhibit round shapes; however, a small number of particles possess irregular shapes. When these particles deviate from a spherical form, significant singular charges and fields may develop at their edges and tips. According to Olyslager [43], in bi-isotropic materials, the formation of such singular fields is closely linked to the material’s electromagnetic properties. Similarly, Valagiannopoulos [44] examined the formation of singular fields near the edges of metals and suggested that these fields can be effectively mitigated through material and geometric optimization.
For our study, this suggests that non-spherical WC particles may cause localized stress concentrations, which could impact the microstructural evolution during solidification and lead to localized anomalies in material properties. To mitigate these effects, we optimize the particle shape during simulation to make it more rounded, thereby preventing the formation of singular fields at the tips and edges. For the singular shapes generated in the experiments, in future studies, we can consider optimizing the formation of these singular fields by changing the particle shapes or choosing suitable materials to avoid local anomalies in the materials.
In practical applications, process and environmental influences cause stress variations even in adjacent areas. Figure 6 illustrates that the stress levels vary at different depths, even when subjected to the same temperature. Our primary focus is on investigating the impact of localized stress on WC particles and nickel-based alloys during the plasma cladding process. Therefore, we refer to the effective stress curves of the layers shown in Figure 6b and select the stress values corresponding to a solid-phase ratio of 0.7–0.9, as illustrated in Figure 6c. We then use stress values ranging from 10 to 30 MPa to simulate the effects of different localized stresses on WC particles.
By incorporating these stress conditions into the phase-field model, the results are depicted in Figure 8. Figure 8a–e illustrate the microstructural evolution around the WC particles under various stress conditions. In these images, the dark-gray regions represent WC particles, the white grains signify the nickel-based alloy, and the light-gray areas around the circles indicate the reaction layer between the WC particles and the nickel-based alloy. This suggests that under high-temperature conditions, WC particles partially dissolve and precipitate, integrating with the nickel-based alloy to form a new phase. To determine the composition of this phase, the physical phase of the sample was analyzed by using X-ray diffraction, as depicted in Figure 9. The analysis revealed that the primary components are γ N i / F e , M 7 C 3 , M 23 C 6 , F e 3 C , and various carbides, as indicated by the intensities of the diffraction peaks. However, this study primarily focuses on the quantity of phase formation under varying stress conditions rather than the phase transformation between the two phases.
As illustrated in Figure 8a, at a local stress of 10 MPa, a distinct reaction layer forms between the WC particles and the nickel-based alloy, and the surrounding grain size is large. According to Equation (6), under low-stress conditions, grain boundary mobility is higher, and the dissolution and diffusion processes of WC particles are less influenced. Consequently, during solidification, WC particles form a distinct reaction layer with the nickel-based alloy. Additionally, due to the minimal change in the system’s free energy, the formation of large grains through the merging of neighboring grains becomes more pronounced, a phenomenon known as Ostwald ripening.
As depicted in Figure 8e, when the local stress increases to 30 MPa, grain boundary mobility decreases significantly, the total free energy of the system reduces, WC particles dissolve only slightly during solidification, the reaction layer diminishes, and the formation of large grains by the merging of neighboring grains is weakened.
In summary, when the local stress is low, the system’s elastic energy decreases marginally, leading to a minor change in the total free energy. Since the movement of microstructures occurs alongside a reduction in free energy, the extent of this reduction determines the energy available for grain boundary migration. Under higher stress, the magnitude of the elastic energy change increases, resulting in a greater decrease in the total free energy of the system, which in turn reduces grain boundary migration. Consequently, the reaction layer between the WC particles and the nickel-based alloy diminishes during solidification, and the Ostwald ripening effect among the grains is weakened. Conversely, under low stress, the intrinsic strain within the lattice is less affected, leading to minor changes in the system’s total free energy. This results in an increased reaction layer, more pronounced changes in the shape of WC particles, and a more evident Ostwald ripening phenomenon.
To more effectively observe the changes in the two phases during solidification, we employ 125 × 125 grid points while maintaining constant time steps, space steps, and the number of orientation field variables. This setup allows us to simulate the influence of and changes in individual WC particles under localized stresses during solidification. We select stress levels of 10 MPa, 20 MPa, and 30 MPa, representing upper surface, middle surface, and subsurface, respectively, to simulate the changes in the grains surrounding the WC particles and the reaction layer between the WC particles and the nickel-based alloy, as illustrated in Figure 10.
By comparing Figure 10a,c, it is evident that for the same number of steps, higher local stress results in slower grain evolution around the WC particles, with relatively smaller grain sizes. Additionally, excessive local stress significantly impacts the total free energy of the system, leading to a decrease in free energy, reduced grain boundary mobility, an increase in the number of grains around the WC particles, and a reduction in their average size. As illustrated in Figure 10g, under lower stress, the decomposition and diffusion of WC particles are pronounced, and the formation of the reaction layer is prominent. Additionally, the lower local stress introduces a certain degree of randomness in the direction of the dissolution and diffusion of the WC particles, altering their shape from circular to elliptical. As depicted in Figure 10i, at high local stress, the dissolution and diffusion of WC particles are significantly influenced, resulting in a reduced thickness of the reaction layer with the nickel-based alloy. Additionally, the small grains near the large grains are not engulfed but retain their shapes, while the geometry of the WC particles remains largely unchanged.
As illustrated in Figure 11a, during the cladding process, the WC particles near the upper surface exhibit significant dissolution and diffusion due to slower temperature changes and lower stress. This leads to the formation of a thicker reaction layer with the surrounding nickel-based alloy. The lower stress and higher grain boundary mobility in the upper layer introduce more randomness into the dissolution and diffusion process of WC particles, resulting in a distinct ellipsoidal shape and relatively larger grain size around the WC particles. As depicted in Figure 11b, the localized stress in the middle layer is relatively moderate, slowing down the dissolution and diffusion processes of WC particles, which results in a thinner reaction layer compared with the upper layer. Additionally, the increased stress affects realm migration, reducing both grain boundary mobility and the Ostwald ripening effect. As illustrated in Figure 11c, at this stage, contact between the cladding layer and the substrate leads to more drastic temperature changes and higher local stress. This significantly reduces the dissolution and diffusion of WC particles, resulting in the thinnest reaction layer with the surrounding nickel-based alloy. The higher stress significantly restricts grain boundary migration, thereby preventing the engulfment of smaller grains by larger ones and preserving the shape of the WC grains.
By comparing Figure 10g with Figure 11a, the simulation results indicate that localized stress in the upper level is lower, resulting in pronounced dissolution and diffusion of WC particles and a prominent reaction layer. Additionally, the relative size of the grains surrounding the WC particles is larger, and the internal WC particles form distinct ellipsoids, consistent with experimentally observed changes. Comparing Figure 10h and Figure 11b, the simulation results demonstrate that localized stresses in the intermediate layer are relatively moderate, reducing the reaction layer formed between the WC particles and the nickel-based alloy and resulting in smaller grain sizes. Additionally, the shape of the WC particles changes slightly, aligning with experimentally observed results. Comparing Figure 10i and Figure 11c, the simulation results reveal that the localized stress at the lower level is higher, significantly reducing the reaction layer around the WC particles. The relative size of the surrounding grains is smaller, and the shape of the WC particles remains unchanged, consistent with experimentally observed changes. The comparison between experimental and simulation results indicates a high degree of consistency.

5. Conclusions

This study investigates the effect of local stress on the microstructural evolution of WC particles and nickel-based alloys during the solidification process of plasma cladding by using the phase-field method combined with ProCAST software. Throughout the solidification of WC particles within nickel-based alloys, localized stresses have a pronounced impact on grain boundary mobility, particle dissolution and diffusion, and the Ostwald ripening of grains. The following conclusions are drawn:
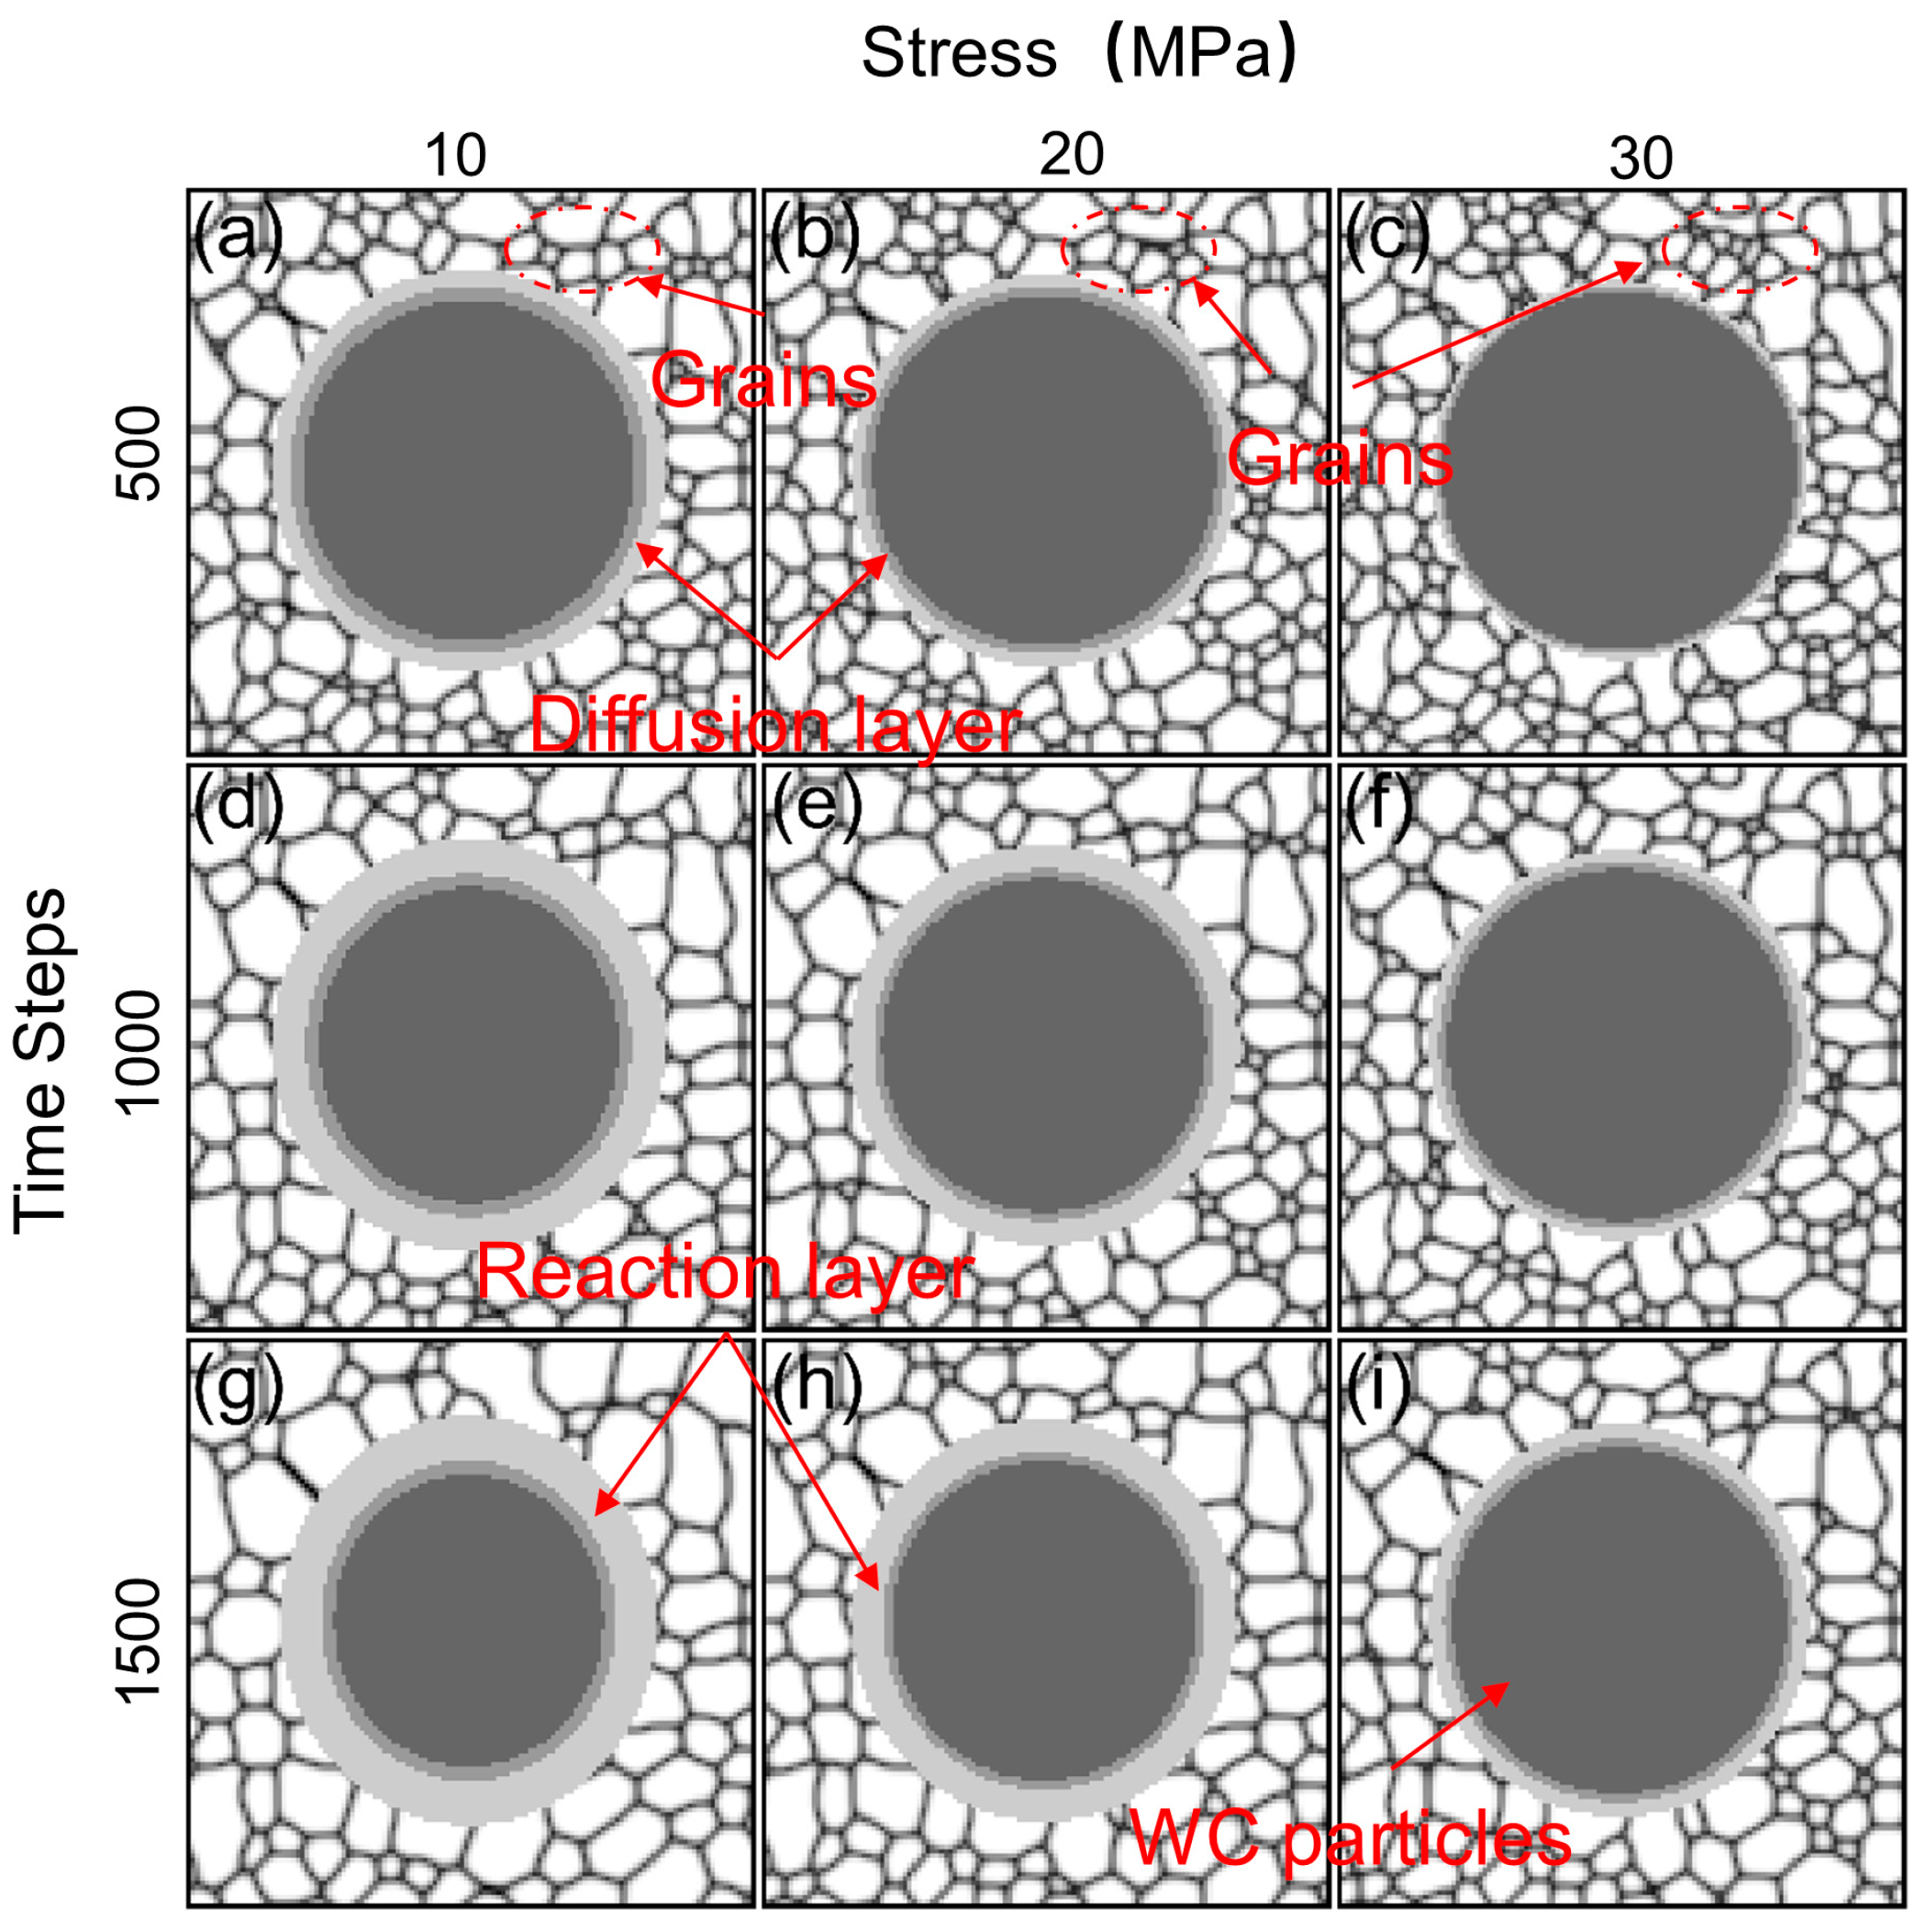
  • When the localized stress is high, the mobility of grain boundaries within the system decreases significantly. Consequently, the dissolution and diffusion of WC particles are markedly hindered, leading to smaller surrounding grain sizes and preserving the shape of WC particles. This stability minimizes the formation of WC singularities and reduces stress concentration, thereby contributing to a more stable microstructural configuration of the material.
  • At lower levels of localized stress, WC particles undergo pronounced dissolution and diffusion, resulting in an expanded reaction layer with the surrounding nickel-based alloys. Additionally, the Ostwald ripening of grains around WC particles becomes more evident, potentially forming new phases and structures that enhance the overall performance of the material.
  • This study demonstrates that optimizing the microstructure during the solidification process can enhance the wear resistance, hardness, and overall performance of coatings. These findings offer a theoretical foundation for advancing material properties through surface modification techniques, which are particularly beneficial for materials exposed to extreme conditions in metallurgical, aerospace, and automotive applications.
Future research should investigate the stresses induced by phase transitions during the solidification of tungsten carbide particles in nickel-based alloys, the influence of temperature, and the impact of the singularity of tungsten carbide particles. Efforts should be directed towards optimizing computational models, broadening the scope of experimental validation, and employing a multiscale simulation approach.

Author Contributions

Conceptualization, M.C. and X.A.; Methodology, M.C. and Z.X.; Software, D.W. and X.A.; Validation, D.W. and C.Z.; Formal analysis, M.C. and C.Z.; Investigation, D.W. and M.C.; Resources, M.C. and Z.X.; Data curation, D.W. and C.Z.; Writing—original draft, D.W.; Writing—review and editing, M.C. and C.Z.; Visualization, D.W. and M.C.; Supervision, X.A. and Z.X.; Project administration, Z.X.; Funding acquisition, Z.X. All authors have read and agreed to the published version of the manuscript.

Funding

This research was supported by National Key Research and Development Program (No. 2021YFB3702003).

Institutional Review Board Statement

Not applicable.

Informed Consent Statement

Not applicable.

Data Availability Statement

The data presented in this study are available on request from the corresponding author.

Conflicts of Interest

The authors declare no conflicts of interest.

References

  1. Fayed, E.M.; Brailovski, V.; Jahazi, M.; Medraj, M. Stability of the Microstructure and Elevated-Temperature Mechanical Properties of Additively Manufactured Inconel 718 Superalloy Subjected to Long-Term in-Service Thermal Cycling. Mater. Sci. Eng. A-Struct. Mater. Prop. Microstruct. Process. 2022, 838, 142790. [Google Scholar] [CrossRef]
  2. Xu, S.; Cai, Q.; Li, G.; Lu, X.; Zhu, X. Effect of Scanning Speed on Microstructure and Properties of Tic/Ni60 Composite Coatings on Ti6al4v Alloy by Laser Cladding. Opt. Laser Technol. 2022, 154, 108309. [Google Scholar] [CrossRef]
  3. Kim, G.; Kim, Y.C.; Cho, J.E.; Yim, C.H.; Yun, D.S.; Lee, T.G.; Park, N.K.; Chung, R.H.; Hong, D.G. Microstructural Evolution, Hardness and Wear Resistance of Wc-Co-Ni Composite Coatings Fabricated by Laser Cladding. Materials 2024, 17, 2116. [Google Scholar] [CrossRef] [PubMed]
  4. Obadele, B.A.; Andrews, A.; Olubambi, P.A.; Mathew, M.T.; Pityana, S. Effect of Zro 2 Addition on the Dry Sliding Wear Behavior of Laser Clad Ti6al4v Alloy. Wear 2015, 328–329, 295–300. [Google Scholar] [CrossRef]
  5. Shen, X.; Peng, H.; Xue, Y.; Wang, B.; Su, G.; Zhu, J.; Li, A. Microstructure and Properties of Wc/Ni-Based Laser-Clad Coatings with Different Wc Content Values. Materials 2022, 15, 6309. [Google Scholar] [CrossRef]
  6. Chen, B.J.; Xu, M.K. Preparation and Performance Analysis of Micro-Nano Composite Coatings Reinforced with Wc Particles. Mater. Res. Express 2024, 11, 026508. [Google Scholar] [CrossRef]
  7. Nomoto, S.; Kusano, M.; Kitano, H.; Watanabe, M. Multi-Phase Field Method for Solidification Microstructure Evolution for a Ni-Based Alloy in Wire Arc Additive Manufacturing. Metals 2022, 12, 1720. [Google Scholar] [CrossRef]
  8. Li, M.; Yang, J.; Han, B.; Song, L.; Li, P.; Dong, W.; Xue, X. Comparative Investigation on Microstructures and Properties of Wc/Cr3c2 Reinforced Laser Cladding Ni-Based Composite Coatings Subjected to Ultrasonic Impact Treatment. Mater. Today Commun. 2023, 34, 105219. [Google Scholar] [CrossRef]
  9. Wang, Y.; Zhou, J.; Zhang, T.; Li, P.; Zhu, H.; Meng, X. Effects of Wc Particles on the Microstructure of In718/Wc Composite Coatings Fabricated by Laser Cladding: A Two-Dimensional Phase-Field Study. Coatings 2023, 13, 432. [Google Scholar] [CrossRef]
  10. Teferra, K.; Rowenhorst, D.J. Optimizing the Cellular Automata Finite Element Model for Additive Manufacturing to Simulate Large Microstructures. Acta Mater. 2021, 213, 116930. [Google Scholar] [CrossRef]
  11. Zinovieva, O.; Zinoviev, A.; Patel, M.N.; Molotnikov, A.; Easton, M.A. Modelling Grain Refinement under Additive Manufacturing Solidification Conditions Using High Performance Cellular Automata. Mater. Des. 2024, 245, 113248. [Google Scholar] [CrossRef]
  12. Ushmaev, D.; Liao, Z.; Notron, A.; Axinte, D. On the Importance of Interface Stability in Cellular Automata Models: Planar and Dendritic Solidification in Laser Melted Ysz. Mater. Des. 2022, 219, 110823. [Google Scholar] [CrossRef]
  13. Tourret, D.; Liu, H.; Llorca, J. Phase-Field Modeling of Microstructure Evolution: Recent Applications, Perspectives and Challenges. Prog. Mater. Sci. 2022, 123, 100810. [Google Scholar] [CrossRef]
  14. Lv, S.J.; Wu, H.H.; Wang, K.Y.; Zhang, C.L.; Zhu, J.M.; Wang, S.Z.; Wu, G.L.; Gao, J.H.; Yang, X.S.; Mao, X.P. Phase Field Simulation of Eutectoid Microstructure During Austenite-Pearlite Phase Transformation. J. Mater. Res. Technol. 2023, 26, 8922–8933. [Google Scholar] [CrossRef]
  15. Wu, Y.; Xiong, J.L.; Luo, Q.; Chen, J.B.; Zeng, R.T.; Wang, S. Estimation of the Critical Value of the Second-Phase Particles in the Microstructure of Az31 Mg Alloy by Phase-Field Methods. Crystals 2022, 12, 1504. [Google Scholar] [CrossRef]
  16. Schwen, D.; Schunert, S.; Jokisaari, A. Evolution of Microstructures in Radiation Fields Using a Coupled Binary-Collision Monte Carlo Phase Field Approach. Comput. Mater. Sci. 2021, 192, 110321. [Google Scholar] [CrossRef]
  17. Zhang, Z.; Ge, P.; Li, J.Y.; Ren, D.X.; Wu, T. Monte Carlo Simulations of Solidification and Solid-State Phase Transformation during Directed Energy Deposition Additive Manufacturing. Prog. Addit. Manuf. 2022, 7, 671–682. [Google Scholar] [CrossRef]
  18. Zheng, Y.; Liu, J.P.; Liang, Y.F.; Wu, P.P. Monte-Carlo-Assisted Phase Field Simulations of Grain Structure Evolution During the Welding Process. Metals 2023, 13, 623. [Google Scholar] [CrossRef]
  19. Browne, D.J.; Hunt, J.D. A Fixed Grid Front-Tracking Model of the Growth of a Columnar Front and an Equiaxed Grain during Solidification of an Alloy. Numer. Heat Transf. Part B Fundam. 2004, 45, 395–419. [Google Scholar] [CrossRef]
  20. Karma, A.; Rappel, W.-J. Quantitative Phase-Field Modeling of Dendritic Growth in Two and Three Dimensions. Phys. Rev. E 1998, 57, 4323–4349. [Google Scholar] [CrossRef]
  21. Chen, L.-Q. Phase-Field Models for Microstructure Evolution. Annu. Rev. Mater. Res. 2002, 32, 113–140. [Google Scholar] [CrossRef]
  22. Moelans, N.; Blanpain, B.; Wollants, P. An Introduction to Phase-Field Modeling of Microstructure Evolution. Calphad 2008, 32, 268–294. [Google Scholar] [CrossRef]
  23. Echebarria, B.; Folch, R.; Karma, A.; Plapp, M. Quantitative Phase-Field Model of Alloy Solidification. Phys. Rev. E Stat. Nonlin. Soft Matter Phys. 2004, 70 Pt 1, 061604. [Google Scholar] [CrossRef] [PubMed]
  24. Tegze, G.; Bansel, G.; Tóth, G.I.; Pusztai, T.; Fan, Z.; Gránásy, L. Advanced Operator Splitting-Based Semi-Implicit Spectral Method to Solve the Binary Phase-Field Crystal Equations with Variable Coefficients. J. Comput. Phys. 2009, 228, 1612–1623. [Google Scholar] [CrossRef]
  25. Wang, Y.B.; Zhang, Y.; Liu, X.T.; Wang, J.X.; Xie, X.Y.; Jiang, J.J.; Liu, J.X.; Liu, H.; Wu, Y.J.; Dong, S.; et al. Simulation of Microstructure Evolution in Mg Alloys by Phase-Field Methods: A Review. Crystals 2022, 12, 1305. [Google Scholar] [CrossRef]
  26. Munoz, E.J.; Attari, V.; Martinez, M.C.; Dickerson, M.B.; Radovic, M.; Arroyave, R. Phase-Field Model of Silicon Carbide Growth During Isothermal Condition. Comput. Mater. Sci. 2024, 242, 113058. [Google Scholar] [CrossRef]
  27. Chen, L.-Q.; Fan, D. Computer Simulation Model for Coupled Grain Growth and Ostwald Ripening—Application to Al2O3-ZrO2 Two-Phase Systems. J. Am. Ceram. Soc. 2005, 79, 1163–1168. [Google Scholar] [CrossRef]
  28. Allen, S.M.; Cahn, J.W. A Microscopic Theory for Antiphase Boundary Motion and Its Application to Antiphase Domain Coarsening. Acta Metall. 1979, 27, 1085–1095. [Google Scholar] [CrossRef]
  29. Cahn, J.W.; Hilliard, J.E. Free Energy of a Nonuniform System. I. Interfacial Free Energy. J. Chem. Phys. 1958, 28, 258–267. [Google Scholar] [CrossRef]
  30. Zheng, S.; Sokoluk, M.; Yao, G.; de Rosa, I.; Li, X. Fe–Ni Invar Alloy Reinforced by Wc Nanoparticles with High Strength and Low Thermal Expansion. SN Appl. Sci. 2019, 1, 172. [Google Scholar] [CrossRef]
  31. Chen, L.Q.; Shen, J. Applications of Semi-Implicit Fourier-Spectral Method to Phase Field Equations. Comput. Phys. Commun. 1998, 108, 147–158. [Google Scholar] [CrossRef]
  32. Gránásy, L.; Börzsönyi, T.; Pusztai, T. Crystal Nucleation and Growth in Binary Phase-Field Theory. J. Cryst. Growth 2002, 237–239, 1813–1817. [Google Scholar] [CrossRef]
  33. Hu, Z.; Wise, S.M.; Wang, C.; Lowengrub, J.S. Stable and Efficient Finite-Difference Nonlinear-Multigrid Schemes for the Phase Field Crystal Equation. J. Comput. Phys. 2009, 228, 5323–5339. [Google Scholar] [CrossRef]
  34. Eiken, J.; Bottger, B.; Steinbach, I. Multiphase-Field Approach for Multicomponent Alloys with Extrapolation Scheme for Numerical Application. Phys. Rev. E Stat. Nonlin Soft Matter Phys. 2006, 73 Pt 2, 066122. [Google Scholar] [CrossRef] [PubMed]
  35. Yoon, S.; Jeong, D.; Lee, C.; Kim, H.; Kim, S.; Lee, H.G.; Kim, J. Fourier-Spectral Method for the Phase-Field Equations. Mathematics 2020, 8, 1385. [Google Scholar] [CrossRef]
  36. Jaatinen, A.; Achim, C.V.; Elder, K.R.; Ala-Nissila, T. Thermodynamics of Bcc Metals in Phase-Field-Crystal Models. Phys. Rev. E Stat. Nonlin Soft Matter Phys. 2009, 80 Pt 1, 031602. [Google Scholar] [CrossRef]
  37. Tegze, G.; Granasy, L.; Toth, G.I.; Podmaniczky, F.; Jaatinen, A.; Ala-Nissila, T.; Pusztai, T. Diffusion-Controlled Anisotropic Growth of Stable and Metastable Crystal Polymorphs in the Phase-Field Crystal Model. Phys. Rev. Lett. 2009, 103, 035702. [Google Scholar] [CrossRef]
  38. Wang, Y.U.; Jin, Y.M.; Cuitiño, A.M.; Khachaturyan, A.G. Nanoscale Phase Field Microelasticity Theory of Dislocations: Model and 3d Simulations. Acta Mater. 2001, 49, 1847–1857. [Google Scholar] [CrossRef]
  39. Choudhury, A.; Nestler, B. Grand-Potential Formulation for Multicomponent Phase Transformations Combined with Thin-Interface Asymptotics of the Double-Obstacle Potential. Phys. Rev. E Stat. Nonlin Soft Matter Phys. 2012, 85 Pt 1, 021602. [Google Scholar] [CrossRef]
  40. Oono, Y.; Puri, S. Computationally Efficient Modeling of Ordering of Quenched Phases. Phys. Rev. Lett. 1987, 58, 836–839. [Google Scholar] [CrossRef]
  41. Xia, M.J.; Gu, D.D.; Ma, C.L.; Zhang, H.M.; Dai, D.H.; Chen, H.Y.; Li, C.P.; Zhou, Z.J.; Chen, G.F.; Kelbassa, I. Fragmentation and Refinement Behavior and Underlying Thermodynamic Mechanism of Wc Reinforcement During Selective Laser Melting of Ni-Based Composites. J. Alloys Compd. 2019, 777, 693–702. [Google Scholar] [CrossRef]
  42. Fan, D.; Chen, L.Q. Computer Simulation of Grain Growth Using a Continuum Field Model. Acta Mater. 1997, 45, 611–622. [Google Scholar] [CrossRef]
  43. Olyslager, F. Overview of the Singular Behavior of Electromagnetic Fields at Edges and Tips in Bi-Isotropic and Special Bianisotropic Media. Radio Sci. 1995, 30, 1349–1354. [Google Scholar] [CrossRef]
  44. Valagiannopoulos, C.A. On Smoothening the Singular Field Developed in the Vicinity of Metallic Edges. Int. J. Appl. Electromagn. Mech. 2009, 31, 67–77. [Google Scholar] [CrossRef]
Figure 1. ProCAST simulation flowchart.
Metals 14 01022 g001
Figure 2. Sample picture of plasma cladding.
Metals 14 01022 g002
Figure 3. Mold structure of 3D model: (a) upper mold structure diagram, (b) lower mold structure diagram, and (c) overall mold structure diagram.
Metals 14 01022 g003
Figure 4. Mesh partitioning: (a) 2D mesh partitioning and (b) 3D mesh partitioning.
Metals 14 01022 g004
Figure 5. Schematic diagram of selected points of solidification process.
Metals 14 01022 g005
Figure 6. Temperature, equivalent force, and solid-phase rate graphs: (a) temperature change graph, (b) equivalent force change graph, and (c) solid-phase rate change graph.
Metals 14 01022 g006
Figure 7. Cross-sectional images of the cladding layer: (a) optical micrograph showing the cladding layer, transition layer, and subsurface regions and (b) SEM micrograph highlighting the distribution of WC particles across the upper and middle surfaces.
Metals 14 01022 g007
Figure 8. Evolution of WC-Ni phase field under 2D conditions: (ae) extent of dissolution and diffusion of WC particles under varying stresses and evolution of surrounding grains.
Metals 14 01022 g008
Figure 9. X-ray diffraction (XRD) pattern of cladding layer.
Metals 14 01022 g009
Figure 10. The evolution of individual WC particles under different stress conditions: (a,d,g) WC particles and nickel-based alloy grain morphology at 10 MPa, (b,e,h) WC particles and nickel-based alloy grain morphology at 20 MPa, and (c,f,i) WC particles and nickel-based alloy grain morphology at 30 MPa.
Metals 14 01022 g010
Figure 11. Morphological organization of WC particles: (a) morphology of WC particles on the upper surface, (b) morphology of WC particles on the middle surface, and (c) morphology of WC particles on the subsurface.
Metals 14 01022 g011
Table 1. Relevant parameters employed in the simulation process.
SymbolDescriptionValueRef.
Δ x Space step2.0[27]
Δ t Time step0.1
k i α Gradient energy coefficient of phase α 2.5
k i β Gradient energy coefficient of phase β 2.0
k c Gradient energy coefficient of concentration0.5
L 0 Benchmark migration rate3.0
A -2.0
B -9.88
D α -1.52
γ α -1.23
δ -1.0
μ Stress sensitivity coefficient0.06-
kPhysical constant1.025
ε 0 Lattice expansion coefficient2.6 × 10−6[30]
ζ Thermal expansion coefficient9.6 × 10−6[41]
Table 2. Chemical composition of Ni40A and Ni40A-45% WC alloys (wt.%).
ElementCCrBSiFeCuWNi
Ni40A0.0711.091.233.463.013.66-Bal
Ni40A-45 wt.% WC1.830.11.241.761.44-43.2Bal
Disclaimer/Publisher’s Note: The statements, opinions and data contained in all publications are solely those of the individual author(s) and contributor(s) and not of MDPI and/or the editor(s). MDPI and/or the editor(s) disclaim responsibility for any injury to people or property resulting from any ideas, methods, instructions or products referred to in the content.

