Article

Study on the Influence of Thickness on the Pre-Bending Process of the JCOE Forming Plate Edge of Nickel-Based Alloy N08810

1
School of Materials Science and Engineering, Taiyuan University of Science and Technology, Taiyuan 030024, China
2
Coordinative Innovation Center of Taiyuan Heavy Machinery Equipment, Taiyuan University of Science and Technology, Taiyuan 030024, China
*
Author to whom correspondence should be addressed.
Metals 2024, 14(9), 1032; https://doi.org/10.3390/met14091032
Submission received: 9 August 2024 / Revised: 28 August 2024 / Accepted: 5 September 2024 / Published: 11 September 2024

Abstract

:
JCOE is a progressively advanced forming process that encompasses J-forming, C-forming, O-forming, and expansion technology. This methodology constitutes an efficacious means of producing high-strength pipes. In recent years, this process has been utilized in the manufacturing of small-diameter, thick-walled welded pipes using nickel-based alloy N08810 plates. This study establishes a mathematical model for key parameters in the pre-bending process, rooted in JCOE forming and plastic bending theory, and introduces a process optimization approach. Initially, by refining the mold configuration and executing simulation analyses, we comprehensively delineate the stress–strain distribution and metal flow dynamics during pre-bending. Furthermore, we unravel the influence of varying plate thicknesses on both the pre-bending force and springback bending angle. Ultimately, the veracity of our theoretical model and simulation protocol is substantiated through rigorous experimentation. The findings indicate that the optimized mold configuration yields superior pre-bending forces and springback bending angles compared to conventional methods, thereby furnishing a solid theoretical foundation for industrial applications.

1. Introduction

With the growing demand for high-strength, corrosion-resistant pipelines in areas such as deep-sea exploration and nuclear power, the nickel-based alloy N08810 (Incoloy 800H) is often used as a raw material in the preparation of transportation pipelines due to its excellent corrosion resistance and high yield strength [1,2]. In recent years, the utilization of straight, seam-welded pipe technology to produce nickel-based alloy, small-diameter, thick-wall pipes that adhere to stringent performance criteria has emerged as the prevalent approach [3,4,5]. Currently, JCOE serves as the primary forming method for straight, seam-welded pipes, which is a multi-stage progressive bending process. This in-volves initially pre-bending the sheet material’s edge, subsequently pressing it into a “J” shape, followed by a “C” shape, and ultimately an “O” shape, before welding and expanding the diameter [6]. Notably, the rationality of the pre-bending treatment is paramount in influencing the efficacy of the JCOE forming process. Improper pre-bending mold configurations and suboptimal parameter settings can give rise to flat sections along the plate’s edge, manifesting as a “peach” or “beak” shape in the final tube, as depicted in Figure 1. Such defects undermine the pipe’s operational performance [7,8]. Thus, a thorough investigation into the pre-bending process is crucial for regulating the JCOE forming outcome and enhancing the mechanical properties of the finished pipe [9].
The finite element simulation and experimental comparative analysis significantly enhance our comprehension of the pre-bending forming process, thereby facilitating the optimization of actual production procedures and enhancing the service performance of the final pipe product. Antoniou et al. [10] conducted a comprehensive finite element simulation of the entire JCOE forming process, elucidating the deformation patterns at each stage and emphasizing the impact of the J→C→O→E transitional stages on the pipe’s stress state. Chandel et al. [11] underscored the pivotal role of mold hardness and curvature in influencing springback during JCOE forming, which directly correlates with pipe quality. Zhang et al. [12] established a pre-bending model, revealing the rule governing the effect of the pre-bending side length on the bending angle post-rebound. Lv et al. [13], through numerical simulation, explored the influence of the pre-bending radius on forming quality. Borges et al. [14] introduced an elastic–viscoplastic analysis method, rooted in the numerical model of steel plate bending based on the Reissner theory. Gavriilidis et al. [15] assessed the peripheral compressive strength of JCOE-processed pipes and proposed a strategy to bolster their radial compressive strength. Gao et al. [16], via finite element simulation, predicted the post-JCOE pipe geometry, noting that springback during load removal significantly impacts dimensional accuracy. They also confirmed that adjusting the mold’s phase difference can mitigate springback’s negative influence on accuracy. In conclusion, springback significantly impacts the JCOE forming process. By examining its relationship with mold hardness, curvature, and layout, we can effectively manage pipe forming quality. This paper establishes a theoretical calculation model for key process parameters tailored to varying thicknesses of nickel-based alloy N08810 plates by modifying mold layouts. We further validate this model through numerical simulation and experimental verification, observing the effects of thickness on edge stress distribution, metal flow, pre-bending force, and springback bending angle during pre-bending. This work holds significant practical implications for guiding actual production processes.

2. Materials and Methods: Mold Optimization and Process Parameter Modeling

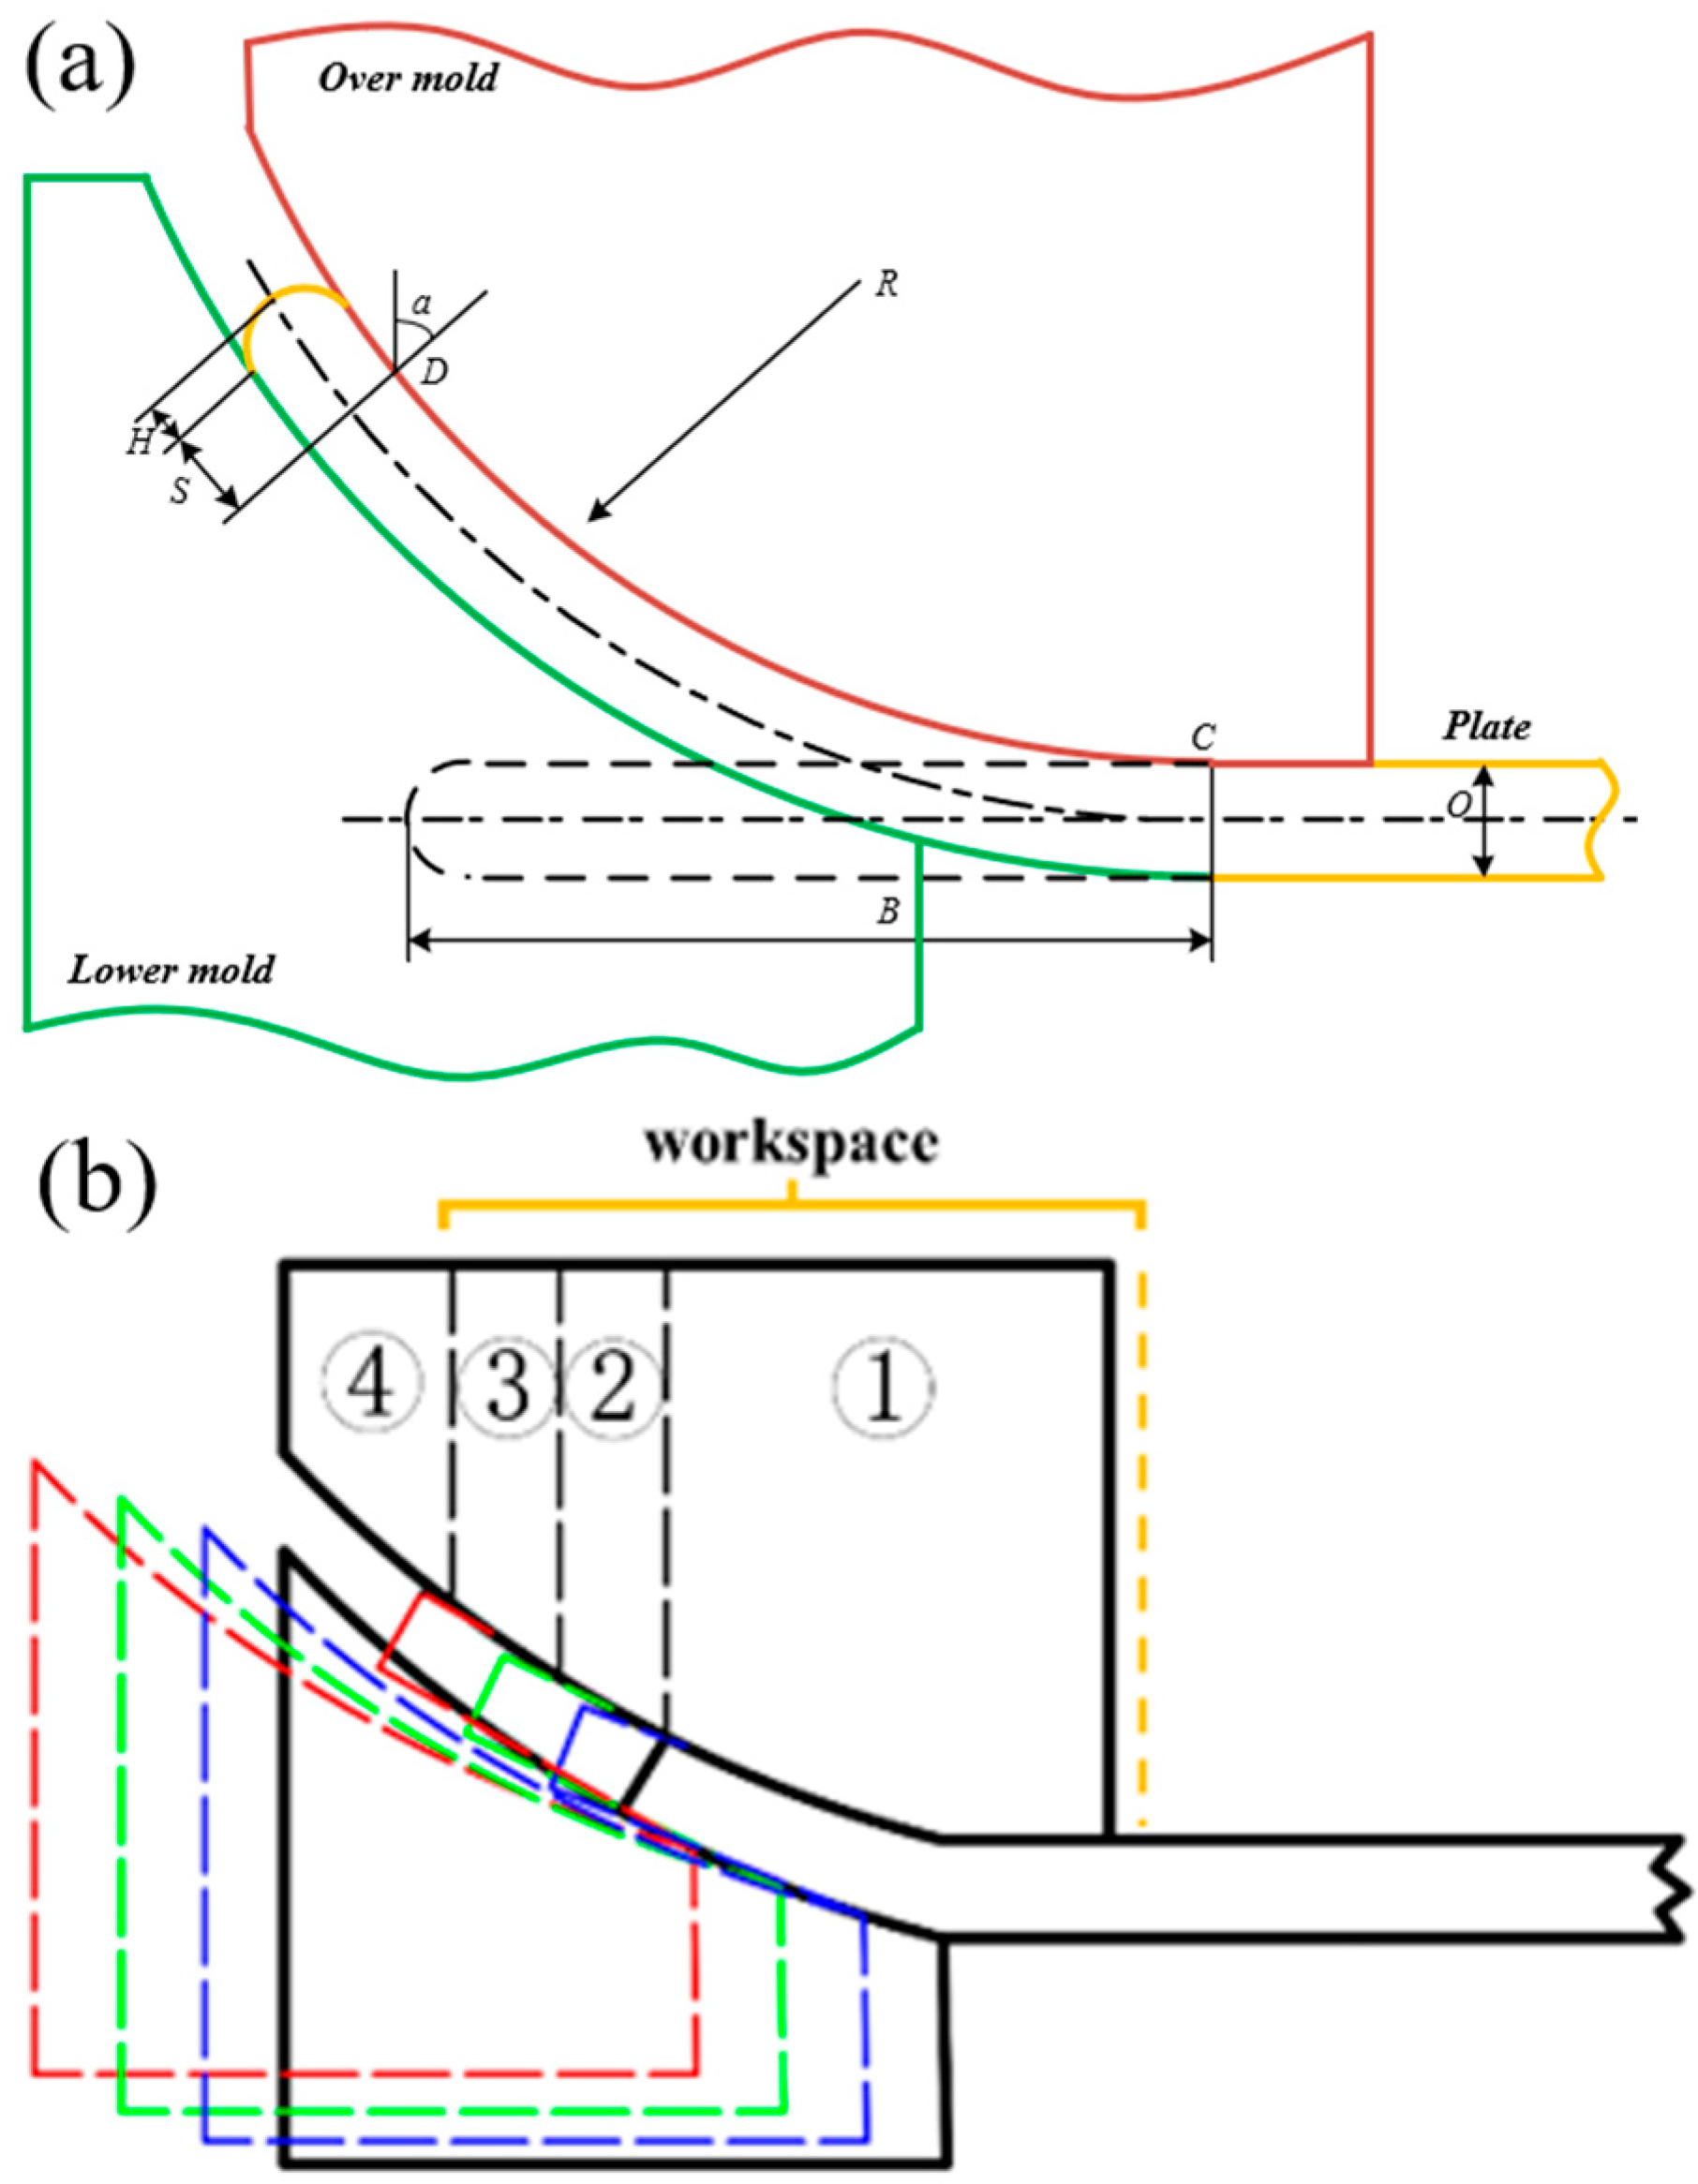
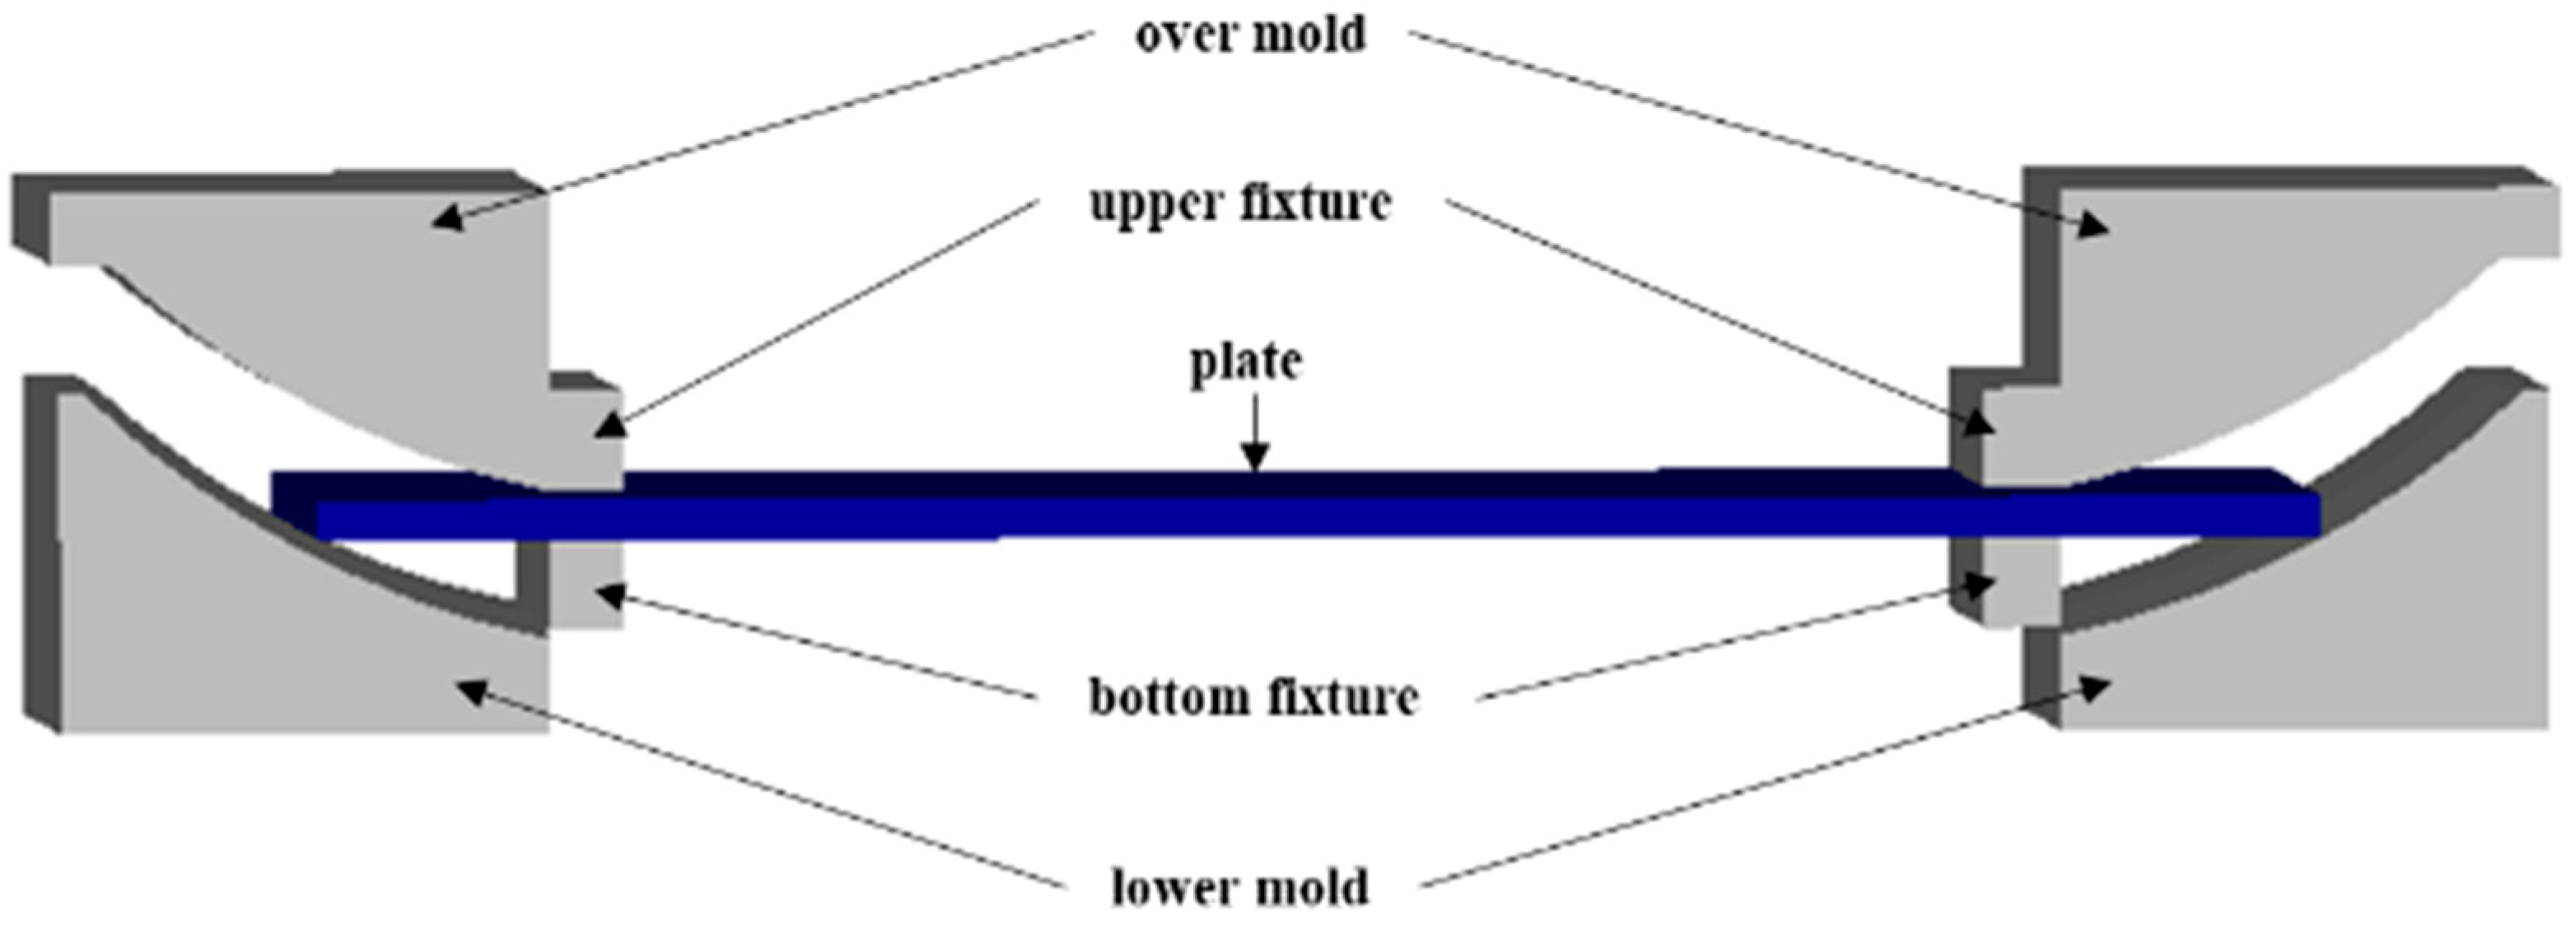
2.1. Optimization of the Pre-Bending Mold

Currently, the preponderance of research endeavors concentrates on examining the traditional mold layouts and delineating the effects that diverse mold structures exert on the pre-bending formation process. However, scant attention has been devoted to investigating the influence of various mold layout forms on the pre-bending procedure. In Figure 2, the conventional pre-bending mold layout forms are presented. To enhance the quality of pre-bending pipes and minimize production costs, this paper introduces a design methodology that accommodates the layout of the pre-bending mold with varying plate thicknesses, drawing upon the optimized structural and material attributes of the involute pre-bending mold.
By meticulously controlling the pre-bending force, we can precisely align the mold stroke and loading method, ensuring uniform compression of the plate between the upper and lower molds throughout the forming process. This enables the achievement of optimal pre-bending widths and springback bending angles [17]. Given the variation in pre-bending rates necessitated by different pipe thicknesses, to maximize mold utilization the relative positioning between the upper and lower molds can be adjusted, altering the phase angle formed. This adjustment modulates the contact area between the molds, enabling the preparation of pipes with diverse thicknesses within a single mold, thereby achieving a versatile, multi-purpose effect. According to the pre-bending rate required by different plate thicknesses, the phase difference diagram between the molds is obtained as shown in Figure 2b. The diagram comprises four distinct zones, each corresponding to the specific phase difference necessary for a certain range of plate thicknesses. For plate thicknesses within 20 mm, the phase difference indicated in zone 1 is utilized. As the thickness increases from 20 mm to 30 mm, the phase difference shown in zone 2 becomes applicable. Within the range of 30 mm to 40 mm, the phase difference featured in zone 3 is adopted, while for thicknesses exceeding 40 mm, the phase difference presented in zone 4 is employed.

2.2. Optimization of Key Parameters of Pre-Bending Theory

By adhering to traditional process parameters for pre-bending the plate’s edge, the quality of the bending operation becomes inconsistent. Consequently, there arises a need to theoretically delve into the pre-bending force and springback bending angle of the plate’s edge, establish a precise mathematical model tailored for springback compensation, and subsequently derive the technical parameters for the pre-bending process [18,19].

2.2.1. Springback Bending Angle

According to the theory of material mechanics, the material will undergo elastic–plastic bending deformation under the action of external moments, and the springback phenomenon will occur after unloading [20], so that the bending radius of the material changes, and its springback curvature changes as follows:
1 ρ 1 = M 1 E I
where ρ 1 is the reciprocal of the springback curvature, E is the modulus of elasticity, and I is the cross-sectional inertia product along the thickness direction,
I = b t 3 12
where b is the steel plate step length, and t is the plate thickness.
The bending moment M1 is the integral along each part of the thickness of the blank, and the required applied bending moment is equal to the sum of the bending moments produced by the yield strength, i.e.,
M 1 = b σ S t 2 4
where σ S is the material yield stress.
Then, the final curvature of the steel plate is the difference between the curvature during loading and the curvature after unloading, i.e.,
1 ρ = 1 ρ 0 1 ρ 1
where ρ is the final radius of the curvature of the steel plate, i.e., the inner wall radius of the steel pipe.
From the nature of the pre-bending roll angle we obtain the following
α = L t ρ 1
Combining the above equation yields the final post springback bending angle:
α = 3 σ S L t 3 ρ σ S + E t

2.2.2. Pre-Bending Force

The pre-bending force is influenced by a multitude of factors, including the pre-bending length of the plate’s edge and the thickness of the plate itself. The determination of the upper mold’s working width is contingent upon the pre-bending length of the plate’s edge, which in turn exerts an impact on the springback bending angle α at the bending end of the upper mold. In the deformation process, the length of the neutral layer is unchanged. The pre-panel edge bending length L is the arc length corresponding to the neutral layer, and, from Figure 2, can be seen as
L = C D ^ + t + H
where C D ^ is the arc length of the upper mold in the corresponding neutral layer, and H is the welding bevel width.
According to the mechanics of materials and pre-bending forming theory, it can be concluded that the elastic–plastic bending moment applied to the pre-bending section of the slab edge is as follows:
M = 2 σ S 3 ρ 2 3 E 2 + 2 n ρ L 2 + σ S ρ E
where n is the strength factor.
The force on the plate material under the plate edge pre-bending mold is:
P = K M cos α t
where α is the pre-bend roll angle and K is the friction loss coefficient. This value is inherently linked to the frequency of mold utilization, where, in the context of theoretical calculations aimed at identifying the optimal mold condition, the assigned value is set to 1.
Combined with the above equation, the pre-bending force required for plate edge pre-bending is as follows:
P = 2 K σ S 3 ρ 2 3 E 2 + n K L ρ + 2 n K σ S ρ E cos α t

3. Experimental Methods and Numerical Simulations

3.1. Test Materials and Methods

The material used in the test of this paper is the nickel-based alloy NO8810 (Incoloy 800 H), whose main composition is 32Ni-21Cr-Ti, Al. Due to its high strength and properties such as oxidation, carburization, and corrosion resistance, it is widely used. The mechanical property parameters of the nickel-based alloy NO8810 are shown in Table 1, and the chemical composition parameters are shown in Table 2 [21].
In the process of sheet bending deformation, when the bending stress reaches the yield limit of the material, the sheet bending deformation is purely elastic deformation, and the deformation follows the generalized Hooke’s law at this stage, and the stress–strain curve shows a linear relationship. When the bending stress exceeds the yield limit stress, the sheet is about to enter the plastic deformation stage in which different elastic–plastic material properties show different hardening laws [22]. In this paper, the theoretical calculation adopts the bilinear hardening material model, and the mathematical expression is as follows:
σ = E ε , ε ε s
where   ε s is the elastic ultimate strain.

3.2. Numerical Simulation

For the intricacies inherent in the JCOE process for preparing straight, seam-welded pipes and the constraints posed by finite element simulation, the model undergoes simplification [23,24,25,26]. Employing three-dimensional modeling software, we establish the mold, fixture, and plate, aligning them symmetrically within the three-dimensional model. The schematic representation of the plate edge pre-bending process, depicted in Figure 3, illustrates this setup. In conducting simulation analysis utilizing DEFORM 3D 10.2, the mold and fixture are modeled as rigid bodies, devoid of plastic deformation, whereas the plate is designated as plastic, with its material properties assigned to nickel-based alloy N08810. During mesh generation, we opt for tetrahedral meshing, configuring the absolute mesh settings to maintain a 2:1 ratio between the maximum and minimum mesh sizes. Based on the varying plate thicknesses, we establish a mesh element count of 100,000. Subsequent to model simplification, the pre-bending process is envisioned as a uniform upward translation of the lower mold, with a velocity set at 100 mm/s. For various plate thicknesses, the mold feed is set to 90 mm, with each incremental feed being 5 mm. Additionally, the interface between the mold and the plate is explicitly designated as a penalty contact, with the friction mechanism specified as shear friction, and the friction coefficient assigned a value of 0.1. The fixture serves to restrain the plate’s free movement, effectively functioning as an integral part of the plate, as defined in previous studies [27,28,29,30,31].

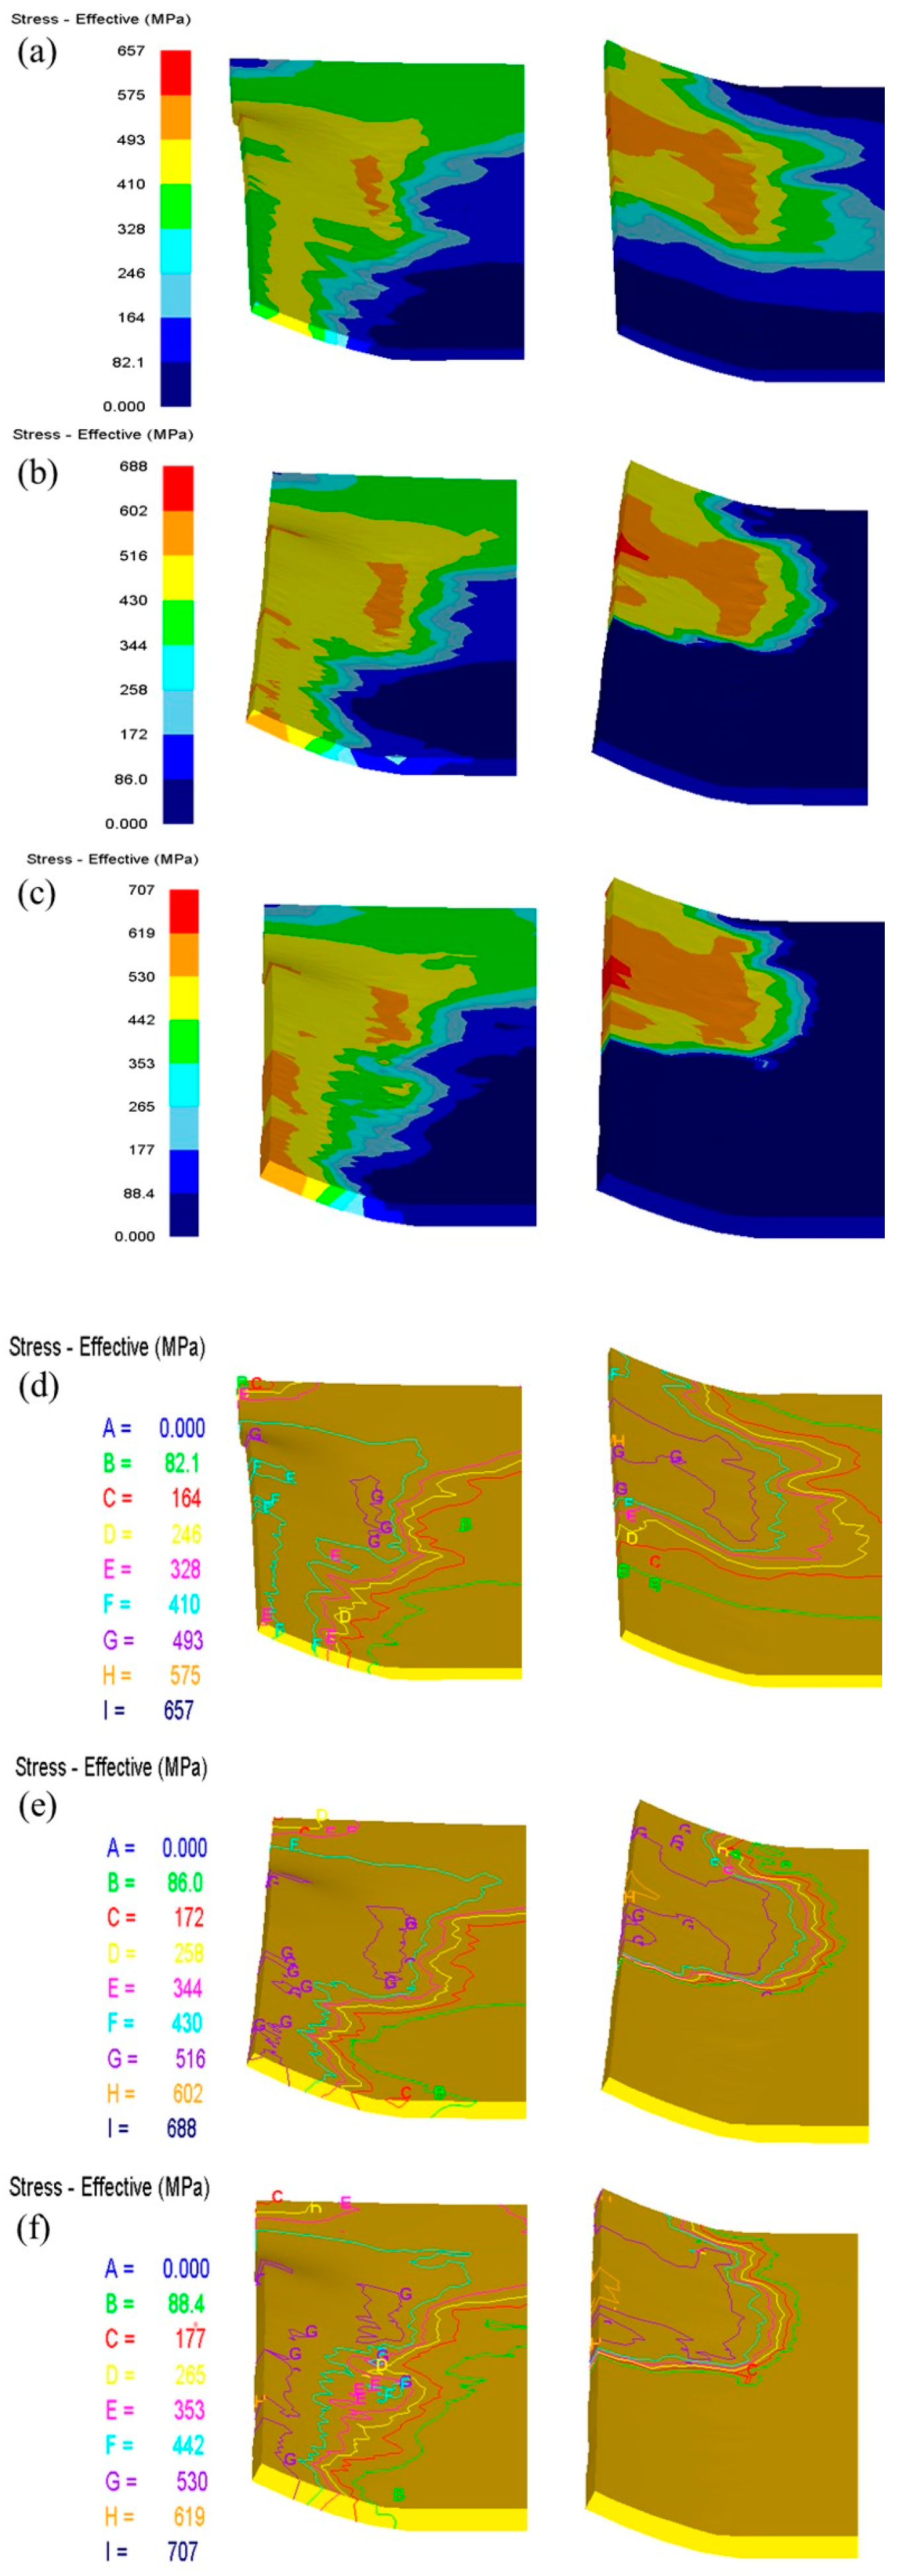
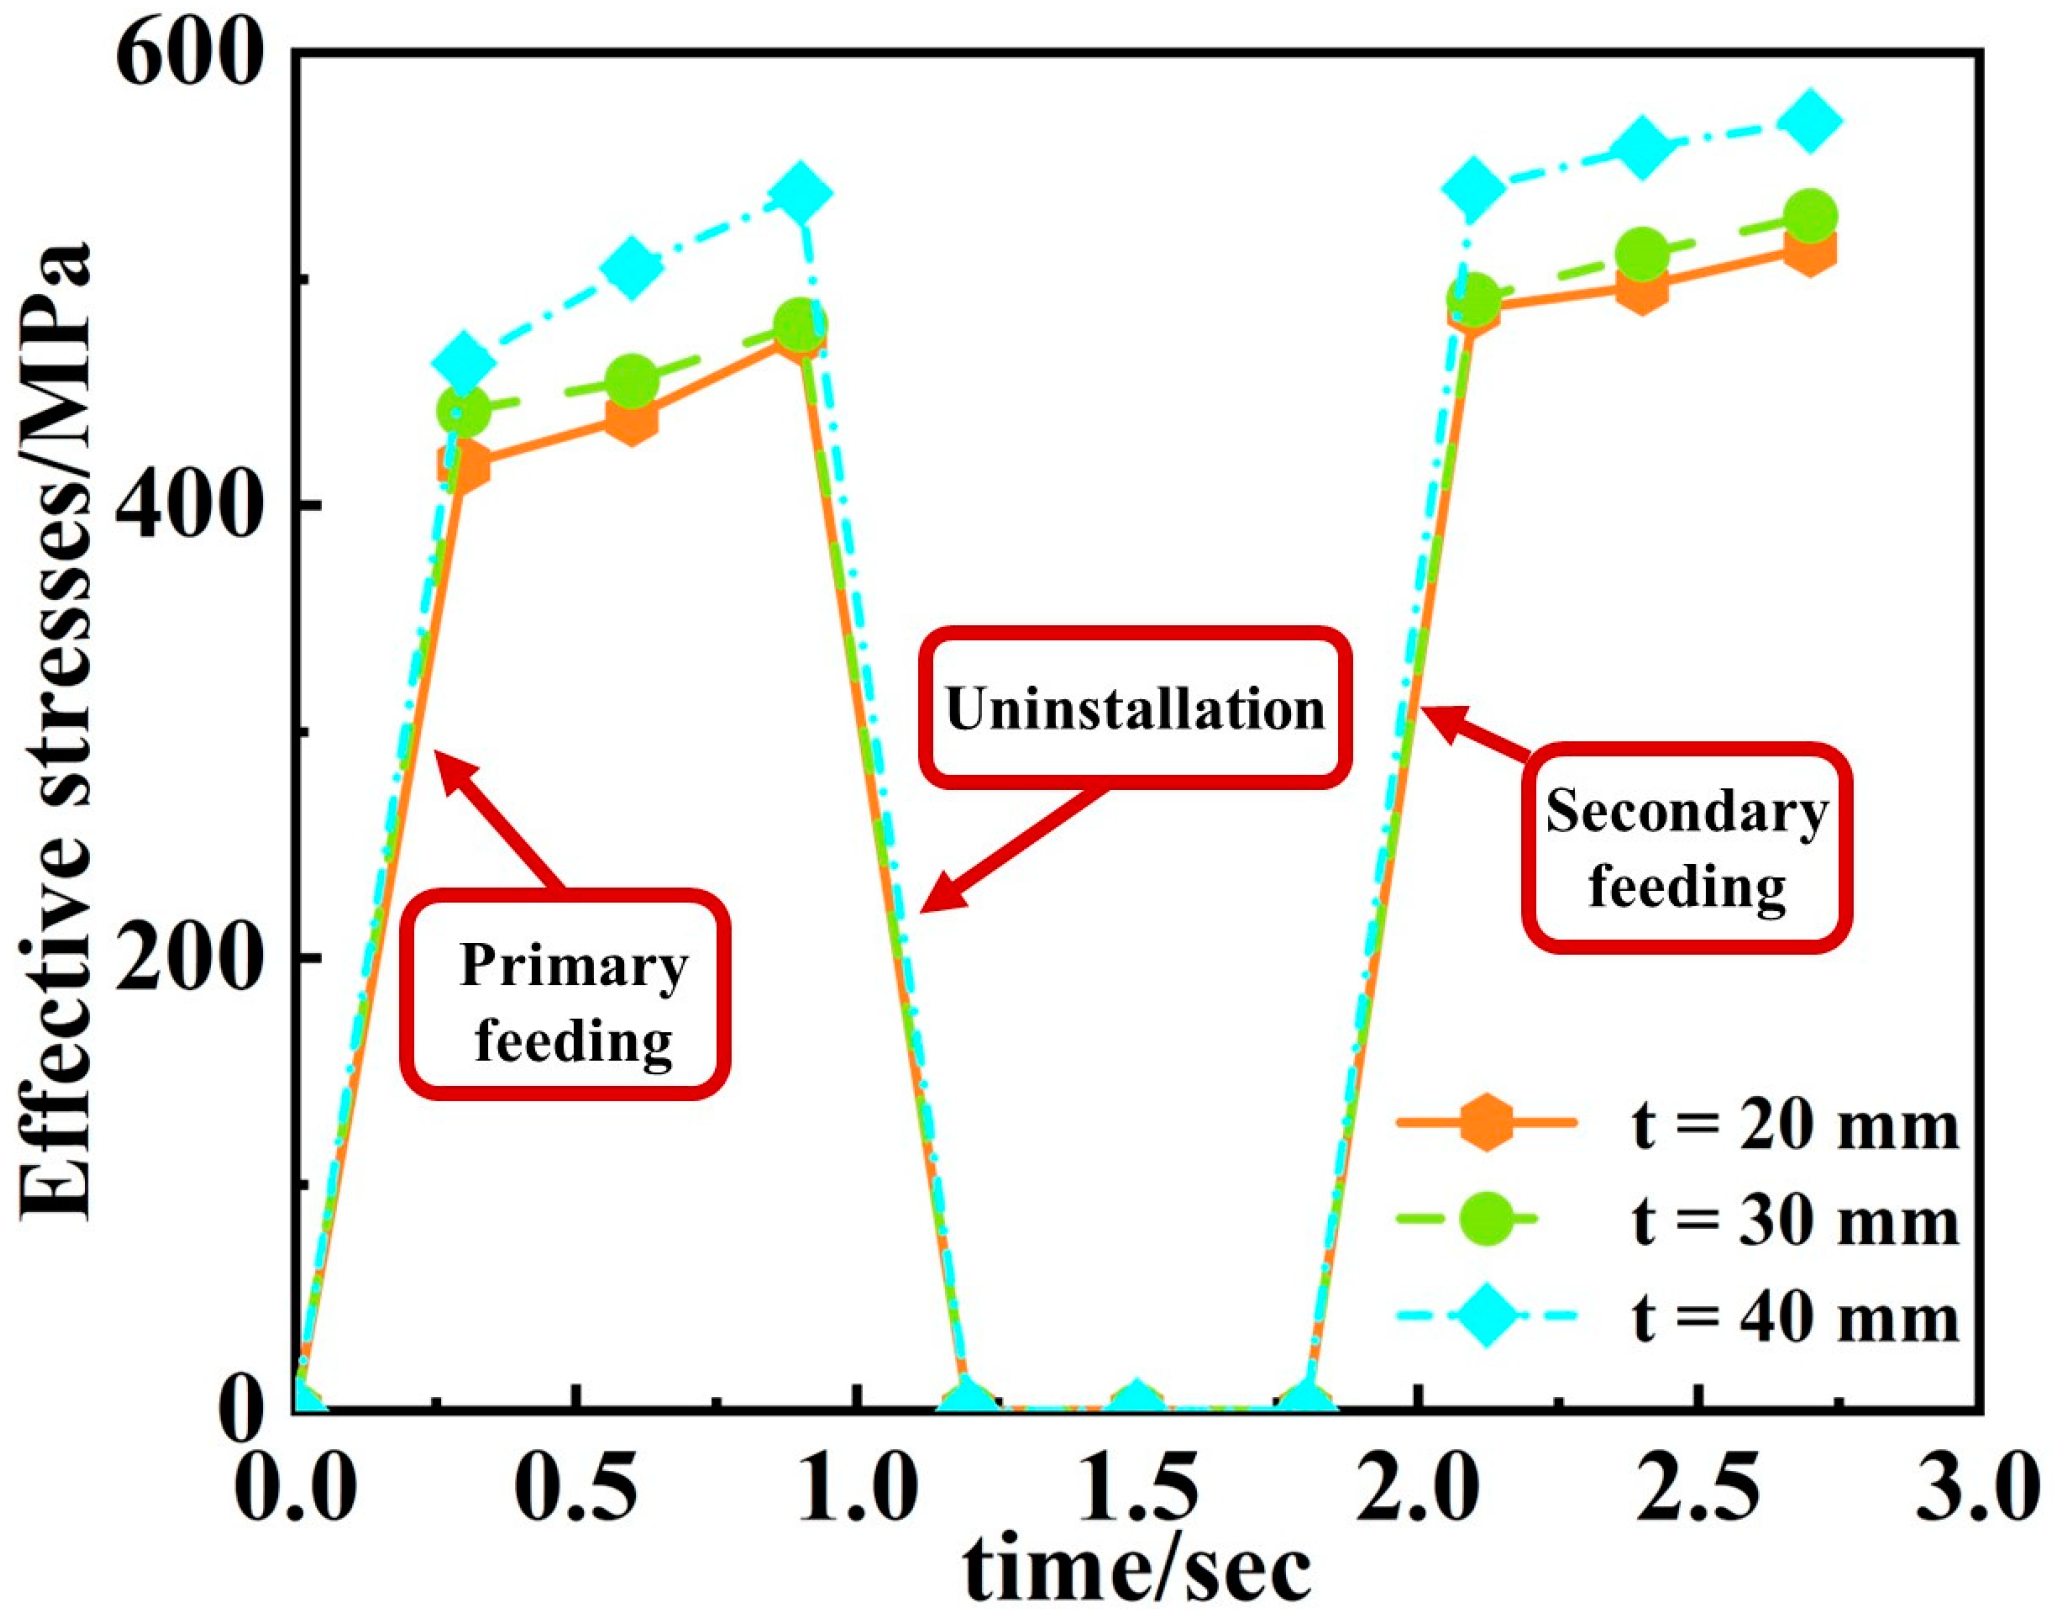
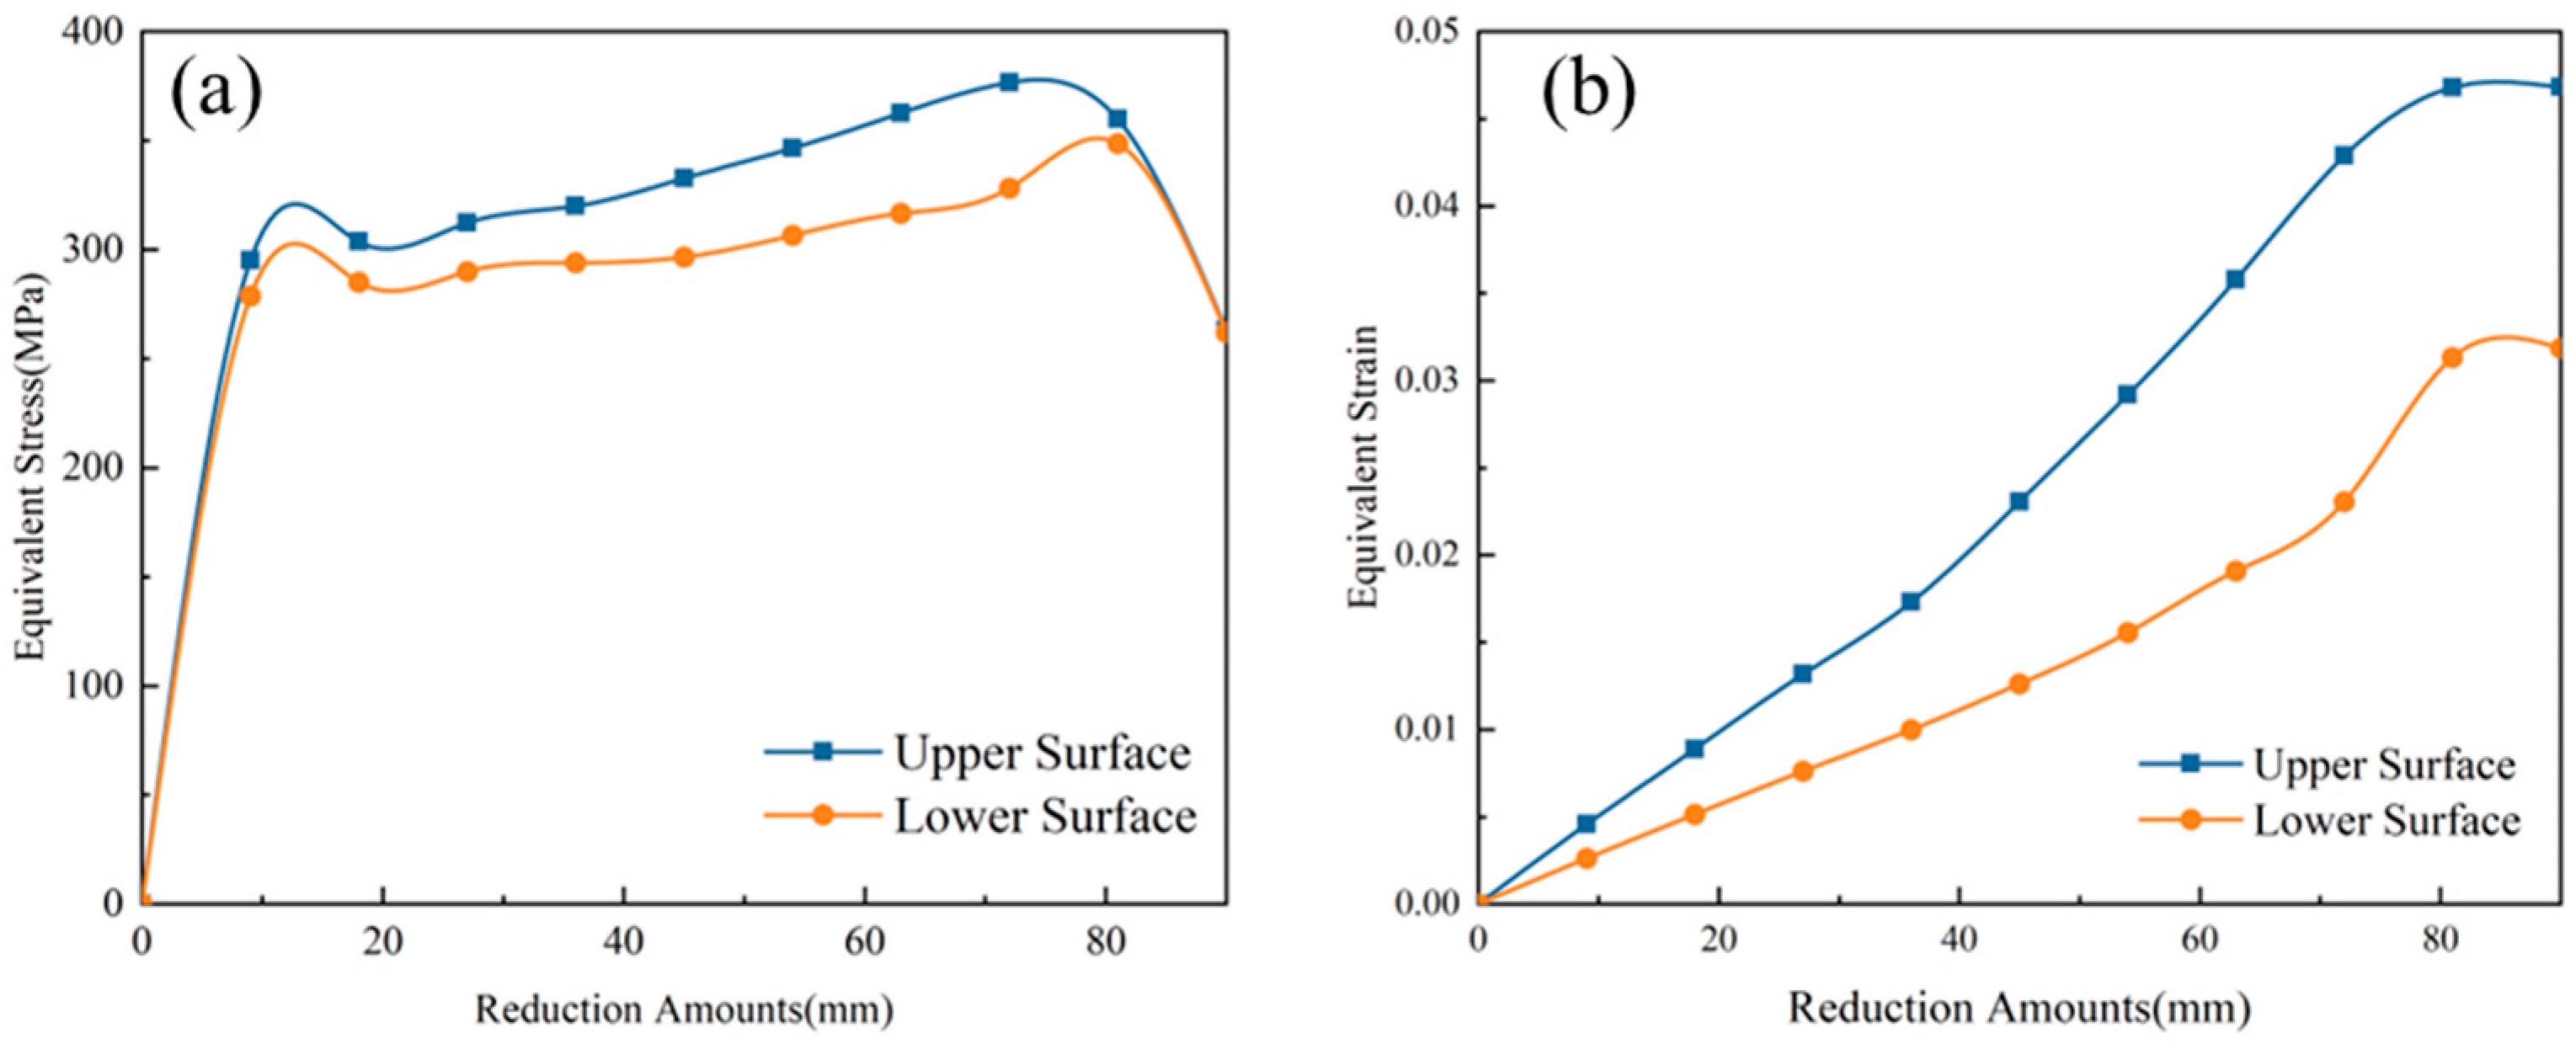
3.2.1. Stress Distribution at Plate Edge

Figure 4 illustrates the simulated distribution of equivalent stresses in the primary and secondary feeding stages, across varying sheet thicknesses at a maximum undercut (marking the end of the loading phase). Throughout the loading process, the pre-bending lower mold ascends incrementally, initiating bending deformation at the plate’s edge, which subsequently propagates and accumulates stress along the perimeter. This study examines the impact of varying plate thicknesses on the pre-bending process by analyzing the stress nephograms obtained during the two feeding operations.
When t = 20 mm, from the stress map in Figure 4a,d, it can be seen that when the first feeding is about to end, the plate in the bending part of the stress distribution compared to other parts is more obvious, along with the stress with the increase in the degree of bending to the edge of the plate extension. It is worth noting that, on the straight side of the arc edge of the plate, the transformation of the stressed part is significantly greater than other parts. A second feed, after the end of the pre-bending completed part of the stress is very small, is performed. With the second feed, downward pressure continues to increase. The plate edge stress distribution and the distribution of the first feed are basically the same. The first feed involves the straight side of the arc edge of the plate edge, and the transformation of the part of the second feed bends at the arc edge, but the sudden change of the stress here is larger. The maximum equivalent stress generated by the plate edge in this process is 657 MPa.
When t = 30 mm, it can be seen from Figure 4b,e that the stress distribution of the first feeding and the second feeding is more concentrated, and the overall stress distribution is generally similar compared with that of t = 20 mm, but the distribution of the maximum equivalent force is more intensive and obvious. The maximum equivalent stress generated at the edge of the plate in this process is 688 MPa.
When t = 40 mm, it can be seen from Figure 4c,f that from the first feeding to the second feeding, the stress distribution in this region is more obvious at the straight-edge– arc-edge transition part of the plate edge to the bending part of the plate edge in the same direction. Notably, the stress after bending is more prominent in the straight-edge–arc-edge transition part of the plate edge, while the stress distribution in the other parts of the plate edge is basically similar to that in the first two simulations with different plate thicknesses. The maximum equivalent stress generated by the plate edge in this process is 707 MPa.
In order to more clearly analyze the trend of change, a point from the pre-bending plate edge was selected as the plate edge equivalent force research object for different plate thickness of the plate edge at a certain point of the equivalent force change rule diagram (Figure 5). As can be seen from the figure, when t = 20 mm, the maximum equivalent force obtained from the first feed is 479 MPa. Unloading after the second feed, the equivalent force is 488 MPa. The equivalent force after the completion of the bending deformation reaches 514 MPa. When t = 30 mm, the maximum equivalent force obtained from the first feeding is 480 MPa, the equivalent force after unloading for the second feeding is 491 MPa, and the equivalent force after bending deformation is completed reaches 528 MPa. When t = 40 mm, the maximum equivalent force is 538 MPa after the first feeding, 542 MPa at the beginning of the second feeding after unloading, and 570 MPa after the bending deformation. This shows that the equivalent force at the edge of the plate increases with the bending deformation process, and the increase in the thickness of the plate material at different deformation stages also makes the equivalent force at the edge of the plate increase. Compared with the values of equivalent force in Figure 4, the values of equivalent force at this point are consistent with the trend of change.
Based on the above analysis, it is evident that the stress distribution at the plate’s edge exhibits non-uniformity, stemming from the involute structure of the mold–plate contact curve, which necessitates a nonlinear contact consideration. Additionally, the varying curvature radii across the mold’s components contribute to this phenomenon. Upon reaching the peak downward pressure, the edge-bending, deformation-loading phase concludes. Notably, as the plate thickness augments, the peak equivalent force observed in edge pre-bending simulations escalates accordingly. Furthermore, an analysis of simulations with varying plate thicknesses reveals a decline in the equivalent force distribution associated with the internal weakening of the plate’s edge. It is noteworthy that during the pre-bending process, both the central and peripheral regions of the plate undergo deformation to varying degrees, manifesting as a stress distribution across the entire plate.

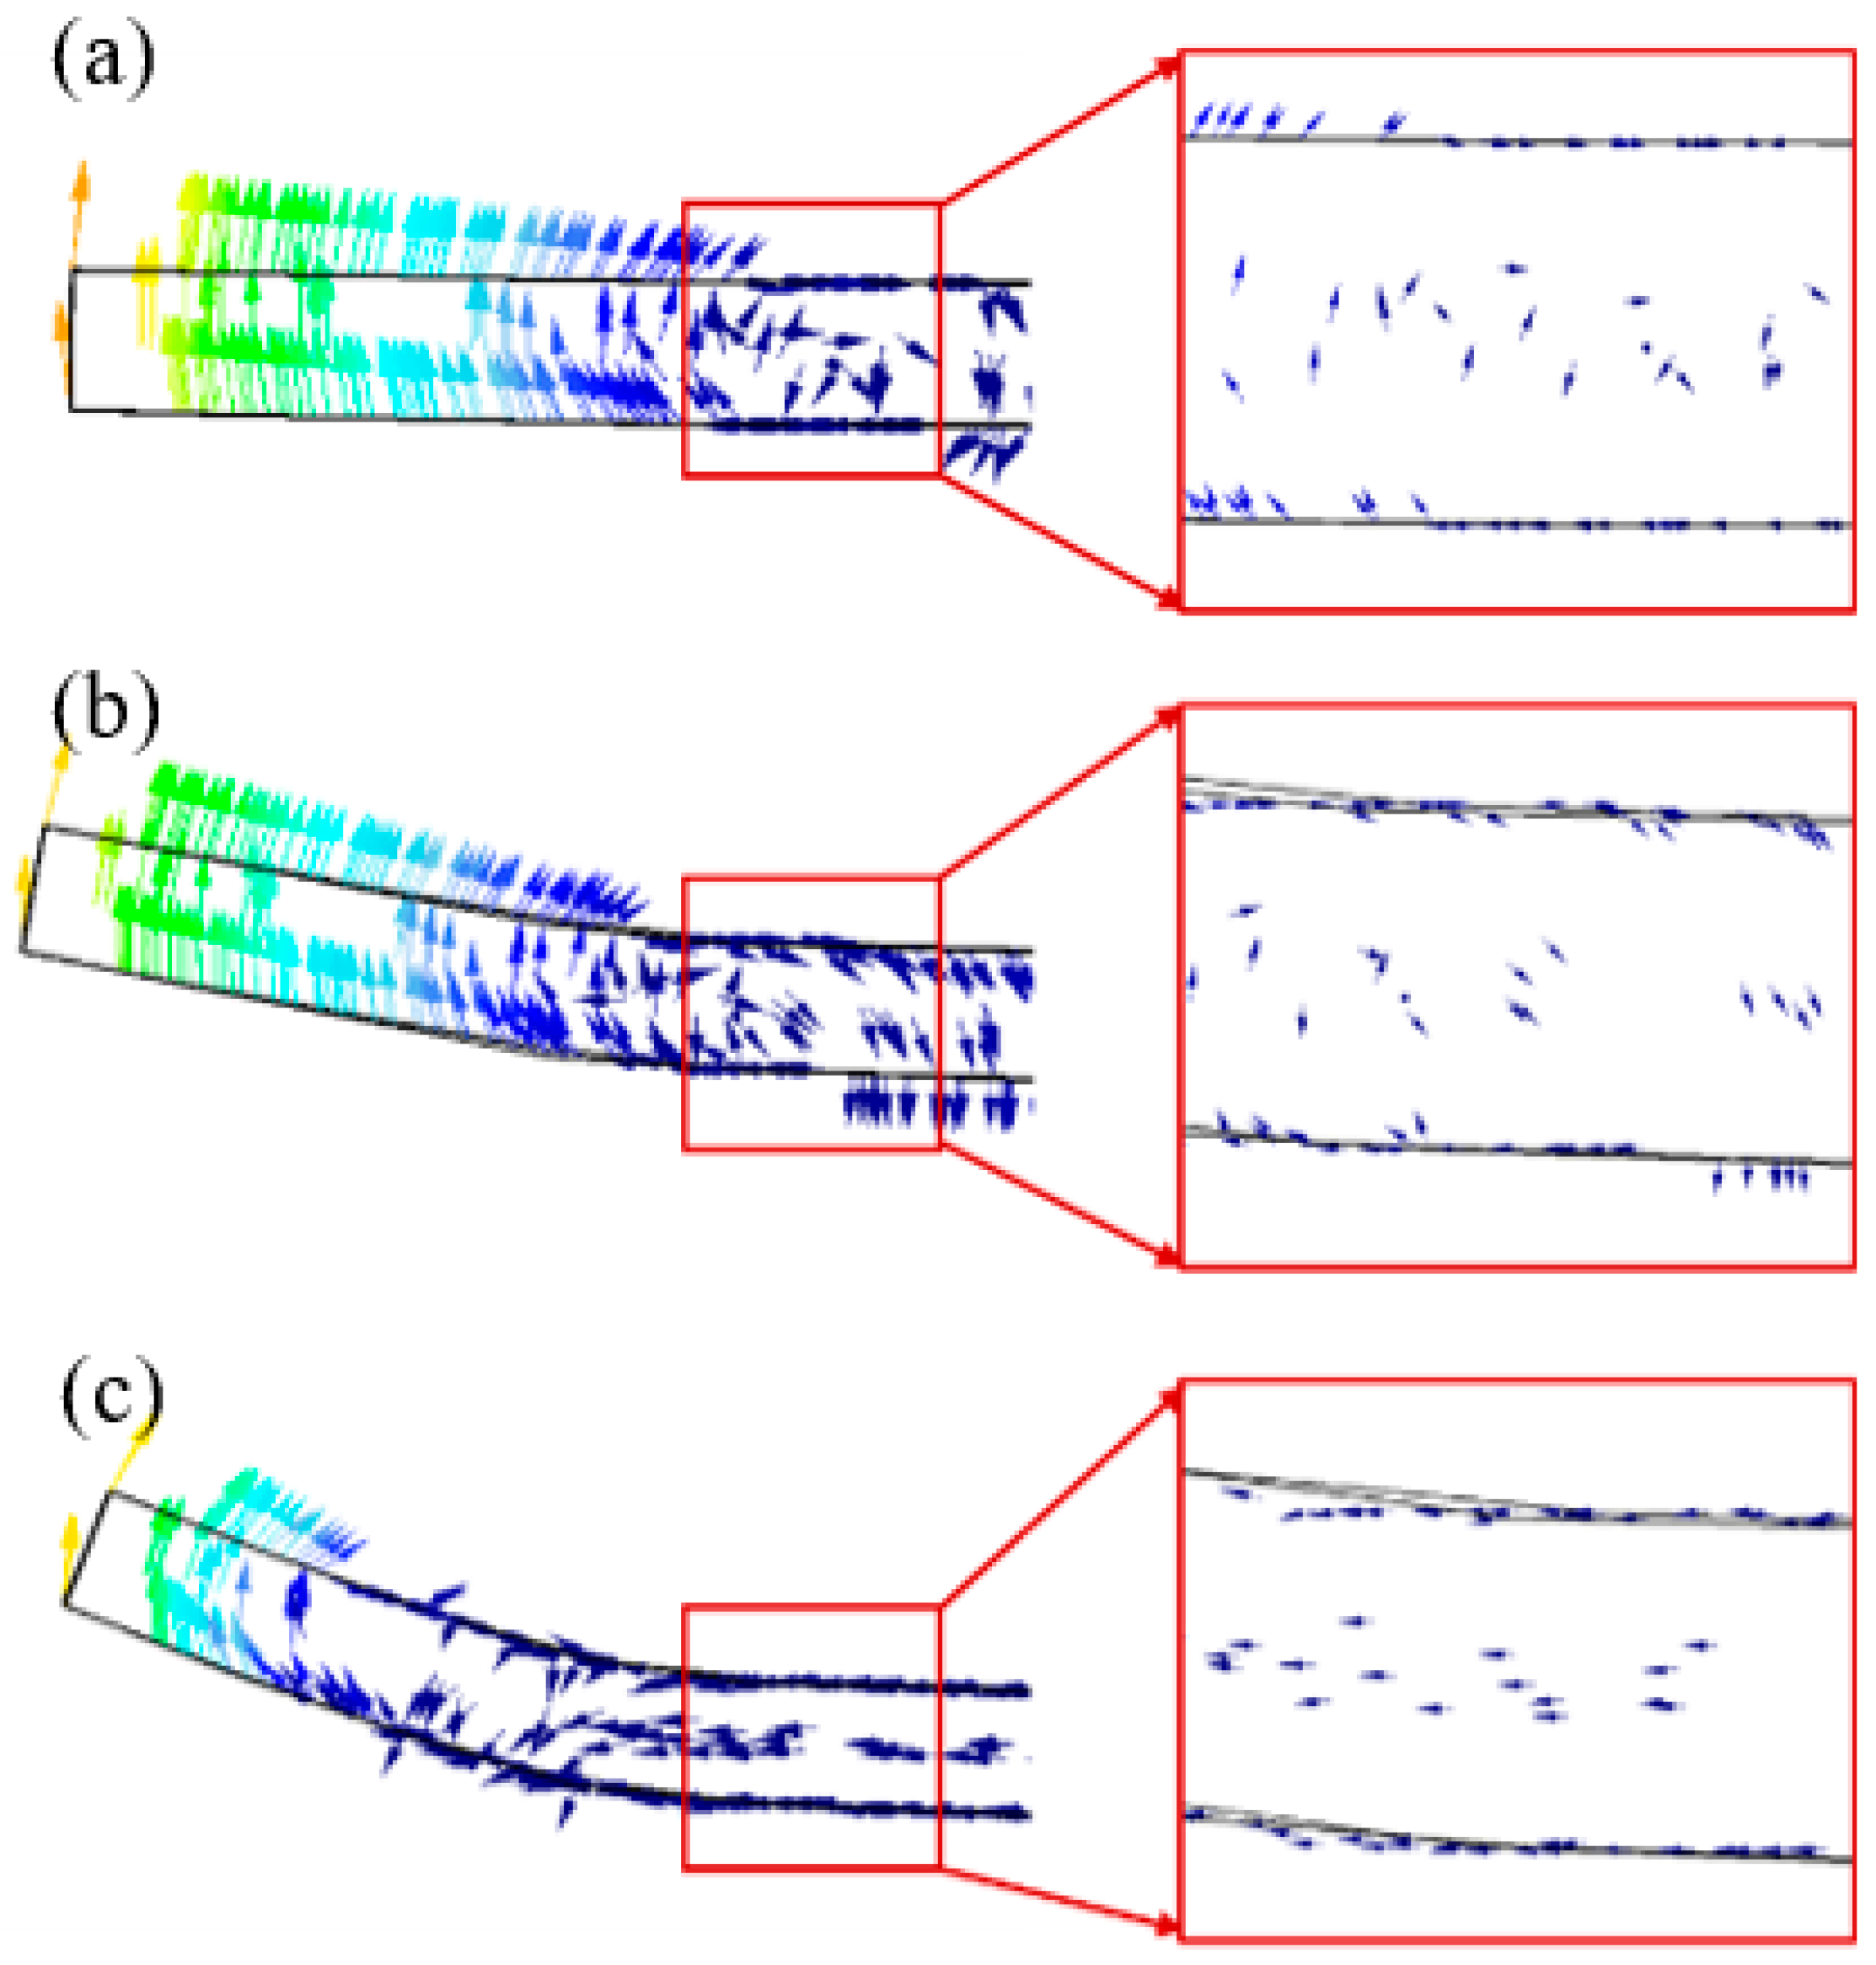
3.2.2. Pre-Bending Metal Flow at the Plate Edge

To delve into the underlying mechanisms governing the rebound phenomenon, the metal flow during this process was meticulously analyzed at distinct reduction amounts: h = 5 mm, h = 45 mm, and h = 90 mm. Figure 6 illustrates the progression of metal flow across various forming stages during the pre-bending process. As evident from the depicted metal flow patterns, despite the stage of formation, the general direction of metal flow along the plate edge remains consistent, albeit with minute variations observable in certain regions.
When h = 5 mm, as shown in Figure 6a, the metal flow direction on the upper and lower surfaces and inside of the plate edge bending deformation area flows tangentially along the plate edge, which is the direction of the plate edge bending change trend. The metal flow direction on the upper surface of the plate in the labeled area flows to the right along the plate surface, and the metal flow direction on the lower surface proceeds to the left along the plate surface.
When h = 45 mm, and the plate edge pre-bending process is halfway complete, as shown in Figure 6b, the plate edge bending degree is obvious, the bending deformation part of the metal flow direction is still along the tangential flow of the plate edge, and the labeled area of the plate surface metal flow direction are perpendicular to the direction of the plate downward flow. This is because, with the increasing amount of pre-bending downward pressure, the plate is bending part of the plate edge, and the unbending straight part of the plate edge is subject to the stress–strain. This is because with the increasing amount of pre-bending downward pressure, both the bending part and the unbent part of the plate edge are affected by stress–strain, and the direction of metal flow is along the pre-bending direction of the plate edge. As shown in Figure 6a,b, most of the metal material flows in the pre-bending direction, but a small part of pre-bending material flows in the opposite direction because it produces rebound, resulting in the chaotic interlacing of phenomena in the direction of the metal flow in the region.
When h = 90 mm, the maximum downward pressure is reached, as shown in Figure 6c. The upper and lower surfaces of the plate and the internal metal flow direction in the labeled area flow to the left along the plate, which is completely in the opposite direction of the bending deformation compared with Figure 6a,b. This phenomenon is caused by the rebound of the plate edge after the end of pre-bending, thus revealing the intrinsic mechanism of the rebound of the plate edge after pre-bending and providing a basis for subsequent research on the rebound of the plate edge pre-bending.
On the upper and lower surfaces of the bending deformation, three sets of points were chosen, and their mean value variations were tracked to analyze the trends in equivalent stress and strain as a function of the reduction amount, as depicted in Figure 7. As evident from the equivalent stress plot in Figure 7a, the stress on the plate’s edge and lower surface escalates with the progressive increase in reduction, with the magnitude and distribution of stress on the upper surface marginally exceeding that on the lower surface during the initial bending phase. However, this disparity diminishes as the pre-bending nears completion, attributed to the augmentation of the edge’s pre-bending angle with the continuous rise in reduction, enabling internal stress to propagate further down the surface. Similarly, the equivalent strain curve in Figure 7b reveals that the strain on both the edge and lower surface intensifies with increasing reduction, with the upper surface exhibiting higher strain values. Notably, the strain undergoes gradual alterations as pre-bending approaches its conclusion, indicating that both stress and strain propagate towards the sheet’s edge as the reduction amount grows.

4. Results and Analysis

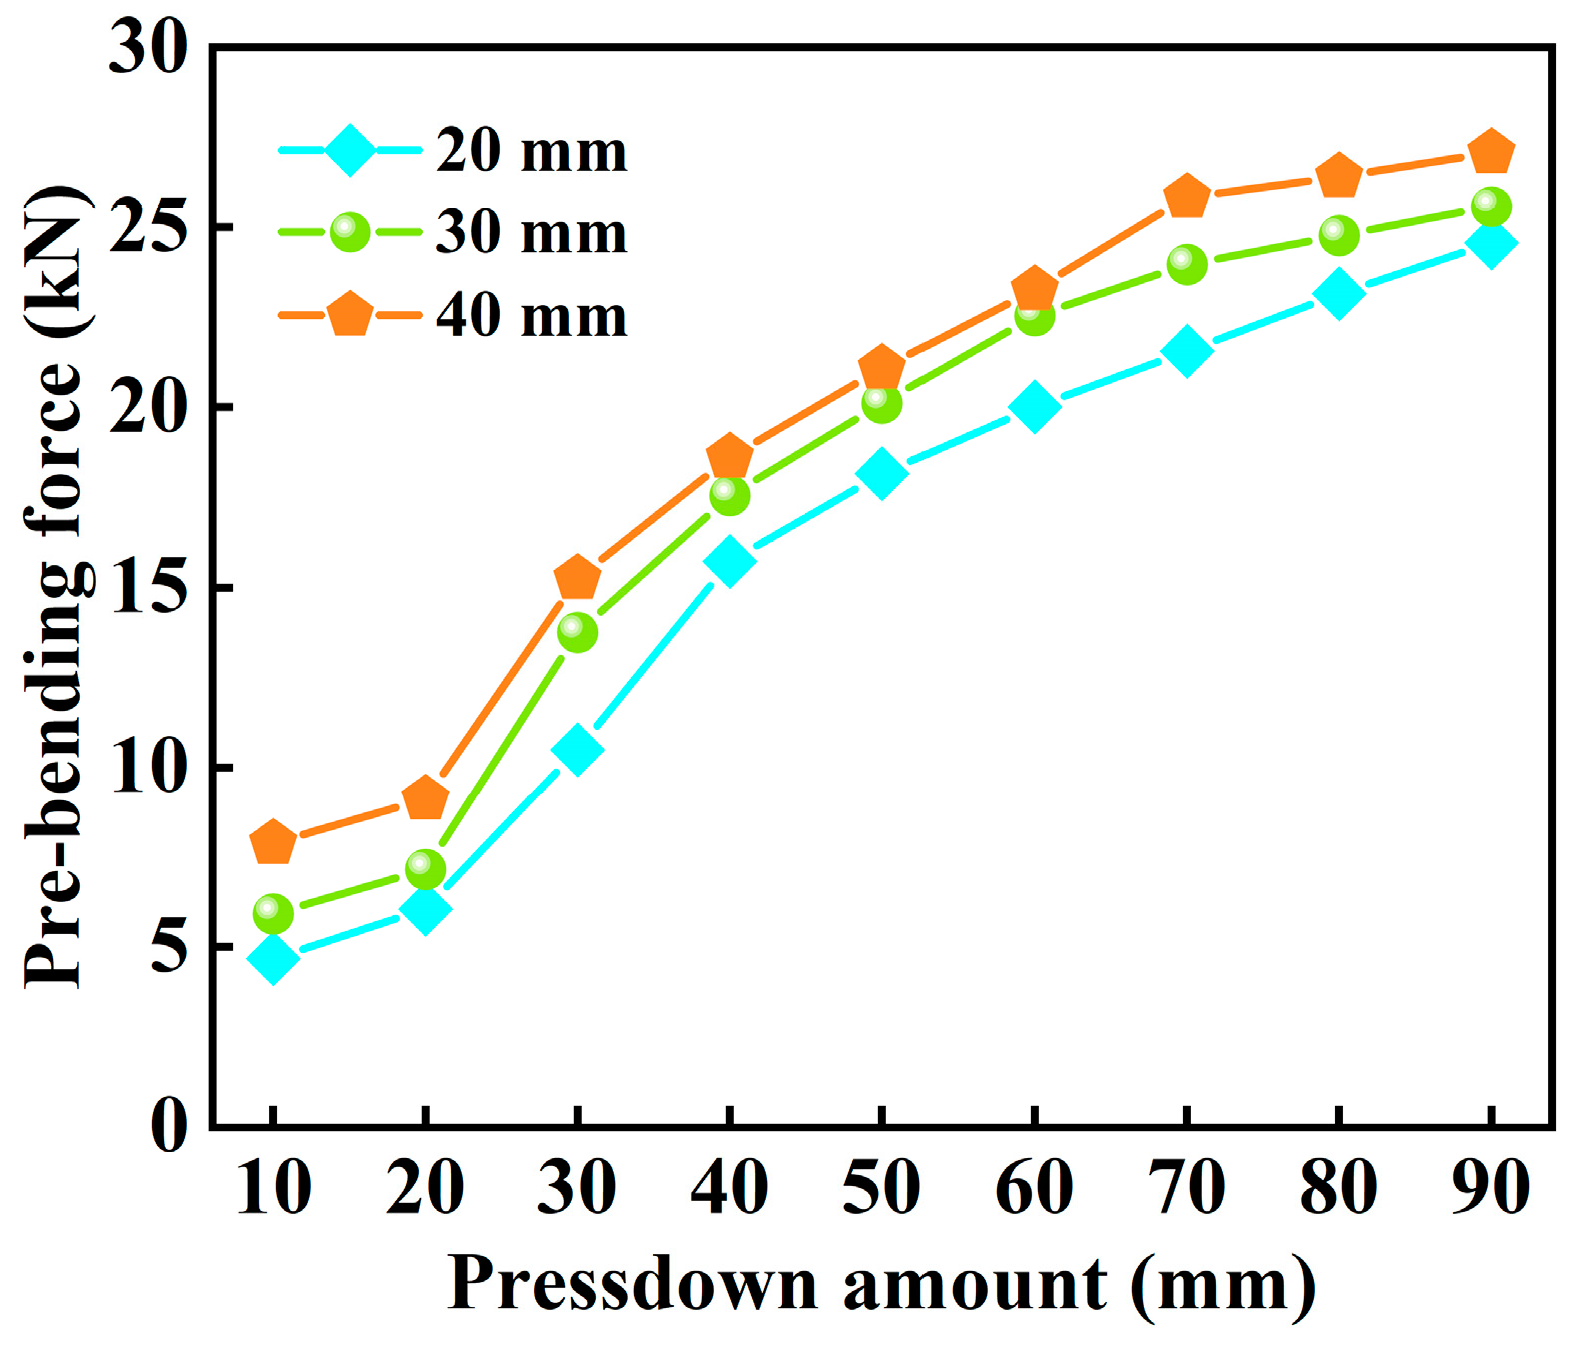
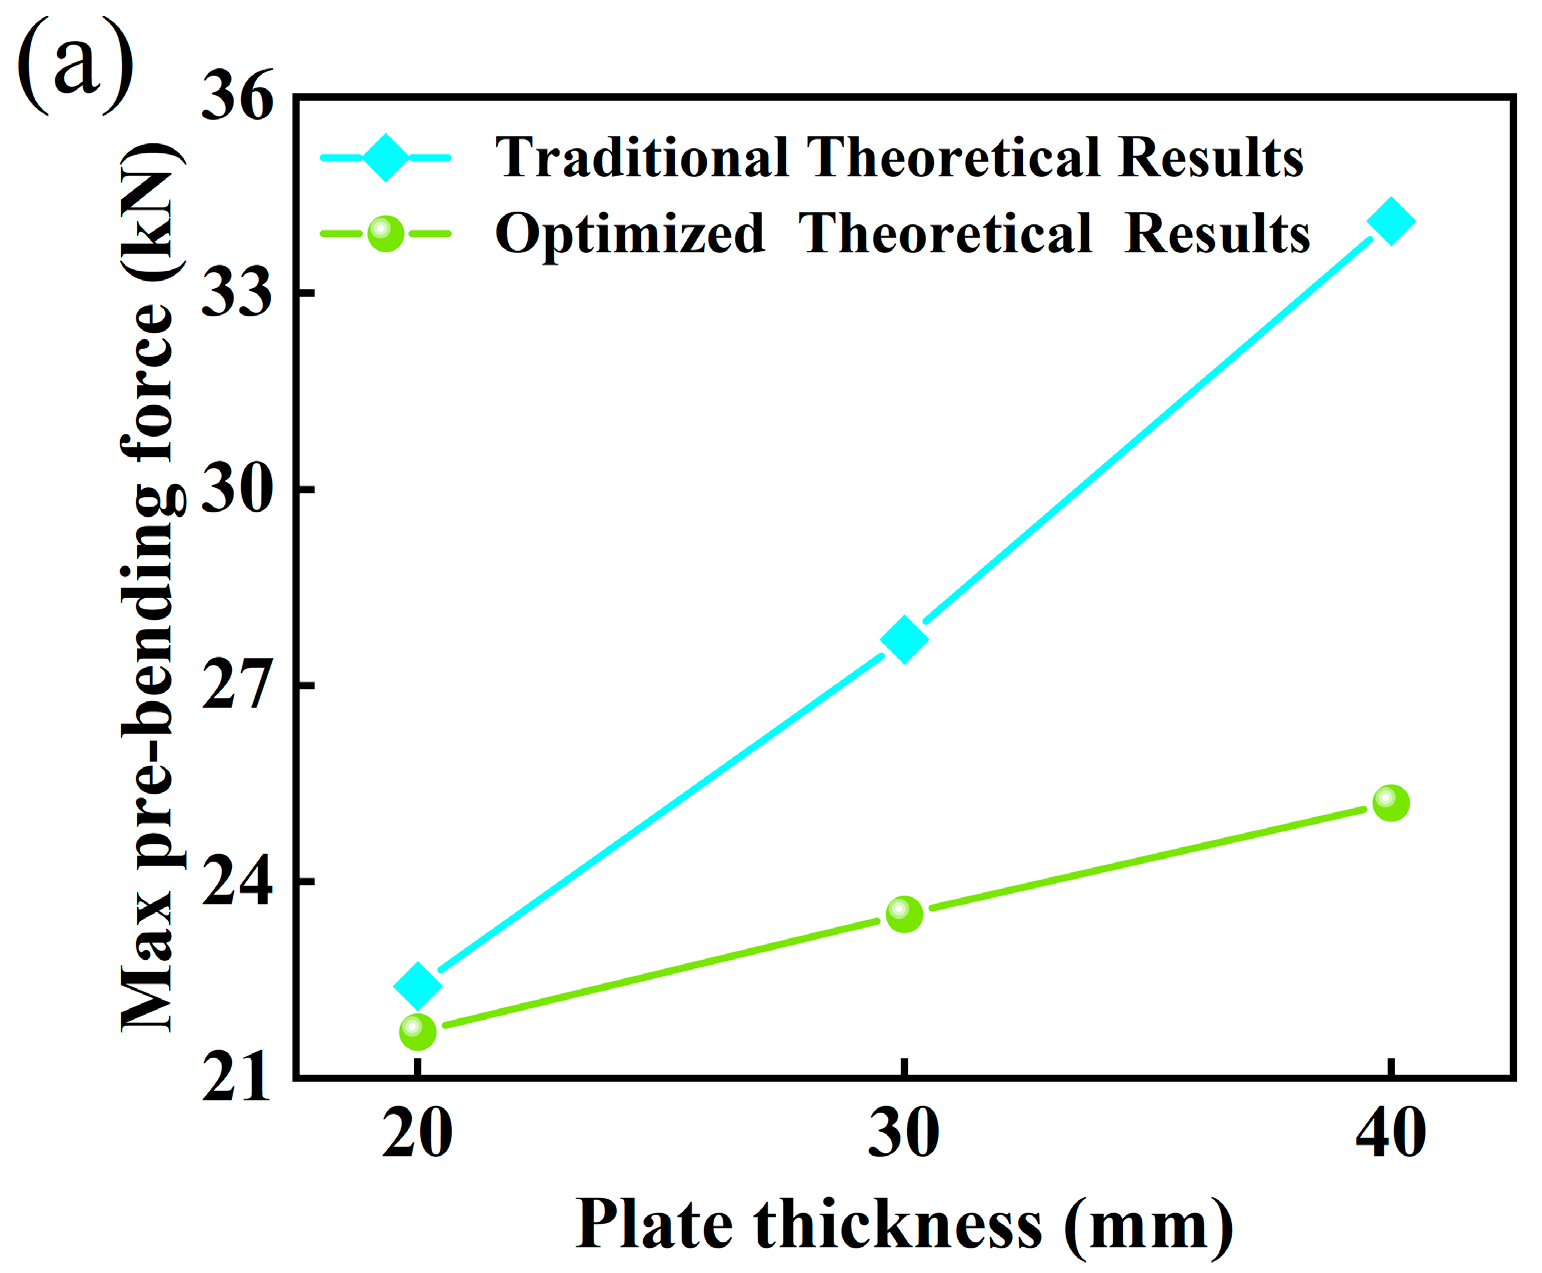
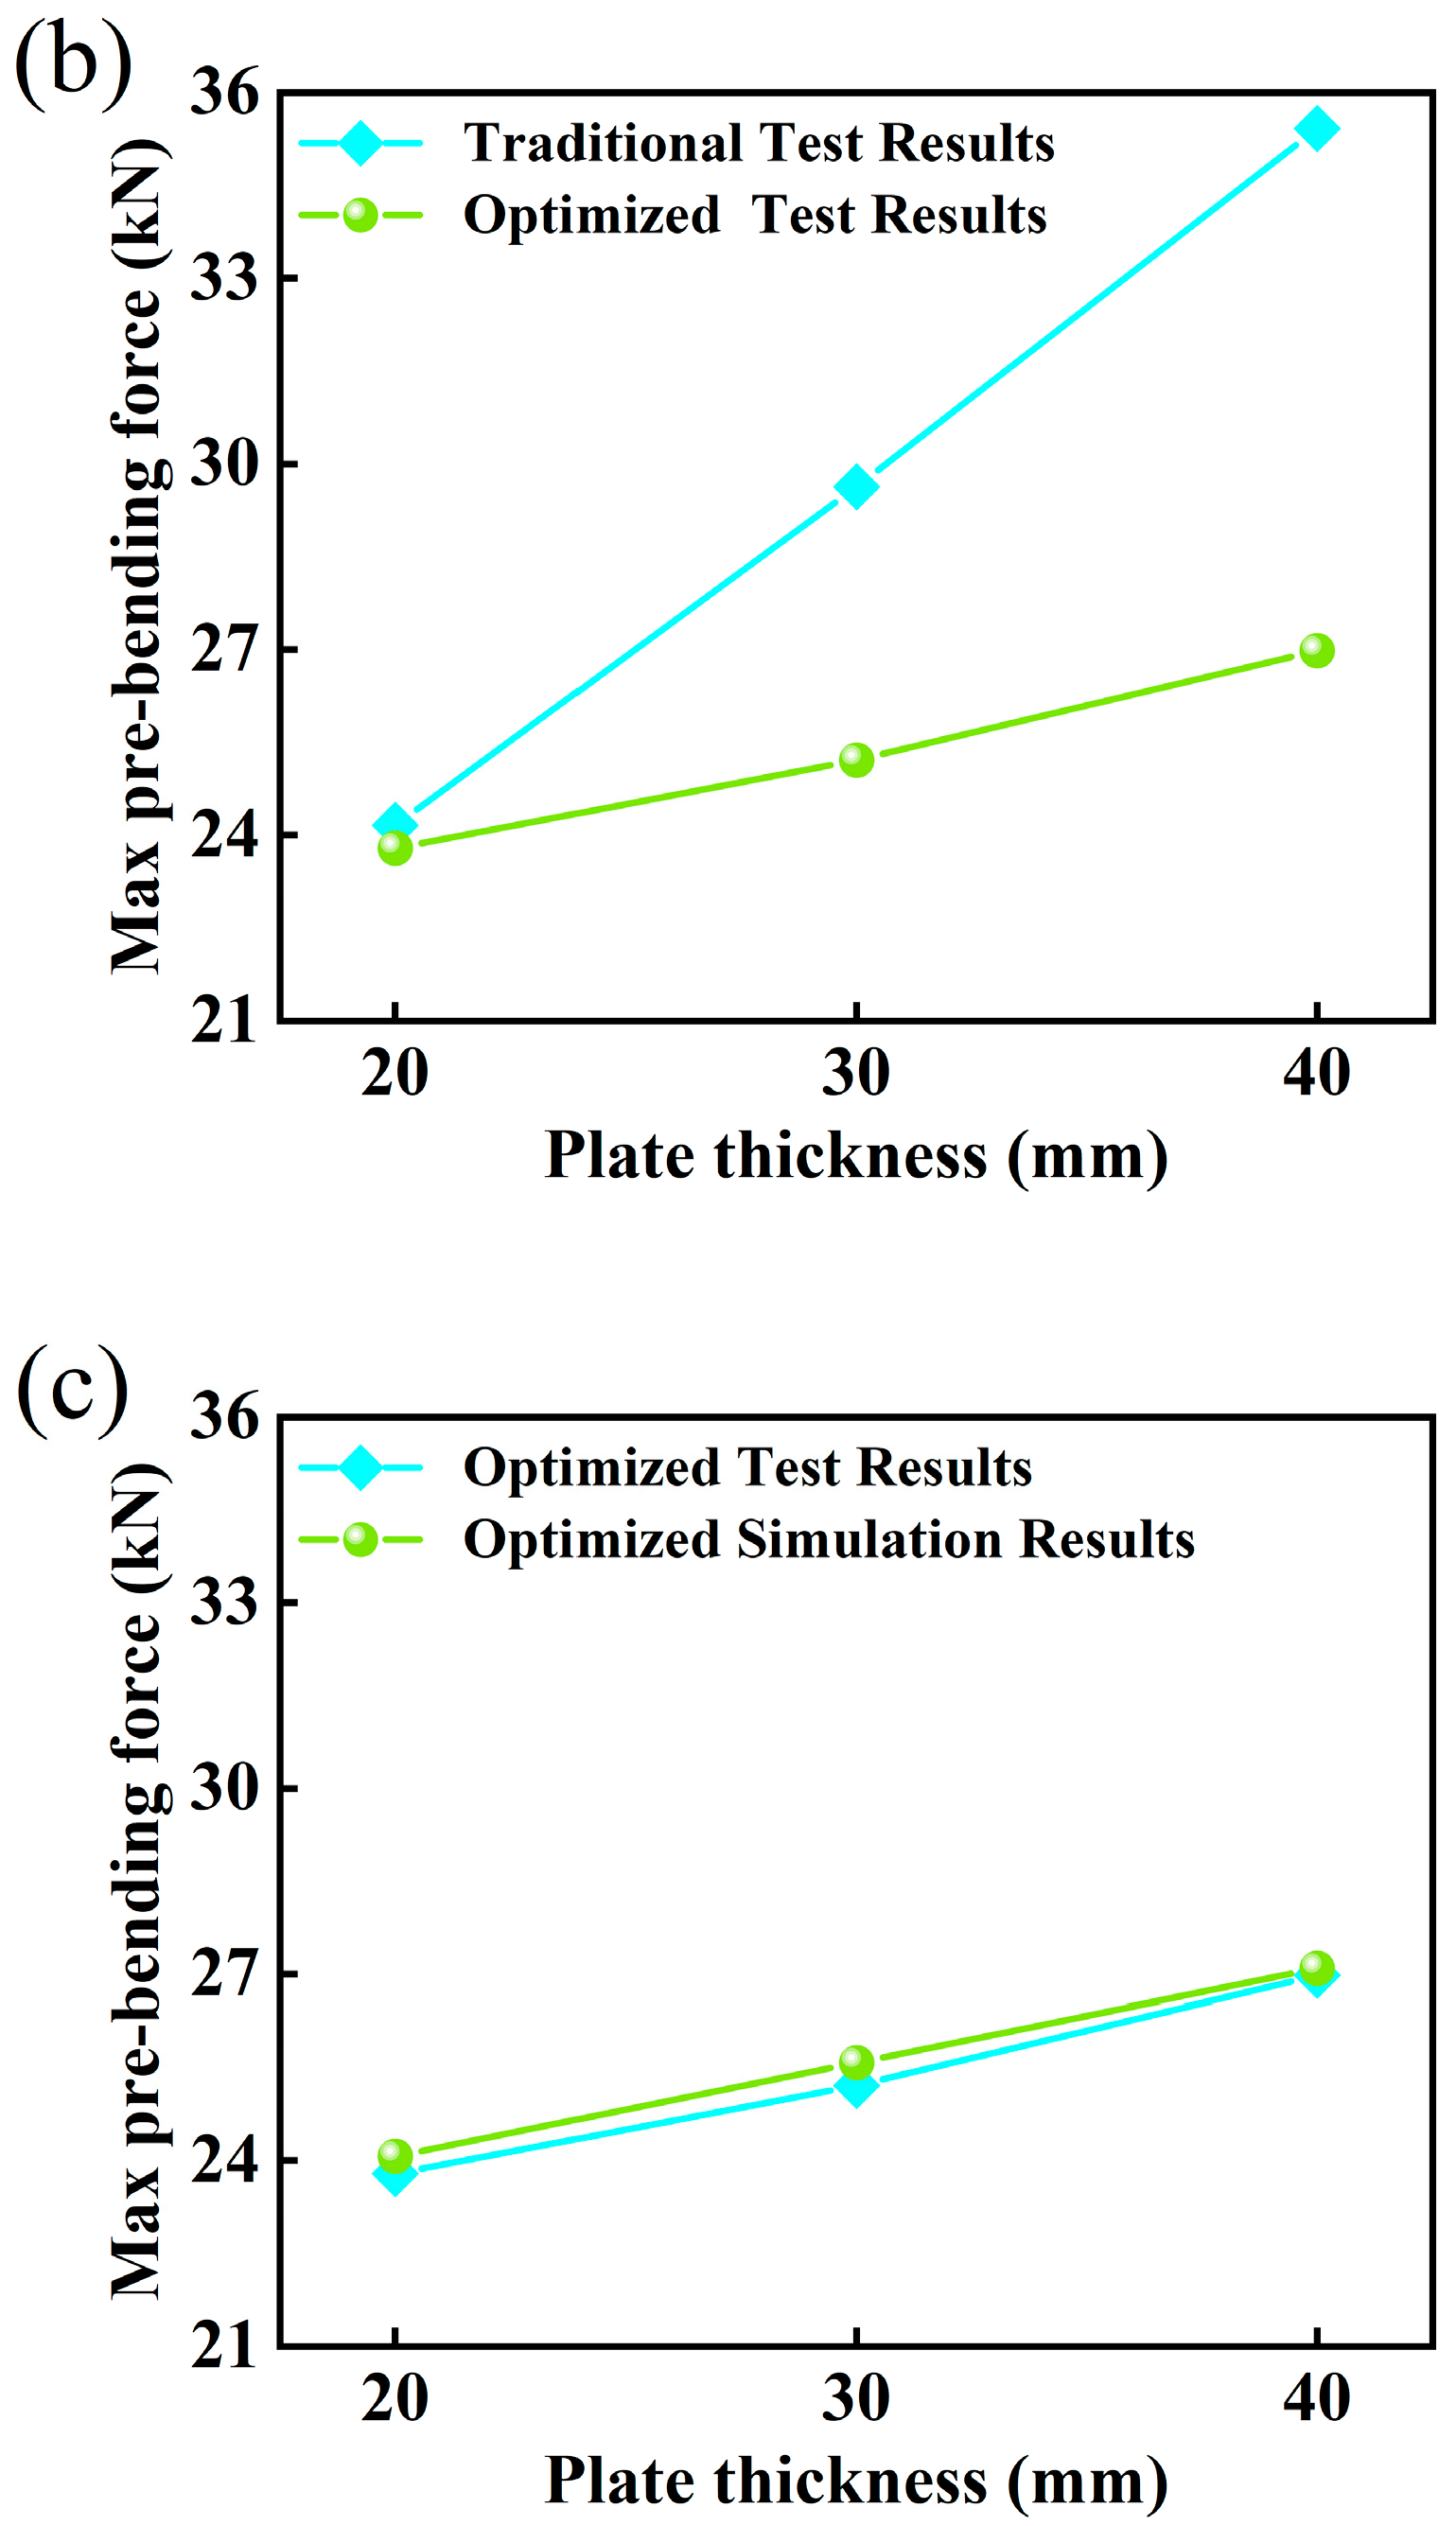
4.1. Influence of Different Plate Thicknesses on the Pre-Bending Force at the Plate Edge

Figure 8 depicts the variations in the pre-bending force necessitated by varying plate thicknesses throughout the pre-bending procedure. Evident from this figure, at a plate thickness of 20 mm, the pre-bending force gradually escalates and subsequently plateaus with the progressive augmentation of the reduction amount, culminating in a peak force of 24.07 kN. Similarly, for plate thicknesses of 30 mm and 40 mm, the respective maximum pre-bending forces required for edge pre-bending are 25.58 kN and 27.09 kN. Notably, throughout these processes, no abrupt fluctuations in the pre-bending force are observed, signifying enhanced mold stability post-optimization. Furthermore, the pre-bending force escalates proportionally with the increase in plate thickness, and the overall trend of the pre-bending force curve remains largely consistent.
This study optimizes the conventional pre-bending mold and establishes a theoretical optimization model for its key parameters. The optimized mold exhibits versatility in accommodating various plate thicknesses and effectively mitigates the pre-bending force required. To elaborate, based on the investigation of the pre-bending process of traditional theory and the optimized theoretical model to calculate the maximum pre-bending force required for bending different plate thicknesses, the maximum pre-bending force calculated by the traditional theoretical model increases significantly with the increase in plate thickness. The optimized theoretical model calculated by the maximum pre-bending force with the increase in plate thickness increases more gently, and the results of the two comparisons are shown in Figure 9a. Among them, the traditional theoretical calculation process aligns closely with the procedures outlined in the reference [32]. In order to ensure that the optimized pre-bending process meets actual production needs while verifying its reasonableness for the traditional mold configuration, through the use of workstations to collect the test load force and the analysis of the test data, it is concluded that the thicker the plate, the greater the required pre-bending force. For optimization of the traditional mold configuration, in the case of the same plate thickness, the use of the new mold test load force versus the use of traditional molds generated by the load force is smaller. The results of the comparison are shown in Figure 9b.
Upon conducting a comparative analysis of Figure 9a,b, it is evident that at t = 20 mm, the discrepancy between the theoretically optimized maximum pre-bending force and the experimental findings amounts to 2.09 kN. Similarly, at t = 30 mm and t = 40 mm, the deviations narrow to 1.71 kN and 1.78 kN, respectively. Notably, post-optimization, the theoretical calculations closely mirror the experimental outcomes, with the latter consistently exceeding the former. This phenomenon can be rationalized by the influence of practical factors such as friction and mold wear during production. Turning to Figure 9c, a comparative evaluation of the optimized maximum pre-bending force’s simulation and experimental results reveals a high degree of congruence, with a maximum divergence of merely 0.37 kN, further validating the precision of the simulation methodology.

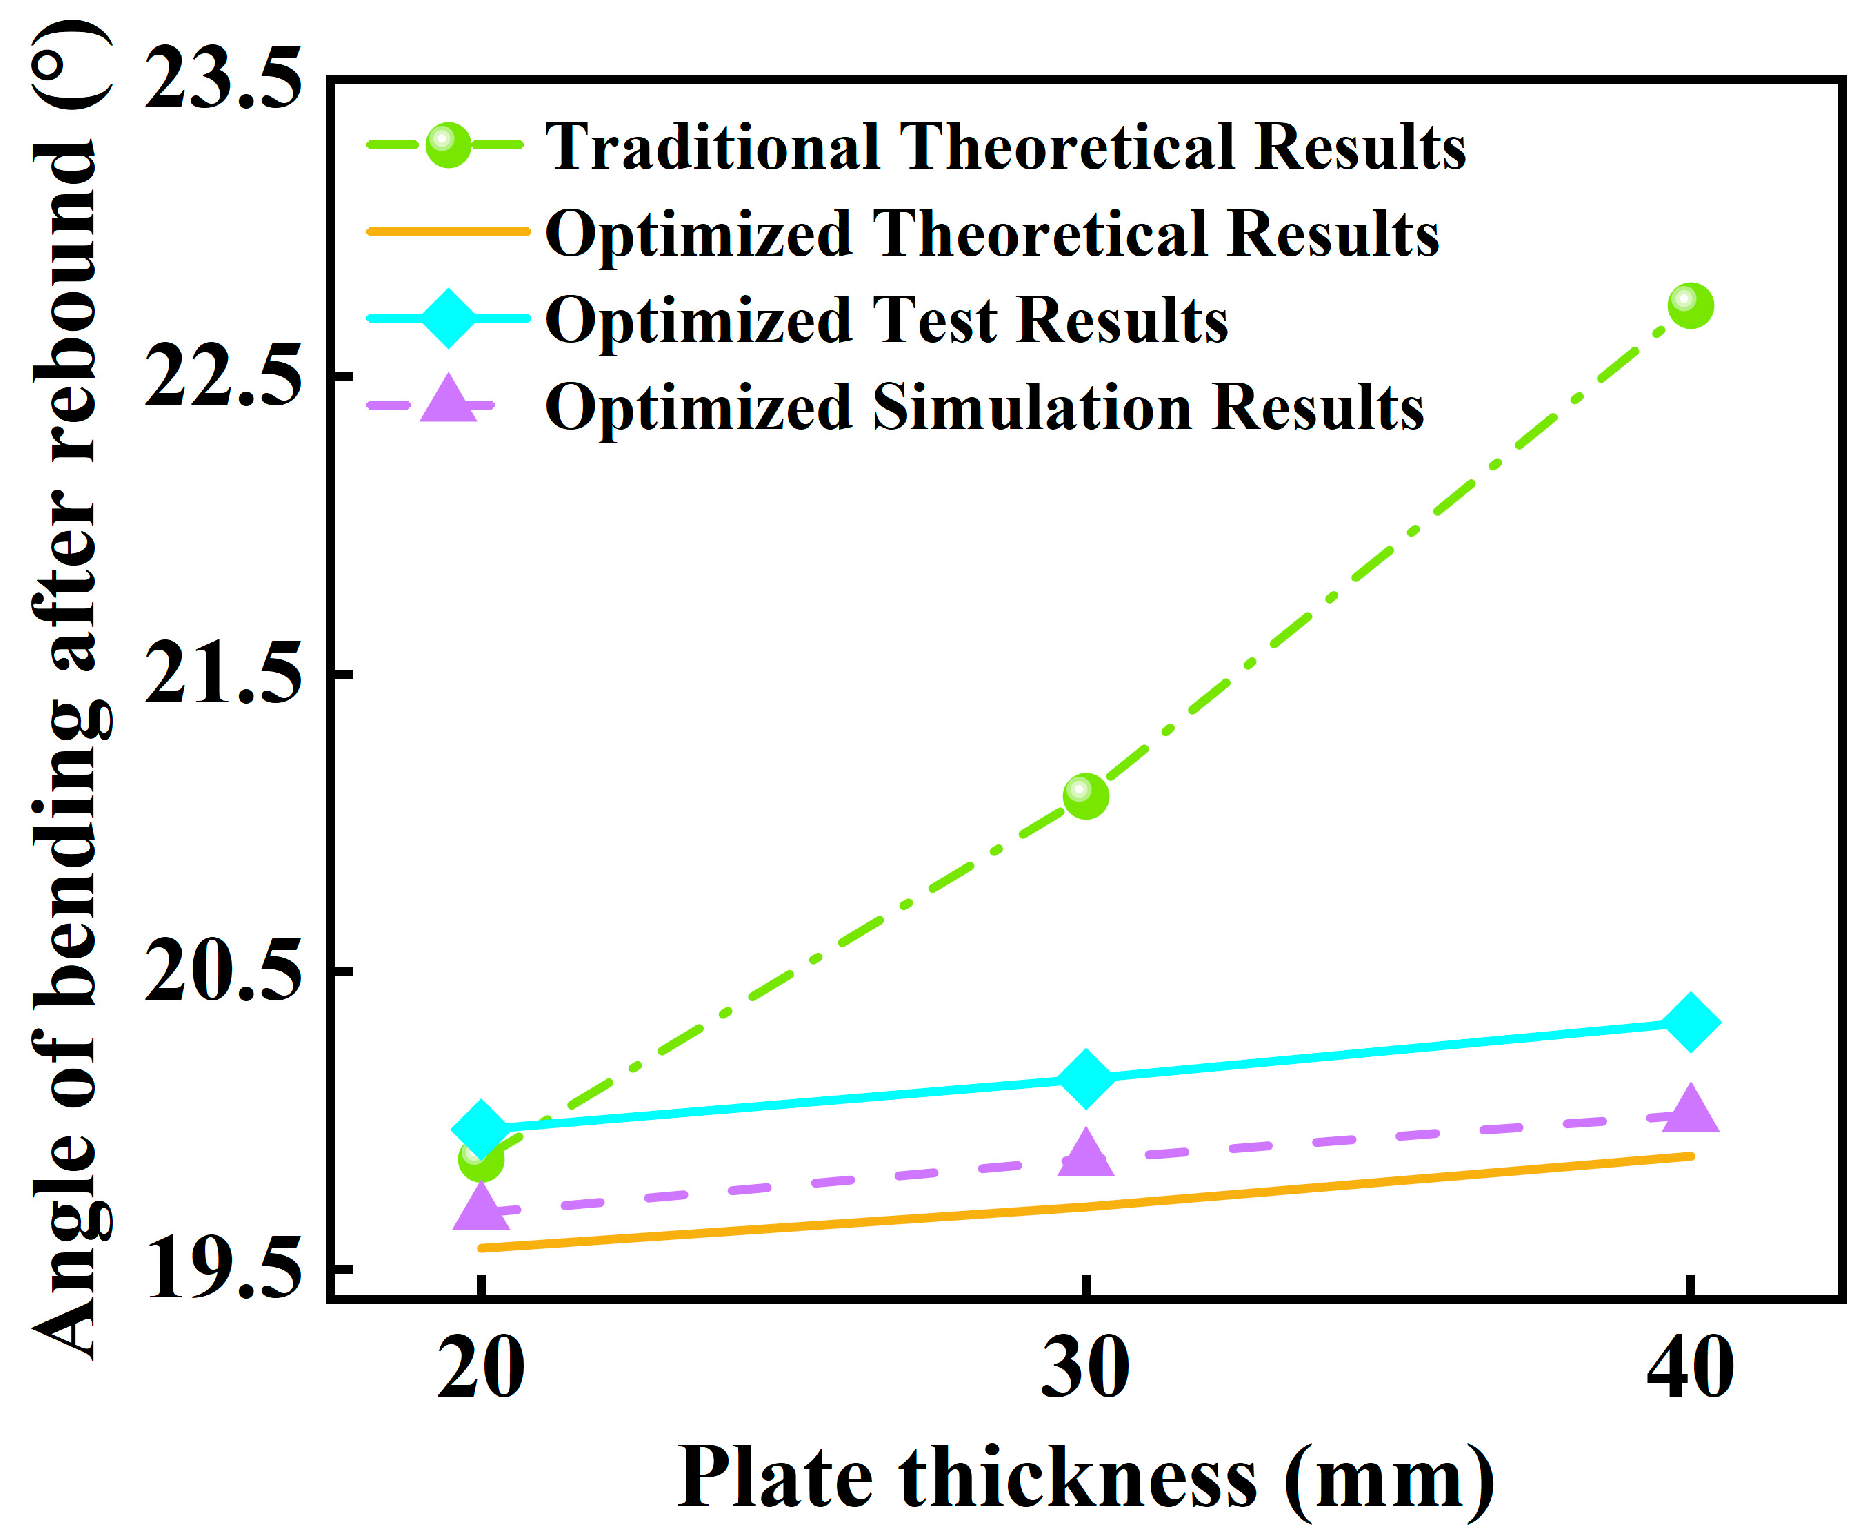
4.2. Effect of Different Plate Thicknesses on the Bending Angle after Springback

In this paper, subsequent to optimizing the pre-bending forming mold, a novel springback bending angle theory model is established, grounded on the refinement of the traditional pre-bending process’s springback bending angle theory. Additionally, by scrutinizing the process optimization simulation outcomes and experimentally analyzing the acquired data, we delve into the springback bending angle variation patterns of pre-bent sheets of varying thicknesses, as depicted in Figure 10. Specifically, for sheet thicknesses of 20 mm, 30 mm, and 40 mm, the discrepancies between traditional theoretical calculations and process optimization results are 0.2°, 4.79°, and 8.94°. These findings indicate that, post-optimization, as sheet thickness increases, the phase between the upper and lower mold augments, leading to a flattening trend in the springback bending angle variation. Compared to the conventional pre-bending process, this approach yields a more precise springback bending angle prediction. Furthermore, Figure 10 reveals that the theoretical calculations, simulation analysis results, and experimental data trends for pre-bending process optimization across different sheet thicknesses are fundamentally congruent, demonstrating a relative fit among the three methods and validating the rationality of the process optimization. Notably, a linear relationship exists between sheet thickness and springback bending angle, with the latter gradually augmenting as the former increases.

5. Conclusions

(1)
Upon the foundation of the conventional pre-bending process, this paper addresses the issue of frequent mold exchange necessitated by varying plate thicknesses during pre-bending operations. To overcome this challenge, we introduce an innovative mold phase difference model and subsequently develop a theoretical framework that aligns key parameters with the optimized springback bending angle and pre-bending force, achieved through meticulous mold configuration optimization.
(2)
In this study, we employed the finite element method to simulate the pre-bending process of nickel-based alloy N08810 plates of varying thicknesses. Following mold optimization, we delved into the evolution of the equivalent stress and metal flow behavior during the pre-bending phase, subsequently elucidating the influence of plate thickness on both the pre-bending force and the springback bending angle. Our findings indicate that the pre-bending force escalates in tandem with an increase in plate thickness, while the overall trend of the pre-bending force curve remains consistent across different plate thicknesses. Furthermore, we discovered a linear correlation between plate thickness and the springback bending angle, with the latter also progressively augmenting as plate thickness increases.
(3)
By means of comprehensive theoretical calculations, rigorous simulation analyses, and extensive experimental verifications, this paper introduces an innovative pre-bending methodology aimed at enhancing the forming quality of JCOE pipes. This method effectively attains the optimal springback bending angle while minimizing the pre-bending force required, thereby furnishing a robust theoretical foundation that underpins practical applications in industrial production.

Author Contributions

Conceptualization, T.L.; Methodology, T.L., H.G. and M.S.; Software, T.L., C.M. and C.X.; Validation, H.G. and M.S.; Investigation, T.L., C.M. and C.X.; Resources, Z.C.; Data curation, C.M. and C.X.; Writing—original draft, T.L.; Writing—review and editing, Z.C.; Project administration, H.G. and M.S.; Funding acquisition, Z.C. All authors have read and agreed to the published version of the manuscript.

Funding

This research was funded by the National Natural Science Foundation of China (52175353), the Shanxi Provincial Key Research and Development Program (202102150401002), and the Shanxi Provincial Science and Technology Major Special Program “Unveiling the Commander-in-Chief” Project Mission Statement (202101110401009).

Data Availability Statement

The original contributions presented in the study are included in the article, further inquiries can be directed to the corresponding author.

Acknowledgments

We are grateful to Yuquan Li, Yuxiang Zhao, and Ri Jin from the School of Materials Science and Engineering, Taiyuan University of Science and Technology, Taiyuan, for their valuable guidance, support, and assistance throughout this research. Their expertise and knowledge contributed greatly to the success of this research.

Conflicts of Interest

The authors declare no conflicts of interest.

References

  1. Xiao, L.; Li, W.; Cota-Sanchez, G. Mechanical property and microstructure characterization of incoloy 800H alloy and its welds after corrosion testing in high temperature steam. Nucl. Eng. Des. 2022, 398, 111970. [Google Scholar] [CrossRef]
  2. Ju, J.; Ma, Y.; Chen, J.; Shuai, L.; Zhang, Y. Effect of Heat Treatment on Structure Evolution and Mechanical Property Strengthening of Low-Cobalt Nickel-Based Superalloy. Metals 2024, 14, 872. [Google Scholar] [CrossRef]
  3. Zhao, X.L.; Ren, K.M.; Lu, X.H.; He, F.; Jiang, Y.K. Investigation on microstructure and mechanical properties of ni-based alloy overlayer by ultrasonic impact treatment. J. Mech. Sci. Technol. 2022, 36, 3973–3981. [Google Scholar] [CrossRef]
  4. Chintada, V.B.; Koona, R.; Raju Bahubalendruni, M.V.A. State of Art Review on Nickel-Based Electroless Coatings and Materials. J. Bio- Tribo-Corros. 2021, 7, 134. [Google Scholar] [CrossRef]
  5. Tovmasyan, M.A.; Samsuev, S.V.; Sidorova, T.Y.; Nguen, V.T. Study of Changes in the Shape of a Pipe Blank Taking into Account the Peculiarities of Contact Interaction with a Deforming Tool during JCOE Molding in the TESA 1420 Line. Steel Transl. 2023, 53, 938–944. [Google Scholar] [CrossRef]
  6. Xu, L.Z.; Qiao, G.Y.; Lu, X.X.; Gu, Y.; Xu, K.; Chen, X.W.; Xiao, F.R. Microstructure evolution and deformation mechanism along the thickness of heavy-wall ferrite-bainite dual-phase offshore pipelines by the progressive forming process. J. Mater. Process. Technol. 2024, 326, 18355. [Google Scholar] [CrossRef]
  7. Shabalov, I.P.; Solov’ev, D.M.; Filippov, G.A.; Livanova, O.V. Mechanical properties of a pipe workpiece at the stages of JCOE pipe forming. Russ. Metall. (Met.) 2015, 38, 309–316. [Google Scholar] [CrossRef]
  8. Qi, S.C.; Yu, G.C.; Chen, S.G. Numerical Simulation of Residual Stress in the JCO-Welding-Calibration Whole Process Forming of the Submarine Pipeline Pipes. In Proceedings of the 14th International Conference on the Technology of Plasticity—Current Trends in the Technology of Plasticity; Mocellin, K., Bouchard, P.-O., Bigot, R., Balan, T., Eds.; Springer: Cham, Switzerland, 2024; Volume 2, pp. 653–663. [Google Scholar]
  9. Fan, L.F.; Yan, J.X.; Gao, Y.; Yun, J.B. Research on deformation characteristics of JCOE forming in large diameter welding pipe. Adv. Manuf. 2016, 4, 268–277. [Google Scholar] [CrossRef]
  10. Antoniou, K.; Chatzopoulou, G.; Karamanos, S.; Tazedakis, A.; Palagas, C.; Dourdounis, E. Numerical simulation of JCO-E pipe manufacturing process and its effect on the external pressure capacity of the pipe. J. Offshore Mech. Arct. Eng. 2019, 141, 011704. [Google Scholar] [CrossRef]
  11. Chandel, J.D.; Singh, N.L. Formation of X-120 M Line Pipe through J-C-0-E Technique. Engineering 2011, 3, 400–410. [Google Scholar] [CrossRef]
  12. Zhang, Z.Q.; Song, J.L.; Fu, J.H. A Refined Model of Three-roller Elastoplastic Asymmetrical Pre-bending of Plate. J. Iron Steel Res. Int. 2014, 3, 328–334. [Google Scholar] [CrossRef]
  13. Lv, G.M.; Zhang, S.F.; Song, L.H. Influence of auxiliary mold stretch-bend forming on the forming quality for L-section aluminum alloy profile. Int. J. Lightweight Mater. Manuf. 2023, 2, 254–263. [Google Scholar] [CrossRef]
  14. Borges, J.G.O.; Karam, V.J. Elastic-viscoplastic analysis of plate bending with Reissner’s theory by the Boundary Element Method. Eng. Anal. Bound. Elem. 2021, 132, 146–158. [Google Scholar] [CrossRef]
  15. Gavriilidis, I.; Stamou, A.G.; Palagas, C.; Dourdounis, E.; Voudouris, N.; Tazedakis, A.; Karamanos, S.A. Heat treatment effects on collapse of JCO-E steel pipes under external pressure: Experiments and numerical predictions. Mar. Struct. 2024, 93, 103536. [Google Scholar] [CrossRef]
  16. Gao, Y.; Li, Q.; Xiao, L.C. Numerical Simulation of JCOE Pipe Forming. In Proceedings of the 2009 World Congress on Computer Science and Information Engineering, Los Angeles, CA, USA, 31 March 2009. [Google Scholar]
  17. Marciniak, Z.; Duncan, J.L.; Hu, S.J. Mechanics of Sheet Metal Forming, 2nd ed.; Butterworth-Heinemann: Oxford, UK, 2002. [Google Scholar]
  18. Chatzopoulou, G.; Karamanos, S.A.; Varelis, G.E. Finite element analysis of UOE manufacturing process and its effect on mechanical behaviour of offshore pipes. Int. J. Solids Struct. 2016, 83, 13–27. [Google Scholar] [CrossRef]
  19. Xue, P.; Yu, T.X.; Chu, E. An energy approach for predicting springback of metal sheets after double-curvature forming part I:Axisymmetric stamping. Int. J. Mech. Sci. 2001, 43, 1893–1914. [Google Scholar] [CrossRef]
  20. Nader, A. Springback and fracture in v-die air bending of thick stainless steel sheets. Mater. Des. 2000, 21, 217–236. [Google Scholar]
  21. Du, B.; Li, H.X.; Zheng, W.; He, X.D.; Ma, T.; Yin, H.Q. Study of oxidation behavior and tensile properties of candidate superalloys in the air ingress simulation scenario. Nucl. Eng. Technol. 2023, 55, 71–79. [Google Scholar] [CrossRef]
  22. Yang, J.L.; Bai, J.J.; Li, J.J. Hardening behavior of nickel-base alloy irradiated by multi-energy Fe ions. J. Mater. Res. Technol. 2024, 29, 1000–1009. [Google Scholar] [CrossRef]
  23. Liu, M.M.; Liu, Y.L.; Li, H. Deformation analysis of double wall brazed tube in the multi-pass roll forming: Cross-sectional variation, stress-strain evolution and roundness assessment. J. Manuf. Process. 2023, 85, 479–491. [Google Scholar] [CrossRef]
  24. Madhav, V.; Krishnaswamy, H.; Majumdar, S. Analysis of UOE forming process accounting for Bauschinger effect and welding. Mater. Manuf. Process. 2020, 35, 910–921. [Google Scholar] [CrossRef]
  25. Al-Zahrani, E.S.; Ogunlakin, N.; Toor, I.U.; Djukic, M.B. Hydrogen-induced cracking of longitudinally submerged arc welded HSLA API 5L X65 carbon steel pipeline. Eng. Fail. Anal. 2024, 163. ISSN 1350–6307. [Google Scholar] [CrossRef]
  26. Zhao, J.; Yin, J.; Ma, R. Springback equation of small curvature plane bending. Sci. China Technol. 2021, 54, 2386–2396. [Google Scholar] [CrossRef]
  27. Zhang, L.J.; Pei, Q.; Zhang, J.X. Study on the microstructure and mechanical properties of explosive welded 2205/X65 bimetallic sheet. Mater. Des. 2014, 64, 462–476. [Google Scholar] [CrossRef]
  28. Hua, L.; Zhang, W.P.; Hu, L.; Zhang, Z.C.; Hu, Z.L. Mechanical responses and microstructure evolution of a 7A09 aluminum alloy extrusion profile during novel stretch bending. Mater. Charact. 2024, 212, 113938. [Google Scholar] [CrossRef]
  29. Qiu, C.; Xu, R.; Xu, X.; Ma, S. Finite Element Simulation of Multi-Pass Rolling of a Pure Aluminum Target under Different Rolling Routes and Methods. Metals 2024, 14, 845. [Google Scholar] [CrossRef]
  30. Hu, H.; Yu, F.; Zhang, S.; Yin, J.; Zhang, H.; Zhang, J.; Zhang, X.; Cao, M.; Murtaza, S. Ultrasonic-Assisted Granular Medium Forming of Aluminum Alloy 6063-T5: Simulations and Experiments. Metals 2024, 14, 847. [Google Scholar] [CrossRef]
  31. Koshmin, A.; Zinoviev, A.; Cherkasov, S.; Mahmoud Alhaj Ali, A.; Tsydenov, K.; Churyumov, A. Finite Element Modeling and Experimental Verification of a New Aluminum Al-2%Cu-2%Mn Alloy Hot Cladding by Flat Rolling. Metals 2024, 14, 852. [Google Scholar] [CrossRef]
  32. Gao, Y. Study on Theory and Computer Simulation of JCO Forming Forlarge-Diamater Longitudinal Welded Pipe. Ph.D. Thesis, Yanshan University, Qinhuangdao, China, 2011; pp. 16–41. [Google Scholar]
Figure 1. Diagram of billet forming defects: (a) peach shape, (b) pointy mouth.
Metals 14 01032 g001
Figure 2. Schematic diagram of pre-bending mold: (a) pre-bending process, (b) phase difference.
Metals 14 01032 g002
Figure 3. The schematic of the geometric model of the plate edge pre-bending process.
Metals 14 01032 g003
Figure 4. Equivalent stress and contour distribution of the primary and secondary feeding with different plate thicknesses: (a,d) t = 20 mm, (b,e) t = 30 mm, (c,f) t = 40 mm.
Metals 14 01032 g004
Figure 5. Variation law of equivalent stress with different plate thicknesses.
Metals 14 01032 g005
Figure 6. Metal flow at different deformation stages: (a) h = 5 mm, (b) h = 45 mm, (c) h = 90 mm.
Metals 14 01032 g006
Figure 7. Equivalent stress and strain diagrams for different reduction amounts: (a) equivalent stress, (b) equivalent strain.
Metals 14 01032 g007
Figure 8. Changing law of pre-bending force during simulation.
Metals 14 01032 g008
Figure 9. Comparison of maximum pre-bending force before and after optimization: (a) theoretical optimization, (b) mold optimization, (c) process optimization.
Metals 14 01032 g009aMetals 14 01032 g009b
Figure 10. Comparison of bending angle after springback before and after optimization of pre-bending theory.
Metals 14 01032 g010
Table 1. Mechanical property parameters of N08810.
MaterialsElastic Modulus
( E /GPa)
Yield Strength
RP (0.2N/mm2)
Tensile Strength
Rm (N/mm2)
Poisson
Ratio   ( ν )
Density
ρ (g/cm3)
Elongation
A5%
N088102161804500.38.0435
Table 2. Chemical composition of N08810.
Materials%NiCrFeCMnSiCuSAlTi
N08810Min3019-0.05----0.150.15
Max3523-0.101.510.750.0150.600.60
Disclaimer/Publisher’s Note: The statements, opinions and data contained in all publications are solely those of the individual author(s) and contributor(s) and not of MDPI and/or the editor(s). MDPI and/or the editor(s) disclaim responsibility for any injury to people or property resulting from any ideas, methods, instructions or products referred to in the content.

