Abstract
Laser Powder Directed Energy Deposition (LP-DED) can produce thin-wall features on the order of 1 mm. These features are essential for large structures operating in extreme environments such as regeneratively cooled nozzles and heat exchangers, which often make use of refractory metals. In this work, the mechanical behavior of LP-DED C103 was investigated via quasi-static tensile testing and low cycle fatigue (LCF) testing. The effects of vacuum stress relief (SR) and hot isostatic pressing (HIP) heat treatments were investigated for specimens in the vertical and horizontal build orientations during tensile testing. The AB and SR properties were lower than literature values for wrought and laser powder bed fusion (L-PBF) bulk components but higher than electron beam powder bed fusion (EB-PBF). The application of a HIP cycle improved strength by 7% and ductility by 27% past the initial as-built condition. Fracture images reveal that interlayer stress concentration sites are responsible for fracture in specimens in the vertical orientation. Meanwhile, fracture in the horizontal specimens mainly propagates at a slanted angle typical of plane stress conditions. The LCF results show cycles to failure ranging from 100 cycles to 8000 cycles for max strain levels of 2% and 0.5%, respectively. Fractography on the fatigue specimens reveals an increasing propagation zone as max strain levels are increased. The impact of these findings and future work are discussed in detail.
1. Introduction
Refractory metals are used for applications in extreme environments such as propulsion systems, hypersonic leading edges, and nuclear reactors [1,2,3]. C103 is a refractory alloy based on a Nb matrix with 10% Hf, 1% Ti and a mix of other elements summarized in Table 1. C103 components have traditionally been manufactured by means of powder metallurgy techniques [4] or vacuum arc melting [5]. The maturation of additive manufacturing (AM) has led to C103 components manufactured by means of laser powder bed fusion (L-PBF) [6,7,8], electron beam powder bed fusion (EB-PBF) [9], and more recently laser powder– directed energy deposition (LP-DED) [10].
LP-DED systems deposit powder through a set of angled nozzles, forming a melt pool at the focal point of the laser. Some studies have explored the use of a defocused laser for cladding applications, where a defocused laser led to changes in the clad width and penetration depth [11]. These deposition systems can be mounted on a gantry with five-axis control or on a robotic arm, both allowing for free-form fabrication. The large build volumes achievable through this technology, coupled with feature resolutions of up to 1 mm, make it an attractive solution for the manufacturing of large structures often not possible with other AM technologies.

Table 1.
Nominal composition of C103 per ASTM B655, Reprinted from Ref. [12].
Table 1.
Nominal composition of C103 per ASTM B655, Reprinted from Ref. [12].
| Element | Nb | Hf | Ti | Zr | W | Ta |
|---|---|---|---|---|---|---|
| % | Bal. | 9.0–11.0 | 0.7–1.3 | <0.7 | <0.5 | <0.5 |
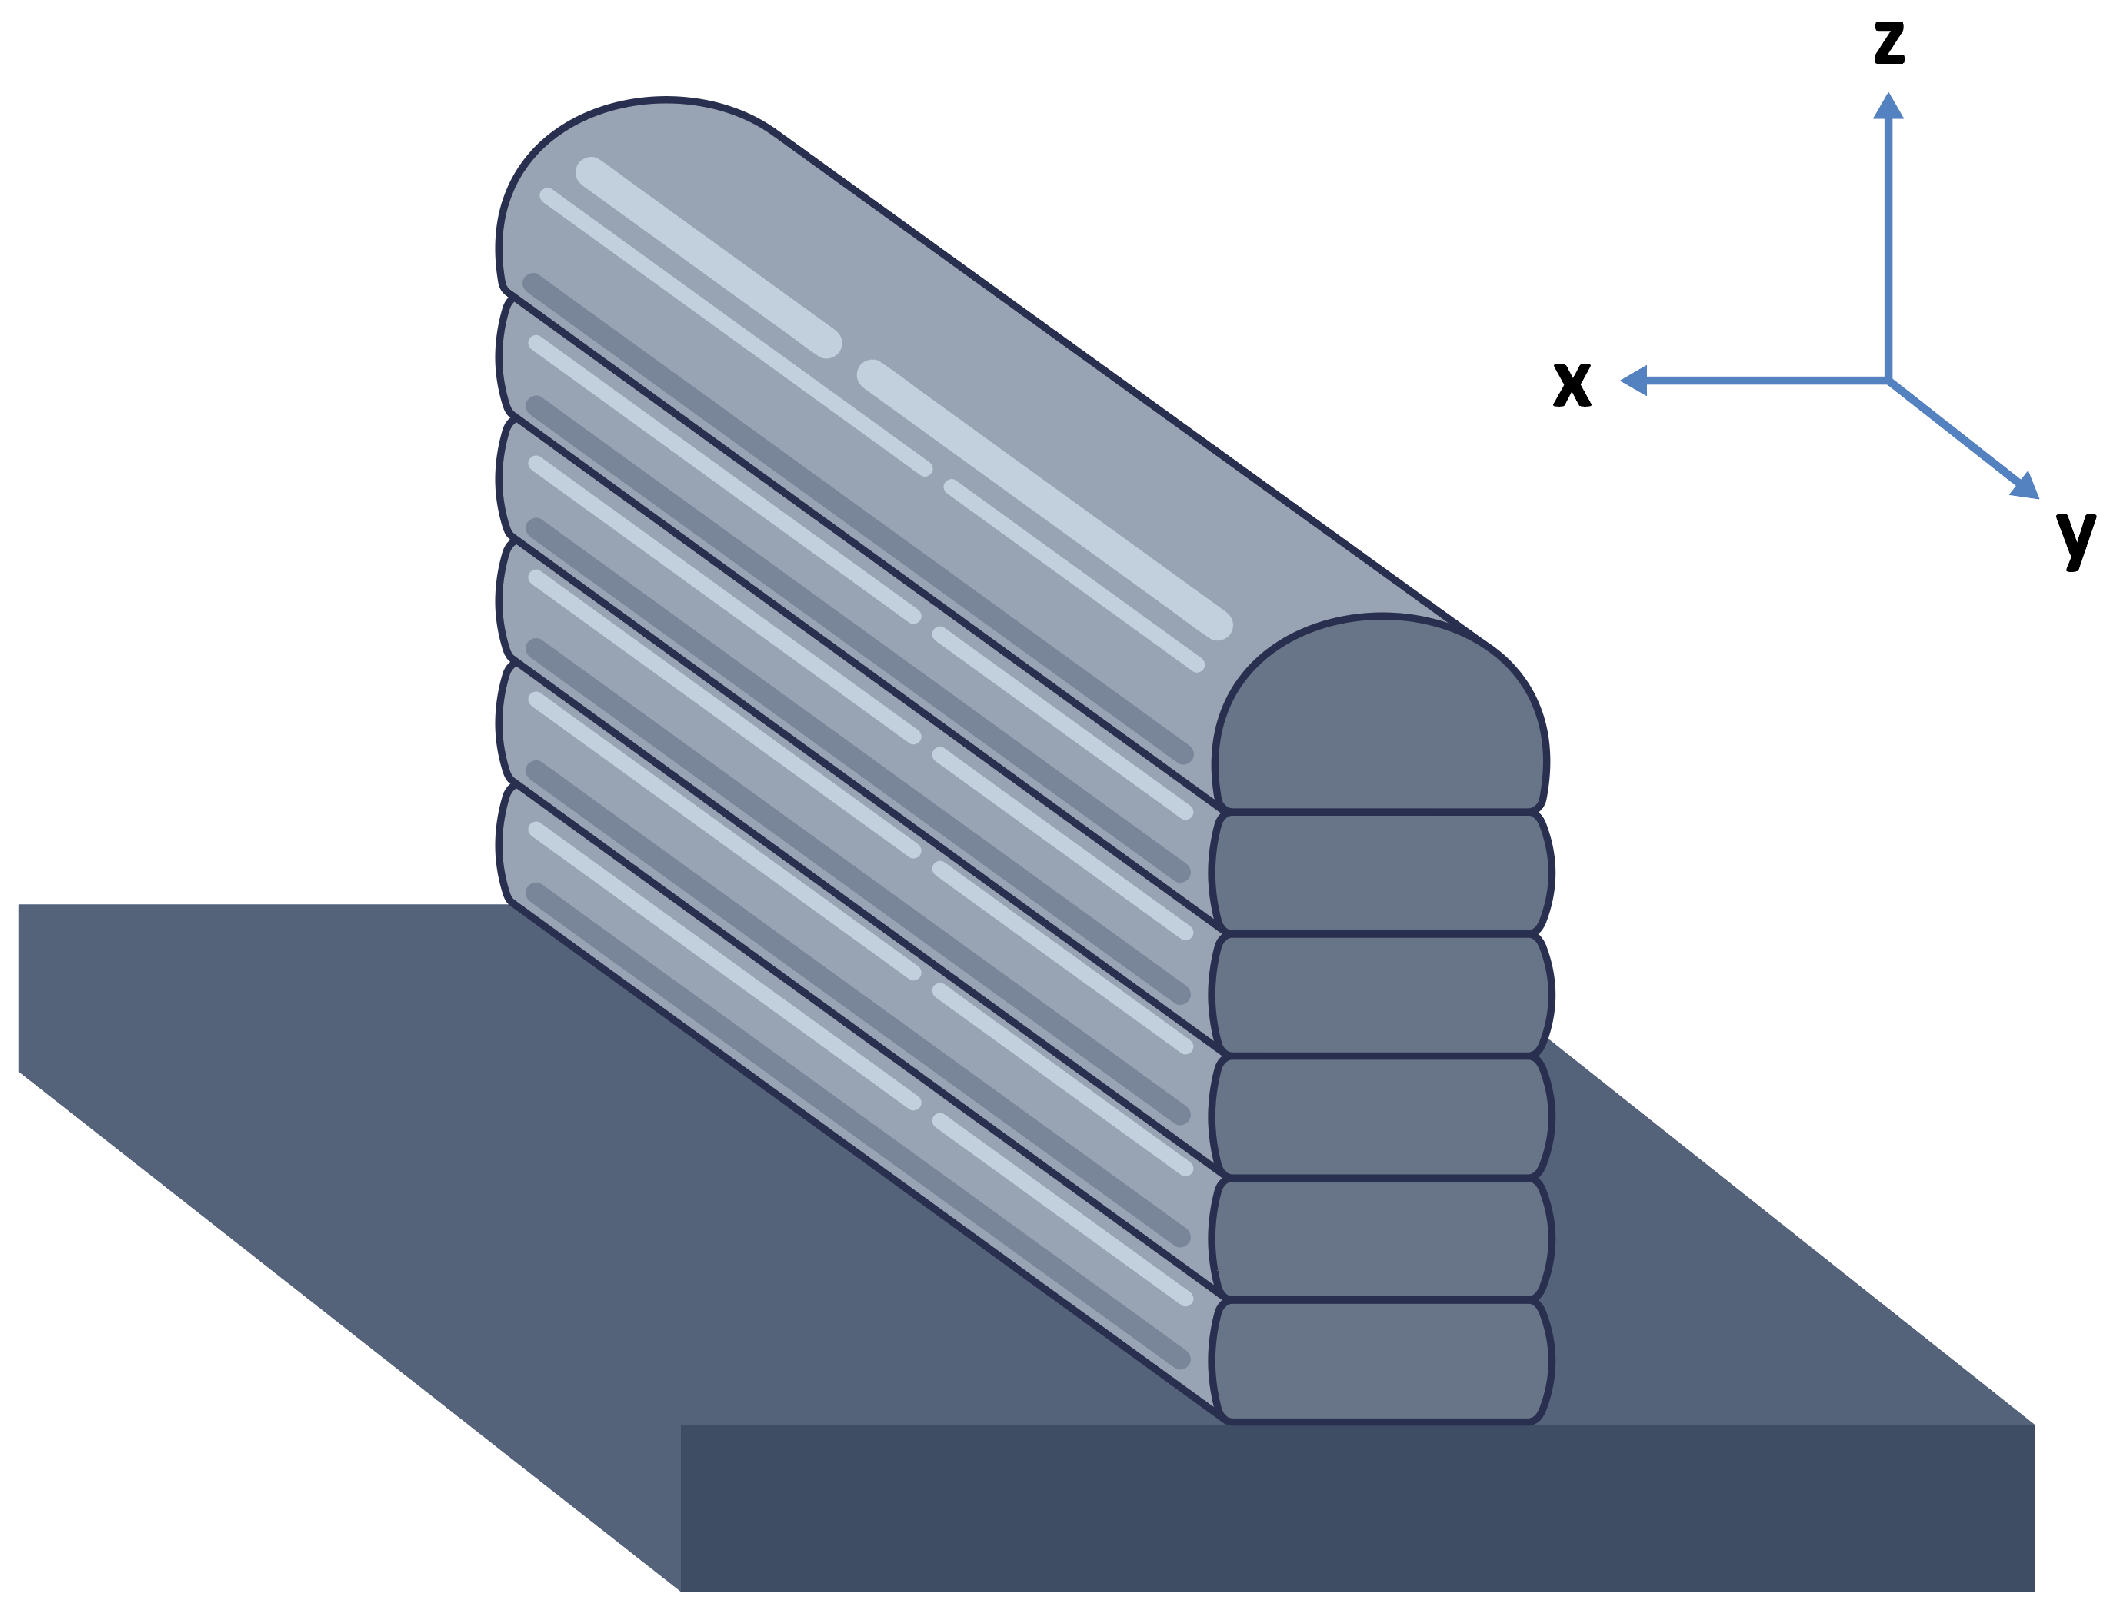
In this work, thin-wall structures are defined as those that are built by the deposition of a single bead that does not overlap for a given layer throughout the build as shown in Figure 1. Thin-wall structures define the minimum feature resolution achievable in LP-DED and are commonly found in propulsion systems. For example, NASA MSFC has developed a series of regeneratively cooled nozzles, where thin walls are used to construct the internal cooling channels [13,14,15].
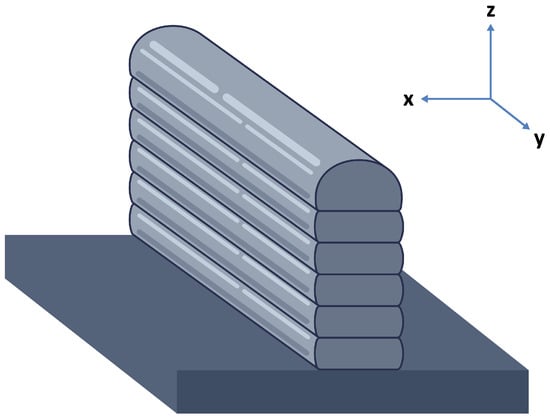
Figure 1.
Graphical representation of a thin-wall structure produced with LP-DED.
Thin-wall structures are unique in comparison to bulk (containing hatch and contour scanning strategies) LP-DED components and therefore require dedicated study. Due to the deposition strategies used for thin walls, remelt and solidification is confined to the layer–layer interface. This in turn creates a distinct thermal profile and cooling rate, driving a very specific microstructure. This has been characterized for LP-DED C103 by the author’s previous work [10], in which they show grain size variation throughout the thickness of the part. Finally, size effects on the mechanical properties must be accounted for during the design and analysis phase, as several studies have shown a decrease in mechanical properties when compared to bulk features [16,17,18].
Interest in these features has led to in-depth studies for several material systems manufactured with LP-DED. For example, Ali et al. [19] investigated the effects of different scanning strategies as a function of laser power for LP-DED 316L. They found that the bidirectional scan strategy produced uniform geometries while the unidirectional showed a negative slope in the opposite direction of the scan. Mueller et al. [20] studied the effects of laser power and deposition speed on the microstructure and geometry of Inconel 718, reporting that the primary dendritic arm spacing decreased as the deposition speed increased. They also found that varying the scanning speed changed the overall size of the weld bead, requiring adjustments in the mass flow rate and laser power to achieve similar weld bead geometries. Finally, Demeneghi et al. [21] performed an in-depth study on the microstructure and mechanical properties of GRCop-42 thin walls at varying wall sizes, i.e., thicknesses. Their results showed that the microstructure was independent of thickness while the elongation was higher for thicker specimens.
At the time of writing, no publicly available data have been published regarding the mechanical behavior of C103 thin-wall structures produced with LP-DED. The work presented here aims to address this gap by systematically evaluating the mechanical properties under relevant environments. An understanding of the strength under quasi-static loading as compared to traditionally wrought C103 is vital for the adoption of this material–process combination. Due to reported anisotropic behavior of AM materials [22], the effects of build orientation on the strength and ductility are investigated. Propulsion components experience high strains that are fully reversible during engine operations, prompting a need to evaluate the low cycle fatigue (LCF) behavior and develop an understanding of the fracture propagation during cyclic loading.
2. Materials and Methods
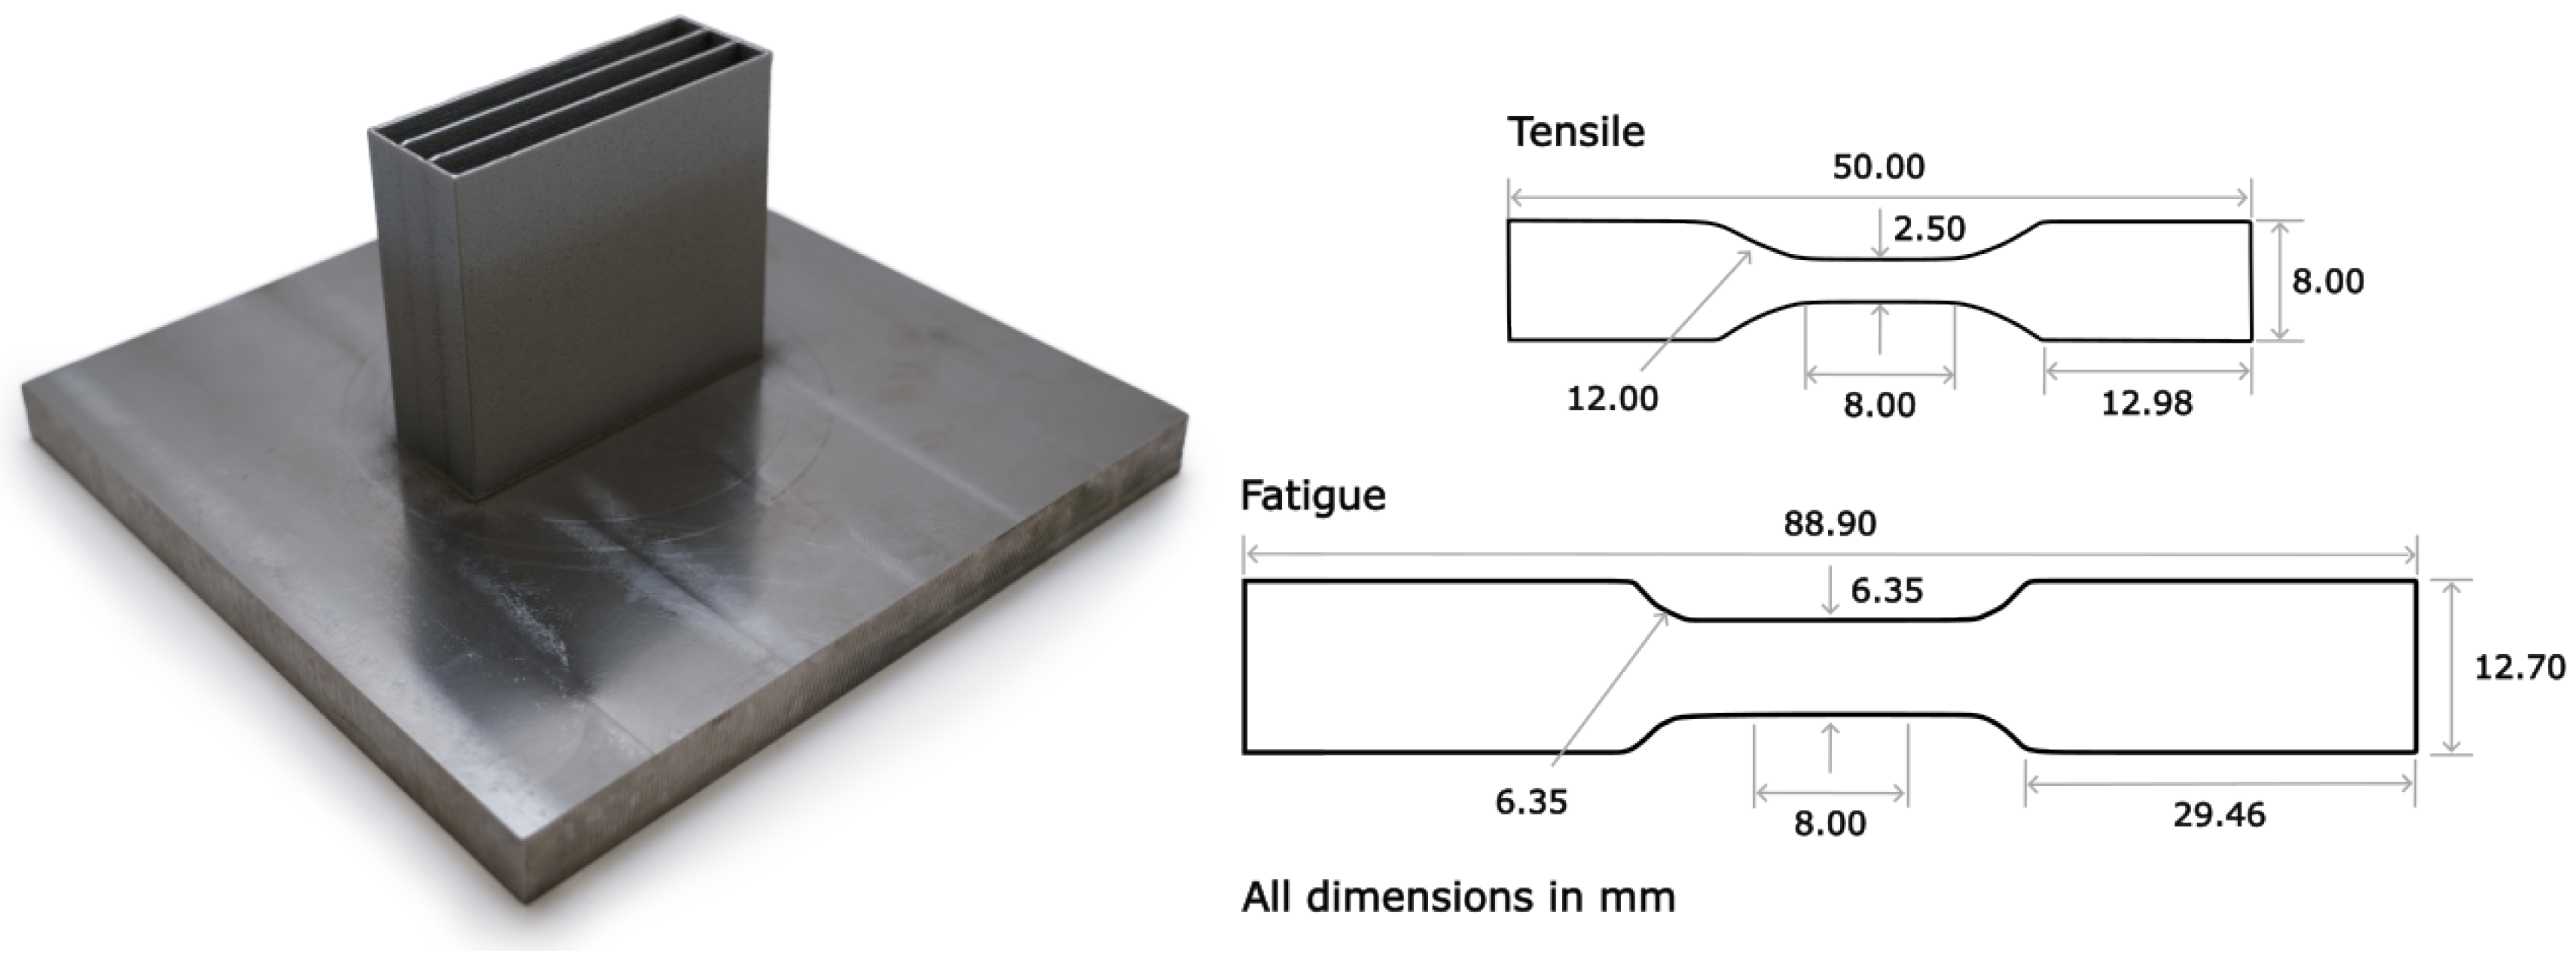
Thin-walled structures were printed using an RPMI 222XR LP-DED (Rapid City, SD, USA) platform with plasma atomized C103 powder. The powder size distribution (PSD) was measured with a Camsizer X2 (York, PA, USA), resulting in an average d10, d50, and d90 of 64 μm, 82 μm, and 120 μm, respectively. The system utilizes a 2 kW 1070 nm IPG fiber laser, with an optics system capable of achieving spot sizes that range between 0.5 mm and 3.5 mm. Recirculating Ar gas was used to create an inert environment within the build chamber, resulting in oxygen levels below 10 ppm during the print process. An alternating back and forth deposition strategy was used to print a box-like geometry as shown in Figure 2. Each box contains a total of four central panels and two side panels, measuring 101.6 mm × 114.3 mm and 101.6 mm × 50.8 mm, respectively. The collection of intersecting panels was selected to provide support and prevent the warping of the high aspect ratio thin walls.
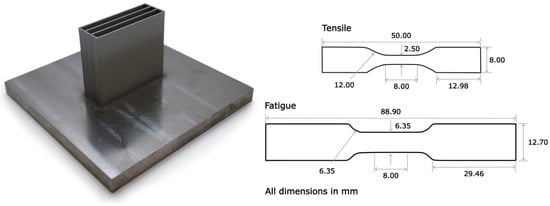
Figure 2.
Printed geometry for mechanical characterization of LP-DED C103. Dimensions are shown for tensile and fatigue specimens.
The parameters used during the printing process, summarized in Table 2, are based on previous work by the authors discussed in detail here [10]. LP-DED is capable of producing features as small as 1 mm when using the appropriate process parameters [23]. In this work, a thickness of 2 mm was selected to minimize the potential build failures experienced when using high-energy density parameters. In these scenarios, the lack of sufficient material to act as an effective heat sink leads to part burnout and distortion [24].
Table 2.
Print process parameters.
Both C103 and pure Nb plates were considered for use as the build substrate during this work. However, due to the high cost of these materials, a 25.4 mm Ti-6Al-4V plate was selected. Errico et al. [25] showed that cross contamination typically occurs in the first layer when depositing on dissimilar materials. To avoid these contamination issues from the build plate, 2 mm of sacrificial material was added at the beginning of each print, which were then discarded during part removal from the plate.
Wire electrical discharge machining (EDM) was used to cut a variety of specimens from the central panels for tensile and fatigue testing as shown in Figure 2. Tensile specimens were based on modified ASTM E8 [26] dimensions and were cut both parallel and perpendicular to the build direction. Fatigue specimens were based on ASTM E606-21 [27].
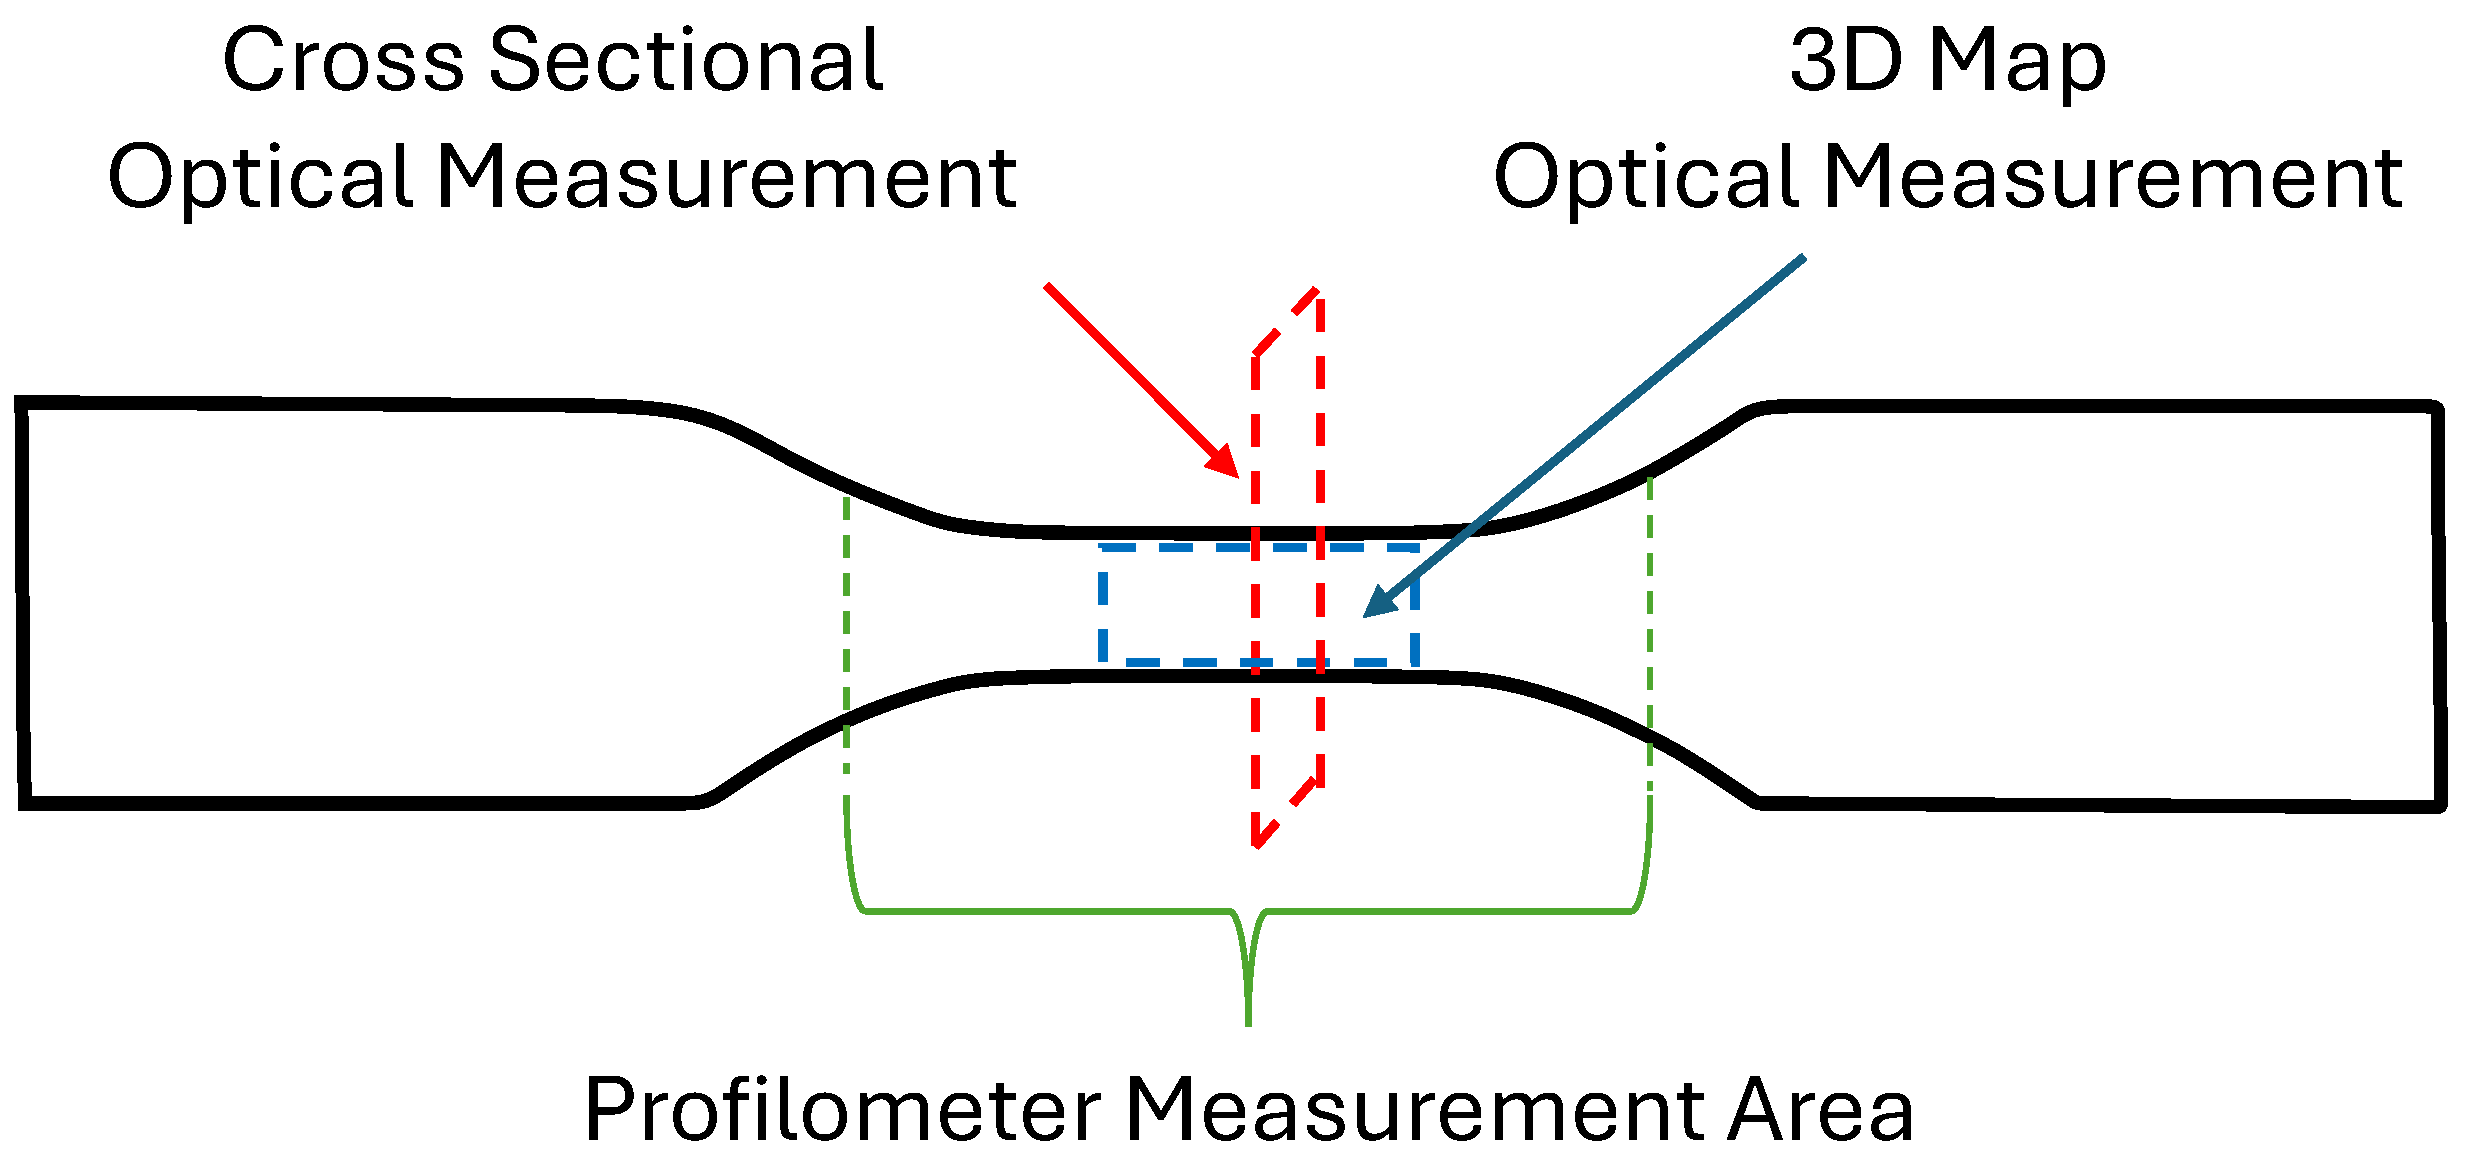
2.1. Surface Topography
Contact-based profilometry and digital microscopy were used to generate roughness profiles and 3D maps, respectively, by following the work outlined by Díaz [28]. A MarSurf XR 20 surface profiler generated surface profiles by tracing 17.5 mm along the gauge section with a sampling length of 2.5 mm. From the trace, 12.5 mm were evaluated by removing one sampling length at the beginning and end, resulting in a total of five sampling lengths. From the roughness profiles, the arithmetical mean height (Ra), maximum peak height (Rp), maximum pit height (Rv), and maximum height (Rz) were quantified. The 3D maps provided the surface area profile and the corresponding parameters (Sa, Sp, Sv, and Sz).
2.2. Heat Treatment
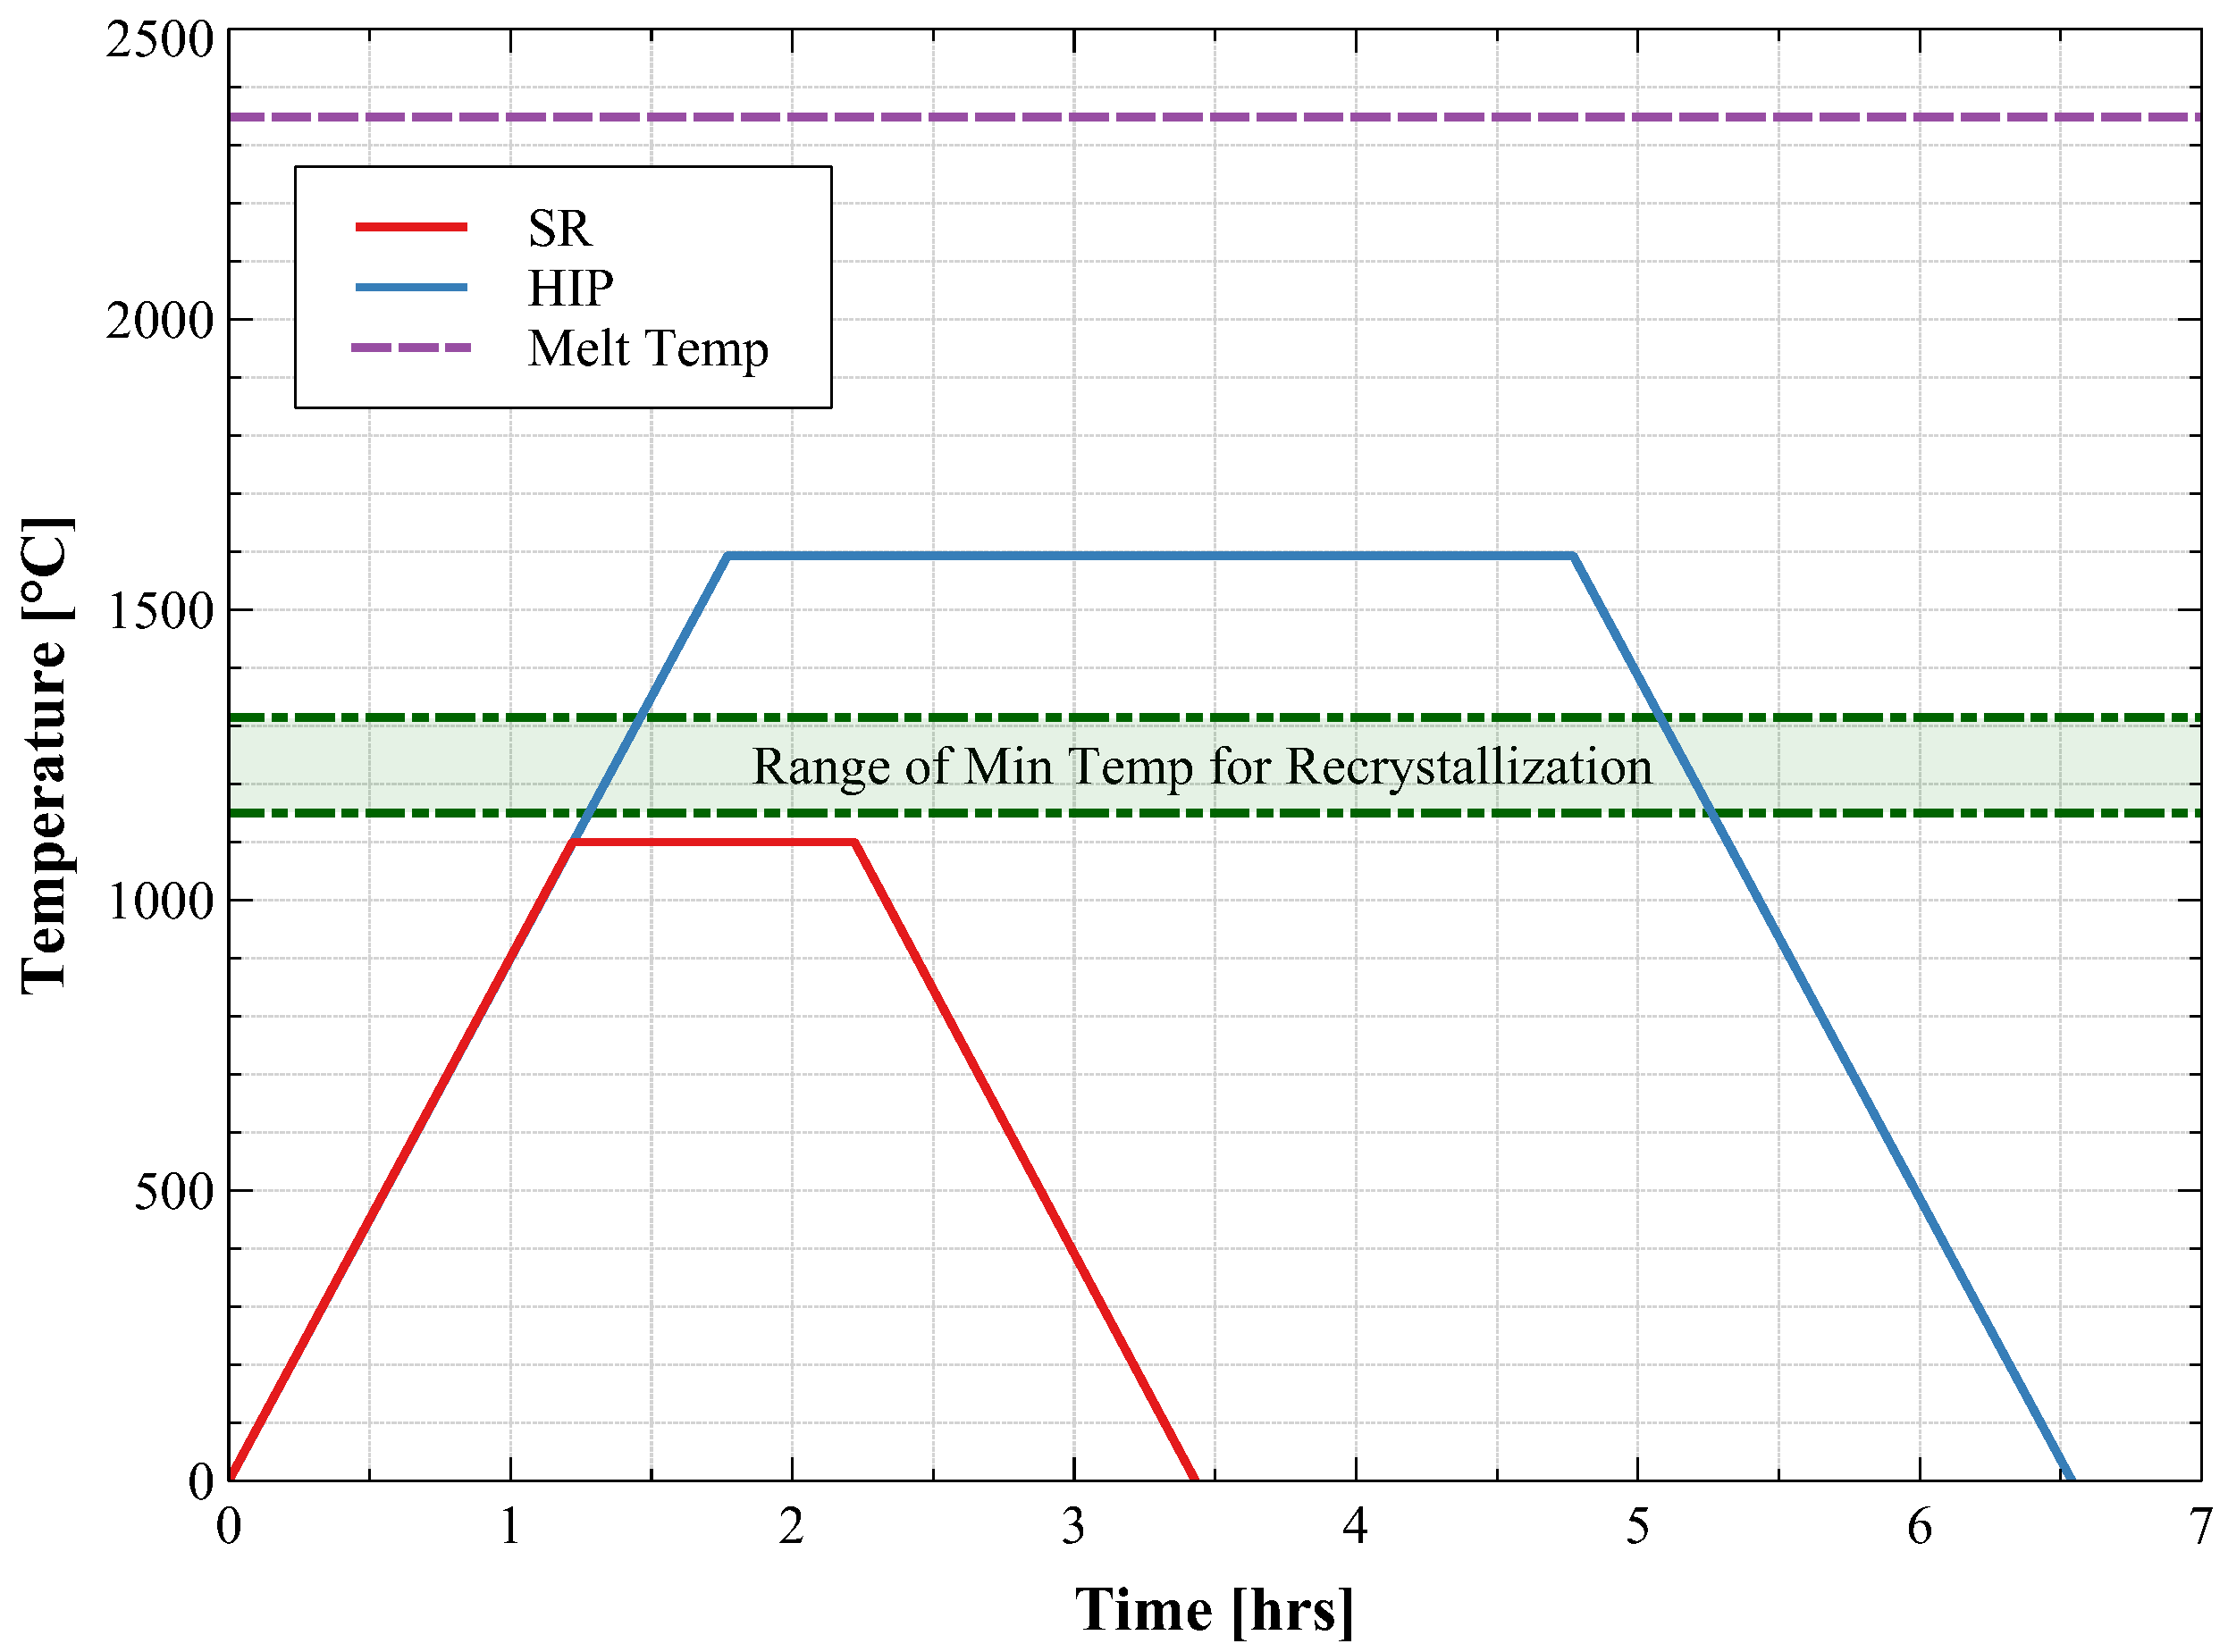
The effects of two heat treatment cycles, shown graphically in Figure 3, were explored in this work. The selected cycles are based on previous NASA work [6] which investigated C103 printed via L-PBF. Applying the same heat treatment cycles ensures that the results are representative of differences due to the printing process. The development of a specific heat treatment cycle for LP-DED C103 is strongly suggested for future work.
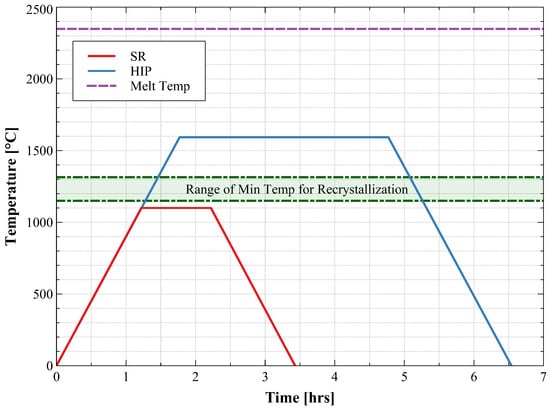
Figure 3.
SR cycle at 1100 °C for 1 h. HIP cycle at 1560 °C and 103.4 MPa for 3 h.
For all heat treatment cycles, the samples were wrapped in Ta foil to help minimize the chance of oxidation. The printed components underwent vacuum stress relief at 1100 °C for 1 h while still on the build plate. This approach is used to prevent part distortion during build plate removal due to the high residual stresses. A separate box in the as-built condition was cut from the build plate and subjected to a hot isostatic press (HIP) schedule at 1560 °C and 150 MPa for 3 h based on a HIP cycle by Wadsworth [4]. HIP is commonly used as a part of heat treatment schedules for a variety of AM alloys. A more comprehensive list can be found in the following reference [29].
2.3. Tensile Testing
Room temperature tensile testing was performed on an Instron 68TM-5 with a 5 kN load cell at a 0.02 mm/s crosshead displacement rate. Due to the small size of the specimens, digital image correlation (DIC) was used to capture the strain measurements. A stochastic spot pattern was created on the gauge section of the specimens by using aerosol spray paint to apply a white base and black speckle pattern. A Flir Grasshopper3 camera with a 100 mm macro lens was used to collect images at a rate of 1 Hz. Specimens were tested in the AB, SR, and HIP heat-treated conditions. Two build orientations were tested for each heat treatment condition, parallel to the build direction (vertical) and perpendicular to the build direction (horizontal). A total of three specimens were tested for each combination of heat treatment and orientations. Fractography was performed on the samples with a Keyence VHX-7000 (Osaka, Japan) digital microscope and a Hitachi S-3700N (Tokyo, Japan) scanning electron microscope (SEM) at 15 kV, 60 mA probe current, and a 9 to 10 mm working distance.
2.4. Fatigue Testing
LCF testing was performed per ASTM E606-21 [27] for samples in the SR heat treated condition. Testing was performed at room temperature on an MTS 810 test frame. The tests were carried out in strain control mode with a strain ratio of R = 0.1, frequency of 0.50 Hz, and a triangular waveform. Runout was defined at 50,000 cycles. Three samples per level were tested for strain levels of 2%, 1% and 0.5% in order to draw comparisons with the previous thin-wall LCF testing found in the literature [15,29]. Due to the high cost of powder and limited print time, fatigue specimens were only tested in the vertical orientation. In-depth characterization of fatigue specimens in the horizontal orientation is strongly recommended for future work. Fractography was performed following the same method outlined in Section 2.3.
3. Results and Discussion
3.1. Surface Topography
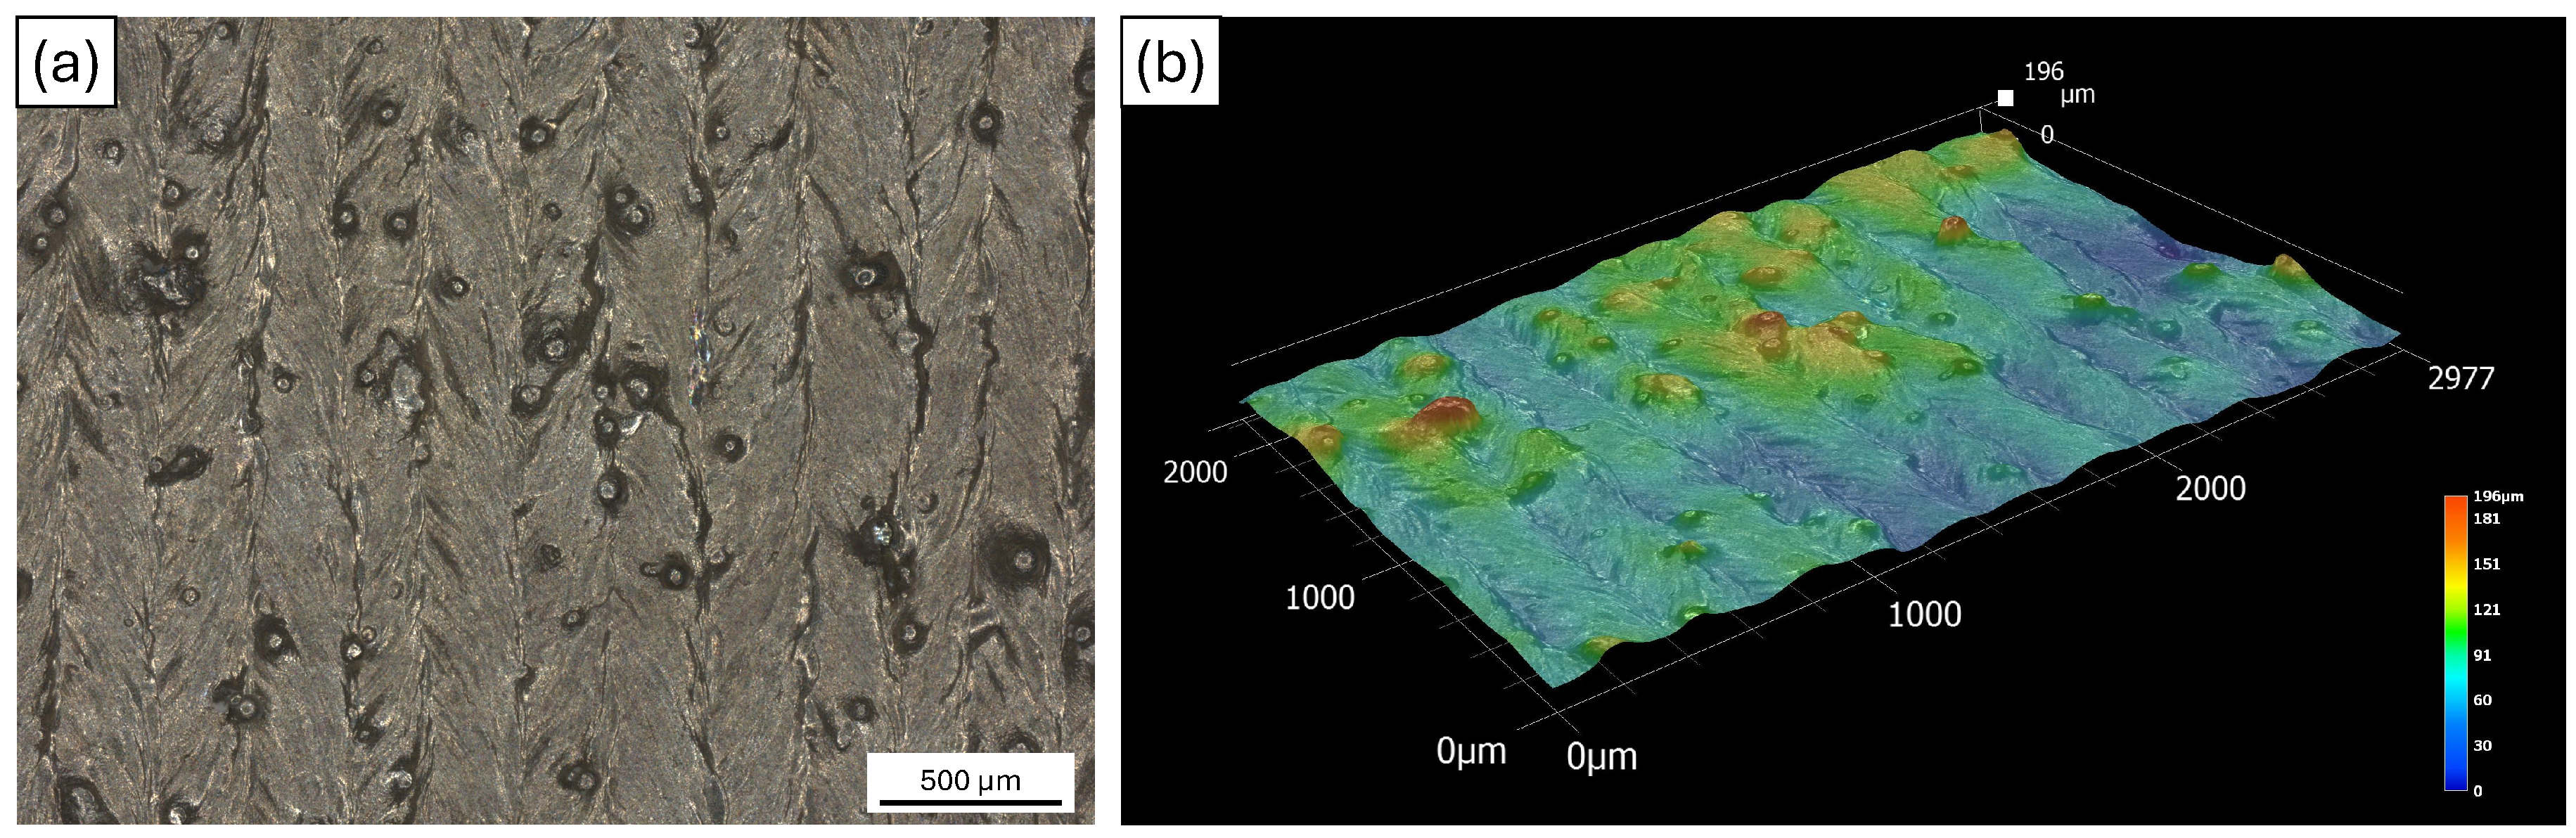
The surface roughness of three tensile specimens were measured, using both techniques described in Section 2.1 as shown in Figure 4. The results are summarized in Table 3. Figure 5a shows the optical image of the measured area, with the resulting 3D map in Figure 5b.
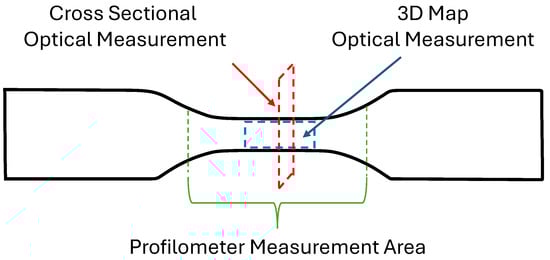
Figure 4.
Location of surface topography measurements and inspection of the cross-sectional area.
Table 3.
Average values of measured surface roughness parameters.
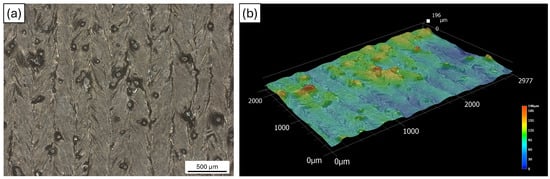
Figure 5.
Surface topography results for the following: (a) Optical image of the sampled region along the gauge section. (b) The 3D height map from the collected optical data.
A difference in the maximum peak height (Sp vs. Rp) measurements can be clearly observed, with a difference of 48%. This is due to the nature of the measurements, where the Rp evaluates along a line, and Sp evaluates a given area. The increase in scanning area leads to a higher probability of detecting larger peaks. Furthermore, the contact profilometer is limited by the size of the probe, whereas the digital microscope can detect smaller features, adding to the depth of the measurement, further shifting the peak value.
Demeneghi et al. [17] reported measured the surface roughness of L-PBF GRCop-42 thin wall specimens that ranged from 0.7 mm to 2 mm in size. Sa and Sq values ranged from 12.6 μm to 21.94 μm and 16.09 μm to 28.67 μm respectively. Mireles et al. [6] reported Sa as a function of angle for bulk L-PBF C103 specimens. As expected, the L-PBF C103 samples had a lower Sa value than the LP-DED ones reported in this work. Gradl et al. [30] performed a large design of experiments (DOE) to investigate the effects of print parameters on the surface roughness of LP-DED NASA HR-1 thin-wall features. They reported that finer powder sizes are more sensitive to changes in the build parameters compared to more coarse powder. Overall, the reported surface roughness parameters in this work follow the expected trends and values from the previous works just described.
3.2. Tensile Testing
The tensile specimens in this work were tested in the as-printed surface condition. While several post-processing approaches have been studied to reduce the surface roughness of AM components [31], the goal of this work was to establish the baseline behavior as several applications make use of components in the as-printed surface condition [32,33]. Due to the inherent high surface roughness of AM components, the load bearing area cannot be accurately determined with traditional measuring tools such as calipers. Major discrepancies in mechanical properties due to measurements overestimating the cross-sectional area have been reported in detail by Tilson et al. [34] for L-PBF thin walls. The overly conservative values reported when using calipers, coupled with the required safety factors applied during the design process, can result in over-designed structures that increase the mass and cost [35].
Several studies have proposed unique approaches to solve this problem. Demeneghi et al. [17] used optical microscopy on a sectioned sample along the gauge section to digitally calculate the area. Their results showed that caliper measurements overestimated the area by up to 29%. In another study by Demeneghi et al. [21], the authors scanned specimens with microcomputed tomography () to establish a base value. They then calculated the area by subtracting the Sp value from the caliper-based measurements, which resulted in a difference of 0.38% from the value. Margerit et al. [36] proposed an analytical solution to estimate the effective thickness of thin-wall structures based on the periodicity of the surface roughness. Yu et al. [37] showed that Rp and Rv values are both adequate parameters to subtract from the caliper measurements to establish a calibrated cross-sectional area.
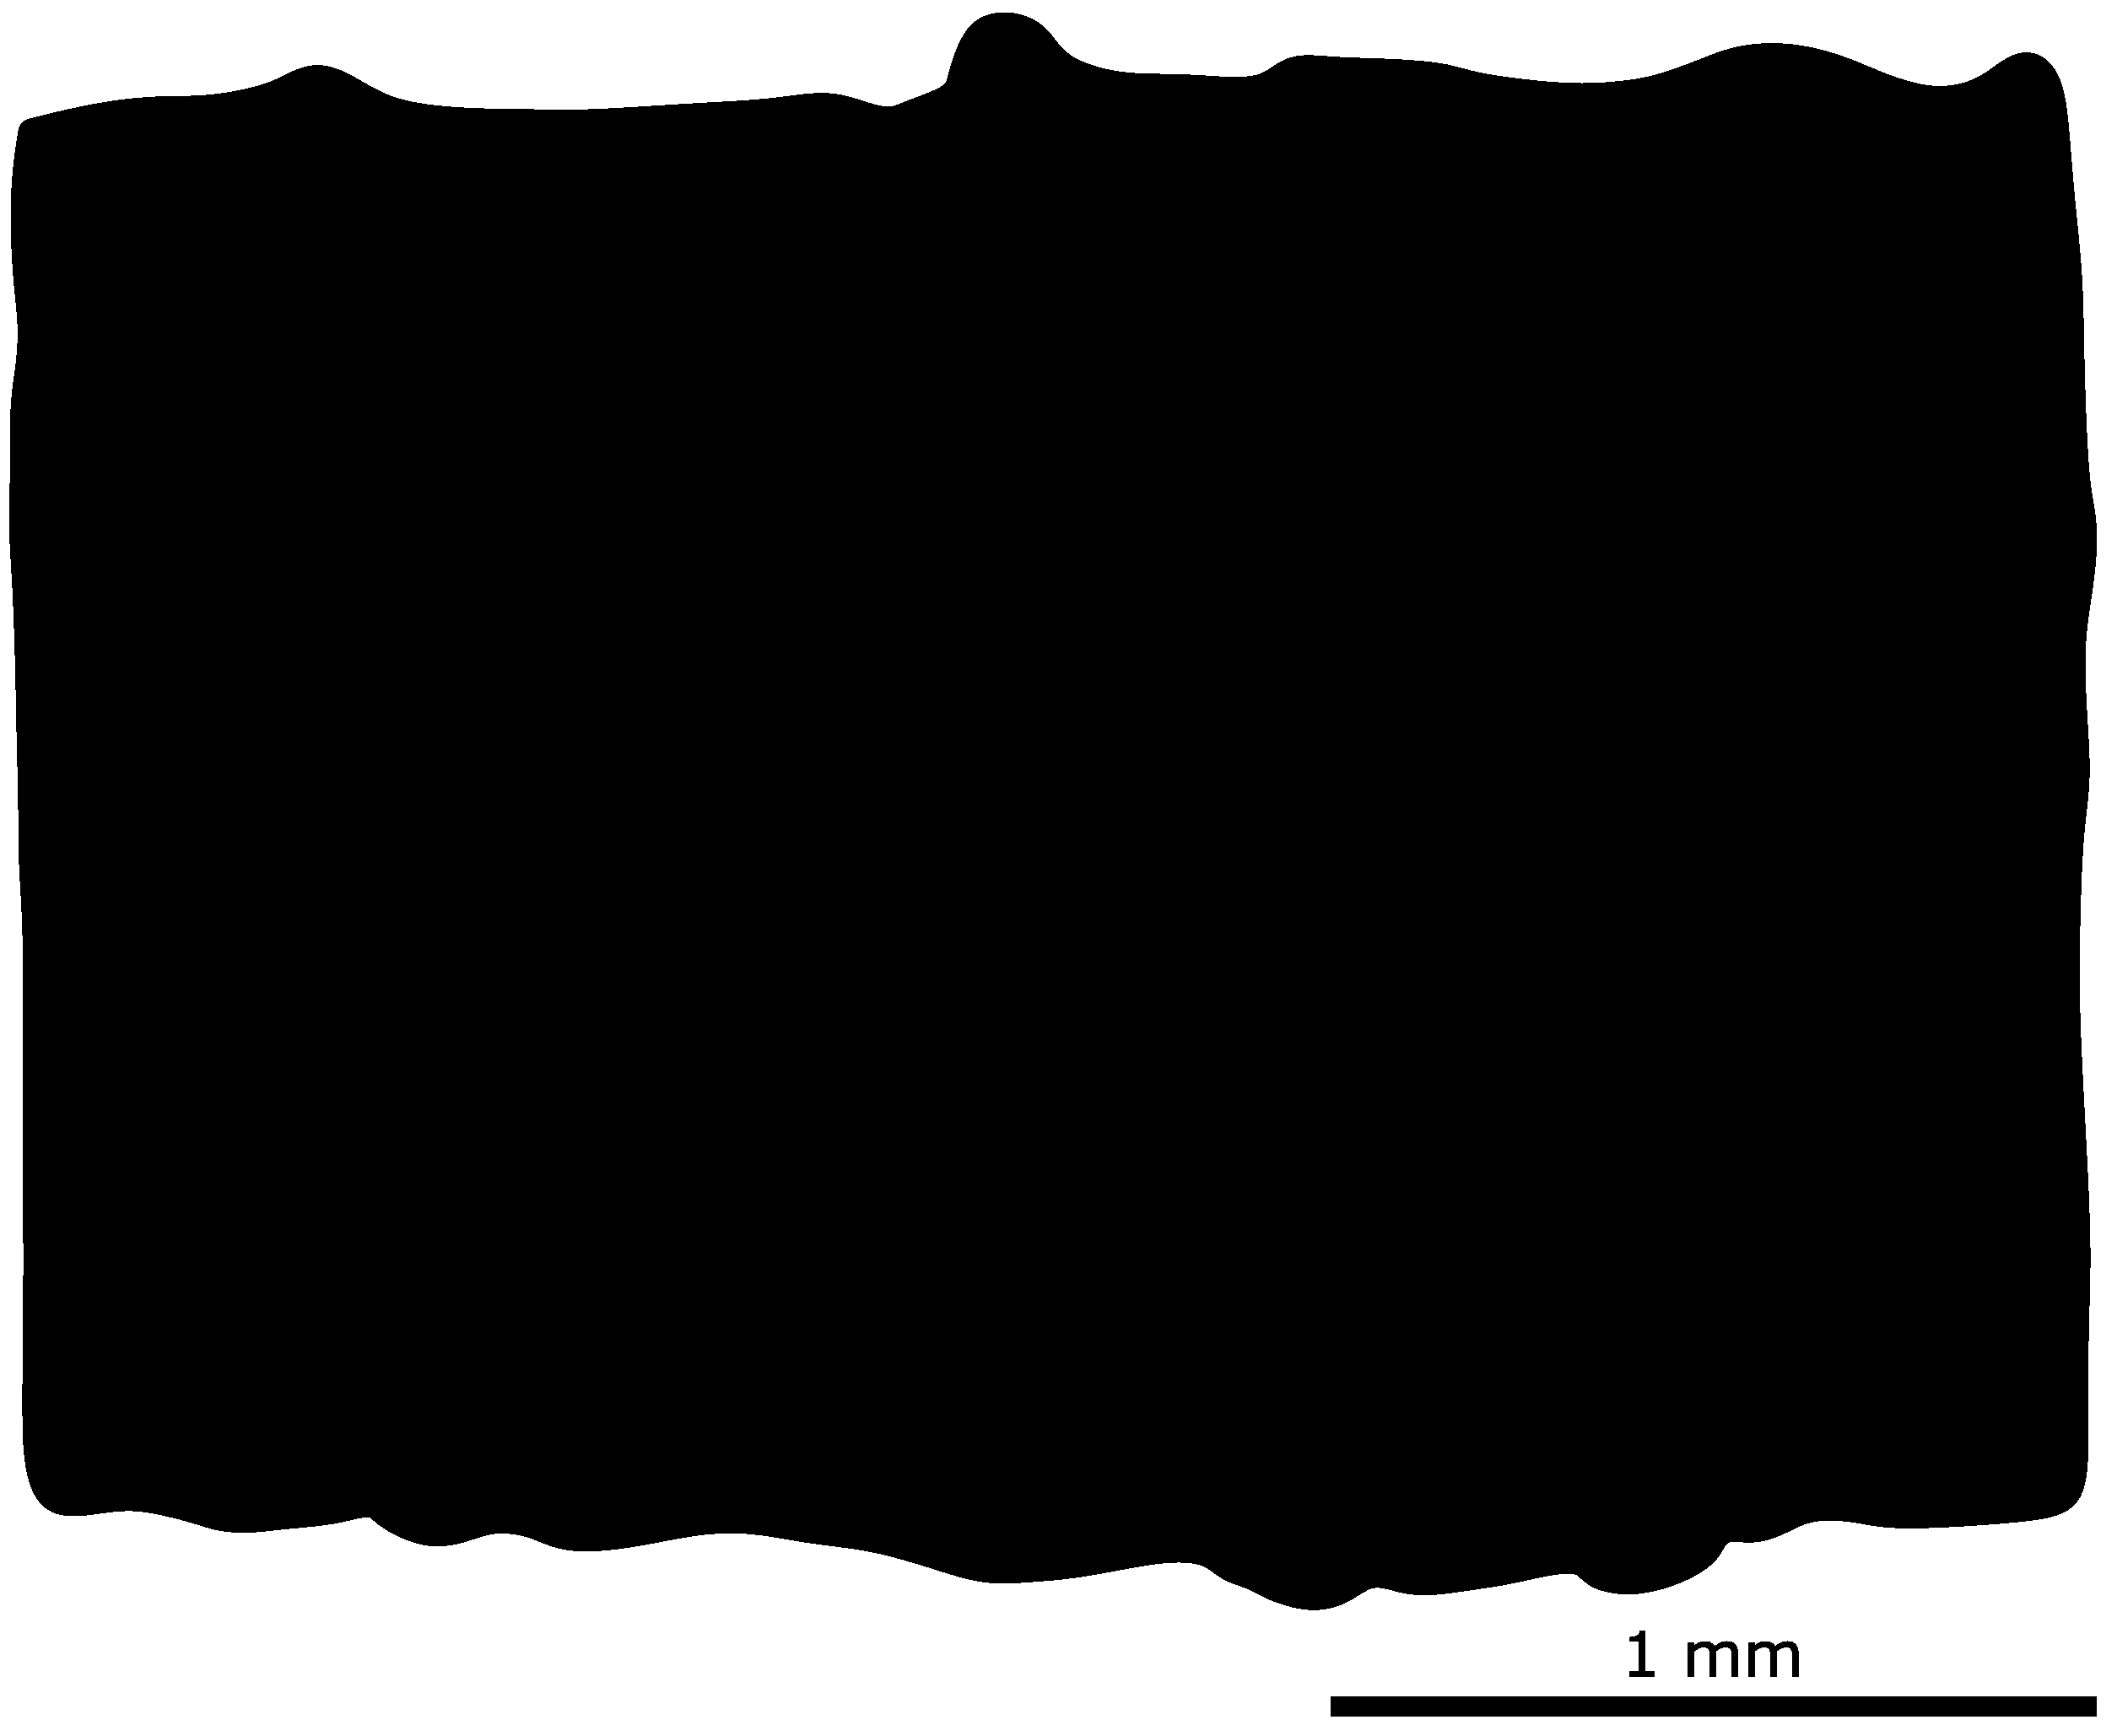
To expand on these previous works, this study evaluated the use of the collected surface roughness profile parameters in Table 3. To establish a baseline comparison, three additional specimens were sectioned at the center of the gauge section, as shown in Figure 4, and polished to obtain an outline of the cross section. ImageJ 1.53t [38] was used to determine the area from the optical cross sections as shown in Figure 6. The average value of the optical cross sections was 4.92 ± 0.10 μm2.

Figure 6.
Cross-sectional area from optical image.
The adjusted area was then calculated according to Equation (1), where A is the area, w is the gauge width, is the caliper-measured thickness value, and is the surface roughness parameter of choice:
Of the line profile parameters, the Rp value resulted in the closest value to the optical cross section with a 0.54% difference. For the areal surface roughness, the Sv was closest with a difference of 0.39%. These results agree with the previously discussed work from the literature and are a good indicator that the methodology is adequate for the work presented here. The calculated areas and their corresponding percent differences are summarized in Table 4.
Table 4.
Calculated area values for different measuring approaches as compared to the optical measurement.
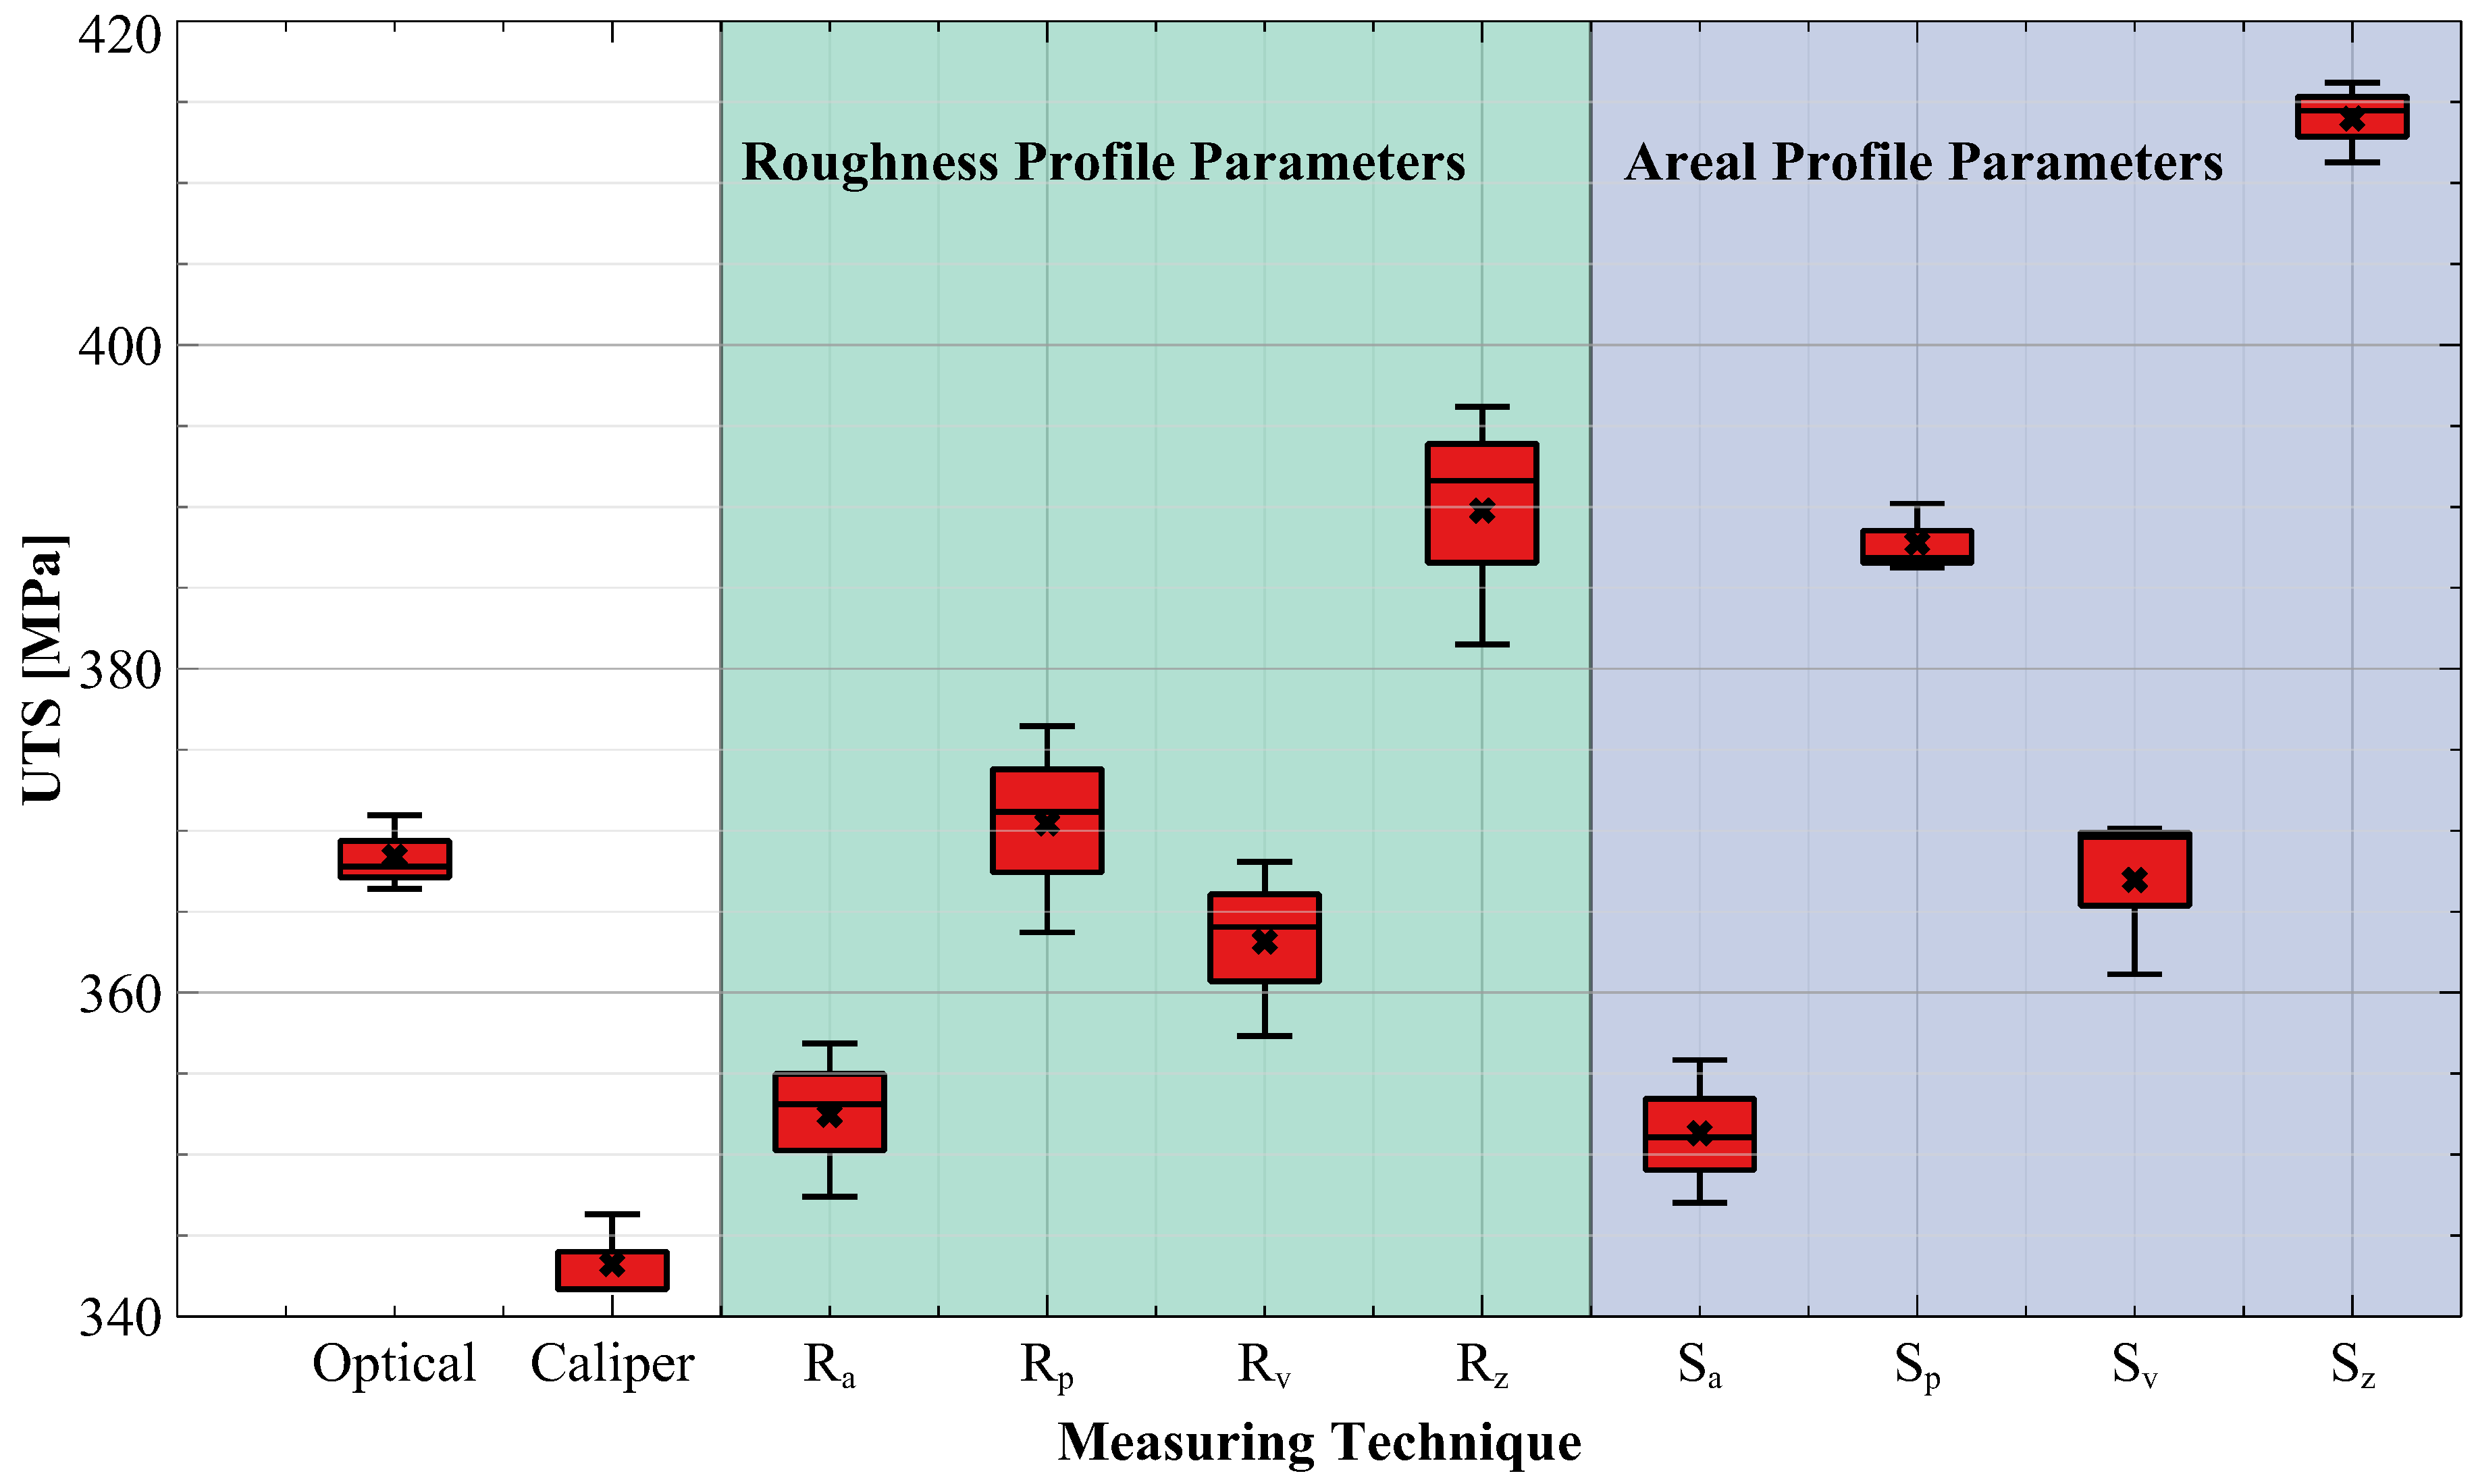
The ultimate tensile strength (UTS) was calculated for the three specimens using the estimated load bearing areas from each surface roughness parameter. The results are summarized and plotted in Figure 7. As expected, the caliper-based values are the lowest with a difference of up to 29 MPa below the strength based on the optical cross section.

Figure 7.
UTS calculated based on the different surface roughness parameters used to adjust the calculated cross-sectional area.
It is important to note that the presented approach was chosen for specimens built completely vertical, i.e., 90° to the surface of the build plate. It has been shown that components printed at an angle will have distinct surface roughness values when comparing the downskin and the upskin of the part [6,30]. Therefore, additional work is required to quantify the effect of builds at an angle on the estimates of the cross-sectional area. There is a clear need to establish a standardized method to determine the cross-sectional area of thin-wall AM components.
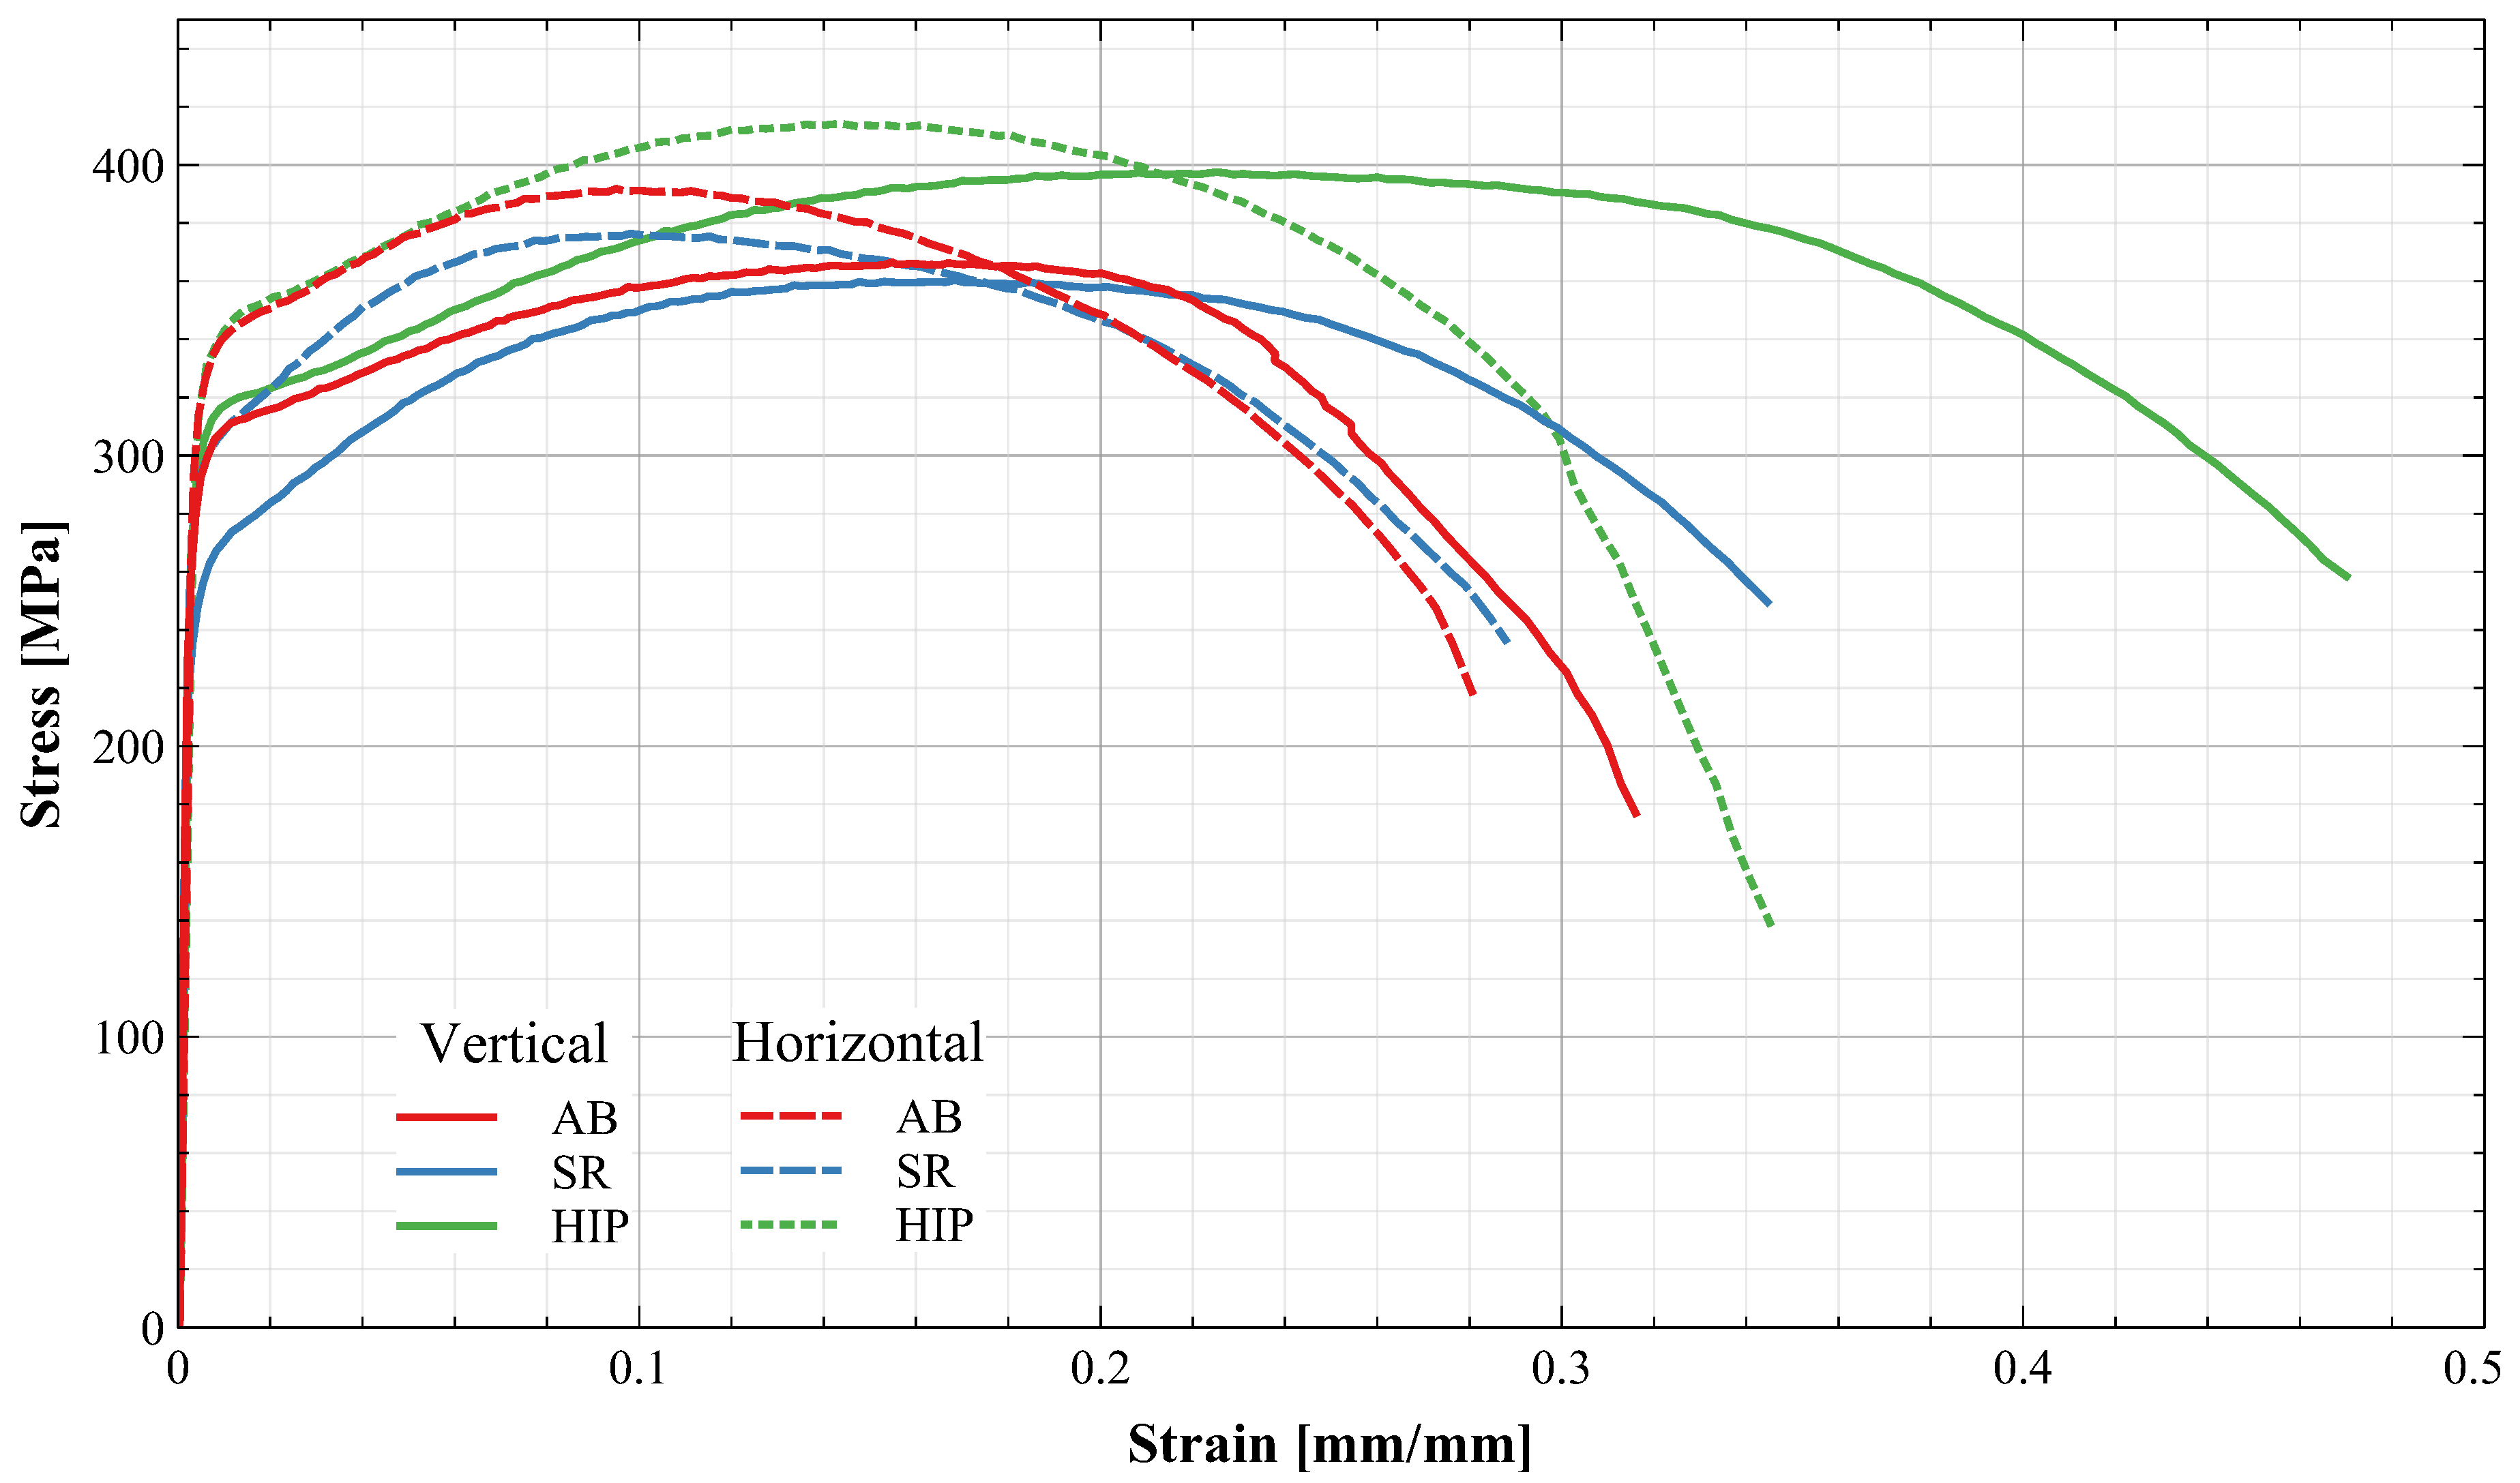
The UTS, yield strength (YS), and percent elongation (%E) are summarized in Table 5 for specimens in the vertical and horizontal orientations. The stress–strain relationship for each of these combinations is shown in Figure 8. These values were calculated with the adjusted cross-sectional area per Equation (1), with an SRP value of 67.11 ± 3.55 μm. As expected, the application of a SR heat treatment reduces strength and increases the ductility of the material in both orientations. This has been well documented across a variety of AM materials and is due to the reduction in residual stresses by the diffusion of dislocations to the grain boundaries [39,40,41,42]. Relative to the AB condition, the HIP heat treatment increased the UTS by 7.68%, the YS by 3.69%, and the %E by up to 27.83%.
Table 5.
Summary of tensile properties of heat treatment–build orientation combinations.
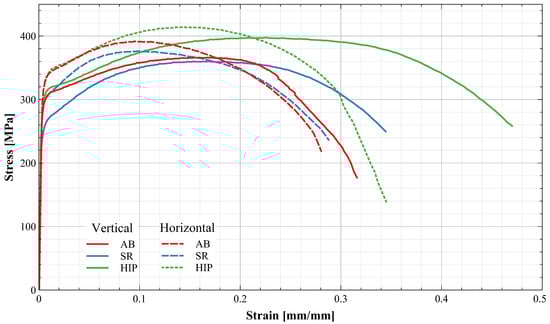
Figure 8.
Stress–strain curves for each heat treatment–build direction combination. Application of a SR cycle reduces overall properties. Application of a HIP cycle increases all properties above the initial AB condition.
The effects of build orientation on the mechanical properties are evaluated. The horizontal orientation shows a consistently higher strength across all of the applied heat treatments. Similarly, specimens in the vertical orientation have increased ductility compared to horizontal specimens. This observed anisotropy is expected due to the resulting microstructure when processing materials via LP-DED, which results in epitaxial columnar grains along the build direction [43,44]. It has been reported that specimens loaded in the direction of the epitaxial grains accumulate a larger amount of slip dislocations along the grain boundaries, ultimately leading to an increase in plastic deformation and a reduction in strength [22,44,45]. In the case of thin-wall C103 structures produced via LP-DED, the author’s previous work [10] showed clear epitaxial columnar growth along the build direction.
The resulting properties are above the specification minimums per AMS7857 [46] and ASTM B655 [12]. The LP-DED results exhibit less strength and ductility overall when compared to the wrought and powder HIP properties reported in literature [4,9]. However, the application of a HIP cycle closes this gap, which suggests that a proper heat treatment schedule may result in optimized properties that are greater than wrought.
It is important to note that the following comparisons are based on the bulk features of L-PBF and EB-PBF C103. The development and characterization of bulk feature LP-DED is required for a more complete comparison. As expected, the results from this work are below those reported for L-PBF [6]. This is attributed to the larger grain sizes in the printed LP-DED specimens. When compared to EB-PBF C103 [9], the LP-DED C103 results are superior overall.
The development and standardization of heat treatments is crucial to achieving uniform mechanical properties for any given alloy. For example, the recommended schedule for LP-DED IN718 includes SR, HIP, solution anneal (SA), and a double step aging (AGE) in that order [29]. The base heat treatment applied to most metal AM components is a SR schedule and is based on industry best practices to minimize distortion upon build plate removal [47]. Some applications require the application of a HIP schedule, such as NASA-STD-6030: Additive Manufacturing Requirements for Spaceflight Systems [48], to reduce porosity and increase fatigue life. Few heat treatments have been explored for AM C103 in general. Mireles et al. [6] explored the addition of a HIP heat treatment schedule post SR. The data showed an increase in the UTS. However, the overall properties were below those of the AB condition. Additional development by Hobbs et al. [49] investigated HIP schedules for L-PBF C103 with various temperatures, dwell times, and cooling rates. The preliminary results show a drop in strength due to the grain growth experienced during the application of the heat treatment. It is evident that there is a lot of uncertainty in the proper application of heat treatments to this alloy, specifically across several AM processes. Future work should focus on an in-depth study of the necessary heat treatments to achieve optimized mechanical properties for C103 across EB-PBF, L-PBF, and LP-DED.
3.3. Tensile Fractography
Fractography was performed on each of the heat treatment and build orientation combinations. Figure 9 shows optical images of the gauge section along the loading direction of all the tested combinations.
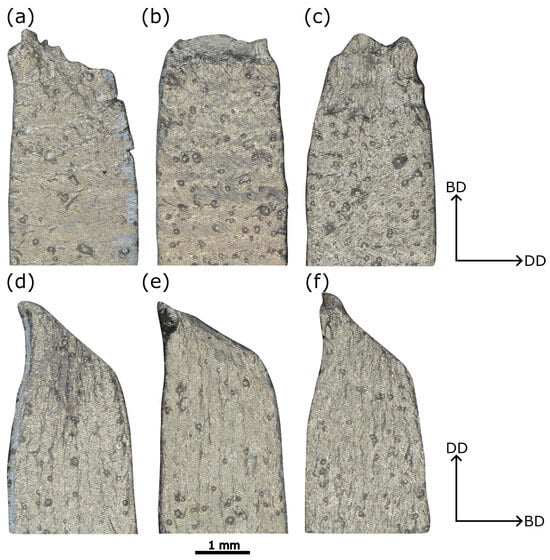
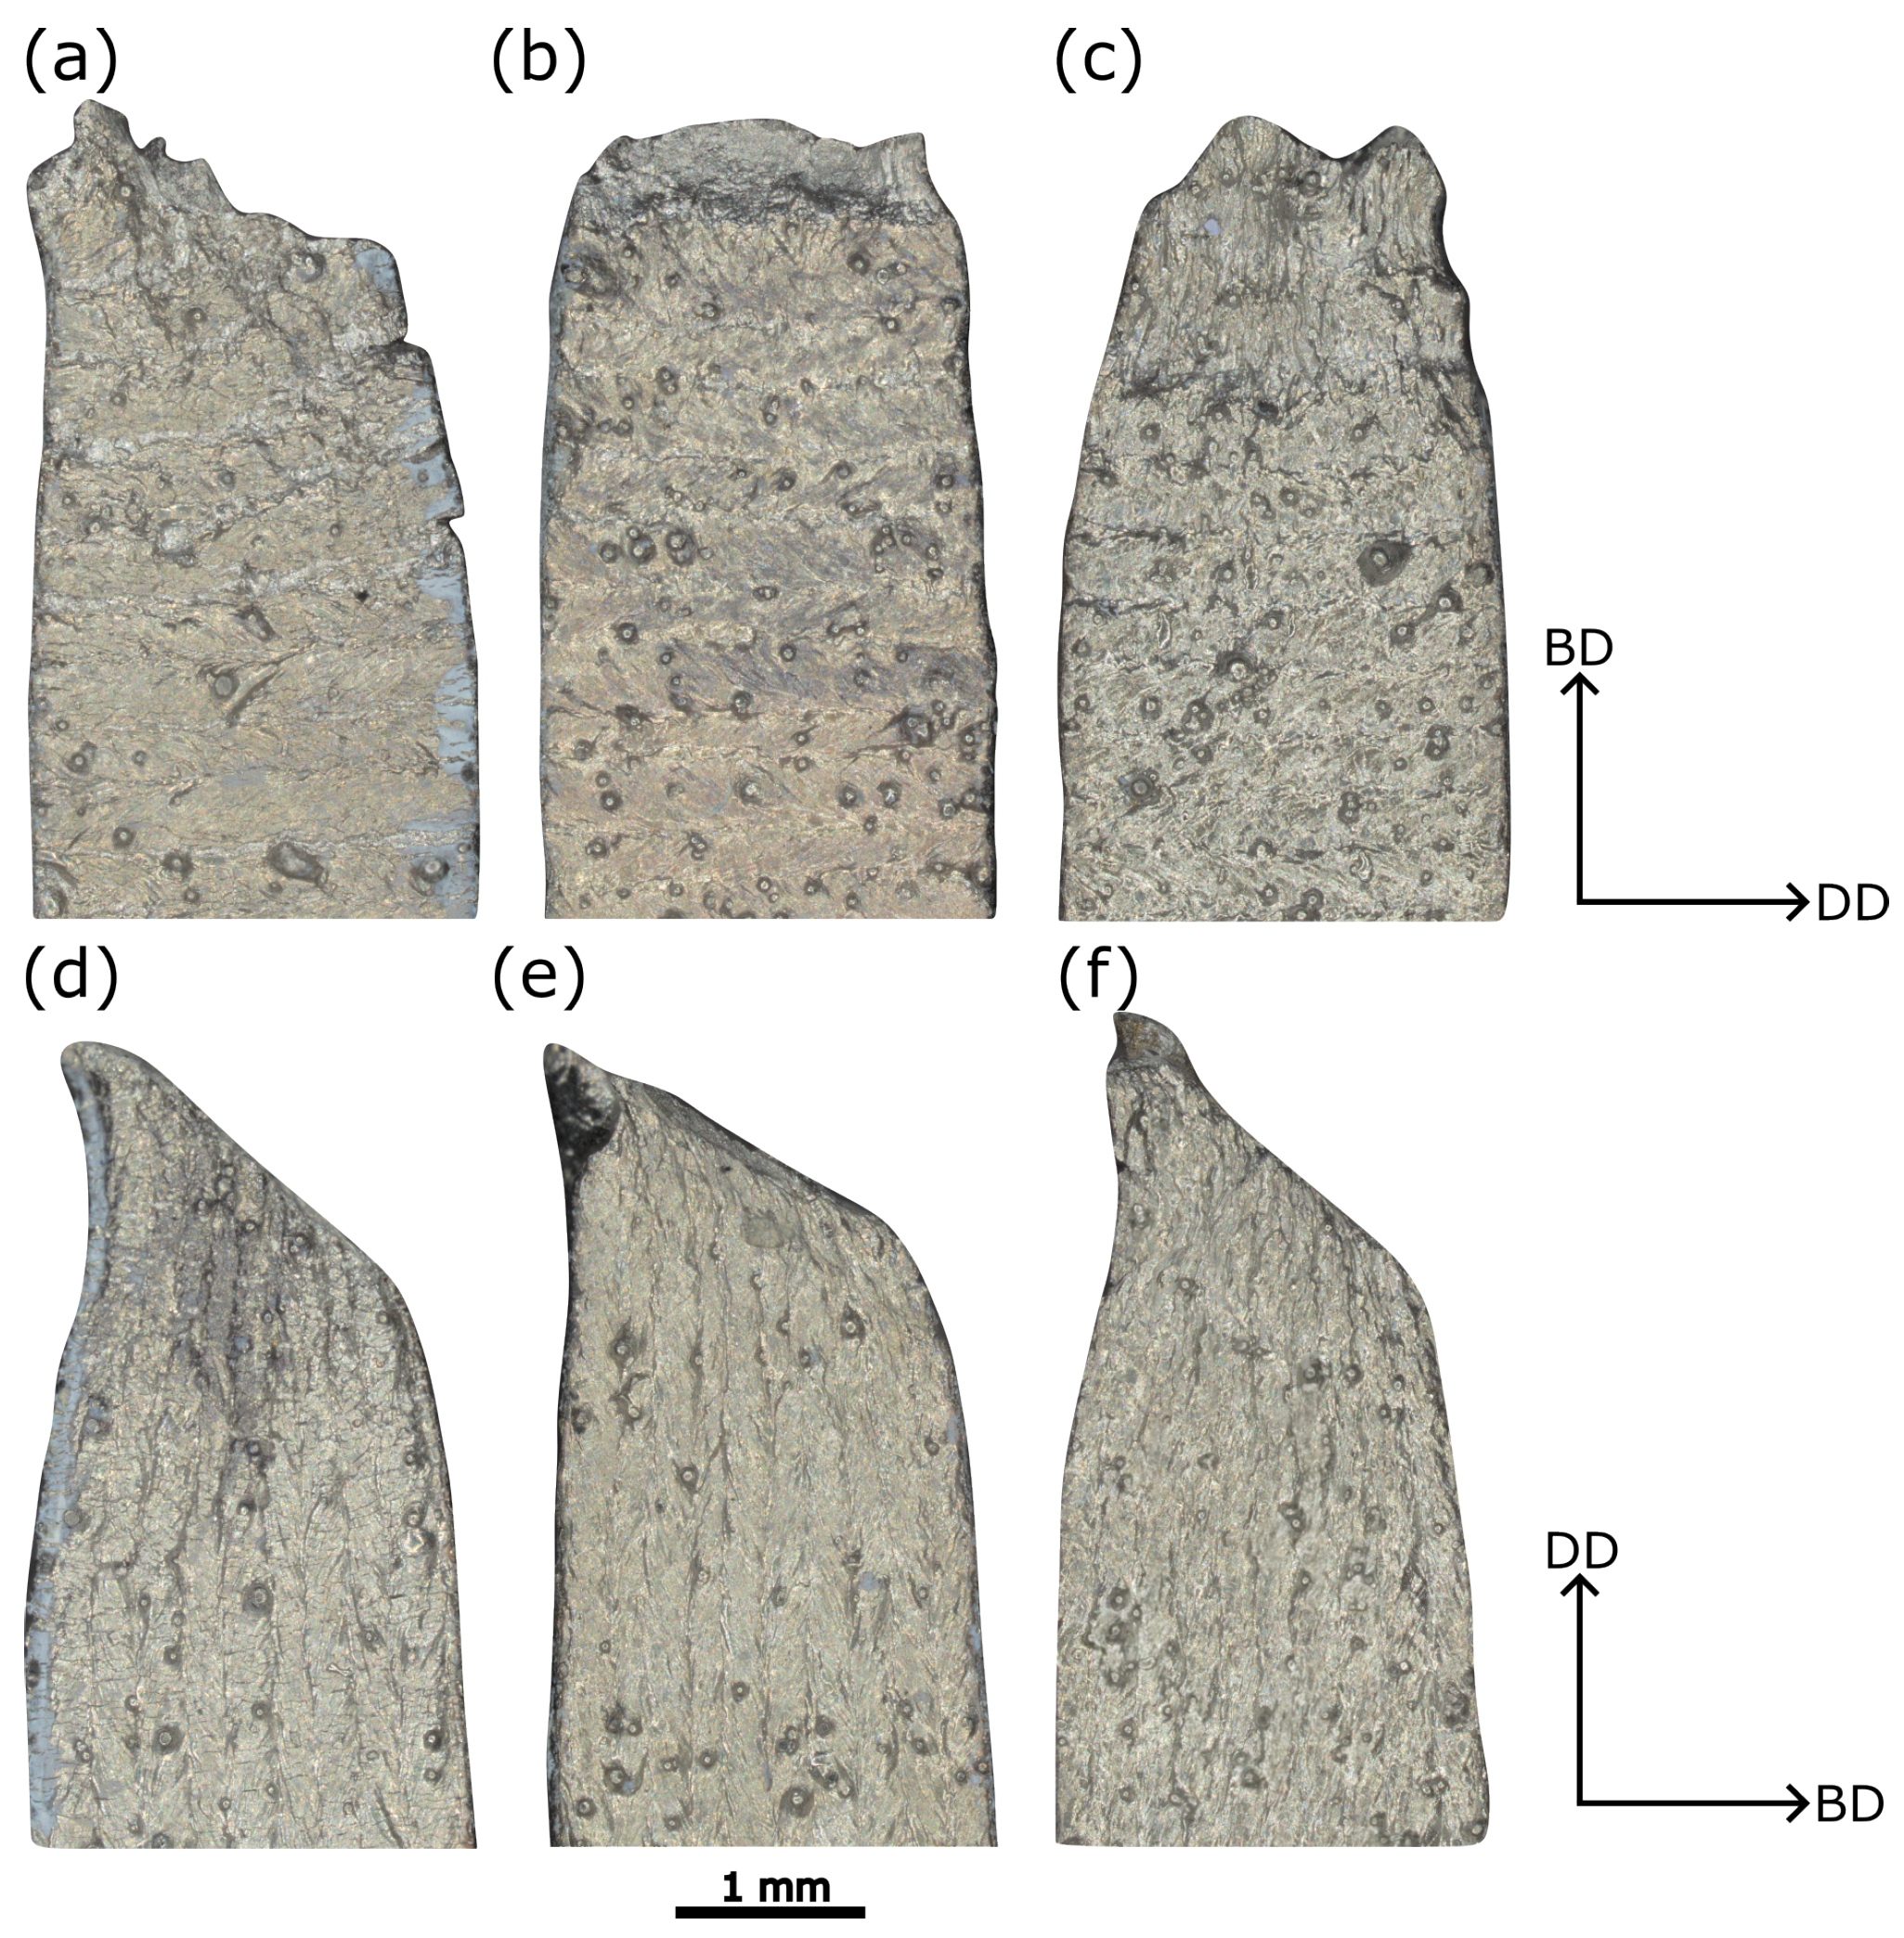
Figure 9.
Front view of fractured surfaces. Arrows indicate the build direction (BD) and deposition direction (DD). The heat treatment–build orientation combinations are as follows: (a) AB-Vertical. (b) SR-Vertical. (c) HIP-Vertical. (d) AB-Horizontal. (e) SR-Horizontal. (f) HIP-Horizontal.
Vertical specimens exhibit multiple secondary cracks across all heat treatments. The cracks are present in between the deposited layers, suggesting that the reduced areas act as stress concentration sites. Similar findings have been reported by Demenghi et al. [21] in their work of LP-DED GRCop-42 thin-wall structures using the same specimen geometry.
Horizontal specimens, on the other hand, lack the presence of these secondary cracks across all applied heat treatments. However, the specimens show a slanted fracture, approximately 45 degrees from the loading direction. This is characteristic of a ductile failure, particularly in thin-plate-type specimens, where the fracture propagates through a slip plane oriented along the maximum shear stress plane (plane stress conditions) [50,51].
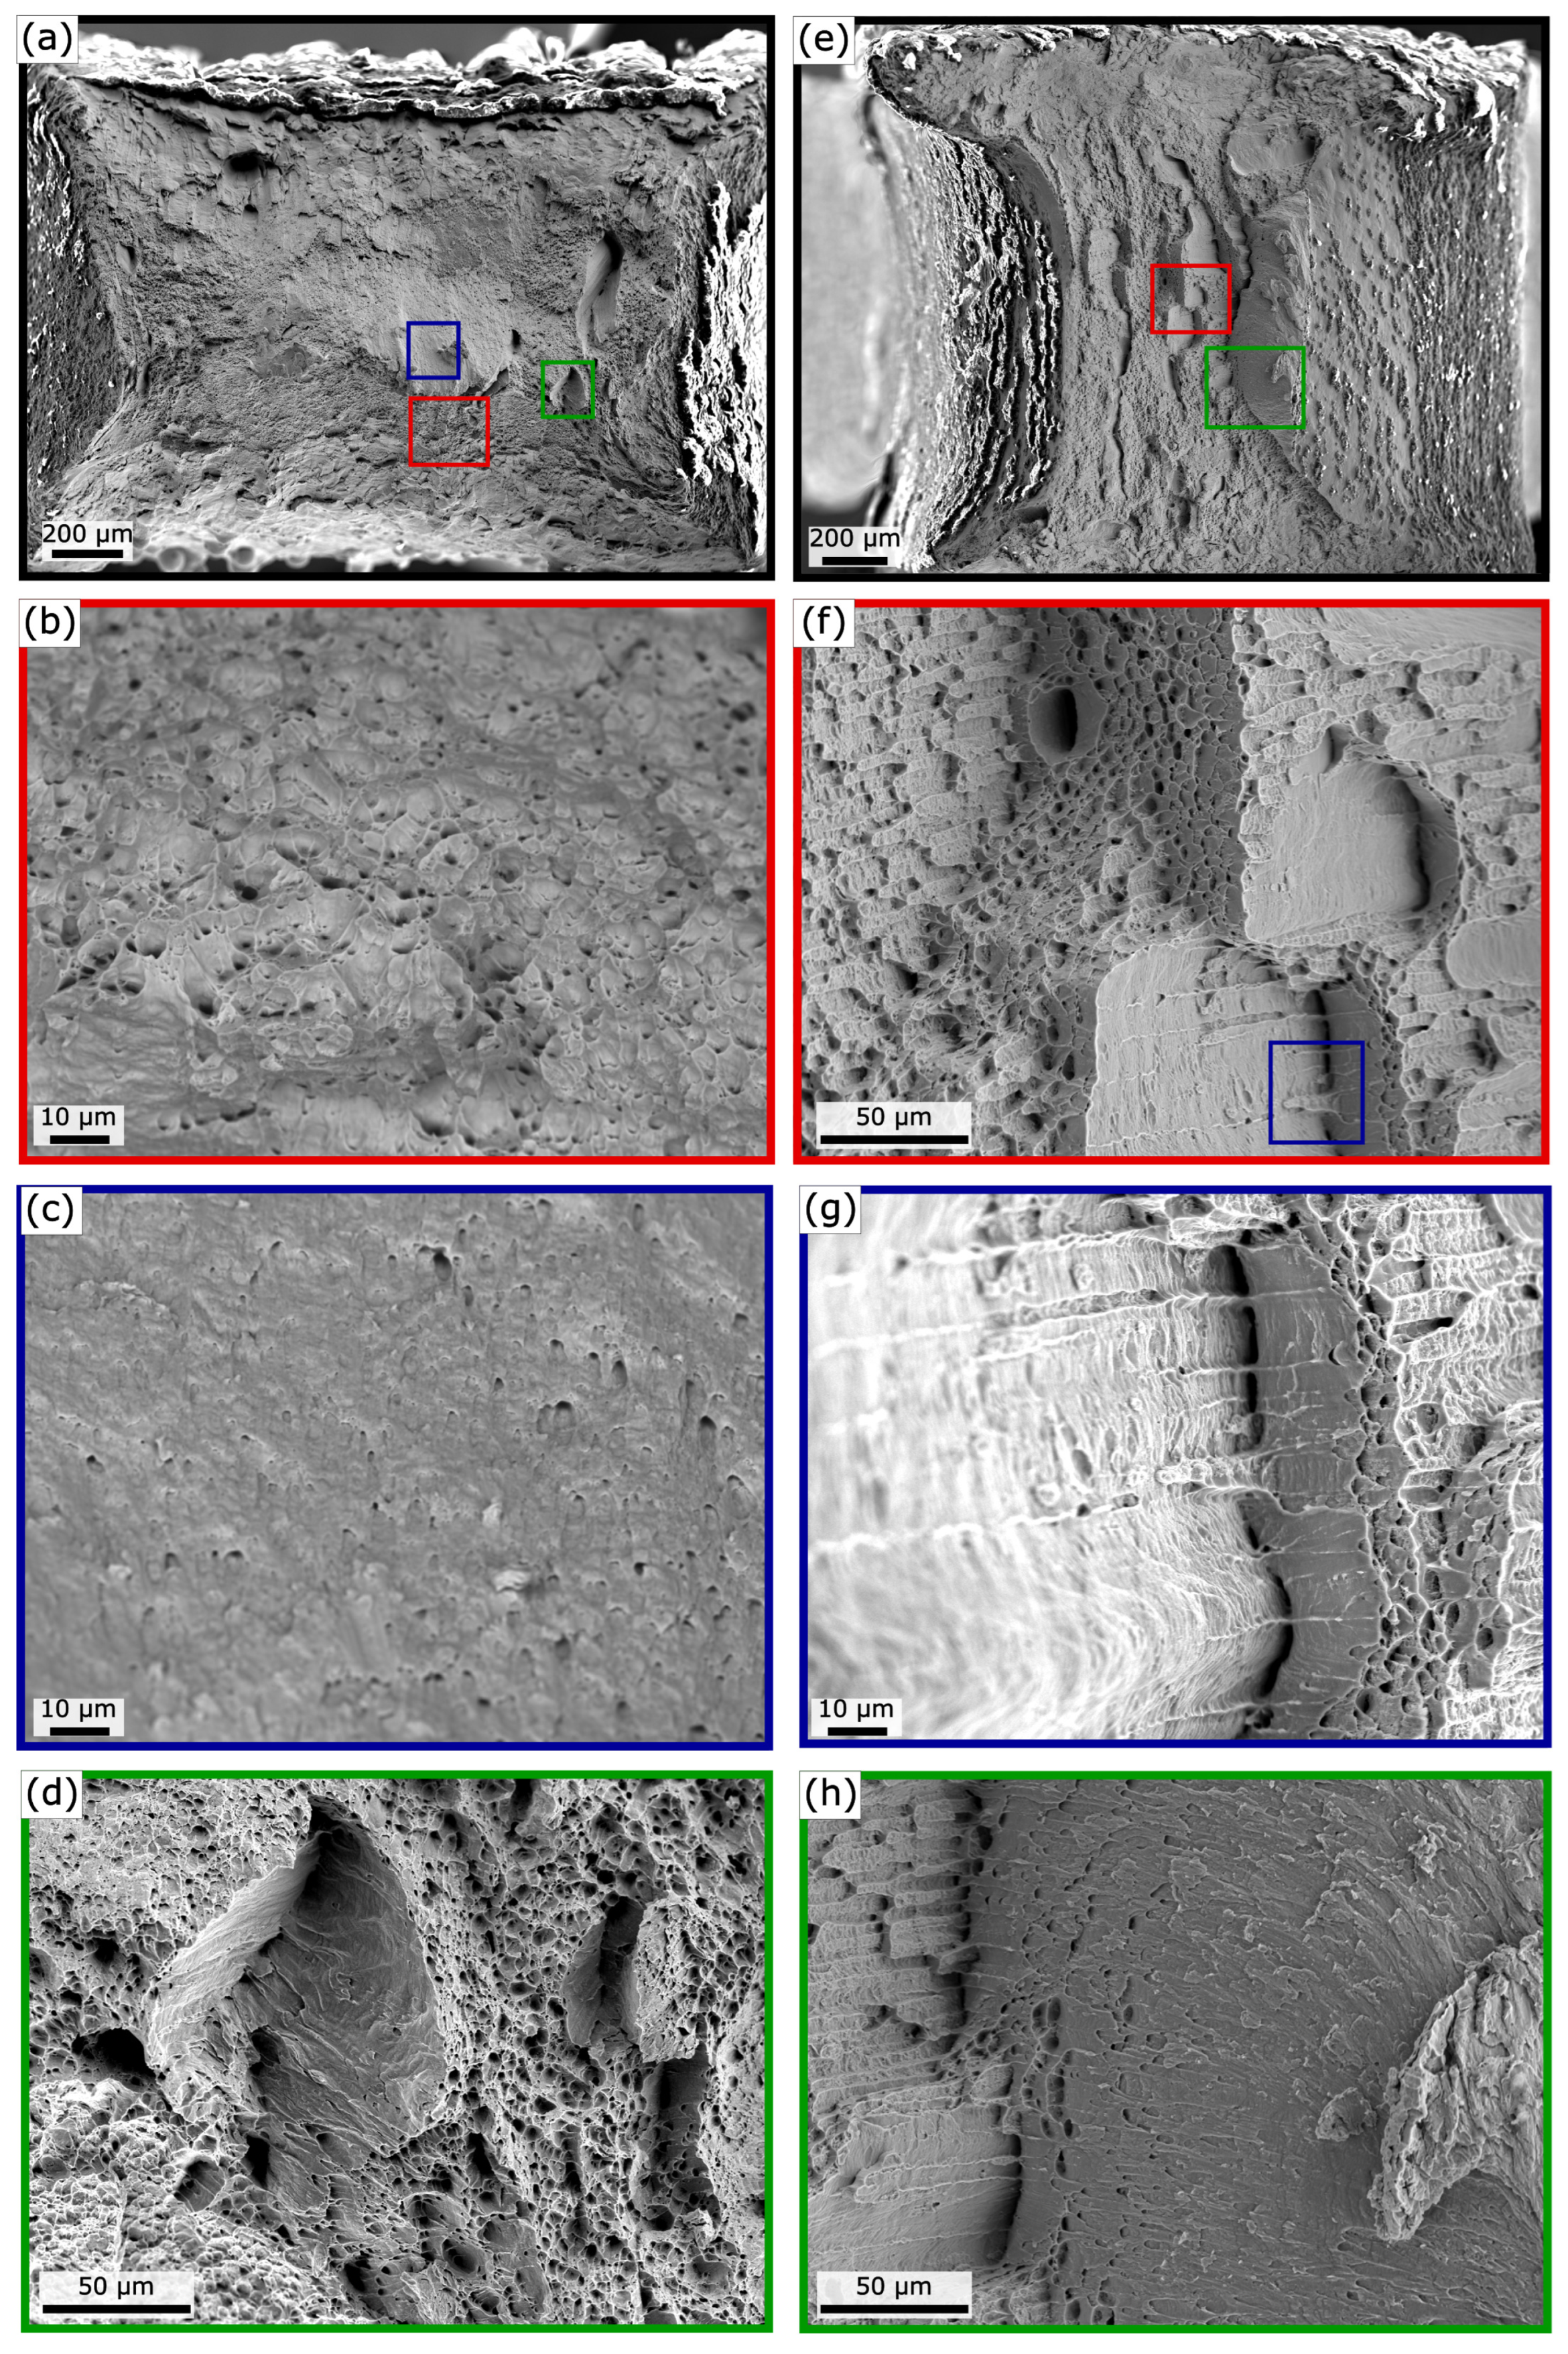
The fracture surfaces of the SR samples in both build directions are shown in detail in Figure 10. At a low magnification of both orientations, Figure 10a,e, there are no clear signs of lack of fusion, porosity, unmelted powder, or other detrimental defects. At higher magnifications, the presence of dimples becomes clear throughout the surface, which is indicative of ductile behavior.
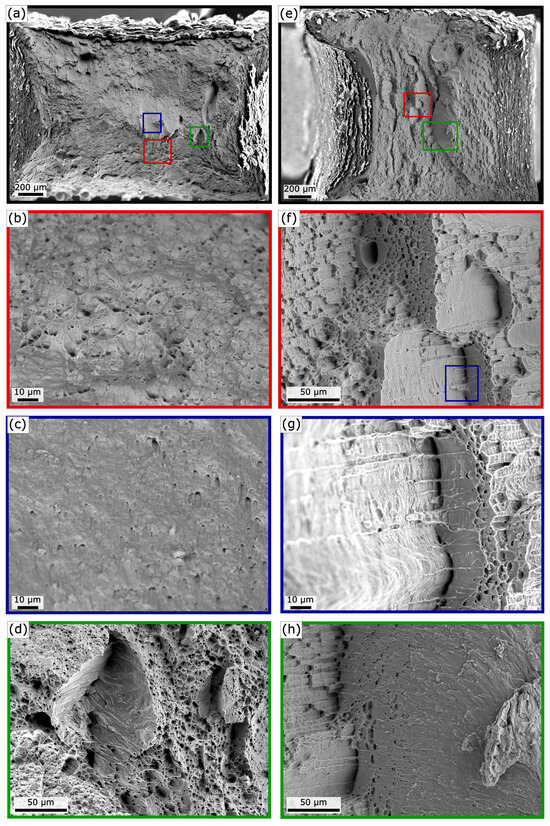
Figure 10.
Fracture surfaces for SR specimens in the vertical orientation (a–d) and the horizontal direction (e–h). (a) Overview of specimen in the vertical orientation. (b) Ductile dimples oriented axially along the loading direction. (c) Highly elongated dimples aimed towards the center of the specimen. (d) Material separated in opposite directions. (e) Overview of specimen in the horizontal direction. (f) Cracks propagating across step-like features. (g) Walls of step-like features showing matching lines, suggesting the material is torn apart. (h) Presence of elongated dimples indicative of shear.
In the vertical sample, Figure 10a, ductile dimples are readily visible on the fracture surface. Ductile dimples are elongated towards the center as shown in Figure 10b,c, indicating that the fracture starts at the surface. Figure 10d shows material that has been separated in opposite directions based on the orientation of the dimples atop of these regions, likely an artifact of the final fracture due to the overload and fast fracture.
The horizontal specimen, Figure 10e, also shows a ductile fracture; however, the operating mechanisms leading up to fracture appear to be different when compared to their vertical counterparts. While the majority of the fracture surface is covered in ductile dimples, secondary cracks, or tearing, of the specimen is more evident. The center of the specimen also shows a higher degree of plastic deformation, which coincides with the reported larger grains on the specimen, and the corresponding higher ductility. At a higher magnification in Figure 10f, the top of each step clearly exhibits ductile behavior due to the presence of many elongated dimples, pointing towards the left. Figure 10g,h also show ductile dimples pointing left with “tears” in between, indicating the presence of a weaker plane or intergranular region in the fracture surface.
BCC metals are known to exhibit preferential growth along the (001) direction, following the steepest thermal gradient during the AM process [52]. Previous work from the author’s showed this behavior for LP-DED C103 [10]. From this reference point, the horizontal specimens are axially loaded perpendicular from the (010) plane. The fracture may be propagating across the (01) plane. Additional experiments are required to confirm this.
The various dimple sizes in both orientations indicate a nonuniform distribution of void nucleation sites. A potential source of the size distribution is second phase particles such as HfO2, which have been identified in previous studies [53]. Additional sources may include the presence of satellites on the feedstock powder due to the powder manufacturing process [54]. However, minimal satellites were observed in the powder during powder characterization efforts.
While not presented in this article, the AB and HIP specimens revealed similar fracture surfaces in the respective build orientations. From the collection of images and data presented in this article, it is clear that each build orientation has a unique fracture mechanism. An awareness of this anisotropy is important for any AM user, as it will have an impact on the decisions made during the planning phases. Part layout on the build plate and toolpath planning will dictate the orientation of the printed component, which will ultimately impact both the resulting mechanical properties and relevant fracture mechanisms.
3.4. Fatigue Testing
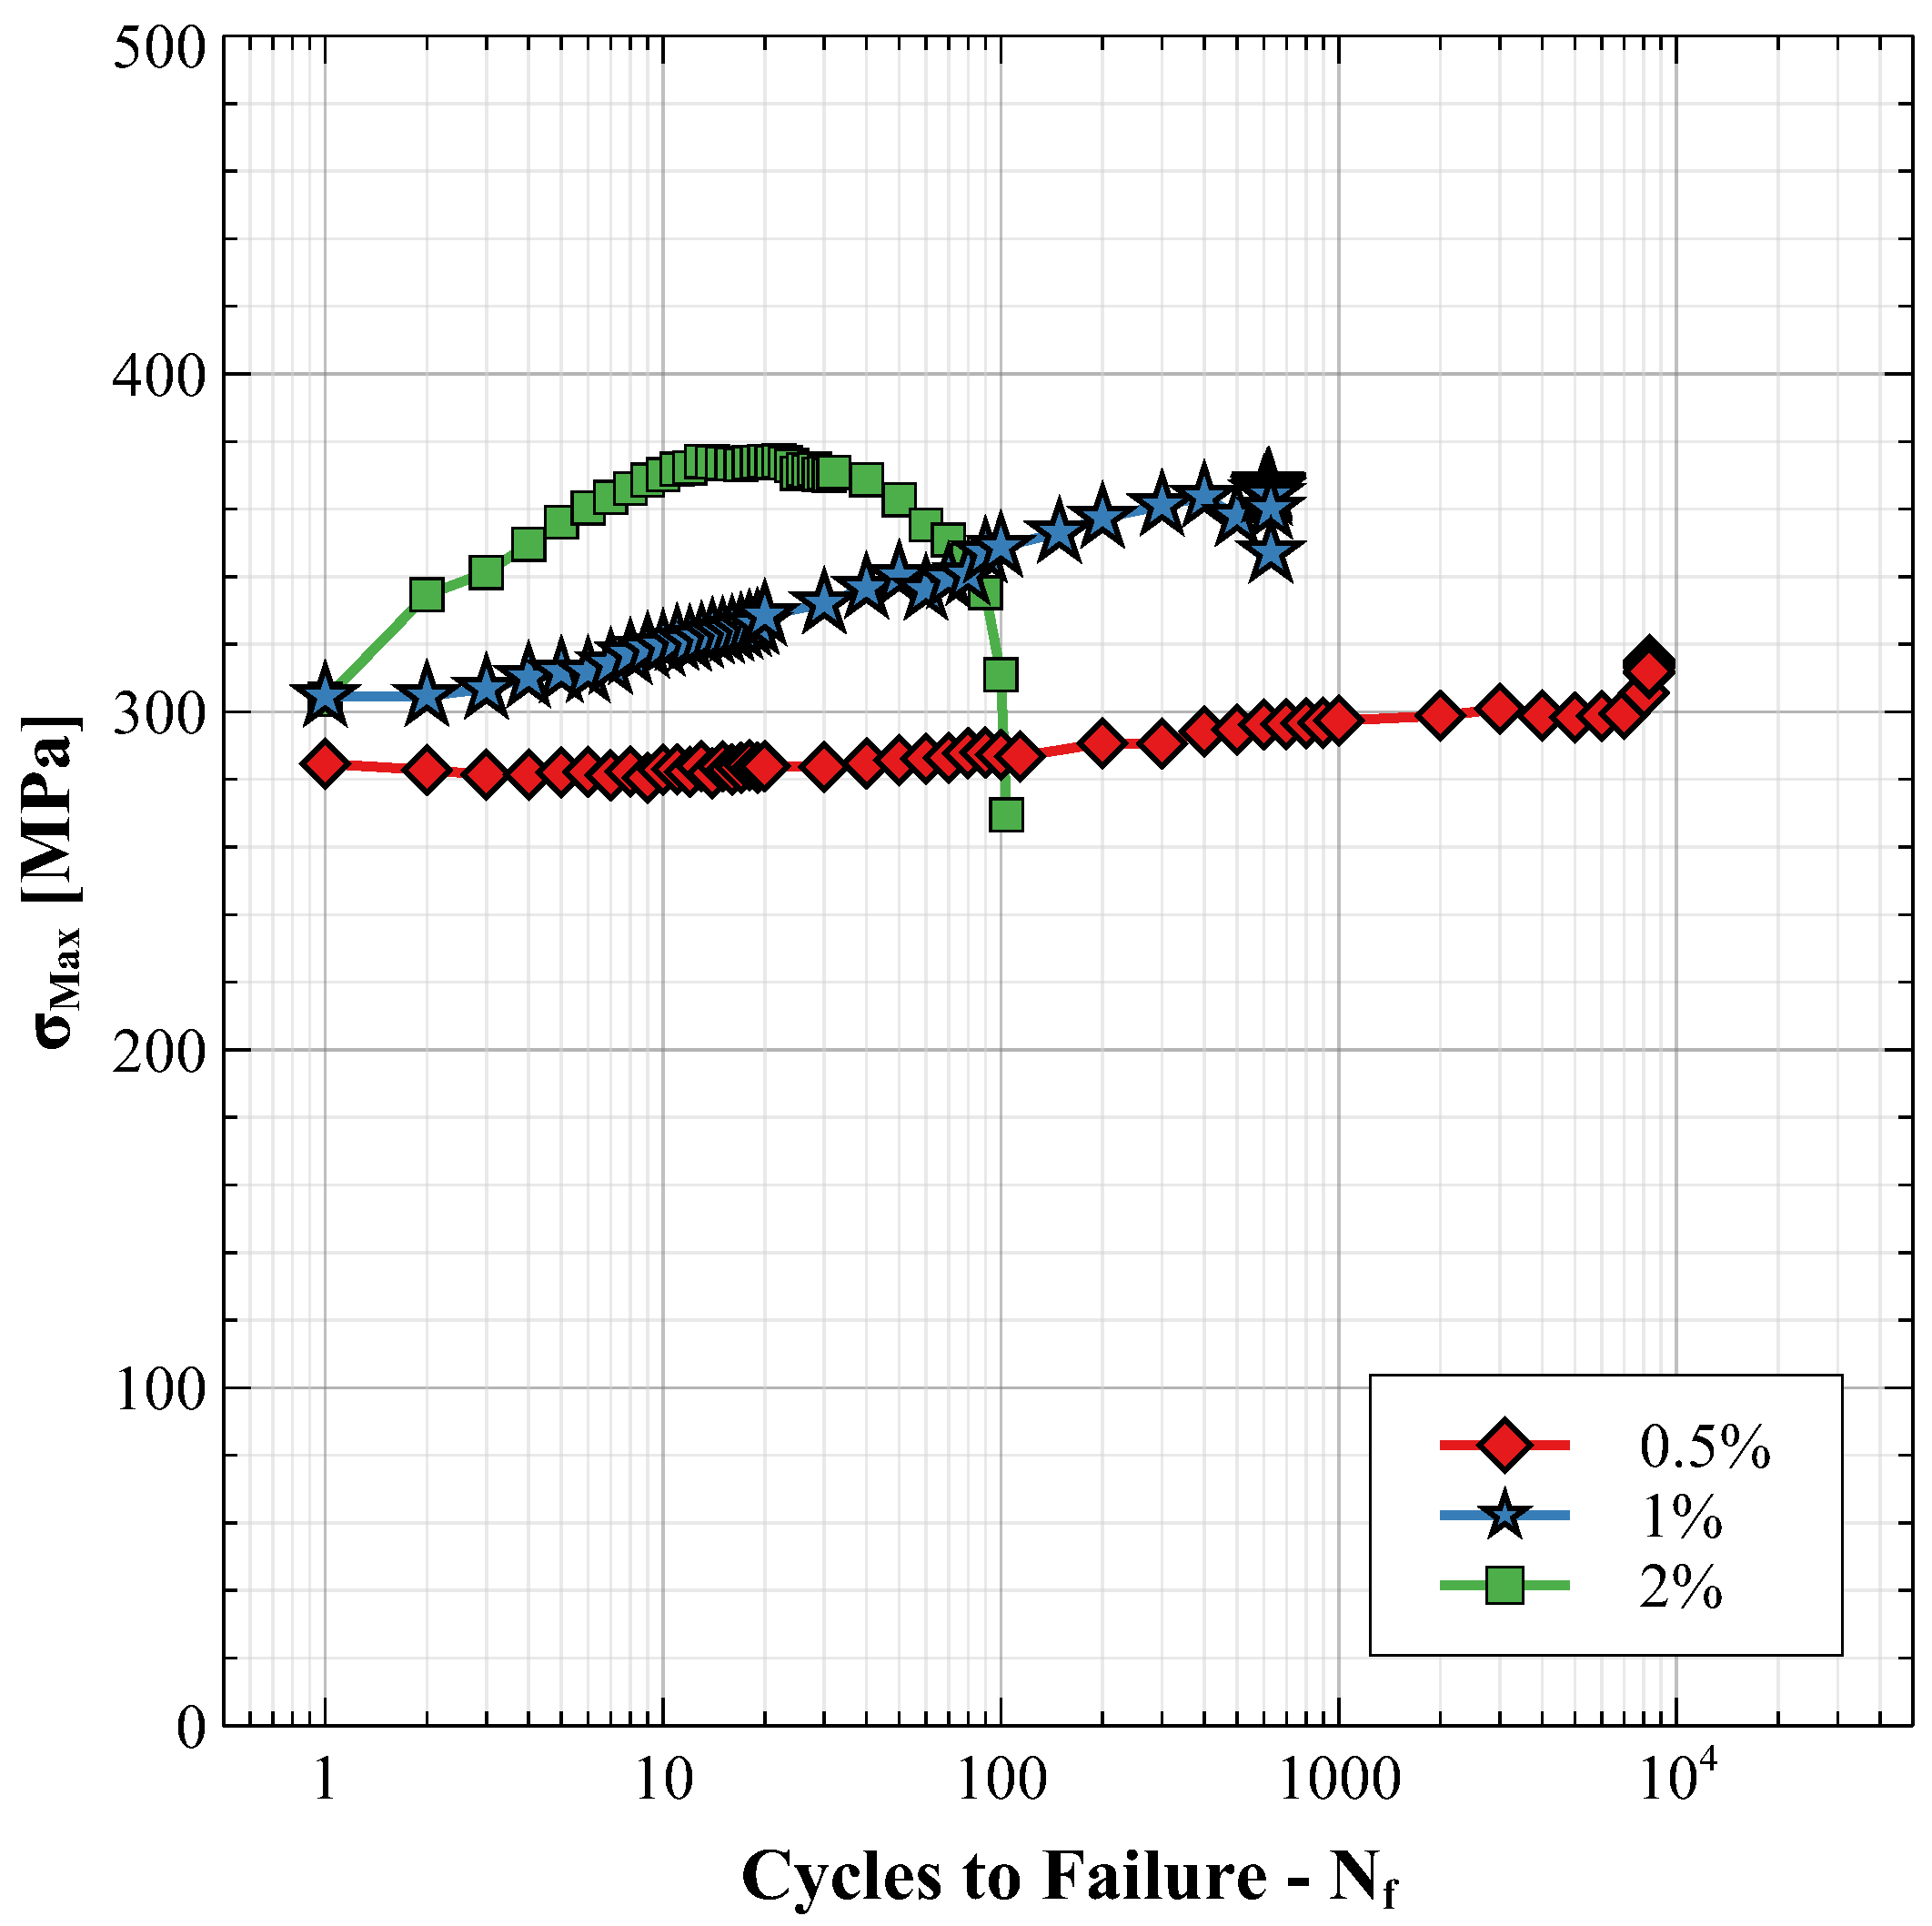
Fatigue testing was conducted on three vertical SR specimens for three different total strains and strain amplitudes. The cycles to failure for each strain level are summarized graphically as an S-N curve in Figure 11. At the time of writing, and to the author’s best knowledge, no publicly available data regarding the fatigue behavior of wrought C103 were found for comparison.
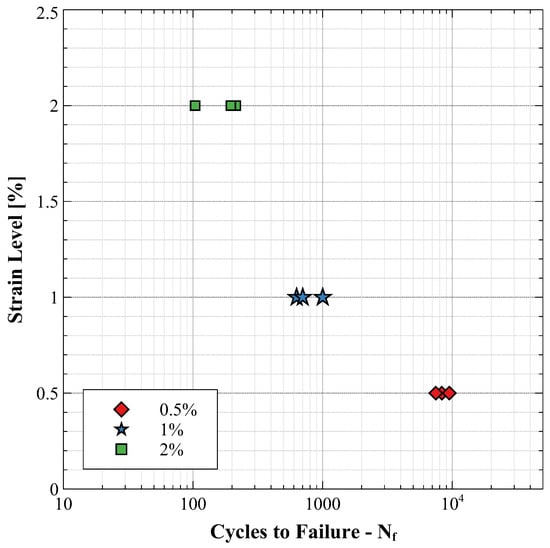
Figure 11.
Cycles to failure for max strain levels of 0.5%, 1%, and 2%.
While the lowest strain, 0.5%, resulted in the largest number of cycles to failure, none of the tested samples survived near the runout condition of 50,000 cycles. Furthermore, the scatter in the data was reduced as the strain levels decreased. Yu et al. [55] performed LCF testing on 316L thin-wall structures for a variety of surface conditions and heat treatments. At higher strain levels, all groups exhibited similar behavior, whereas lower strains led to observable differences due to an increase in sensitivity to stress concentration sites. Additionally, the maximum stress at each cycle in and the hysteresis loops for selected cycles are shown in Figure 12 and Figure 13, respectively, to show the stress evolution with fatigue life.

Figure 12.
Max stress per cycle for max strain levels at 0.5%, 1%, and 2%.
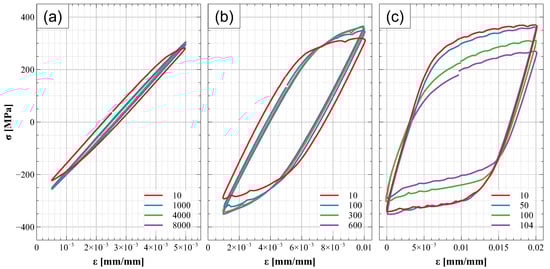
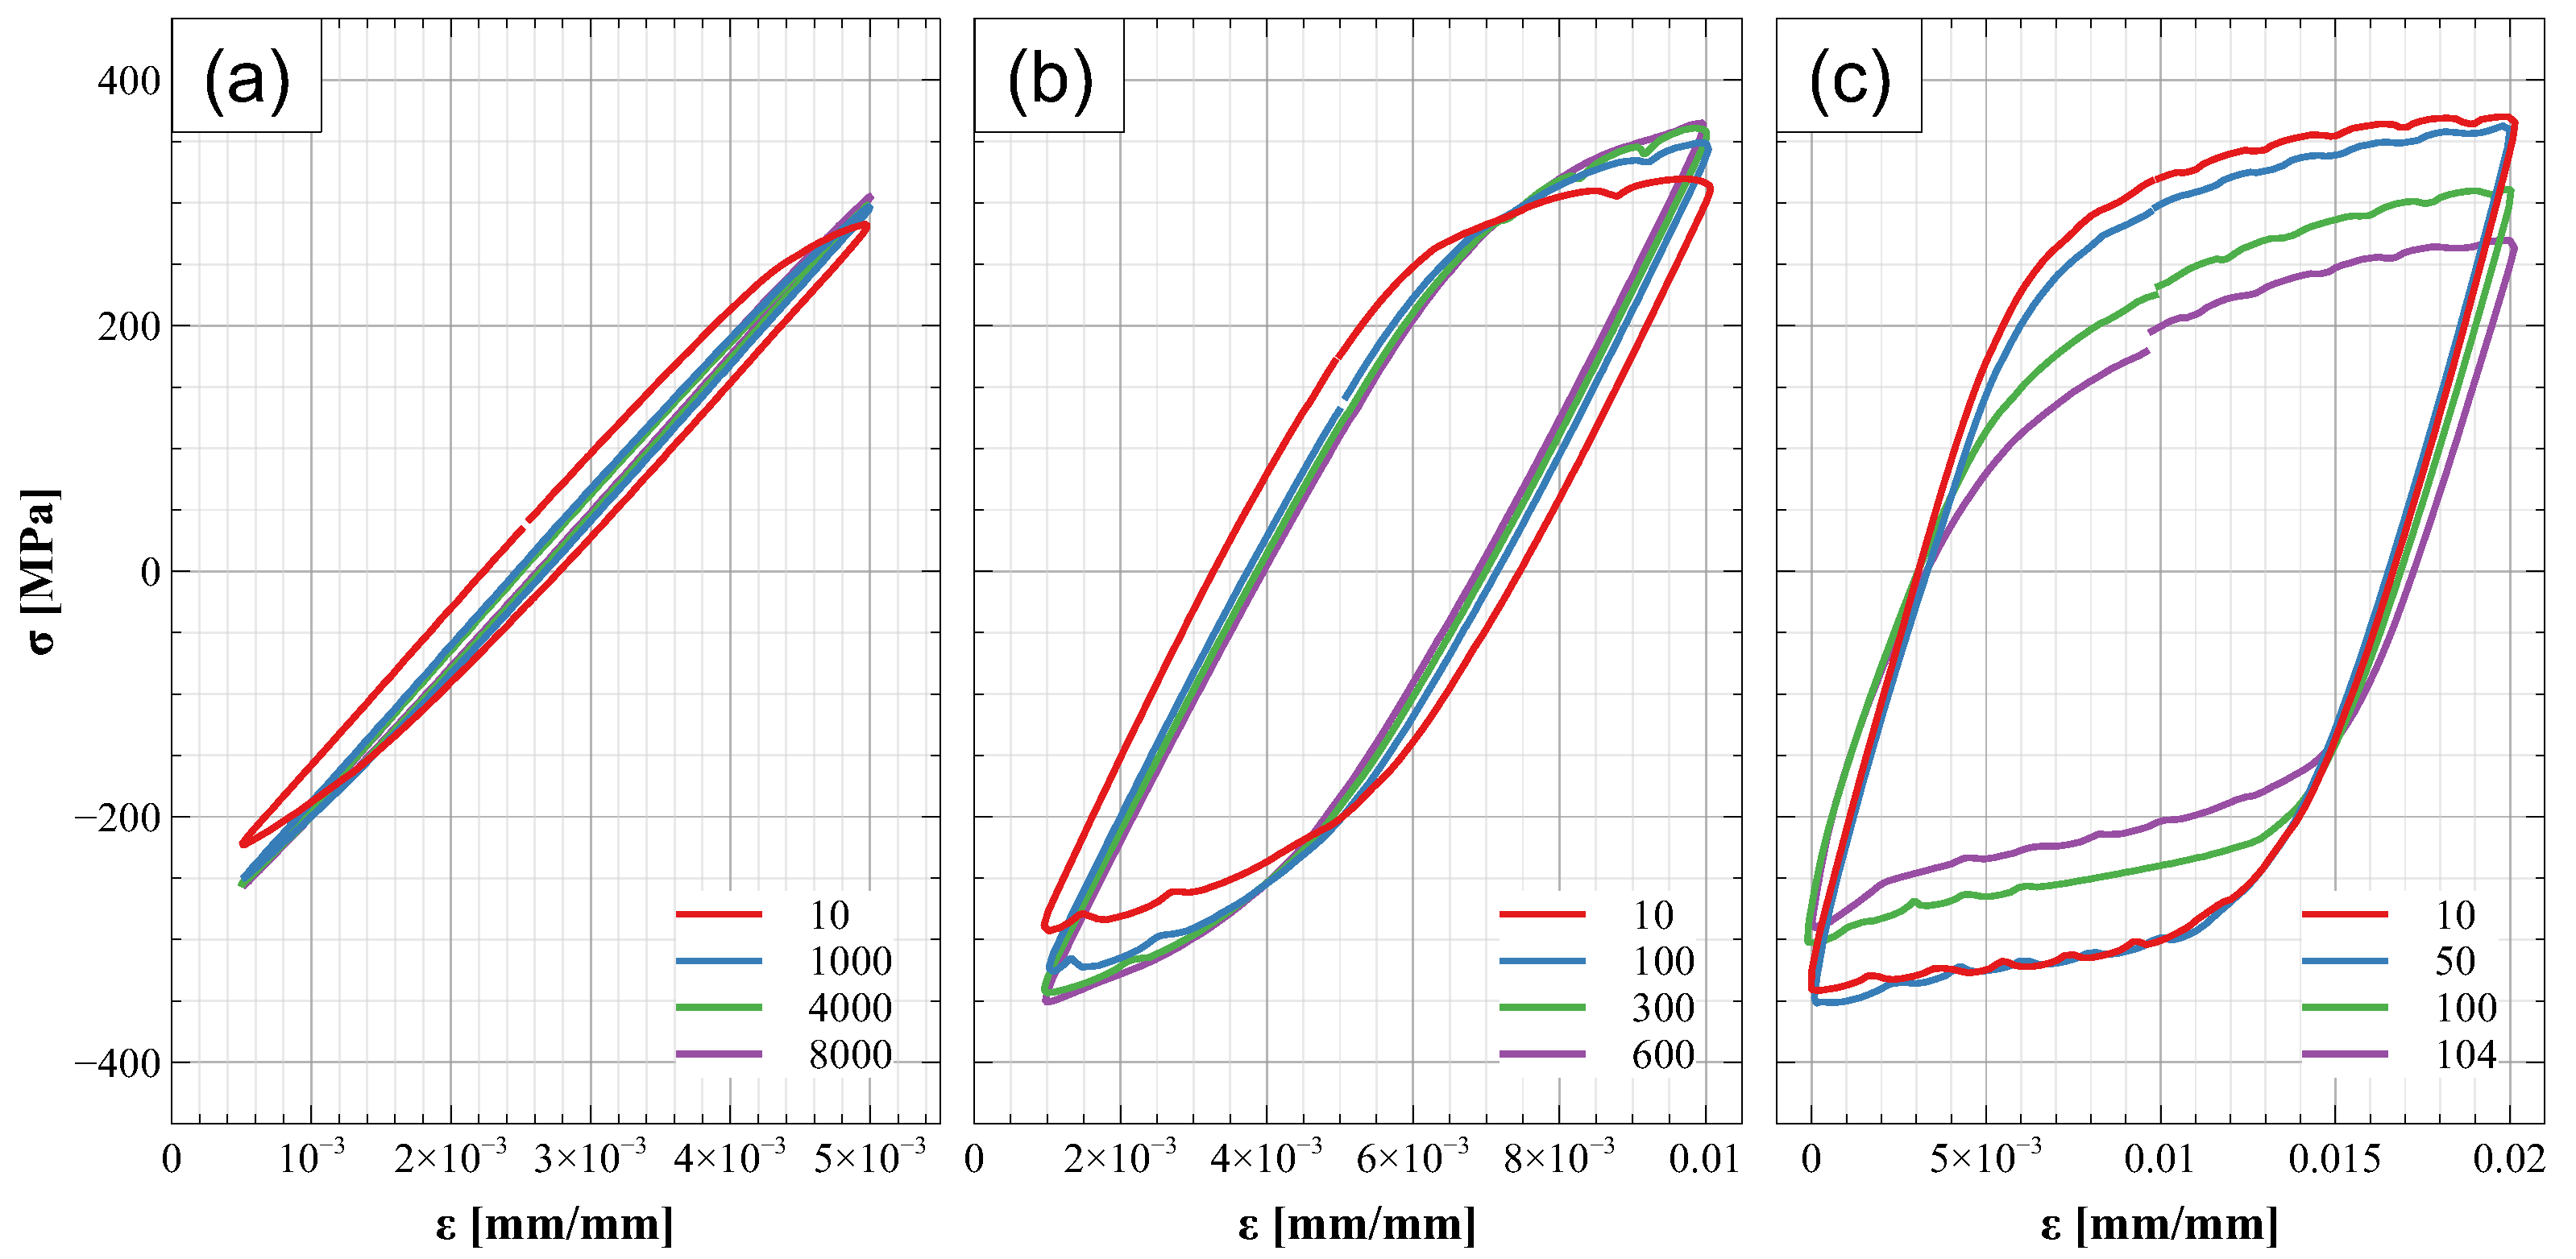
Figure 13.
Hysteresis loops for tested specimens at each max strain level. (a) Specimen at 0.5% max strain level strain hardens sufficiently to behave elastically. (b) Specimen at 1% max strain level shows stable hysteresis loops after 100 cycles. (c) Specimen at 2% max strain shows consistent change in hysteresis loops indicative of strain softening.
The 0.5% max strain specimen showed a relatively cyclic stable behavior, not significantly hardening or softening, for the first 100 cycles, with stresses of approximately 280 MPa. This was followed by a slight increase to an approximate stress of 300 MPa in between cycles 100 and 1000, indicative of cycling hardening for the material. Interestingly, the cyclic hardening was sufficient to shift the YS of the material such that the applied strain was not inducing significant plastic deformation on the specimens, which is observed for the remainder of the cycles in the hysteresis loop in Figure 13a. Although plastic deformation is not observed during these cycles directly, the material continues to accumulate microscopic damage by means of dislocation motion, leading to the creation of new defects and ultimately deteriorating the mechanical properties. Microscopic damage during fatigue testing followed by reduced mechanical properties has previously been shown in alpha-iron and aluminum 7075-T6 [56]. The observed increase in the stress during the last 2000 cycles suggests that crack propagation is taking place until the material reaches failure. This indicates that at lower strains, the material spends the majority of the time accumulating microscopic damage, during the crack initiation stage, followed by crack propagation and failure.
At 1% strain, a consistently progressive cyclic hardening behavior is observed from the beginning of the fatigue life up to failure as observed in Figure 12. The hysteresis loops in Figure 13b show a change in the shape until reaching approximately 100 cycles, due to the strain hardening behavior. From 100 cycles up to near failure at 600 cycles, the shape of the hysteresis loop is constant with relatively small increasing stress. In the case of 1% max strain, it is speculated that the specimen spends the majority of the fatigue life undergoing crack propagation.
Finally, the specimen at a max strain 2% exhibits a steep cyclic hardening behavior for the first 10 cycles, reaching a stress plateau of approximately 380 MPa, followed by strain softening until failure, at 100 cycles. The hysteresis loops in Figure 13c show a consistent hysteresis shape with consistently decreasing stress. Similar to the 1% max strain, this sample spends the majority of its life undergoing crack propagation.
3.5. Fatigue Fractography
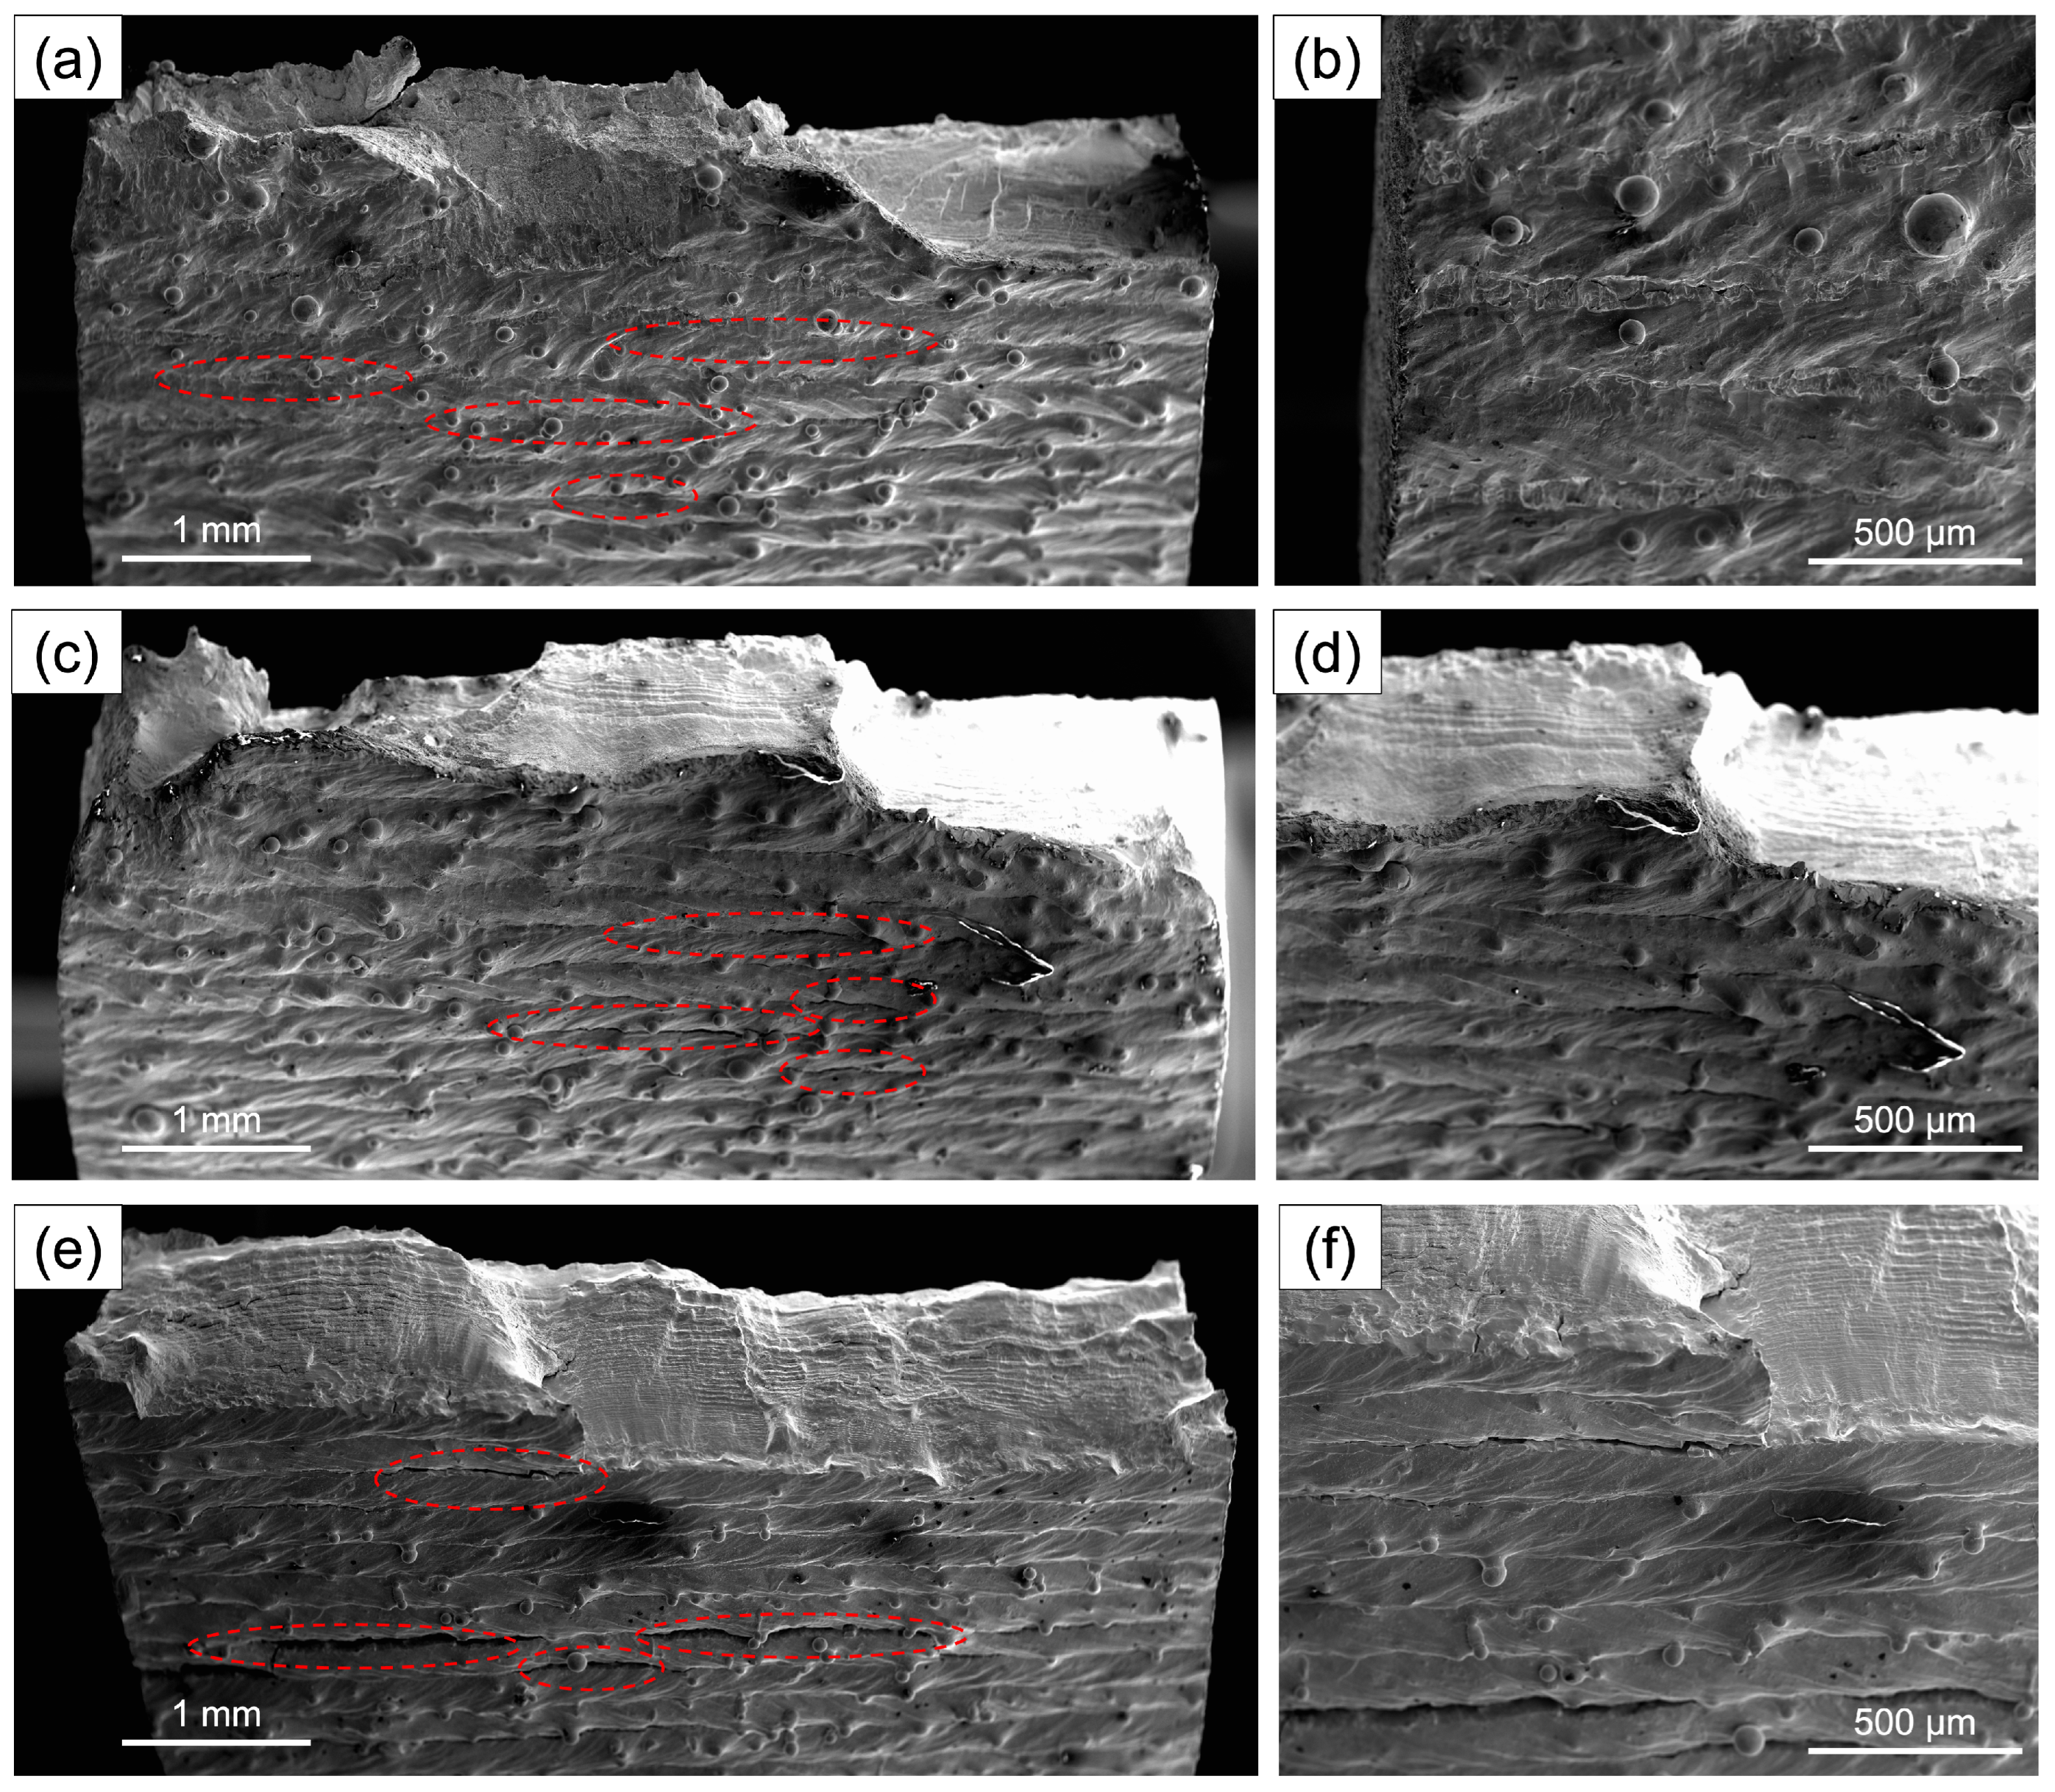
Fractography was performed on a specimen from each tested strain to identify fracture initiation sites and gain insights into the dominant fracture mechanisms. Figure 14 shows a collection of SEM images of the gauge section near the fracture surface. Specimens across all strain levels show that the fracture initiates at a given interlayer and travels through various layers as it progresses through the specimen.

Figure 14.
SEM images of fatigue specimens along the gauge length near the fracture surface. Dotted red lines highlight secondary crack formation. (a,b) Specimen at 0.5% max strain level shows secondary initiation cracks in the interlayers below the fracture surface. (c,d) Secondary cracks in the specimen at 1% max strain level begin to propagate across the sample. (e,f) Secondary cracks in the specimen at 2% max strain level have propagated along the majority of the gauge width.
Interestingly, the specimen tested at 0.5% max strain shows a crack initiation and propagation on a single site prior to the onset of the fast fracture, or overload. However, several secondary cracks were observed on adjacent layers, which could indicate they formed during overload. Specimens tested at 1% and 2%, however, show multiple cracks initiating and propagating at different interlayers and joined together, evident by the beach and ratchet marks. Therefore, multiple layers are showing secondary cracks on both the same face and opposite face of the primary crack initiation site.
Figure 15a shows the fracture surface for the 0.5% max strain level, where the propagation zone takes up to approximately 25% of the fracture surface. Along the top right region of the sample, a collection of beach marks and river marks radiating from near the corner of the specimen indicate a primary initiation and propagation site. As mentioned previously, secondary cracks are also present throughout the leftmost upper region; however, these appear to be a consequence of the overload.
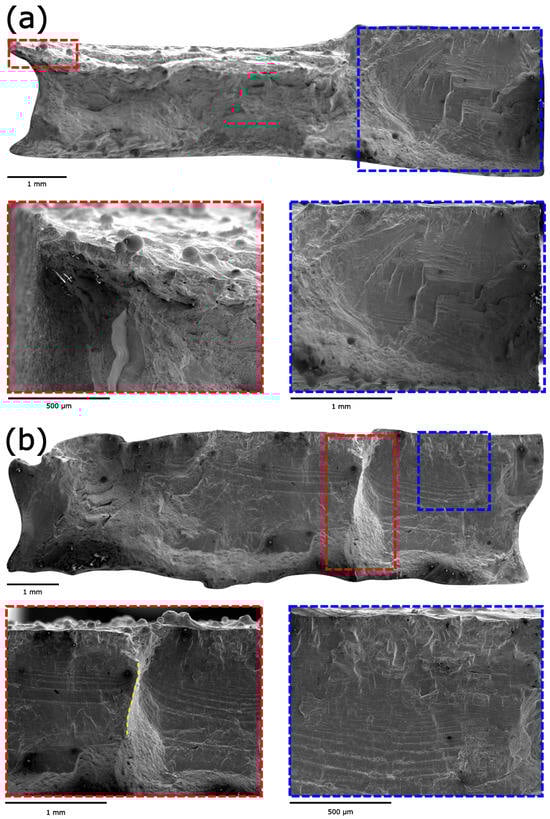
Figure 15.
Fracture surfaces of the fatigue specimens. (a) 0.5% max strain specimen failed at 8307 cycles. Crack propagation region is ≈25% of the entire surface area. (b) Specimen tested at 1% max strain failed at 630 cycles. Crack propagation region increased up to ≈66% of the fracture surface area. Dotted yellow line shows a ratchet mark indicative of two separate cracks across the deposited layers. (c) The 2% max strain specimen failed at 104 cycles. The crack propagation region occupies most of the visible fracture surface.
The 1% max strain fracture surface shown in Figure 15b reveals multiple crack initiation sites along the upper edge of the sample. A clear ratchet mark, highlighted by the yellow dashed line, points to the two separate cracks across the deposited layers. The beach marks are significantly further apart as the crack progresses throughout the specimen, where the propagation zone occupies approximately 66% of the total fracture surface.
The 2% max strain specimen’s fracture surface is presented in Figure 15c. The presence of multiple crack initiation sites along the upper edge is now mostly uninterrupted along the length of the sample. A similar ratchet mark is observed, adjoining two separate cracks during crack propagation. Smearing is also observed at a higher magnification, meaning that the sample compressed against itself during testing. There is a clear inverse relationship between the number of cycles to failure and the size of the crack propagation zone. This suggests that the higher strains lead to significant crack growth between each cycle.
4. Summary and Conclusions
Recent advancements have shown viability and scalability of additively manufactured (AM) C103. Laser Powder Directed Energy Deposition (LP-DED) can create large monolithic structures with a feature resolution of up to 1 mm. The results from this work can be used for preliminary design and analysis phase of LP-DED thin-wall structures. Recommendations for future work include additional testing in relevant operating temperatures, fatigue testing at additional strain levels to establish Basquin or Manson–Coffin curves, and the optimization of heat treatment cycles. Additionally, characterization of the fatigue behavior of wrought C103 should be evaluated for comparison to AM specimens.
In this study, the mechanical properties of LP-DED C103 were explored for both quasi-static loading and cyclic loading. The effects of vacuum stress relief (SR) and hot isostatic pressing (HIP) heat treatments were investigated for specimens in the vertical and horizontal build orientations. The findings are summarized below.
- Subtracting the maximum peak height (Rp) twice from the caliper measured thickness provided the most accurate estimate of the load bearing area. The use of caliper-based measurements tends to underestimate the material properties. Additional work is required to characterize this approach for specimens printed at an angle with different surface roughness values for the upskin and downskin of the material.
- Mechanical properties of LP-DED C103 are greater than their wrought counterparts. The large grain size resulting from LP-DED led to properties below the reported EB-PBF and L-PBF values. Stress relief (SR) heat treatment schedule reduced both strength and ductility. Hot isostatic pressing (HIP) increased all properties above the as-built (AB) condition. This is a unique behavior to LP-DED C103 since HIP cycles are detrimental to L-PBF C103 due to induced grain growth. Additional exploratory work is required to develop heat treatment schedules that produce optimal mechanical properties.
- Fractography of the tensile specimens revealed mixed mode fracture composed of equiaxed dimples, highly elongated dimples, shear fracture, and transgranular fracture for all heat treatment–build orientation combinations. The dominant fracture mechanisms are thought to be unique for each build orientation studied in this work. Scanning electron microscope (SEM) images confirmed that the interlayers act as stress concentration sites for crack initiation when specimens are oriented vertical to the build direction. When the specimens are oriented horizontal to the build direction, the fracture appears to mainly propagate along the (01) plane.
- Fatigue results showed max life cycles ranging from 100 cycles to over 8000 cycles for 2% and 0.5% max strain level respectively. At the lowest max strain level, the samples did not reach runout target of 50,000 cycles. Additional testing is needed to evaluate the material’s response to high cycle fatigue (HCF) and establish a predictive life cycle model.
- Fractography of the fatigue specimens revealed consistent crack initiation sites along the edges of the samples within the interlayers. The cracks propagated across several deposited layers prior to the final fracture. As strain levels are increased, the crack propagation zone is increased. At the 0.5% max strain level, the specimen spends most of the test time under crack initiation and damage accumulation. At increased strain levels, crack propagation dominates for the majority of the time.
Author Contributions
Conceptualization, B.C., M.P., G.D. and O.M.; Methodology, B.C., M.P., G.D. and K.H.; Formal Analysis, B.C., M.P. and G.D.; Resources, F.M., O.M. and K.H.; Data Curation, B.C. and M.P.; Writing—Original draft preparation, B.C.; writing—review and editing, M.P., G.D. and O.M.; Visualization, B.C.; Supervision, O.M., K.H. and F.M.; Project administration, O.M. and F.M.; Funding Acquisition, O.M. and F.M. All authors have read and agreed to the published version of the manuscript.
Funding
This research was funded by the National Aeronautics and Space Administration (NASA) under Cooperative Agreement Notice (CAN) # 80MSFC22N0001 and the NASA Space Technology Graduate Research Opportunity Fellowship (NSTGRO) Grant # 80NSSC23K0107.
Data Availability Statement
The data presented in this study are available on request from the corresponding author. The data is not publicly available due to ITAR restrictions.
Acknowledgments
The authors would like to thank Colton Katsarelis from NASA Marshall Spaceflight Center (MSFC) for the guidance and feedback on the interpretation of the fracture surfaces. The authors would also like to thank Kenny Webster from NASA MSFC for the assistance with wire EDM of the test specimens. Los Alamos National Laboratory release number LA-UR-24-25527.
Conflicts of Interest
The authors declare no conflicts of interest.
References
- Ciulik, J.R.; Shields, J.A.; Kumar, P.; Leonhardt, T.; Johnson, J.L. Properties and Selection of Powder Metallurgy Refractory Metals. In Powder Metallurgy; ASM International: Almere, The Netherlands, 2015; pp. 593–598. [Google Scholar] [CrossRef]
- Briant, C.L.; Banerjee, M.K. Refractory Metals and Alloys. In Reference Module in Materials Science and Materials Engineering; Elsevier: Amsterdam, The Netherlands, 2016. [Google Scholar] [CrossRef]
- Halchak, J.A.; Cannon, J.L.; Brown, C. Materials for Liquid Propulsion Systems. In Aerospace Materials and Applications; Progress in Astronautics and Aeronautics, American Institute of Aeronautics and Astronautics, Inc.: Las Vegas, NV, USA, 2018; pp. 641–698. [Google Scholar] [CrossRef]
- Wadsworth, J.; Roberts, C.A.; Rennhack, E.H. Creep behaviour of hot isostatically pressed niobium alloy powder compacts. J. Mater. Sci. 1982, 17, 2539–2546. [Google Scholar] [CrossRef]
- Ranjbar Motlagh, S.; Momeni, H.; Ehsani, N. Study on the Post-annealing Process of Nb-Hf Alloy Produced by Spark Plasma Sintering. Iran. J. Mater. Sci. Eng. 2021, 18, 110–117. [Google Scholar] [CrossRef]
- Mireles, O.; Rodriguez, O.; Gao, Y.; Philips, N. Additive Manufacture of Refractory Alloy C103 for Propulsion Applications. In Proceedings of the AIAA Propulsion and Energy 2020 Forum, Virtual, 24–28 August 2020. [Google Scholar] [CrossRef]
- Awasthi, P.D.; Agrawal, P.; Haridas, R.S.; Mishra, R.S.; Stawovy, M.T.; Ohm, S.; Imandoust, A. Mechanical properties and microstructural characteristics of additively manufactured C103 niobium alloy. Mater. Sci. Eng. A 2022, 831, 142183. [Google Scholar] [CrossRef]
- Milner, J.L.; Brizes, E. Elevated Temperature Mechanical Properties of L-PBF Niobium Alloy: C103. In Proceedings of the NTRS Author Affiliations: Glenn Research Center NTRS Meeting Information: 153rd Annual Meeting and Exhibition of The Minerals, Metals & Materials Society (TMS), Orlando, FL, USA, 3–7 March 2024; Undefined NTRS Document ID: 20240002294. NTRS Research Center, Glenn Research Center (GRC): Cleveland, OH, USA, 2024. [Google Scholar]
- Philips, N.R.; Carl, M.; Cunningham, N.J. New Opportunities in Refractory Alloys. Metall. Mater. Trans. A 2020, 51, 3299–3310. [Google Scholar] [CrossRef]
- Colón, B.J.; Watanabe, K.I.; Hobbs, T.J.; Romnes, C.J.; Mireles, O.R.; Murr, L.E.; Medina, F. Parameter development and characterization of laser powder directed energy deposition of Nb – Alloy C103 for thin wall geometries. J. Mater. Res. Technol. 2024, 30, 5028–5039. [Google Scholar] [CrossRef]
- Mazzarisi, M.; Errico, V.; Angelastro, A.; Campanelli, S.L. Influence of standoff distance and laser defocusing distance on direct laser metal deposition of a nickel-based superalloy. Int. J. Adv. Manuf. Technol. 2022, 120, 2407–2428. [Google Scholar] [CrossRef]
- ASTM B655; Standard Specification for Niobium-Hafnium Alloy Bar and Wire. ASTM: West Conshohocken, PJ, USA, 2024.
- Gradl, P.R.; Protz, C.S.; Wammen, T. Additive Manufacturing and Hot-fire Testing of Liquid Rocket Channel Wall Nozzles Using Blown Powder Directed Energy Deposition Inconel 625 and JBK-75 Alloys. In Proceedings of the AIAA Propulsion and Energy 2019 Forum, Indianapolis, IN, USA, 19–22 August 2019. [Google Scholar] [CrossRef]
- Gradl, P.R.; Teasley, T.W.; Protz, C.S.; Garcia, M.B.; Ellis, D.; Kantzos, C. Advancing GRCop-based Bimetallic Additive Manufacturing to Optimize Component Design and Applications for Liquid Rocket Engines. In AIAA Propulsion and Energy 2021 Forum, AIAA Propulsion and Energy Forum, Virtual, 9–11 August 2021; American Institute of Aeronautics and Astronautics: Las Vegas, NV, USA, 2021. [Google Scholar] [CrossRef]
- Gradl, P.R.; Teasley, T.W.; Protz, C.S.; Katsarelis, C.; Chen, P. Process Development and Hot-fire Testing of Additively Manufactured NASA HR-1 for Liquid Rocket Engine Applications. In Proceedings of the AIAA Propulsion and Energy 2021 Forum, Virtual, 9–11 August 2021; American Institute of Aeronautics and Astronautics: Las Vegas, NV, USA, 2021. [Google Scholar] [CrossRef]
- Roach, A.M.; White, B.C.; Garland, A.; Jared, B.H.; Carroll, J.D.; Boyce, B.L. Size-dependent stochastic tensile properties in additively manufactured 316L stainless steel. Addit. Manuf. 2020, 32, 101090. [Google Scholar] [CrossRef]
- Demeneghi, G.; Barnes, B.; Gradl, P.; Mayeur, J.R.; Hazeli, K. Size effects on microstructure and mechanical properties of additively manufactured copper–chromium–niobium alloy. Mater. Sci. Eng. A 2021, 820, 141511. [Google Scholar] [CrossRef]
- Brown, B.; Everhart, W.; Dinardo, J. Characterization of bulk to thin wall mechanical response transition in powder bed AM. Rapid Prototyp. J. 2016, 22, 801–809. [Google Scholar] [CrossRef]
- Ali, N.; Tomesani, L.; Ascari, A.; Fortunato, A. Fabrication of Thin Walls with and without Close Loop Control as a Function of Scan Strategy Via Direct Energy Deposition. Lasers Manuf. Mater. Process. 2022, 9, 81–101. [Google Scholar] [CrossRef]
- Mueller, M.; Franz, K.; Riede, M.; López, E.; Brueckner, F.; Leyens, C. Influence of process parameter variation on the microstructure of thin walls made of Inconel 718 deposited via laser-based directed energy deposition with blown powder. J. Mater. Sci. 2023, 58, 11310–11326. [Google Scholar] [CrossRef]
- Demeneghi, G.; Barnes, B.; Gradl, P.; Ellis, D.; Mayeur, J.R.; Hazeli, K. Directed energy deposition GRCop-42 copper alloy: Characterization and size effects. Mater. Des. 2022, 222, 111035. [Google Scholar] [CrossRef]
- Kok, Y.; Tan, X.P.; Wang, P.; Nai, M.L.S.; Loh, N.H.; Liu, E.; Tor, S.B. Anisotropy and heterogeneity of microstructure and mechanical properties in metal additive manufacturing: A critical review. Mater. Des. 2018, 139, 565–586. [Google Scholar] [CrossRef]
- Simpson, J.; Haley, J.; Cramer, C.; Shafer, O.; Elliott, A.; Peter, W.; Love, L.; Dehoff, R. Considerations for Application of Additive Manufacturing to Nuclear Reactor Core Components; Technical Report ORNL/TM-2019/1190; Oak Ridge National Laboratory: Oak Ridge, TN, USA, 2019; p. 1564201. [CrossRef]
- Liu, M.; Kumar, A.; Bukkapatnam, S.; Kuttolamadom, M. A Review of the Anomalies in Directed Energy Deposition (DED) Processes & Potential Solutions—Part Quality & Defects. Procedia Manuf. 2021, 53, 507–518. [Google Scholar] [CrossRef]
- Errico, V.; Posa, P.; Mazzarisi, M.; Angelastro, A.; Campanelli, S.L. Effects of Laser-Deposited Maraging Steel on L-PBF 316L Component. Metals 2022, 12, 1669. [Google Scholar] [CrossRef]
- ASTM E8; Standard Test Methods for Tension Testing of Metallic Materials. ASTM: West Conshohocken, PJ, USA, 2024.
- ASTM E606-21; Standard Test Method for Strain-Controlled Fatigue Testing. ASTM: West Conshohocken, PJ, USA, 2021.
- Diaz, A. 16—Surface texture characterization and optimization of metal additive manufacturing-produced components for aerospace applications. In Additive Manufacturing for the Aerospace Industry; Froes, F., Boyer, R., Eds.; Elsevier: Amsterdam, The Netherlands, 2019; pp. 341–374. [Google Scholar] [CrossRef]
- American Institute of Aeronautics and Astronautics. Mechanical Properties of Select AM Alloys. In Metal Additive Manufacturing for Propulsion Applications; Progress in Astronautics and Aeronautics; American Institute of Aeronautics and Astronautics, Inc.: Reston, VA, USA, 2022; pp. 717–774. [Google Scholar] [CrossRef]
- Gradl, P.R.; Cervone, A.; Gill, E. Surface texture characterization for thin-wall NASA HR-1 Fe–Ni–Cr alloy using laser powder directed energy deposition (LP-DED). Adv. Ind. Manuf. Eng. 2022, 4, 100084. [Google Scholar] [CrossRef]
- Maleki, E.; Bagherifard, S.; Bandini, M.; Guagliano, M. Surface post-treatments for metal additive manufacturing: Progress, challenges, and opportunities. Addit. Manuf. 2021, 37, 101619. [Google Scholar] [CrossRef]
- Pais, M.R.; Chow, L.C.; Mahefkey, E.T. Surface Roughness and Its Effects on the Heat Transfer Mechanism in Spray Cooling. J. Heat Transf. 1992, 114, 211–219. [Google Scholar] [CrossRef]
- Teasley, T.; Gradl, P.R.; Tinker, D.C.; Mireles, O.R.; Diaz, A. Component Performance and Application Characteristics. In Metal Additive Manufacturing for Propulsion Applications; Progress in Astronautics and Aeronautics; American Institute of Aeronautics and Astronautics, Inc.: Reston, VA, USA, 2022; pp. 527–592. [Google Scholar] [CrossRef]
- Tilson, W.G.; Katsarelis, C. SLM Inconel 718 Thin Section Study; NTRS Author Affiliations: Marshall Space Flight Center NTRS Report/Patent Number: MPFR-19-004 NTRS Document ID: 20205006448; NTRS Research Center; Marshall Space Flight Center (MSFC): Huntsville, AL, USA, 2020.
- Möller, N.; Hansson, S.O. Principles of engineering safety: Risk and uncertainty reduction. Reliab. Eng. Syst. Saf. 2008, 93, 798–805. [Google Scholar] [CrossRef]
- Margerit, P.; Weisz-Patrault, D.; Ravi-Chandar, K.; Constantinescu, A. Tensile and ductile fracture properties of as-printed 316L stainless steel thin walls obtained by directed energy deposition. Addit. Manuf. 2021, 37, 101664. [Google Scholar] [CrossRef]
- Yu, C.H.; Peng, R.L.; Luzin, V.; Sprengel, M.; Calmunger, M.; Lundgren, J.E.; Brodin, H.; Kromm, A.; Moverare, J. Thin-wall effects and anisotropic deformation mechanisms of an additively manufactured Ni-based superalloy. Addit. Manuf. 2020, 36, 101672. [Google Scholar] [CrossRef]
- Schneider, C.A.; Rasband, W.S.; Eliceiri, K.W. NIH Image to ImageJ: 25 years of Image Analysis. Nat. Methods 2012, 9, 671–675. [Google Scholar] [CrossRef] [PubMed]
- Dossett, J.L.; Totten, G.E. Steel Heat Treating Fundamentals and Processes; ASM International: Almere, The Netherlands, 2013; Volume 4A. [Google Scholar] [CrossRef]
- Laleh, M.; Sadeghi, E.; Revilla, R.I.; Chao, Q.; Haghdadi, N.; Hughes, A.E.; Xu, W.; De Graeve, I.; Qian, M.; Gibson, I.; et al. Heat treatment for metal additive manufacturing. Prog. Mater. Sci. 2023, 133, 101051. [Google Scholar] [CrossRef]
- Nguyen, H.D.; Pramanik, A.; Basak, A.K.; Dong, Y.; Prakash, C.; Debnath, S.; Shankar, S.; Jawahir, I.S.; Dixit, S.; Buddhi, D. A critical review on additive manufacturing of Ti-6Al-4V alloy: Microstructure and mechanical properties. J. Mater. Res. Technol. 2022, 18, 4641–4661. [Google Scholar] [CrossRef]
- Mfusi, B.J.; Mathe, N.R.; Tshabalala, L.C.; Popoola, P.A. The Effect of Stress Relief on the Mechanical and Fatigue Properties of Additively Manufactured AlSi10Mg Parts. Metals 2019, 9, 1216. [Google Scholar] [CrossRef]
- DebRoy, T.; Wei, H.L.; Zuback, J.S.; Mukherjee, T.; Elmer, J.W.; Milewski, J.O.; Beese, A.M.; Wilson-Heid, A.; De, A.; Zhang, W. Additive manufacturing of metallic components—Process, structure and properties. Prog. Mater. Sci. 2018, 92, 112–224. [Google Scholar] [CrossRef]
- Yadav, S.; Paul, C.P.; Jinoop, A.N.; Rai, A.K.; Bindra, K.S. Laser Directed Energy Deposition based Additive Manufacturing of Copper: Process Development and Material Characterizations. J. Manuf. Processes 2020, 58, 984–997. [Google Scholar] [CrossRef]
- Carroll, B.E.; Palmer, T.A.; Beese, A.M. Anisotropic tensile behavior of Ti–6Al–4V components fabricated with directed energy deposition additive manufacturing. Acta Mater. 2015, 87, 309–320. [Google Scholar] [CrossRef]
- AMS7857; Columbium (Niobium) Alloy Bars, Rods, and Extrusions 10Hf-1.0Ti, Recrystallization Annealed. SAE International: Troy, MI, USA, 1984.
- Li, C.; Liu, Z.Y.; Fang, X.Y.; Guo, Y.B. Residual Stress in Metal Additive Manufacturing. Procedia CIRP 2018, 71, 348–353. [Google Scholar] [CrossRef]
- Additive Manufacturing of Liquid Rocket Engine Combustion Devices: A Summary of Process Developments and Hot-Fire Testing Results. In Proceedings of the AIAA Propulsion and Energy Forum, Cincinnati, OH, USA, 9–11 July 2018.
- Hobbs, T.; Colon, B.; Beamer, C.; Tirado, F.R.; Romnes, C.; Mireles, O. Heat Treatment Optimization of Laser Powder Bed Fusion Additive Manufacture C103. In Proceedings of the 153rd Annual Meeting and Exhibition of The Minerals, Metals & Materials Society (TMS), Orlando, FL, USA, 3–7 March 2024; undefined NTRS Document ID: 20240002139. NTRS Research Center, Glenn Research Center (GRC): Cleveland, OH, USA, 2024. [Google Scholar]
- Hertzberg, R.W. Chapter 1: Tensile Response of Materials. In Deformation and Fracture Mechanics of Engineering Materials, 4th ed.; John Wiley & Sons, Inc.: Hoboken, NJ, USA, 1995; pp. 3–56. [Google Scholar]
- Schroeder, C.J.; Parrington, R.J.; Maciejewski, J.O.; Lane, J.F. ASM Handbook Volume 12: Fractography; ASM Handbook; ASM International: Almere, The Netherlands, 1987. [Google Scholar]
- Fonda, R.W.; Rowenhorst, D.J. Crystallographic Variability in Additive Manufacturing. In IOP Conference Series: Materials Science and Engineering; IOP Publishing: Bristol, UK, 2022; Volume 1249, p. 012007. [Google Scholar] [CrossRef]
- Philips, N.; Rock, C.; Cunningham, N.; Cooper, J.; Horn, T. Electron Beam Powder Bed Fusion of ATI C103TM Refractory Alloy. Metall. Mater. Trans. A 2024, 55, 2472–2484. [Google Scholar] [CrossRef]
- Wang, Z.; Wang, J.; Xu, S.; Liu, B.; Sui, Q.; Zhao, F.; Gong, L.; Liu, J. Influence of powder characteristics on microstructure and mechanical properties of Inconel 718 superalloy manufactured by direct energy deposition. Appl. Surf. Sci. 2022, 583, 152545. [Google Scholar] [CrossRef]
- Yu, C.H.; Leicht, A.; Peng, R.L.; Moverare, J. Low cycle fatigue of additively manufactured thin-walled stainless steel 316L. Mater. Sci. Eng. A 2021, 821, 141598. [Google Scholar] [CrossRef]
- Indeck, J. The Effect of Microstructural Defect Evolution during Elastic Fatigue Loading on Subsequent Mechanical Properties. Ph.D. Thesis, The University of Alabama in Huntsville, Huntsville, AL, USA, 2021. [Google Scholar]


Disclaimer/Publisher’s Note: The statements, opinions and data contained in all publications are solely those of the individual author(s) and contributor(s) and not of MDPI and/or the editor(s). MDPI and/or the editor(s) disclaim responsibility for any injury to people or property resulting from any ideas, methods, instructions or products referred to in the content. |
© 2024 by the authors. Licensee MDPI, Basel, Switzerland. This article is an open access article distributed under the terms and conditions of the Creative Commons Attribution (CC BY) license (https://creativecommons.org/licenses/by/4.0/).