Article

Microstructure Control for Enhancing the Combination of Strength and Elongation in Ti-6Al-4V through Heat Treatment

1
Advanced Packaging Integration Center, Korea Institute of Industrial Technology, Incheon 21999, Republic of Korea
2
Department of Materials Science and Engineering, Hanyang University, Seoul 04763, Republic of Korea
3
Department of Convergence Manufacturing System Engineering, Korea National University of Science and Technology (UST), 217 Gajeong-ro, Daejeon 34113, Republic of Korea
*
Author to whom correspondence should be addressed.
Metals 2024, 14(9), 985; https://doi.org/10.3390/met14090985
Submission received: 31 July 2024 / Revised: 28 August 2024 / Accepted: 28 August 2024 / Published: 29 August 2024

Abstract

:
For the application of Ti-6Al-4V alloys in urban air mobility, safety is very important, so achieving excellent strength and toughness is essential to prevent fractures. Regarding toughness, which is a combination of strength and ductility, it is necessary to derive the optimal heat treatment conditions for this combination of Ti-6Al-4V alloy and further understand its microstructure and fracture characteristics. For this purpose, this study investigated the microstructure in terms of grain size, plate thickness, and element distribution, as well as mechanical properties, including phase hardness and tensile properties, of Ti-6Al-4V alloy subjected to solution treatment and aging (STA) heat treatment under various aging conditions. As a result, this study suggests that solution treatment followed by aging at 630 °C for 480 min can achieve approximately 26% higher toughness than the just-solution treatment process. This is because there is little difference in hardness between the equiaxed α and basketweave structures, and β plates, which contain an excessive V between α plates, function like fibers and delay fracture.

Graphical Abstract

1. Introduction

In recent years, the urban air mobility (UAM) market has rapidly emerged as a next-generation transportation solution that solves the urgent issue of urban traffic congestion and provides efficient transportation [1,2]. One of the most critical problems to be solved in the development of UAM is safety [2,3]. This requires not only having systems to avoid collisions with other aircraft and obstacles during flight [3], but also ensuring that the materials composing the aircraft possess high strength while maintaining high ductility [4,5]. Specifically, toughness represents the total amount of energy that a material can absorb during the deformation process, and is a mechanical property that is an appropriate balance between strength, which is the material’s ability to withstand deformation, and ductility, which is the ability to maintain a load without breaking [6]. In other words, applying high-strength and high-toughness materials to UAM can prevent sudden structural failures from external impacts or excessive loads, thus enhancing durability and safety. However, because strength and ductility are generally in a trade-off relationship in most metals [6,7], it is still difficult to obtain a high-toughness alloy, which has both excellent strength and ductility [8].
The Ti-6Al-4V (Ti64) alloy is one of the representative lightweight alloys used in aircraft and boasts excellent properties such as strength, corrosion resistance, and high-temperature properties [9,10,11,12]. To improve strength, solution treatment and aging (STA) heat treatment is commonly used, which involves two cycles of heat treatment consisting of solution treatment (ST) and aging (A) [12,13]. When performing the STA heat treatment below the β-transus temperature, a microstructure consisting of equiaxed α and transformed β, known as a duplex microstructure, is observed [14,15,16,17]. Numerous studies have been conducted regarding the microstructural property changes under various ST and A conditions. S. Huang et al. [18] found that higher ST temperatures lead to greater concentration variations in V and Al in transformed β compared to equiaxed α. Y.C. Lin et al. [19] found that coarsened secondary α and equiaxed α combined to form new curved lamellar α, while N. Kherrouba et al. [20] suggested a relationship between the precipitation of secondary α and partial V diffusion in transformed β. Regarding the mechanical properties under various STA conditions, T. Morita et al. [21], S. Tanka et al. [22], and A. Ajiz et al. [23] observed microstructures and mechanical properties under different aging conditions after quenching at 930 °C for 60 s, and found that aging within the range of 530–580 °C has the highest tensile strength. S.T. Oh et al. [24] noted that a higher amount of retained β after ST results in a pronounced TRIP effect during aging, with the best combination of tensile properties observed at 550 °C for 300 s. Y. Vahidshad et al. [25] reported that ST at 950 °C followed by aging at 500 °C was the condition with the highest tensile strength with Ti3Al. G. Perumal et al. [26] investigated the mechanical properties and wear characteristics under various STA conditions, revealing that a fine lamellar structure exhibits high hardness, strength, and low wear rate. However, these studies [21,22,23,24,25,26] did not analyze from the perspective of changes in toughness, which is the combination of strength and elongation, according to STA conditions. Recently, with regard to Ti64 STA heat treatment and toughness, Q. Zhu et al. [27] and R.N. Elshaer et al. [28] reported that air cooling in ST or water cooling and aging in ST showed higher toughness. However, these studies [27,28] lack sufficient explanation regarding the microstructural features for enhancing toughness and their correlation with fractographies under different STA conditions.
As in the aforementioned studies, there still remains a lack of research on STA heat-treated Ti64 to achieve a high combination of strength and elongation, especially regarding the correlation between microstructural characteristics and fractographies. Moreover, the hardness of each phase at the micro-scale changes due to phase transformation, grain size, and redistribution of elements within the phase during STA, which ultimately affects the macro-scale tensile properties due to the interaction of each phase under tensile loading [29]. Therefore, in this study, microstructural characteristics such as size and thickness of the phase and V distribution were precisely controlled by changing the aging temperature and time during STA heat treatment, and the phase hardness, strength, elongation and modulus of toughness were compared for each heat treatment condition. Consequently, we propose that aging at 630 °C for 480 min is the optimal heat treatment condition for a high modulus of toughness with proper strength.

2. Materials and Experimental Procedures

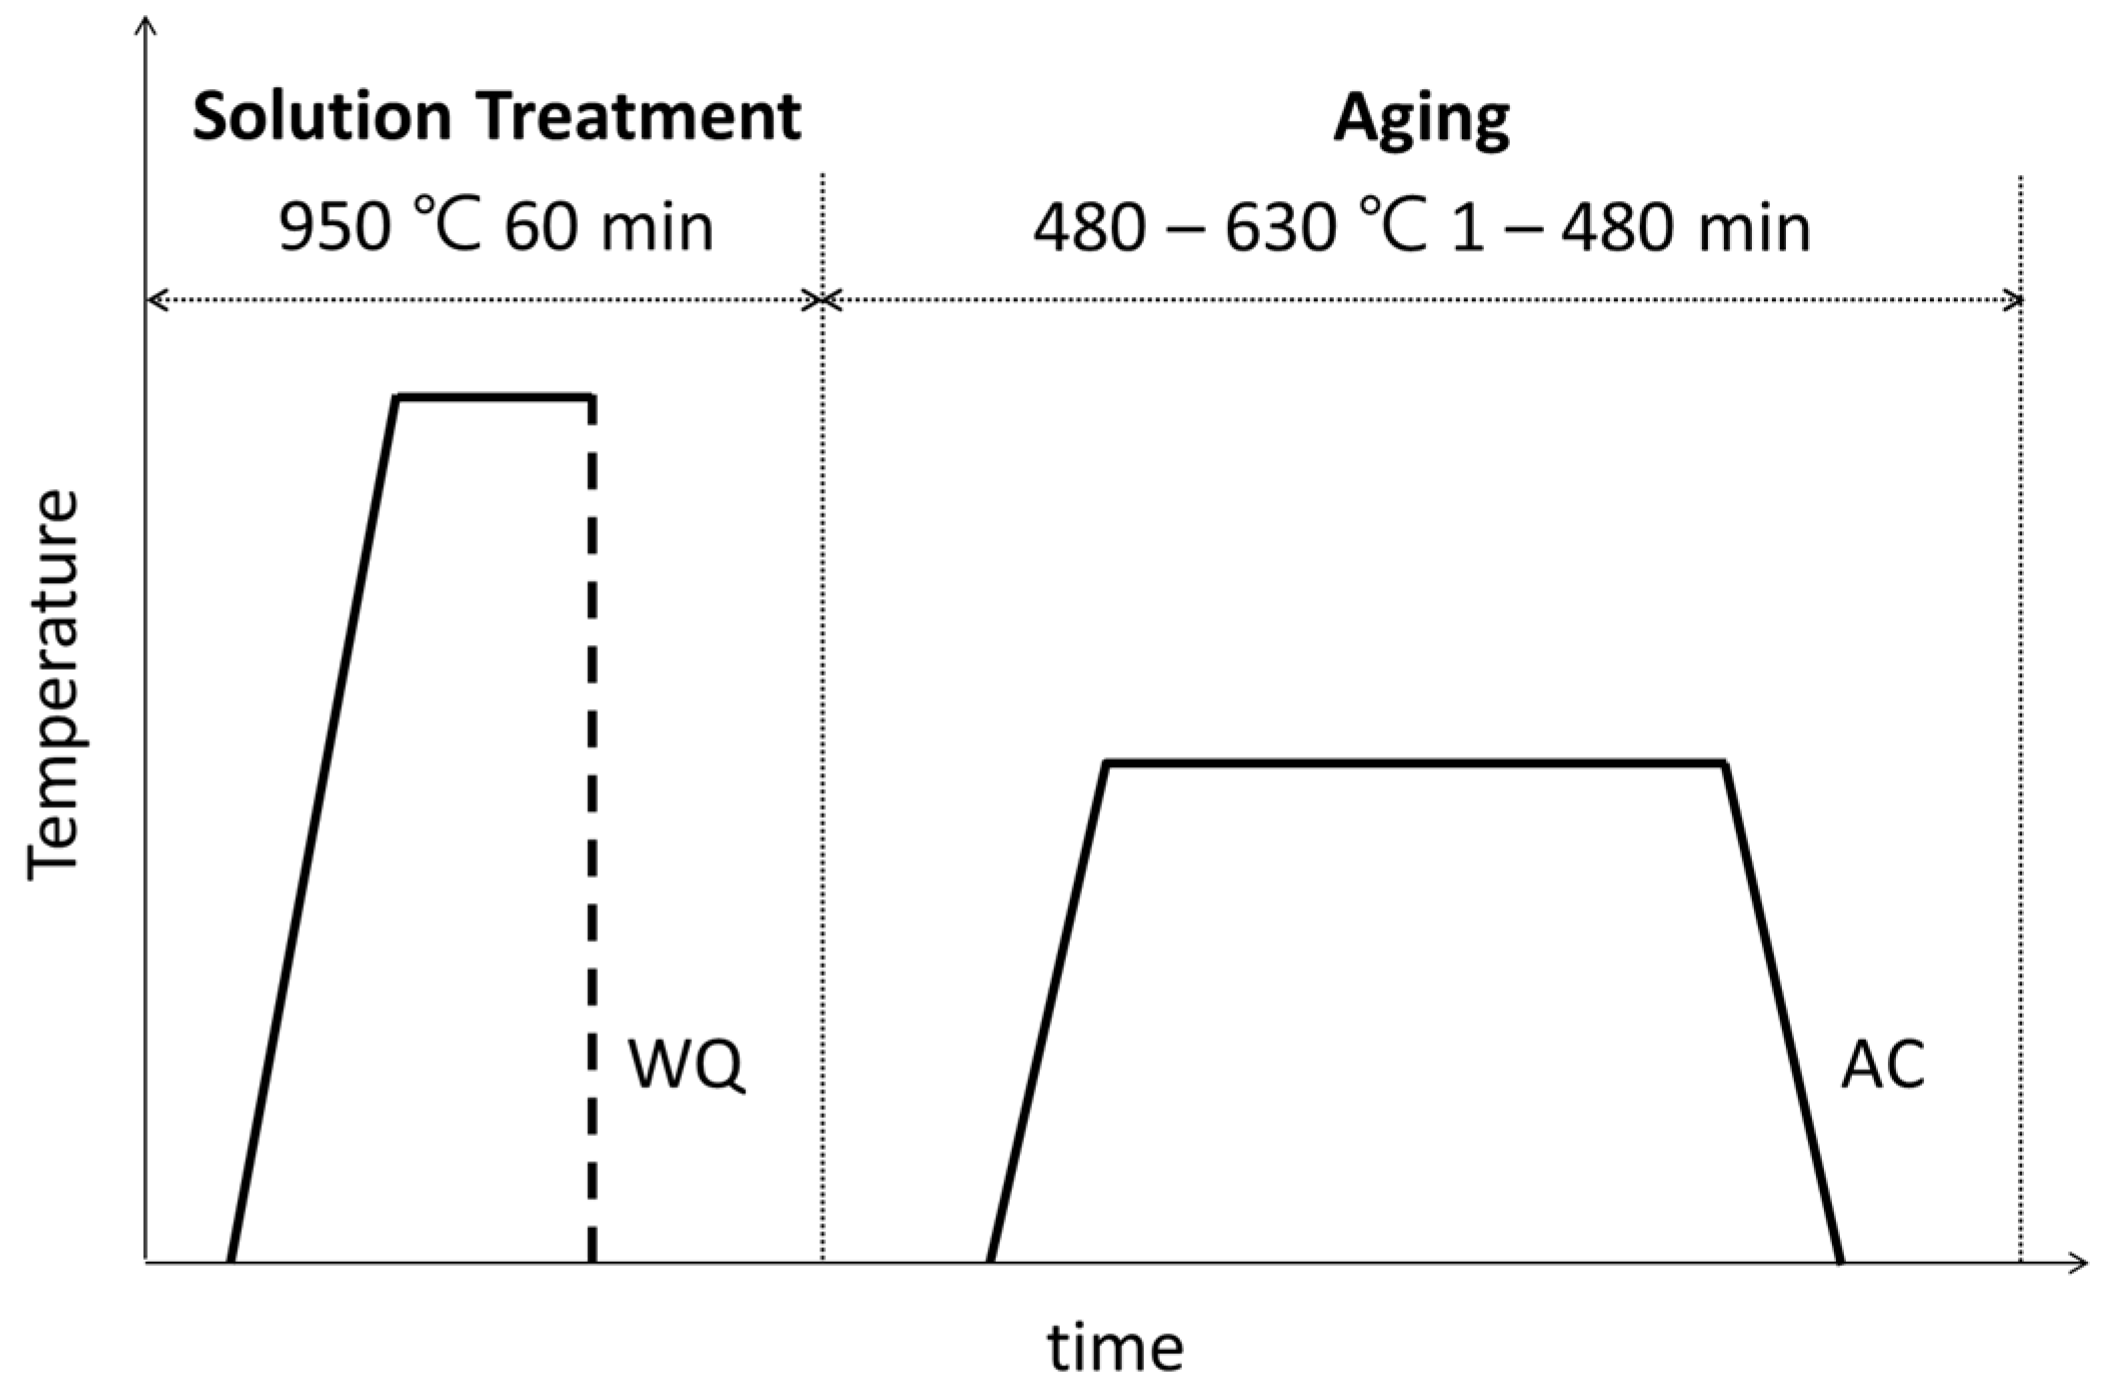
2.1. Material and Heat Treatment Conditions

In this study, a rod-shaped Ti-6Al-4V alloy ( 70   m m × 2000   m m ) fabricated via a vacuum arc remelting (VAR) process by KPC Metal Co., Ltd. (Gyeongsan, Republic of Korea), served as a starting material. The chemical composition of the alloy is obtained using inductively coupled plasma optical emission spectroscopy (ICP-OES, Optima 7300DV, PerkinElmer, Hopkinton, MA, USA) analysis, which is presented in Table 1. Additionally, the as-received sample is a fully equiaxed microstructure, which consists with equiaxed α and β in Figure 1.
Samples for heat treatment were machined to dimensions of 10 × 10 × 55   ( mm 3 ) . The samples were solution-treated at 950 °C for 1 h followed by water quenching (WQ) and aging at temperatures ranging from 480 to 630 °C for durations ranging from 1 min to 480 min, then followed by air cooling (AC), as illustrated in Figure 2. All the heat treatments were performed in a quartz furnace under vacuum ( 6 × 10 5   torr ).

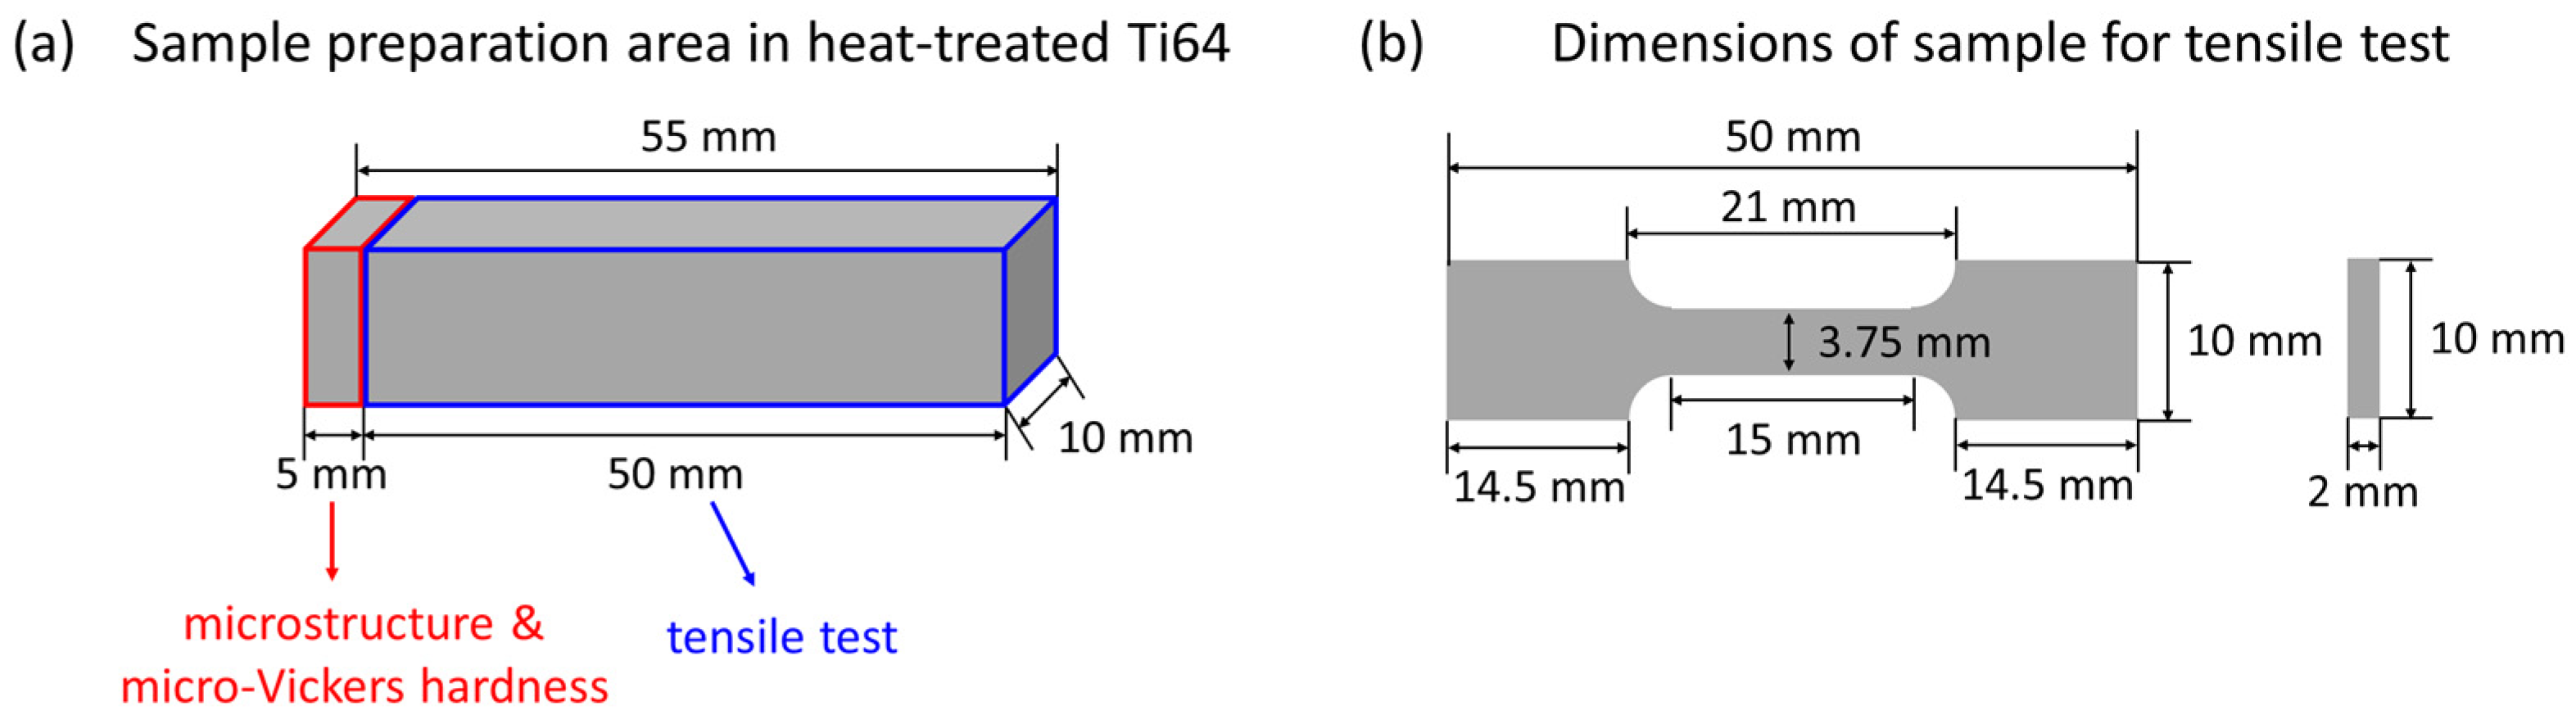
2.2. Characterization

The hardness of all STA samples before and after aging was measured using a micro-Vickers hardness tester (HM–210B, Mitutoyo, Japan) with a load of 1 kgf on a machined 10 × 10 × 5   ( mm 3 ) area (Figure 3a). Then, in the hardness profile according to the various aging condition, which is, in detail, described in Section 3.1, we chose 4 conditions to analyze further microstructural and mechanical properties; these conditions are solution treatment (ST) and 3 aging conditions at 480 °C for 1 min (A_480-1), 530 °C for 120 min (A_530-120) and 630 °C for 480 min (A_630-480).
Then, the microstructures of 4 conditions (ST, A_480-1, A_530-120, A_630-480) were analyzed using X-ray diffraction (XRD, X’pert–Pro MPD, PANalytical, Marvern, UK), optical microscopy (OM, HRM-300, Huvitz, Houston, TX, USA) and field-emission scanning electron microscopy (FE-SEM, NNS-450, FEI, Hilsboro, OR, USA). The XRD was analyzed with the Cu Kα radiation source in the 2θ range of 30–90 ° at a scan speed of 0.02 ° min−1. Then, the same samples were mechanically grinded and polished using a 1 μm diamond suspension, followed by an oxide suspension (OP-S solution), and etched using Kroll’s reagent (5 mL HF and 10 mL HNO3 in 85 mL distilled H2O) for OM and SEM analysis. Grain size and plate thickness were also measured at 7 points in OM images, and at 9 plates in SEM microstructures, respectively. Additionally, the distribution of Al and V in the STA heat-treated samples was analyzed using electron probe micro-analysis (EPMA, JXA-8500F, JEOL, Tokyo, Japan) for line scanning across the duplex phases.
The hardness of each phase in the duplex structure under various aging conditions was measured using a micro-Vickers hardness tester with a 0.05 kgf load. The hardness value for each structure represents an average of 5 measurements. Tensile tests were conducted 3 times using a universal testing machine (5982, Instron, Norwood, MA, USA) at room temperature with a test speed of 0.001/s. The tensile samples were prepared as proportional specimens in compliance with the ASTM E8/E8M [30]. The machining location of tensile samples is shown in Figure 3a, and the sample dimensions are provided in Figure 3b. Following the tensile test, fractographies were analyzed using SEM.

3. Results and Discussion

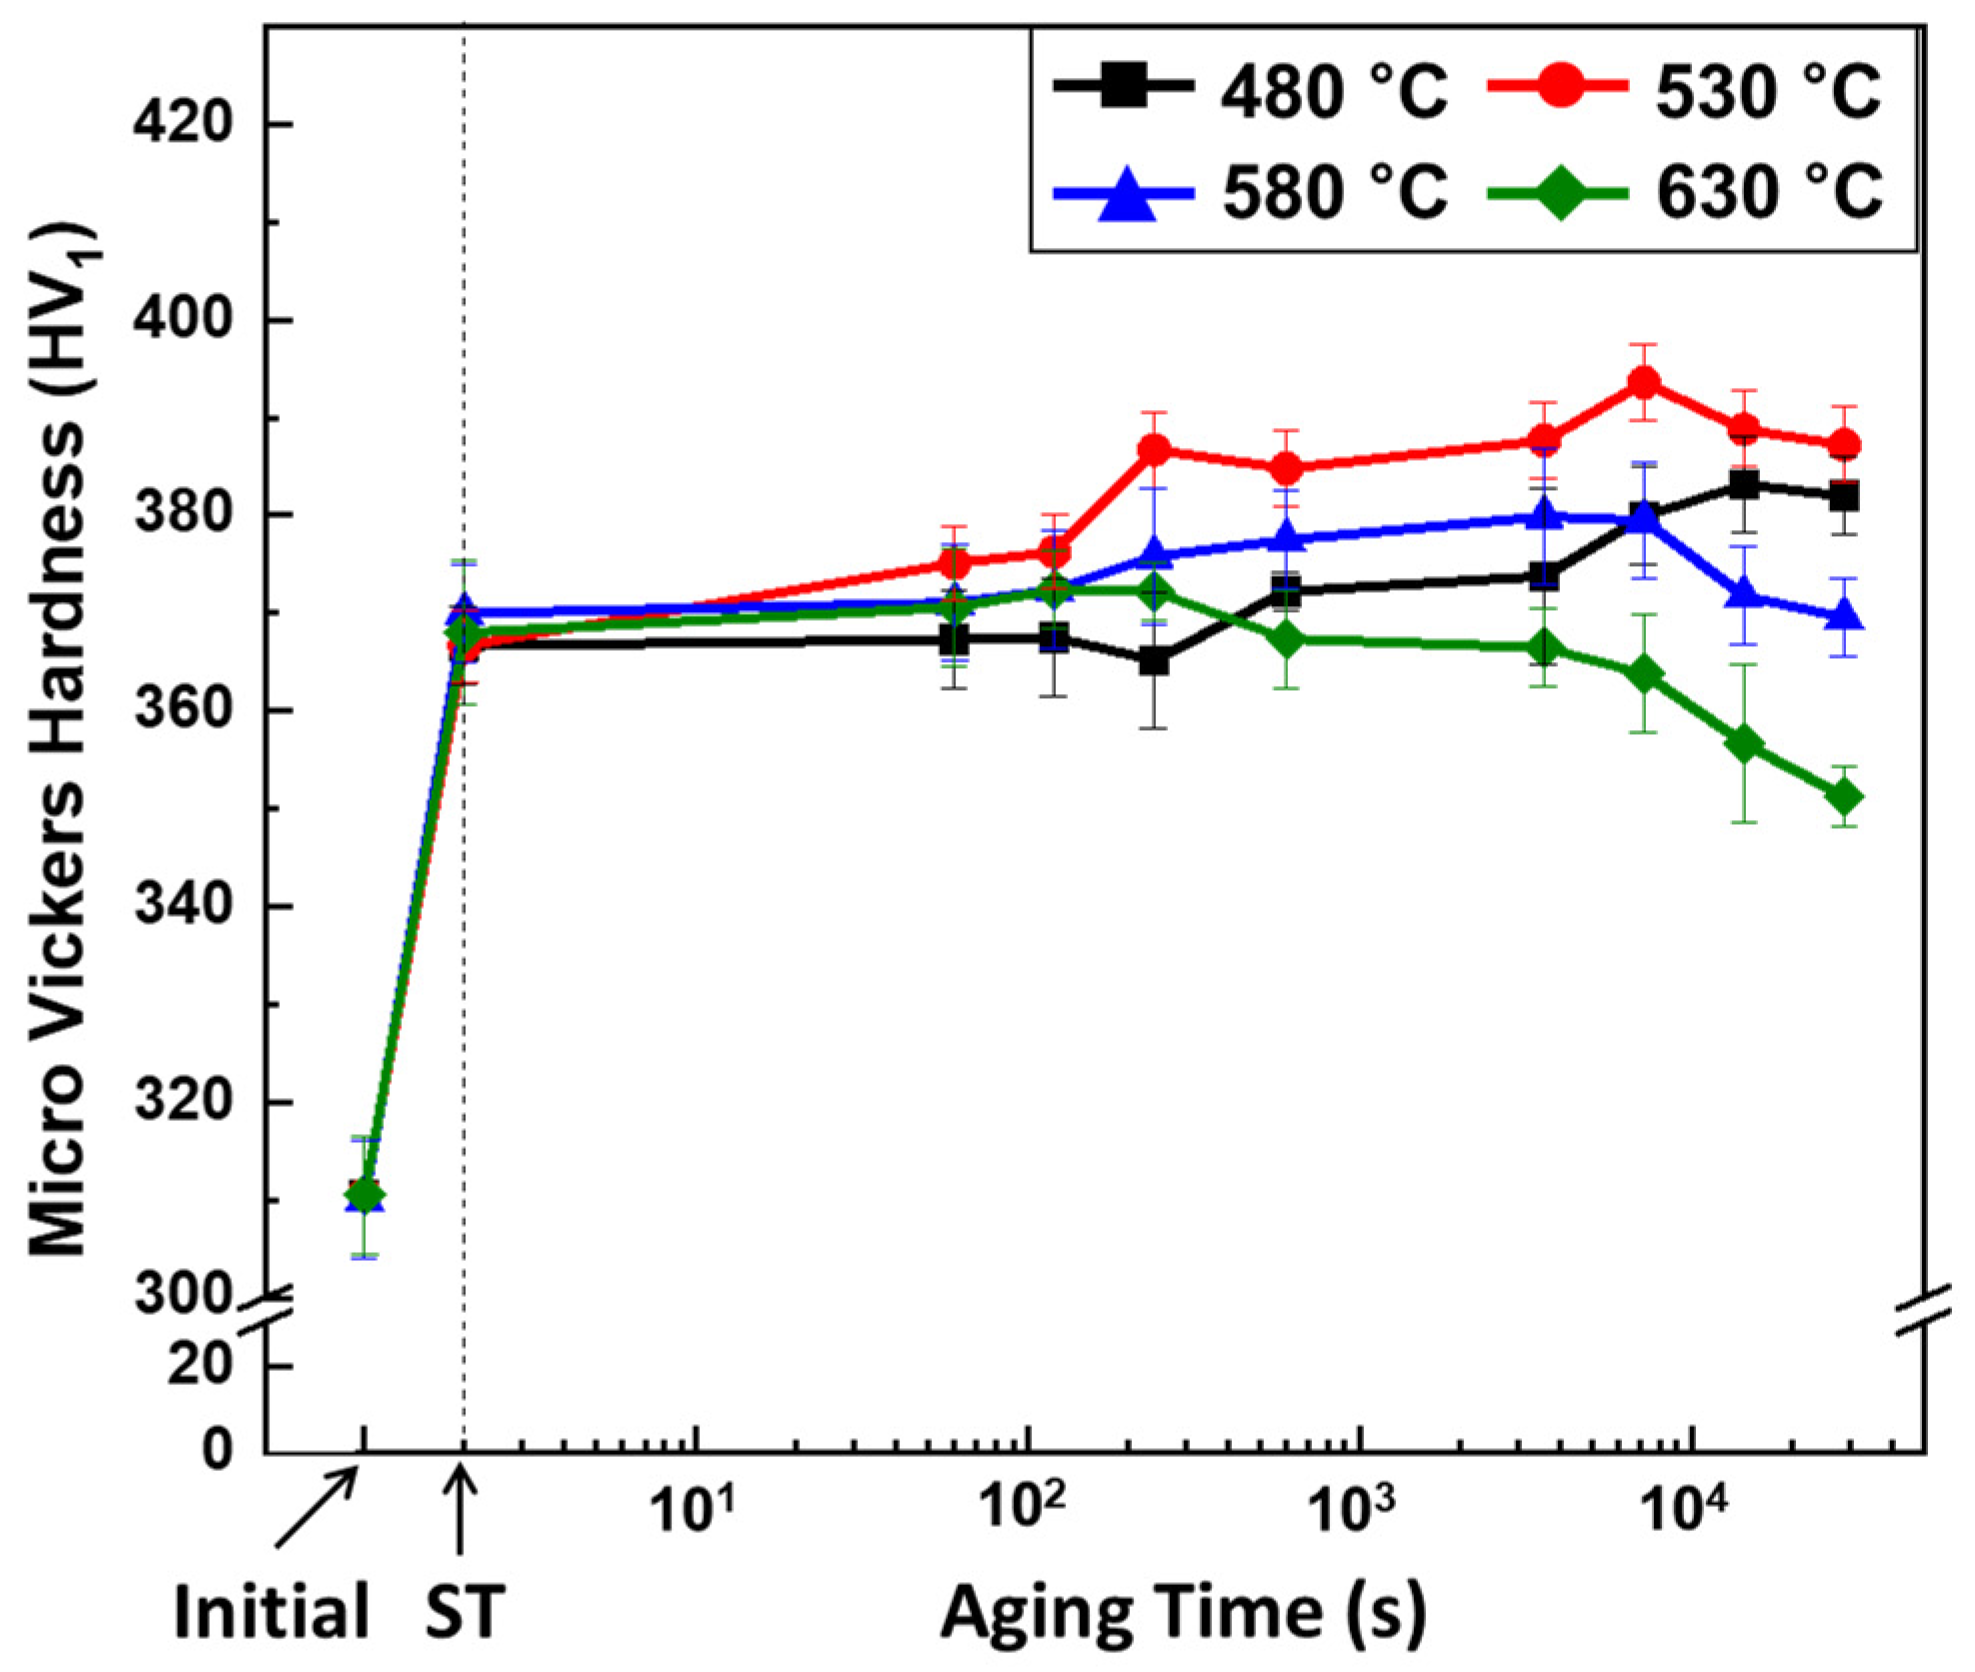
3.1. Hardness Profile

The hardness profile before and after STA heat treatment is presented in Figure 4. In Figure 4, the Ti64 alloy before heat treatment is indicated as the ‘initial’ alloy. After ST, the hardness of the initial alloy increases significantly to 366.7 (±7.4) Hv. In several studies, this increase in hardness is attributed to the transformation of the β to α′ during quenching [13,21,22,23]. Subsequent short-term aging (1 min) further elevates the hardness of the Ti-6Al-4V alloy slightly. The hardness of STA samples increases with increasing aging time, until it reaches a maximum (peak hardness), after which it begins to decrease. The highest hardness, measured at 393.6 (±3.9) Hv, is achieved at the sample aged at 530 °C for 120 min. Moreover, the holding time required for an STA sample to reach peak hardness decreases with an increasing holding temperature. At 630 °C aging, the peak hardness of 372.4 (±5.97) Hv is observed in the sample aged for 2 min, after which it decreases. The sample aged at 630 °C for 480 min has 351.27 (±3.26) Hv, which is the lowest value after STA.
Therefore, in the hardness profiles among the solution treatment and several aging conditions, we chose four conditions, which are the solution treatment (ST) and three conditions of aging (A_480-1, A_530-120, A_630-480). A_480-1 is the short aging step representing the case of holding at the lowest temperature (480 °C) for the shortest time (1 min); A_530-120 corresponds to holding at 530 °C for 120 min, which is the highest hardness value; and 630–480 represents holding at the highest temperature (630 °C) for the longest duration (480 min), which is the lowest hardness value in all aging conditions.

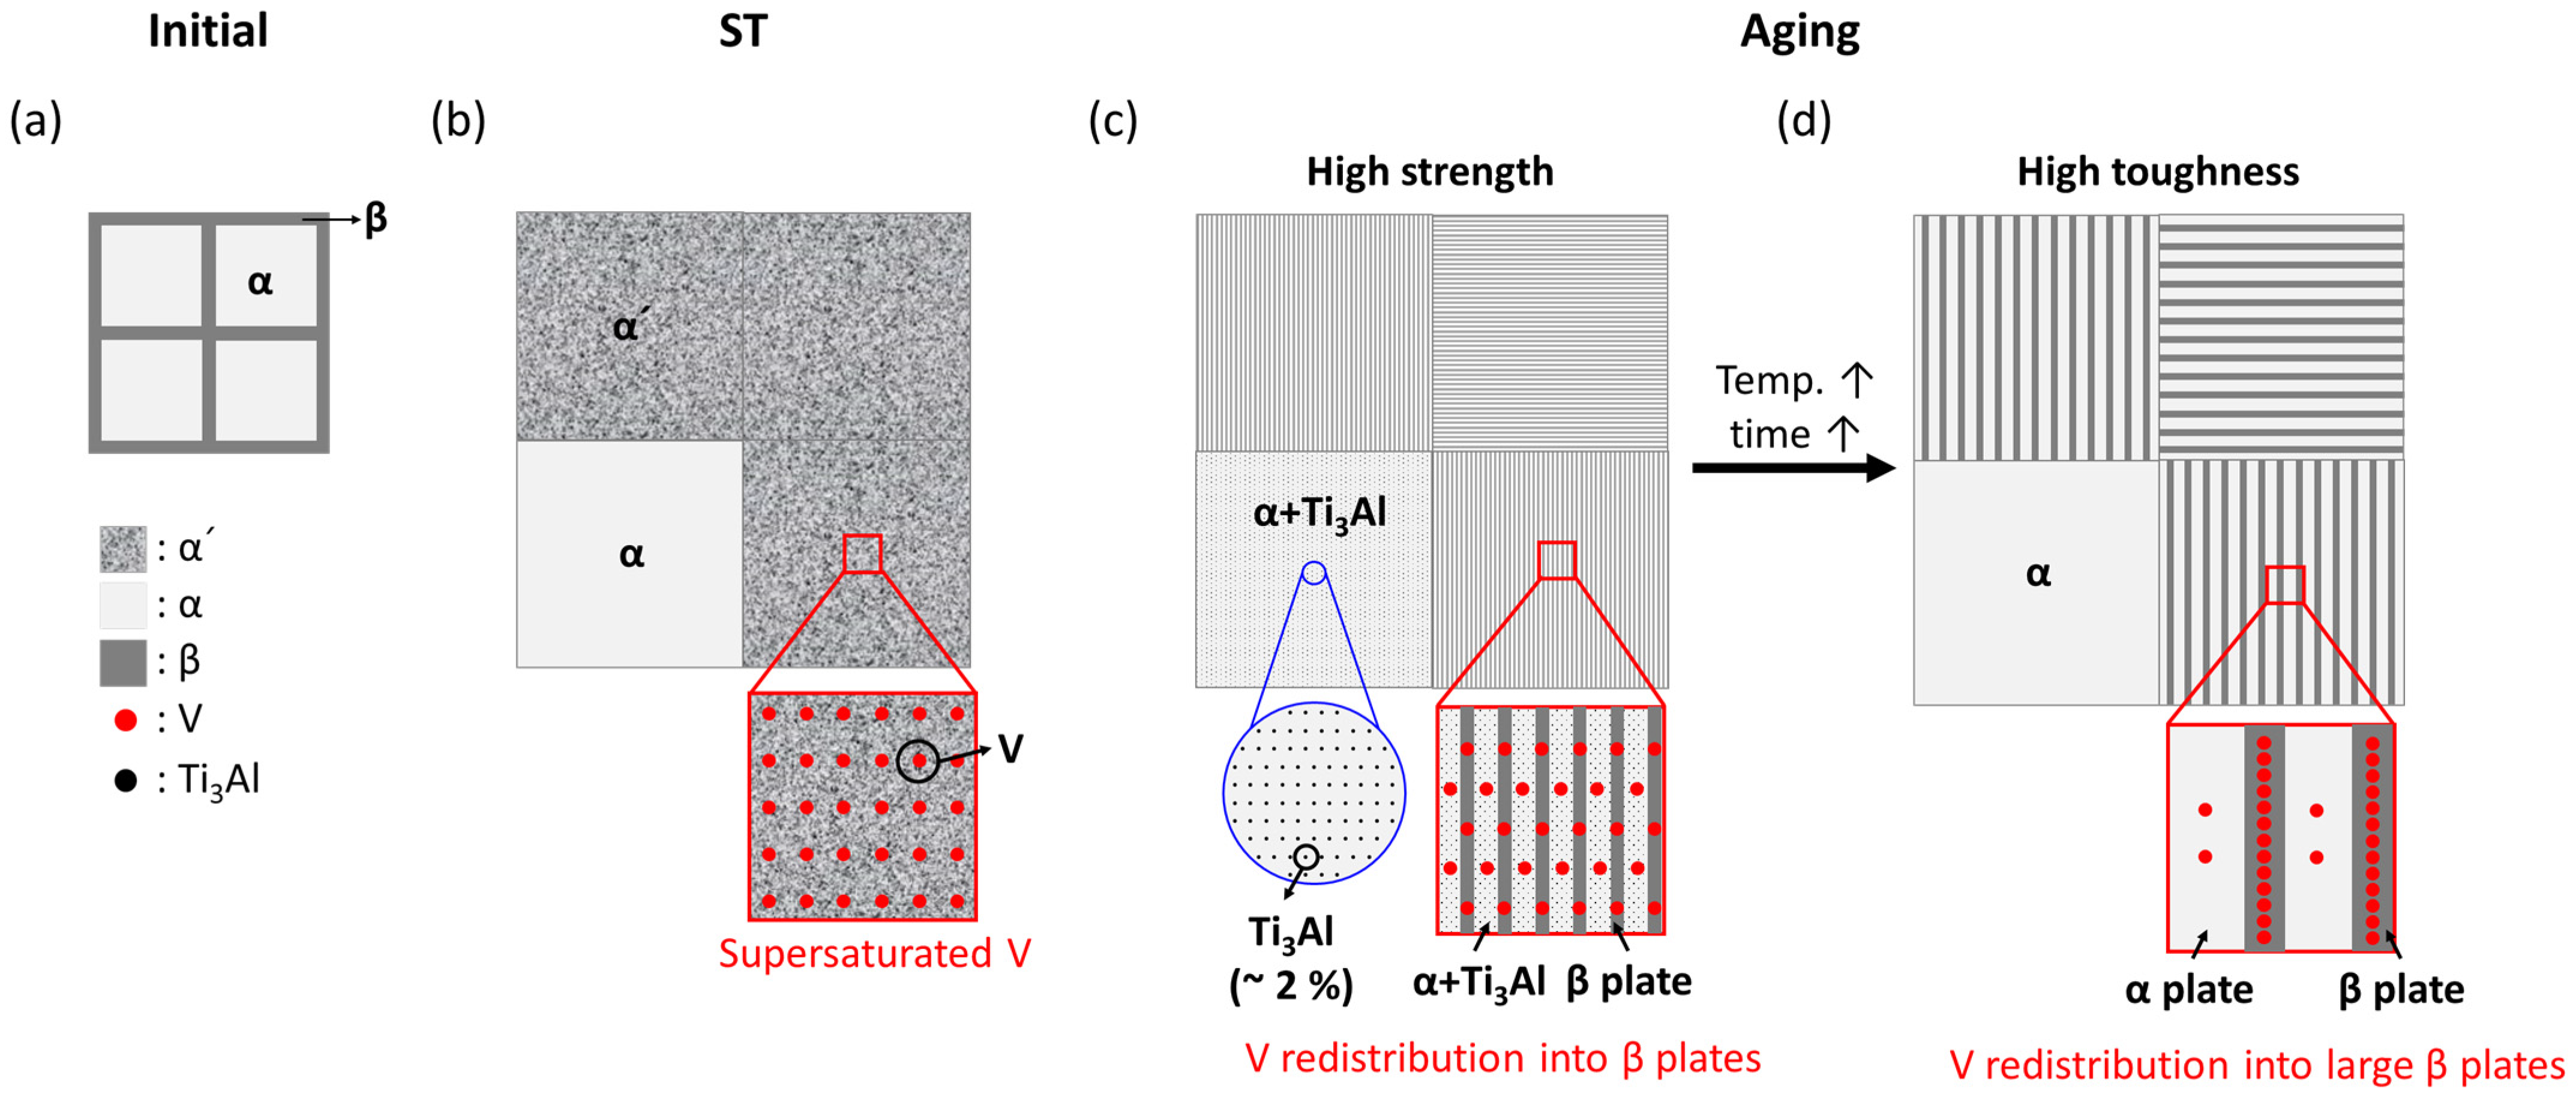
3.2. Microstructure Model

Before discussing the microstructure, we proposed the microstructure model that changes during STA, schematically shown in Figure 5, which is based on several studies [13,14,15,16,17,18,19,20,21,22,23,24,25,26,27,28]. We illustrated that the α′ phase is a granite-like pattern that has black dots on a gray background, the α phase is light gray, and the β phase is dark gray. The red dot is the V element, and the black dot is Ti3Al, which is a representative precipitated phase in α during aging [11,13]. The initial Ti64, which consists of equiaxed α and β in Figure 5a, changes its microstructure during STA heat treatment as follows: While holding sufficient time in ST, the microstructure consists of more than half of β and α (Figure 5b), and V is diffused into β at the temperature [13,18]. During rapid cooling by water, β is transformed into α′, a type of martensite phase, and V is supersaturated in α′ because diffusion from β to α is impossible due to the fast cooling rate (Figure 5b) [11,13].
During aging, the secondary step, α′ is transformed into the plate-like α and β by redistributing the V element into β [11,12,13,20]. According to X. Shi et al. [31], when the amount of interfacial area between α and β plates is larger, the resistance of dislocation movement increases, so the alloys become harder and more difficult to deform. Also, Ti3Al, which is the hard phase, can be precipitated in α during aging [9,11,32]. So, we expected that for Ti64 to have the highest strength, the microstructure should be composed of the sufficiently fine α, β plates and Ti3Al phase, as shown in Figure 5c. The Ti3Al phase fraction during aging is approximately 2%, calculated using the JMatPro ver.7.0. [33]. If the aging temperature and time are increased, the α and β plates with high V may become coarse, leading to the potential dissolution of Ti3Al. This can result in a decrease in hardness and strength while increasing ductility. However, if this change is moderate, toughness may be maximized, as illustrated in Figure 5d.
Therefore, we propose the two models for the strongest case and the toughest microstructures, as shown in Figure 5c,d. Figure 5c, which is predicted to have the highest hardness and strength, consists of equiaxed α, plate-like α and β with concentrated V, and some Ti3Al. Figure 5d represents the example with the highest ductility and toughness, with a microstructure consisting of equiaxed α, coarse α and β plates and the highest V concentration in the β plate.

3.3. Microstructure Characterization

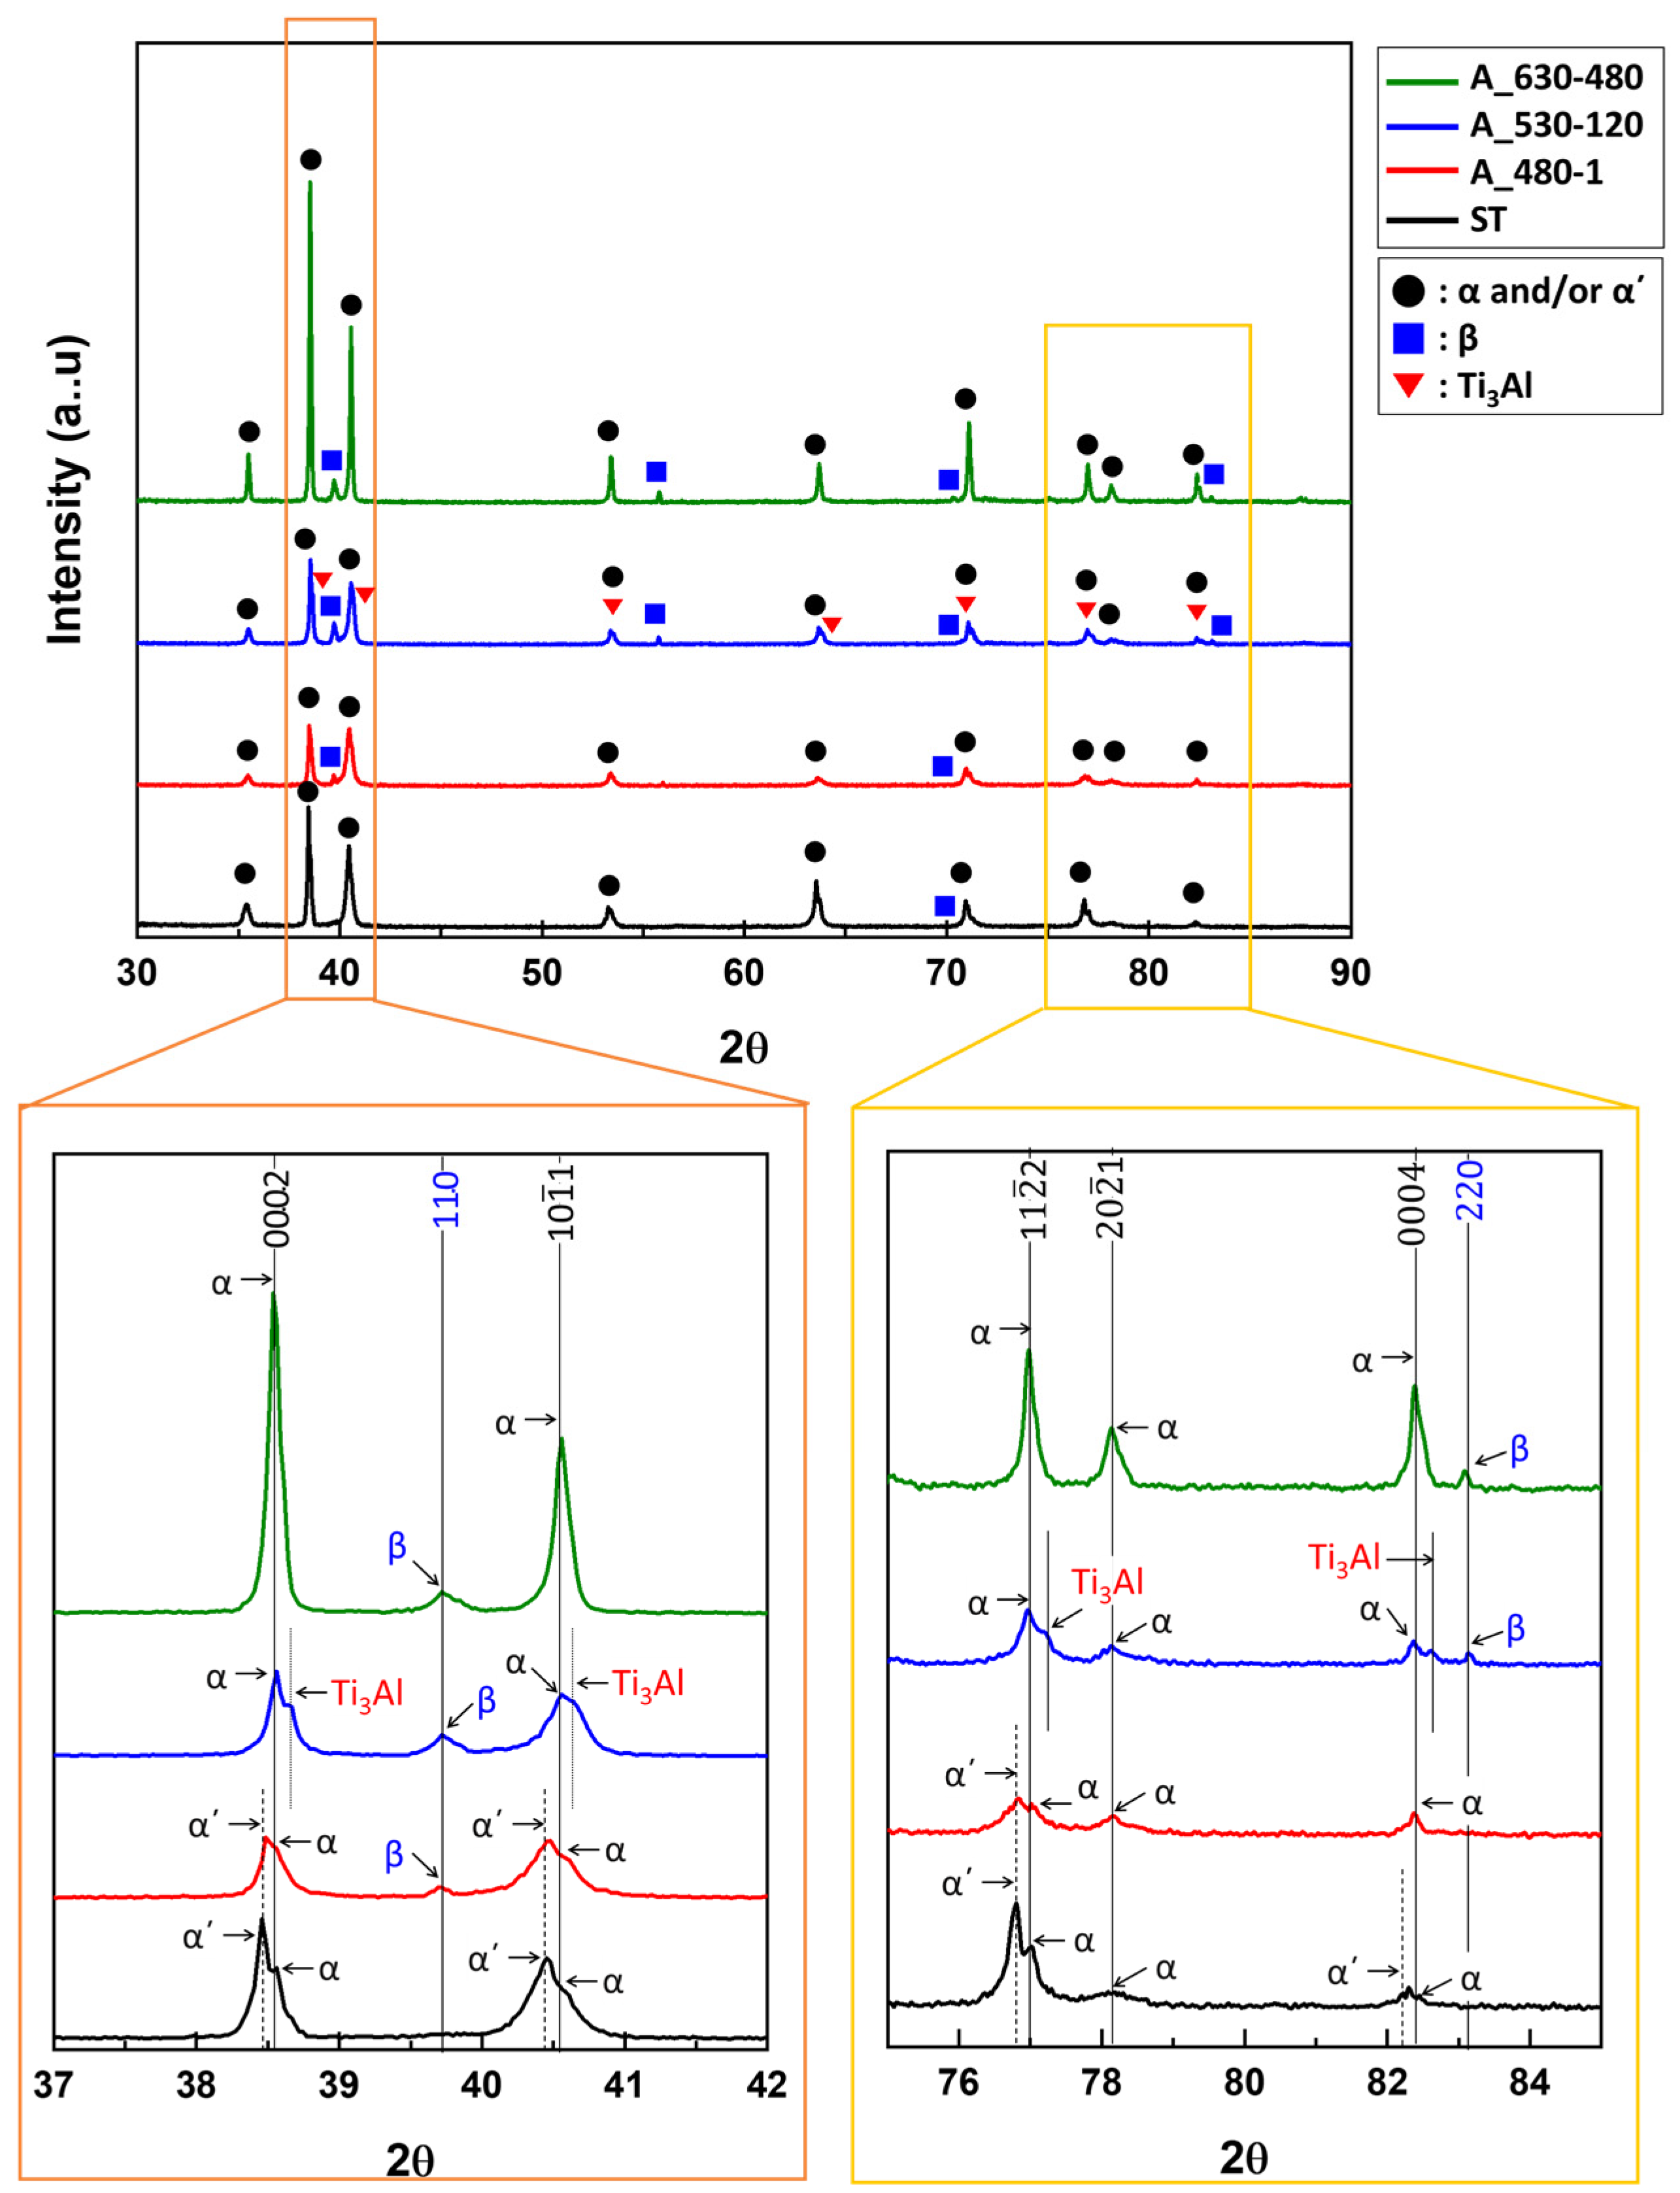
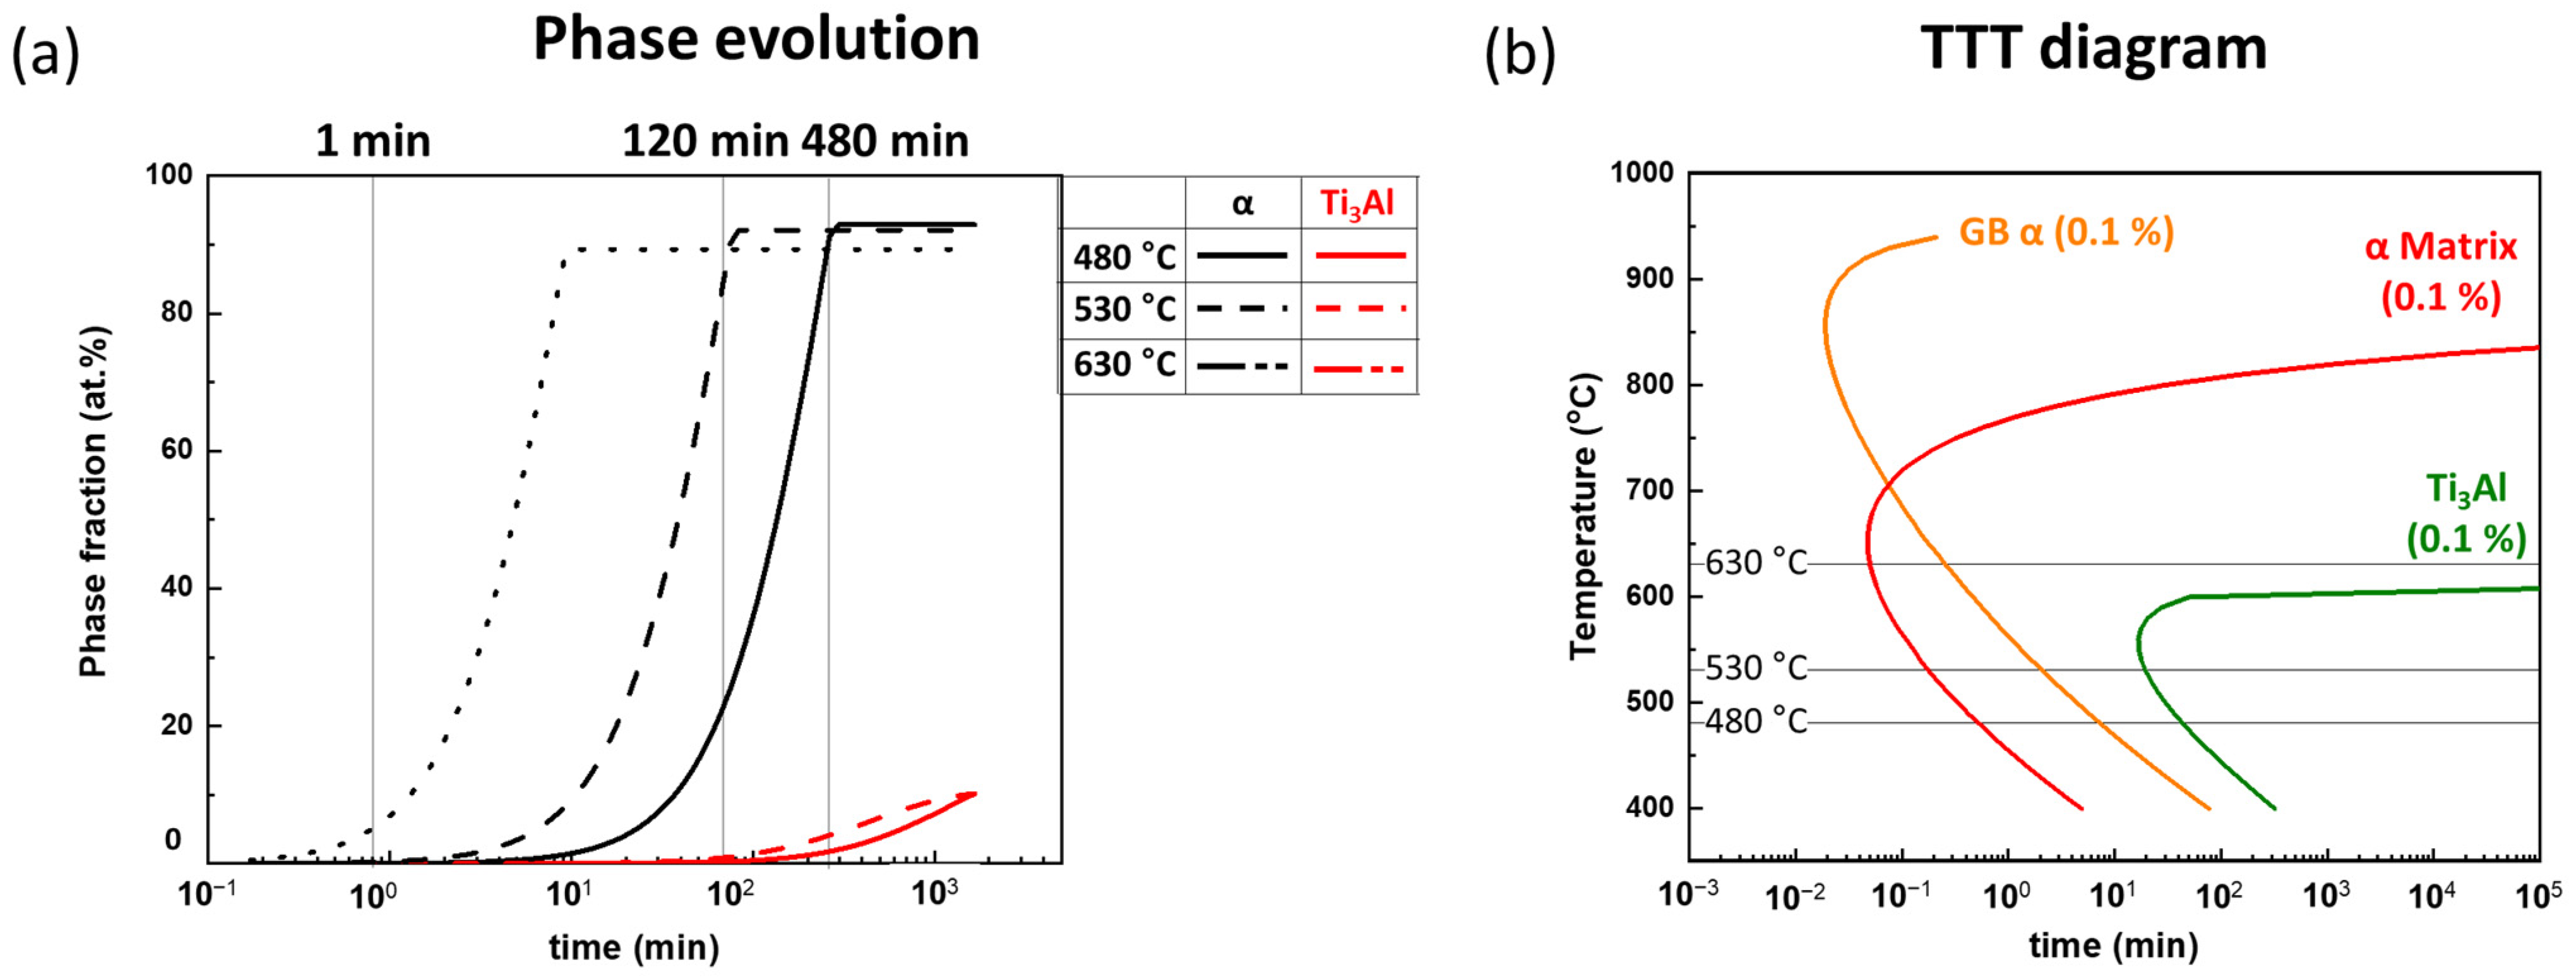
3.3.1. X-ray Diffraction and Phase Evolution

Figure 6 displays the XRD results for ST and several aging conditions (A_480-1, A_530-120, A_630-480). Peaks in XRD patterns were indexed with reference to the Inorganic Crystal Structure Database (ICSD) cards for α-Ti (ICSD 01-089-5009), β-Ti (ICSD 01-089-4913) and Ti3Al (ICSD 03-065-4565) phases. The ST sample predominantly exhibits α/α′ peaks in the entire theta range. In the magnified images of 37 to 42.5° and 75 to 85°, some separated, inflected and shifted peaks are observed near the closet peak of the α phase peaks. Here, α is the primary α formed during isothermal holding in the solution treatment. α′ is formed by rapid cooling; due to the residual stress caused by the quenching process, it exhibits a slightly shifted peak compared to α [32]. Additionally, the ST sample shows a (211) β peak, suggesting the presence of retained β. This could be because a small amount of β that has not yet been transformed into α′ is retained due to rapid cooling. Therefore, the ST sample contains α′, α and retained β phases.
During aging, as studied by Morita et al. [21] and other studies [22,23,24,25], α is precipitated in α′, so α′ is decomposed to widmanstätten α + β, and subjected to a longer aging process, and Ti3Al can be precipitated. Ti3Al peaks are similar to α, but due to the lattice distortion, the peaks are also shifted, and the peak information is in the Ti3Al ICSD card. The A_480-1 condition comprises α and β peaks, with more β peaks detected than in the ST condition, and there are some retained α′ peaks in the magnified area. Regarding this phenomenon, we calculated the evolution of phase fraction according to the holding time at each aging temperature after solution treatment at 950 °C (Figure 7a); this was based on the time–temperature–transformation (TTT) diagram (Figure 7b) using JMatPro ver. 7.0. [33]. According to the graph, in the case of aging at 480 °C for 1 min, the transformation of α′ into α starts, but does not reach the equilibrium fraction of α. Regarding Ti3Al precipitation in this condition, as shown in the Ti3Al curve of the TTT diagram, 0.1% precipitation can occur when held for more than 35 min at 480 °C. However, because of the short holding time of only 1 min, Ti3Al was not observed in A_480-1. A_530-120 exhibits peaks corresponding to α, β and Ti3Al. In Figure 7a, it can be observed that holding at 530 °C for more than 90 min completes the precipitation of α from α′. Also, regarding Ti3Al precipitation, in Figure 7a and b, 0.1% Ti3Al is precipitated for more than 15 min; so, holding at 530 °C for 120 min allows for A_530-120 to be sufficiently precipitated in that phase, and the fraction is about 2%. Therefore, in the XRD results of A_530-120, the α, β and Ti3Al peaks without α′ observed are valid results. A_630-480, which has the largest aging degree, consists of α and β, but without Ti3Al peaks. As shown in the 630 °C curve in Figure 7a, the higher the aging temperature, the faster the precipitation and transformation onset, as well as the transformation rate. At 630 °C, the precipitation of α from α′ is completed within just 10 min. Furthermore, it can be confirmed from Figure 7a,b that even after holding for 103 at 630 °C, the precipitation of Ti3Al does not occur. So, in this study, for A_630-480, only the α and β peaks exist.

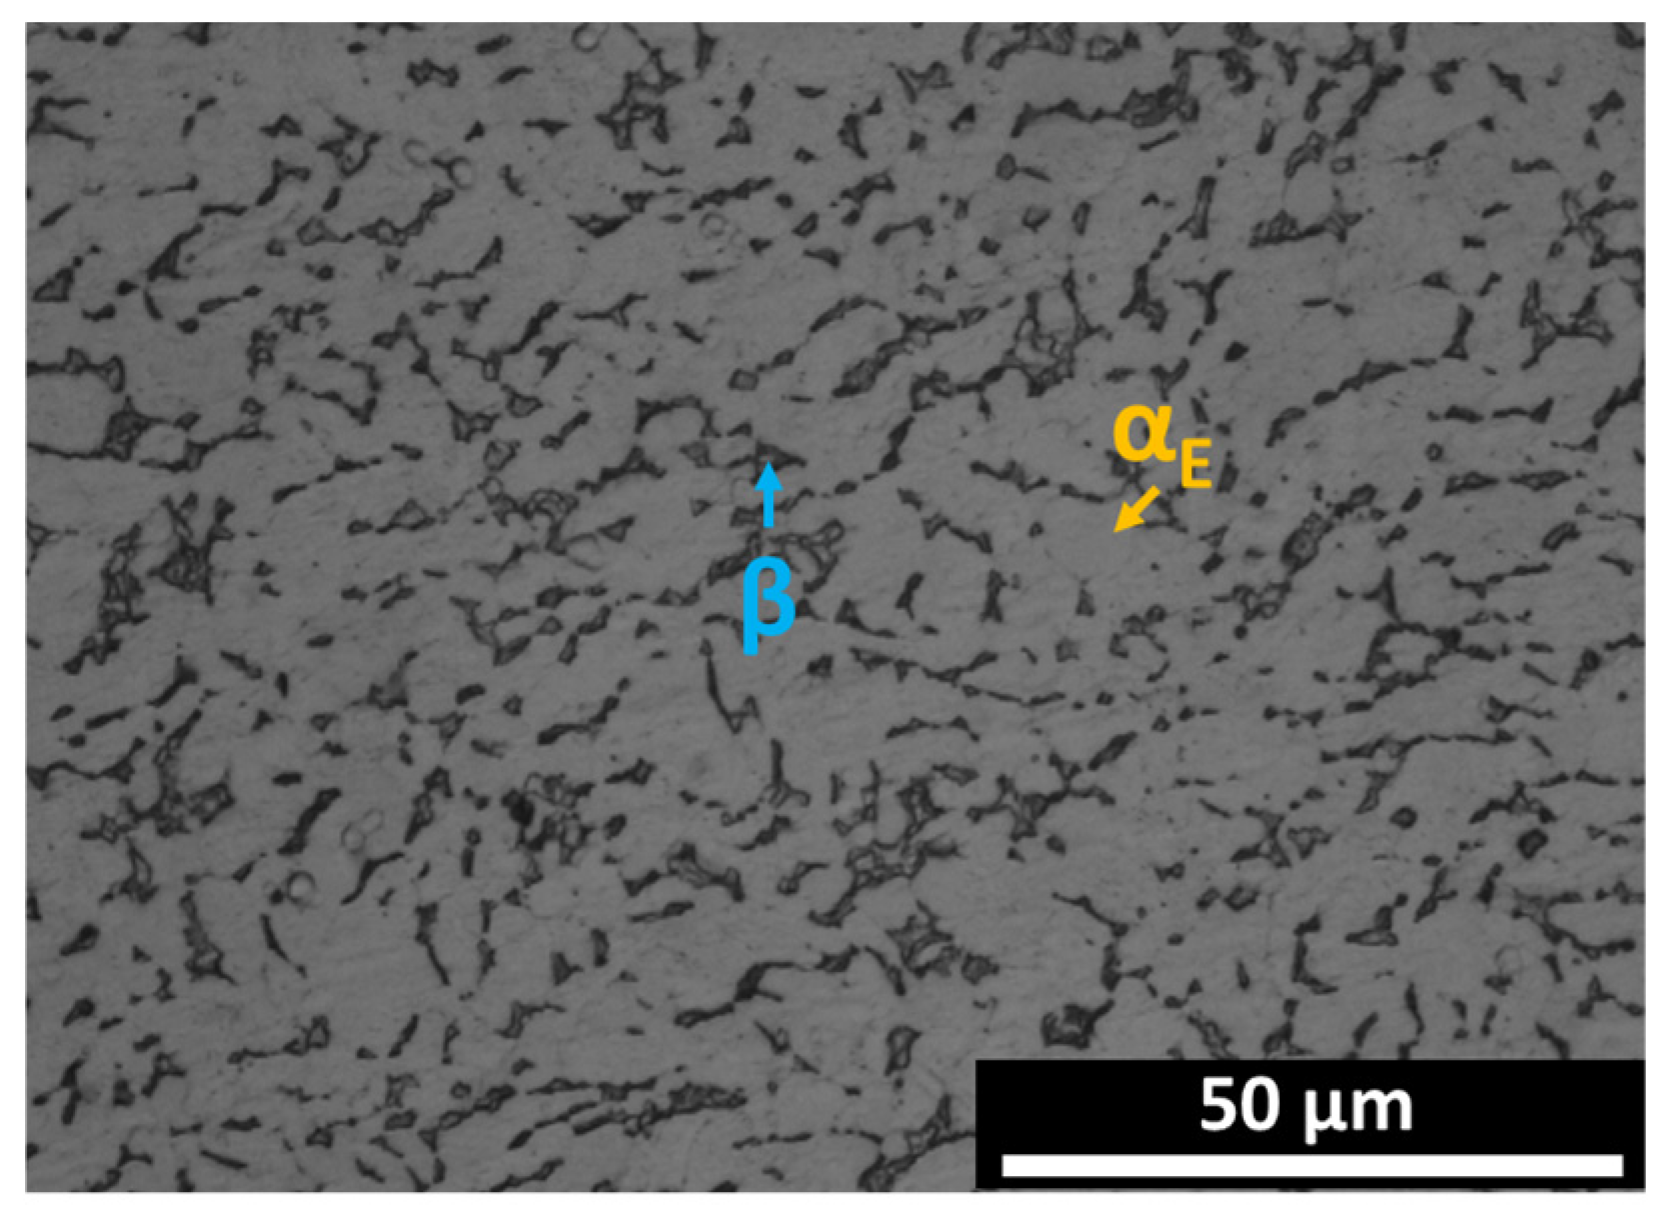
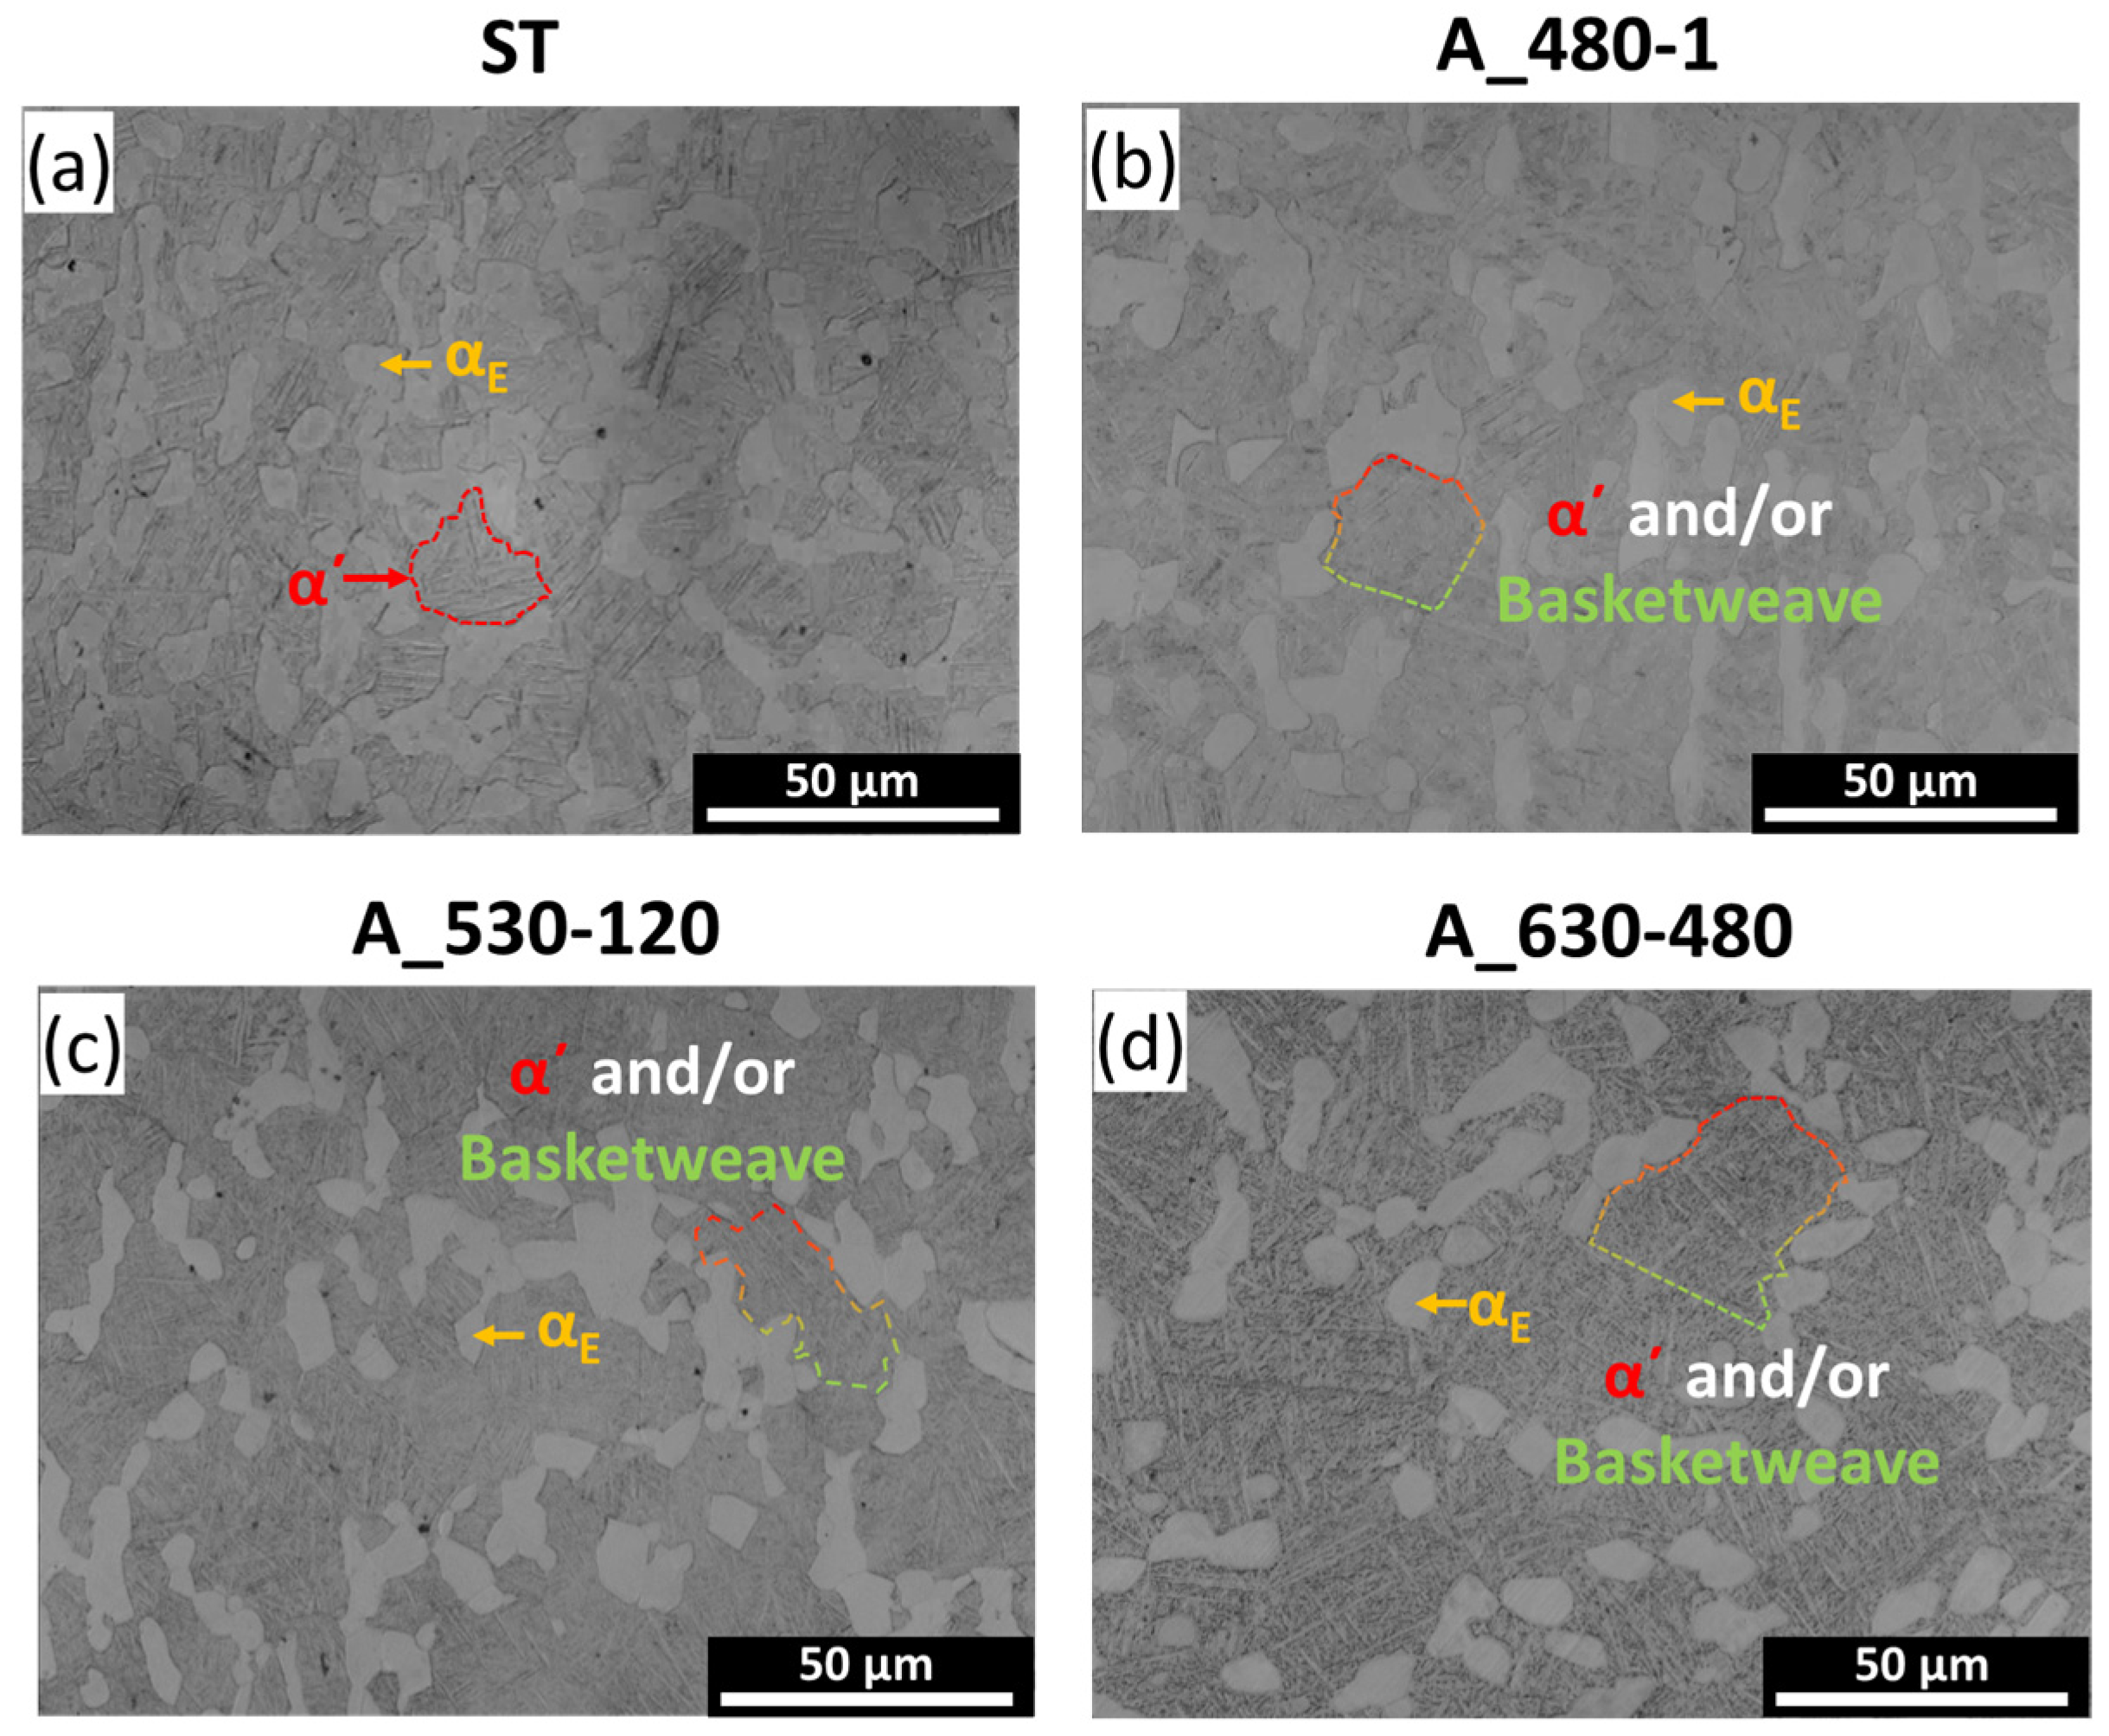
3.3.2. Microstructure

Figure 8a–d present the OM images of ST and several aging conditions (A_480-1, A_530-120, A_630-480). Each sample exhibits a duplex microstructure consisting of equiaxed α (αE), represented by a bright phase, α′ and/or a basketweave structure, which is relatively dark and resembles an intertwined structure [11,12]. According to the image analyzer, the amount of equiaxed α in the ST is approximately 30%, similar to that in other samples. The appearance of α′ and/or basketweave structures is not significantly different when observed using OM.
Therefore, in the duplex microstructure, especially α′, and/or a basketweave structure, were observed at high magnification using SEM, as shown in Figure 9a–h. Figure 9b,d,f,h are magnified from Figure 9a,c,e,g, respectively. In Figure 9b, transformed β in the ST sample consists of intertwined, very fine (average 50 nm thickness) acicular α′ and some nano-sized, retained β βre between α′. During aging, the growth in equiaxed α and the transformation of α′ into α and β occur [11]. Figure 9d demonstrates that A_480-1 exhibits both a basketweave structure with fine α and β plates, and a much finer α′. Similar to the XRD result and JMatPro calculation (Figure 6 and Figure 7), for the extreme early aging condition 480-1, the transformation of α′ into α and β basketweave structures begins, but this condition is insufficient to complete the transformation. In the case of A_530-120 shown in Figure 9f, α′ is fully transformed into α and β plates, which is also confirmed in the XRD result in Figure 6. Ti3Al is too small to be clearly distinguished from the surroundings in Figure 9f, but because of the XRD results (Figure 6) and regarding Lütjering [11], in A_530-120, Ti3Al clearly exists in the α phase, both of equiaxed α and α plates, with a coherently elliptical shape. A_630-480 in Figure 9h has much coarser α and β plates than those of A_530-120 because of the higher growth rate of each plate under the higher temperature and longer aging duration. Also, Ti3Al does not precipitate under A_630-480; this was not detected in XRD (Figure 6).
Average grain size and plate thickness from Figure 8 and Figure 9 were measured and the results are shown in Figure 10. The average grain size increases by 15% with increasing aging temperature and time after ST. During aging, α′ in ST is transformed into α + β, and the plates become coarser at the higher aging condition. As shown in Figure 5, when the aging temperature is increased, the rate of the α′-to-α + β transformation accelerates. Moreover, according to J. Chen et al. [34], at the higher temperature, the growth rate of transformed plates significantly increases. When aged at the 630–480 condition, the longest holding time at the highest temperature in this study, the thickest α plate is exhibited, which is more than five times thicker than ST. This growth in grain size and plate thickness during STA shows a similar trend, as shown in Figure 5b–d.

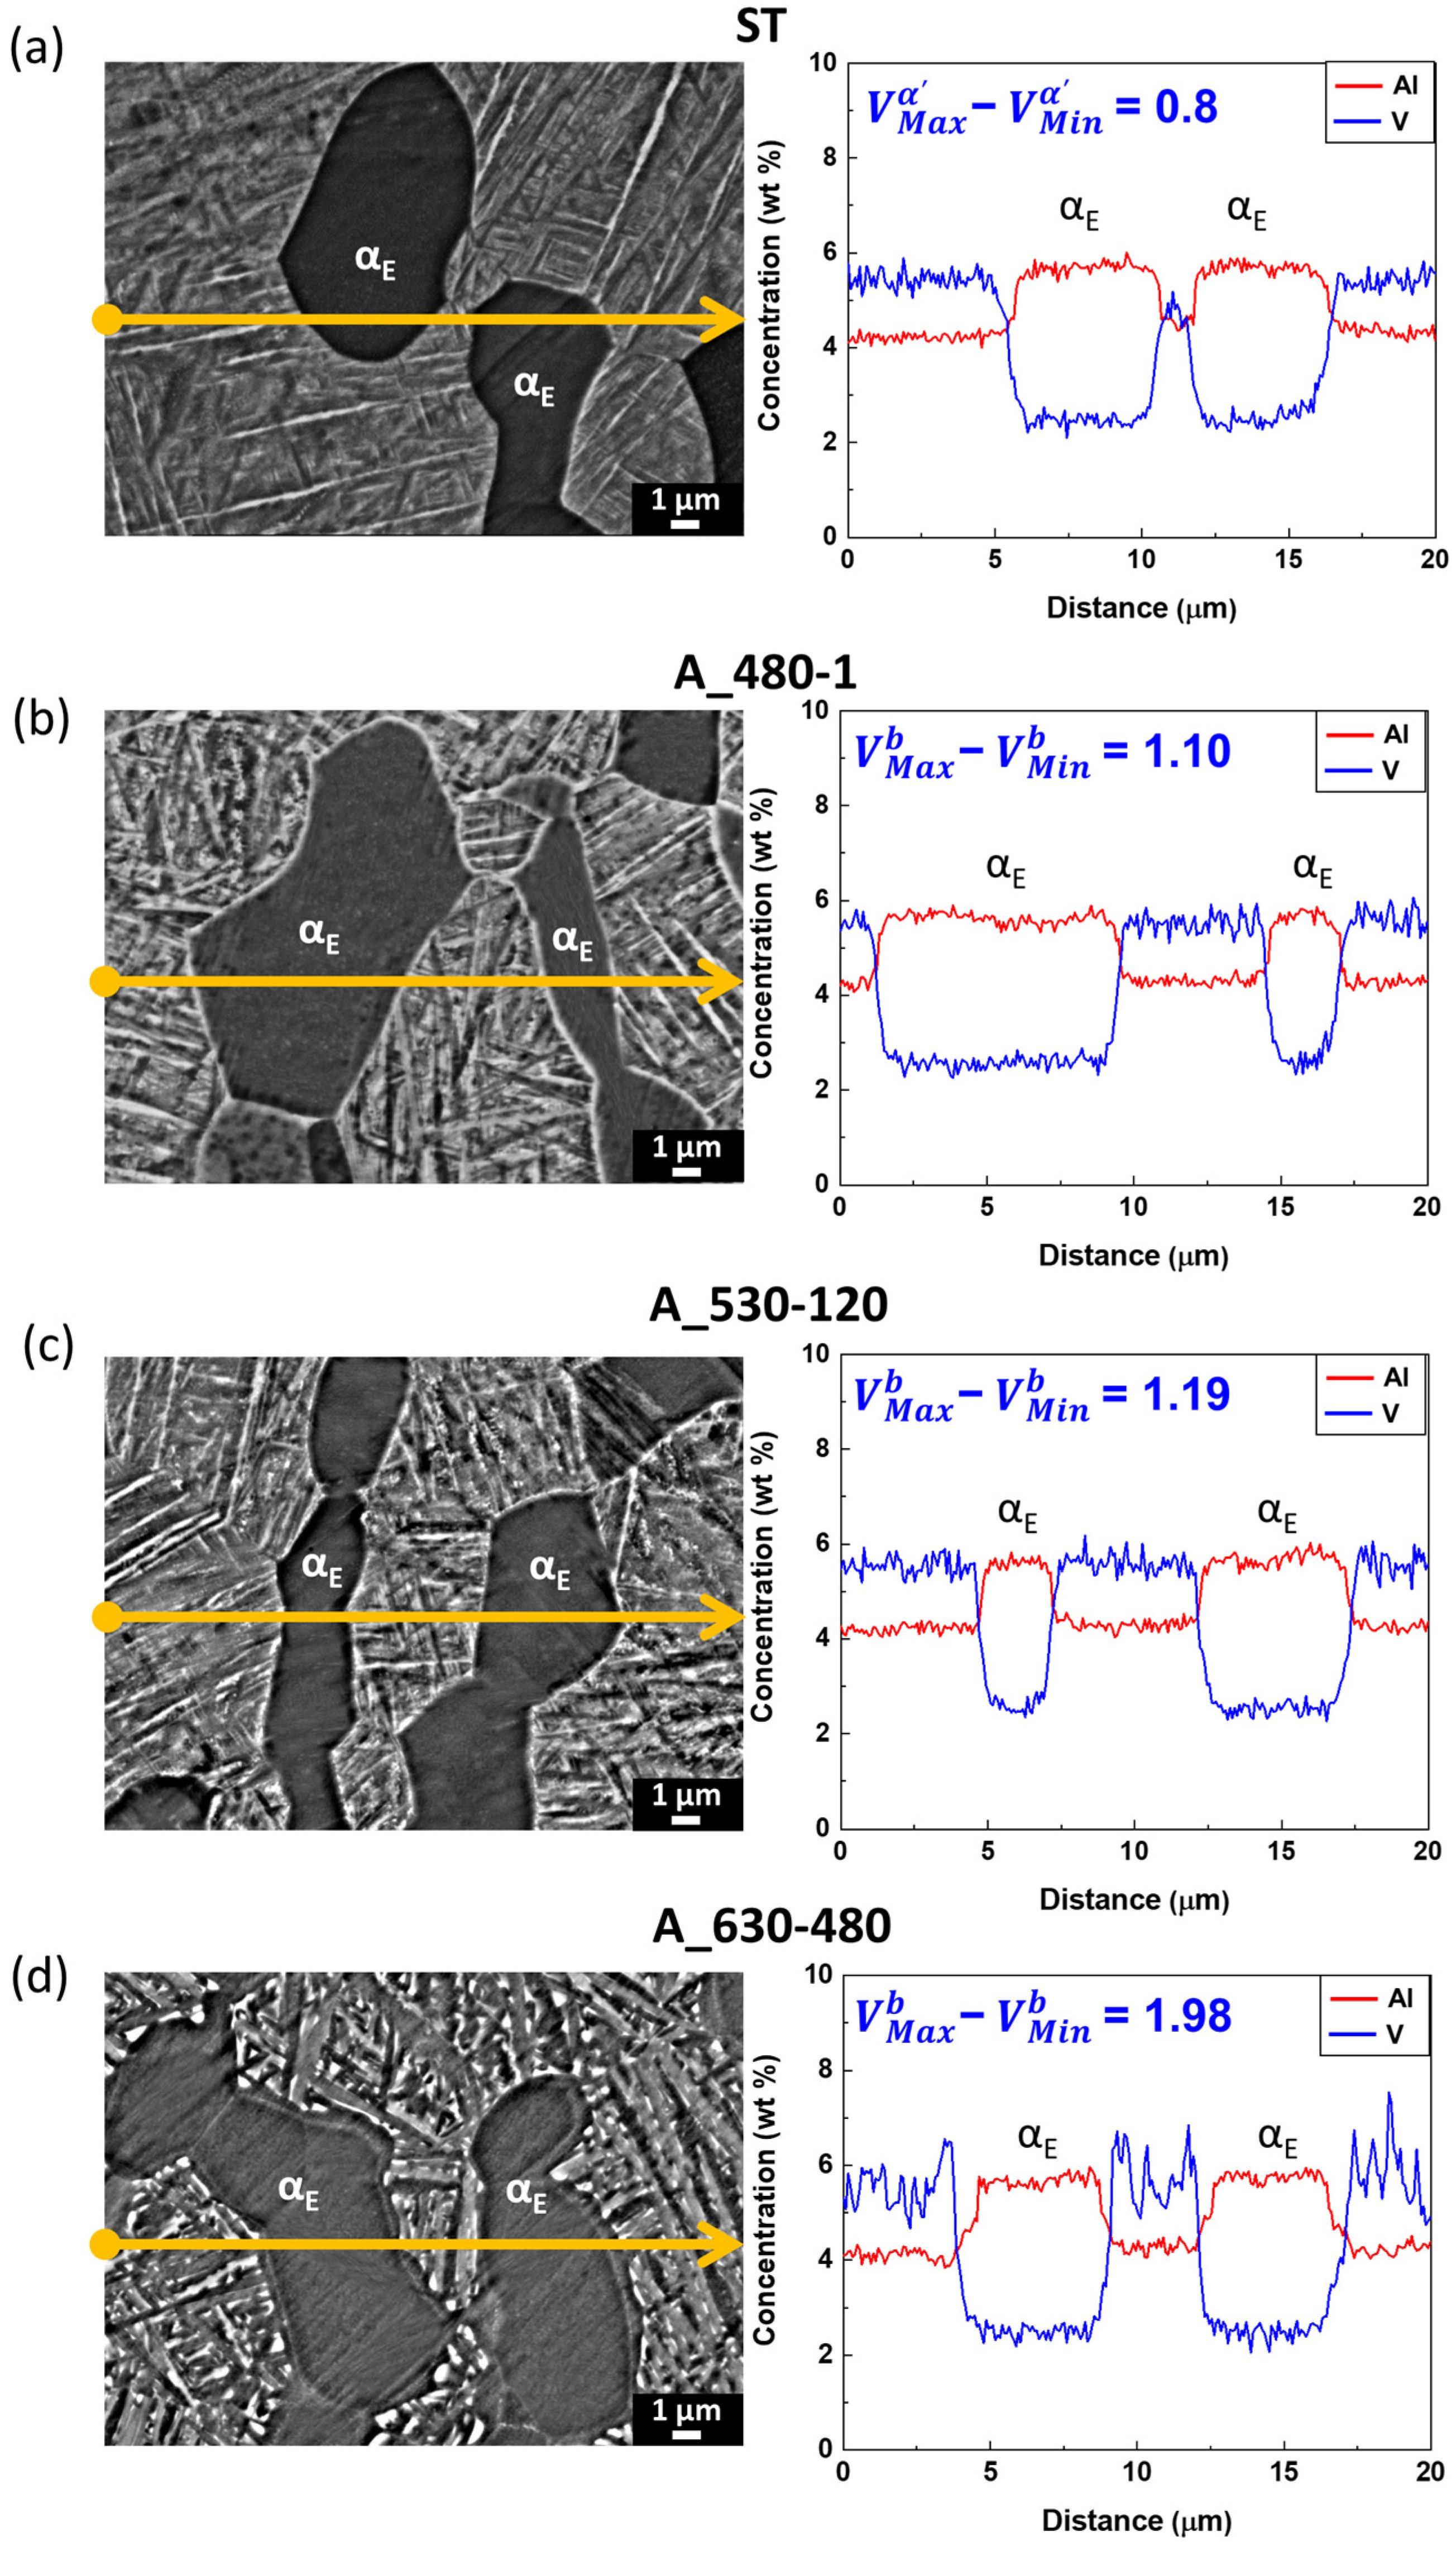
3.3.3. Element Redistribution

Figure 11a–d present the line mapping results of EPMA for Al and V composition across the duplex phases under various STA conditions. Al is one of the α-stabilizing elements, and V is one of the β-stabilizing elements [11,18]. Therefore, V tends to exist more in the β phase rather than in the α phase. In the case of equiaxed α, the Al concentration in Figure 11a–d ranges from 5.5 to 6 wt.%, similar to the average element composition. However, the V content in equiaxed α (αE) is low, at 2 to 2.5%, which is significantly lower than the average V content of 4.15 wt.% for the material. In addition, when comparing the Al and V concentrations in equiaxed α after aging, there is little difference in concentration even if the aging temperature and time increase.
The α′ phase observed in the ST (Figure 11a) contains approximately 5.5 to 6 wt.% of V and 4 to 4.5 wt.% of Al. Because α′ is transformed from β, and due to the fast cooling of WQ (approximately 100 °C/s), it was difficult for the V distribution during cooling, so the V concentration in α′ (average 5.5 wt.%) is higher than the average V concentration of the material (4.15 wt.%). The gradient of V concentration in α′ phase is 0.8 wt.%, which is calculated as the difference between the maximum and minimum values of V concentration ( V M a x α V M i n α ´ ). During the aging, α′ is transformed into α and β phases and V is redistributed to the β plate [20]. According to Kherrouba et al. [20], as the holding temperature and time are increased, the V concentration in the β plate is increased. Therefore, as shown in Figure 11b–d, when the aging condition increases the temperature and time from A_480-1 to A_630-480, the redistributed amount of V to the β plate is larger, so the difference in V concentration in the basketweave structure, V M a x b V M i n b , is increased. The maximum difference in the basketweave structure of A_630-480 (Figure 11d) is 1.98 wt.%, which is about twice higher than the value of α′ of ST. The changes in V composition in β plates according to the aging condition show a similar trend, as shown in Figure 5a–d, which can affect the mechanical properties.

3.4. Mechanical Properties

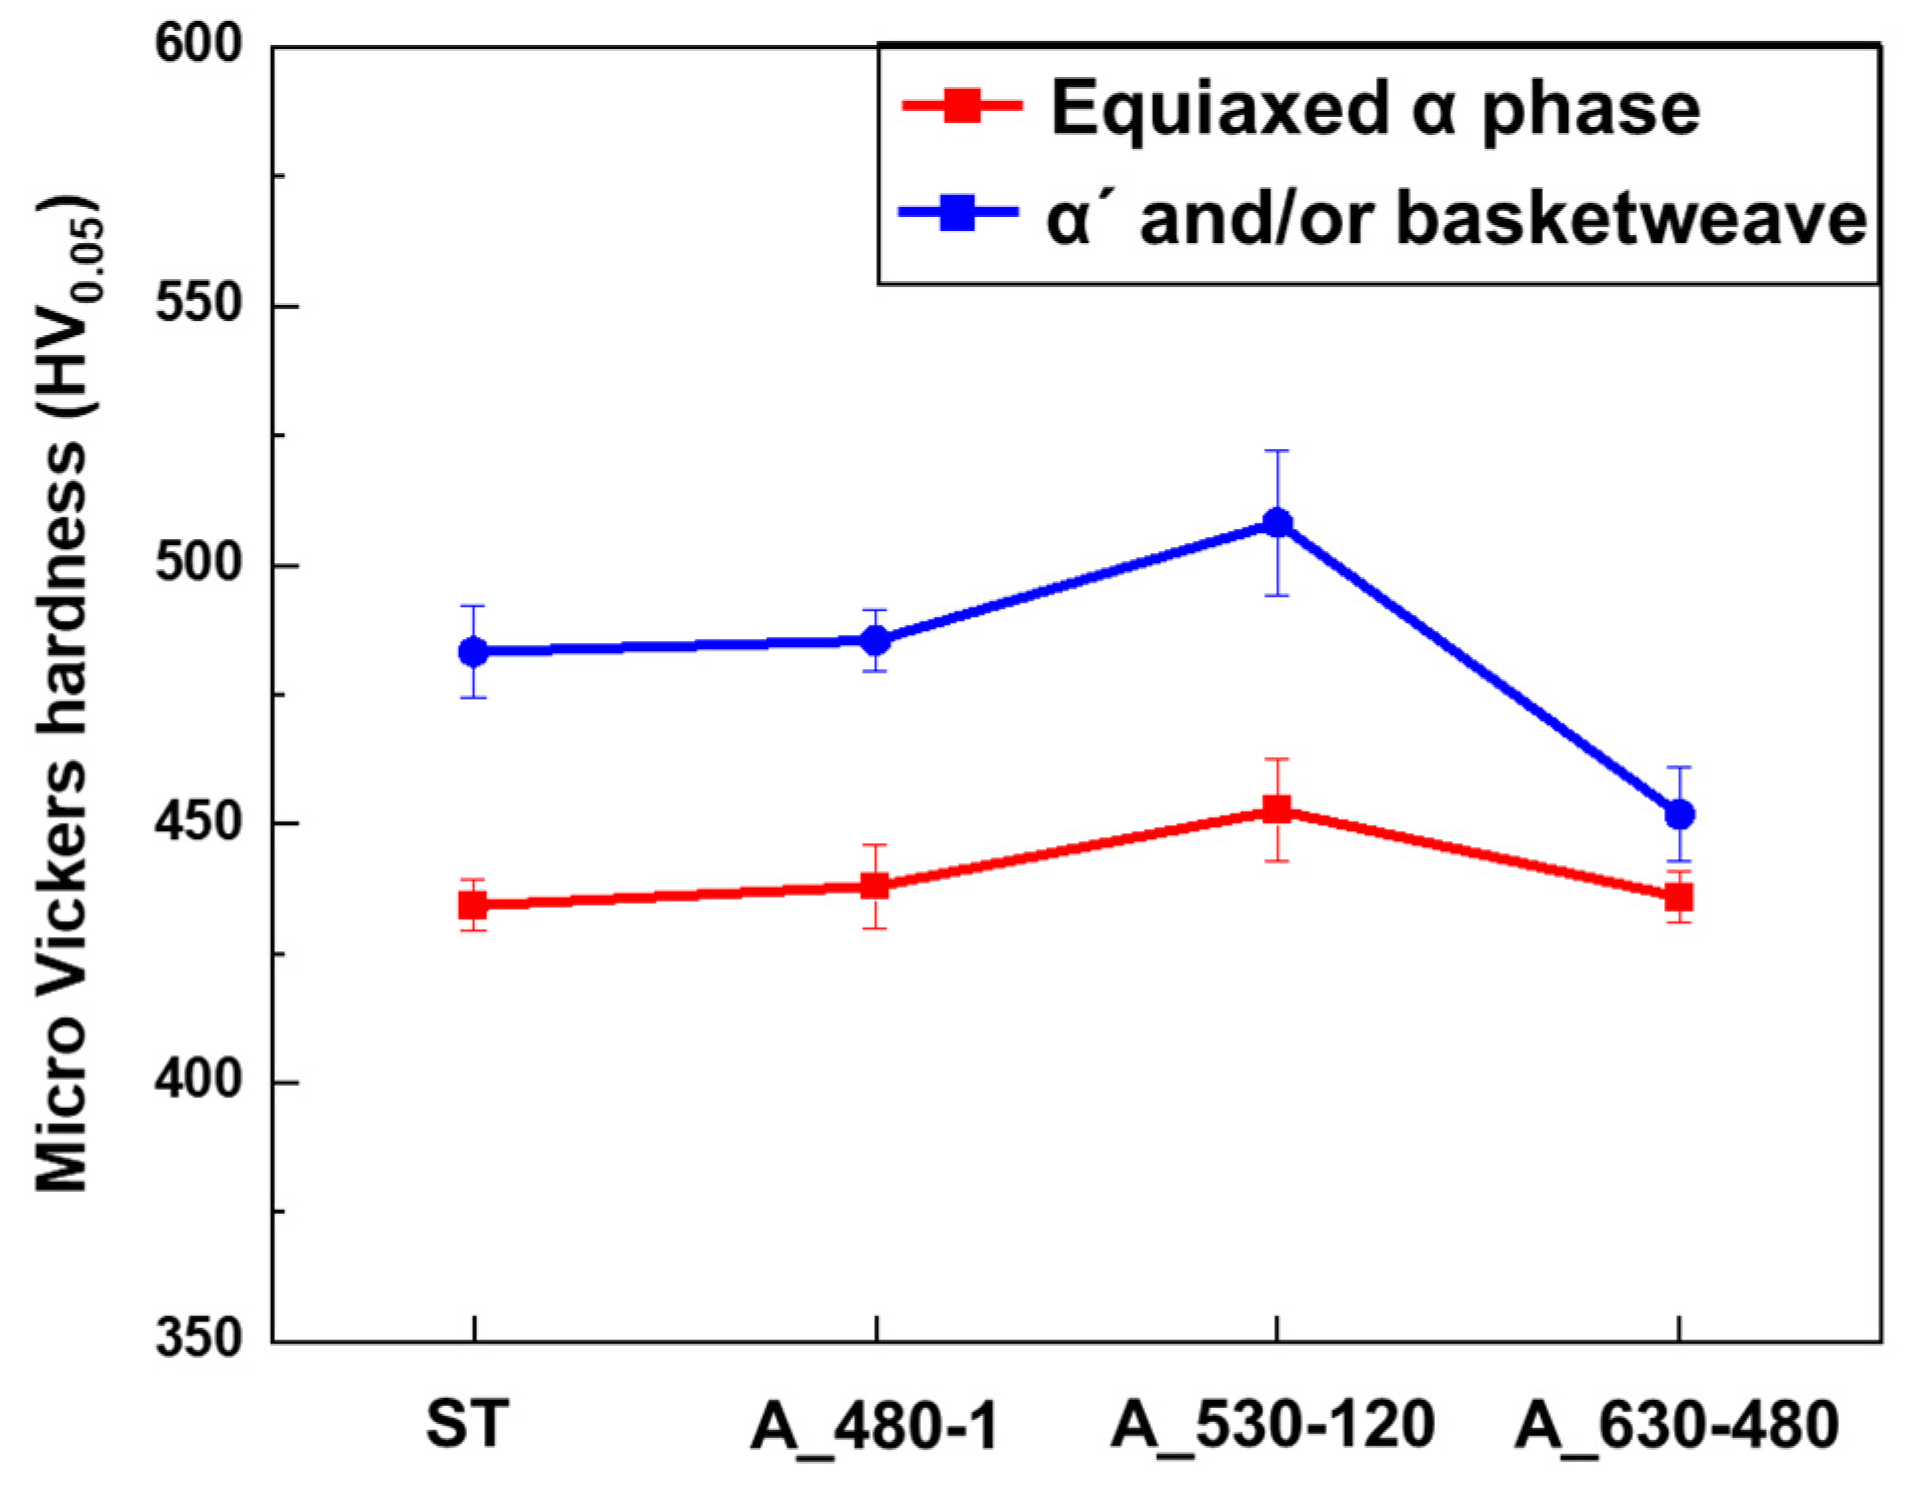
3.4.1. Change in Phase Hardness

Figure 12 presents the average Vickers hardness results for equiaxed α and α′ and/or basketweave structure in the duplex microstructure. Regarding the change in the hardness value of equiaxed α, the difference between ST and aging conditions is not very large. But in the case of aging at A_530-120, the hardness is the highest, which is attributed to Ti3Al precipitation. In a similar study, it was found that when Ti3Al is precipitated, the hardness is increased because of the higher resistance of dislocation movement at the precipitated phase [11,35,36].
The hardness of α′ in ST is higher than that of equiaxed α. This is because of the presence of the fine acicular plate of about 50 nm in size, with high dislocation density formed by WQ [30]. The hardness of α′ or the basketweave structure of A_480-1 showed a similar hardness with α′ of ST due to insufficient transformation time. The basketweave structure of A_530-120 is the hardest, not only because the transformation from α′ to fine α + β is completed, but also because of the presence of Ti3Al [35,36]. In other words, in the case of A_530-120, many α/β grain boundaries and precipitated phases blocked dislocation movement. Conversely, the basketweave structure in A_630-480 has the lowest hardness value due to the large size of α and β plates and the absence of Ti3Al. Regarding the plate thickness and mechanical properties, it is known that when the plate thickness is coarse, the amount of α/β boundary becomes smaller, making it easier to move dislocations, and hardness is decreased [31]. For this reason, in this study, the basketweave structure with the coarsest α plate of A_630-480 showed the lowest hardness value compared to other conditions. Consequently, in the case of A_630-480, the hardness values of the equiaxed α and the basketweave structure are the most similar. This similar hardness of phases in A_630-480 allows for relatively uniform deformation under tensile loading and can suppress stress localization, which can have a positive effect on the tensile behavior.

3.4.2. Tensile Properties

Figure 13a shows the engineering stress–strain curves obtained during the tensile test and Figure 13b shows the yield strength, elongation and modulus of toughness for each STA condition obtained from the curves; the specific values are in Table 2. Compared with ST, all of the aged samples reveal higher yield strength and elongation due to the transformation of α′ into α and β. A_530-120 has the highest yield strength and slightly higher elongation than ST, not only because of the transformation from α′ to fine α + β [21], but also because of precipitated Ti3Al [35,36]. A_630-480 has a 6.84% higher yield strength than ST and the yield strength is similar with A_530-120. In addition, A_630-480 has the highest elongation, and its value is 19.10%, which is 21.66% higher than ST, and 16.46% higher than A_530-120. This is because A_630-480 has coarse α and β plates as well as none of the Ti3Al phase, so it has the least obstacles to dislocation movement, making it easier for dislocation movement [31,37].
Also, the area under the stress–strain curve of Figure 13a indicates the modulus of toughness according to the combination of strength and elongation, and refers to the energy required to fracture a material. As can be seen in Figure 13b and Table 2, the modulus of toughness for aged samples is higher than that of ST. Among the several aging conditions, A_630-480 has the maximum modulus of toughness, which is 26.18% higher than that of ST, and 13.70% higher than that of A_530-120. The microstructure of A_630-480 has a basketweave structure with coarse plates, so the amount of α/β interface is the smallest; therefore, the resistance of dislocation movement is relatively easy. As can be seen in Figure 12, because the hardness values of equiaxed alpha and basketweave in the duplex microstructure are similar, it is also believed that during the tensile test, stress was not concentrated on a specific phase and was deformed relatively uniformly over the entire area of the specimen.
For the safety of the UAM industry using Ti64, toughness is one of the most important properties. Therefore, aging at 630 °C for 480 min (A_630-480) is the optimal aging condition because it increases toughness by 26% with adequate high strength and elongation compared to the ST condition.

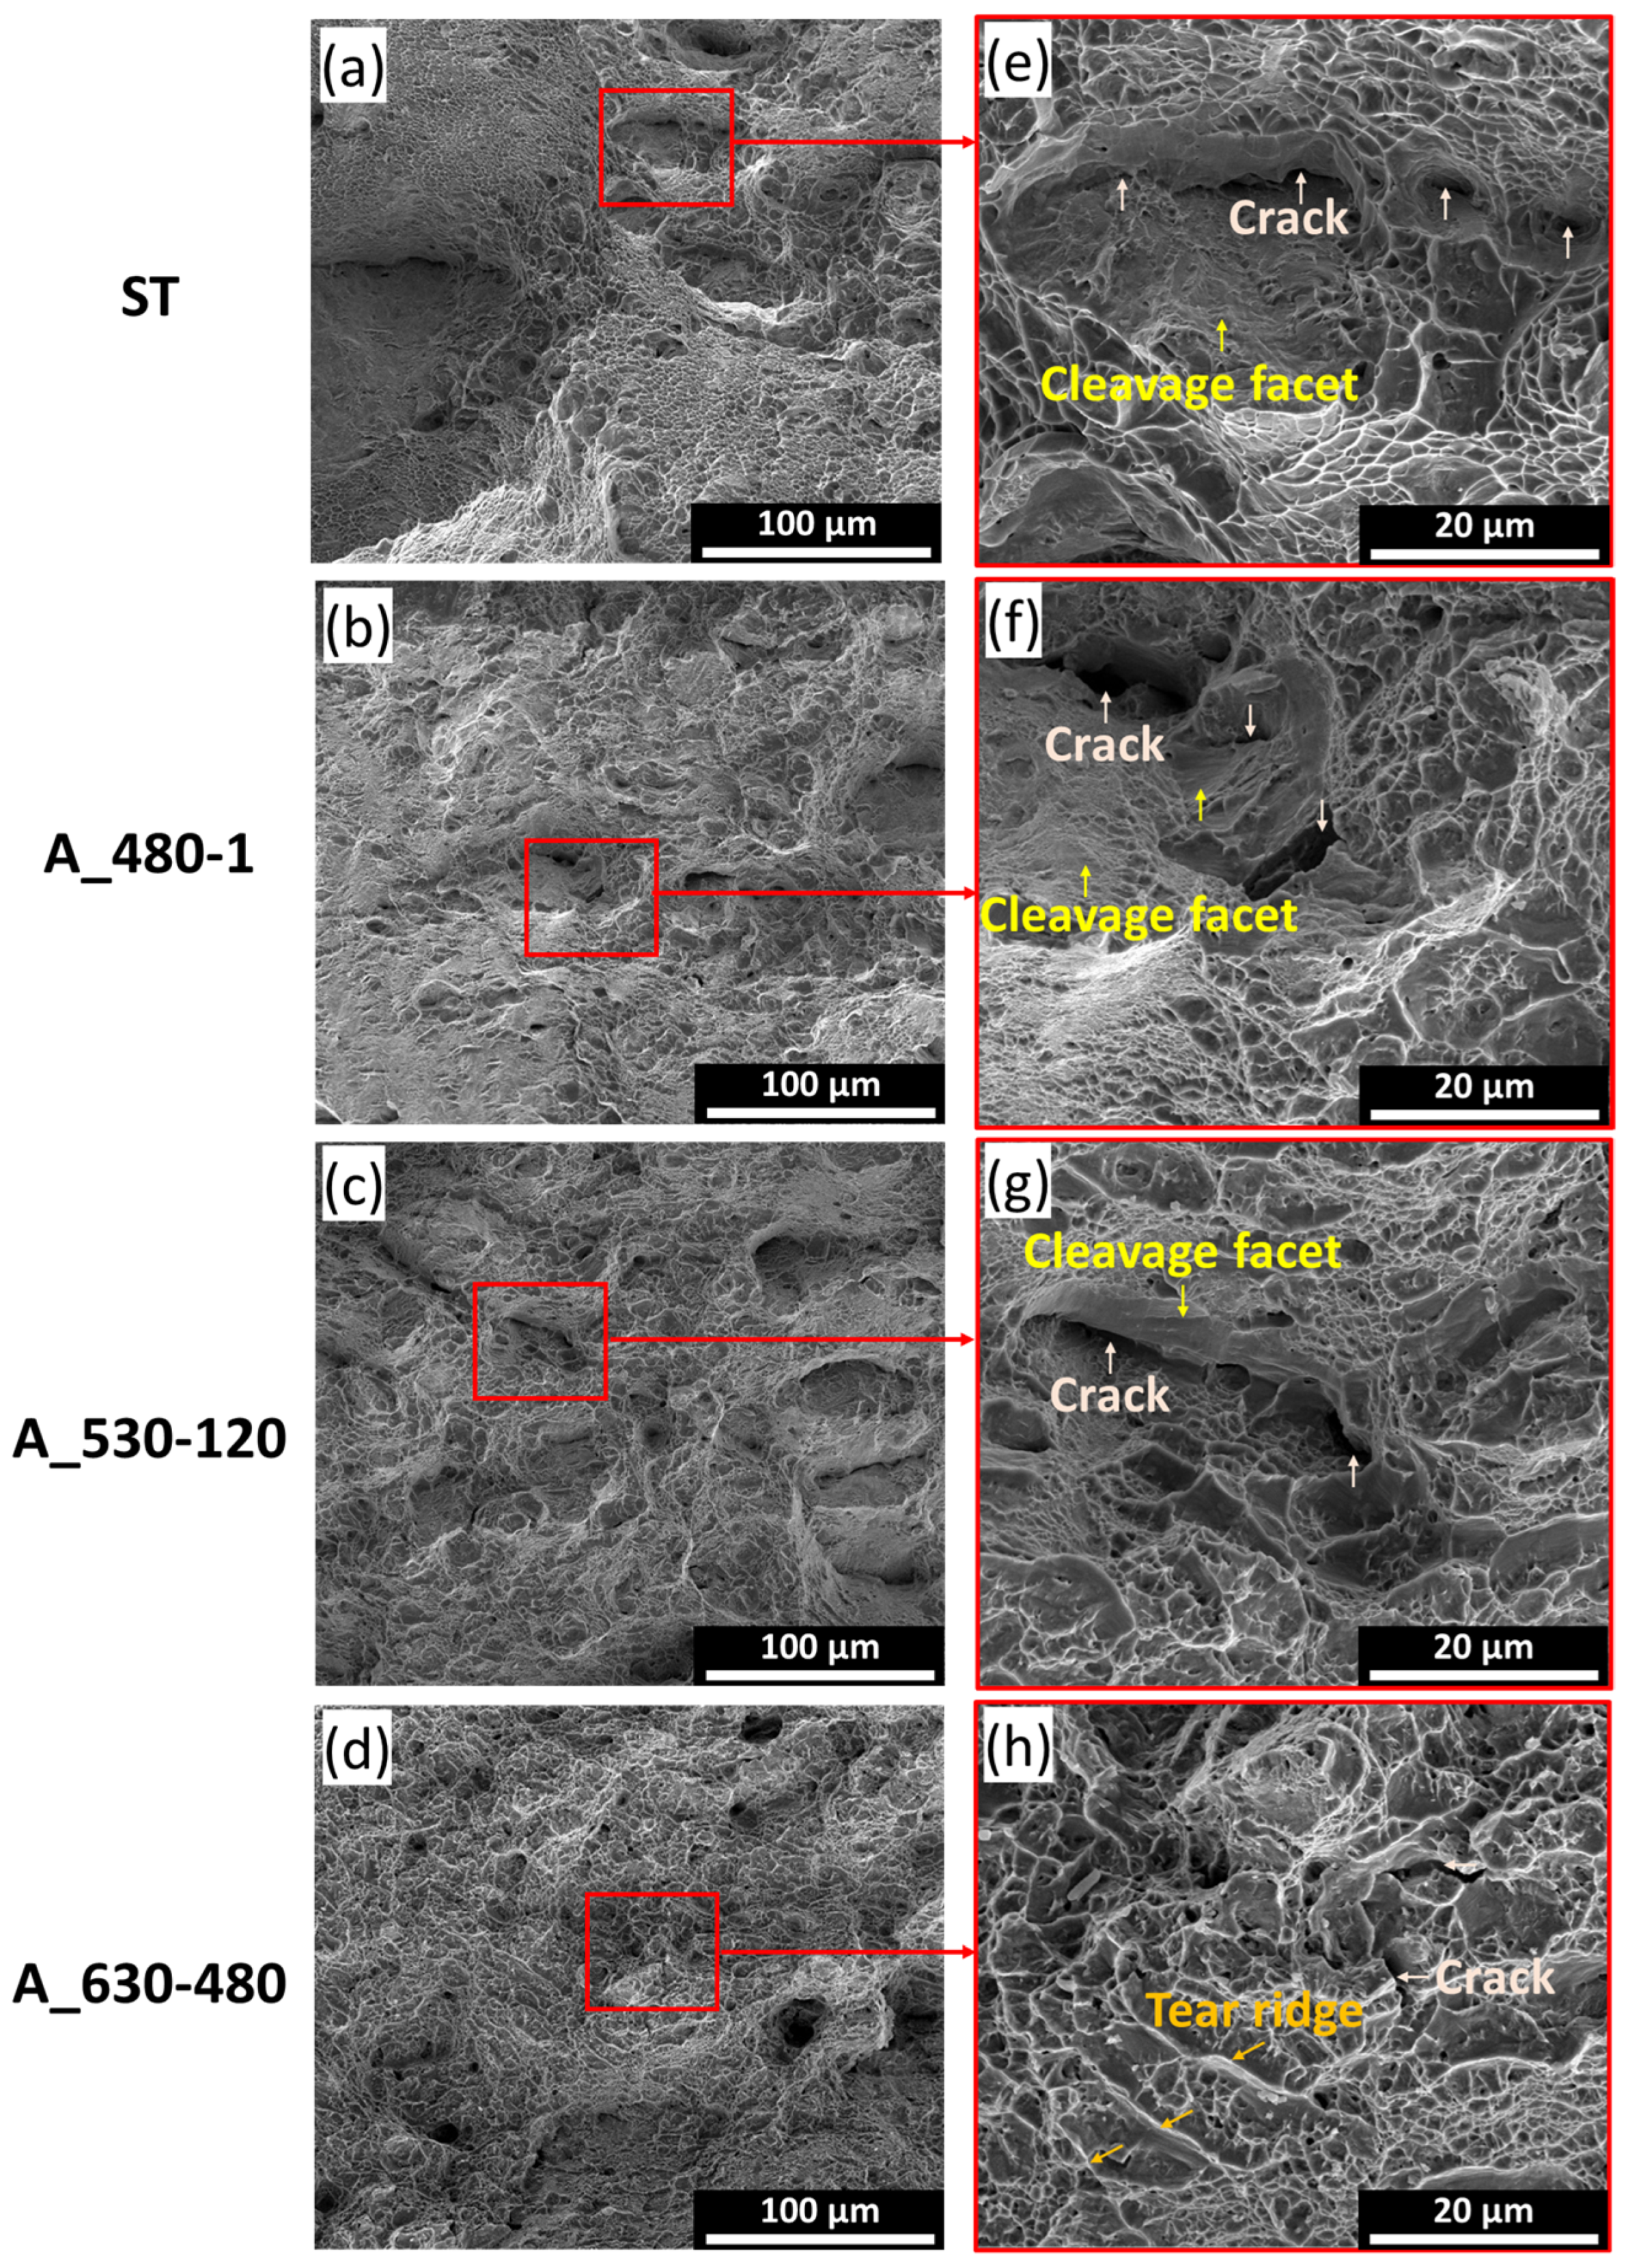
3.4.3. Fractographies

Figure 14 shows fractographies of ST and STA. In Figure 14a–d, both cleavage and dimple structures are observed, indicating a mixture of brittle and ductile fracture patterns. Figure 14e–h are enlarged specific areas in Figure 14a–d. In Figure 14e, the ST exhibits some cleavage structures surrounded by cracks. The high dislocation density hinders dislocation and slip movements in α′, causing it to be unable to withstand deformation under tensile load, which leads to cleavage fracture [31,38,39]. A_480-1 has a very fine basketweave structure and α′; so, Figure 14f shows a mixed fracture pattern similar to that of ST, as shown in Figure 14e. In Figure 14g, the fractography of A_530-120 exhibits various sizes of dimple structures, and small dimples are observed even within the area surrounded by cracks and cleavage facets. These small dimples are made from fracturing α and β plates in a basketweave structure. In Figure 14h, A_630-480 exhibits some tear ridge patterns with various sizes of dimple structures [40]. This tear ridge patterns were formed from β plates between α. The β plate in A_630-480 has an excessively high V concentration, as shown in Figure 11d, and that β plate is surrounded by coarse α plates. According to J.M. Oh et al. [38], the hardness increases as the concentration of the contained elements increases. This means that in A_630-480, the β plate with a higher V concentration is stronger than the surrounding α plate with a lower V concentration in the basketweave structure. Therefore, during the tensile test, the α plates in the basketweave structure of A_630-480 are sufficiently deformed, while the β plates between the α plates act as a tough tissue, which suppresses failure due to severe deformation. Consequently, A_630-480 has the highest modulus of toughness with adequate high strength and high elongation.

4. Conclusions

This study investigated the microstructural and mechanical properties according to heat treatment conditions in various STA (ST, A_480-1, A_530-120, A_630-480) conditions to determine the optimal STA heat treatment conditions to obtain high toughness with high strength of Ti64 for the UAM industry. The following conclusions were obtained:
All selected STA conditions exhibited a duplex microstructure consisting of equiaxed α, and α′ and/or α + β basketweave structures. As the aging conditions increase, the thickness of the α plate and concentration difference in the V element become larger. In the case of aging at 630 °C for 480 min, the thickness of the α plate is approximately five times coarser than that of ST, and the difference in V concentration between β and α plates in the basketweave structure is 1.98%; this value is approximately 2.5 times higher than ST.
Regarding the hardness of equiaxed α and α’ and/or basketweave under STA conditions, when aged at 530 °C for 120 min after ST, both phases showed the highest hardness. After aging at 630 °C for 480 min, the hardness of the basketweave structure decreased rapidly, so the hardness difference according to each phase is insignificant.
Aged Ti64 showed improved yield strength and elongation than the solution-treated sample. The highest strength was exhibited in A_530-120 due to fine α + β and Ti3Al precipitation. Toughness, which is the highest combination of strength and elongation, was highest in A_630-480; this value was approximately 26.18% higher than just ST. The β plates between coarse α plates with sufficiently high V in A_630-480 appeared in a tear ridge pattern, and played a role in withstanding large deformation and suppressing the fracture.
Aging Ti64 at 630 °C for 480 min (A_630-480) is the best condition as it enhances toughness by 26% with sufficiently high yield strength (1053.40 MPa) and elongation (19.10%) compared to the ST condition.

Author Contributions

Conceptualization, S.S., M.J. and J.P.; methodology, S.S. and M.J.; software, S.S.; investigation, S.S.; resources, J.P.; writing—original draft preparation, S.S., M.J. and J.P.; writing—review and editing, S.S. and J.P.; supervision, M.J. and J.P. All authors have read and agreed to the published version of the manuscript.

Funding

This research was funded by the Korea Institute of Industrial Technology (KITECH) internal project (EH240008) and the Ministry of Trade, Industry and Energy, grant number (10081335).

Data Availability Statement

The original contributions presented in the study are included in the article, further inquiries can be directed to the corresponding authors.

Acknowledgments

The authors are deeply grateful to KPCM Co., Ltd., for providing the Ti-6Al-4V billet.

Conflicts of Interest

The authors declare no conflicts of interest.

References

  1. Afonso, F.; Ferreira, A.; Ribeiro, I.; Lau, F.; Suleman, A. On the design of environmentally sustainable aircraft for urban air mobility. Transp. Res. Part D 2021, 91, 102688. [Google Scholar] [CrossRef]
  2. Pak, H.; Asmer, L.; Kokus, P.; Schuchardt, B.I.; End, A.; Meller, F.; Schweiger, K.; Torens, C.; Barzantny, C.; Becker, D.; et al. Can Urban Air Mobility become reality? Opportunities and challenges of UAM as innovative mode of transport and DLR contribution to ongoing research. CEAS Aeronaut. J. 2024, 7, 1–31. [Google Scholar] [CrossRef]
  3. Thipphavong, D.P.; Apaza, R.; Barmore, B.; Battiste, V.; Burian, B.; Dao, Q.; Feary, M.; Go, S.; Goodrich, K.H.; Homola, J.; et al. Urban air mobility airspace integration concepts and considerations. In Proceedings of the 2018 Aviation Technology, Integration, and Operations Conference, Atlanta, Georgia, 25–29 June 2018. [Google Scholar] [CrossRef]
  4. Zhang, X.; Chen, Y.; Hu, J. Recent advances in the development of aerospace materials. Prog. Aerosp. Sci. 2018, 97, 22–34. [Google Scholar] [CrossRef]
  5. Eswara, P.N.; Wanhill, R.J.H. Aerospace Materials and Material Technologies; Springer: Singapore, 2017; Volume 1. [Google Scholar]
  6. Callister, W.D.; Rethwisch, D.G. Materials Science and Engineering, 8th ed.; WILEY: New York, NY, USA, 2017. [Google Scholar]
  7. Zhang, W.; Yang, P.; Liang, X.; Cao, Y.; Ouyang, S.; Liu, Y.; Wu, Z. Strength-ductility trade-off deviation in a pre-deformed metastable β titanium alloy. J. Alloys Compd. 2020, 835, 155332. [Google Scholar] [CrossRef]
  8. Jia, M.T.; Zhang, D.L.; Gabbitas, B.; Liang, J.M.; Kong, C. A novel Ti–6Al–4V alloy microstructure with very high strength and good ductility. Scripta. Mater. 2015, 107, 10–13. [Google Scholar] [CrossRef]
  9. Boyer, R.; Collings, E.W.; Welsch, G. (Eds.) Materials Properties Handbook: Titanium Alloys; ASM international: Novelty, OH, USA, 1994; pp. 528–530. [Google Scholar]
  10. Inagaki, I.; Takechi, T.; Shirai, Y.; Ariyasu, N. Application and features of titanium for the aerospace industry. Nippon. Steel Sumitomo Met. Tech. Rep. 2014, 106, 22–27. [Google Scholar]
  11. Lütjering, G.; Williams, J.C. Titanium, 2nd ed.; Derby, B., Ed.; Springer: Berlin, Germany, 2007; pp. 1–14. [Google Scholar]
  12. Boyer, R. An overview on the use of titanium in the aerospace industry. Mater. Sci. Eng. A 1996, 213, 103–114. [Google Scholar] [CrossRef]
  13. Boyer, R.; Foltz, J. Metallurgy of titanium alloy heat treatment. In ASM Handbook Volume 4e Heat Treating of Nonferrous Alloys; Totten, G.E., Mechenzie, D.S., Eds.; ASM International: Materials Park, OH, USA, 2016; pp. 498–509. [Google Scholar]
  14. Seo, S.; Choi, H.; Lee, G.; Lee, K.A.; Han, J.; Jung, M. Effect of cooling rate on microstructure and hardness during solution treatment and aging process of Ti-6Al-4V alloy for aerospace components. J. Mater. Eng. Perform. 2021, 30, 3406–3415. [Google Scholar] [CrossRef]
  15. Gupta, A.; Khatirkar, R.K.; Kumar, A.; Parihar, M.S. Investigations on the effect of heating temperature and cooling rate on evolution of microstructure in an α+ β titanium alloy. J. Mater. Res. 2018, 33, 946–957. [Google Scholar] [CrossRef]
  16. Carreon, H.; Ruiz, A.; Santoveña, B. Study of aging effects in a Ti-6Al-4V alloy with Widmanstätten and equiaxed microstructures by non-destructive means. AIP Conf. Proc. 2014, 1581, 739–745. [Google Scholar]
  17. Gupta, R.K.; Kumar, V.A.; Chhangani, S. Study on variants of solution treatment and aging cycle of titanium alloy Ti6Al4V. J. Mater. Eng. Perform. 2016, 25, 1492–1501. [Google Scholar] [CrossRef]
  18. Huang, S.; Zhang, J.; Ma, Y.; Zhang, S.; Youssef, S.S.; Qi, M.; Wang, H.; Qiu, J.; Xu, D.; Lei, J.; et al. Influence of thermal treatment on element partitioning in α+ β titanium alloy. J. Alloys Compd. 2019, 791, 575–585. [Google Scholar] [CrossRef]
  19. Lin, Y.C.; Tang, Y.; Jiang, Y.Q.; Chen, J.; Wang, D.; He, D.G. Precipitation of Secondary Phase and Phase Transformation Behavior of a Solution-Treated Ti–6Al–4V Alloy during High-Temperature Aging. Adv. Eng. Mat. 2020, 22, 1901436. [Google Scholar] [CrossRef]
  20. Kherrouba, N.; Carron, D.; Kouba, R.; Bouabdallah, M.; Badji, R. Gleeble-assisted investigation and thermokinetics simulation of α phase isothermal precipitation during short-time duplex heat treatment of Ti-6Al-4V alloy. J. Mater. Eng. Perform. 2022, 31, 7517–7526. [Google Scholar] [CrossRef]
  21. Morita, T.; Hatsuoka, K.; Iizuka, T.; Kawasaki, K. Strengthening of Ti–6Al–4V alloy by short-time duplex heat treatment. Mater. Trans. 2005, 46, 1681–1686. [Google Scholar] [CrossRef]
  22. Tanaka, S.; Morita, T.; Shinoda, K. Effects of short-time duplex heat treatment on microstructure and fatigue strength of Ti-6Al-4V alloy. In Proceedings of the 13th International Conference on Fracture, Beijing, China, 16–21 June 2013; Curran Associates Inc.: New York, NY, USA, 2013; pp. 16–21. [Google Scholar]
  23. Ajiz, A.; Affi, J. The effects of short-time solution treatment and short-time aging on mechanical properties of Ti-6Al-4V for orthopaedic applications. Int. J. Adv. Sci. Eng. Inf. Technol. 2015, 5, 329–334. [Google Scholar] [CrossRef]
  24. Oh, S.T.; Woo, K.D.; Kim, J.H.; Kwak, S.M. Effect of retained β phase on mechanical properties of cast Ti-6Al-4V alloy. Mater. Trans. 2017, 58, 1145–1149. [Google Scholar] [CrossRef]
  25. Vahidshad, Y.; Khodabakhshi, A.H. Effect of solution treatment and aging temperature on α′ and Ti3Al (α2) phase formation and mechanical properties of water-quenched Ti–6Al–4V. MMA 2022, 11, 59–71. [Google Scholar] [CrossRef]
  26. Perumal, G.; Senthilkumar, N.; Subramaniyan, C.; Ramasamy, R.; Satheshkumar, D. Tailoring the mechanical and tribological properties of Ti-6Al-4 V alloy through duplex heat treatment. J. Mater. Eng. Perform. 2023, 9, 1–18. [Google Scholar] [CrossRef]
  27. Zhu, Q.; Yang, X.; Lan, H.; Wang, D.; Lou, H.; Li, J. Effect of solution treatments on microstructure and mechanical properties of Ti–6Al–4V alloy hot rolled sheet. J. Mater. Res. Technol. 2023, 23, 5760–5771. [Google Scholar] [CrossRef]
  28. Elshaer, R.N.; El-Hadad, S.; Nofalm, A. Influence of heat treatment processes on microstructure evolution, tensile and tribological properties of Ti6Al4V alloy. Sci. Rep. 2023, 13, 11292. [Google Scholar] [CrossRef]
  29. Qiao, P.; Xie, J.; Jiang, Y.; Tang, P.; Liang, B.; Lu, Y.; Gong, J. Mechanical properties of σ-phase and its effect on the mechanical properties of austenitic stainless steel. Coatings 2022, 12, 1917. [Google Scholar] [CrossRef]
  30. ASTM E8/E8M-16a; Standard Test Methods for Tension Testing of Metallic Materials. ASTM International: West Conshohocken, PA, USA, 2016.
  31. Shi, X.; Zeng, W.; Sun, Y.; Han, Y.; Zhao, Y.; Guo, P. Microstructure-tensile properties correlation for the Ti-6Al-4V titanium alloy. J. Mater. Eng. Perform. 2015, 24, 1754–1762. [Google Scholar] [CrossRef]
  32. Vikas, K.S.R.; Rahul, V.S.N.; Reddy, G.M.; Rao, K.S. Effect of Heat Treatments on Tensile Fracture Behaviour of Ti-6Al-4V Alloy Friction Welds. J. Ins. Eng. India Series D 2023, 105, 929–947. [Google Scholar] [CrossRef]
  33. JMatPro, Version 7.0, Sente Software Corp.: Guildford, UK, 2021.
  34. Chen, J.; Wang, L.; Fan, Q. Effect of aging temperature on microstructure and mechanical properties of a novel Ti-6121 alloy. J. Alloys Compd. 2023, 947, 169612. [Google Scholar] [CrossRef]
  35. Welsch, G.; Lütjering, G.; Gazioglu, K.; Bunk, W. Deformation characteristics of age hardened Ti-6Al-4V. Metall. Mater. Trans. A 1977, 8, 169–177. [Google Scholar] [CrossRef]
  36. Lee, D.G.; Lee, S. Effects of nano-sized α2 (Ti3Al) particles on quasi-static and dynamic deformation behavior of Ti-6Al-4V alloy with bimodal microstructure. J. Mater. Sci. 2005, 40, 4077–4084. [Google Scholar] [CrossRef]
  37. Andani, M.T.; Lakshmanan, A.; Karamooz-Ravari, M.; Sundararaghavan, V.; Allison, J.; Misra, A. A quantitative study of stress fields ahead of a slip band blocked by a grain boundary in unalloyed magnesium. Sci. Rep. 2020, 10, 3084. [Google Scholar] [CrossRef]
  38. Oh, J.M.; Lim, J.W.; Lee, B.G.; Suh, C.Y.; Cho, S.W.; Lee, S.W.; Choi, G.S. Grain refinement and hardness increase of titanium via trace element addition. Mater. Trans. 2010, 51, 2009–2012. [Google Scholar] [CrossRef]
  39. Liu, D.; Pons, D.J. Crack propagation mechanisms for creep fatigue: A consolidated explanation of fundamental behaviours from initiation to failure. Metals 2018, 8, 623. [Google Scholar] [CrossRef]
  40. Dang, N.; Chen, S.; Liu, L.; Maire, E.; Adrien, J.; Cazottes, S.; Xiao, W.; Ma, C.; Zhou, L. Analysis of hybrid fracture in α/β titanium alloy with lamellar microstructure. Mater. Sci. Eng. A 2019, 744, 54–63. [Google Scholar] [CrossRef]
Figure 1. Optical microstructure (OM) of initial state of Ti64 used in this study.
Metals 14 00985 g001
Figure 2. Conditions of solution treatment and aging (STA) heat treatment procedures.
Metals 14 00985 g002
Figure 3. (a) is a diagram indicating the sampling locations from the heat-treated specimen for microstructural and mechanical property analysis and (b) presents the sample dimensions for the tensile test conducted in this study.
Metals 14 00985 g003
Figure 4. Micro-Vickers hardness profile of initial state of alloy, solution-treated (ST) sample, and various aging conditions for a selection of conditions to analyze microstructural and mechanical properties.
Metals 14 00985 g004
Figure 5. Schematic diagrams of microstructural models before heat treatment ((a) initial state), and during solution treatment ((b) ST) and aging heat treatment (c,d). In the diagram, (c) corresponds to the state of the highest strength and (d) corresponds to the state of the highest toughness. α′ phase is a granite-like pattern, α phase is light gray, and β phase is dark gray. V element is shown as a red dot and Ti3Al is a black dot.
Metals 14 00985 g005
Figure 6. XRD results for the entire and some magnified ranges of solution treatment (ST) and STA heat treated samples aged at 480 °C; for 1 min (A_480-1), at 530 °C; for 120 min (A_530-120), and at 630 °C for 480 min (A_630-480), including peaks for each phase, α′ is dotted line.
Metals 14 00985 g006
Figure 7. Calculation results for Ti64 used in this study adapted from JMatPro ver. 7.0. [33]; (a) evolution of the α and Ti3Al fractions (at.%) according to holding temperature and time after solution treatment at 950 °C during aging and (b) the time–temperature–transformation (TTT) diagram.
Metals 14 00985 g007
Figure 8. OM images of the microstructures of (a) solution treatment (ST) and STA samples aged at (b) A_480-1, (c) A_530-120, and (d) A_630-480; the area; the dotted line in ST represents α′, and the dotted line in the aged samples represents α′ and/or basketweave structure.
Metals 14 00985 g008
Figure 9. SEM microstructures of duplex microstructure (a,c,e,g) and enlarged α′ and/or basketweave structure (b,d,f,h) in the area marked in red box; (a,b) are ST, (c,d) are A_480-1, (e,f) are A_530-120, and (g,h) are A_630-480.
Metals 14 00985 g009
Figure 10. Average value of grain size and α and/or α’ plate thicknesses of ST and STA samples.
Metals 14 00985 g010
Figure 11. The microstructures with the EPMA test line, which is yellow arrow, and the variation in Al and V profiles; (a) ST, (b) A_480-1, (c) A_530-120 and (d) A_630-480.
Metals 14 00985 g011
Figure 12. Average micro-Vickers hardness value of each phase consisting of a duplex microstructure.
Metals 14 00985 g012
Figure 13. (a) Engineering stress–strain curves of STA during tensile test and (b) graph for yield strength, elongation and modulus of toughness of each condition obtained from (a).
Metals 14 00985 g013
Figure 14. Fractographies of STA after tensile test; (ad) are ST, A_480-1, A_530-120, and A_630-480, respectively, and (eh) are enlarged views of the indicated area in (ad), respectively.
Metals 14 00985 g014
Table 1. Chemical composition (wt.%) of Ti-6Al-4V used in this study.
TiAlVFeONCH
Balance6.564.150.190.190.0210.0270.003
Table 2. Tensile properties of ST and various aging conditions.
Yield Strength
(MPa)
Elongation
(%)
Modulus of Toughness
(MPa%)
ST985.97 (±24.2)15.71 (±1.8)15,996 (±117.4)
A_480-11063.13 (±21.3)16.22 (±1.7)17,056 (±159.6)
A_530-1201067.42 (±23.1)16.28 (±1.9)17,752 (±200.8)
A_630-4801053.40 (±13.4)19.10 (±0.3)19,803 (±112.3)
Disclaimer/Publisher’s Note: The statements, opinions and data contained in all publications are solely those of the individual author(s) and contributor(s) and not of MDPI and/or the editor(s). MDPI and/or the editor(s) disclaim responsibility for any injury to people or property resulting from any ideas, methods, instructions or products referred to in the content.

