Article

Texture Evolution of 1060 Aluminum Alloy Featuring Initial Rotated β Fiber During Accumulative Roll Bonding Process

School of Materials Engineering, Jiangsu University of Technology, Changzhou 213001, China
*
Author to whom correspondence should be addressed.
Metals 2025, 15(4), 418; https://doi.org/10.3390/met15040418
Submission received: 24 February 2025 / Revised: 26 March 2025 / Accepted: 2 April 2025 / Published: 8 April 2025

Abstract

:
Accumulative roll bonding was employed on 1060 aluminum alloy along the transverse direction without lubrication. The texture evolution and lattice rotation of an ARB-processed aluminum sheet, which initially exhibited a rotated β fiber texture, were examined using X-ray diffraction. Successful interlayer bonding was achieved during the ARB process, and the grains in the sheets were refined and stretched along the rolling direction. The rotated β fiber was unstable during shear deformation, gradually transitioning to a stable r-cube orientation along different rotation paths. Variations in ODFs with accumulated true strain were utilized to determine the rotation paths from the initial rotated β fiber to the end r-cube orientation. The rotated β fiber disappearance rate initially decreased rapidly as the accumulated true strain increased, followed by a slower decline. The B’ {0 1 1}<1 1 1> orientation moved to the S’ {1 2 3}<17 22 9> orientation along the skeleton of the initial rotated β fiber, while the C’ {1 1 2}<1 1 0> orientation moved to the r-cube orientation along the transverse direction axis. A slight deviation from the C’ orientation was revealed in the rotation path from the S’ orientation to the r-cube orientation. Texture evolution was clarified quantitatively through establishing a mathematical relation between texture component volume fractions and accumulated true strain utilizing the JMAK equation. The relatively high r values indicated that the JMAK equation could quantify texture evolution during shear deformation.

1. Introduction

Texture evolution in roll-bonded aluminum alloys has gained great interest in research by metallurgists since plastic anisotropy and formability are significantly affected by texture. The formation of dislocation boundaries in deformation not only subdivides initial grains to form a deformed microstructure but also results in the lattice rotation of individual grains to give rise to a deformation texture. Therefore, conducting an analysis of lattice rotation is important for understanding the deformation mechanism and explaining the formation of deformation texture.
Researchers have made considerable effort to study texture evolution and lattice rotation in cold-rolled aluminum alloys [1,2,3]. During the cold rolling process, cube-oriented grains are unstable and rotate to the stable end of the β fiber along different rotation paths. Liu et al. [4] reported that one pathway of the rotation path involves a transition from the cube orientation to the B orientation via the Goss orientation, while another allows for the direct rotation to orientations situated between the S and C orientations. Similarly, the r-cube orientation was unstable during rolling, and it underwent a rotation about the transverse direction (TD) to the C orientation, displaying significant scattering towards the S orientation, as reported by Li et al. [5]. Liu et al. [6] studied the textural evolution of cold-rolled 3105 aluminum alloy, initially characterized with a rotated β fiber texture. They reported that the C’ {1 1 2}<1 1 0> orientation moved towards the B’{0 1 1}<1 1 1> orientation via the S’ {1 2 3}<17 22 9> orientation, while the B’{0 1 1}<1 1 1> orientation moved along the α fiber towards the B orientation. Furthermore, they found that the crystallites would rotate gradually to the β fiber components, which were located between the B and S orientations as they reached the {0 1 1}<6 5 5> orientation. Moreover, the texture evolution could be described in a quantitative manner by correlating the texture volume fractions with the rolling true strain [7,8].
Shear texture, which typically includes a primary {0 0 1}<1 1 0> (r-cube orientation) component along with two secondary {1 1 1}<1 1 2> and {1 1 1}<1 1 0> components, is usually formed in deformed aluminum alloys. Several deformation processes have been employed to obtain shear texture. Equal channel angular pressing and asymmetric rolling have been used to obtain finer grains and shear texture formation [9,10]. The accumulative roll bonding (ARB) technique is considered as an effective method for achieving ultra-fine grain structures in metals and alloys with enhanced properties among the severe plastic deformation methods [11,12]. Roll bonding serves as a simple and effective technique for fabricating laminated metal composites that exhibit good comprehensive properties [13].
In these cases, the surface layers of the rolled sheets suffered excessive shear strain on account of significant friction between rough rolls and sheet surfaces, which results in microstructural and textural heterogeneity throughout the thickness [14]. Different types of texture components were observed in aluminum sheets processed by ARB. The surface layer featured a shear texture including an r-cube component and γ-fiber, while the center layer was dominated by rolling β fiber texture [15]. The basic characteristics of the textures in 1070 aluminum sheets at both the surface and center regions remained relatively unchanged with an increasing number of ARB cycles [15]. Jamaati et al. [16] studied the textural evolution in Al/Al2O3 metal matrix composites processed by ARB processes. They found that the r-cube shear texture in ARB-processed Al/Al2O3 sheets strengthened with increasing ARB cycles. Shaarbaf and Toroghinejad [17] found that the initial cube texture in ARB-processed copper sheets was converted into the r-cube shear texture. This initial cube component facilitated the development of r-cube shear texture [18]. Likewise, ascribed to shear deformation occurring during asymmetric rolling, the C orientation would transition to the r-cube orientation [19]. Wang et al. [20] investigated the textural evolution during cryogenic accumulative roll bonding and found that the initial cube orientation at the surface layer of an Al sheet gradually rotated to the r-cube orientation, leading to an increase in the strength of the r-cube shear texture with ARB cycles. Although much effort has been made to understand textural evolution during rolling, studies on the evolution of texture and lattice rotation related to shear deformation seem to be quite limited. The evolution of shear texture remains lacking in quantitative analysis compared to rolling texture.
In this study, 1060 aluminum alloy sheets with an initial rotated β fiber texture were subjected to accumulative roll bonding along the transverse direction (TD). The evolution of texture and lattice rotation at the surface layer of sheets was examined. A quantitative analysis of texture evolution was performed by correlating texture volume fractions with the accumulated true strain.

2. Materials and Methods

This investigation utilized 1060 aluminum alloy sheets with a thickness of 2.2 mm, and the chemical compositions of the Al alloys is shown in Table 1 (Xingyu Co., Ltd., Beijing, China). The grains in the hot-rolled sheets were elongated along the original rolling direction, as shown in Figure 1. The hot-rolled sheet was characterized by a typical β fiber rolling texture. While performing ARB on aluminum alloys, redundant shear strain was generated in the surface layer of the aluminum alloys owing to high friction between the rough rolls and sheet surface, resulting in the development of a pronounced shear texture. To explore the evolution of the rotated β fiber during shear deformation, the ARB processes were performed along the original TD without lubrication.
Initially, the sheets were degreased using acetone and then brushed to achieve a clean surface. Following the preparation, the sheets were stacked so that their roughened surfaces made contact with each other, and then they were fastened together at one end. The rolling process was performed on a laboratory rolling mill consisting of 230 mm diameter rolls with high surface roughness. During the rolling process, the roll peripheral speed was maintained at approximately 0.4 m/s. To demonstrate the texture evolution, the sheets were previously cold-rolled to reductions of approximately 31%, 37.8%, and 50% along the original TD, which corresponded respectively to true strains of 0.37, 0.47, and 0.69. The bonded sheets with a 50% reduction were subsequently cut to half their length before being roll-bonded again with about 50% reduction. Afterward, this process was repeated for a total of six cycles. The accumulative roll-bonding process is illustrated in a schematic diagram shown in Figure 2.
The microstructure of the ARB sheets was examined with a metallurgical microscope under polarized light. The optical analysis was performed on the RD-ND sections after grinding and mechanical polishing with diamond polishing paste (2.5 μm). The 1060 alloy was anodized and observed using polarized light false color on a metallurgical microscope (Axiover 200MAT, Zeiss, Oberkochen, Germany). Texture analysis was conducted on the sheet surface using X-ray diffraction (XRD, Rigaku D/Max-2500, Rigaku, Tokyo, Japan) with Cu Kα radiation (λ = 0.154056 nm) at V = 40 kV and I = 200 mA. The detailed procedure used to measure the texture and the subsequent ODFs calculation method can be found in previous articles [21,22]. The volume fraction of the r-cube component was estimated using an enhanced method [7,8]. The intensity of orientations f(g) within a 12.5° range around the center of the rotated β fiber in Euler space was integrated to indicate the rotated β fiber component volume fraction. Orientations besides the r-cube and rotated β fiber in Euler space are referred to as the remainder component.

3. Results and Discussion

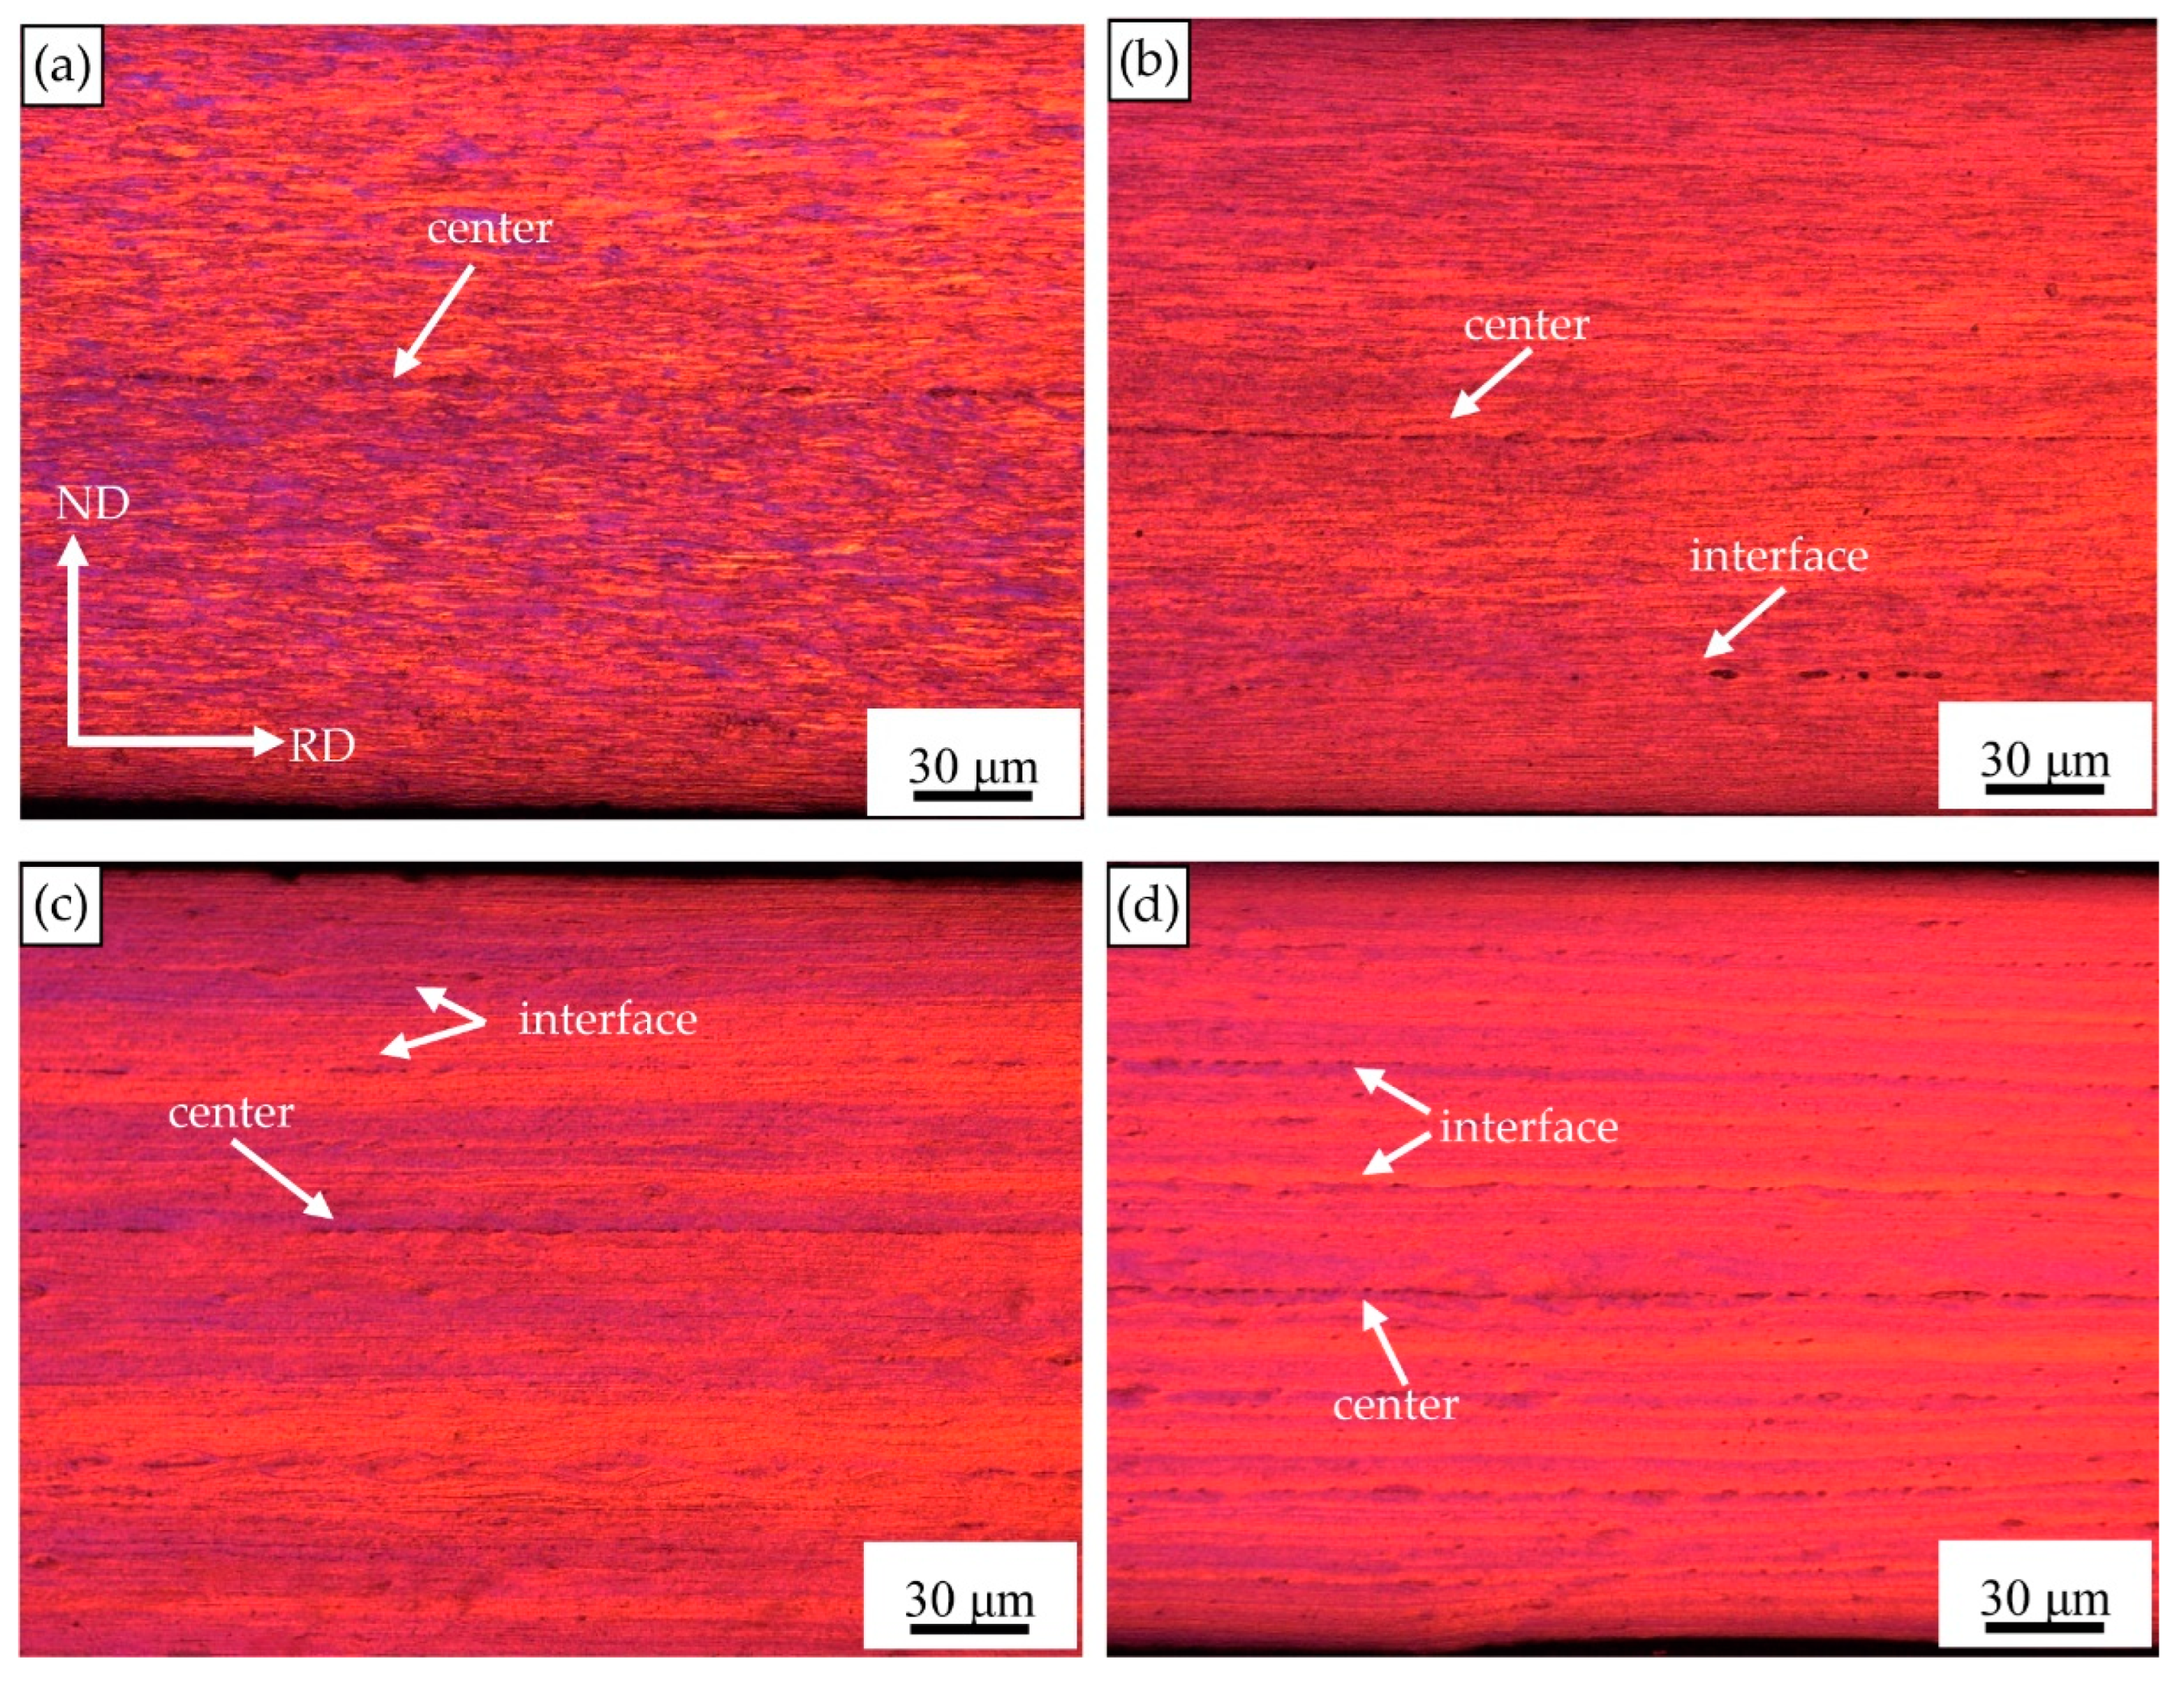
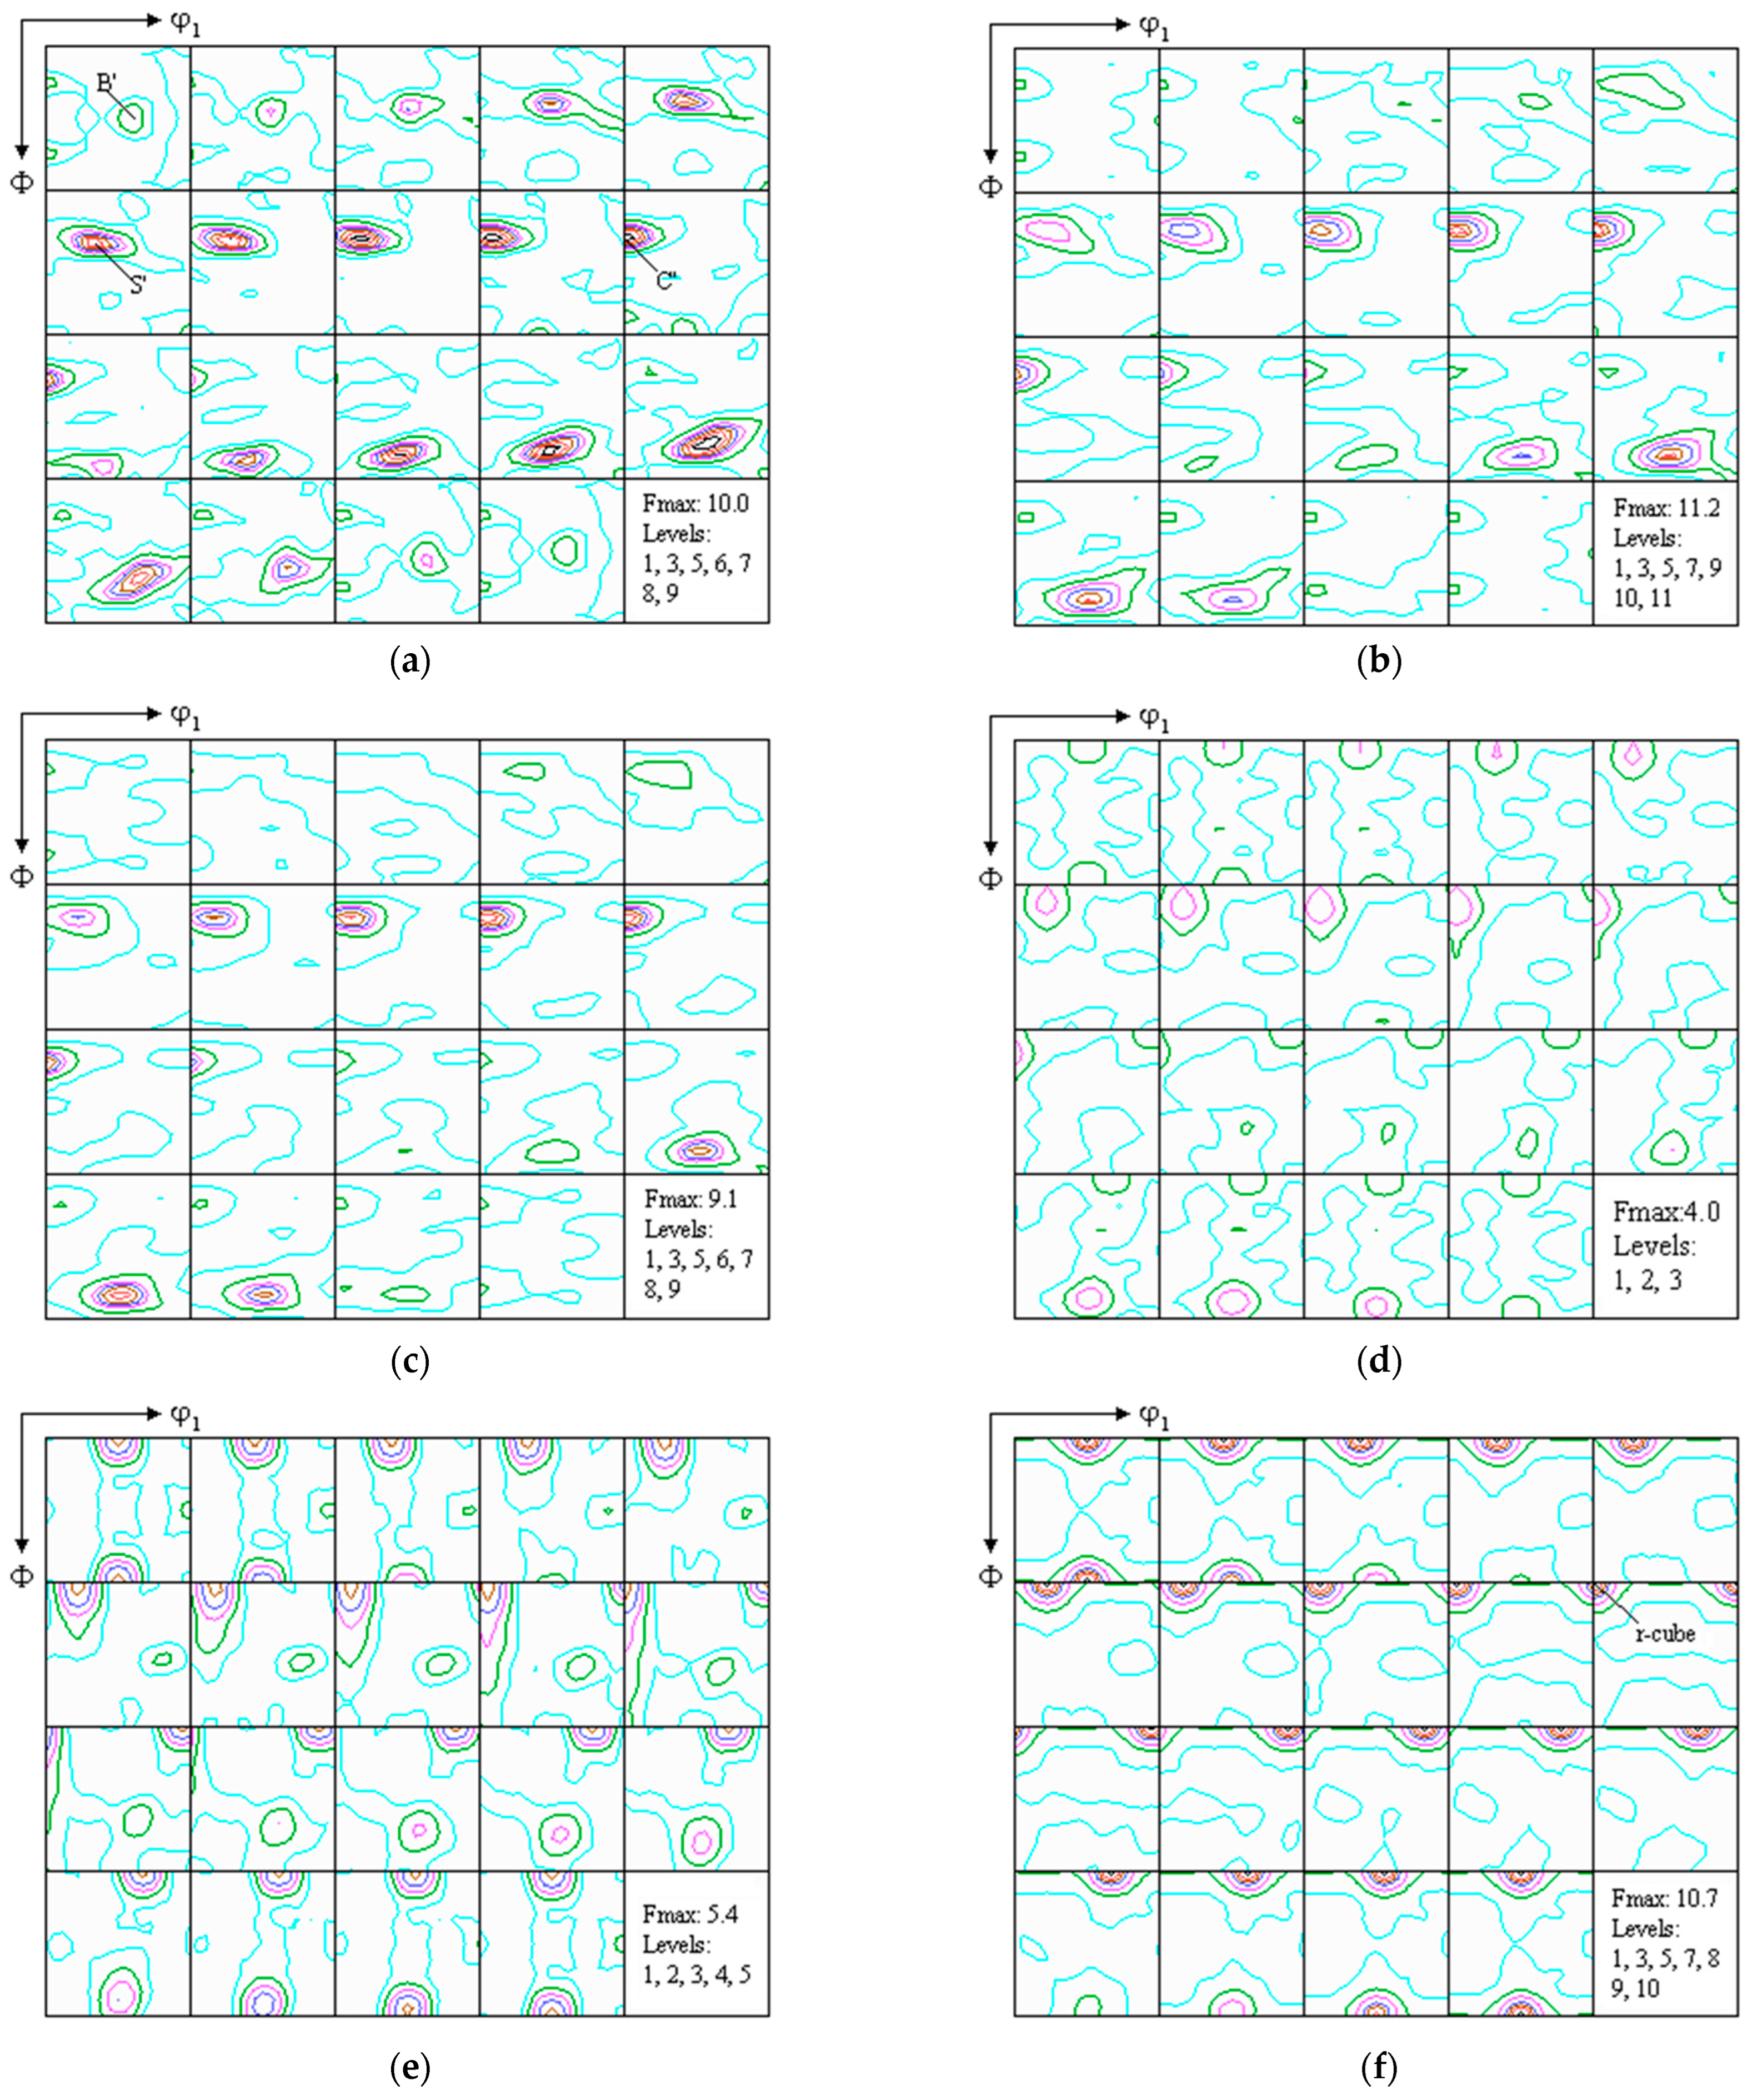
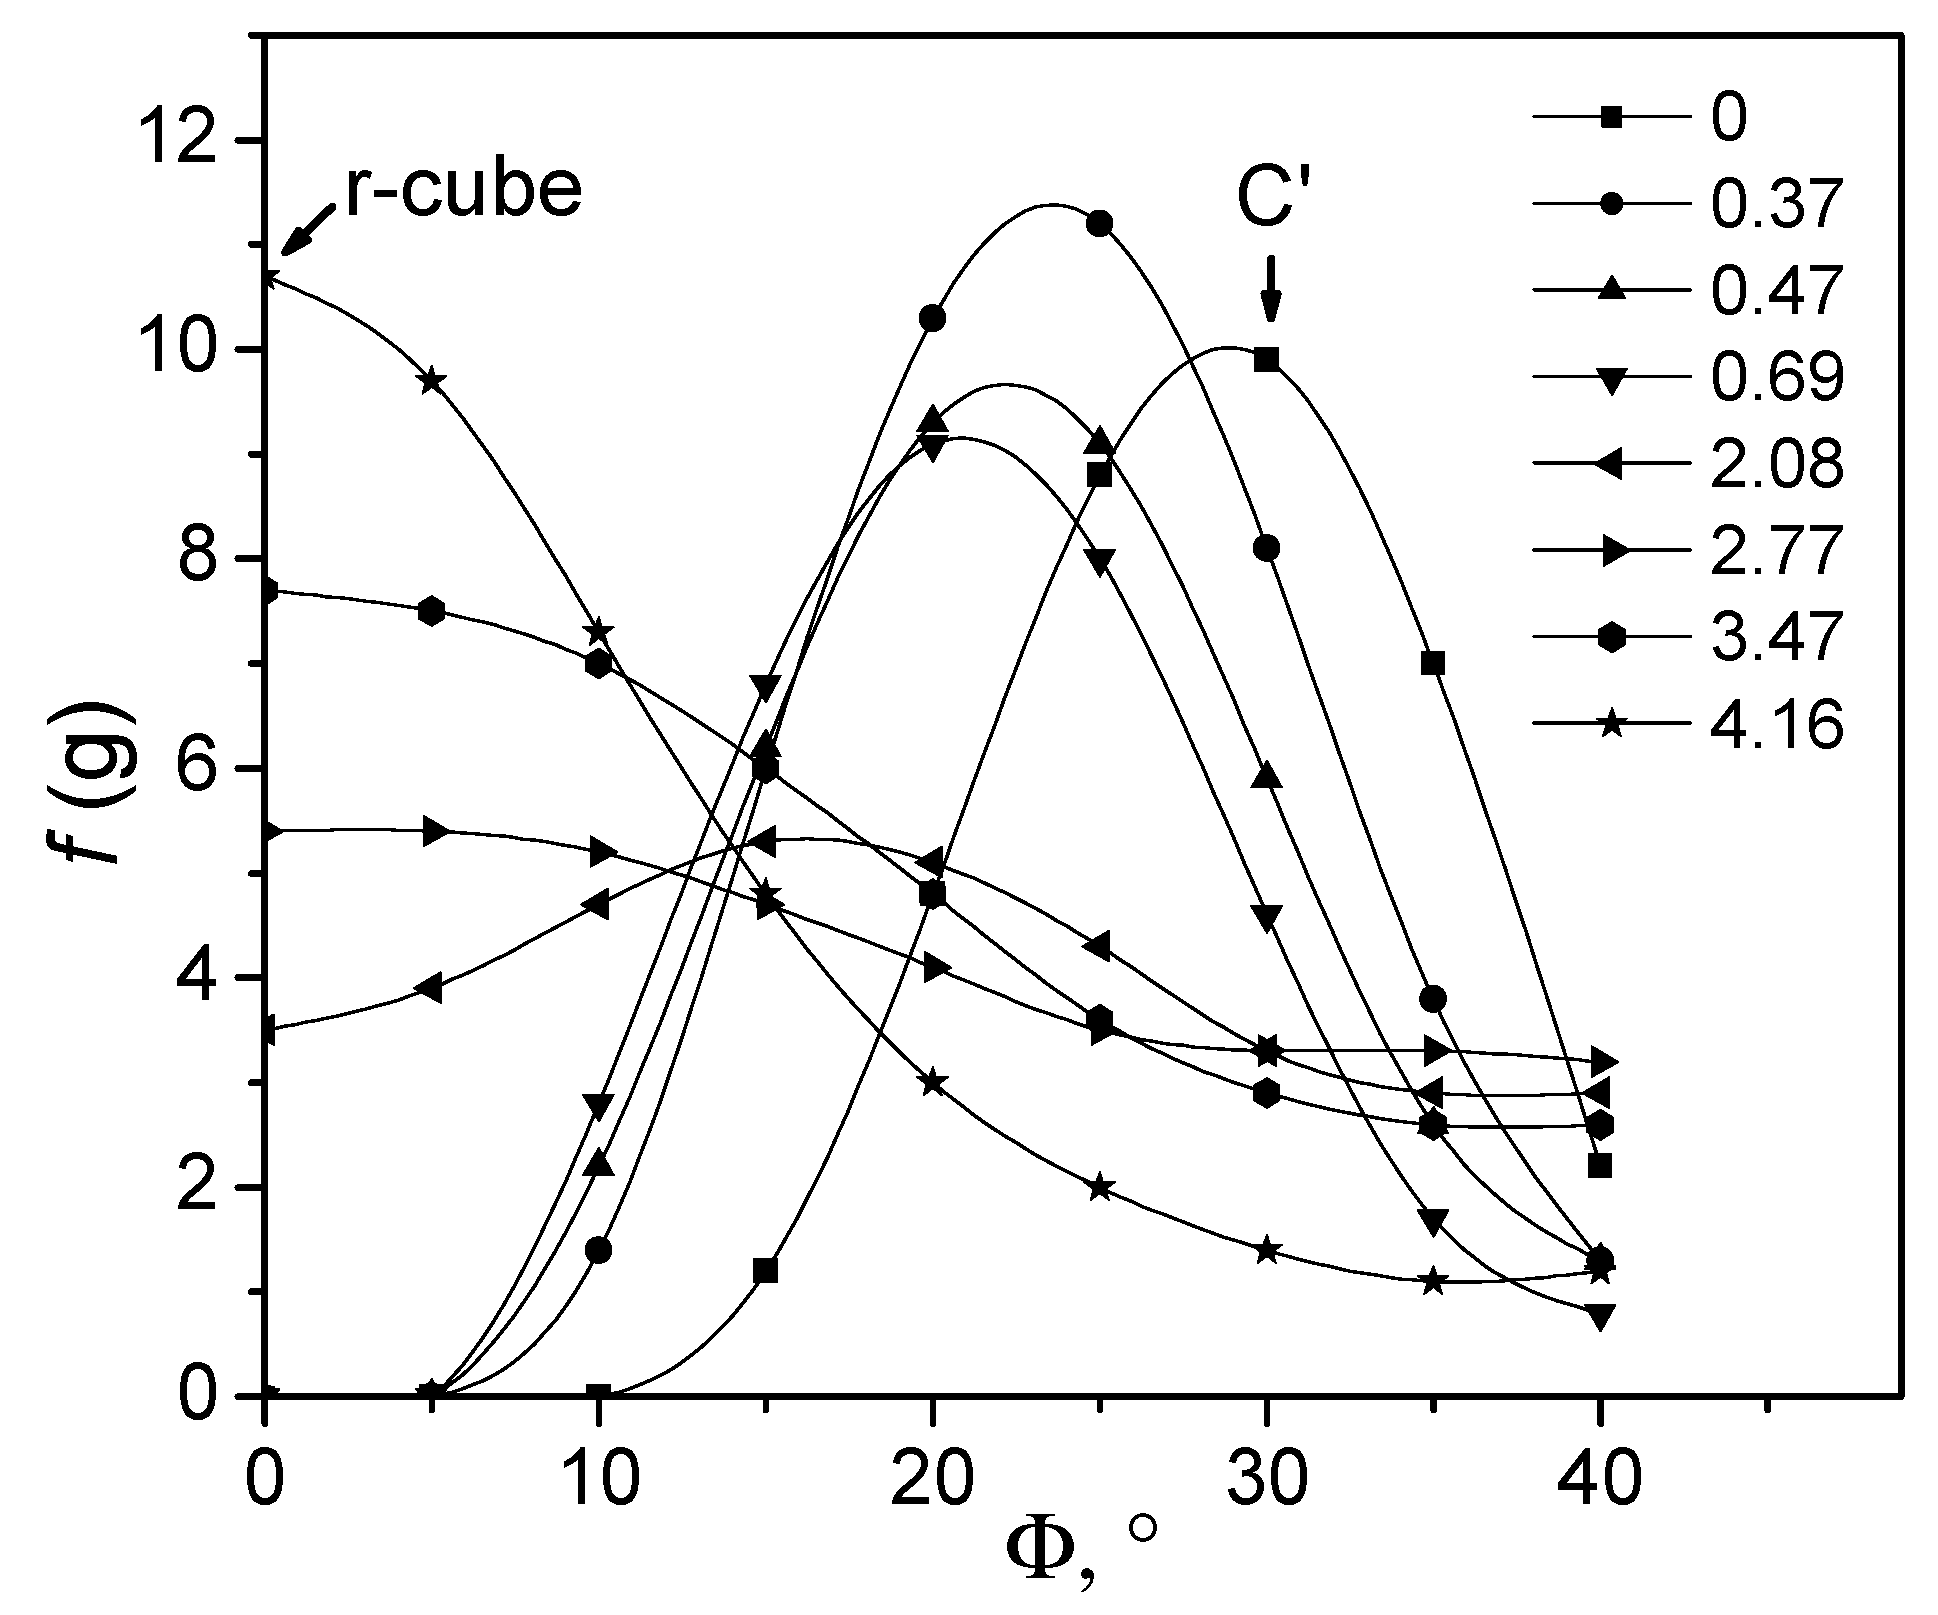
3.1. Texture Development During Shear Deformation

Figure 3 exhibits the polarized light images of the ARB-processed sheets after one, two, four, and six cycles. After one cycle, the 1060 aluminum alloy sheets exhibited satisfactory welding, illustrating successful interlayer bonding achieved during the ARB process. Grains in the sheets were stretched along the rolling direction (RD) and refined. With increasing ARB cycles, the grains became more elongated in the RD and developed into lamellar microstructures. The interface from the previous rolling pass became nearly indistinguishable, suggesting that effective bonding was achieved by the ARB process.
Figure 4 depicts the texture evolution at the surface layer of 1060 aluminum alloy sheets during the ARB process. Figure 4a shows the texture of the obtained hot-rolled sheets. The B, S, and C orientations of the initial β fiber transitioned to the B’, S’, and C’ orientations characteristic of the rotated β fiber after rotating around the rolling direction (RD). Typical B’, S’, and C’ orientations are marked in Figure 4a. These initial orientations were unstable during shear deformation and progressively rotated to the stable end r-cube orientation. During the early deformation stage (Figure 4a–c), the B’ component disappeared quickly, while the S’ and C’ orientation intensities decreased gradually with increasing accumulated true strain. At an accumulated true strain of 1.38 (Figure 4d), a weak r-cube shear texture was observed. With increasing accumulated true stain, the strength of the r-cube shear texture increased. After the accumulated true strain reached 4.16, a very strong r-cube shear texture with an intensity of 10.7 formed, suggesting that the shear texture formation during the ARB process is significantly influenced by shear deformation introduced by the high friction between the rough rolls and the sheet surface. To obtain further insights into the texture characteristics, the 3D-ODF was plotted as shown in Figure 5. A distinct rotated β fiber was observed in the initial 1060 aluminum alloy sheet, as shown Figure 5a. As the accumulated true strain increased to 0.37, the B’ component disappeared, and the “remaining fiber” was deviated from the skeleton of the initial rotated β fiber. With the accumulated true strain increasing to 4.16, a strong r-cube shear texture was observed.
To precisely ascertain the variation in the rotated β fiber, the position of maximum intensity in different sections of φ2 = constant, i.e., φ1 and Φ as a function of φ2, was plotted as shown in Figure 6. Since the B’ component disappeared quickly in the early deformation stage, only the position of maximum intensity located in the range of φ2 = 25° to 45° could be presented. As the accumulated true strain increased, the maximum intensity position gradually changed from initial rotated β fiber to the r-cube orientation. Notably, φ1 values in different φ2 sections decreased slightly with an increasing accumulated true strain, while the Φ value decreased gradually to 0°.
Figure 7 shows the intensity of components on the rotated β fiber as a function of φ2. The rotated β fiber was unstable during shear deformation, and overall orientations on the rotated β fiber indicated a decrease compared to the initial sample. The components’ intensity first decreased rapidly in the early deformation stage, followed by a slower decline. The B’ orientation intensity decreased to 0 at the accumulated true strain of 0.37. The S’ orientation intensity decreased rapidly with an increasing accumulated true strain, while the C’ orientation intensity decreased gradually.

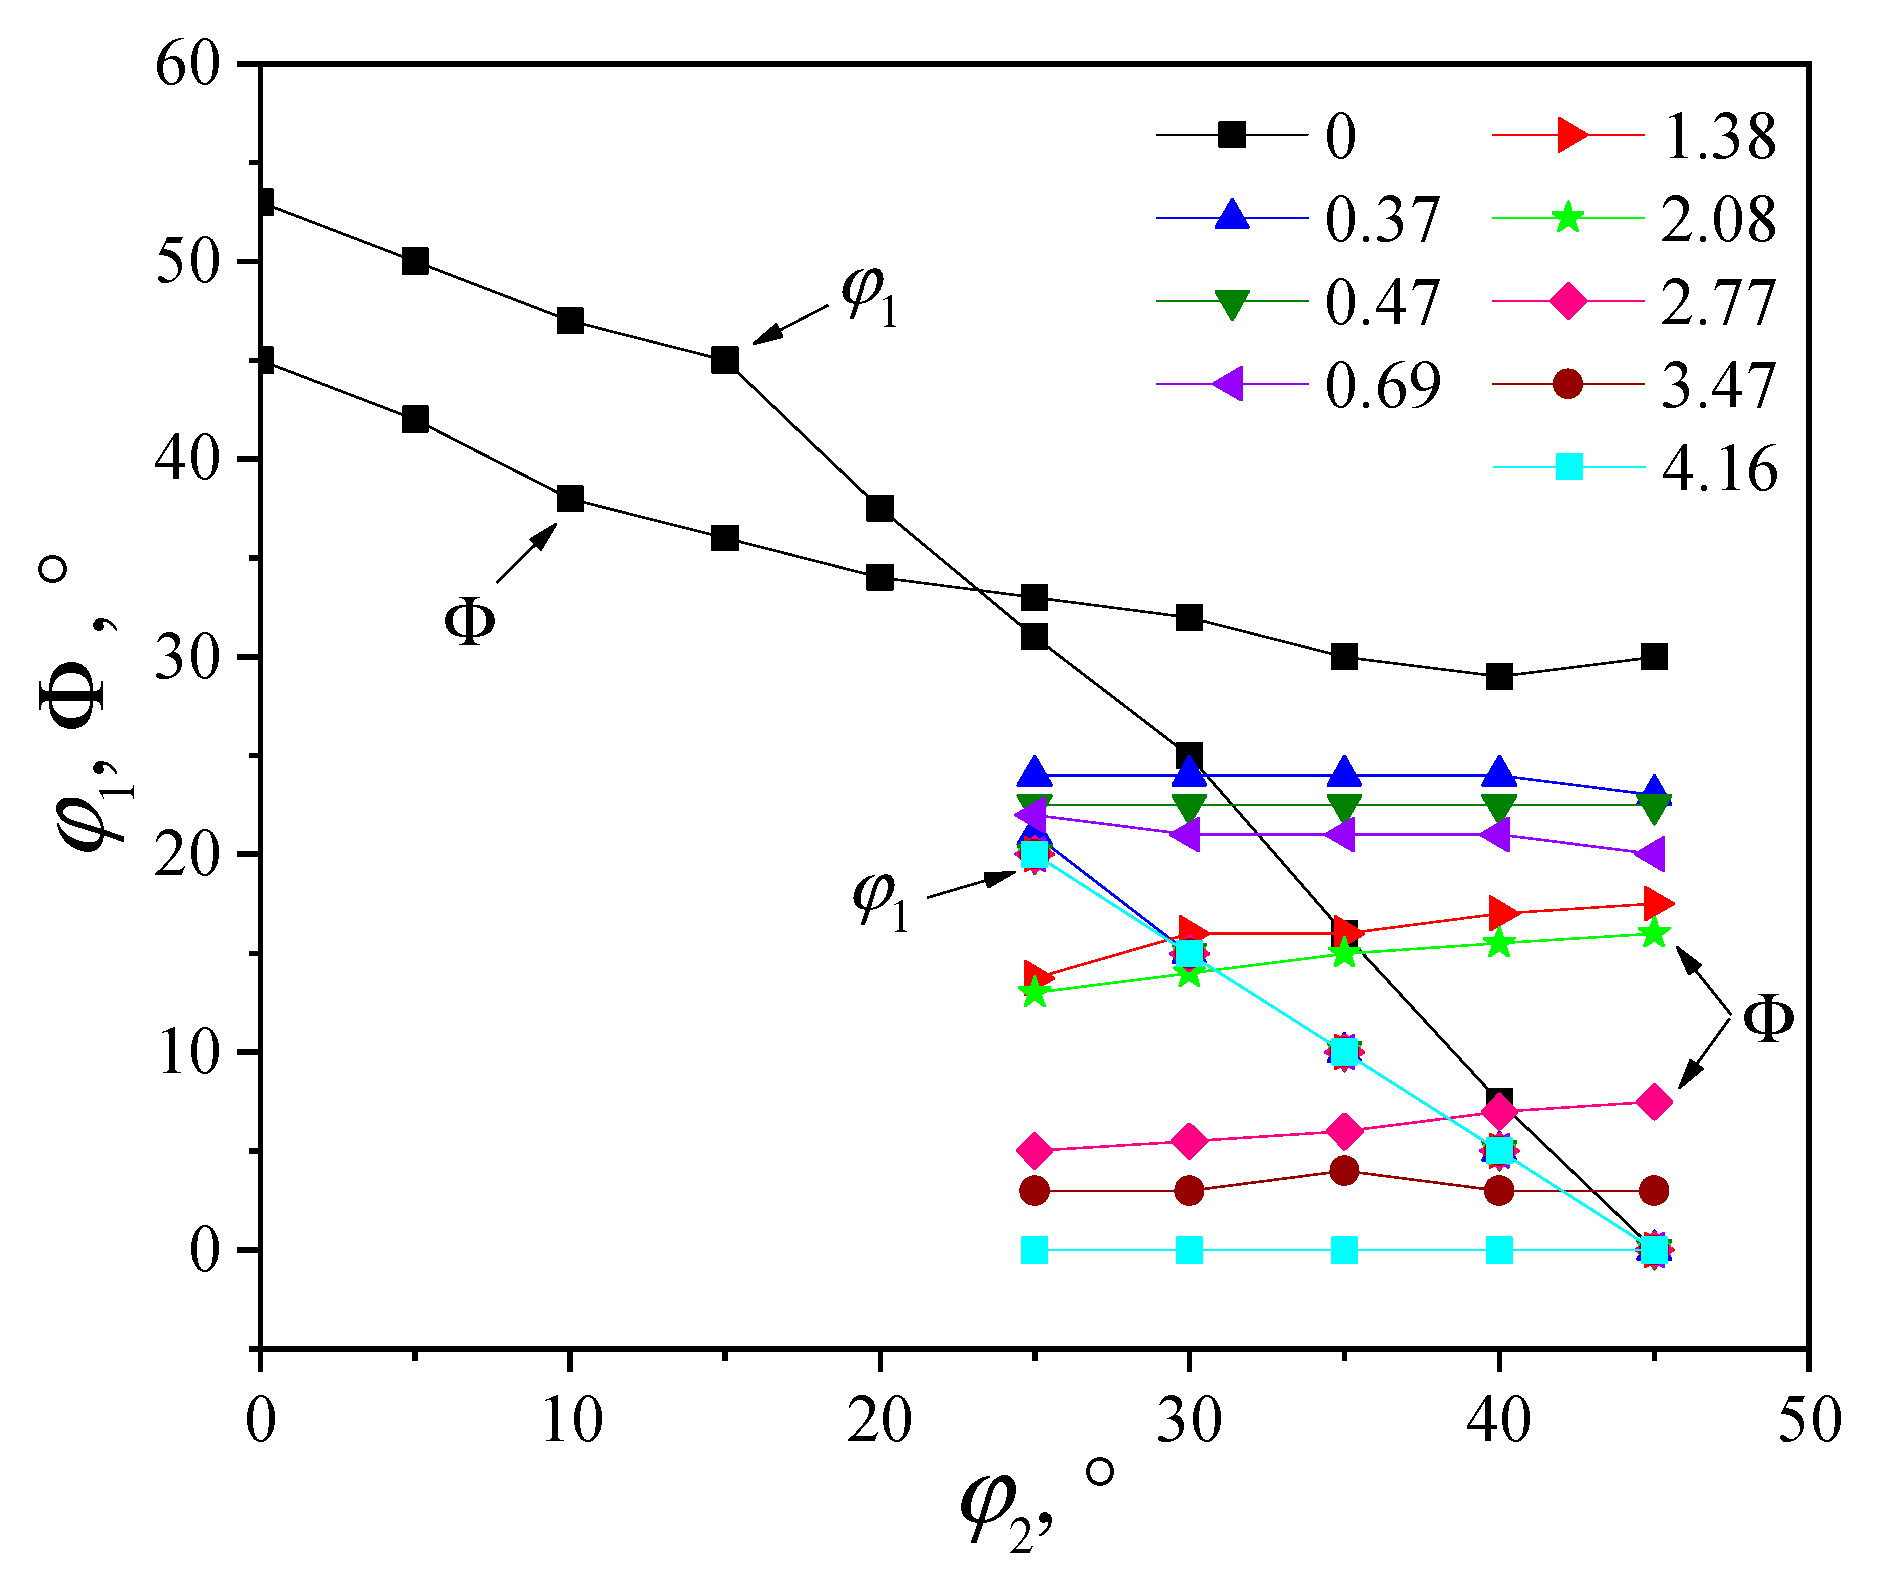
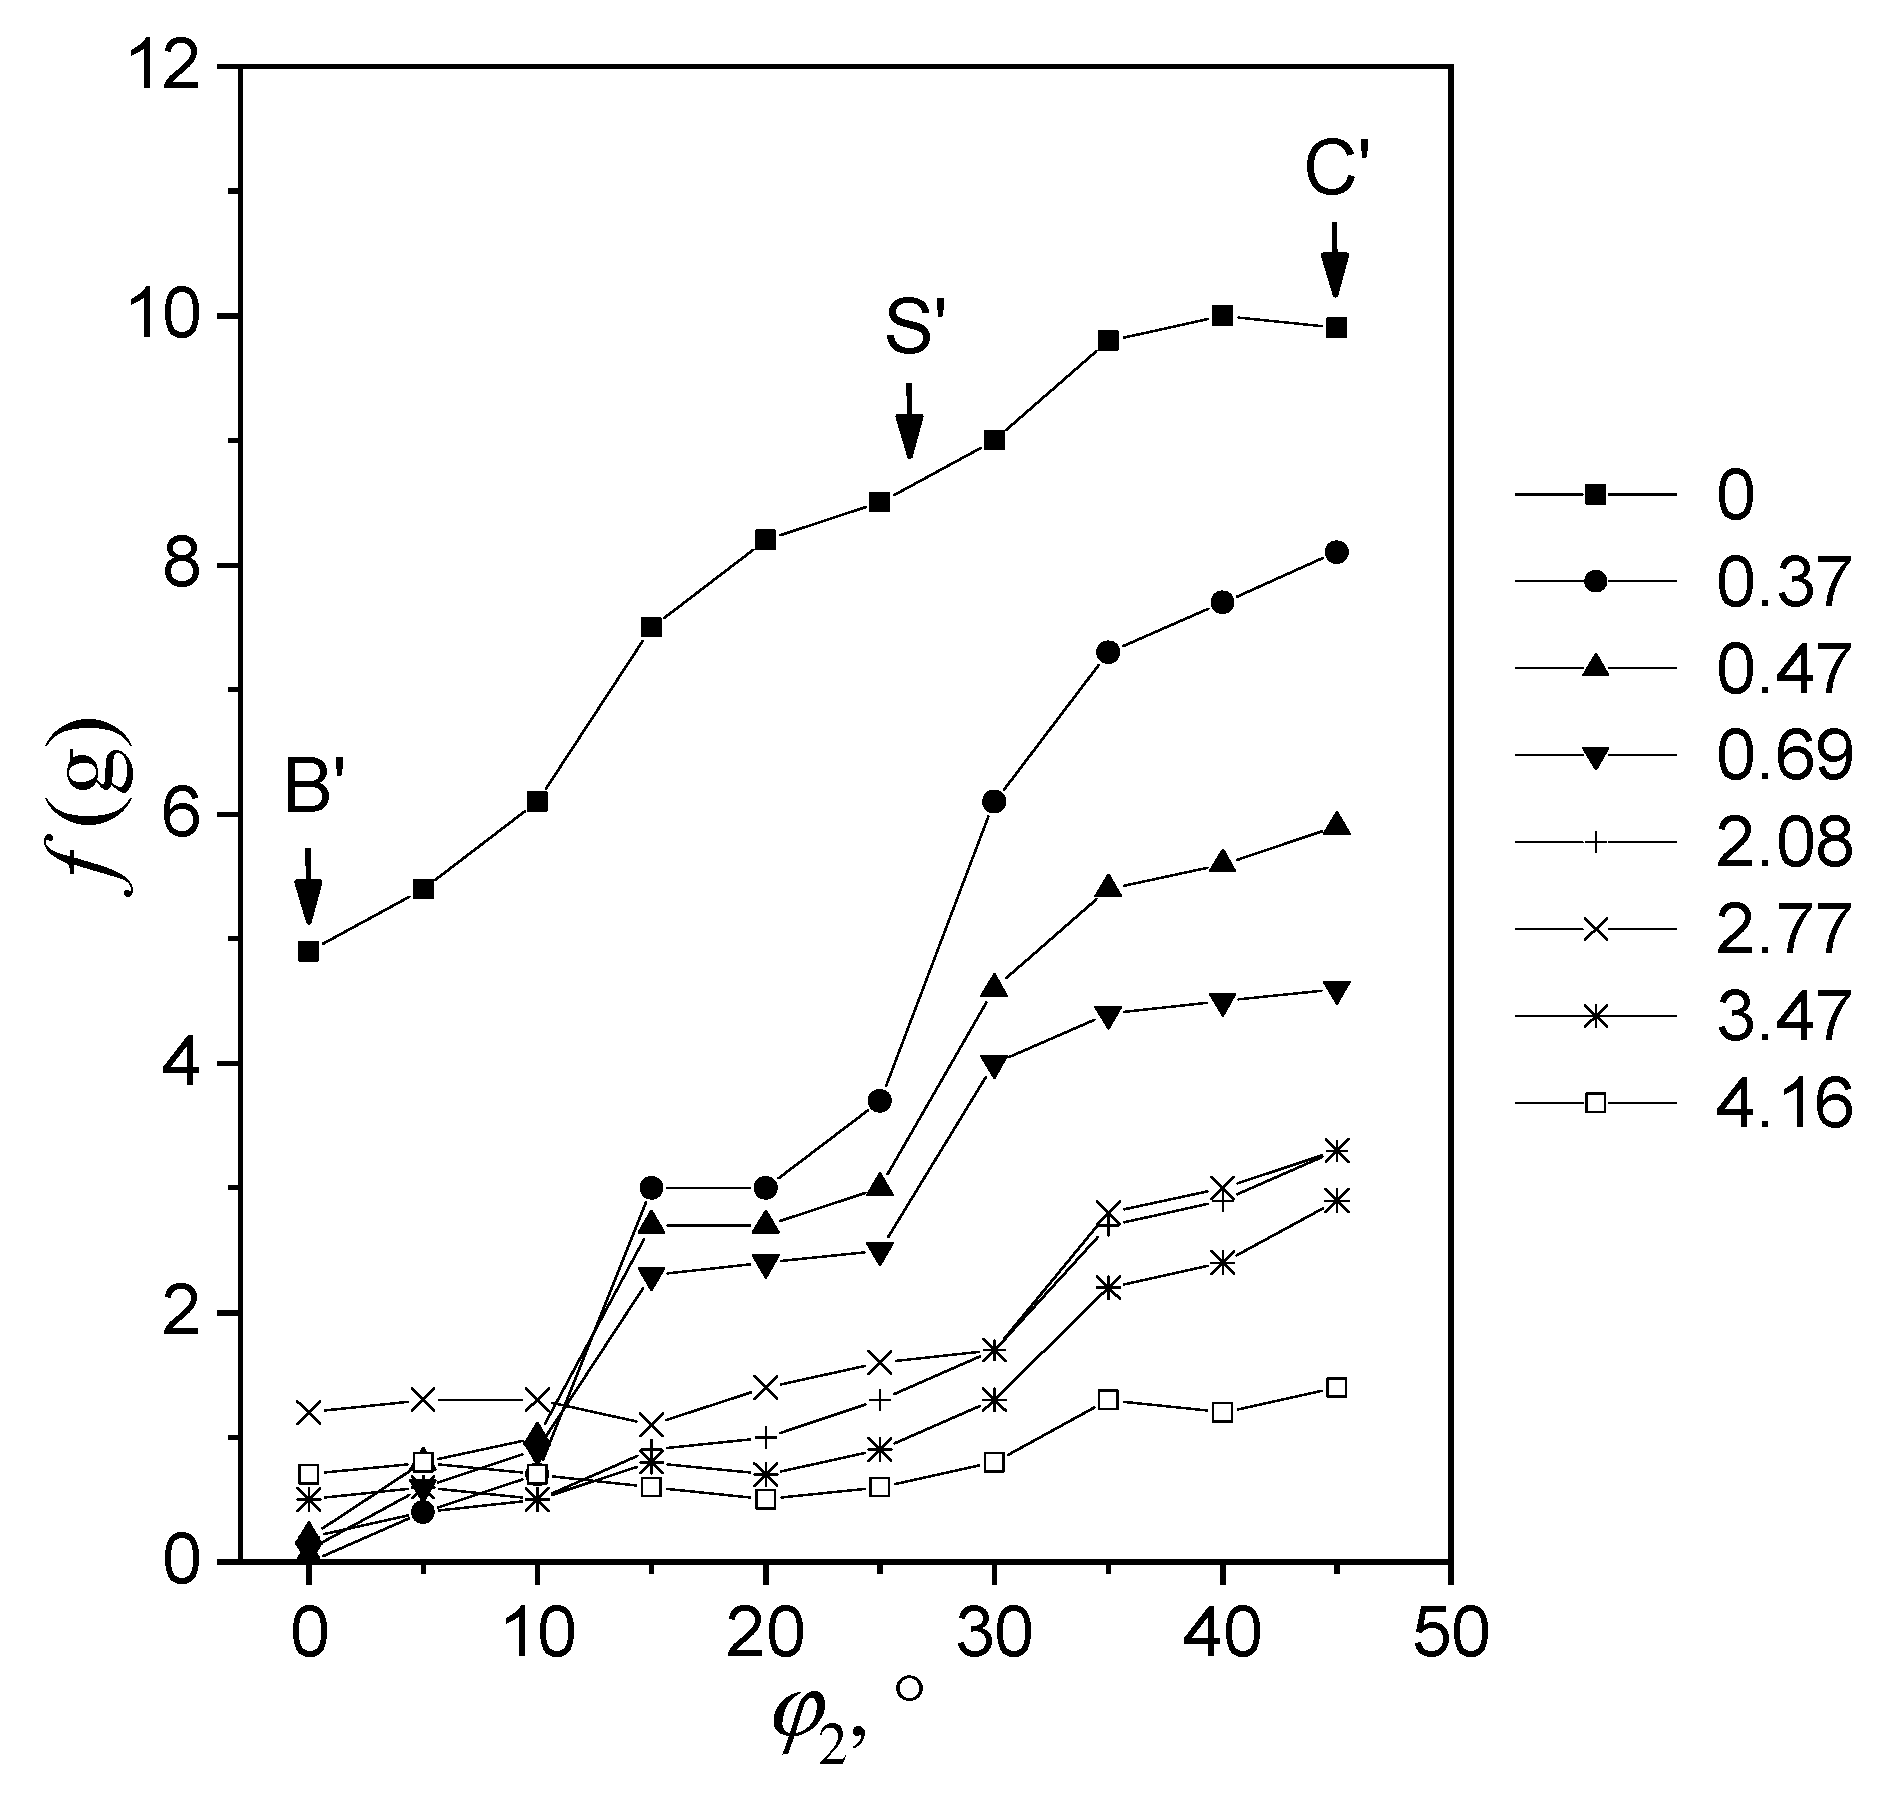
3.2. The Rotation Paths of the B’, S’, and C’ Orientations

The variation in ODFs with the accumulated true strain explicitly demonstrates the rotation paths from the initial rotated β fiber to the r-cube orientation. Figure 4 shows that the B’ orientation first shifted to the S’ orientation and then moved towards the C’ orientation during shear deformation. The C’ orientation moved along the line where φ1 = 0° within the φ2 = 45° plane towards the r-cube orientation. In the meantime, a trace that the S’ orientation rotated towards the r-cube component was also detected. The rotation path from the S’ orientation to the r-cube component deflected slightly correspondingly to the C’ component owing to the C’ orientation movement.
Figure 8 shows the orientation intensity f(g) along the φ1 = 0° lines in the φ2 = 45° plane at the surface layer of the ARB-processed sheets. The C’ orientation intensity decreased to 0 as the accumulated true strain increased, while the r-cube intensity increased. The location of maximum intensity gradually moved from the C’ orientation along the Φ axis to the r-cube orientation during shear deformation. The maximum intensity location was determined in terms of the accumulated true strain and is illustrated in Figure 9. The Φ value associated with the maximum intensity decreased quickly in the early deformation stage and then slowly decreased at the accumulated true strain from 0.69 to 2.77.
To elucidate the lattice rotation of these orientations in a more detailed way, the lattice rotation from the initial B’, S’, and C’ orientations to the stable end r-cube orientation are depicted in Figure 10 in a (1 1 1) pole figure, featuring one of the symmetrical rotation paths. It is observed that the B’ orientation moved along the skeleton of the initial rotated β fiber to the S’ orientation, while the C’ orientation moved along the TD axis to the r-cube orientation. The S’ orientation to the r-cube orientation rotation path slightly deviated from the C’ orientation.

3.3. Quantitative Analysis of Texture Evolution During ARB Process

The volume fractions of the r-cube and rotated β fiber were calculated and are shown in Figure 11, offering a more detailed quantitative understanding of these components during shear deformation. The changes in the volume fractions of the rotated β fiber and r-cube orientations can be described as follows:
f i = M i M i 0 M i M i 0
Mi0 represents the component volume fraction before ARB, Mi represents the component volume fraction at the accumulated true strain ε, and Mi represents the component volume fraction at the end of ARB. The Mi∞ value of the rotated β fiber was 0, while the Mi∞ value of the r-cube component was 1. The variation in texture volume fraction with the accumulated true strain ε can be reflected using the Johnson–Mehl–Avrami–Kolmogorov (JMAK) equation on the basis of the quantitative analysis of the rolling texture [8]:
f i = 1 exp ( k i ε n i )
ni denotes the strain exponent corresponding to the r-cube and rotated β fiber, while ki is an empirical constant. The experimental data were fitted into Equation (2) through plotting ln [ l n ( 1 f i ) ] versus ln ε, allowing for the determination of ki and ni values, as illustrated in Figure 12. The ki and ni values, along with the correlation coefficients (r), are tabulated in Table 1. Since the variation in the r-cube component volume fraction was identical to the combined volume fraction variations in the rotated β fiber and remainder components, the value of M r o t a t e d   β   f i b e r + M r e m a i n d e r can be calculated through the utilization of the ki and ni values of the r-cube component. The subsequent formulae could be derived as follows on the basis of Equations (1) and (2):
M r - c u b e = M 10 exp ( k 1 ε n 1 )
M r o t a t e d   β   f i b e r = M 20 exp ( k 2 ε n 2 )
M r o a t e d   β   f i b e r + M r e m a i n d e r = ( 1 M 10 ) e x p ( k 1 ε n 1 )
M r e m a i n d e r = ( 1 M 10 ) e x p ( k 1 ε n 1 ) M 20 exp ( k 2 ε n 2 )
where M10 and M20 represent the r-cube and rotated β fiber volume fractions before ARB, respectively. Texture volume fractions were determined using Equations (3)–(6) and are presented in Figure 11 as a function of the accumulated true strain. In Figure 11, experimental data points are represented by various symbols, while the curves illustrate the fitting results. The variation in the r-cube and rotated β fiber volume fractions during shear deformation can be extracted better by using the fitting procedure. The high r values in Table 2 demonstrate that the JMAK equation can quantify 1060 aluminum alloy texture evolution during shear deformation.
To assess the r-cube and rotated β fiber evolution rate, the derivative (dMidε) was determined using Equations (3) and (4), as shown in Figure 13. Negative values indicate the disappearance of the rotated β fiber, while positive values correspond to the r-cube component formation. The rotated β fiber disappearance rate initially decreased rapidly as the accumulated true strain increased, followed by a slower decline. The rotated β fiber was unstable during shear deformation, and it rotated toward the r-cube component through the remainder component. Therefore, the r-cube formation rate was lower than the rotated β fiber disappearance rate owing to the increasing remainder component volume fraction.

4. Conclusions

X-ray diffraction analysis was employed to examine the 1060 aluminum alloy’s texture evolution during the ARB process, which initially featured a rotated β fiber texture. The key conclusions are as follows:
(1)
The rotated β fiber was unstable, and it rotated to the r-cube shear texture. The B’ orientation disappeared quickly in the early deformation stage, while the S’ and C’ orientation intensities decreased gradually as the accumulated true strain increased. In the meantime, the r-cube orientation intensity increased as the accumulated true strain increased.
(2)
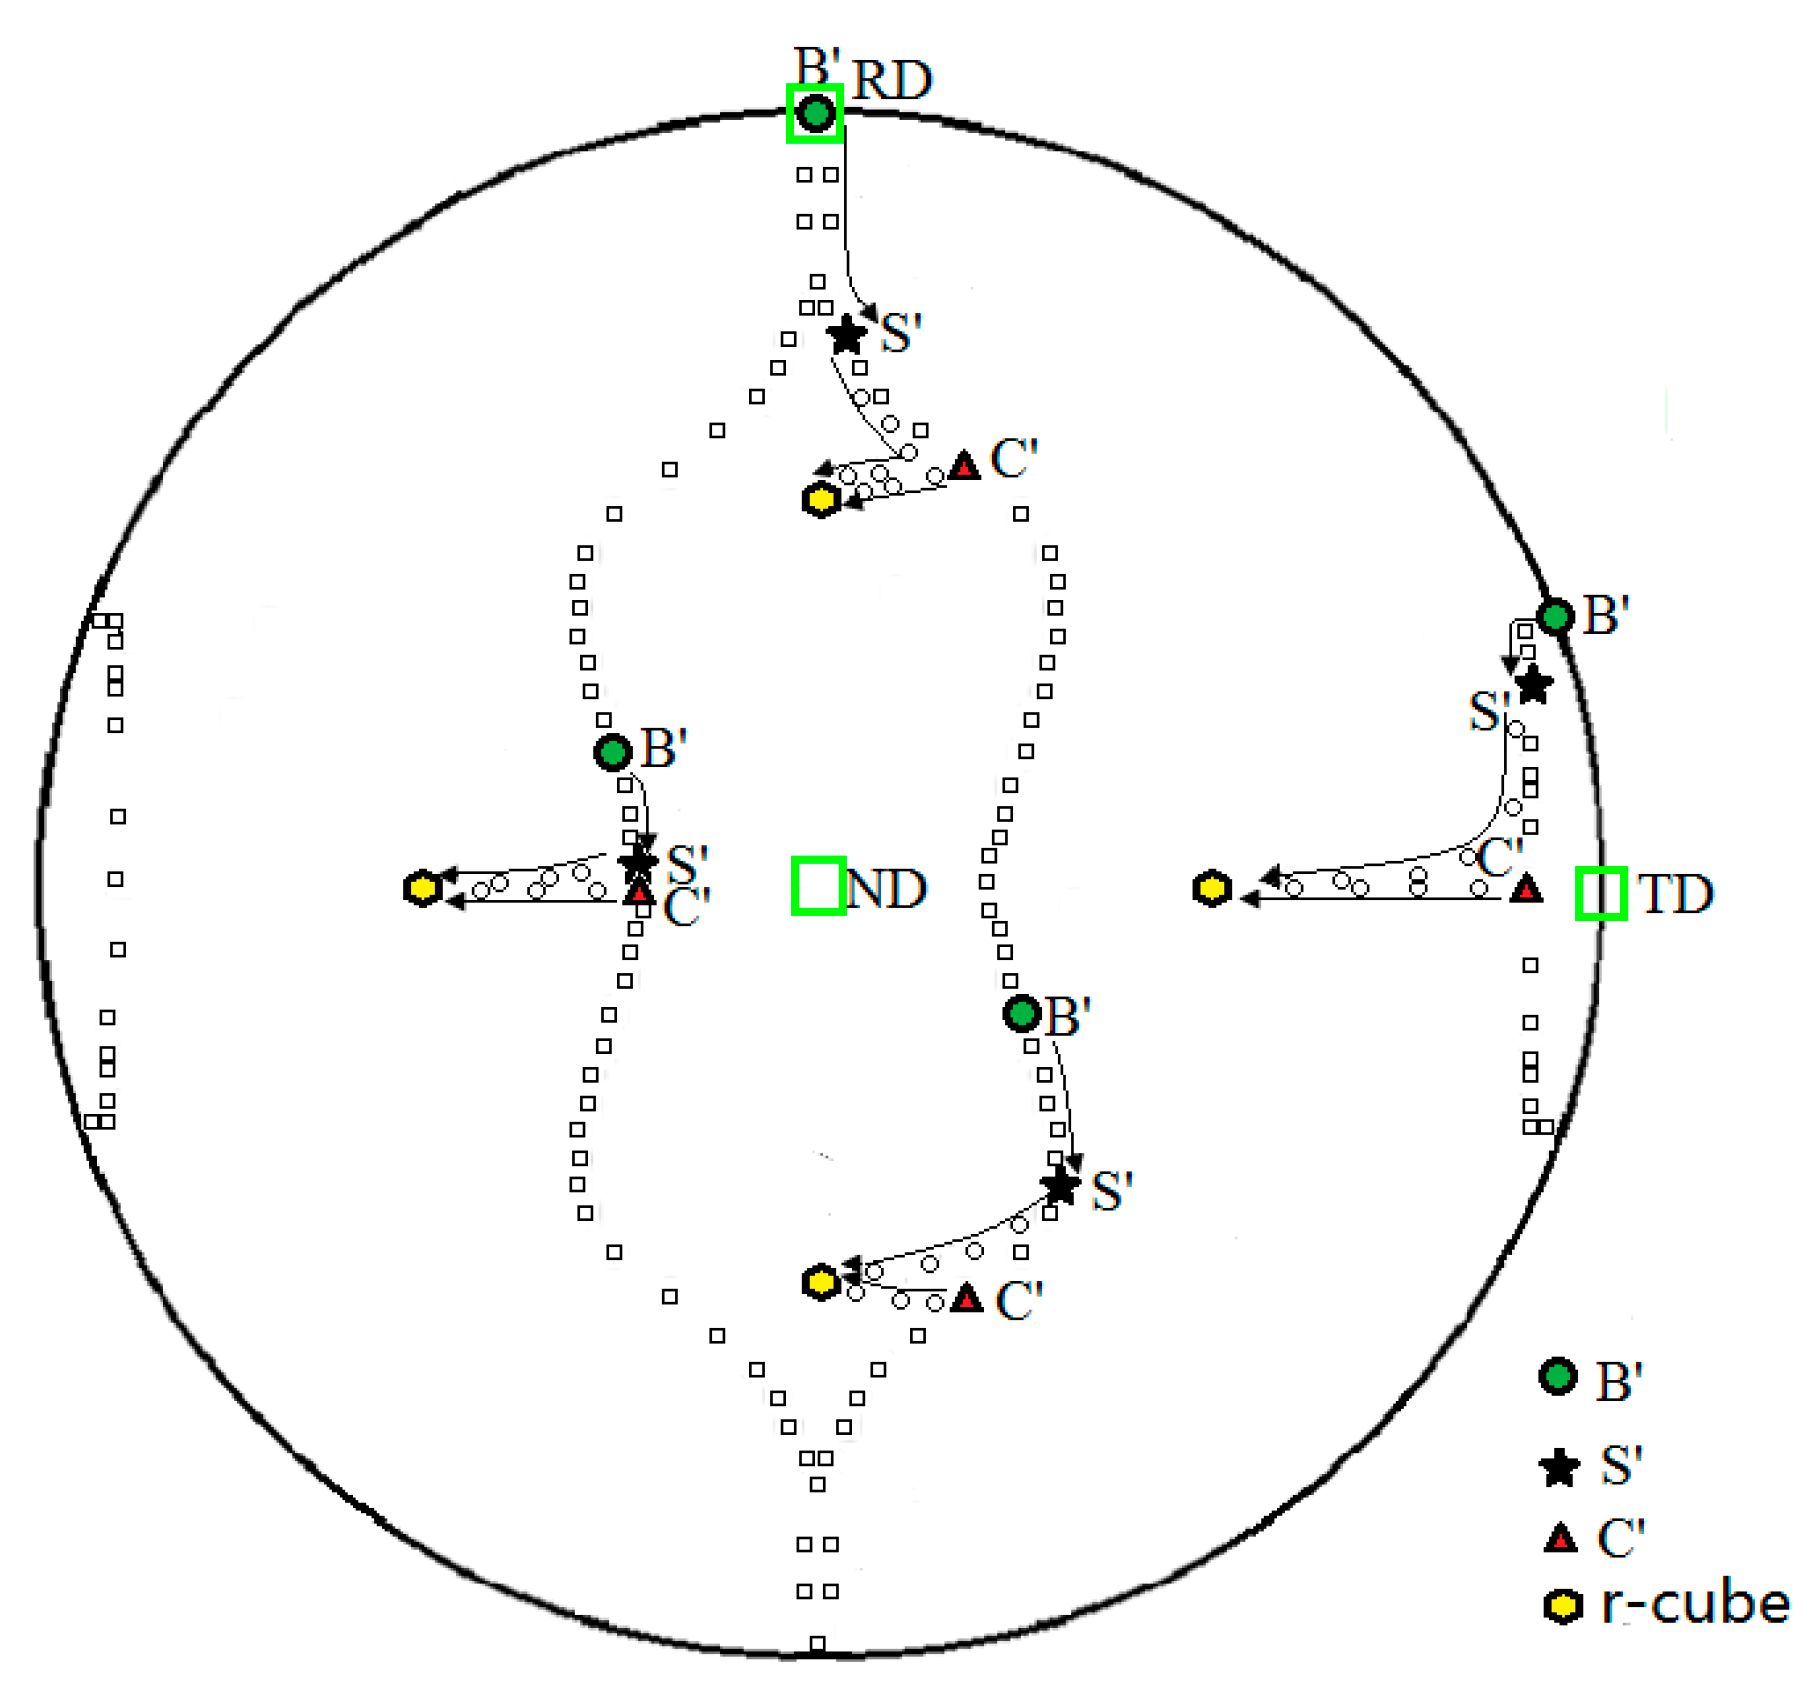
The rotation paths from the rotated β fiber to the r-cube orientation were determined according to the ODFs. The B’ orientation moved to the S’ orientation along the initial rotated β fiber skeleton, while the C’ orientation moved along the TD axis to the r-cube orientation. The S’ orientation to the r-cube orientation rotation path slightly deviated from the C’ orientation.
(3)
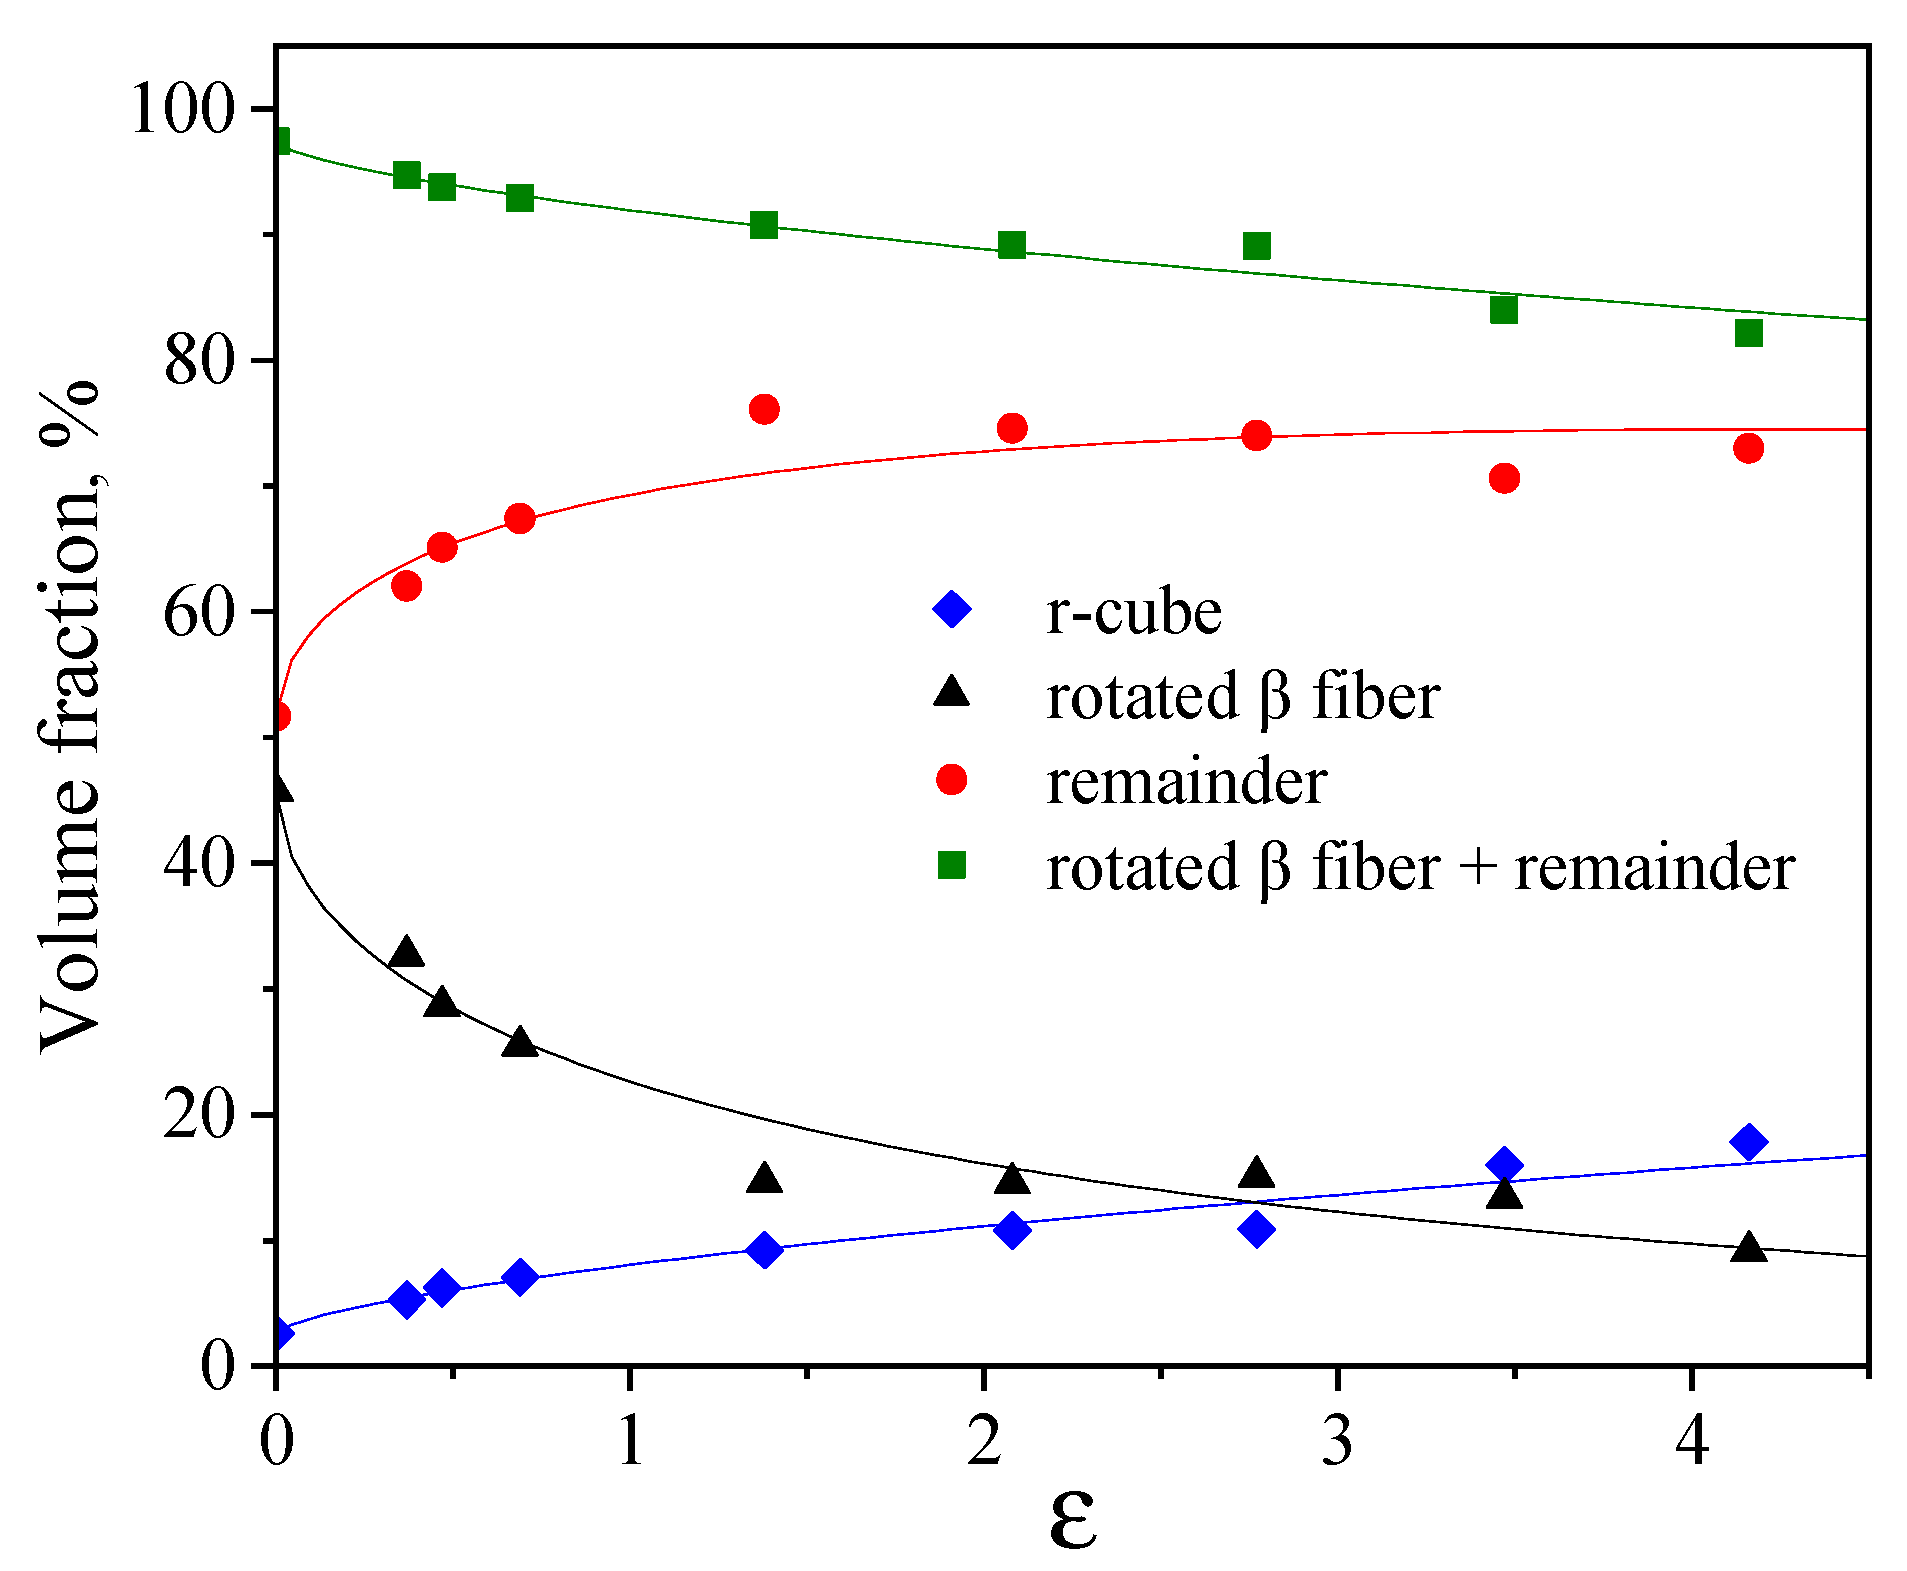
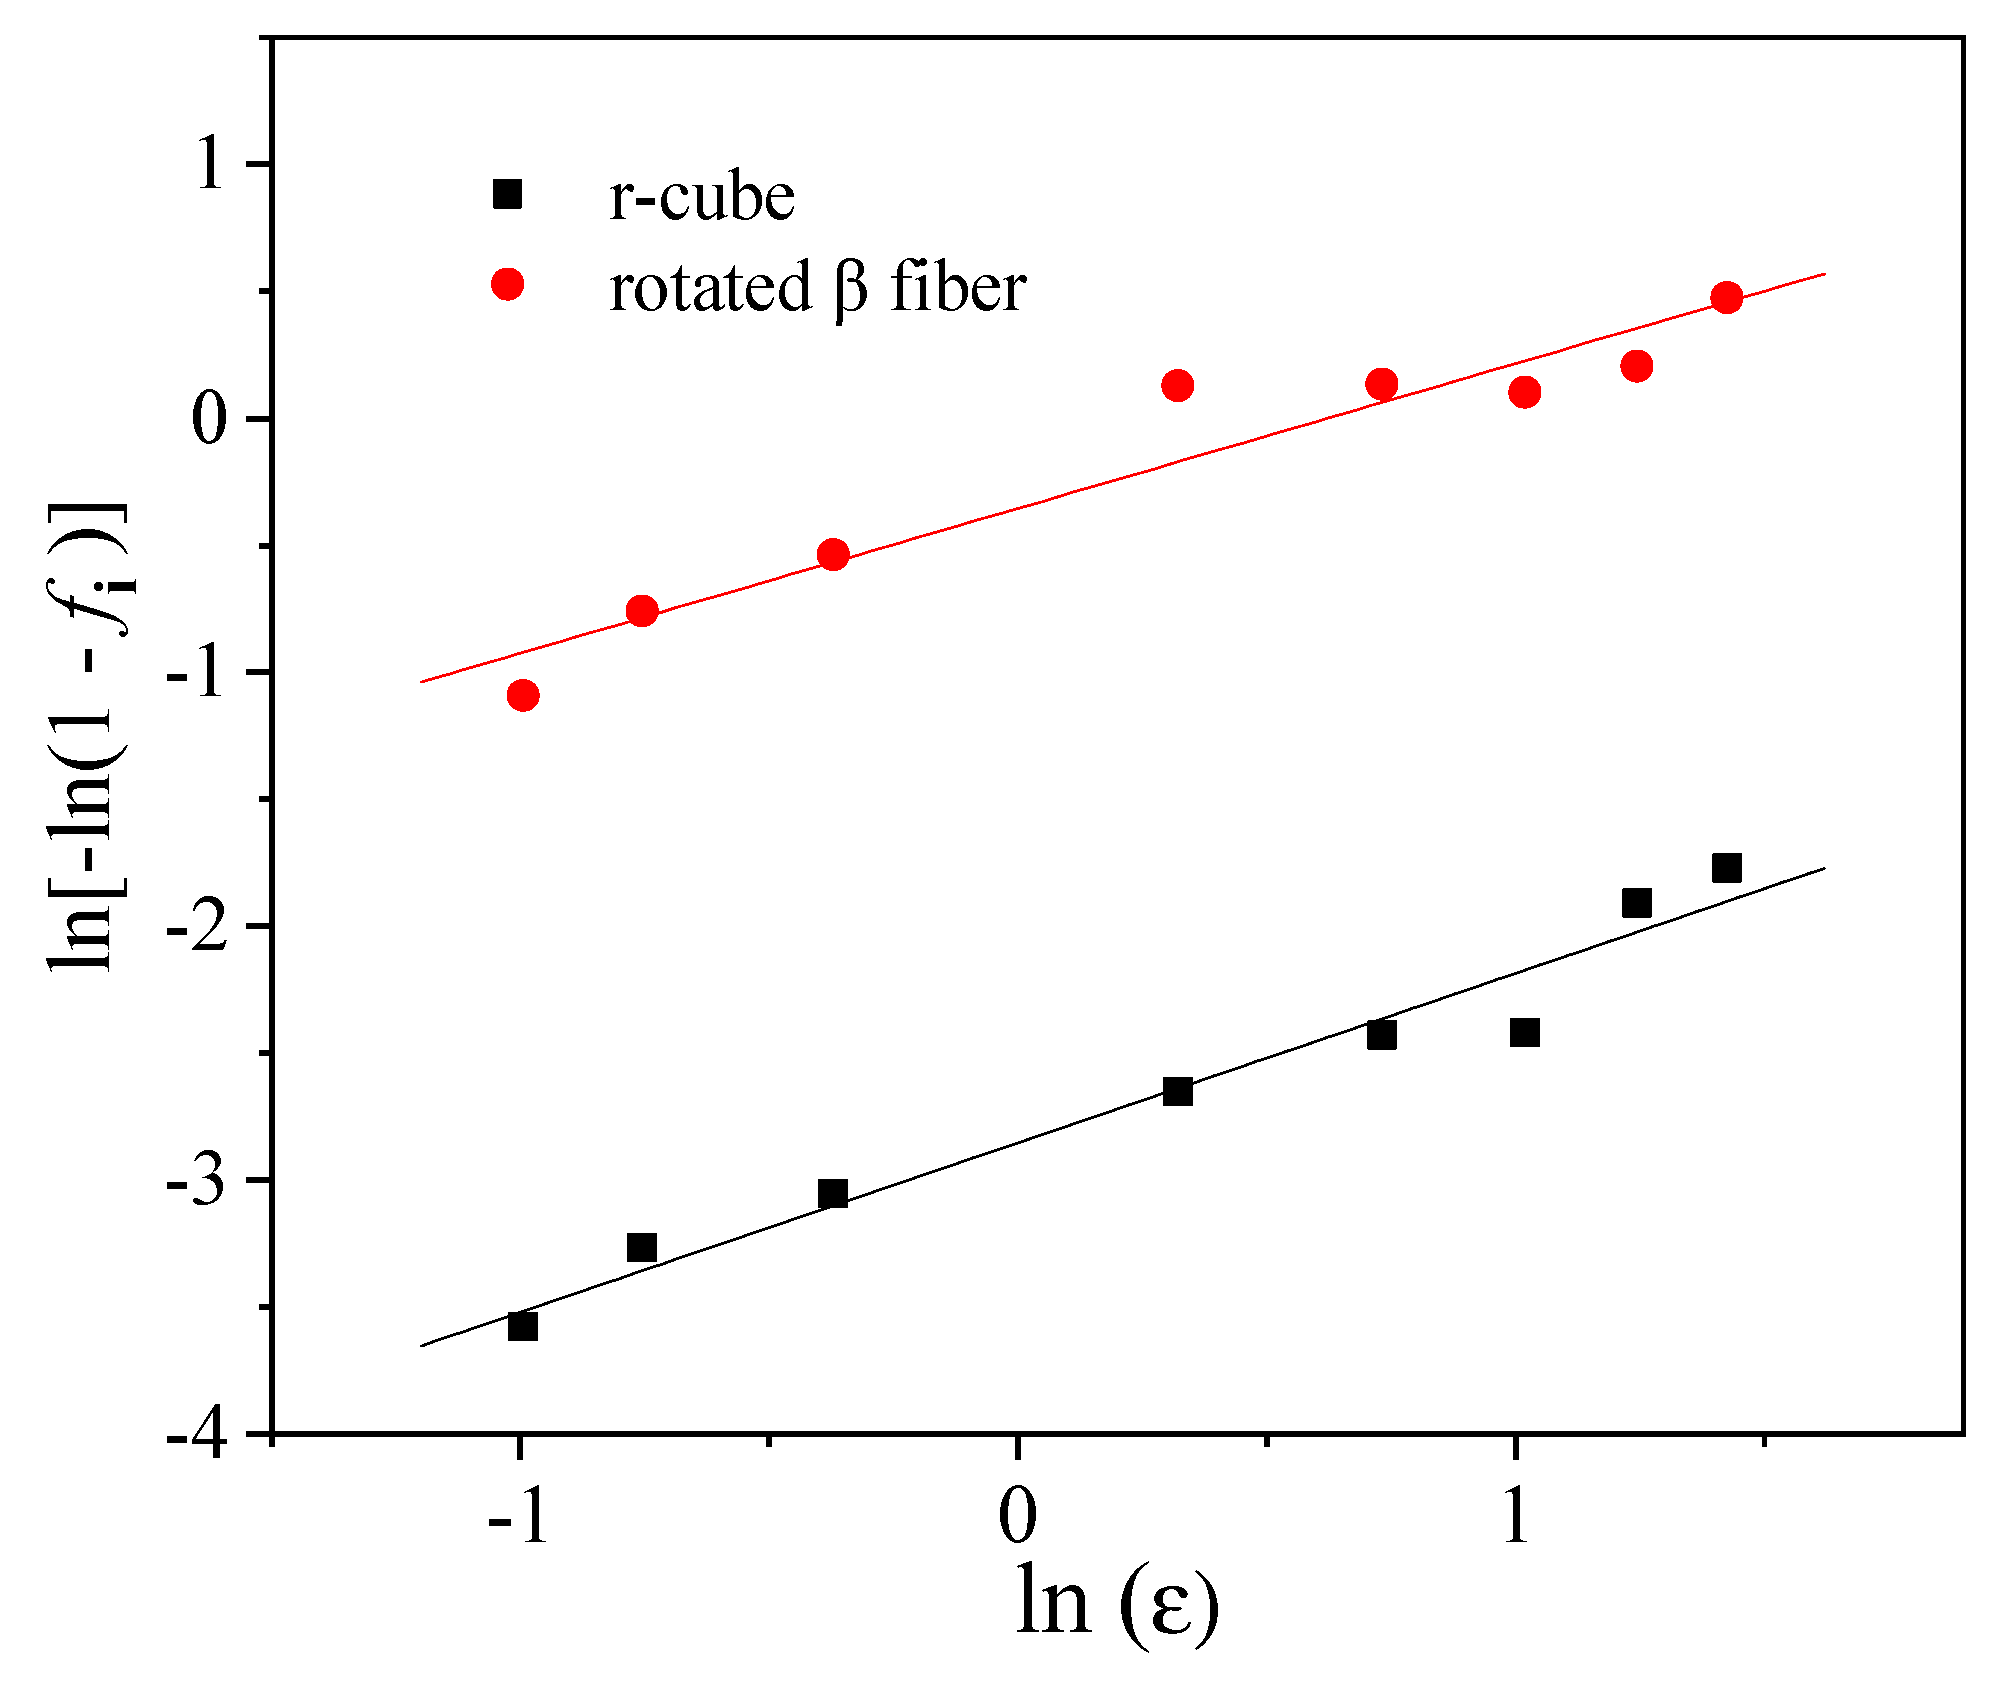
The texture evolution of 1060 aluminum alloy featuring an initial rotated β fiber during shear deformation was analyzed in a quantitative manner by establishing a mathematical relationship between the texture volume fractions and accumulated true strain, which allowed us to make more precise predictions regarding the texture evolution during shear deformation.
(4)
To obtain a better understanding of texture evolution and lattice rotation during shear deformation, future studies could focus on the lattice rotation based on the analysis of slip systems, calculating the slip systems under shear deformation.

Author Contributions

Investigation, H.S. and J.O.; methodology, H.S. and J.O.; writing—original draft preparation, H.S. and J.O.; data curation, L.C.; visualization, L.C.; formal analysis, L.S. and Y.L.; writing—review and editing, L.S. and Y.L. All authors have read and agreed to the published version of the manuscript.

Funding

This research received no external funding.

Data Availability Statement

The original contributions presented in this study are included in the article. Further inquiries can be directed to the corresponding author.

Conflicts of Interest

The authors declare no conflict of interest.

References

  1. Mehr, V.Y.; Toroghinejad, M.R. On the texture evolution of aluminum-based composites manufactured by ARB rocess: A review. J. Mater. Res. Technol. 2022, 21, 1095–1109. [Google Scholar] [CrossRef]
  2. Attarilar, S.; Ebrahimi, M.; Hsieh, T.H.; Uan, J.Y.; Göde, C. An insight into the vibration-assisted rolling of AA5052 aluminum alloy: Tensile strength, deformation microstructure, and texture evolution. Mater. Sci. Eng. A 2021, 803, 140489. [Google Scholar] [CrossRef]
  3. Xie, H.; Wang, M.P.; Chen, W.; Jia, Y. Microstructure, mechanical properties, and texture evolution of aluminum alloy 7005 by accumulative roll bonding. J. Mater. Eng. Perform. 2016, 25, 1199–1210. [Google Scholar] [CrossRef]
  4. Liu, W.C.; Man, C.-S.; Morris, J.G. Lattice rotation of the cube orientation to the β fiber during cold rolling of AA 5052 aluminum alloy. Scr. Mater. 2001, 45, 807–814. [Google Scholar] [CrossRef]
  5. Li, Z.J.; Godfrey, A.; Liu, Q. Macroscopic sub-division of rolled Al-1% Mn single crystals of {001}<110> orientation. Scr. Mater. 2001, 45, 847–852. [Google Scholar]
  6. Liu, W.C.; Kong, X.Y.; Chen, M.B.; Li, J.; Yuan, H.; Yang, Q.X. Texture development in a pseudo cross-rolled AA 3105 aluminum alloy. Mater. Sci. Eng. A 2009, 516, 263–269. [Google Scholar] [CrossRef]
  7. Liu, W.C.; Morris, J.G. Comparison of the texture evolution in cold rolled DC and SC AA 5182 aluminum alloys. Mater. Sci. Eng. A 2003, 339, 183–193. [Google Scholar] [CrossRef]
  8. Liu, W.C.; Morris, J.G. Quantitative analysis of texture evolution in cold-rolled, continuous-cast AA 5xxx-series aluminum alloys. Metall. Mater. Trans. A 2004, 35, 265–277. [Google Scholar] [CrossRef]
  9. Bednarczyk, I.; Dobkowska, A.; Hilšer, O.; Rusz, S.; Pastrňák, M.; Čada, R.; Mizera, J. Influence of temperature and number of passes during twist channel angular pressing (TCAP) on the microstructural, mechanical, and corrosion properties of Mg–4Li–Ca. Arch. Civ. Mech. Eng. 2024, 24, 89. [Google Scholar] [CrossRef]
  10. Wang, X.; Liu, H.; Tang, X.; Wang, Y.; Guo, M.; Zhuang, L. Influence of asymmetric rolling on the microstructure, texture evolution and mechanical properties of Al–Mg–Si alloy. Mater. Sci. Eng. A 2022, 844, 143154. [Google Scholar] [CrossRef]
  11. Ebrahimi, M.; Wang, Q. Accumulative roll-bonding of aluminum alloys and composites: An overview of properties and performance. J. Mater. Res. Technol. 2022, 19, 4381–4403. [Google Scholar]
  12. Khatami, R.; Fattah-alhosseini, A.; Mazaheri, Y.; Keshavarz, M.K.; Haghshenas, M. Microstructural evolution and mechanical properties of ultrafine grained AA2024 processed by accumulative roll bonding. J. Adv. Manuf. Technol. 2017, 93, 681–689. [Google Scholar]
  13. Sun, H.Y.; Du, P.; Wang, Z.J.; Ma, M.; Liu, W.C.; Sasaki, G.; Zhang, J.X. Study on the microstructure, texture and mechanical properties of hot-rolled and T6-treated Al1060/Al6061-TiCp/Al1060 laminated composites. J. Mater. Res. Technol. 2022, 18, 2808–2821. [Google Scholar]
  14. Wang, Z.J.; Liu, S.; Qiu, Z.X.; Sun, H.Y.; Liu, W.C. A Study of the Microstructure, Texture and tensile properties of 1060/Al-TiC/1060 sandwich composites prepared by hot-roll bonding. Metall. Mater. Trans. A 2020, 51, 6714–6726. [Google Scholar]
  15. Li, S.; Li, F.S.H. Observation and modeling of the through-thickness texture gradient in commercial-purity aluminum sheets processed by accumulative roll-bonding. Acta Mater. 2010, 58, 1317–1331. [Google Scholar]
  16. Jamaati, R.; Toroghinejad, M.R.; Hoseini, M.; Szpunar, J.A. Texture development in Al/Al2O3 MMCs produced by anodizing and ARB processes. Mater. Sci. Eng. A 2011, 528, 3573–3580. [Google Scholar]
  17. Shaarbaf, M.; Toroghinejad, M.R. Evaluation of texture and grain size of nanograined copper produced by the accumulative roll bonding process. Metall. Mater. Trans. A 2009, 40, 1693–1700. [Google Scholar]
  18. Beausir, B.; Scharnweber, J.; Jaschinski, J.; Brokmeier, H.G.; Oertel, C.G.; Skrotzki, W. Plastic anisotropy of ultrafine grained aluminium alloys produced by accumulative roll bonding. Mater. Sci. Eng. A 2010, 527, 3271–3278. [Google Scholar] [CrossRef]
  19. Kim, K.H.; Lee, D.N. Analysis of deformation textures of asymmetrically rolled aluminum sheets. Acta Mater. 2001, 49, 2583–2595. [Google Scholar] [CrossRef]
  20. Wang, Z.J.; Ma, M.; Qiu, Z.X.; Zhang, J.X.; Liu, W.C. Microstructure, texture and mechanical properties of AA 1060 aluminum alloy processed by cryogenic accumulative roll bonding. Mater. Charact. 2018, 139, 269–278. [Google Scholar] [CrossRef]
  21. Sun, H.Y.; Wang, Z.J.; Du, P.; Zhang, J.X.; Liu, W.C. Effect of rolling reduction and heat treatment on the microstructure and mechanical properties of Al1060/Al6061-0.5 SiC/Al1060 laminates. Mater. Sci. Eng. A 2022, 830, 142328. [Google Scholar] [CrossRef]
  22. Sun, H.Y.; Zhang, D.H.; Ma, M.; Zhang, J.X.; Liu, W.C. Effect of rolling parameters on microstructure, texture, and mechanical properties of Al/Mg/Al laminated composites. J. Mater. Eng. Perform. 2022, 31, 7624–7640. [Google Scholar] [CrossRef]
Figure 1. Microstructure of initial hot-rolled sheets.
Metals 15 00418 g001
Figure 2. Schematic illustration of accumulative roll-bonding process.
Metals 15 00418 g002
Figure 3. Polarized light images of 1060 aluminum alloy sheets processed by ARB after (a) one, (b) two, (c) four, and (d) six cycles.
Metals 15 00418 g003
Figure 4. ODFs at the surface layer of the ARB-processed sheets at accumulated true strains of (a) 0, (b) 0.37, (c) 0.69, (d) 1.38, (e) 2.77, and (f) 4.16.
Metals 15 00418 g004
Figure 5. Three-dimensional ODFs at the surface layer of the ARB-processed sheets at accumulated true strains of (a) 0, (b) 0.37, and (c) 4.16.
Metals 15 00418 g005
Figure 6. Variations in the positions of orientations with maximum intensity with accumulated true strain during shear deformation.
Metals 15 00418 g006
Figure 7. ODF f(g) intensities at the rotated β fiber centerline as a function of a particular φ2 angle for ARB-processed sheets with different accumulated true strains.
Metals 15 00418 g007
Figure 8. The orientation intensity f(g) along the φ1 = 0° line in the φ2 = 45° plane at the ARB-processed sheets’ surface layer with different accumulated true strains.
Metals 15 00418 g008
Figure 9. Lattice rotation from the C’ orientation to the r-cube orientation with an increasing accumulated true strain.
Metals 15 00418 g009
Figure 10. Rotation paths from the B’, S’, and C’ orientations to the r-cube component in a (111) pole figure.
Metals 15 00418 g010
Figure 11. Variations in the volume fractions of the B’, S’, and C’ orientations with the accumulative true strain.
Metals 15 00418 g011
Figure 12. ln[−ln (1 − fi)] versus ln (ε) for the ARB-processed sheets.
Metals 15 00418 g012
Figure 13. Derivative of r-cube and rotated β fiber volume fractions as function of accumulated true strain.
Metals 15 00418 g013
Table 1. Chemical compositions of 1060 aluminum alloy (wt. %).
ElementSiFeCuMnMgZnTiVAl
Content0.120.140.030.010.020.030.020.0399.6
Table 2. Values of ki, ni, and r for the r-cube and rotated β fiber components at the surface layer of ARB-processed aluminum sheets.
Texture ComponentMi0 (%)kinir
r-cube2.60.058 (0.055–0.061)0.667 ± 0.0540.980
rotated β fiber54.30.528 (0. 493–0.564)0.636 ± 0.0720.961
Disclaimer/Publisher’s Note: The statements, opinions and data contained in all publications are solely those of the individual author(s) and contributor(s) and not of MDPI and/or the editor(s). MDPI and/or the editor(s) disclaim responsibility for any injury to people or property resulting from any ideas, methods, instructions or products referred to in the content.

