Article

Crystal Plasticity Modeling of Dislocation Density Evolution in Cellular Dislocation Structures

Department of Mechanical Engineering, University of South Carolina, Columbia, SC 29208, USA
*
Author to whom correspondence should be addressed.
Metals 2025, 15(4), 419; https://doi.org/10.3390/met15040419
Submission received: 5 March 2025 / Revised: 4 April 2025 / Accepted: 5 April 2025 / Published: 8 April 2025
(This article belongs to the Section Crystallography and Applications of Metallic Materials)

Abstract

:
The complex thermal cycles during the solidification process in metal additive manufacturing (AM) lead to the formation of high-density dislocation networks, organizing into submicron-scale cellular structures. These ultrafine structures are recognized as crucial for enhancing the mechanical properties of AM metals. In this study, we investigate the evolution of dislocation density within these cellular structures under plastic deformation and its impact on mechanical response using dislocation density-based crystal plasticity finite element (CPFE) modeling. The model incorporates the evolution of both statistically stored dislocation (SSD) and geometrically necessary dislocation (GND). Our simulations reveal that the yield and flow stresses of dislocation cell structures exceed predictions based on the rule of mixtures (ROM). Additionally, the SSD density increases at a higher rate than the GND density. Factors such as the volume fraction of the cell wall, cell diameter, and initial dislocation density difference between the cell wall and interior significantly influence GND accumulation across different regions of the cellular dislocation structures.

1. Introduction

Recently, additive manufacturing (AM) has gained widespread adoption in the manufacturing industry for producing metallic parts, offering a streamlined supply chain and enhanced design flexibility [1]. Metal additive manufacturing is primarily categorized into two methods: powder bed fusion and metal deposition, based on the material delivery approach. In the powder bed fusion technique, an electron beam or selective laser beam serves as the energy source [2]. During the manufacturing process, the pre-built layer undergoes continuous reheating and cooling, resulting in a complex thermodynamic cycle that influences solidification. This intricate heat transfer through the deposited layers introduces microstructural heterogeneity [3]. Extensive research has shown that the inherent microstructural heterogeneity in AM-produced parts contributes to their enhanced properties compared to conventionally manufactured metals. This improvement is largely attributed to the high dislocation density in AM parts, particularly those fabricated by the laser powder bed fusion (LPBF) process, where dislocations are organized into a cellular structure, forming a network [4]. These submicron cellular structures have garnered significant attention due to their distinct characteristics and widespread presence in LPBF-fabricated parts [5,6]. Experimental observations indicate that cellular structures can significantly impact the mechanical properties of LPBF parts, notably enhancing yield strength while maintaining or even improving ductility compared to their conventional wrought counterparts [7,8,9]. Previous studies have shown that the yield strength of the metal decreases as the size of the cellular structure increases, a trend analogous to substructure strengthening in heavily deformed Al alloys [10,11]. Additionally, the size effect and solute segregation significantly influence plastic strain localization and the evolution of geometrically necessary dislocation (GND) hardening [12]. As-built AM metals, with their higher initial dislocation density, exhibit greater flow stress compared to their heat-treated and wrought counterparts [13]. However, the influence of dislocation cell structure on the evolution of dislocation density within the cell walls and interiors, and its subsequent influence on the yield and flow stress of AM metals, remains unclear. In this context, the crystal plasticity finite element (CPFE) method can serve as a valuable numerical tool to explore the mechanical response and dislocation density evolution in AM metals, as it bridges macroscopic stress and strain with the microscopic length scale of grains and slip systems in ductile crystalline materials [14].
Over the past decades, the CPFE model has been used to explore deformation mechanisms in a wide variety of crystalline materials [15]. An advantage of the CPFE approach is its capability to model the deformation behavior of crystalline materials by incorporating the evolution of dislocation densities. Additionally, it can account for complex phenomena such as martensitic transformation [16] and mechanical twinning [17]. Another strength of the CPFE model is its ability to predict sample shape changes, lattice rotation, and the evolution of GND density. Dislocation-based CPFE models are based on statistical assumptions regarding the behavior of dislocations on slip systems within crystalline materials. The core of these physics-based models lies in the behavior of dislocations, including their collective movement on one slip system, their interactions with dislocations on other slip systems, and temporal evolution [18]. Recently, Kwon et al. [4] employed the dislocation-based CPFE model to predict the microstructure evolution and stress–strain curves of LPBFed copper specimens. Their dislocation density evolution model incorporates the deposition of dislocation density from the grain interior to the boundary, its multiplication via the Frank–Read source, and subsequent dynamic recovery or annihilation. However, their approach does not differentiate between SSD and GND. Kergaßner et al. [19] employed a phenomenological gradient-enhanced crystal plasticity hardening law that accounts for both self and latent hardening in AM Inconel 718. Their findings indicate that yield stress increases with decreasing grain size when the representative volume element (RVE) is loaded perpendicular to the building direction (BD). However, this effect is minimal when loading is applied parallel to the BD, as the columnar grains in this direction behave as if they are infinite due to the imposed periodic boundary conditions (PBCs) in the simulation. Galera et al. [20] investigated the same IN718 alloy and employed a phenomenological crystal plasticity model to simulate the polycrystalline structure. They utilized a power law as the flow rule and the Voce hardening law to describe the hardening behavior. Their results demonstrated that IN718 exhibited higher strength when deformed perpendicular to the BD compared to deformation along the BD, regardless of heat treatment and temperature. This observation was attributed to strong crystallographic texture, as confirmed by mechanical testing. Zhang et al. [21] applied a dislocation density-based CP model to simulate the mechanical behavior of Al-Si-Mg alloys. Their study revealed that the eutectic cell boundary network significantly enhances the exhaustion rate of mobile dislocations when produced via LPBF [22]. They used the K-M model [23] to analyze dislocation evolution in constituent phases, emphasizing the interplay between storage and dynamic recovery effects. Their findings indicated that AlSi3.5Mg2.5, with a higher initial dislocation density than AlSi3.5Mg1.5, experienced a more rapid increase in dislocation density during plastic deformation due to a reduced rate of dislocation annihilation. Ghorbanpour et al. [24] developed a dislocation density-based hardening law for AM IN718, incorporating temperature effects. Their model focused on the octahedral slip mode <111>< 1 1 ¯ 0 > as it is the dominant deformation mode in the service temperature at 550 °C for IN718. They found that anisotropy arises from grain structure and tension/compression asymmetry, primarily due to non-Schmid activation and latent hardening. Biswas et al. [25] employed a non-local CP model to examine the effects of texture and microstructural morphology on the mechanical properties of 316L stainless steel (316LSS) manufactured by selective laser melting (SLM). They integrated back stress hardening, caused by GND, into their model and found that texture is the dominant factor influencing macroscopic behavior, overshadowing the impact of grain shape. They also observed that anisotropic behavior is strongly dependent on grain morphology, highlighting the complex interplay between microstructure and mechanical performance. Pokharel et al. [26] developed a thermo-mechanical model for AM 304LSS, which features a two-phase microstructure with grains elongated along one axis. The basic Taylor hardening model was used to describe athermal slip resistance arising from glide dislocation interactions with other dislocations. The model’s accuracy was confirmed via CPFE simulations, revealing a correlation between inter-granular residual stresses in the ferrite phase and mechanical properties, with plastic deformation hypothesized as the dominant mechanism for stress accommodation. Lindroos et al. [27] developed a coupled phase field and CP model for AM 316L stainless steel to investigate the rapid solidification process, microsegregation, and dislocation structure formation. The model captured the solidification phenomena and tracked dislocation density evolution, revealing that local solute segregation leads to heterogeneous dislocation distribution. Dislocations tend to pile up at cellular region interfaces, cell boundaries, and around segregation pools, which are sites with a high concentration of solute and act as pinning regions due to high dislocation density.
Although extensive research has been conducted on the characterization of the microstructure of AM metals, the evolution of dislocation density during deformation in AM metals remains unclear. Additionally, the effects of dislocation cell size ( d ), volume fraction of the cell wall ( f ), anisotropy, and variations in initial dislocation density on the mechanical response of AM metals are not well understood. In this study, we employ a dislocation density-based CPFE model to investigate the evolution of SSD and GND densities in the dislocation cell structures during deformation and explore the effects of cell size, d , cell wall thickness, and variations in dislocation densities on the mechanical response of AM copper. Furthermore, we derive a set of equations for predicting the evolution of GND density in the cell wall and interior based on our modeling results, which can be adopted for larger-length scale models for the mechanical behavior of AM metal structures.

2. Methods

In CPFE modeling, deformation at each material point within the finite element mesh is governed by a constitutive model that captures both the material’s elastic anisotropy and the rate-dependent nature of crystallographic slip [28,29,30,31,32,33,34]. In this work, we present the key kinematic equations, flow rule, and dislocation density-based hardening equations essential to our implementation, ensuring conciseness. Crystallographic slip is considered the primary mechanism of plastic deformation, occurring through dislocation motion. As a result, the lattice, along with the embedded material, experiences elastic strains and rotations [33]. Hence, the multiplicative decomposition of the total deformation gradient, F , a second-order tensor, can be written as follows:
F = F F p
where F and F p represent the elastic and plastic parts of the deformation gradient, respectively. The plastic deformation gradient, F p , evolves with the second-order plastic velocity gradient tensor, L p , according to the following formula:
L p = F ˙ p F p 1
The plastic velocity gradient can also be expressed as the summation of the shear rate of all slip systems:
L P = α = 1 N γ ˙ α s α   m α
where γ ˙ α is the shear strain rate in a certain slip system   α . s α m α is the Schmid tensor defined by the slip direction, s α , and slip plane normal, m α . For rate-dependent materials, the shear strain rate in slip system α is governed by a power-law equation that relates it to the resolved shear stress and the critically resolved shear stress. This equation, derived in crystal plasticity modeling, is based on the thermally activated nature of dislocation motion and the empirically observed power-law creep behavior of metals [33,35,36,37,38]. It effectively captures both high- and low-strain-rate behaviors in crystalline materials and is given as follows:
γ ˙ α = γ ˙ 0 | τ R S S α | τ C R S S α 1 m sign τ R S S α
where γ ˙ 0 ,   τ R S S α ,   a n d   τ C R S S α are the reference shear strain rate, resolved shear stress, and critically resolved shear stress, respectively, on the slip system α, and m is the strain rate sensitivity exponent. In this work, the plastic strain is assumed to be the result of the dislocation slip. These physical quantities are one-dimensional approximations.
For the dislocation density-based formulation, critically resolved shear stress (CRSS) is directly dependent on the dislocation density ( ρ S S D α + ρ G N D α ) through the Taylor strength relationship [39]. Evolution of the CRSS can then be calculated by the following formula:
                                τ C R S S α = χ G b ρ S S D α + ρ G N D α
Χ, G, b, ρ S S D α , and ρ G N D α are the dislocation interaction factor, shear modulus, magnitude of the Burgers vector, SSD density, and GND density, respectively.
The SSD density evolution varies with the interplay between dislocation trapping and dynamic recovery/annihilation [40]. The evolution of the ρ S S D α can be calculated as follows:
𝜕 ρ S S D α 𝜕 γ α = k 1 ρ S S D α k 2 ρ S S D α        
The parameter k 1 is a coefficient for statistical trapping of mobile dislocations, and k 2 is a coefficient for the annihilation of dislocations. According to that equation, the evolution of the density of the SSD is related to the increment of the shear strain.
Due to the spatial heterogeneity in the cell structure, different regions will experience different strain during deformation, producing strain gradient across the regions. To accommodate the strain gradient near the interface of those regions and to keep the geometry continuity, another type of dislocation will be generated, which is called the GND. The evolution of GND density is calculated based on the gradient of plastic strain (or plastic deformation) [41]. The evolution of GND density is related to the plastic strain F p in the following formula:
ρ ˙ G N D α = 1 b x × γ ˙ α F P T n α      
where x is the derivative with respect to the reference coordinate system. The decomposition of Equation (7) is related to screw and edge dislocations during the calculation, where the tangent vector of the screw dislocations is parallel to the slip direction, d α , and the other two groups of edge dislocations have their tangent vectors parallel to t α   ( transverse direction ) and n α   ( normal direction ) , respectively, and can be defined as follows:
ρ ˙ G N D s α = 1 b [ x × γ ˙ α F P T n α ]   . d α
ρ ˙ G N D e t α = 1 b [ x × γ ˙ α F P T n α ]   . t α
ρ ˙ G N D e n α = 1 b [ x × γ ˙ α F P T n α ]   . n α      
                  ρ ˙ G N D α = ρ ˙ G N D s α 2 + ρ ˙ G N D e t α 2 + ρ ˙ G N D e n α 2
The change in GND density is finally calculated by Equation (11).
We performed calculations for single-crystal copper to calibrate the model parameters based on the experimental results from tensile stress–strain curves for [001] and [111] oriented single-crystal samples [42]. Two samples were utilized, each consisting of a 6 × 6 × 6 mesh grid with C3D8R linear brick elements, having eight nodes with reduced integration (1 integration point). Euler angles for [001] and [111] crystallographic orientations were fed into the model via UMAT, facilitated by ABAQUS CAE (version 2017). In the calibration calculations, the negative surfaces of the samples were constrained (i.e., −X surface along Ux = 0, −Y surface Uy = 0, −Z surface Uz = 0). Uniaxial tensile loading was applied along the X direction with the applied strain rate of 0.003 s−1 following the experiment setups [42]. Several tests were performed with the aforementioned setup to calibrate the CPFE model parameters that govern the hardening behavior. The predicted true stress–strain results, consistent with the experimental results from reference [42], are shown in Figure 1. Based on the predicted results, materials and fitted parameters are summarized in Table 1.
In AM metals, grain sizes typically range from a few microns to tens of microns [43,44,45,46], while cellular structures are on the scale of approximately one hundred to several hundred nanometers [6,7,43,44,47,48,49], indicating a substantial presence of dislocation cells. In our model, periodic boundary conditions (PBCs) are imposed in X, Y, and Z directions to simulate the mechanical response of a large grain in AM metals, which contain a high density of dislocation cells. By adopting this approach, we neglect the influence of grain boundaries and texture, focusing instead on the dislocation cell structure as the dominant microstructural feature. Consequently, in our framework, the modeled samples serve as a unit cell of dislocation cell structures in AM metals. With the PBC in the model, the displacements of two equivalent nodes (a) and (b) on opposite sides of the mesh are coupled with the deformation gradient, F ¯ i j [50]:
  u i a u i b = F ¯ i j x j 0 a x j 0 b x i 0 a x i 0 b
where x i 0 a ,   a n d   x i 0 b indicate the position of a point pair in the non-deformed configurations. It should be noted that PBCs are a more realistic representation of the micromechanical behavior inside the materials during uniaxial tension compared with other conventional boundary conditions that prescribe the displacement of every node on the boundaries of RVEs [51]. In our model, we assume that the building direction (BD) is along the [001] direction, and the initial orientation of our sample is aligned with the [001] direction. This orientation corresponds to the most common alignment of dislocation cell structures in AM metals. Loading along the [001] direction, represented as the Y direction in our model, simulates the loading in the building direction. In contrast, loading along the [100] direction, represented as the X direction in our model, corresponds to loading along the transverse direction (TD) of the cell structure. The results from the two different loading directions will highlight the anisotropy in the strength and plasticity of the sample containing dislocation cell structure.
According to previous experimental studies in AM metals [43], the yield strength of the dislocation cell structure scales with the cell size. To incorporate this size effect in this model, the dislocation source term was added in Equation (5), according to the model in reference [52], to obtain the following expression:
                    τ C R S S α = χ G b ρ S S D α + ρ G N D α + k G b d
k , G , and d represent a geometrical constant, shear modulus, and cell size, respectively. This term represents the critical stress to activate a dislocation source within a dislocation cell structure. The value of k was determined to be 1.13 from the reference [52].

3. Results and Discussion

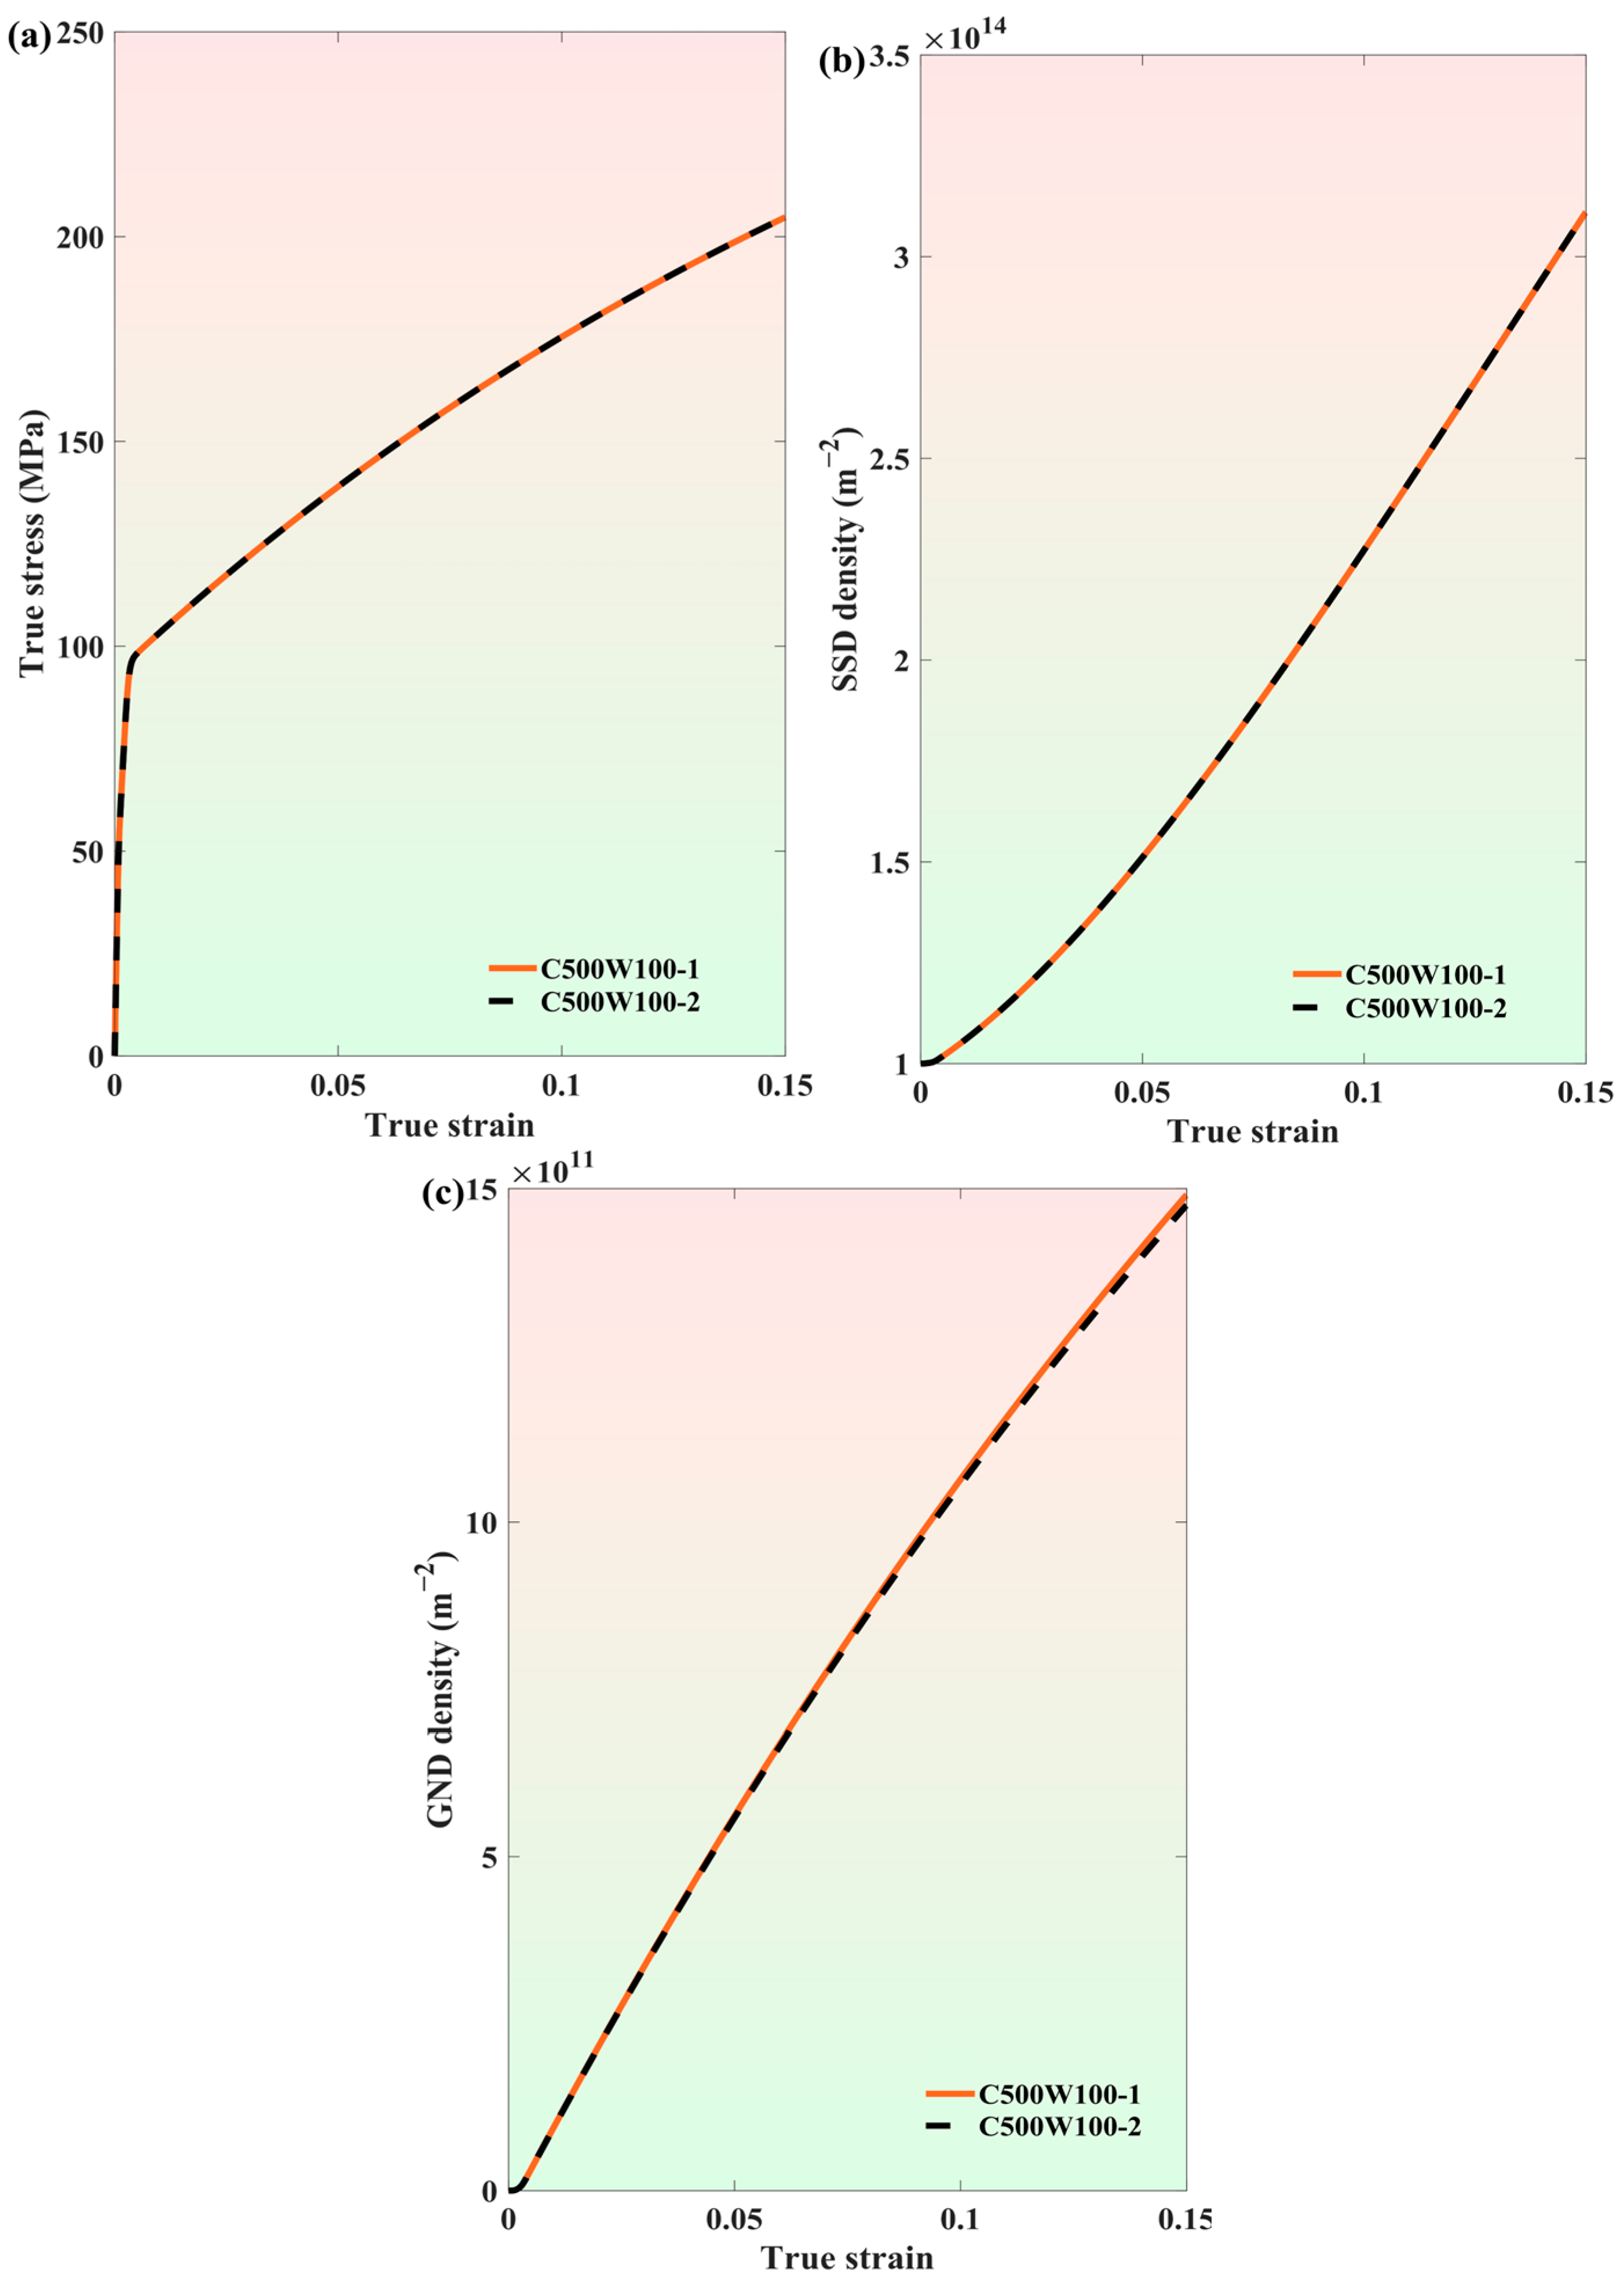
3.1. Mesh Sensitivity

To evaluate the effect of mesh density on the results, two samples were used: one with a coarser mesh (12 × 12 × 12 elements) and the other with a finer mesh (24 × 24 × 24 elements). Both meshes maintained a consistent cell size of 600 nm and an identical volume fraction of the cell wall, f. All other parameters, including boundary conditions and loading directions, were identical between the two simulations. Figure A1a presents the overlapping true stress–strain responses of C500W100-1 and C500W100-2, where “C500” indicates a cell interior size of 500 nm, and “W100” represents a cell wall thickness of 100 nm. The evolution of SSD and GND densities is shown in Figure A1b and Figure A1c, respectively. The results indicate that the SSD density remained unchanged, while the GND density exhibited only a negligible variation (~1% at 15% true strain). Given that the SSD density is three orders of magnitude higher than the GND density, this minor variation in GND density did not affect the overall strength in either simulation. Thus, no significant effect of mesh density was observed throughout this study.

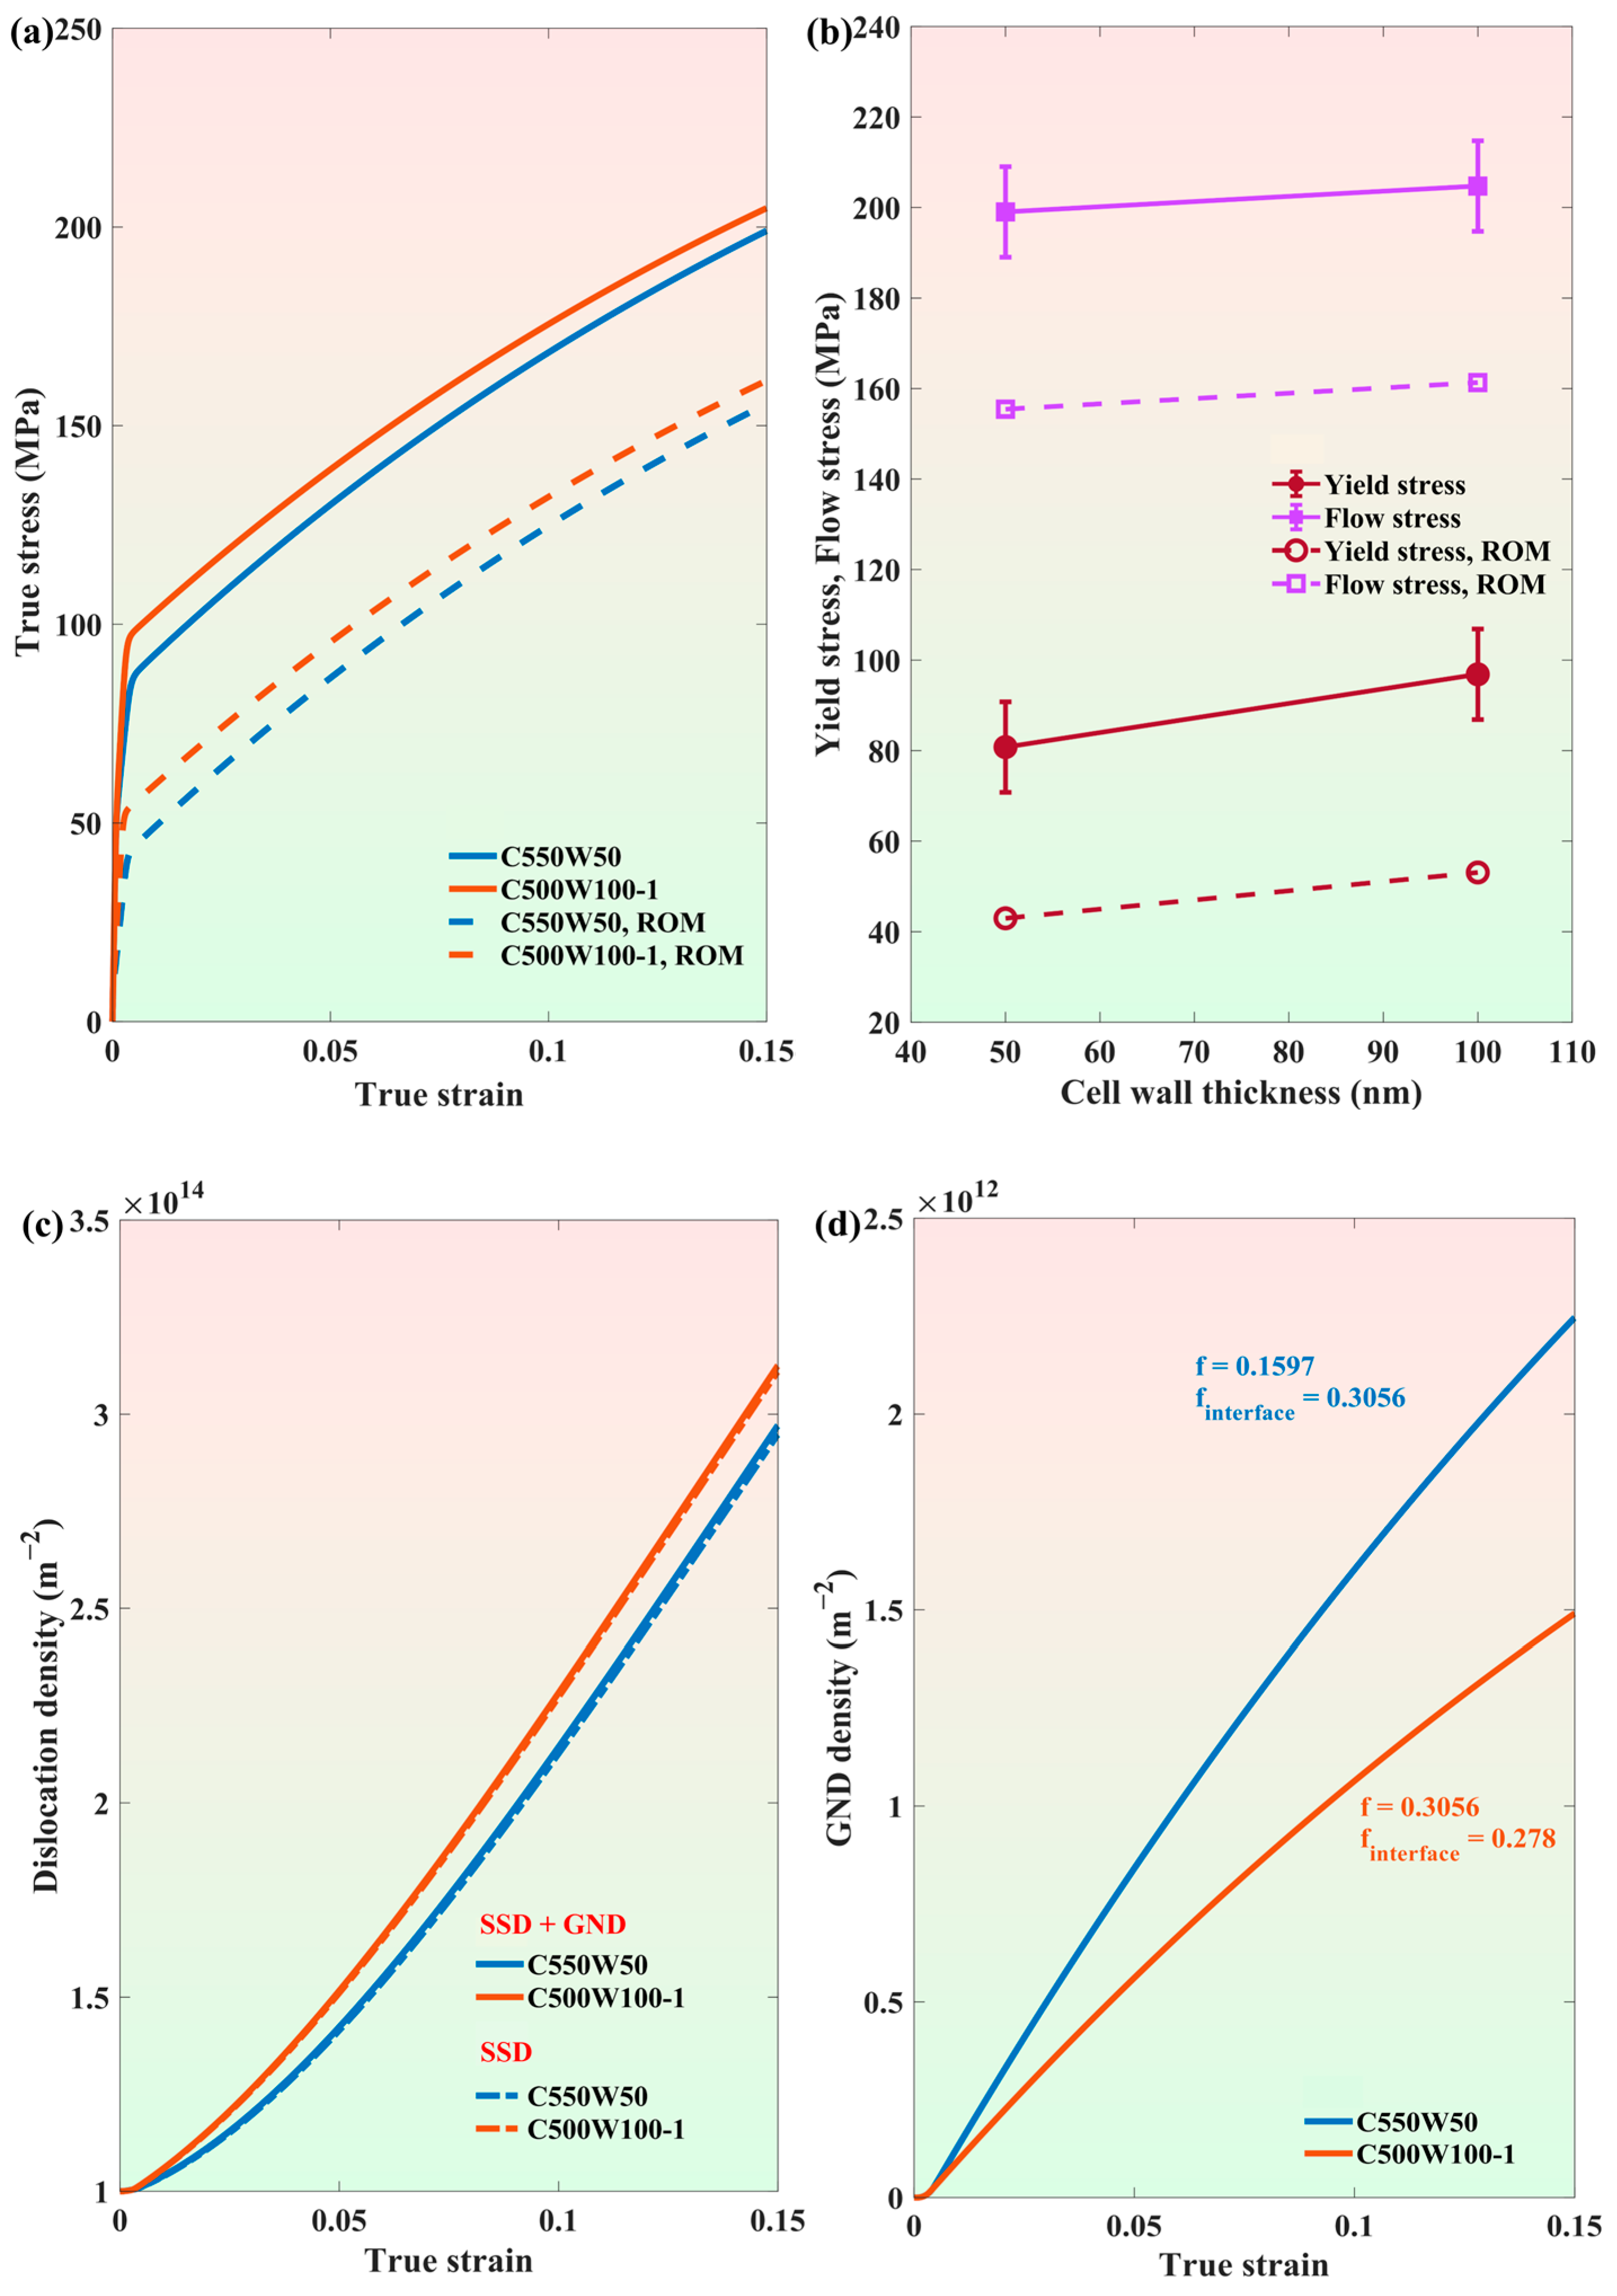
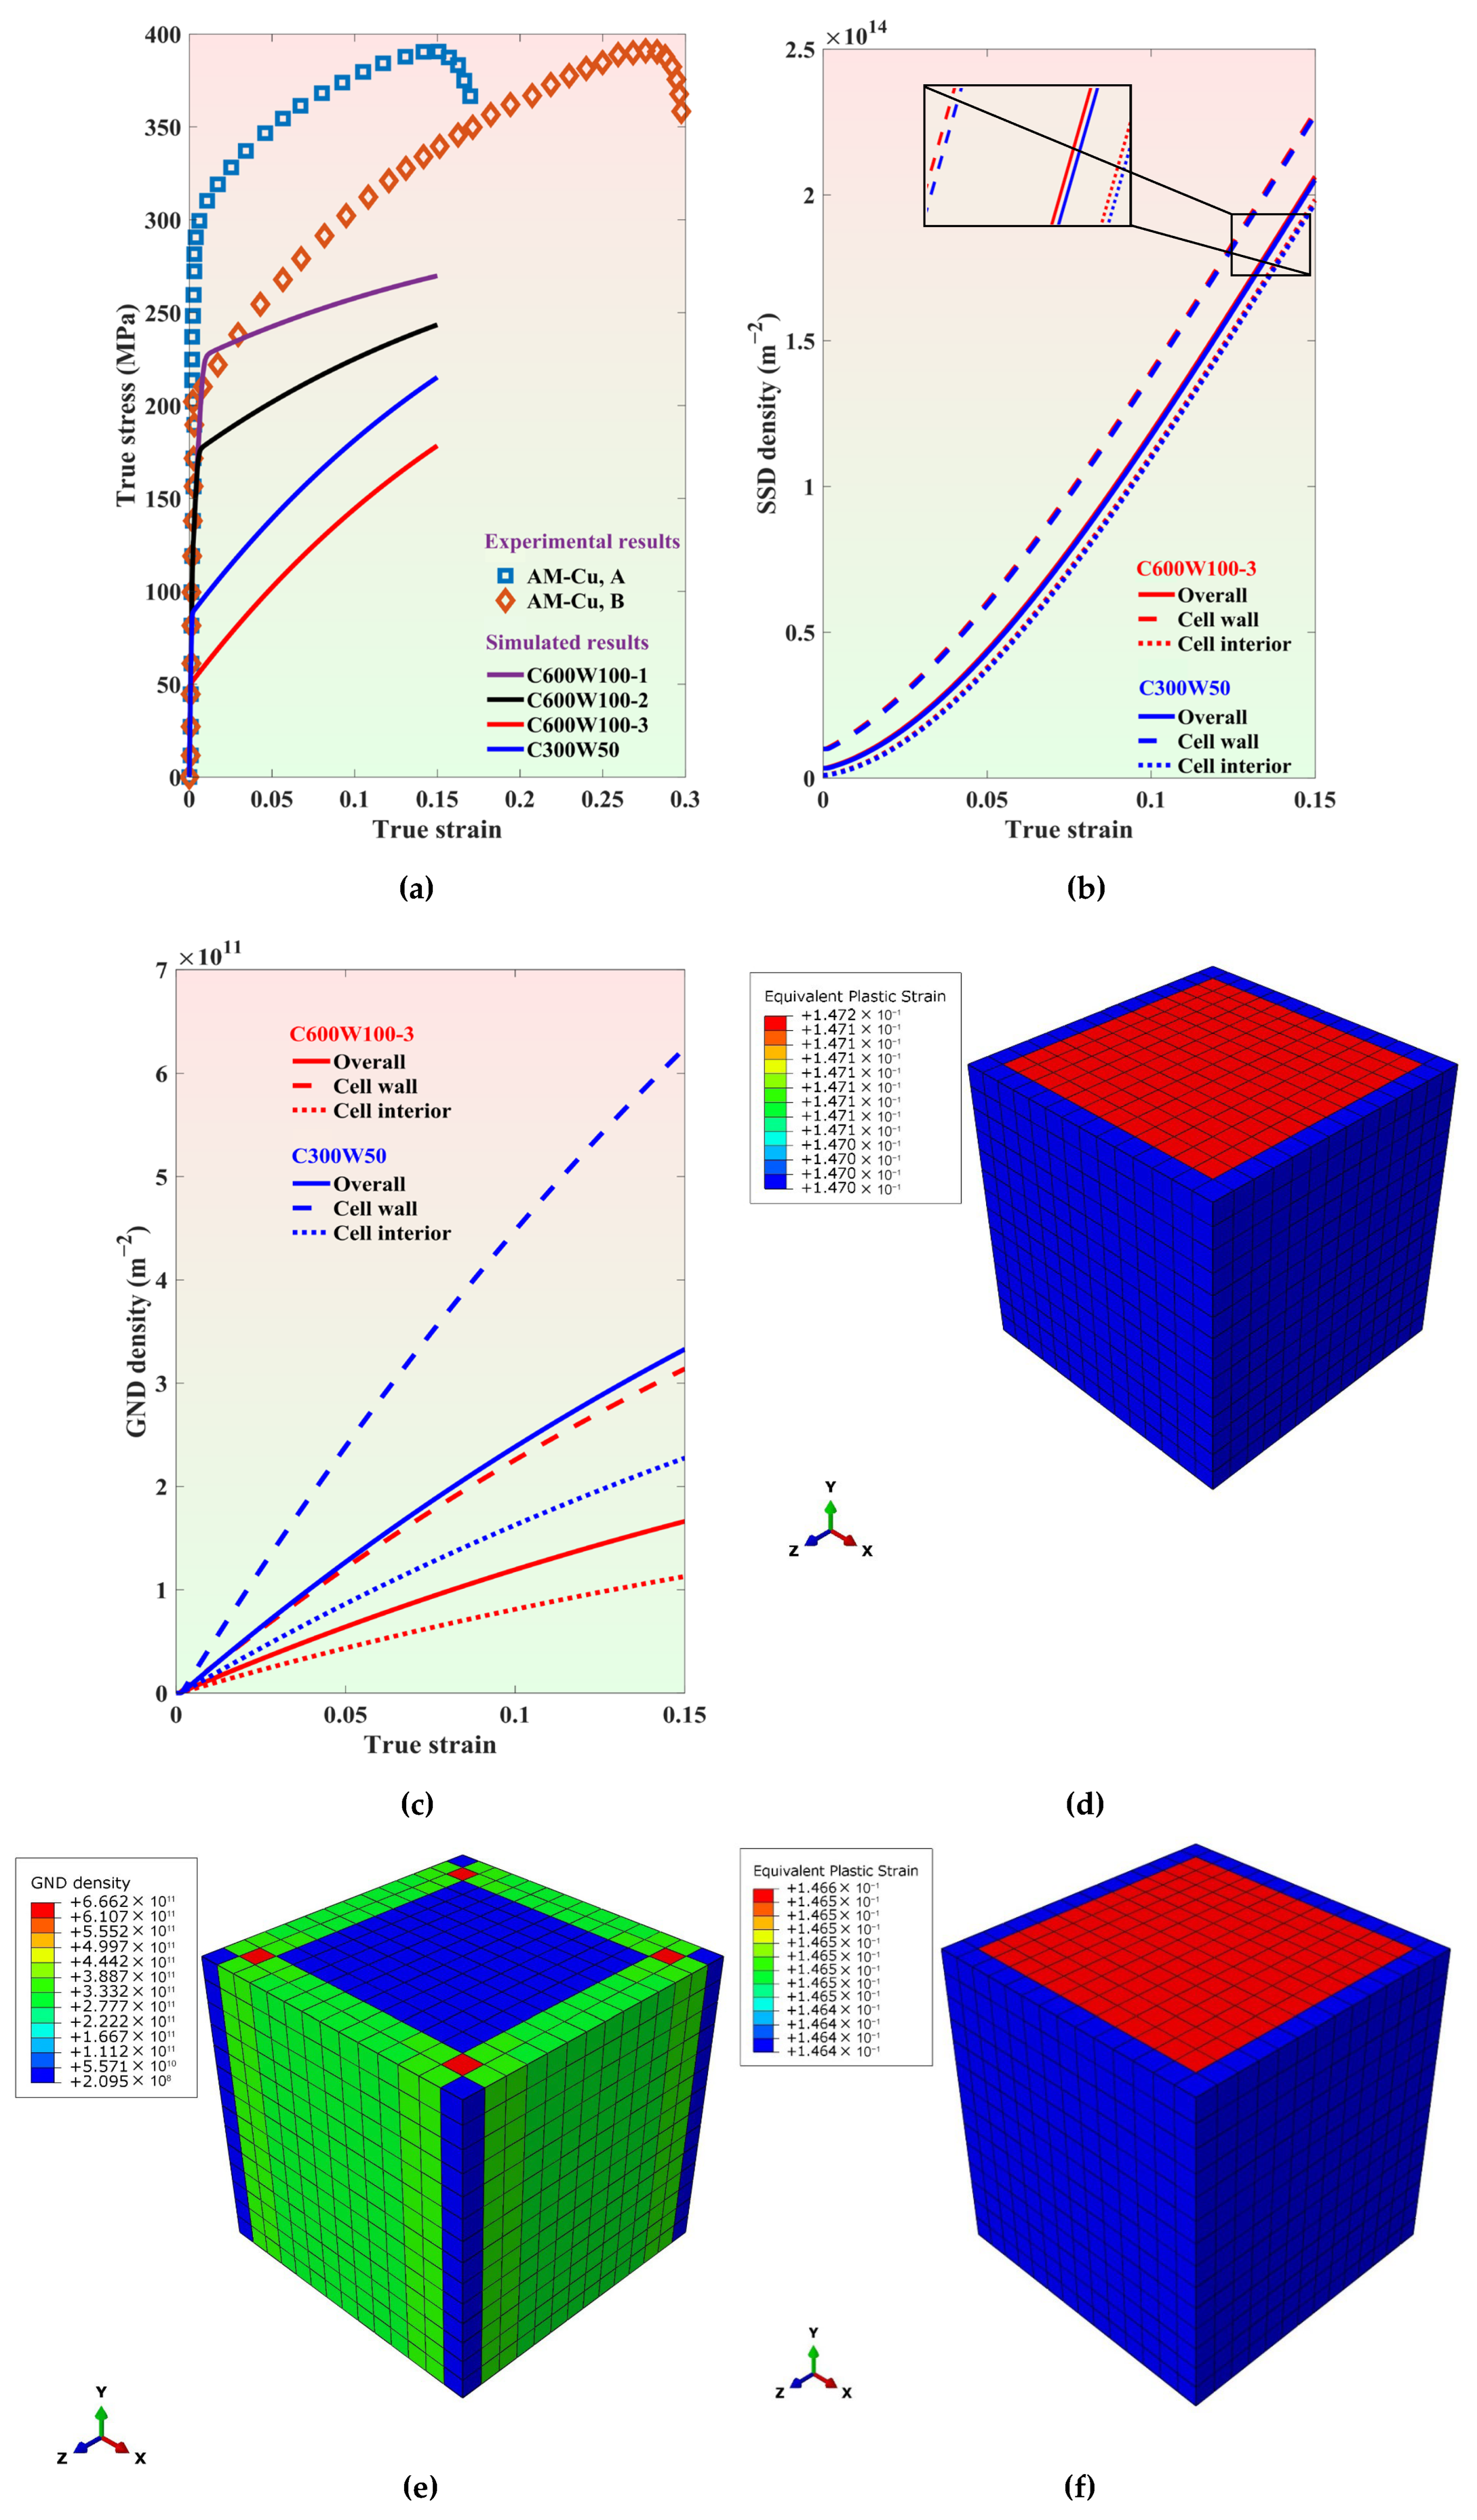
3.2. Effect of Cell Structure on Mechanical Response

Dislocation cell structures are the unique microstructure in AM metals, specially fabricated with the LPBF process. The size of these cell structures varies depending on the processing parameters of the LPBF process. While several researchers have used a continuous scanning strategy with a 67-degree [7,44,53] or 90-degree [54] rotation between alternate layers to introduce randomness in crystal orientation and reduce residual stress in as-built samples, Wang et al. [43] did not apply any scanning rotation for alternate layers and achieved AM 316SS steel with exceptional mechanical properties. The LPBF process parameters associated with variations in dislocation cell structure size are summarized in Table 2.
After thoroughly reviewing the literature, we selected dislocation cell sizes ranging from 350 to 700 nm for our model. Samples used in this work correspond to these cell structures and are labeled as CxxxWyyy and CxxxWyyy-n. Here, xxx and yyy represent the thickness of the cell interior and cell wall, respectively, while the subscript n indicates variations in the initial dislocation density. Figure 2a,b illustrate typical samples employed in this study with varying volume fractions of the cell wall, f . The red regions denote dislocation cell walls, while the blue regions represent dislocation cell interiors.
Li et al. [47] experimentally demonstrated that the dislocations are stored and terminated at the cell wall without penetrating into adjacent cells. This phenomenon underscores the pivotal role of the cell wall in governing the overall mechanical response of the material at the macroscopic scale. With increasing plastic deformation, how cell wall thickness contributes to the evolution of the dislocation density and affects the overall strength is one of the points of interest in this work. Figure 3a shows the true stress–strain responses of two different modeling results with their corresponding rule of mixture (ROM) cases. The strength of the cases in Figure 3a surpasses the strength predicted by the simple rule of mixture (ROM) method expressed as σ R O M = v i σ i , where v i is the volume fraction, and σ i is the strength of each part [55]. Simulation cells labeled C550W50 consisted of a cell interior of 550 nm and a cell wall of 50 nm. The other sample labeled C500W100-1 featured a cell interior and wall dimensions of 550 nm and 100 nm, respectively. The initial dislocation density for the cell interiors in both configurations was 1012 m−2. However, the dislocation density within the cell walls exhibited variations, with values ranging from ~6.21 × 10¹⁴ m−2 in the C550W50 to ~3.25 × 10¹⁴ m−2 in the C500W100-1. Consequently, the initial overall dislocation density for both samples was maintained at 1014 m−2. Throughout this work, the initial dislocation density will only refer to the initial density of SSD (used interchangeably) as it was assumed that initially there was no GND present in any of the samples. It is evident from Figure 3b that the predicted yield stress of approximately 96.86 MPa and the flow stress of about 204.74 MPa at 15% true strain for the C500W100-1 configuration, with an f of around 30%, exceed the corresponding predicted values for the C550W50 configuration. Specifically, the C550W50 has a lower predicted yield stress of approximately 80.78 MPa and a flow stress of roughly 199.03 MPa at the same level of true strain, with an f of approximately 16%. The evolution of total dislocation and SSD density for both simulations are presented in Figure 3c. The results indicate that the trends of the two simulations delineate similarity with the higher f providing greater values. SSD density closely approximated the total dislocation density, indicating the total overall dislocation density is predominantly governed by the SSD density. The evolution of GND density follows the opposite trend as it declines with an increase in f (Figure 3d). This trend can be linked with the fraction ( f interface) of the interface region between the dislocation-rich cell wall and dislocation-poor cell interior. As f interface increases, misfit areas in terms of dislocation density also increase. This implies that the induced strain gradient becomes more pronounced, necessitating a higher density of GND in those regions to maintain material continuity. The overall effect of the increase in the density of SSD and decrease in the density of GND, due to higher f , is to increase the overall strength of the material as the density of SSD is several orders of magnitude higher. Although both SSD and GND affect the strength of the specimen, Figure 3e,f show that the rate of increment in SSD is higher than GND at the same level of strain. The SSD continues to increase even after the entire sample undergoes plastic deformation, whereas the rate of GND increment slows down immediately after the global yield point. This occurs because, beyond the global yield point, each of the regions experiences plastic deformation, and dislocations tend to rearrange within themselves. As the dynamic recovery rate increases, the rate of increase of SSD density slows down. The strain gradient reaches its peak at the global yield point, after which strain incompatibility diminishes. Consequently, the rate of increase of GND density at the interface of the elements decreases by a significant amount and results in a lower increment rate for the whole sample as can be seen in Figure 3f.
In our model, the built sample represents the cell structures formed in a single large grain. In the experimental samples, the diameter of the dislocation cell structures ranged from 400 nm to 600 nm, determined by Kwon et al. [4], and the total dislocation density varied from 9.5 × 10¹⁴ m−2 to 4 × 10¹⁴ m−2 [47]. To mimic cell structures in the experiment samples with the same initial total dislocation density, the size of the cell interior was set to be 600 nm, and cell wall thickness was 100 nm. C600W100-1 and C600W100-2 had initial total dislocation densities of 9.5 × 10¹⁴ m−2 and 4 × 10¹⁴ m−2, respectively. Figure 4a compares our predicted curves with the experimental data of LPBF Cu from reference [47].
Since experimental data for single-crystal samples are unavailable, we compare our predicted curves with the polycrystalline sample from reference [47]. As shown in Figure 4a, there is a significant difference between the two experimental curves, indicating that processing parameters strongly influence the mechanical properties of AM metals. Additionally, our predicted curves are lower than the experimental ones, primarily due to the simplified nature of our model, which does not account for grain boundary effects or the texture of the experimental samples. This simplification allows us to focus on the fundamental influences of dislocation density evolution, particularly in relation to cell size, cell wall thickness, and cell wall density.
Additionally, two other simulations have also been carried out, where the sizes of the cell interior are set to be 300 nm (C300W50) and 600 nm (C600W100-3), and cell wall thickness varies from 50 nm to 100 nm. Figure 4a also outlines that the lower cell size, d (C300W50), predicts the higher strength, which is also seen in the AM-Cu, A. Liu et al. [7], Wang et al. [43], and Kong et al. [56] also experimentally observed that the flow stress increased with decreasing cell size, d . The trend of the SSD density for the cell wall and interior, with their values in both cases, is in proximity (Figure 4b). A zoomed-in inset shows the minimal variation in SSD density across the cell wall, interior, and overall sample. While SSD density exhibits negligible differences, GND density demonstrates a contrasting trend, increasing by an approximate factor of two for 350 nm compared to 700 nm cell size (Figure 4c). As the initial dislocation density (1013 m−2 in the cell wall and 1012 m−2 in the interior) is identical to both samples, cell structures with higher d act as softer domains due to reduced restrictions to dislocation motion, leading to a higher equivalent plastic strain (Figure 4d) and a lower GND density (Figure 4e). This phenomenon is reversed in cell structures with smaller d , where stricter dislocation motion leads to a reduction in equivalent plastic strain (Figure 4f) and an increase in GND density (Figure 4g). Figure 4h,i represent the distribution of equivalent plastic strain from the center of the dislocation cell toward the cell wall. Strain partitioning is the highest near the interface and follows a homogeneous plastic strain distribution within the cell interior.

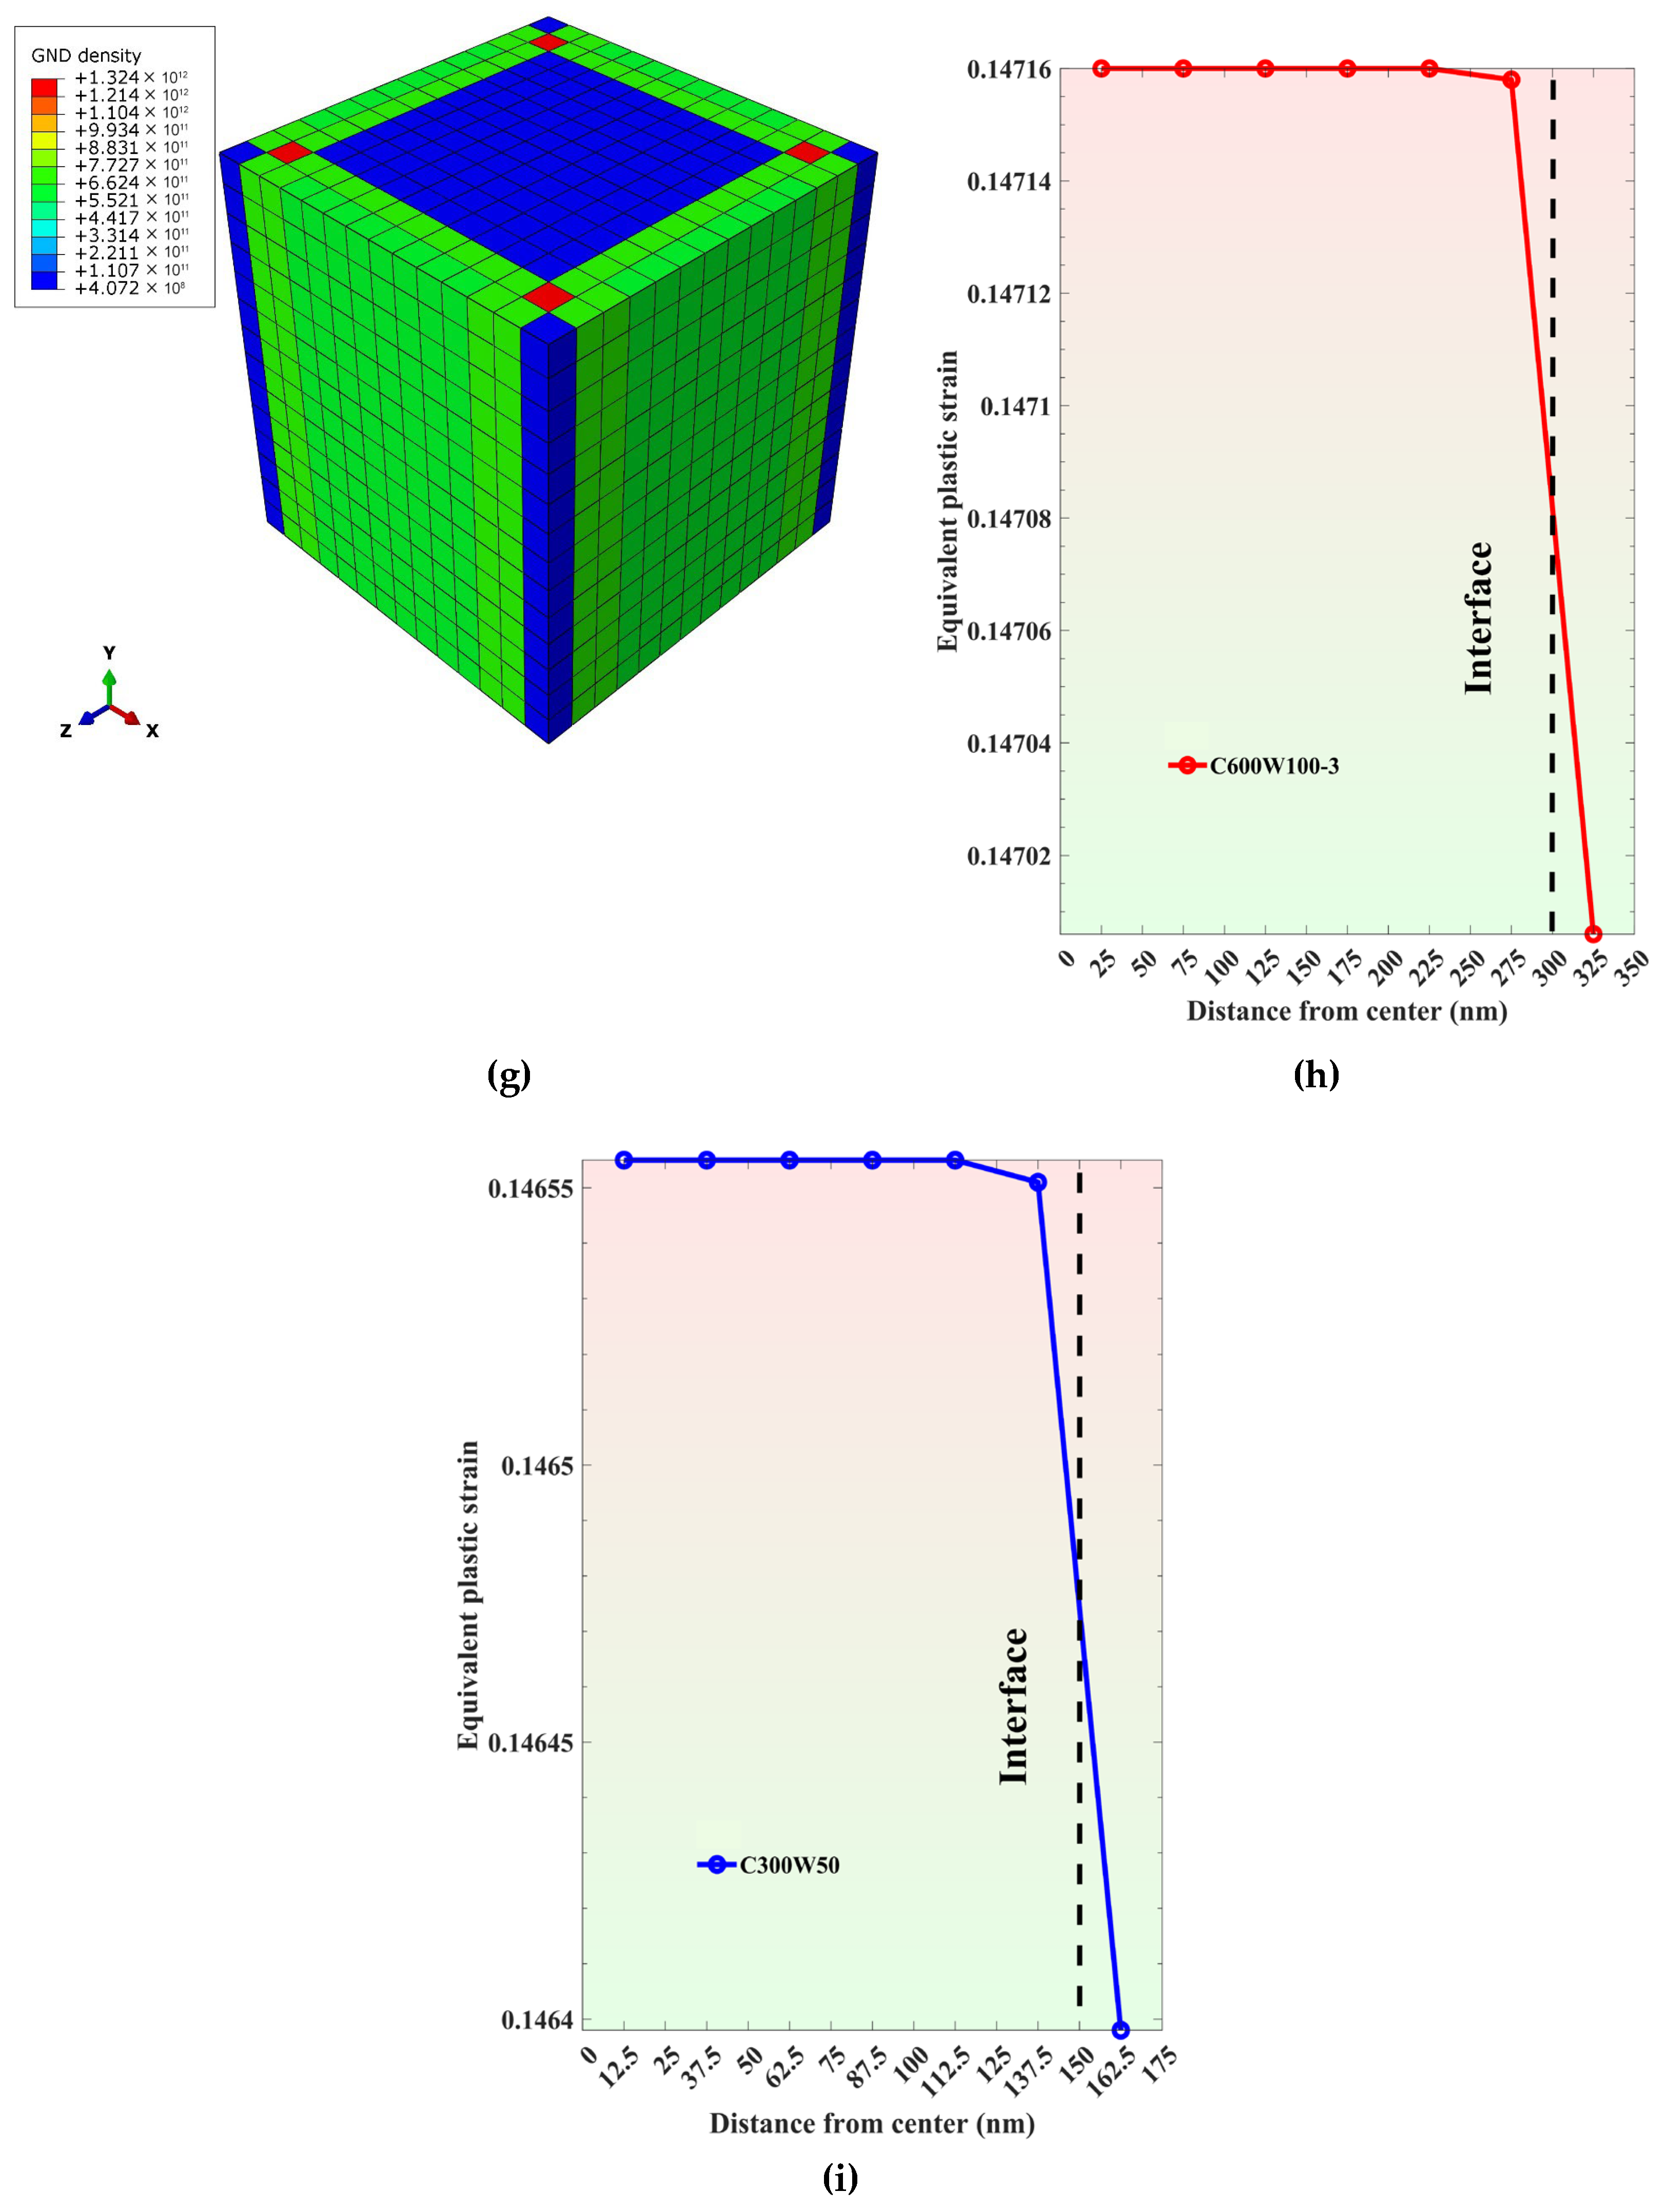
3.3. Impact of Initial Dislocation Density on Yield and Flow Stress
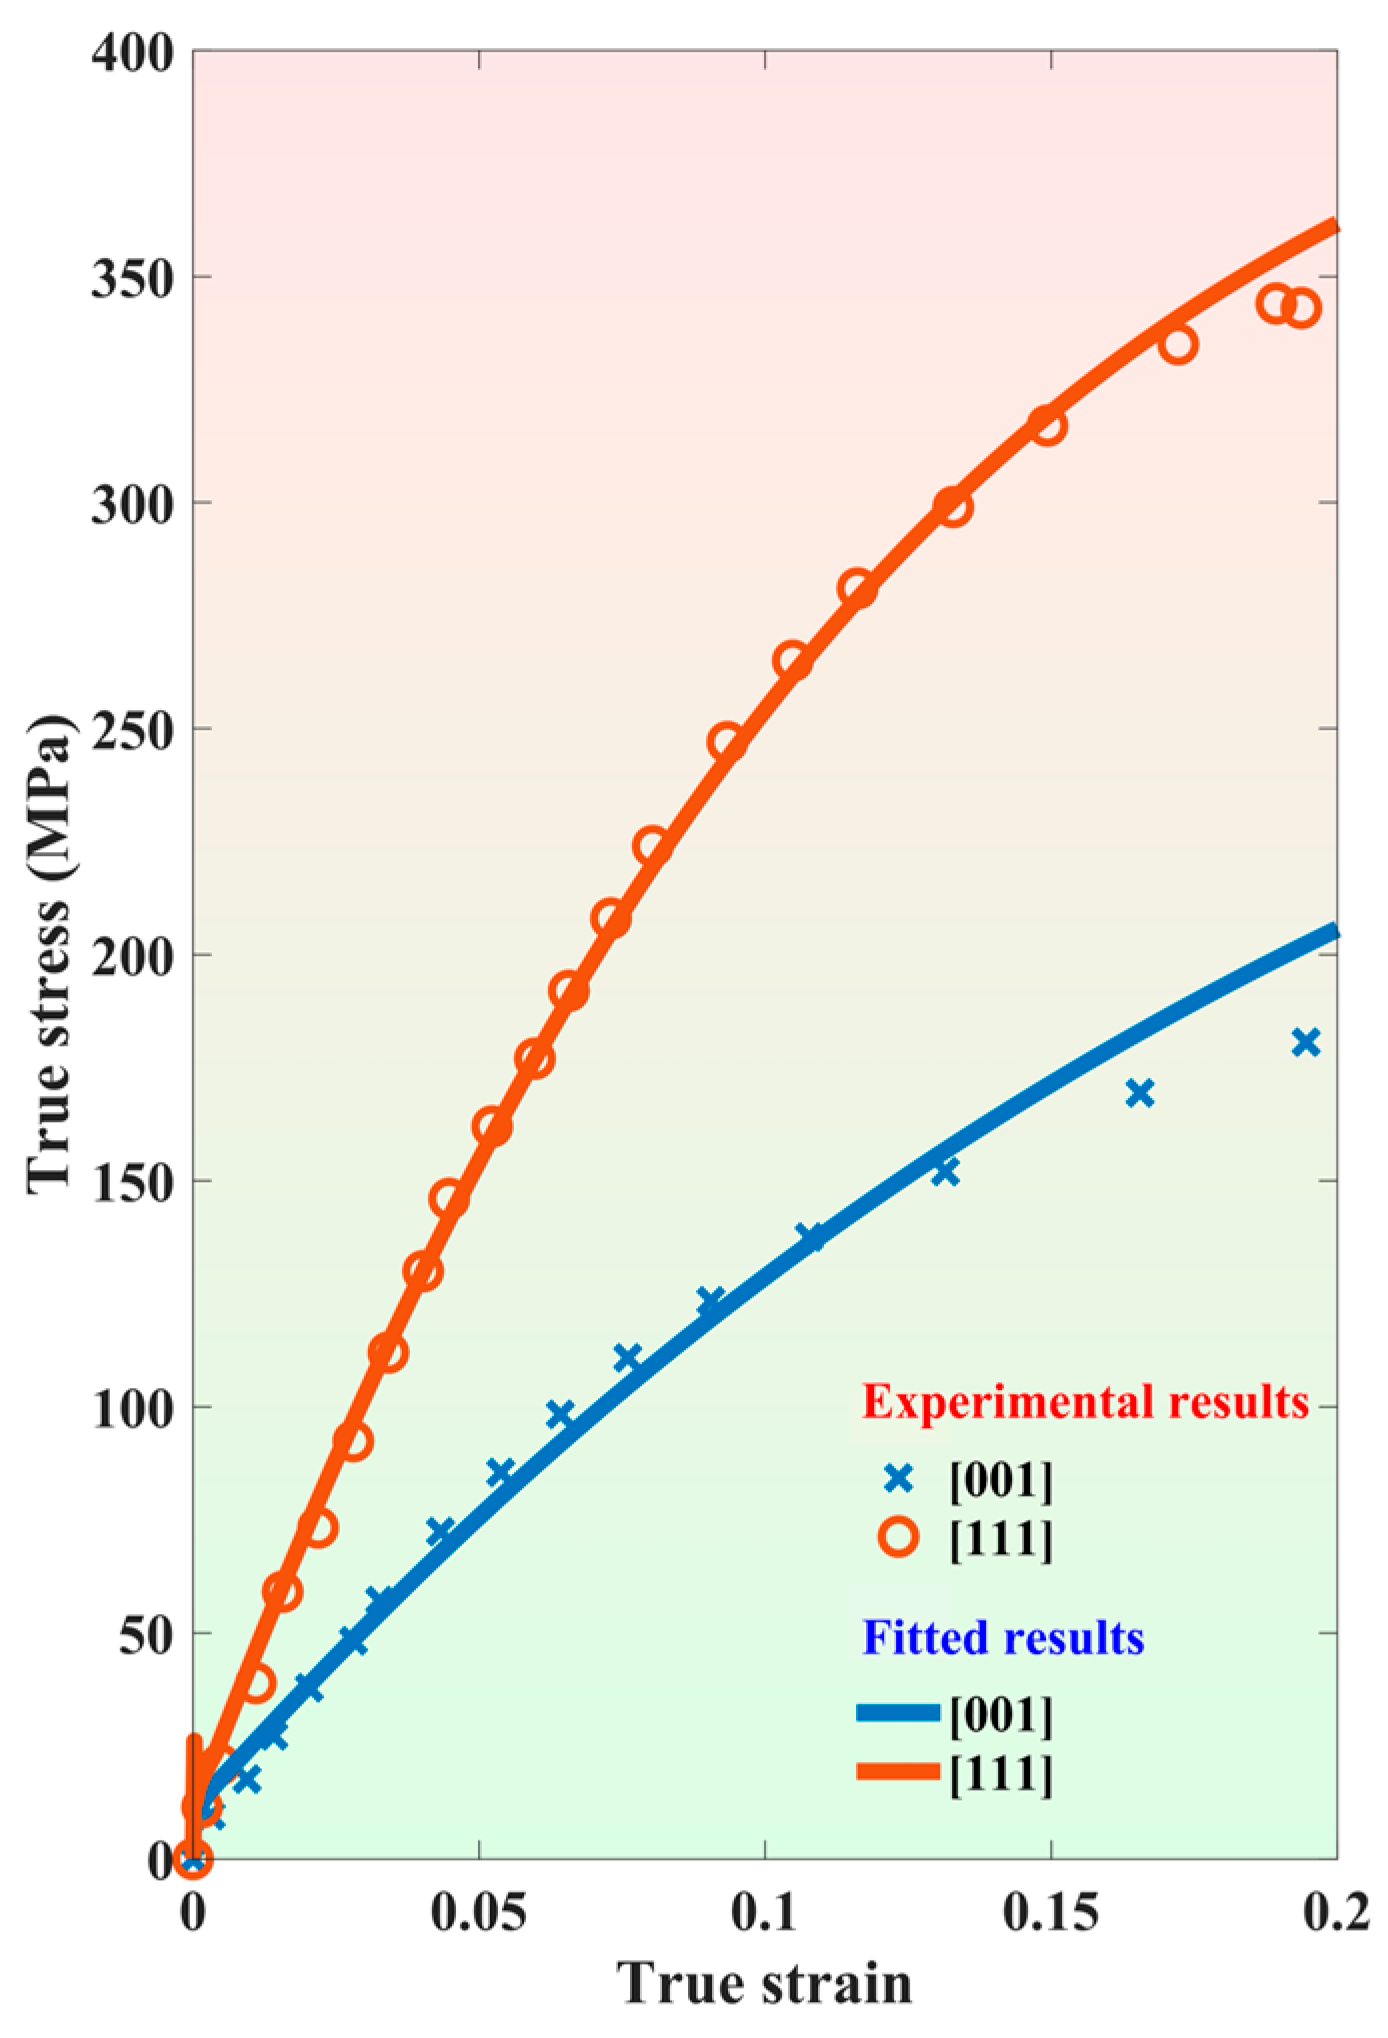
The initial dislocation density in AM metals can vary significantly depending on the processing parameters such as scanning speed, hatch distance, cooling rate, and laser power. Therefore, it is crucial to understand how an increase in initial dislocation density within the cell wall influences the mechanical response of AM metals. We performed two calculations, C500W100-3 and C500W100-4. The initial total dislocation densities were identical in those two samples, i.e., the initial SSD density of 1012 m−2 in the cell interior, but with different initial SSD densities in the cell wall, 1013 m−2 and 1014 m−2, respectively. Figure 5a plots the stress–strain curves for these two samples. It is obvious that the yield strength and flow stress increase with the initial SSD density in the cell wall, as shown in Figure 5b. SSD and GND density evolution in Figure 5c,d demonstrate an increase in both densities, following a similar trend and shape.
We also performed analysis on the distribution of SSD and GND densities at different strain levels to explore how dislocation density in different regions of the solidification cell structures evolves during plastic deformation. SSD density evolution remains relatively constant from the center of the cell structures, increasing as it approaches the cell wall, where it reaches its highest value for both 5% and 15% strain in Figure 5e. Due to the heterogeneity in dislocation density within the dislocation cell structure, a strain gradient emerges between regions of higher and lower dislocation density. The region with a steeper gradient accumulates a higher GND density than other areas within the dislocation cell.
As depicted in Figure 5f, the GND density begins to rise from the center (as this is the region that suffers the most plastic strain) toward the wall, and it increases significantly in the vicinity of the interface of the low and high dislocation densities. This increase reflects the accommodation of the highest plastic strain gradient between the two regions. This behavior is observed in both the 5% and 15% strain levels.

3.4. Anisotropy

In the layer-by-layer fabrication process of (LPBF), the generation of a thermal gradient along the BD is inevitable, leading to the formation of a textured microstructure [57]. This phenomenon gives rise to the presence of columnar grains, which may induce anisotropic mechanical properties of AM metals. To understand the effect of cell structures on the anisotropy of AM metals, samples C500W100-3 and C500W100-4 have been loaded along the transverse direction (TD), i.e., X direction in our sample. Figure 5a includes the stress–strain curves for loading in TD. Figure 5b–d compare the results of yield stress, flow stress, SSD, and GND densities from the loadings in BD and TD. The overall stress–strain curves for BD and TD overlap in both cases. And the differences in the SSD curves are negligible. The only difference occurs on the GND curves. In Figure 5d, the anisotropy on GND density becomes pronounced with a higher difference in the initial SSD between the cell wall and cell interior.
Additionally, the SSD density evolution, presented in Figure 5c, indicates that the evolution overlaps across different loading directions, suggesting that the slight increase in yield stress and flow stress is attributed to the noticeable differences in GND density (Figure 5d).

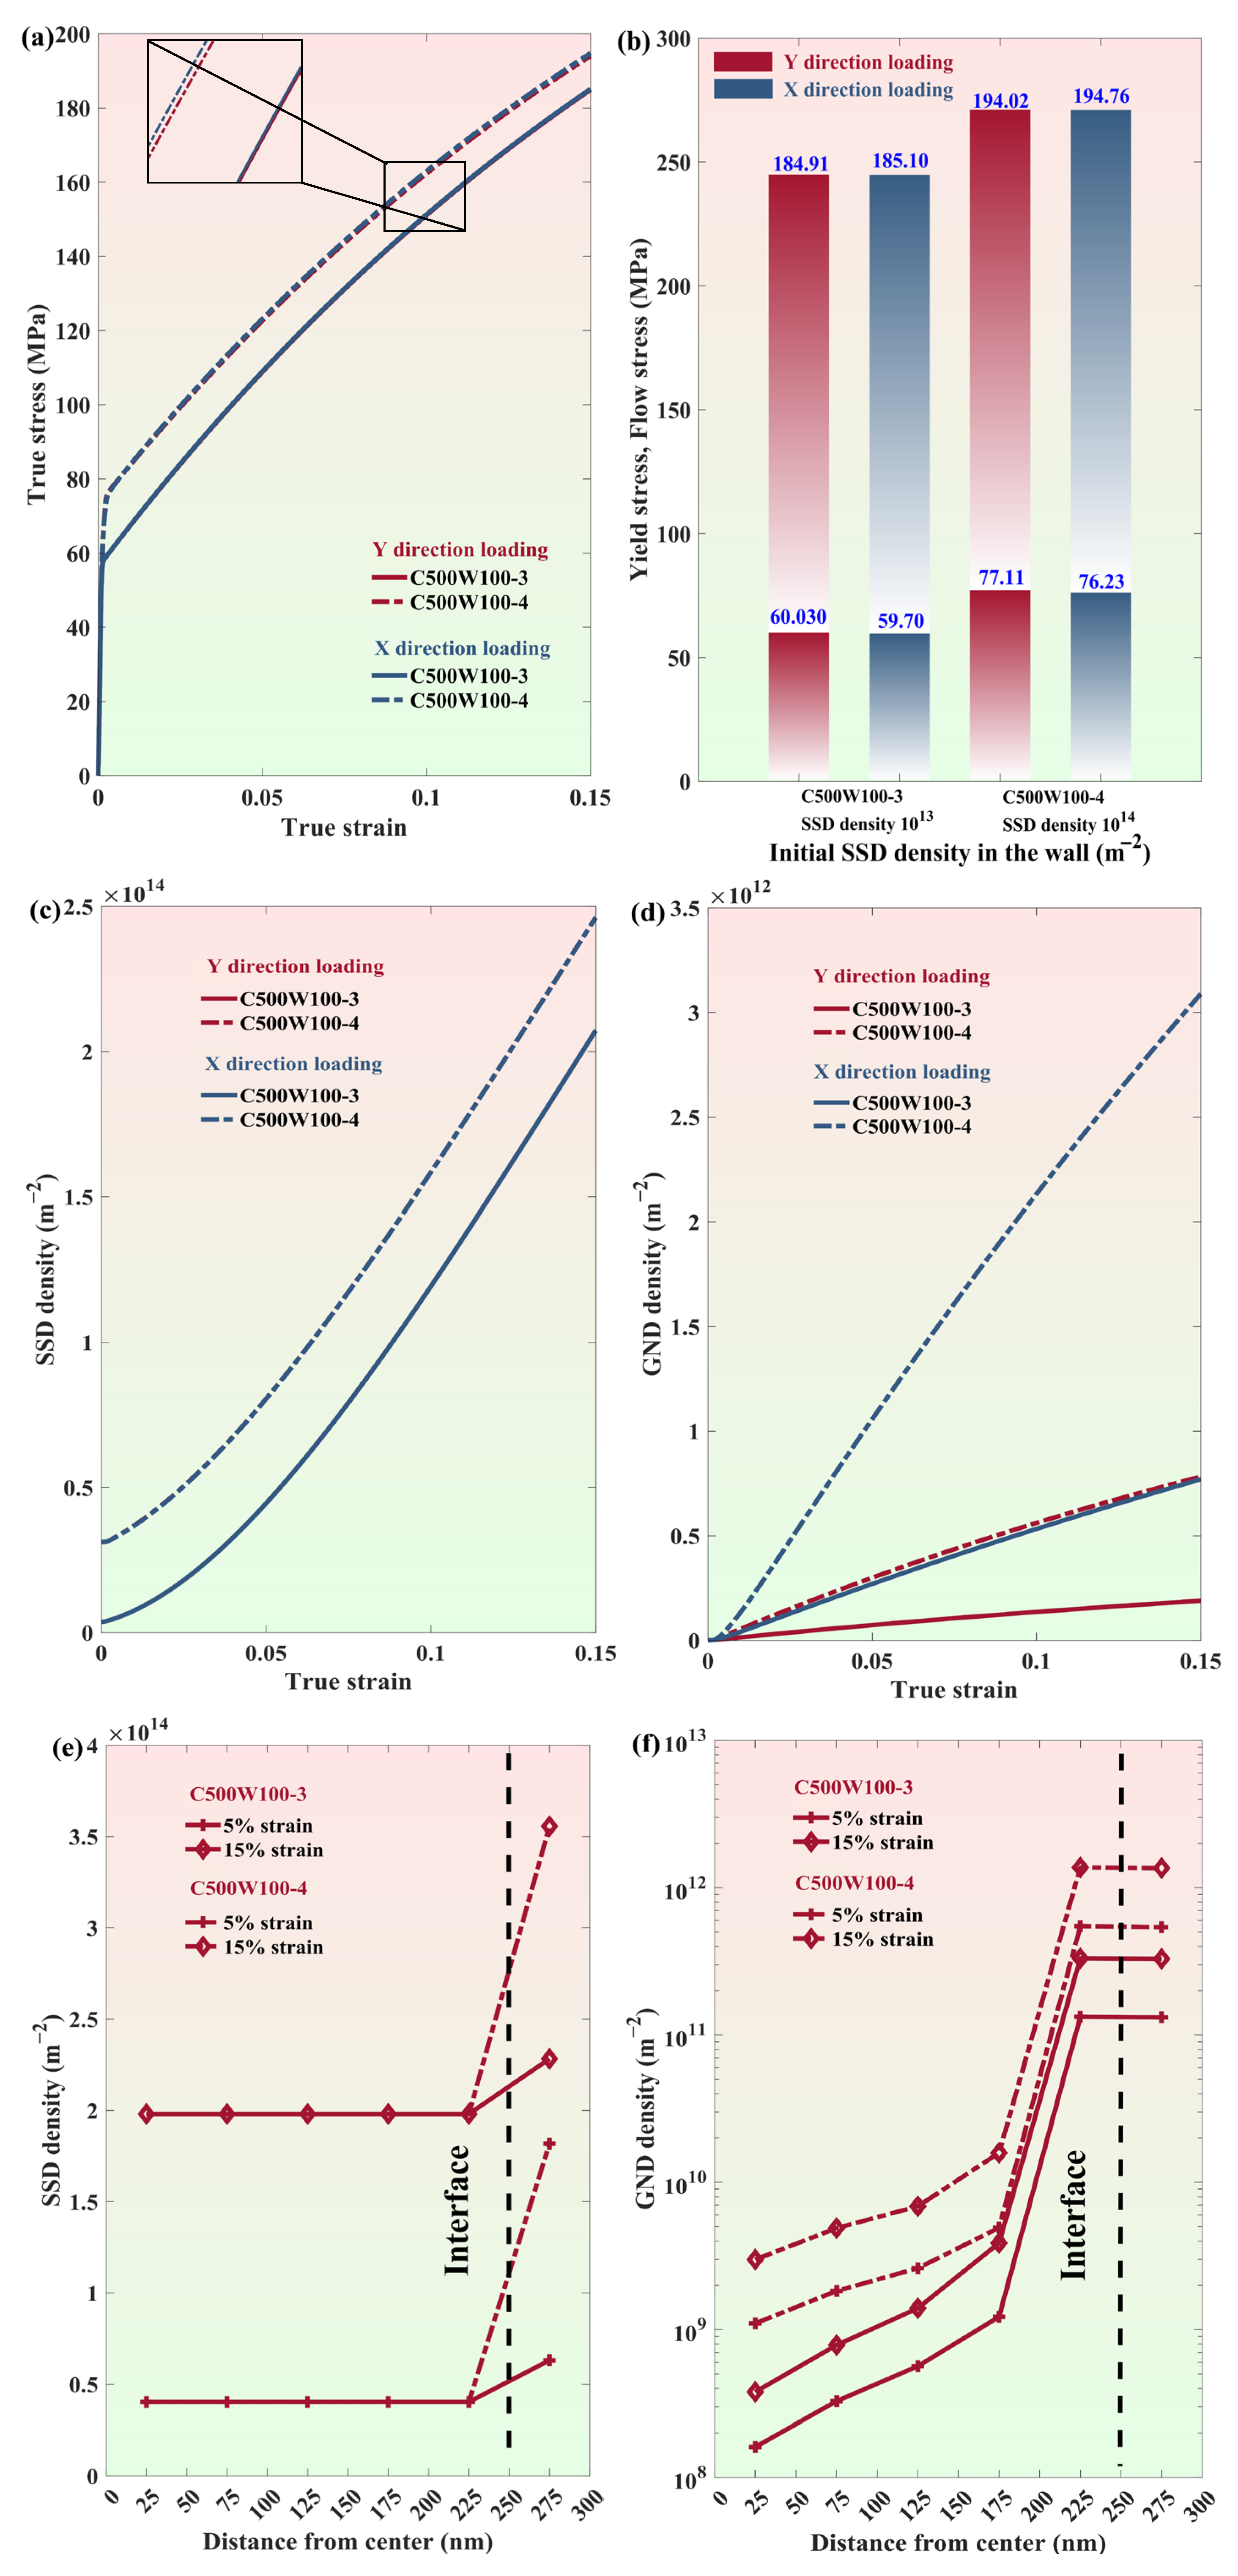
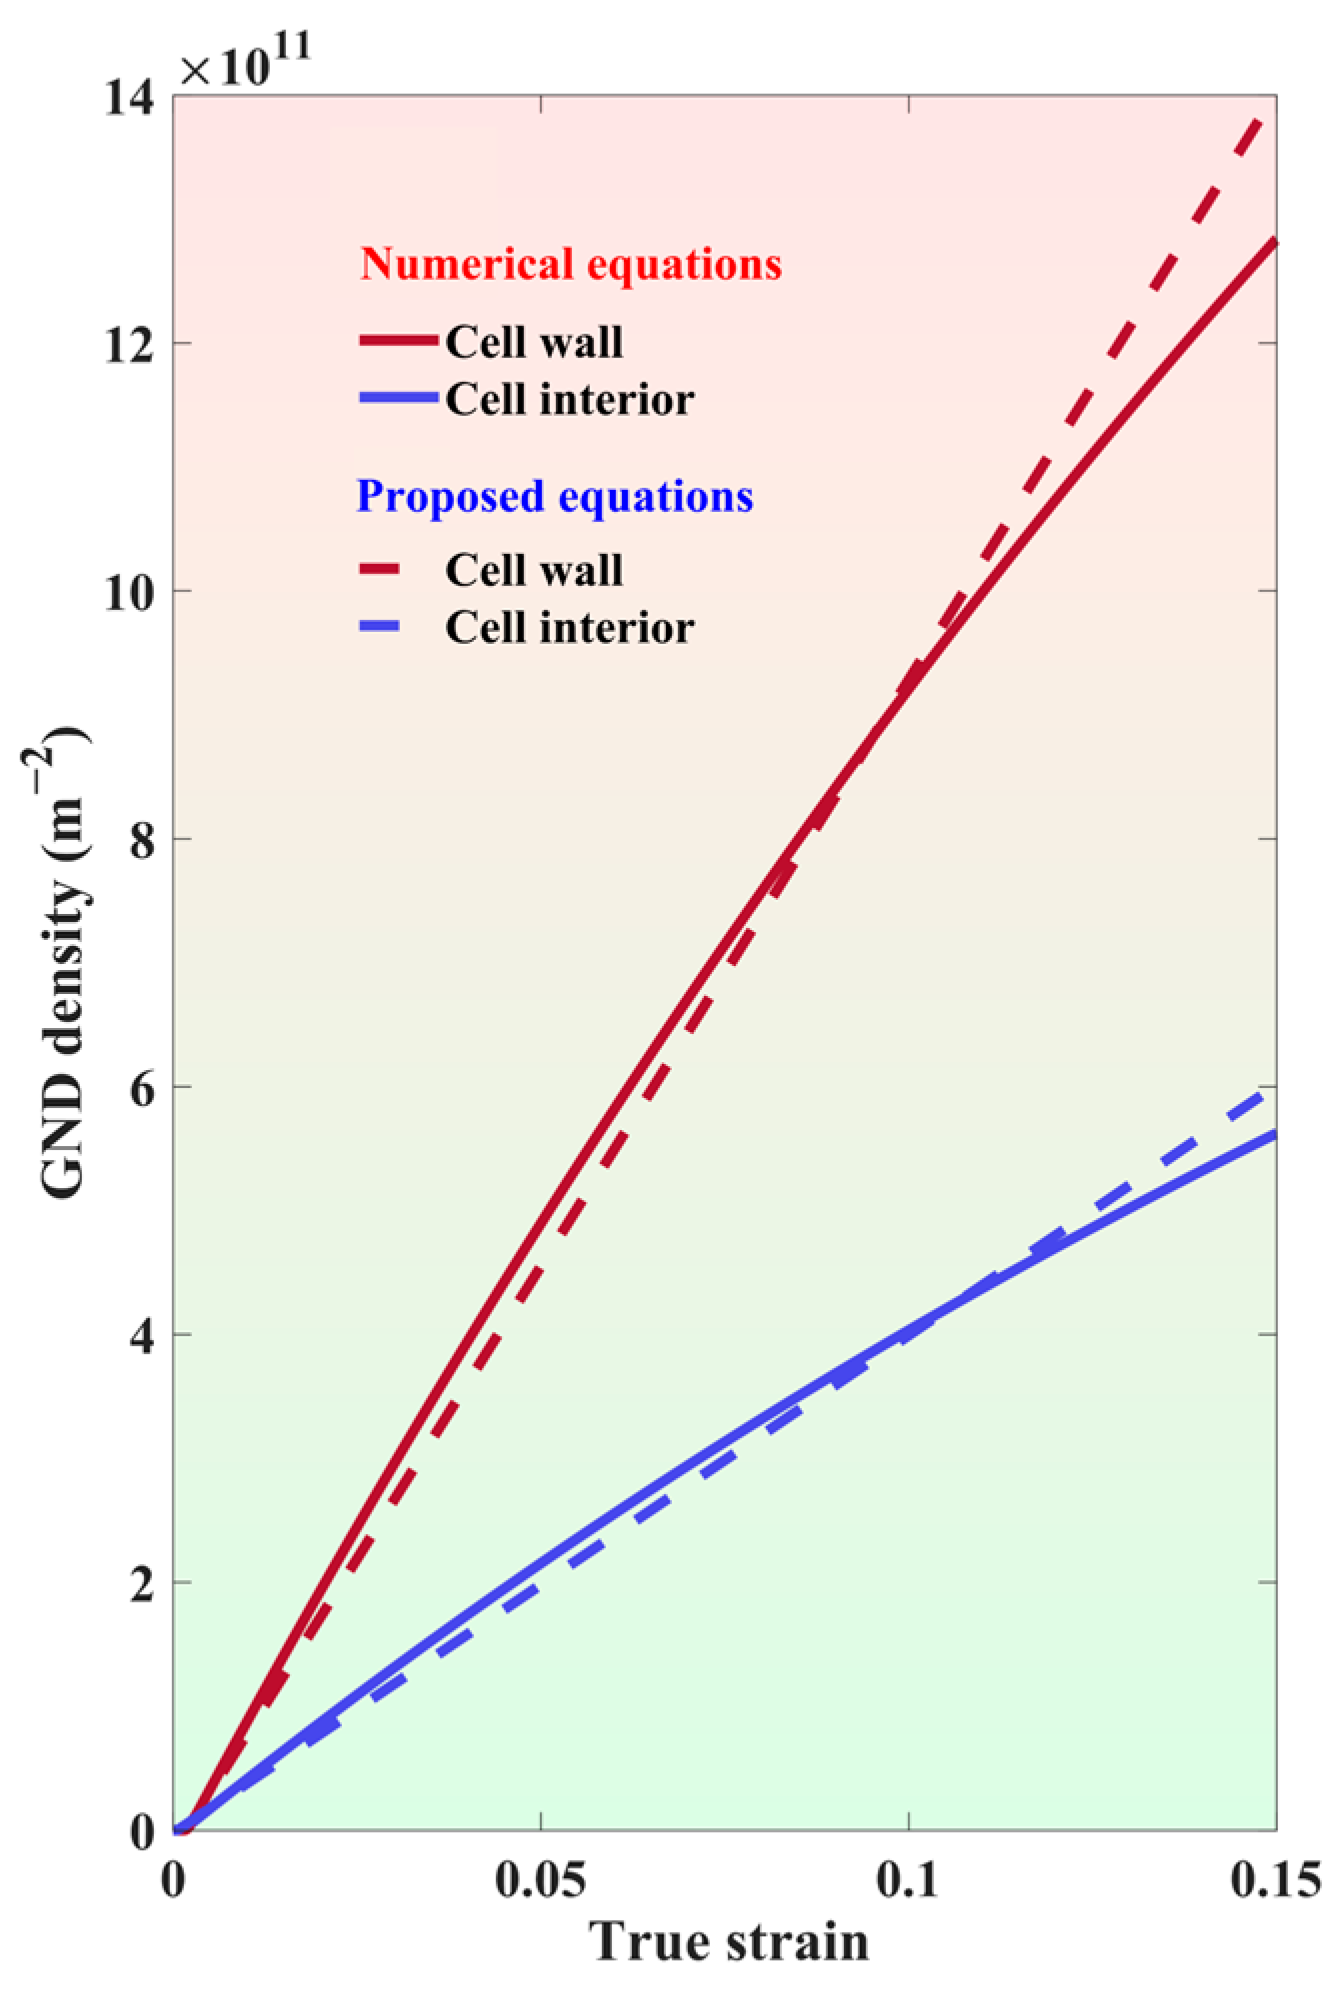
3.5. Quantifying GND

In this work, we propose constitutive equations to express the evolution of GND density in the cell wall and cell interior in the spirit of Ashby’s [58] equation. The proposed equations are as follows:
                ρ ˙ w ,   G N D α = k w *   γ ˙ w α b d 1 1 f    
ρ ˙ i n t ,   G N D α = k i n t   * γ ˙ i n t α b d 1 f  
where ρ ˙ w , G N D α and ρ ˙ i n t , G N D α are the rate of change of GND density in the cell wall and cell interior, d is the diameter of the cell structure, f is the volume fraction of the cell wall, γ ˙ w α is the shear strain rate in the cell wall, γ ˙ i n t α is the shear strain rate in the cell interior, and k w * and k i n t   *   are the efficiency of the GND accumulation in the cell wall and interior, respectively. To determine the values of efficiency coefficients, k w * and k i n t * GND densities predicted by Equations (14) and (15) were fitted to the GND densities obtained from our CPFE calculations. As a result, two separate linear fitting equations for k w * and k i n t * were derived and presented in Equations (16) and (17).
                k w *   =   0.0136 × S S D w S S D i n t ρ r e f          
                            k i n t * =   0.0288 × S S D w S S D i n t ρ r e f                      
where S S D w and S S D i n t represent the initial density of SSD in the cell wall and interior, respectively, and ρ r e f is the reference dislocation density equal to 1016 m−2.
Combining Equations (14)–(17), we obtain the following:
                                      ρ ˙ w , G N D α = 0.0136 × S S D w S S D i n t ρ r e f γ ˙ w α b d 1 1 f
                                      ρ ˙ i n t , G N D α = 0.0288 × S S D w S S D i n t ρ r e f γ ˙ i n t α b d 1 f
The results from the proposed equations are presented in Figure 6. The GND density curves predicted by Equations (18) and (19) exhibit reasonable agreement with the CPFE calculation results.

4. Conclusions

In this study, we investigated the influence of solidification sub-grain cell structures on the strength of additively manufactured metallic components using a dislocation density-based CPFE model. We analyzed various cell sizes, considering different volume fractions of the cell wall and initial dislocation densities in both the cell wall and interior. Each dislocation cell structure consisted of a high-dislocation-density cell wall and a low-dislocation-density cell interior. Our analysis revealed the following: (i) cell structures with a higher volume fraction of cell walls exhibit increased strength; (ii) for the same cell size, both flow stress and yield stress rise with higher initial dislocation densities.
The evolution of SSDs occurs more rapidly than GNDs. While SSD density remains relatively uniform at the center of the dislocation cell structures, GND density increases as the distance from the center to the wall decreases. The interface between the high- and low-dislocation-density regions, where the mismatch is greatest, accommodates the highest concentration of GNDs.
From these findings, we conclude that the larger difference in SSD density between the cell wall and interior leads to a faster increase in SSD density. However, cell size has little impact on SSD density evolution. Furthermore, a larger initial dislocation density difference between the wall and interior results in a more pronounced rise in GND density within the cell.
Based on our modeling results, we have developed constitutive equations to describe the evolution of GND density in both the cell wall and cell interior. These equations can be incorporated into coarse-grain modeling of deformation in AM metals, considering grain morphology and crystallographic texture.

Author Contributions

Conceptualization, M.M.R. and C.Z.; methodology, M.M.R. and C.Z.; investigation, M.M.R. and C.Z.; writing—original draft preparation, M.M.R.; writing—review and editing, M.M.R. and C.Z.; project administration, C.Z. All authors have read and agreed to the published version of the manuscript.

Funding

This research received no external funding.

Data Availability Statement

Data are contained within the article.

Conflicts of Interest

The authors declare no conflicts of interest.

Appendix A

Figure A1. (a) Stress–strain curves, the evolution of (b) SSD and (c) GND densities of C500W100-1 (fine mesh) and C500W100-2 (coarse mesh), where cell interior is 500nm with SSD density of 1012 m−2, and the cell wall is 100 nm with SSD density of ~3.25 × 10¹⁴ m−2.
Metals 15 00419 g0a1

References

  1. Lewandowski, J.J.; Seifi, M. Metal Additive Manufacturing: A Review of Mechanical Properties. Annu. Rev. Mater. Res. 2016, 46, 151–186. [Google Scholar] [CrossRef]
  2. Frazier, W.E. Metal additive manufacturing: A review. J. Mater. Eng. Perform. 2014, 23, 1917–1928. [Google Scholar] [CrossRef]
  3. Niendorf, T.; Leuders, S.; Riemer, A.; Richard, H.A.; Tröster, T.; Schwarze, D. Highly anisotropic steel processed by selective laser melting. Metall. Mater. Trans. B Process Metall. Mater. Process. Sci. 2013, 44, 794–796. [Google Scholar] [CrossRef]
  4. Kwon, J.; Karthik, G.M.; Estrin, Y.; Kim, H.S. Constitutive modeling of cellular-structured metals produced by additive manufacturing. Acta Mater. 2022, 241, 118421. [Google Scholar] [CrossRef]
  5. Prashanth, K.G.; Eckert, J. Formation of metastable cellular microstructures in selective laser melted alloys. J. Alloys Compd. 2017, 707, 27–34. [Google Scholar] [CrossRef]
  6. Bajaj, P.; Hariharan, A.; Kini, A.; Kürnsteiner, P.; Raabe, D.; Jägle, E.A. Steels in additive manufacturing: A review of their microstructure and properties. Mater. Sci. Eng. A 2020, 772, 138633. [Google Scholar] [CrossRef]
  7. Liu, L.; Ding, Q.; Zhong, Y.; Zou, J.; Wu, J.; Chiu, Y.L.; Li, J.; Zhang, Z.; Yu, Q.; Shen, Z. Dislocation network in additive manufactured steel breaks strength–ductility trade-off. Mater. Today 2018, 21, 354–361. [Google Scholar] [CrossRef]
  8. Shamsujjoha, M.; Agnew, S.R.; Fitz-Gerald, J.M.; Moore, W.R.; Newman, T.A. High Strength and Ductility of Additively Manufactured 316L Stainless Steel Explained. Metall. Mater. Trans. A 2018, 49, 3011–3027. [Google Scholar] [CrossRef]
  9. Sun, Z.; Tan, X.; Tor, S.B.; Chua, C.K. Simultaneously enhanced strength and ductility for 3D-printed stainless steel 316L by selective laser melting. NPG Asia Mater. 2018, 10, 127–136. [Google Scholar] [CrossRef]
  10. Nes, E. Modelling of work hardening and stress saturation in FCC metals. Prog. Mater. Sci. 1997, 41, 129–193. [Google Scholar] [CrossRef]
  11. Nes, E.; Marthinsen, K. Modeling the evolution in microstructure and properties during plastic deformation of f.c.c.-metals and alloys—An approach towards a unified model. Mater. Sci. Eng. A 2002, 322, 176–193. [Google Scholar] [CrossRef]
  12. Pinomaa, T.; Lindroos, M.; Walbrühl, M.; Provatas, N.; Laukkanen, A. The significance of spatial length scales and solute segregation in strengthening rapid solidification microstructures of 316L stainless steel. Acta Mater. 2020, 184, 1–16. [Google Scholar] [CrossRef]
  13. Bronkhorst, C.A.; Mayeur, J.R.; Livescu, V.; Pokharel, R.; Brown, D.W.; Gray, G.T. Structural representation of additively manufactured 316L austenitic stainless steel. Int. J. Plast. 2019, 118, 70–86. [Google Scholar] [CrossRef]
  14. Shimanek, J.D.; Liu, Z.K.; Beese, A.M. Effects of misorientation on single crystal plasticity by finite element methods. Comput. Mater. Sci. 2024, 237, 112879. [Google Scholar] [CrossRef]
  15. Roters, F.; Eisenlohr, P.; Hantcherli, L.; Tjahjanto, D.D.; Bieler, T.R.; Raabe, D. Overview of constitutive laws, kinematics, homogenization and multiscale methods in crystal plasticity finite-element modeling: Theory, experiments, applications. Acta Mater. 2010, 58, 1152–1211. [Google Scholar] [CrossRef]
  16. Thamburaja, P.; Anand, L. Polycrystalline shape-memory materials: Effect of crystallographic texture. J. Mech. Phys. Solids 2001, 49, 709–737. [Google Scholar] [CrossRef]
  17. Salem, A.A.; Kalidindi, S.R.; Semiatin, S.L. Strain hardening due to deformation twinning in α-titanium: Constitutive relations and crystal-plasticity modeling. Acta Mater. 2005, 53, 3495–3502. [Google Scholar] [CrossRef]
  18. Sedighiani, K.; Traka, K.; Roters, F.; Raabe, D.; Sietsma, J.; Diehl, M. Determination and analysis of the constitutive parameters of temperature-dependent dislocation-density-based crystal plasticity models. Mech. Mater. 2022, 164, 104117. [Google Scholar] [CrossRef]
  19. Kergaßner, A.; Mergheim, J.; Steinmann, P. Modeling of additively manufactured materials using gradient-enhanced crystal plasticity. Comput. Math. Appl. 2019, 78, 2338–2350. [Google Scholar] [CrossRef]
  20. Galera-Rueda, C.; Nieto-Valeiras, E.; Gardon, M.; Pérez-Prado, M.T.; LLorca, J. Effect of ZrH2 particles on the microstructure and mechanical properties of IN718 manufactured by selective laser melting. Mater. Sci. Eng. A 2021, 813, 141123. [Google Scholar] [CrossRef]
  21. Zhang, X.X.; Knoop, D.; Andrä, H.; Harjo, S.; Kawasaki, T.; Lutz, A.; Lahres, M. Multiscale constitutive modeling of additively manufactured Al–Si–Mg alloys based on measured phase stresses and dislocation density. Int. J. Plast. 2021, 140, 102972. [Google Scholar] [CrossRef]
  22. Li, Z.; Li, Z.; Tan, Z.; Xiong, D.-B.; Guo, Q. Stress relaxation and the cellular structure-dependence of plastic deformation in additively manufactured AlSi10Mg alloys. Int. J. Plast. 2020, 127, 102640. [Google Scholar] [CrossRef]
  23. Estrin, Y.; Mecking, H. A unified phenomenological description of work hardening and creep based on one-parameter models. Acta Metall. 1984, 32, 57–70. [Google Scholar] [CrossRef]
  24. Ghorbanpour, S.; Alam, M.E.; Ferreri, N.C.; Kumar, A.; McWilliams, B.A.; Vogel, S.C.; Bicknell, J.; Beyerlein, I.J.; Knezevic, M. Experimental characterization and crystal plasticity modeling of anisotropy, tension-compression asymmetry, and texture evolution of additively manufactured Inconel 718 at room and elevated temperatures. Int. J. Plast. 2020, 125, 63–79. [Google Scholar] [CrossRef]
  25. Biswas, A.; Prasad, M.R.G.; Vajragupta, N.; ul Hassan, H.; Brenne, F.; Niendorf, T.; Hartmaier, A. Influence of Microstructural Features on the Strain Hardening Behavior of Additively Manufactured Metallic Components. Adv. Eng. Mater. 2019, 21, 1900275. [Google Scholar] [CrossRef]
  26. Pokharel, R.; Patra, A.; Brown, D.W.; Clausen, B.; Vogel, S.C.; Gray, G.T. An analysis of phase stresses in additively manufactured 304L stainless steel using neutron diffraction measurements and crystal plasticity finite element simulations. Int. J. Plast. 2019, 121, 201–217. [Google Scholar] [CrossRef]
  27. Lindroos, M.; Pinomaa, T.; Ammar, K.; Laukkanen, A.; Provatas, N.; Forest, S. Dislocation density in cellular rapid solidification using phase field modeling and crystal plasticity. Int. J. Plast. 2022, 148, 103139. [Google Scholar] [CrossRef]
  28. Marin, E.B.; Dawson, P.R. On modelling the elasto-viscoplastic response of metals using polycrystal plasticity. Comput. Methods Appl. Mech. Eng. 1998, 165, 1–21. [Google Scholar] [CrossRef]
  29. Anand, L. Constitutive Equations for the Rate-Dependent Deformation of Metals at Elevated Temperatures. J. Eng. Mater. Technol. 1982, 104, 12–17. [Google Scholar] [CrossRef]
  30. Asaro, R.J.; Needleman, A. Overview no. 42 Texture development and strain hardening in rate dependent polycrystals. Acta Metall. 1985, 33, 923–953. [Google Scholar] [CrossRef]
  31. Hutchinson, J.W. Bounds and self-consistent estimates for creep of polycrystalline materials. Proc. R. Soc. Lond. A Math. Phys. Sci. 1976, 348, 101–127. [Google Scholar] [CrossRef]
  32. Lebensohn, R.A.; Tomé, C.N. A self-consistent anisotropic approach for the simulation of plastic deformation and texture development of polycrystals: Application to zirconium alloys. Acta Metall. Mater. 1993, 41, 2611–2624. [Google Scholar] [CrossRef]
  33. Peirce, D.; Asaro, R.J.; Needleman, A. Material rate dependence and localized deformation in crystalline solids. Acta Metall. 1983, 31, 1951–1976. [Google Scholar] [CrossRef]
  34. Nemat-Nasser, S.; Obata, M. Rate-dependent, finite elasto-plastic deformation of polycrystals. Proc. R. Soc. Lond. A Math. Phys. Sci. 1986, 407, 343–375. [Google Scholar] [CrossRef]
  35. Kocks, U.F.; Argon, A.S.; Ashby, M.F. Thermodynamics and kinetics of slip. Prog. Mater. Sci. 1975, 19, 1–281. [Google Scholar]
  36. Houtte, P.V. Simulation of the rolling and shear texture of brass by the Taylor theory adapted for mechanical twinning. Acta Metall. 1978, 26, 591–604. [Google Scholar] [CrossRef]
  37. Peirce, D.; Asaro, R.J.; Needleman, A. An analysis of nonuniform and localized deformation in ductile single crystals. Acta Metall. 1982, 30, 1087–1119. [Google Scholar] [CrossRef]
  38. Rice, J.R. Inelastic constitutive relations for solids: An internal-variable theory and its application to metal plasticity. J. Mech. Phys. Solids 1971, 19, 433–455. [Google Scholar] [CrossRef]
  39. Taylor, G.I. Plastic strain in metals. J. Inst. Met. 1938, 62, 307–324. [Google Scholar]
  40. Mecking, H.; Kocks, U.F. Kinetics of flow and strain-hardening. Acta Metall. 1981, 29, 1865–1875. [Google Scholar] [CrossRef]
  41. Ma, A.; Roters, F.; Raabe, D. A dislocation density based constitutive model for crystal plasticity FEM including geometrically necessary dislocations. Acta Mater. 2006, 54, 2169–2179. [Google Scholar] [CrossRef]
  42. Takeuchi, T. Work Hardening of Copper Single Crystals with Multiple Glide Orientations. Trans. Jpn. Inst. Met. 1975, 16, 629–640. [Google Scholar] [CrossRef]
  43. Wang, Y.M.; Voisin, T.; McKeown, J.T.; Ye, J.; Calta, N.P.; Li, Z.; Zeng, Z.; Zhang, Y.; Chen, W.; Roehling, T.T.; et al. Additively manufactured hierarchical stainless steels with high strength and ductility. Nat. Mater. 2018, 17, 63–71. [Google Scholar] [CrossRef]
  44. Wang, G.; Ouyang, H.; Fan, C.; Guo, Q.; Li, Z.; Yan, W.; Li, Z. The origin of high-density dislocations in additively manufactured metals. Mater. Res. Lett. 2020, 8, 283–290. [Google Scholar] [CrossRef]
  45. Zhu, Z.G.; Nguyen, Q.B.; Ng, F.L.; An, X.H.; Liao, X.Z.; Liaw, P.K.; Nai, S.M.L.; Wei, J. Hierarchical microstructure and strengthening mechanisms of a CoCrFeNiMn high entropy alloy additively manufactured by selective laser melting. Scr. Mater. 2018, 154, 20–24. [Google Scholar] [CrossRef]
  46. Gallmeyer, T.G.; Moorthy, S.; Kappes, B.B.; Mills, M.J.; Amin-Ahmadi, B.; Stebner, A.P. Knowledge of process-structure-property relationships to engineer better heat treatments for laser powder bed fusion additive manufactured Inconel 718. Addit. Manuf. 2020, 31, 100977. [Google Scholar] [CrossRef]
  47. Li, Z.; Cui, Y.; Yan, W.; Zhang, D.; Fang, Y.; Chen, Y.; Yu, Q.; Wang, G.; Ouyang, H.; Fan, C.; et al. Enhanced strengthening and hardening via self-stabilized dislocation network in additively manufactured metals. Mater. Today 2021, 50, 79–88. [Google Scholar] [CrossRef]
  48. Freeman, F.S.H.B.; Sharp, J.; Xi, J.; Todd, I. Influence of solidification cell structure on the martensitic transformation in additively manufactured steels. Addit. Manuf. 2019, 30, 100917. [Google Scholar] [CrossRef]
  49. Boussinot, G.; Apel, M.; Zielinski, J.; Hecht, U.; Schleifenbaum, J.H. Strongly Out-of-Equilibrium Columnar Solidification during Laser Powder-Bed Fusion in Additive Manufacturing. Phys. Rev. Appl. 2019, 11, 014025. [Google Scholar] [CrossRef]
  50. Kadkhodapour, J.; Butz, A.; Ziaei-Rad, S.; Schmauder, S. A micro mechanical study on failure initiation of dual phase steels under tension using single crystal plasticity model. Int. J. Plast. 2011, 27, 1103–1125. [Google Scholar] [CrossRef]
  51. Choi, K.S.; Liu, W.N.; Sun, X.; Khaleel, M.A. Influence of Martensite Mechanical Properties on Failure Mode and Ductility of Dual-Phase Steels. Metall. Mater. Trans. A 2009, 40, 796–809. [Google Scholar] [CrossRef]
  52. Rao, S.I.; Dimiduk, D.M.; Tang, M.; Parthasarathy, T.A.; Uchic, M.D.; Woodward, C. Estimating the strength of single-ended dislocation sources in micron-sized single crystals. Philos. Mag. 2007, 87, 4777–4794. [Google Scholar] [CrossRef]
  53. Li, J.; Yi, M.; Wu, H.; Fang, Q.; Liu, Y.; Liu, B.; Zhou, K.; Liaw, P.K. Fine-grain-embedded dislocation-cell structures for high strength and ductility in additively manufactured steels. Mater. Sci. Eng. A 2020, 790, 139736. [Google Scholar] [CrossRef]
  54. Bertsch, K.M.; Meric de Bellefon, G.; Kuehl, B.; Thoma, D.J. Origin of dislocation structures in an additively manufactured austenitic stainless steel 316L. Acta Mater. 2020, 199, 19–33. [Google Scholar] [CrossRef]
  55. Meyers, M.A.; Chawla, K.K. Mechanical Behavior of Materials; Cambridge University Press: Cambridge, UK, 2008. [Google Scholar] [CrossRef]
  56. Kong, D.; Dong, C.; Wei, S.; Ni, X.; Zhang, L.; Li, R.; Wang, L.; Man, C.; Li, X. About metastable cellular structure in additively manufactured austenitic stainless steels. Addit. Manuf. 2021, 38, 101804. [Google Scholar] [CrossRef]
  57. Qu, S.; Ding, J.; Fu, J.; Fu, M.; Song, X. Anisotropic material properties of pure copper with fine-grained microstructure fabricated by laser powder bed fusion process. Addit. Manuf. 2022, 59, 103082. [Google Scholar] [CrossRef]
  58. Ashby, M.F. The deformation of plastically non-homogeneous materials. Philos. Mag. J. Theor. Exp. Appl. Phys. 1970, 21, 399–424. [Google Scholar] [CrossRef]
Figure 1. Comparison of the stress–strain curves between the experimental results and CPFE modeling results for single crystal Cu.
Metals 15 00419 g001
Figure 2. Meshes representing dislocation cell structures. The volume fraction of the cell wall ( f ) equals to (a) ~16% and (b) ~56%. The red region defines the cell wall, and the blue region represents the cell interior.
Metals 15 00419 g002
Figure 3. True stress–strain responses. (a) C550W50 and C500W100-1 cases with an initial dislocation density of ~6.21 × 10¹⁴ m−2 and ~3.25 × 10¹⁴ m−2 in the cell wall of 50 nm and 100 nm, respectively, while the cell interior of 550 nm and 500 nm maintained an initial total dislocation density of 1012 m−2 with their corresponding ROM predicted strength, (b) yield and flow stress with the corresponding ROM (empty circles and squares), evolution of (c) total dislocation (SSD + GND) density, (d) GND density, the rate of change of (e) SSD density, and (f) GND density.
Metals 15 00419 g003aMetals 15 00419 g003b
Figure 4. Comparison of (a) true stress–strain responses for C600W100-1,2,3 and C350W50 with experimental sample AM-Cu, A, and AM-Cu, B [47]. Evolution of (b) SSD and (c) GND densities in the cell wall, cell interior, and the whole sample for C600W100-3 and C300W50, both having identical initial dislocation density (1013 m−2 in the cell wall and 1012 m−2 in the interior). (d) Equivalent plastic strain (red region highlights the cell interior and blue region marks the cell wall) and (e) GND density contour plots for case C600W100-3. (f) Equivalent plastic strain and (g) GND density contour plots for case C300W50. Equivalent plastic strain distribution from the center of the cells toward the cell wall at 15% true strain for (h) C600W100-3 and (i) C300W50, where the dashed line along the Y axis represents the interface region of the cell wall and cell interior.
Metals 15 00419 g004aMetals 15 00419 g004b
Figure 5. Impact of initial dislocation density and anisotropy of C500W100-3 and C500W100-4, both having the same initial SSD density in the cell interior, while the cell wall SSD densities are 1013 m−2 and 1014 m−2, respectively, loaded along the X and Y directions. (a) True stress–strain responses, (b) bar plots for yield stress (lower sub-bars in the two stacked bars) and flow stress (upper sub-bars in the stacked bars), evolution of (c) SSD density, (d) GND density in the sample, (e) SSD density, and (f) GND density from the center of the cell structure toward the cell wall at 5% and 15% true strain.
Metals 15 00419 g005
Figure 6. Comparison of GND density evolution for C500W100-4 predicted by Equation (11) for cell wall and interior and proposed Equations (18) and (19) for cell wall and cell interior, respectively.
Metals 15 00419 g006
Table 1. CPFE model parameters.
k 1 (m−1) k 2 γ ˙ 0 (s−1)m
109 (fitted)28 (fitted)0.003 (fitted)0.1 (fitted)
ρ S S D α  (m−2) ρ G N D α  (m−2)b (nm)G (GPa)
1012 (fitted)00.25642
C11 (GPa)C12 (GPa)C44 (GPa) χ
168.15125.6078.800.35 (fitted)
Table 2. List of LPBF process parameters and the size of dislocation cell structures.
Process Parameters[7][43][44][53][54]
Laser power (W)200150–350230225275
Scanning speed (mm/s)850700–170050010008.5
Hatch spacing (µm)10075–1056090350
Rotated scanning direction (degree)670676790
Laser spot size (µm)7054608080
Layer thickness (µm)20302030254
Average cell diameter (nm)500580,930200–500500470
Disclaimer/Publisher’s Note: The statements, opinions and data contained in all publications are solely those of the individual author(s) and contributor(s) and not of MDPI and/or the editor(s). MDPI and/or the editor(s) disclaim responsibility for any injury to people or property resulting from any ideas, methods, instructions or products referred to in the content.

