Abstract
The Mg-Nd-Zn isothermal section at 300 °C was established in the full composition range using diffusion couples and equilibrated key alloys. Microstructural characterization was carried out using WDS, XRD, and metallographic methods. The homogeneity ranges of the binary and ternary compounds were determined by WDS analysis. Six ternary compounds were observed in the Mg-Nd-Zn system at 300 °C. These are: τ1 (Nd5Mg21+xZn45−x; 0 ≤ x ≤ 4), τ2 (Nd5Mg3+yZn25−y; 0 ≤ y ≤ 1), τ3 (NdMg1+zZn2−z; 0 ≤ z ≤ 0.44), τ4 (Mg40Nd5Zn55), τ5 (Mg22–23.5Nd15.5–17.5Zn59.1–61.8), and τ6 (Nd2(Mg,Zn)23). τ5 was found to have a homogeneity range of 22.0–23.5 atom % Mg, 15.5–17.6 atom % Nd and 59.1–61.8 atom % Zn and τ6 was found to have 54.1–61.3 atom % Mg at a constant Nd of 8.0 atom %. The ternary solubility of Zn in Mg-Nd compounds was found to increase with the decrease in Mg concentration. Accordingly, (Mg41Nd5) was found to have an extended solubility of 3.1 atom % Zn, whereas (Mg3Nd) was found to have 30.0 atom % Zn. MgNd was found to have a complete substitution of Mg by Zn. The maximum solid solubility of Zn in α-Mg was measured as 4.8 atom % Zn.
1. Introduction
Magnesium alloys are widely used in the automotive and aerospace industries, because of their high strength to weight ratio. The reason for this interest is the reduction of fuel consumption, because magnesium alloys are lighter than the traditional iron- and aluminum-based alloys [1]. The use of magnesium alloys is restricted to low stress level and low temperature components due to their poor mechanical properties and creep resistance at elevated temperatures [2,3]. Addition of zinc is known for improving the mechanical properties and corrosion resistance of magnesium-based alloys at room temperature [4]. However, the melting temperature of Mg-Zn alloys is very low, because of the deep eutectic which occurs at 342 °C [5,6]. For this reason, rare earth elements are added to improve the mechanical properties and creep resistance of magnesium alloys at elevated temperatures [7]. Addition of neodymium to magnesium-based alloys results in improving their hardness and strength after an age hardening treatment. This can be attributed to the formation of fine-scaled solute-rich regions, Guinier-Preston zones (GP zones), in the Mg matrix [8]. On the other hand, the Nd-Zn binary phase diagram [9] shows the formation of a series of stable intermetallic compounds with high melting temperatures, which may result in improving the creep behavior of Mg alloys.
The main objective of this work is to establish the Mg-Nd-Zn isothermal section at 300 °C in the full composition range by means of diffusion couples and key alloy experiments using X-ray diffraction (XRD), a scanning electron microscope (SEM), energy dispersive X-ray spectrometer (EDS), and wavelength dispersive X-ray spectrometer (WDS).
2. Literature Review
The Mg-Nd-Zn partial isothermal section (50–100 atom % Mg, 0–35 atom % Nd, and 0–55 atom % Zn) was studied by Drits et al. [10] at 300 °C using X-ray diffraction and metallography. They reported several binary and ternary compounds that are in equilibrium with the α-Mg solid solution. These compounds are: Mg12Nd (denoted in their work as Mg9Nd), Mg7Zn3, MgZn, MgNd4Zn5, Mg6Nd2Zn7, and Mg2Nd2Zn9. In addition, three vertical sections (section 1: from 80 atom % Mg and 20 atom % Nd to 70 atom % Mg and 30 atom % Zn; section 2: constant 10 atom % Nd and 0–60 atom % Zn; section 3: constant 20 atom % Zn and 0–35 atom % Nd) were determined using thermal analysis. Accordingly, two eutectic reactions: L↔α-Mg+Mg12Nd+MgNd4Zn5 and L↔α-Mg+Mg2Nd2Zn9+Mg7Zn3, and two quasi-peritectic reactions: L+MgNd4Zn5↔α-Mg+Mg6Nd2Zn7 and L+Mg6Nd2Zn7↔α-Mg+Mg2Nd2Zn9 were observed. Drits et al. [10] found that Mg7Zn3 is stable within a narrow temperature range between 312 and 340 °C. Later, Drits et al. [11] studied the combined solubility of Nd and Zn in an Mg solid solution at 200, 250, 300, 400, and 500 °C using X-ray diffraction, electrical resistivity, microhardness, and microstructural examination. Based on these results, the phase equilibria between Mg12Nd, Mg7Zn3, MgNd4Zn5, Mg6Nd2Zn7, and Mg2Nd2Zn9 and the α-Mg solid solution were suggested. In his review paper, Raynor [12] presented the Mg-Nd-Zn ternary phase diagram based on the results obtained by Drits et al. [10,11]. Kinzhibalo et al. [13] reported different phase relations in the Mg-rich corner at 297 °C and ternary compounds than those reported by Drits et al. [11] at 300 °C. Kinzhibalo et al. [13] proposed that the α-Mg solid solution is in equilibrium with Mg12Nd, Mg6NdZn3, Mg8Nd3Zn11, Mg7NdZn12, and MgZn. Huang et al. [14] investigated the structure, composition range, and phase equilibria of the ternary compound τ1 (Mg27–33.4Nd6.1–7.4Zn60.2–66.4) using SEM/EPMA, XRD, and TEM. The existence of τ1 was confirmed in the low Nd side in the temperature range of 300–400 °C. Also, they reported the existence of three three-phase regions τ1+α-Mg+MgZn, τ1+MgZn+L, and τ1+Mg2Zn3+L at 300, 350, and 400 °C, respectively. Zhang et al. [15,16] reported the existence of a simple icosahedral quasi-crystal phase with a stoichiometric composition of Mg40Nd5Zn55 using SEM, EDS, and TEM experiments. The quasi-lattice parameter aR was determined based on X-ray diffraction as 0.525 nm. The phase was detected in the Mg-Nd-Zn as-cast alloys, which were made under conventional casting conditions [15,16]. However, the presence of the Mg40Nd5Zn55 phase was not confirmed under equilibrium conditions.
Recently, Huang et al. [1] performed a systematic study on the Mg-rich corner of the partial Mg-Nd-Zn system at 400 °C using XRD, SEM/EPMA, and TEM. They reported a ternary compound τ2, having the chemical formula Nd(Mg,Zn)11.5, which was found in equilibrium with the α-Mg solid solution, τ1, τ3 (MgNdZn2), and τ4 (Mg25.2Nd15.7Zn59.1). In addition, five three-phase regions, τ2+τ3+α-Mg, τ2+τ1+α-Mg, τ2+τ3+τ4, τ2+τ1+τ4, and α-Mg+τ1+L, were identified [1]. More recently, Qi et al. [8] provided a thermodynamic description of the Mg-Nd-Zn system using the CALPHAD approach. Four stable ternary compounds, taken from the literature, were considered in their model [8]. These compounds are τ1 (Mg7NdZn12), τ2 (Mg7Nd2Zn11), τ3 (Mg6NdZn3), and τ4 (Mg6Nd3Zn11). The calculated isothermal section of the Mg-Nd-Zn system at 300 °C showed different phase relations than those reported in the experimental isothermal section of Kinzhibalo et al. [13] at 300 °C. Later, Zhang et al. [17] evaluated the Mg-Nd-Zn system at 300 °C and 400 °C using four key alloys and thermodynamic modeling. In their work, three ternary compounds, τ1 (Mg35Nd5Zn60), τ2 (Nd8(Mg, Zn)92), and τ3 (Mg30Nd15Zn55), reported by Kinzhibalo et al. [13], were confirmed experimentally using EPMA and XRD. The various ternary compounds in the Mg-Nd-Zn system reported in the literature [1,10,11,13,14,15,16] are presented graphically in Figure 1.
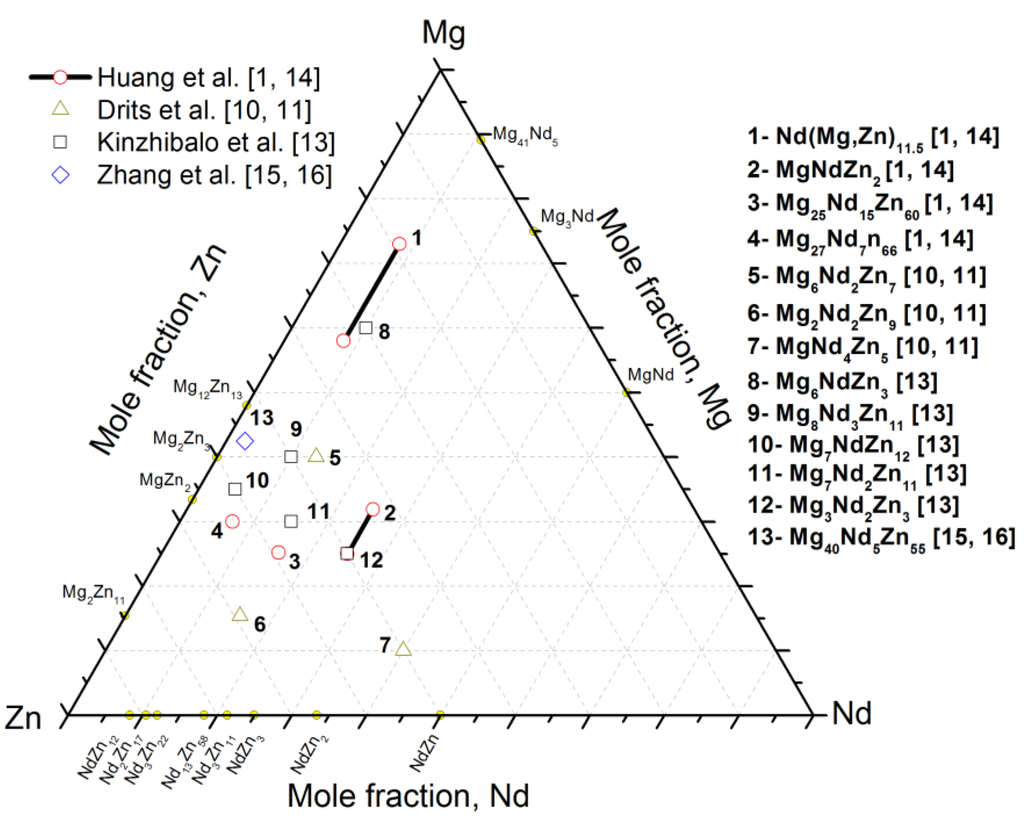
Figure 1.
Graphical representation of the Mg-Nd-Zn ternary compounds reported in the literature [1,10,11,13,14,15,16] at different temperatures.
Figure 1.
Graphical representation of the Mg-Nd-Zn ternary compounds reported in the literature [1,10,11,13,14,15,16] at different temperatures.

The available literature data focused on partial isothermal sections near the Mg-rich corner only and the phase relations near the Zn-rich corner were poorly studied. Also, many discrepancies on the composition of the ternary compounds were found. Thus, it is necessary to understand the phase relationships in the Mg-Nd-Zn system at 300 °C for the whole composition range by means of experimental techniques.
3. Results and Discussion
In the following section, ternary compounds are denoted by the Greek symbol τ and are numbered according to their order of appearance. Binary and ternary solid solutions are described using parentheses and superscripts. For example, the binary solid solubility of Zn in α-Mg is presented as (α-Mg)Zn and the ternary solid solubility of Zn in Mg3Nd is presented as (Mg3Nd).
3.1. Solid-Solid Diffusion Couples
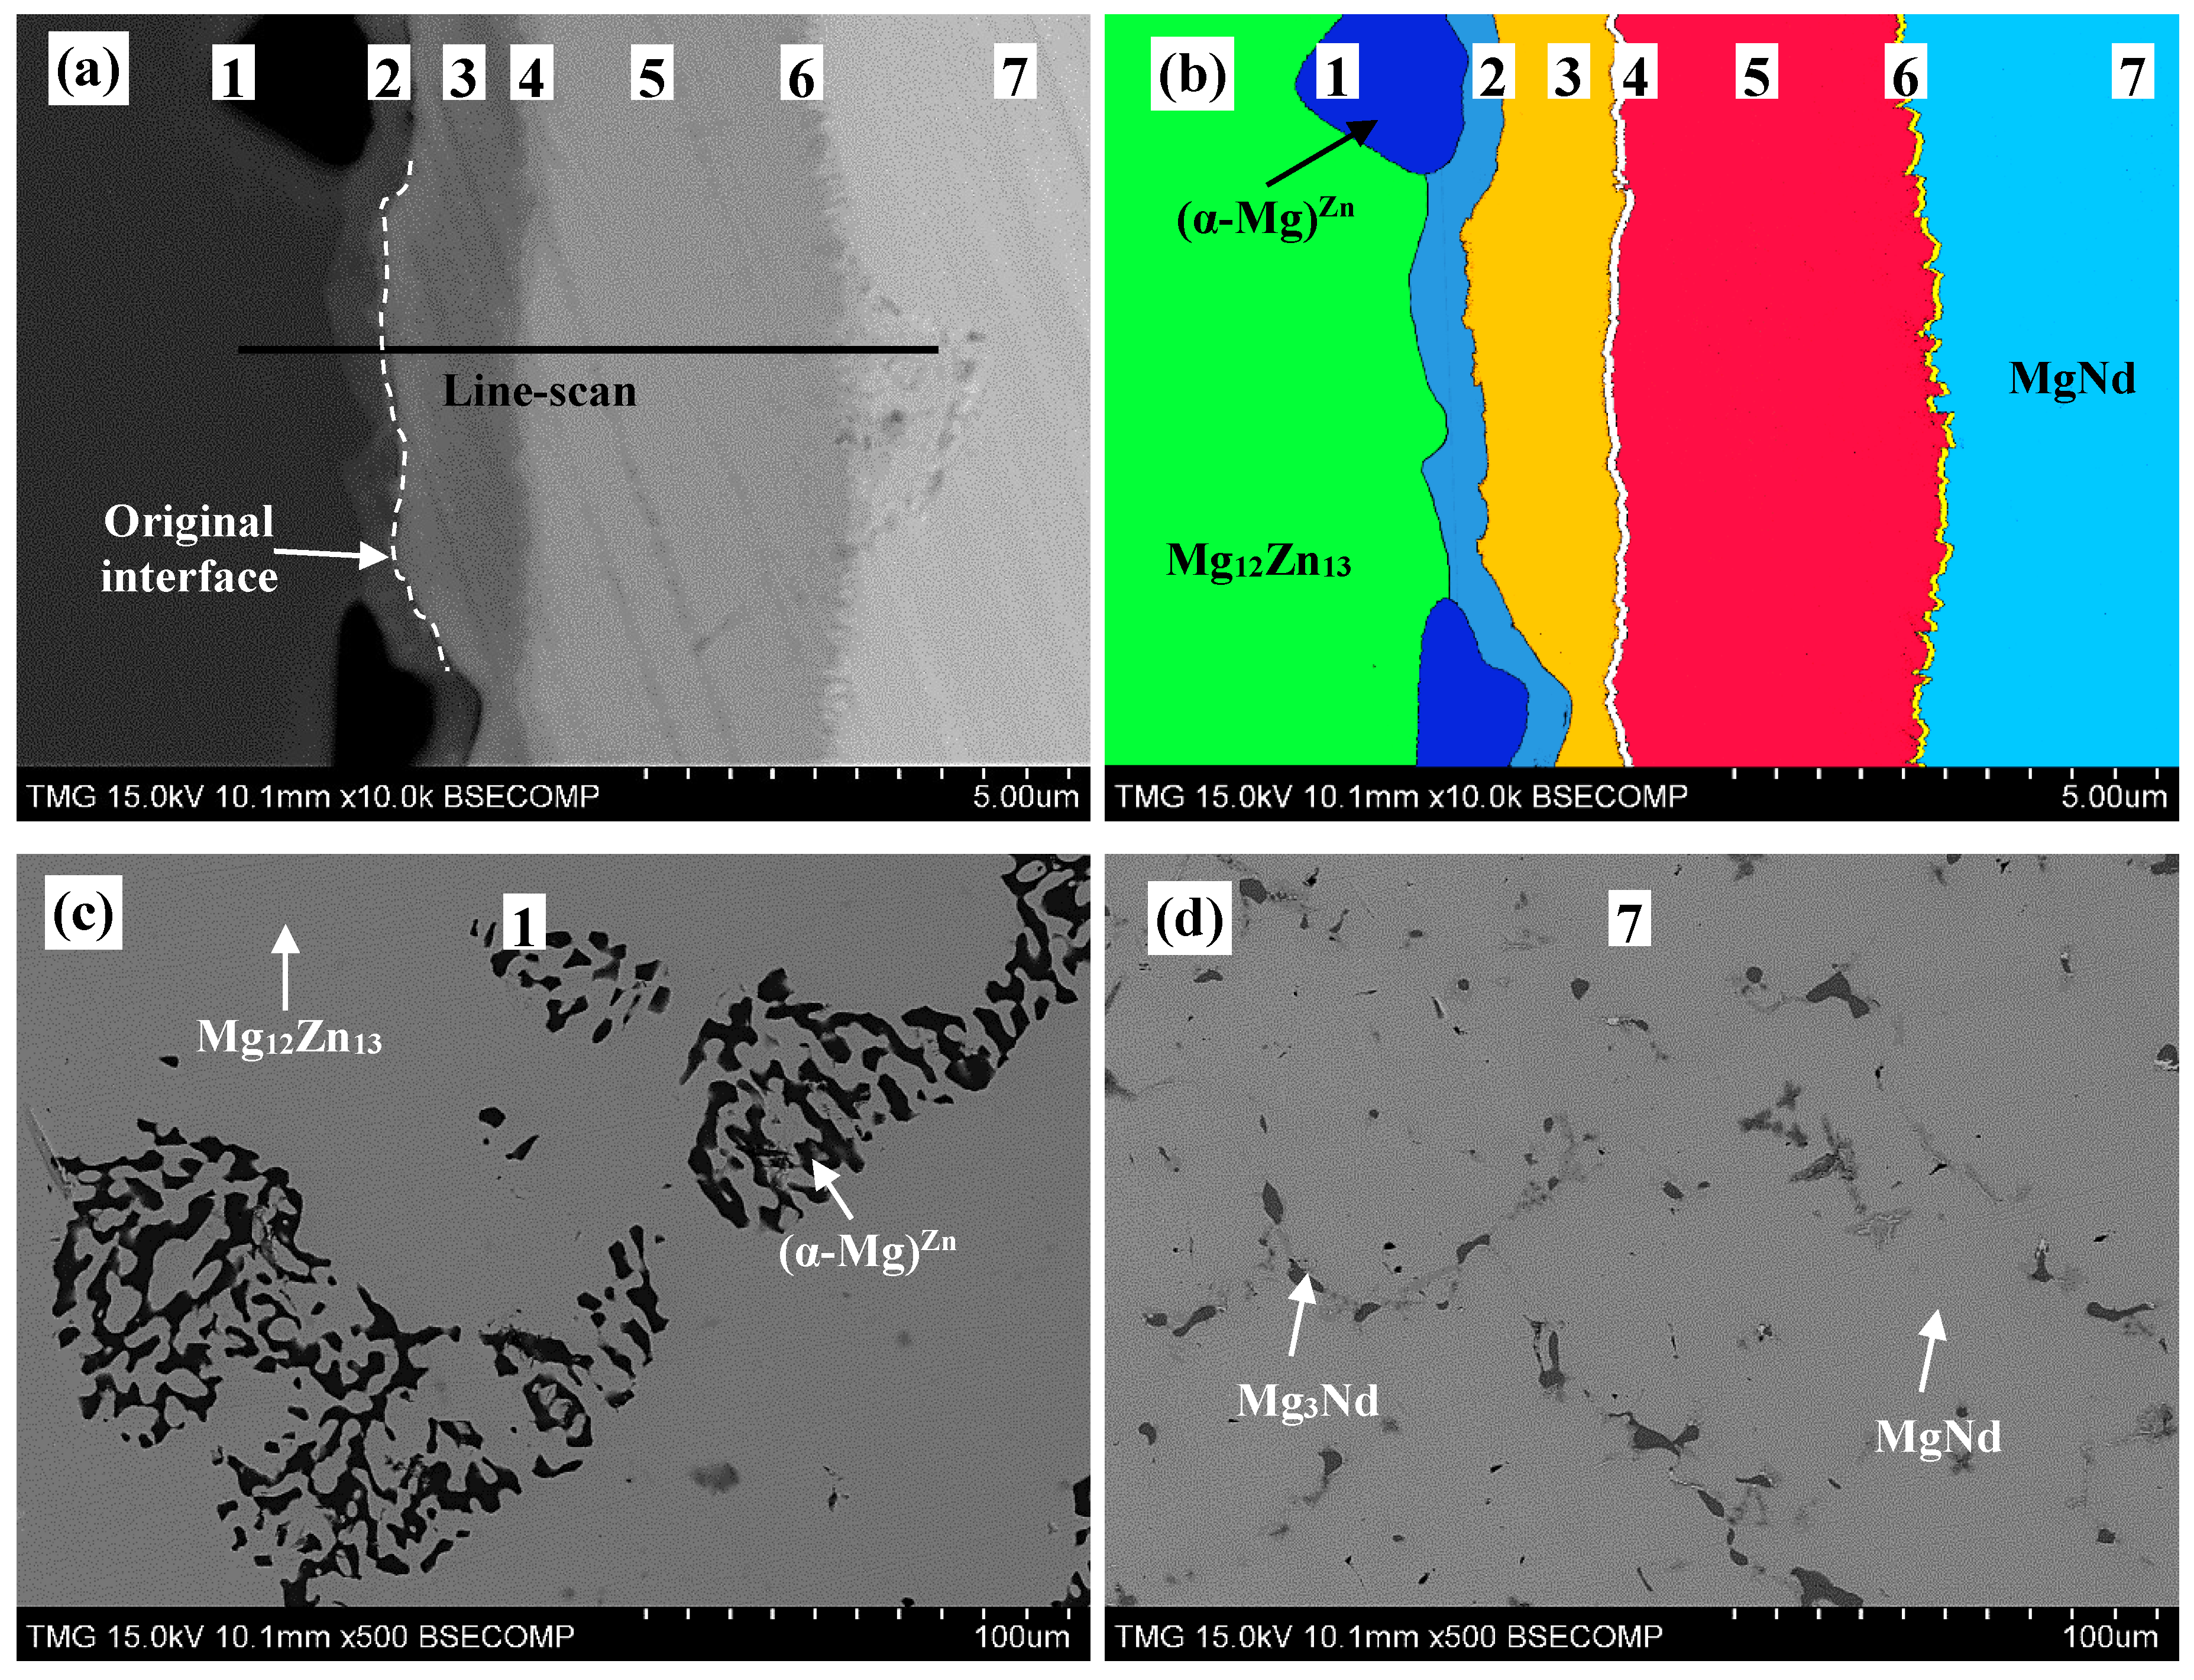
The end-members of diffusion couple #1 were made from pure zinc and a two-phase binary alloy containing Mg3Nd and MgNd, as shown in Figure 2d. The diffusion couple was annealed at 300 °C for 21 days. The SEM micrographs of diffusion couple #1 are shown in Figure 2a–c. Nine diffusion zones in this diffusion couple were identified using WDS spot analysis (±1 atom %). The compositions of the constituents of these nine zones are given in Table 1.
From Figure 2 and Table 1, diffusion zone #1 represents the pure-Zn end-member. Diffusion zone #2 represents the binary compound layer Mg2Zn11. Diffusion zones #3–5 represent two-phase layers. These are: (Nd2Zn17)+Mg2Zn11, (Nd2Zn17)+MgZn2, and τ1+MgZn2, respectively. Three-phase equilibrium could be determined at every interface of these zones. For instance, the three-phase equilibria (Nd2Zn17)+Mg2Zn11+MgZn2 was determined at the interface between zones #3 and #4. The three-phase equilibria (Nd2Zn17)+MgZn2+τ1 was determined at the interface between zones #4 and #5. Each of the diffusion zones #6–8 represent a single phase layer as follows: Mg2Nd2Zn9 (denoted as τ2 in this work), MgNdZn2 (denoted as τ3 in this work), and Nd(Mg,Zn)3, respectively. Drits et al. [11] reported the existence of Mg2Nd2Zn9 at 200 and 300 °C and proposed that it is in equilibrium with α-Mg in both isothermal sections. Zones #7 and #8 show that Zn substitutes for Mg at a constant Nd concentration of 25 atom %. The composition of Mg varied from 25 to 31.5 atom % in the τ3 ternary compound, and from 51.2 to 75 atom % in the (Mg3Nd) ternary solid solution. Zone #9 is the Mg3Nd+MgNd end-member.
EDS elemental mapping was performed to determine the boundaries of the diffusion zones near the two-phase end-member (zone #9) as shown in Figure 3. These maps proved that the observed morphology in diffusion couple #1 has planar features with alternating phases and not cracks. The elemental maps of Mg, Nd, and Zn distribution are presented in Figure 3b–d, respectively.
According to EDS elemental mapping, the dark phase in Figure 3a, zones #4 and #5, represent the MgZn2 compound, whereas the bright dendrites represent the ternary and the Nd-containing binary phases. These phases are Nd2Zn17 in zone #4 and as τ1 in zone #5. Zones #6 and #7 are τ1 and τ3 ternary compounds. Zone #8 is the (Mg3Nd) ternary solid solution. These results were confirmed by WDS analysis, as listed in Table 1.
It is usually difficult to locate the original interface between the two end-members after diffusion takes place. However, knowing the location of the original interface provides information regarding atomic flux leading to diffusion layer formation [18]. The original interface of diffusion couple #1 was determined at the contacting interface between zones #2 and #3, as shown in Figure 2c. This means that the diffusion reaction took place based on Mg and Zn atom, exchange with less mobility for Nd atoms. As a result, a very wide matrix containing Mg2Zn11 in zone #3, and MgZn2 in zones #4 and #5, are formed, and the Nd-containing phases, the bright dendrites in Figure 2a, appeared within this matrix. Similar morphologies were observed at 300 °C in the Ce-Mg-Zn system studied by our research group [19]. The reason for having such periodic layer morphology could be due to the difference between the atomic sizes of Mg/Zn atoms that leads to lattice distortion, which imposes mechanical stresses that break the ternary compound layers. The atomic radius of Zn is about 133 pm, which is relatively smaller than the atomic radius of Mg (160 pm) [20]. Also, when a diffusion couple consists of species with very different mobilities, various phases are grown at different growth rates. Therefore, the slowly growing phase will be under tension as the other phase grows rapidly, and it finally splits off from the reaction front [21]. In this work, the mobility of Zn atoms is expected to be higher than that of Nd. Thus, the very mobile Zn atoms diffuse into the Mg-Nd end-member, leading to the formation of a Mg-Zn matrix and Mg-Nd-Zn ternary compounds.

Figure 2.
(a–c) SEM micrographs of diffusion couple #1 annealed at 300 °C for 21 days. The numbers represent the diffusion zones and correspond to those in Table 1 and Figure 4; (d) is the SEM micrograph of MgNd+Mg3Nd end-member.
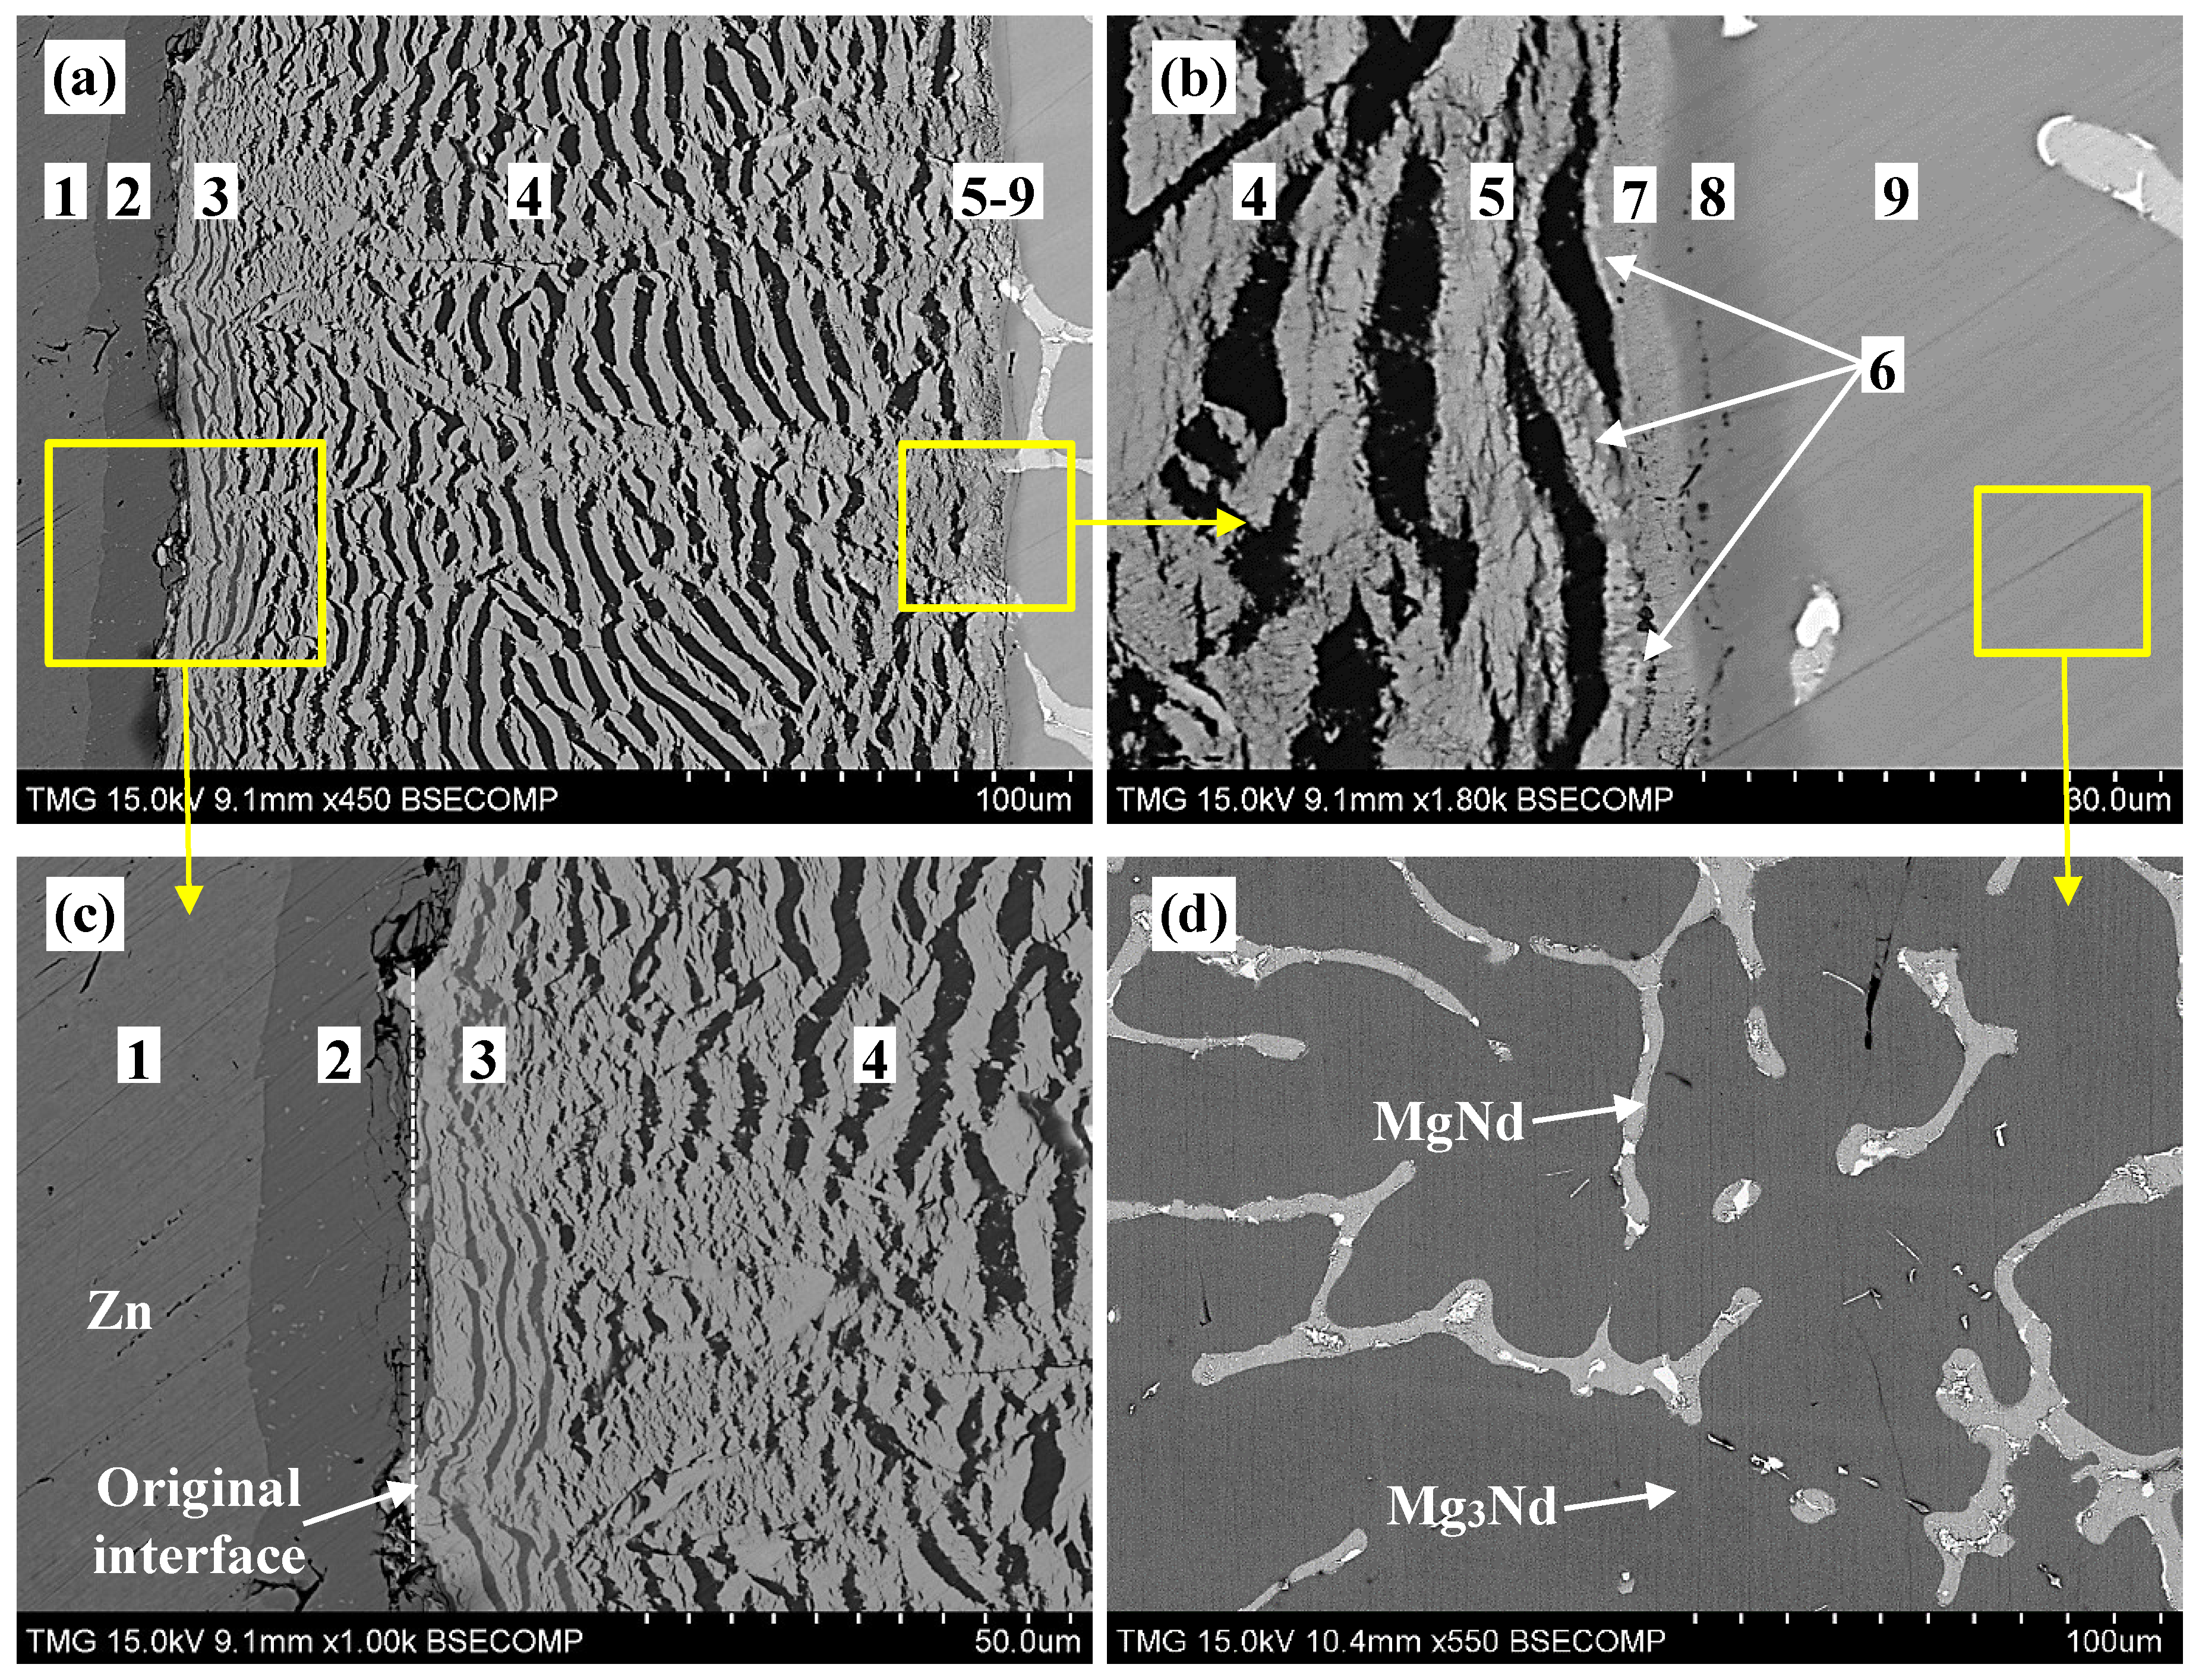

Table 1.
WDS spot analysis of different diffusion zones of the diffusion couple #1.
| Zone | Description | Composition (atom %) | Corresponding Phase | ||
|---|---|---|---|---|---|
| Mg | Nd | Zn | |||
| 1 | Pure Zn (end-member) | - | - | 100 | Zn |
| 2 | Single-phase layer | 15.4 | - | 84.6 | Mg2Zn11 |
| 3 | Two-phase layer | 10.8 | 1.9 | 87.3 | (Nd2Zn17) |
| 14.7 | 85.3 | - | Mg2Zn11 | ||
| 4 | Two-phase layer | 2.0 | 8.9 | 89.1 | (Nd2Zn17) |
| 32.5 | 0 | 67.5 | MgZn2 | ||
| 5 | Two-phase layer | 6.5 | 29.5 | 64 | τ1 |
| 32.1 | - | 67.9 | MgZn2 | ||
| 6 | Single-phase layer | 14.5 | 14.7 | 71.8 | τ2 |
| 7 | Single-phase layer | 25.0–31.5 | 24.5 | 44.0–51.5 | τ3 |
| 8 | Single-phase layer | 51.2–75.0 | 24.6 | 0–24.2 | (Mg3Nd) |
| 9 | Two-phase alloy | 74.8 | 25.2 | - | Mg3Nd |
| (end-member) | 50.0 | 50.0 | - | MgNd | |
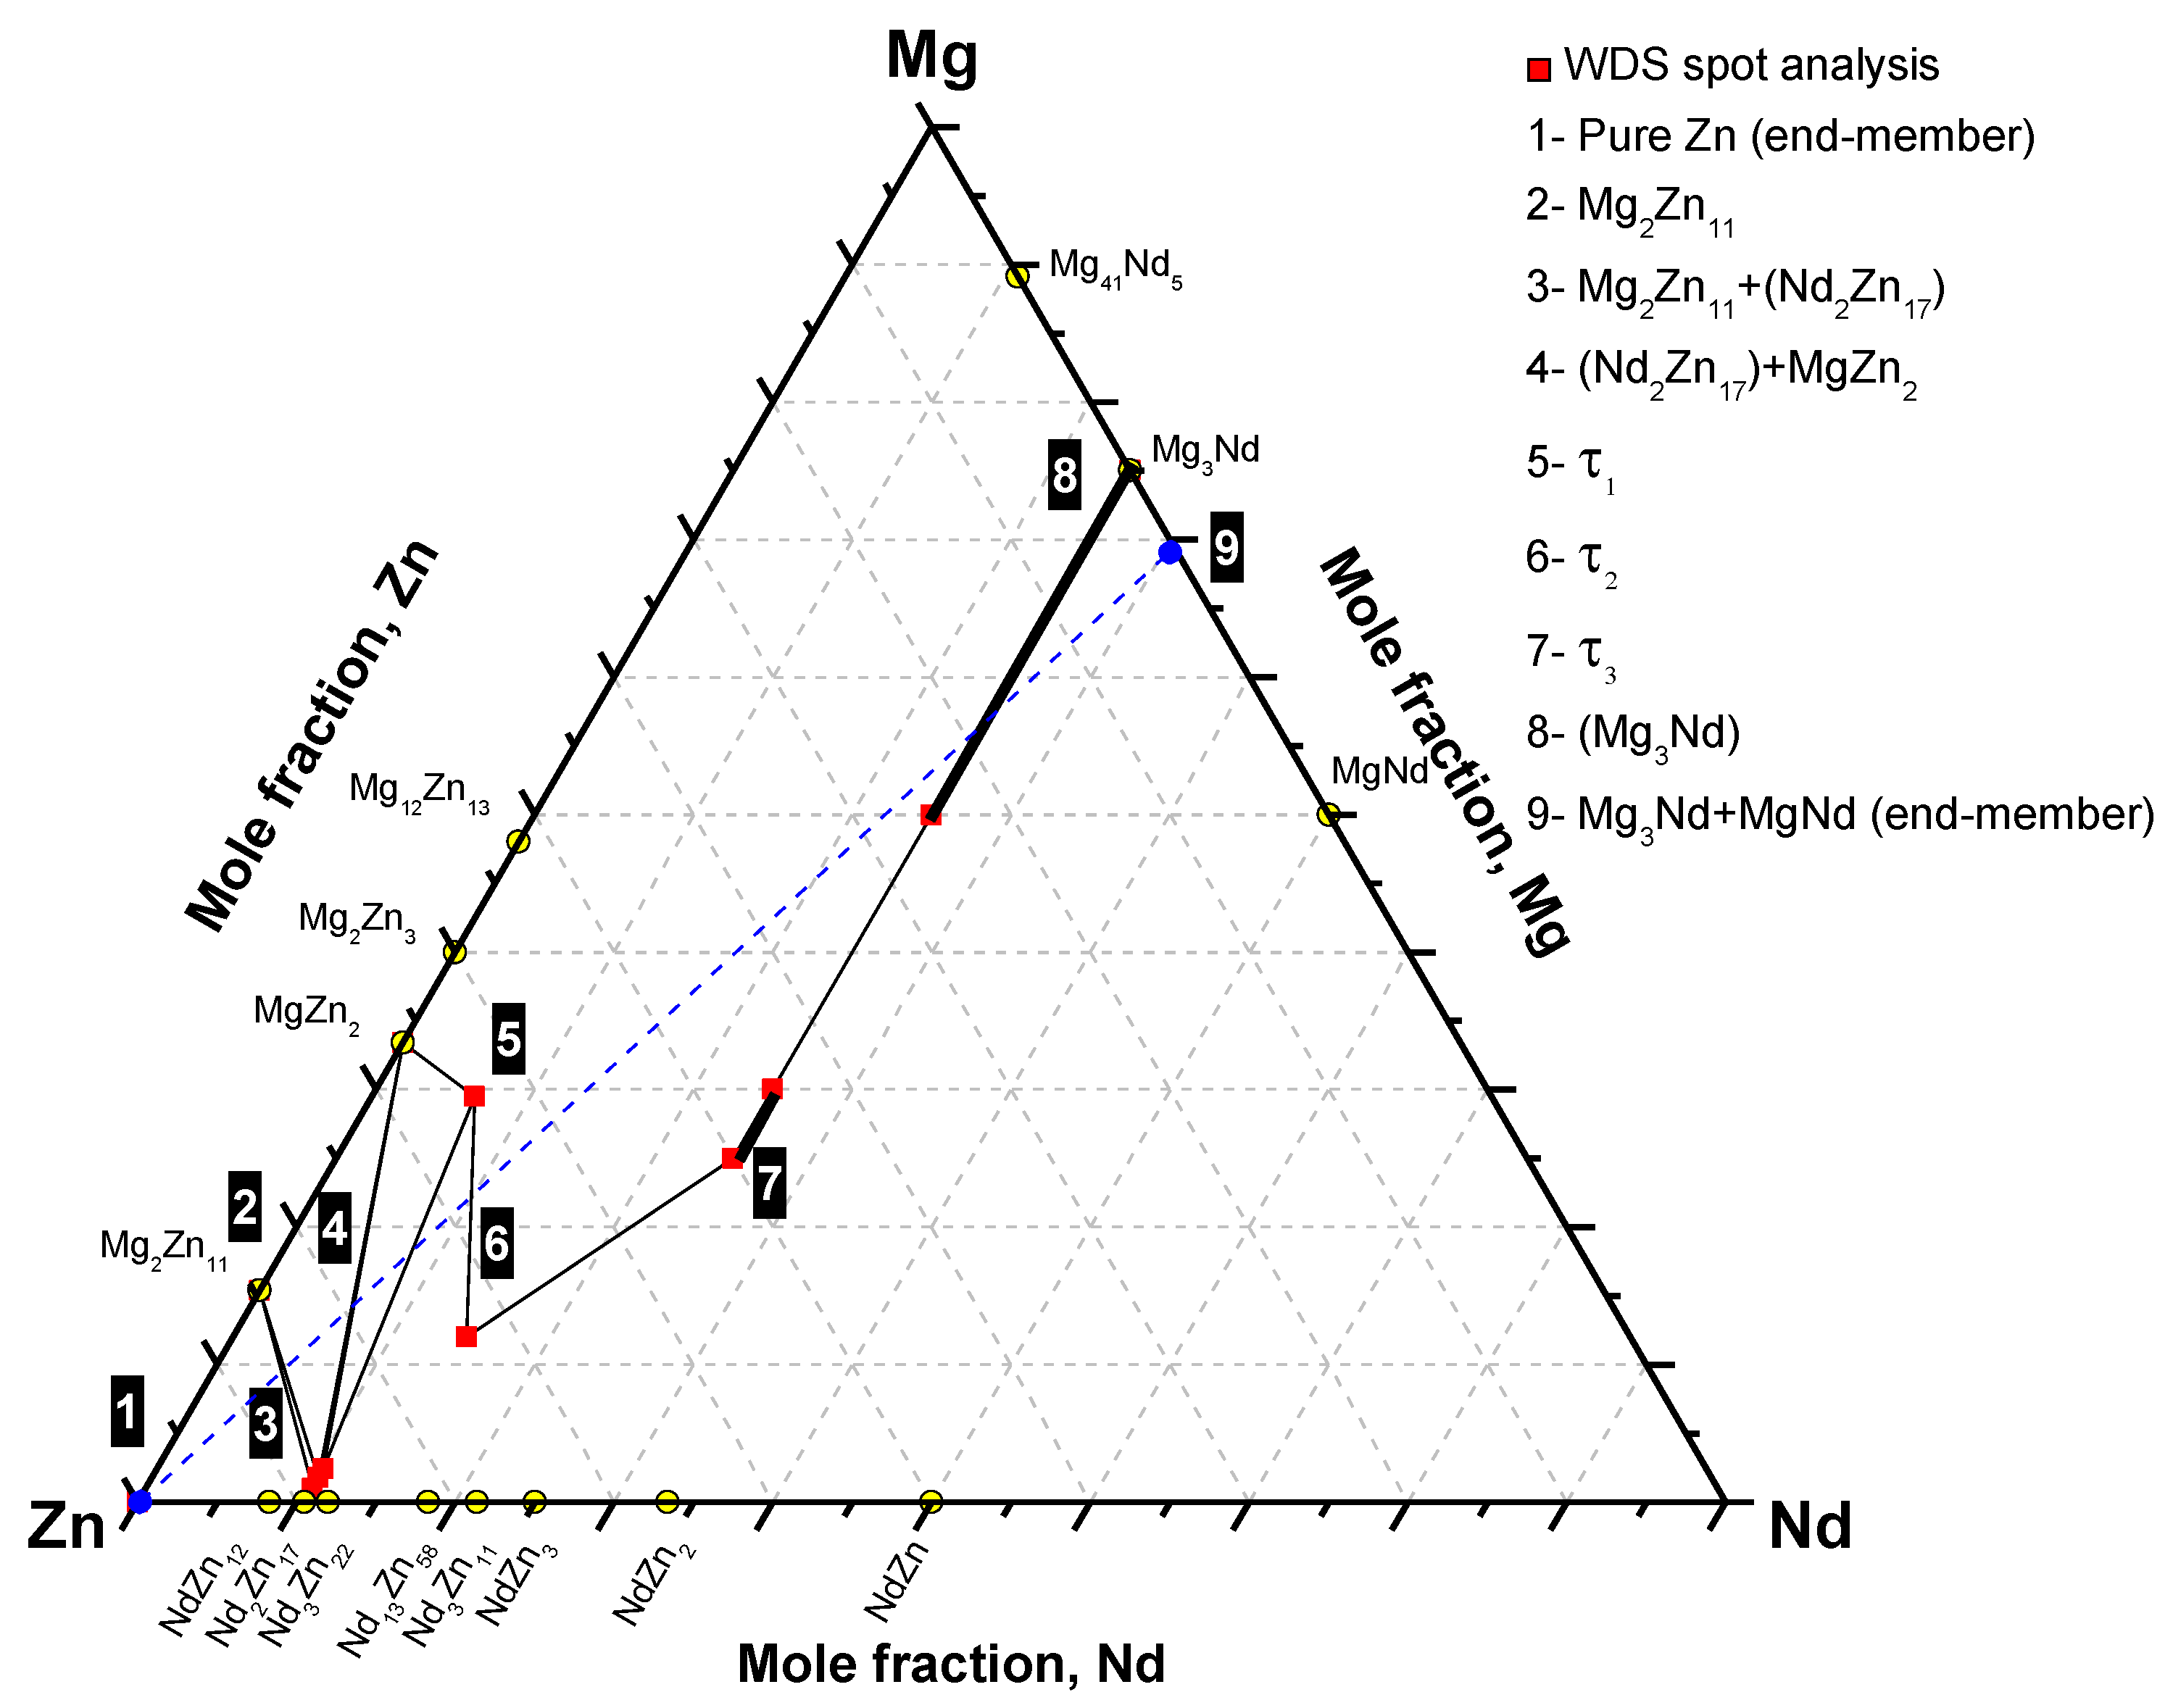
Based on the phase equilibria determined from diffusion couple #1, the phase equilibrium and diffusion path can be depicted as follows: pure Zn (end-member)/Mg2Zn11/Mg2Zn11+(Nd2Zn17)/(Nd2Zn17)+MgZn2+Mg2Zn11/(Nd2Zn17)+MgZn2/MgZn2+(Nd2Zn17)+τ1/MgZn2+τ1/τ2/τ3/(Mg3Nd)/Mg3Nd+MgNd (end-member). Accordingly, the phase relations can be represented graphically, as shown in Figure 4. The two end-members are connected by a dashed line. The numbered boxes represent the corresponding diffusion zones in Figure 2 and Table 1.
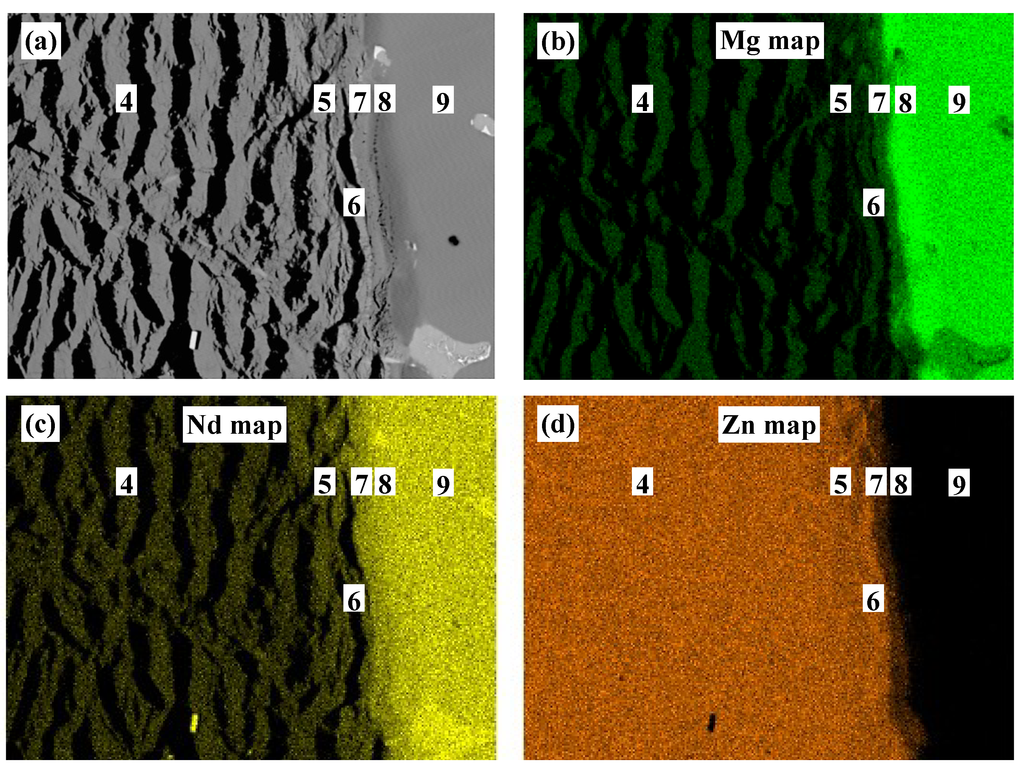
Figure 3.
(a) SEM micrograph of diffusion couple #1 near zones #4–8; (b–d) EDS elemental maps for the elements Mg, Nd, and Zn, respectively. Readers are encouraged to see the online version for the colored maps.
Figure 3.
(a) SEM micrograph of diffusion couple #1 near zones #4–8; (b–d) EDS elemental maps for the elements Mg, Nd, and Zn, respectively. Readers are encouraged to see the online version for the colored maps.

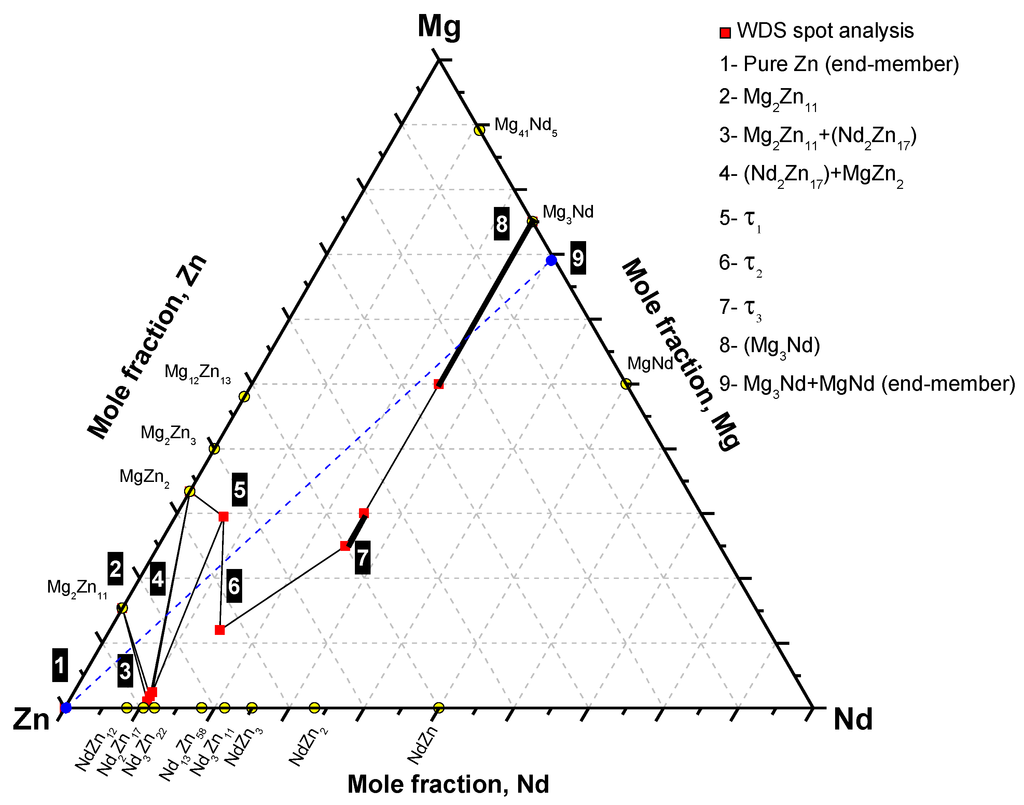
Figure 4.
The phase equilibria depicted from diffusion couple #1.
Figure 4.
The phase equilibria depicted from diffusion couple #1.
SEM micrographs of diffusion couple #2, annealed at 300 °C for 40 days, are shown in Figure 5a,b. A long annealing time (40 days) was required, because no successful diffusion occurred when a shorter annealing time (21 days) was used. This can be attributed to the composition of the end-members, because the diffusion process is governed by the affinity of different species to one another. For instance, the affinity of Nd to Zn is reduced in the presence of Mg. This can be attributed to the high diffusivity of Mg in both Zn and Nd [22]. Evidence can be seen in the thickness of diffusion zones in diffusion couple #1, where very wide diffusion layers of Mg-Zn compounds were formed at 300 °C within 21 days only.
Both end-members of diffusion couple #2 were composed of two-phase binary alloys. The actual composition of the first end-member, Figure 5c, is 63Mg-37Zn atom % and it contains Mg12Zn13 and (α-Mg)Zn. The actual composition of the second end-member, Figure 5d, is 55Mg-45Nd atom % and it contains Mg3Nd and MgNd. WDS spot analysis, summarized in Table 2, was used to determine the composition of the diffusion zones and their constituents. A WDS line-scan, shown in Figure 6, was performed across the diffusion zones of diffusion couple #2. The original interface location was determined at the junction between zones #2 and #3, as indicated in Figure 5a,b.
Based on WDS spot analysis and line-scan, seven diffusion zones were determined. Diffusion zones #1 and #7 are the end-members. The SEM micrographs and WDS results revealed that the other diffusion zones are single-phase layers, unlike diffusion couple #1, where most of the layers contained two phases. Zone #2 is the Mg40Nd5Zn55 ternary compound (denoted as τ4 in this work), that conforms with that reported by [15,16]. Diffusion zones #3–6 represent single-phase diffusion layers as follows: τ1, Mg2NdZn4 (denoted as τ5 in this work), τ3, and Nd(Mg,Zn), respectively.

Figure 5.
(a) A SEM micrograph of diffusion couple #2 annealed at 300 °C for 40 days; (b) the colored version of the same diffusion couple (readers are encouraged to see the online version for the colored image); (c) is the (α-Mg)Zn+Mg12Zn13 end-member; and (d) is the MgNd+Mg3Nd end-member. The numbers represent the diffusion zones and correspond to those in Table 2 and Figure 7.
From the WDS results in Figure 6 and Table 2, τ1 was recognized as a ternary solid solution extending from 26.6 to 29.5 atom % Mg at 6.5 atom % Nd, τ3 extended from 24.6 to 38.0 atom % Mg at 25.0 atom % Nd, and Nd(Mg,Zn) extended from 43.3 to 48.1 atom % Mg at 50.0 atom % Nd. Diffusion couples do not provide the solubility limits very accurately. However, they are useful in detecting whether solubility exists or not. The exact solubility limits can be obtained using equilibrated key alloys. Besides, diffusion zones #4 and #6 are relatively thinner than other zones, which can lead to large errors in WDS results. Therefore, the composition of the corresponding compounds must be confirmed by the key alloys method.
The SEM micrograph in Figure 5a and the colored version in Figure 5b showed that (α-Mg)Zn and Mg12Zn13 are in equilibrium with τ4 from one side, and τ4 is in equilibrium with τ1 from the other side of the original interface of diffusion couple #2. Based on the phase equilibria determined from diffusion couple #2, the diffusion path can be depicted as follows: α-Mg+Mg12Nd13 (end-member)/τ4/τ1/τ5/τ3/(Mg3Nd)/Nd(Mg,Zn)/Mg3Nd+MgNd (end-member). Accordingly, the phase relations can be represented graphically as shown in Figure 7. The two end-members are connected by a dashed line.
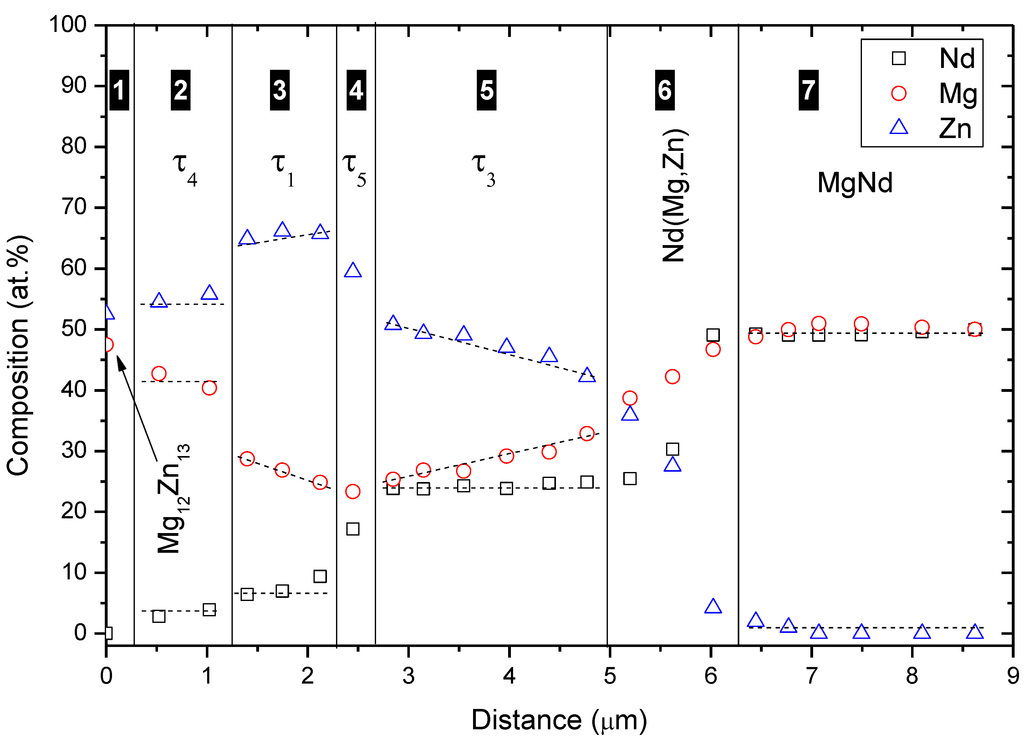
Figure 6.
WDS line-scan across diffusion couple #2.
Figure 6.
WDS line-scan across diffusion couple #2.
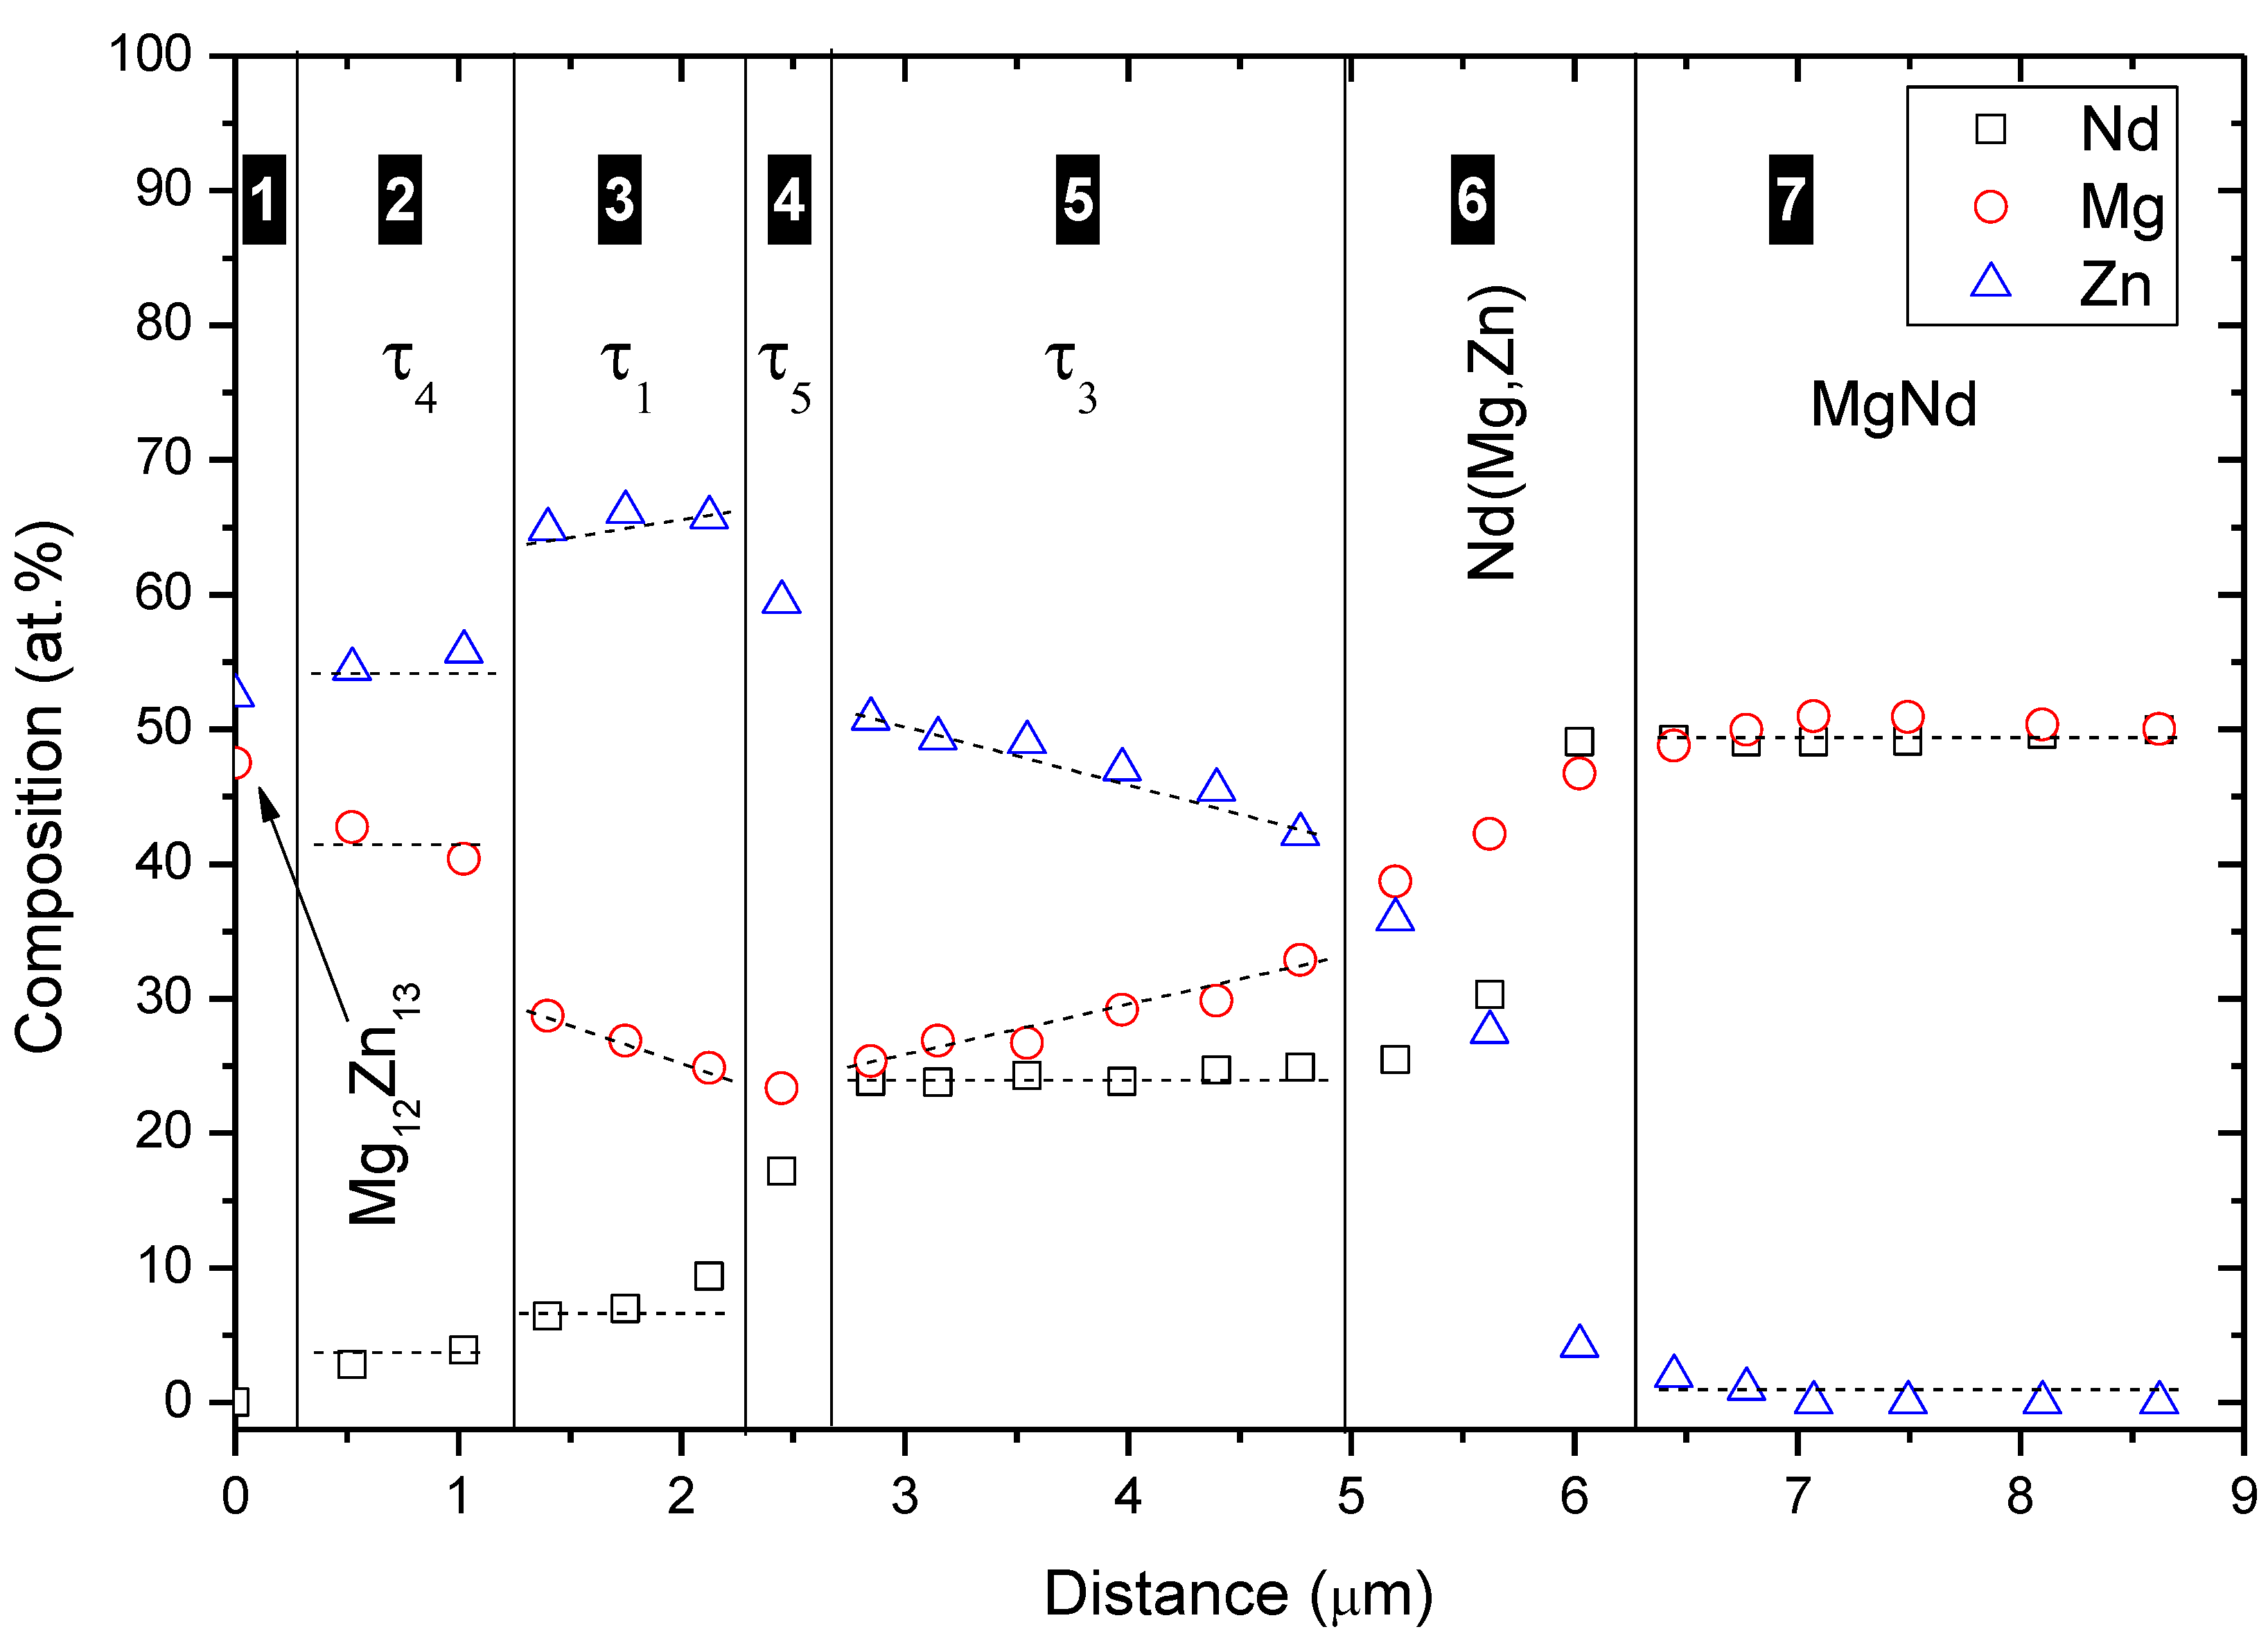
Table 2.
WDS spot analysis of diffusion zones of diffusion couple #2.
| Zone | Description | Composition (atom %) | Corresponding Phase | ||
|---|---|---|---|---|---|
| Mg | Nd | Zn | |||
| 1 | Two-phase alloy | 95.6 | - | 4.4 | (α-Mg)Zn |
| (end-member) | 47.3 | - | 52.7 | Mg12Zn13 | |
| 2 | Single-phase layer | 45.6 | 1.8 | 52.6 | τ4 |
| 3 | Single-phase layer | 26.6–29.5 | 6.5 | 64.0–66.9 | τ1 |
| 4 | Single-phase layer | 28.8 | 13.1 | 58.1 | τ5 |
| 5 | Single-phase layer | 24.6–38.0 | 25.0 | 37.0–50.4 | τ3 |
| 6 | Single-phase layer | 43.3–48.1 | 50.0 | 1.9–6.7 | Nd(Mg,Zn) |
| 7 | End-member | 50.0 | 50.0 | - | MgNd |
Figure 7 shows that the diffusion path is mainly passing across the lower side of the line connecting the two end-members. However, the mass balance principle must be taken into account in any diffusion couple. To understand the mass balance in this diffusion couple, the diffusion reaction starting from zone #7 to zone #1 can be described as follows. In the case of binary diffusion couples, the growth of diffusion layers is sequential rather than simultaneous [23]. However, the case could be different for ternary diffusion couples. Due to the presence of more than two species having different mobilities, layers can form simultaneously. For instance, if two of the diffusing species react to form a binary compound, the third element could be simultaneously consumed adjacent to the interface to form another layer. Evidence could be observed through the layers around the original interface, where the less mobile Nd atoms form τ4 on one side, and the Zn atoms with high mobility form many layers on the other side. More specifically, Nd(Mg,Zn) firstly formed adjacent to MgNd (from zone #7) by dissolving diffusing Zn form zone #1. Simultaneously, Zn depletion from Mg12Zn13 produced a layer of τ4, with low Nd concentration, in zone #2. The concentration of Zn increased gradually with the decrease in Mg and Nd concentrations, starting from zone #6 until the interface between zones #2 and #3, as illustrated in Figure 6. As a result, the diffusion path, in Figure 7, was pulled down towards the Zn-rich side. This could be due to the mobility of Zn atoms. In zone #3, there is Zn/Mg exchange at around 6.5 atom % Nd to form τ1. At the end of zone #3, the diffusion path changed its direction towards the Mg-Zn side.
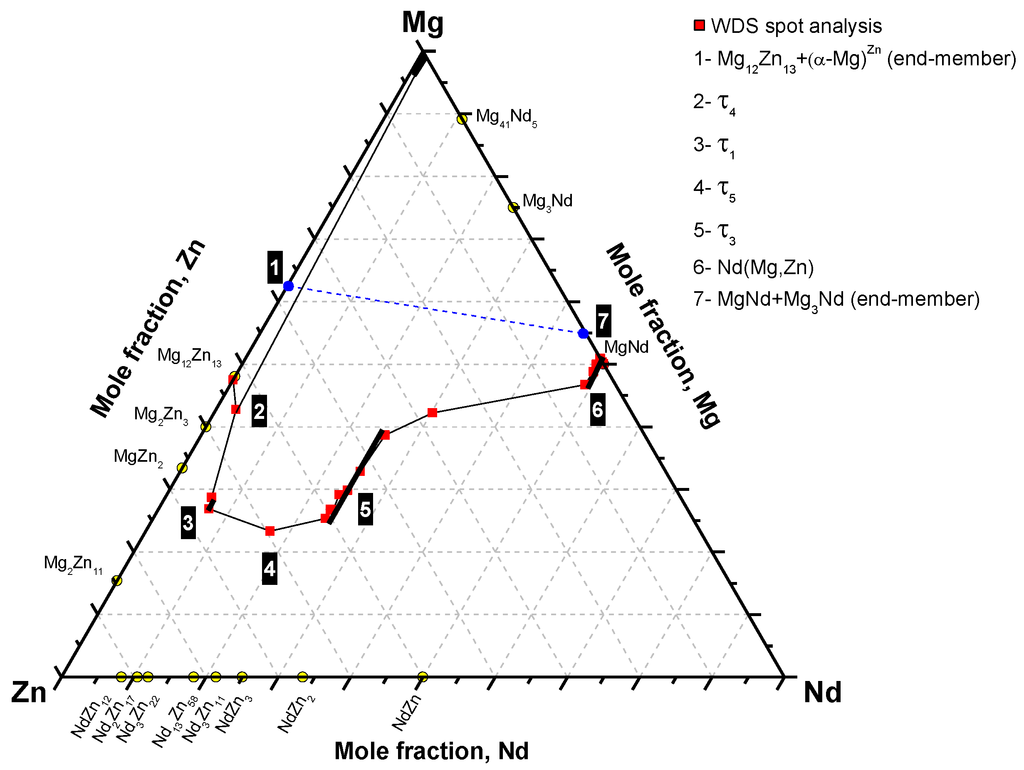
Figure 7.
The phase equilibria depicted from diffusion couple #2.
Figure 7.
The phase equilibria depicted from diffusion couple #2.
Diffusion couple experiments revealed the existence of five ternary compounds in the system at 300 °C. These are: τ1 (Mg7NdZn12), τ2 (Mg2Nd2Zn9), τ3 (MgNdZn2), τ4 (Mg40Nd5Zn55), and τ5 (Mg2NdZn4). The preliminary results obtained from this work showed that (α-Mg)Zn is in equilibrium with Mg12Zn13, τ1, and τ4. Also, the ternary compounds τ1 and τ3 were recognized with extended solid solubility. However, these results must be confirmed using equilibrated key alloys. The combined results of diffusion couples and key alloys improve the accuracy of the obtained phase equilibrium information. In the following section, the results obtained from equilibrated key alloys are discussed.
3.2. Equilibrated Key Alloys
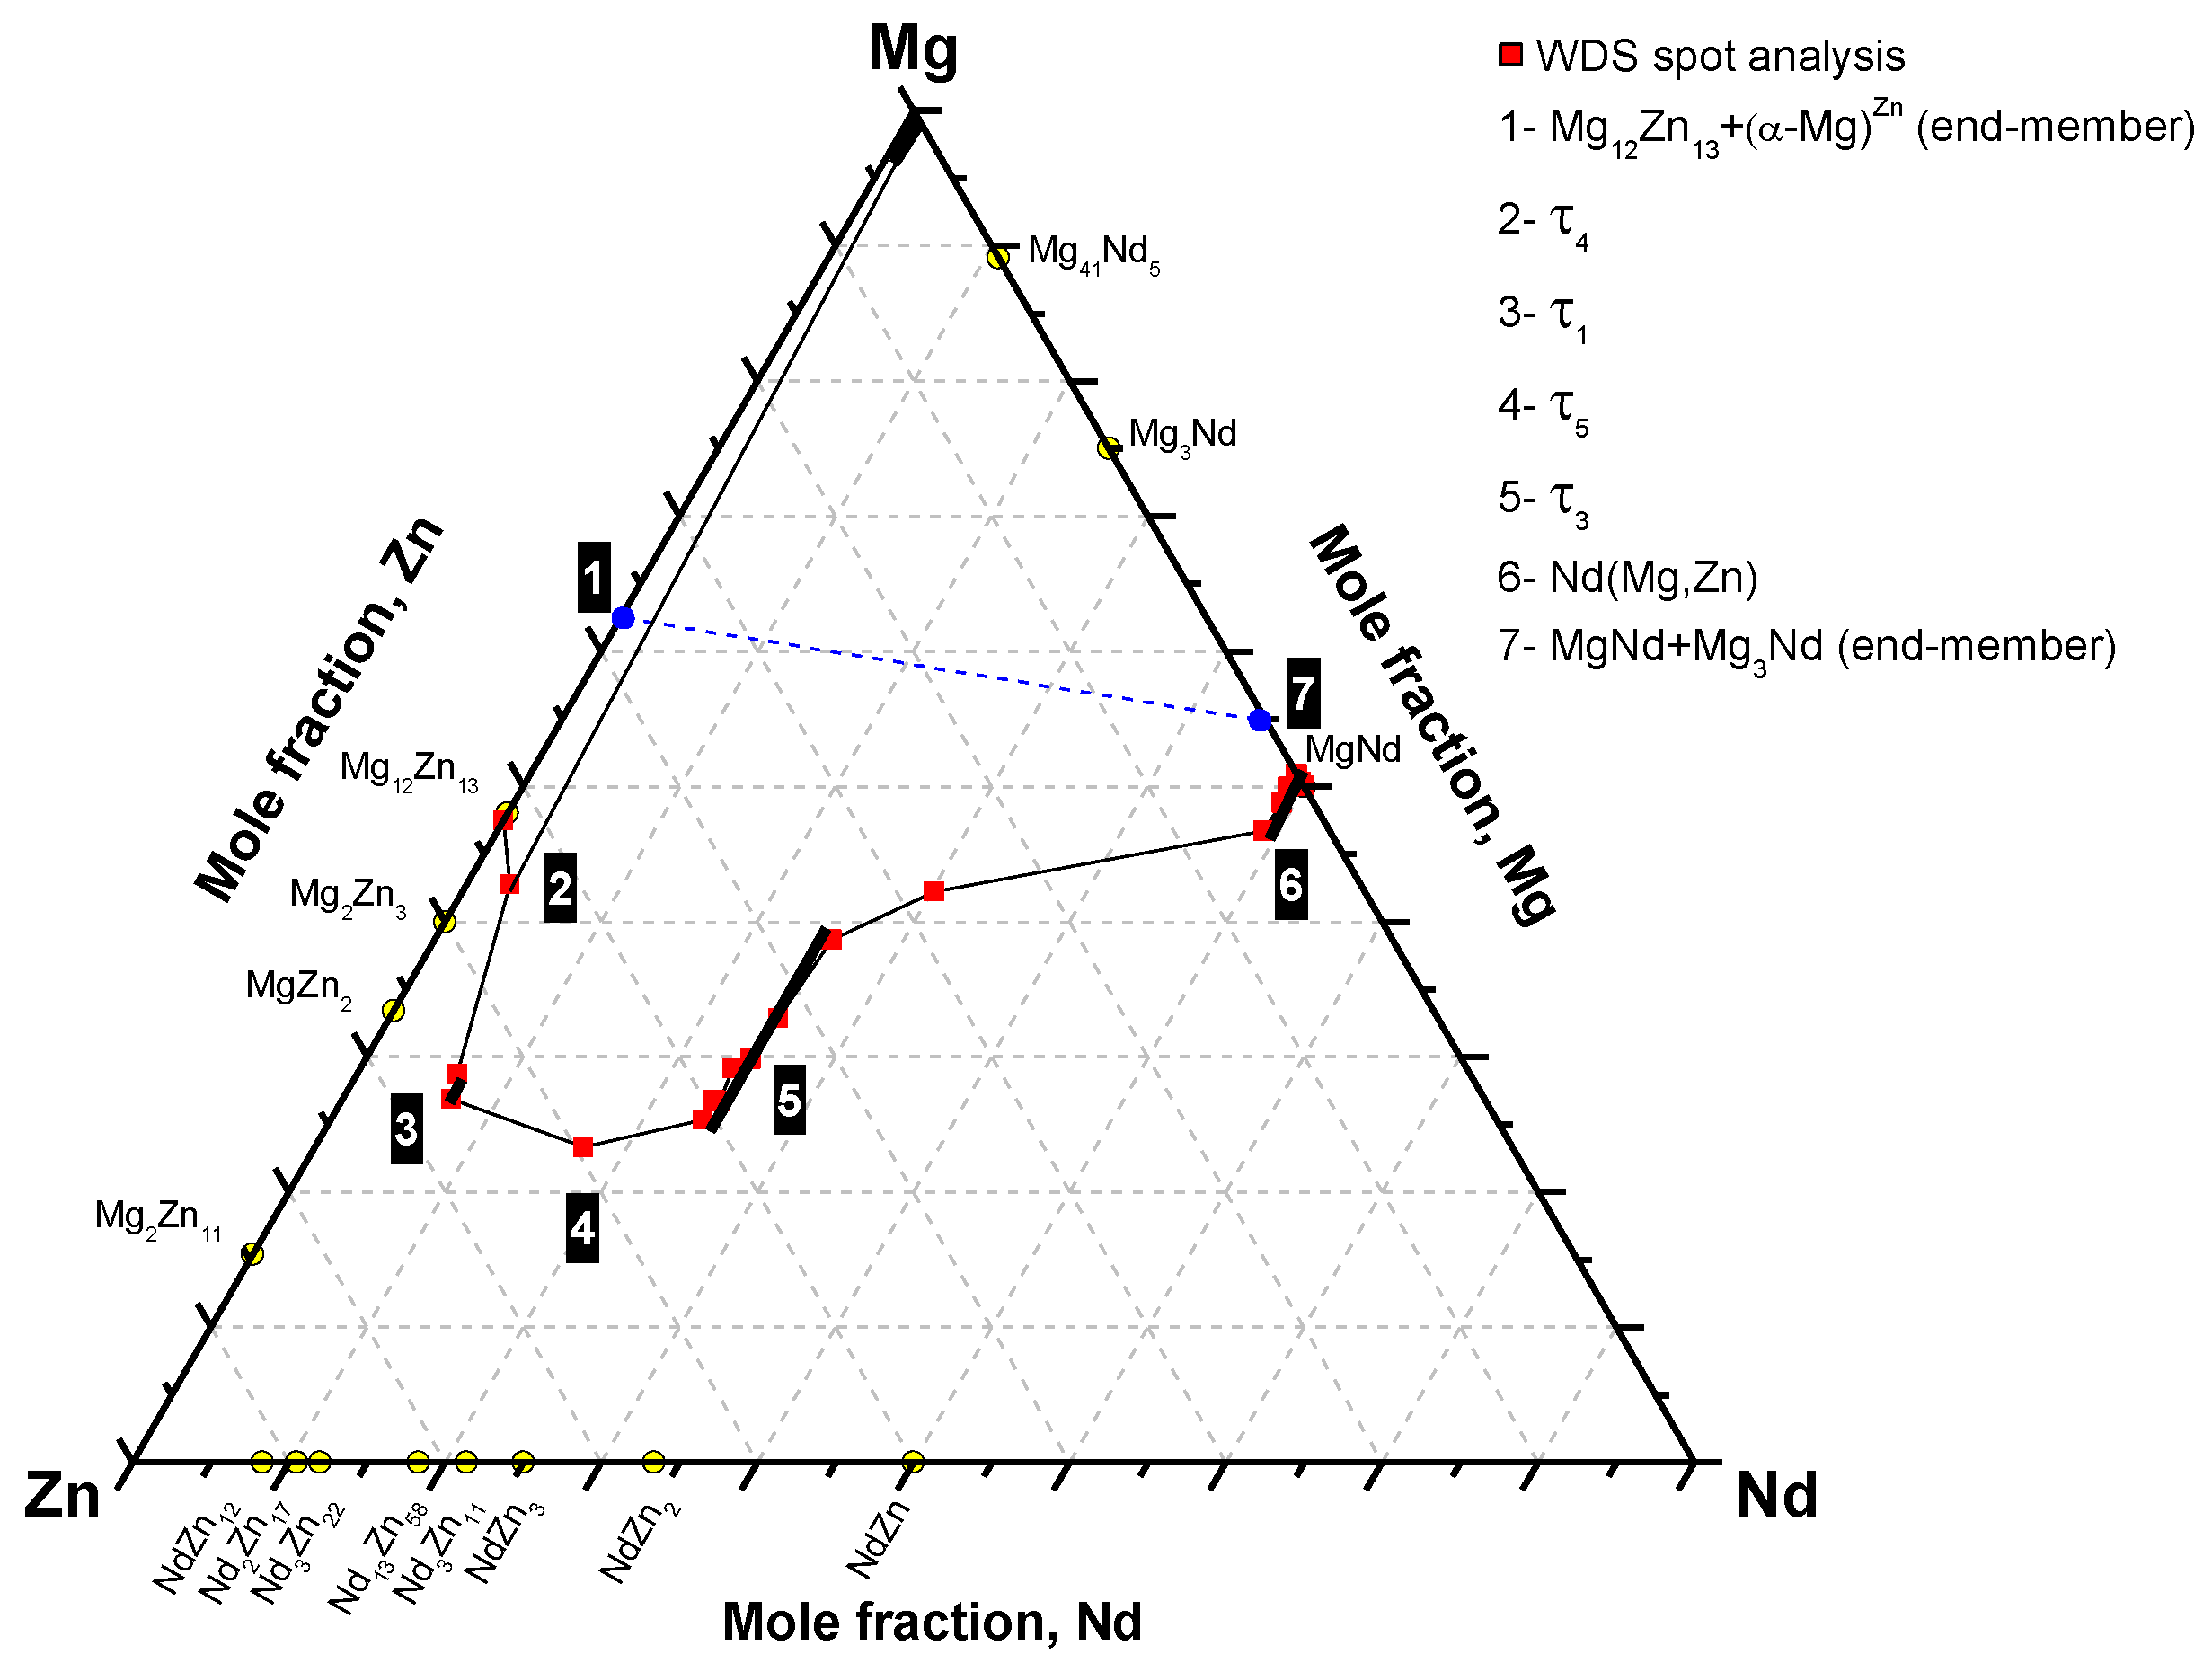
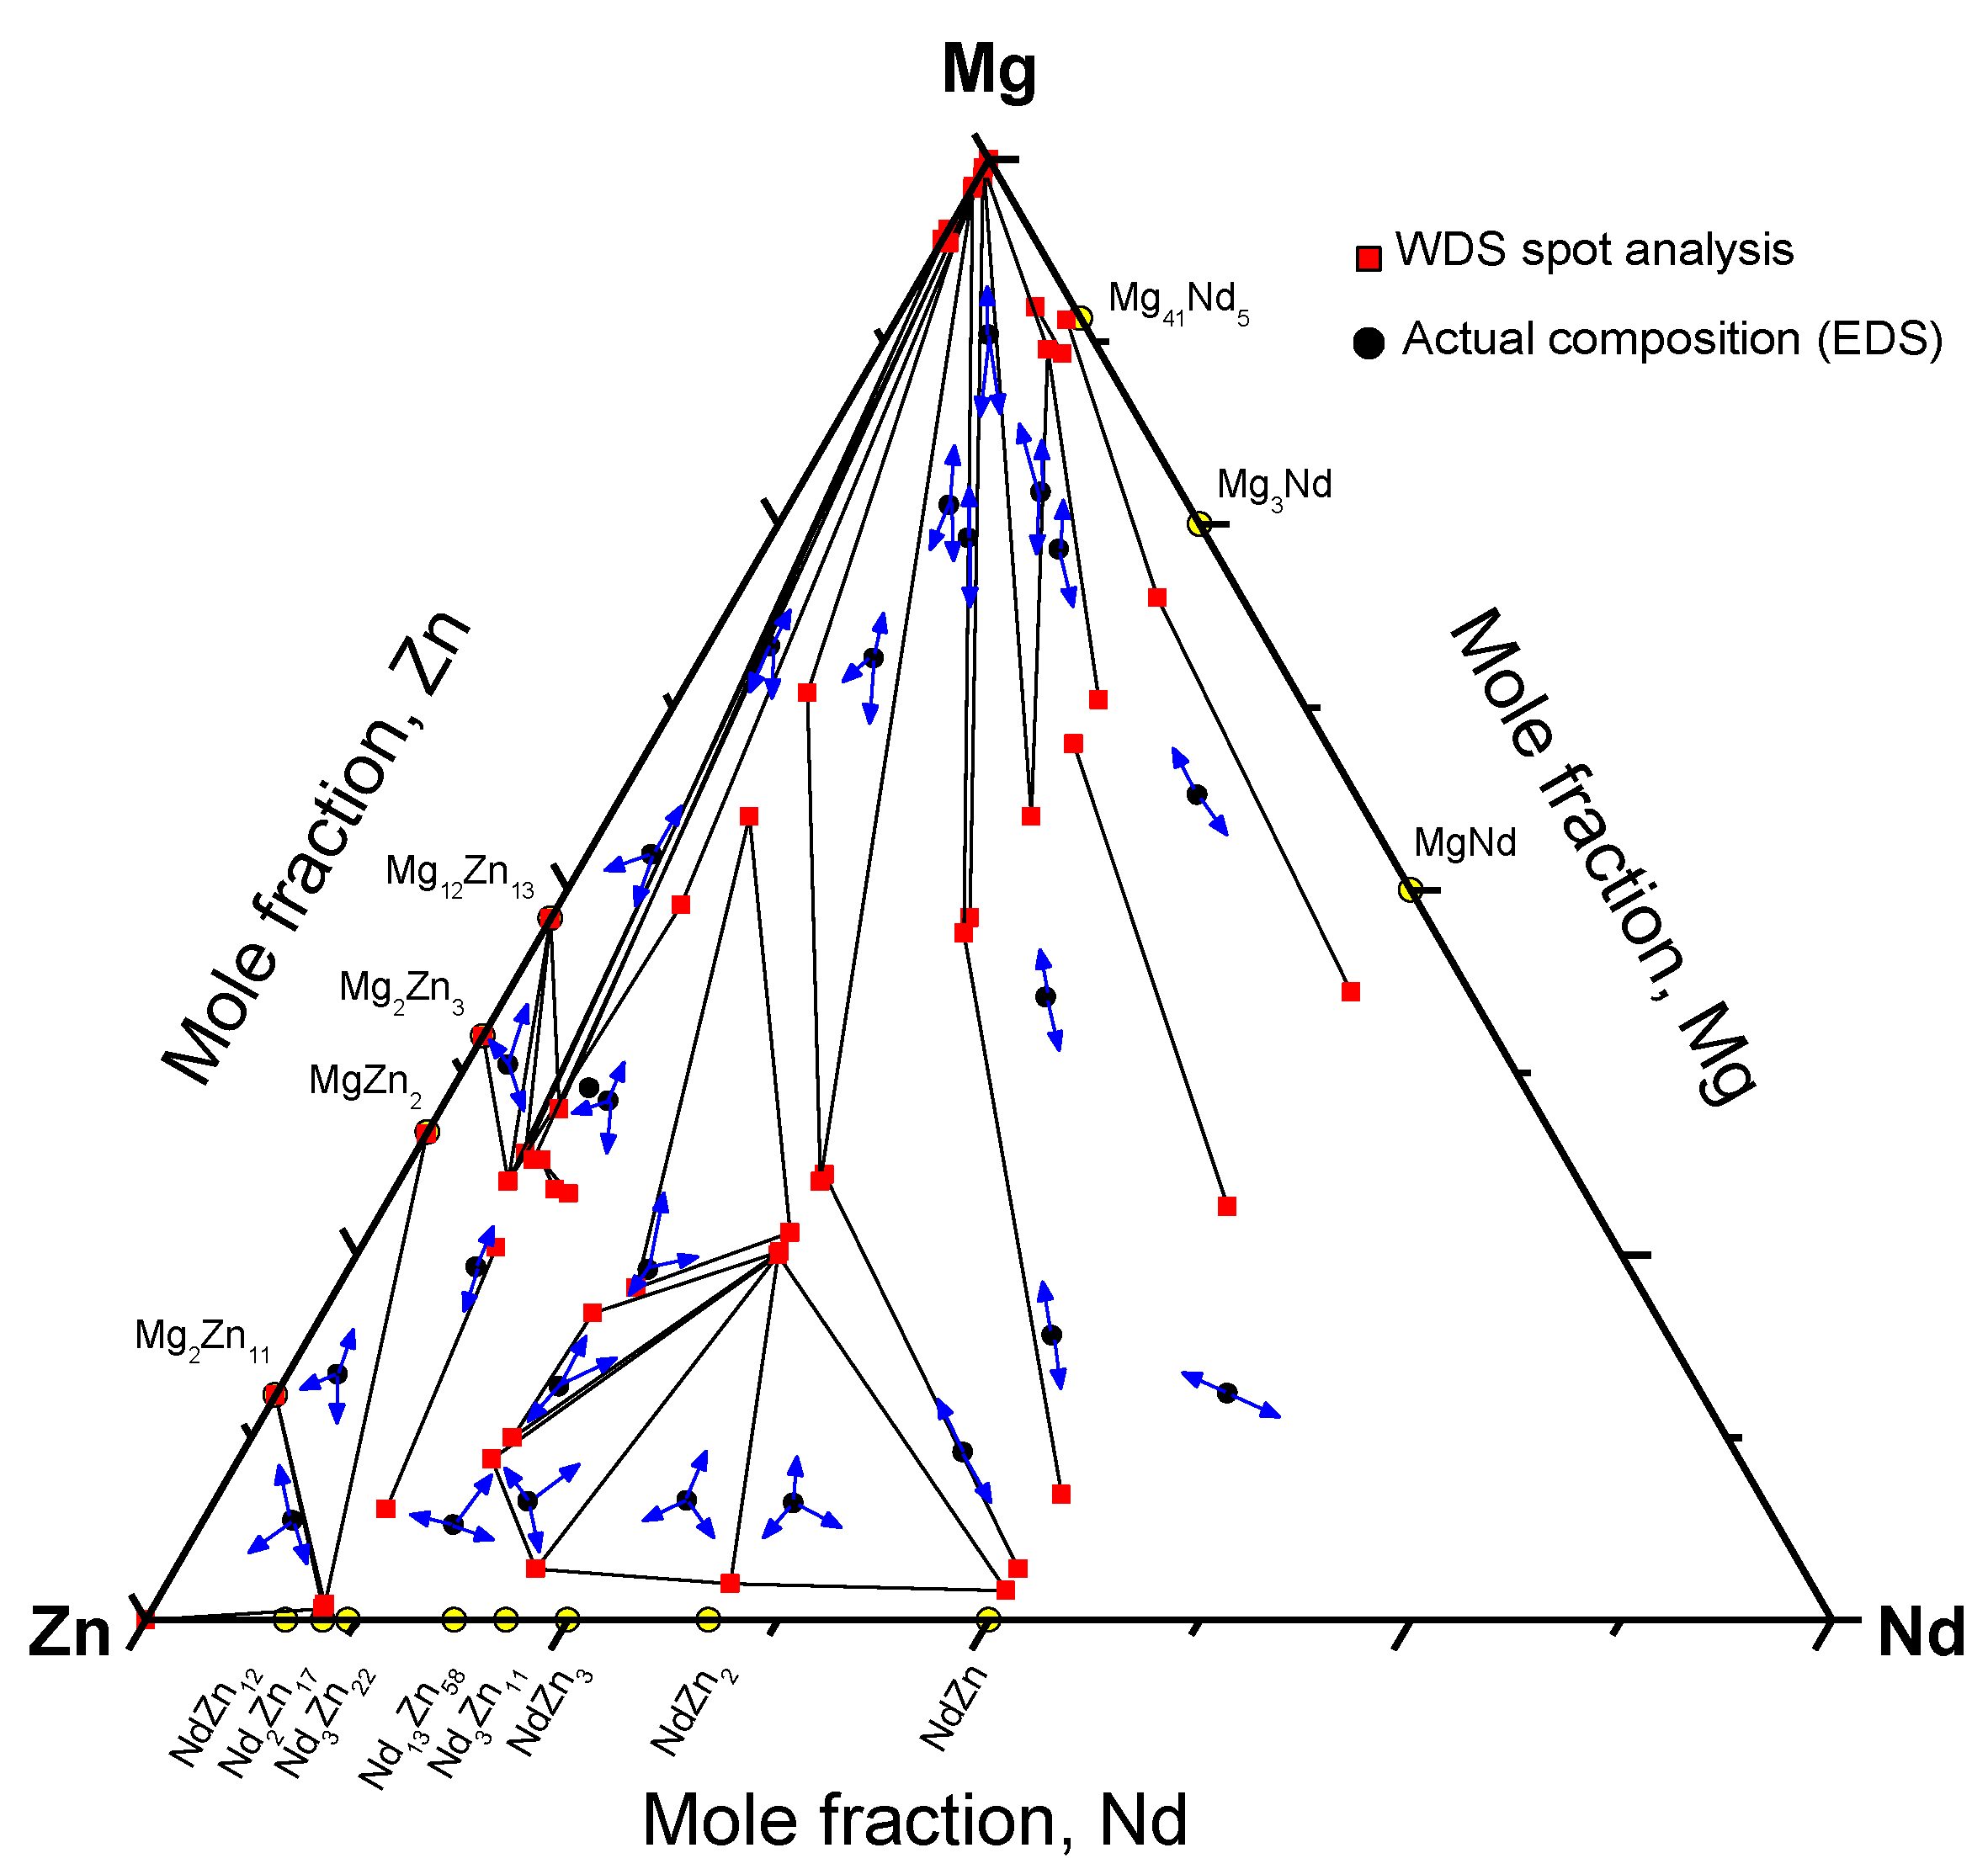
Twenty-five equilibrated key alloys, selected at different compositions of the Mg-Nd-Zn system, were annealed at different time intervals. Figure 8 shows the distribution of the selected key alloys based on their actual composition obtained by SEM/EDS area analysis.
Because annealing was performed at 300 °C, a long time was required to achieve the equilibrium structure. For some compositions, annealing for about 45 days was not sufficient to homogenize the structure. In such cases, the equilibrium was inferred by comparing the as-cast microstructures and XRD patterns with the annealed ones. Table 3 and Table 4 list the experimental results obtained from equilibrated key alloys containing three-phase and two-phase equilibria, respectively. The question marks in the XRD results in Table 3 denote that the crystal structure of the compound is unknown. The crystal structure of τ1 was taken from [14] and of τ3 and τ6 was taken from [1].
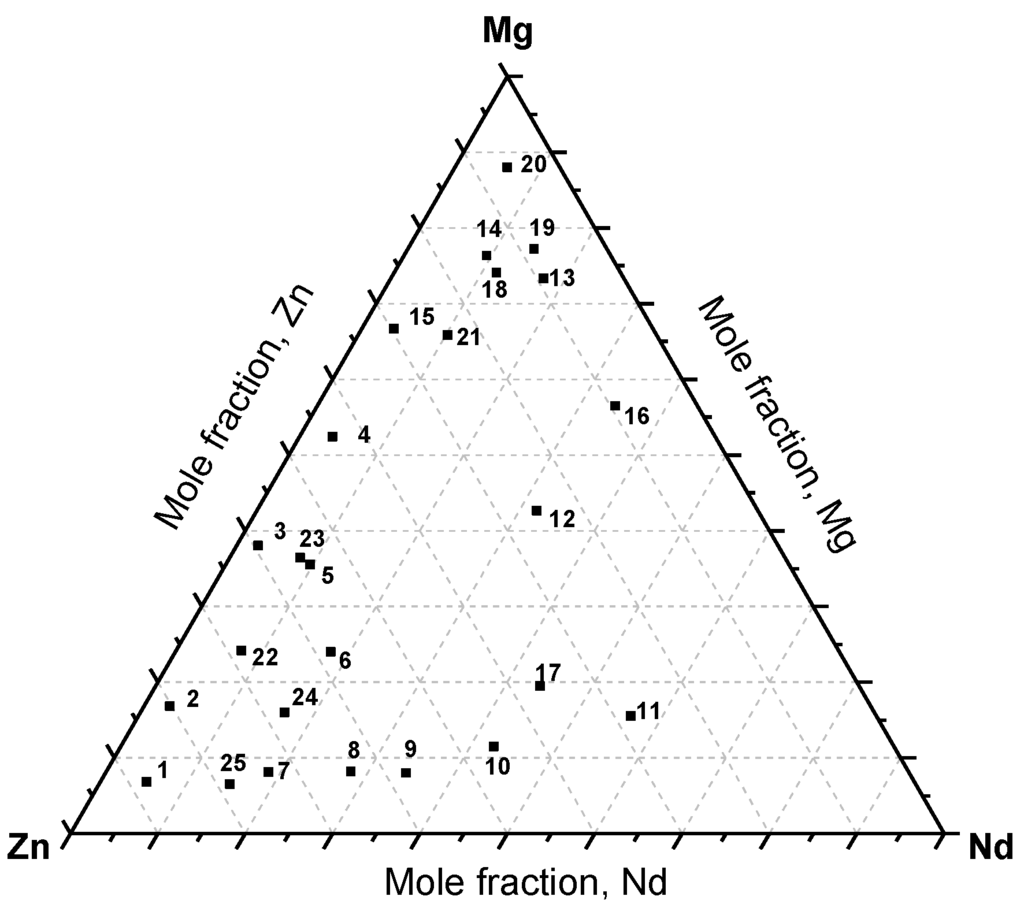
Figure 8.
The actual composition of the Mg-Nd-Zn key alloys.
Figure 8.
The actual composition of the Mg-Nd-Zn key alloys.

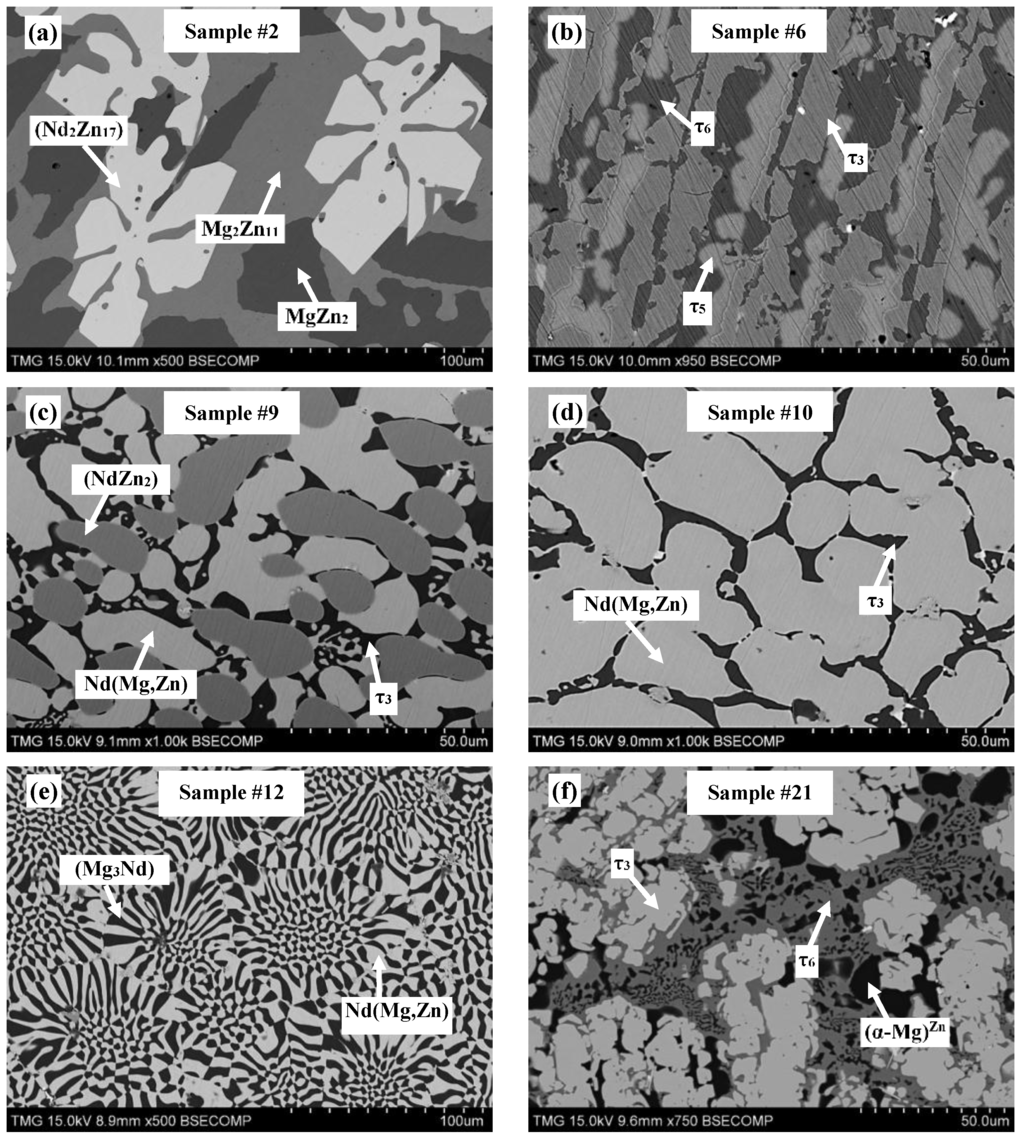
Figure 9.
SEM micrographs of alloys annealed at 300 °C selected from different regions in the Mg-Nd-Zn system: (a) sample #2, (b) sample #6, (c) sample #9, (d) sample #10, (e) sample #12, and (f) sample #21.
Figure 9.
SEM micrographs of alloys annealed at 300 °C selected from different regions in the Mg-Nd-Zn system: (a) sample #2, (b) sample #6, (c) sample #9, (d) sample #10, (e) sample #12, and (f) sample #21.

Table 3.
Actual composition of key alloys containing three-phase equilibria and their experimental results.
| Sample | Actual alloy Composition (atom %) | Phase Identification XRD | Phase Composition (atom %) | Corresponding Phase | ||||
|---|---|---|---|---|---|---|---|---|
| Mg | Nd | Zn | Mg | Nd | Zn | |||
| 1 | 6.8 | 5.3 | 87.9 | Zn | - | - | 100.0 | Zn |
| Mg2Zn11 | 15.4 | - | 84.6 | Mg2Zn11 | ||||
| (Nd2Zn17) | <1.0 | 10.1 | 89.1 | (Nd2Zn17) | ||||
| 2 | 16.8 | 3 | 80.2 | Mg2Zn11 | 15.4 | - | 84.6 | Mg2Zn11 |
| MgZn2 | 33.3 | - | 66.7 | MgZn2 | ||||
| (Nd2Zn17) | 1.1 | 10.1 | 88.9 | (Nd2Zn17) | ||||
| 3 | 38.0 | 2.5 | 59.5 | Mg12Zn13 | 48.0 | - | 58.0 | Mg12Zn13 |
| Mg2Zn3 | 40.0 | - | 60.0 | Mg2Zn3 | ||||
| τ1 | 32.0 | 7.0 | 61.0 | τ1 | ||||
| 4 | 52.4 | 3.8 | 43.8 | (α-Mg)Zn | 95.2 | - | 4.8 | (α-Mg)Zn |
| 15 | 66.7 | 3.7 | 29.6 | Mg12Zn13 | 48.1 | - | 51.9 | Mg12Zn13 |
| ? | 34.9 | 7.0 | 58.1 | τ1 | ||||
| 5 | 35.5 | 9.7 | 54.8 | (α-Mg)Zn | 95.3 | - | 4.7 | (α-Mg)Zn |
| τ6 | 49.0 | 7.2 | 43.8 | τ6 | ||||
| τ1 | 30.0 | 6.5 | 63.5 | τ1 | ||||
| 6 | 24 | 17.8 | 58.2 | τ6 | 54.8 | 8.3 | 36.9 | τ6 |
| ? | 22.7 | 17.6 | 59.7 | τ5 | ||||
| τ3 | 26.5 | 24.9 | 48.6 | τ3 | ||||
| 7 | 8.12 | 18.6 | 73.28 | (Nd3Zn11) | 3.5 | 21.4 | 75.1 | (Nd3Zn11) |
| τ3 | 25.1 | 25.0 | 49.9 | τ3 | ||||
| ? | 11.0 | 15.0 | 74.0 | τ2 | ||||
| 8 | 8.2 | 28 | 63.8 | (Nd3Zn11) | 3.5 | 21.4 | 75.1 | (Nd3Zn11) |
| (NdZn2) | 2.5 | 33.4 | 64.1 | (NdZn2) | ||||
| τ3 | 26.2 | 25.0 | 48.8 | τ3 | ||||
| 9 | 8.0 | 34.4 | 57.6 | (NdZn2) | 2.5 | 33.4 | 64.1 | (NdZn2) |
| Nd(Mg,Zn) | 2.0 | 50.0 | 48.0 | Nd(Mg,Zn) | ||||
| τ3 | 28.3 | 25.0 | 46.7 | τ3 | ||||
| 20 | 88.0 | 6.0 | 6.0 | (α-Mg)Zn | 99.4 | - | <1.0 | (α-Mg)Zn |
| (Mg41Nd5) | 87.0 | 10.0 | 3.0 | (Mg41Nd5) | ||||
| (Mg3Nd) | 55.0 | 25.0 | 20.0 | (Mg3Nd) | ||||
| 21 | 65.8 | 10.4 | 23.8 | (α-Mg)Zn | 98.2 | - | 1.8 | (α-Mg)Zn |
| τ6 | 63.5 | 7.5 | 29 | τ6 | ||||
| τ3 | 30.0 | 25.0 | 45.0 | τ3 | ||||
| 24 | 16.0 | 16.5 | 67.5 | ? | 21.0 | 16.0 | 63.0 | τ5 |
| τ3 | 25.2 | 25.0 | 49.8 | τ3 | ||||
| ? | 12.5 | 15.5 | 72.0 | τ2 | ||||
“?” is used to indicate unknown crystal structure.
Table 4.
Actual composition of key alloys containing two-phase equilibria and their experimental results.
| Sample Number | Actual alloy Composition (atom %) | Phase Identification XRD | Phase Composition (atom %) | Corresponding Phase | ||||
|---|---|---|---|---|---|---|---|---|
| Mg | Nd | Zn | Mg | Nd | Zn | |||
| 10 | 11.5 | 42.7 | 45.8 | Nd(Mg,Zn) | 3.5 | 50.0 | 46.5 | Nd(Mg,Zn) |
| τ3 | 30.5 | 25.0 | 44.5 | τ3 | ||||
| 11 | 15.5 | 56.4 | 28.1 | Nd(Mg,Zn) | 19.0 | 50.0 | 31.0 | Nd(Mg,Zn) |
| Nd | 100.0 | - | - | Nd | ||||
| 12 | 42.6 | 32.1 | 25.3 | Nd(Mg,Zn) | 28.3 | 50.0 | 21.7 | Nd(Mg,Zn) |
| (Mg3Nd) | 60.0 | 25.0 | 15.0 | (Mg3Nd) | ||||
| 13 | 73.3 | 17.5 | 9.2 | (Mg41Nd5) | 89.0 | 10.1 | <1.0 | (Mg41Nd5) |
| (Mg3Nd) | 70.0 | 25.0 | 5.0 | (Mg3Nd) | ||||
| 14 | 76.3 | 9.5 | 14.2 | (α-Mg)Zn | 98.8 | - | 1.2 | (α-Mg)Zn |
| (Mg3Nd) | 48.1 | 25.0 | 26.9 | (Mg3Nd) | ||||
| 16 | 56.5 | 34.1 | 9.4 | Nd(Mg,Zn) | 43.0 | 50.0 | 7.0 | Nd(Mg,Zn) |
| (Mg3Nd) | 70.0 | 25.0 | 5.0 | (Mg3Nd) | ||||
| 17 | 19.5 | 44 | 36.5 | Nd(Mg,Zn) | 8.6 | 50.0 | 41.4 | Nd(Mg,Zn) |
| (Mg3Nd) | 47.0 | 25.0 | 28.0 | (Mg3Nd) | ||||
| 18 | 74.1 | 11.7 | 14.2 | (α-Mg)Zn | 97.8 | - | 2.2 | (α-Mg)Zn |
| (Mg3Nd) | 47.0 | 25.0 | 28.0 | (Mg3Nd) | ||||
| 19 | 77.2 | 14.5 | 8.3 | (Mg41Nd5) | 87.0 | 10.0 | 3.0 | (Mg41Nd5) |
| (Mg3Nd) | 63.0 | 25.0 | 12.0 | (Mg3Nd) | ||||
| 22 | 24.2 | 7.5 | 68.3 | (Nd2Zn17) | 7.5 | 10.5 | 82.0 | (Nd2Zn17) |
| τ1 | 29.0 | 6.5 | 64.5 | τ1 | ||||
| 23 | 36.4 | 8.1 | 55.5 | (α-Mg)Zn | 94.3 | - | 5.7 | (α-Mg)Zn |
| τ1 | 31.5 | 7.2 | 61.3 | τ1 | ||||
| 25 | 6.5 | 15 | 78.5 | (Nd2Zn17) | 7.0 | 10.5 | 82.5 | (Nd2Zn17) |
| τ1 | 25.5 | 7.5 | 67.0 | τ1 | ||||
The microstructures of equilibrated key alloys selected from different regions of the Mg-Nd-Zn system are shown in Figure 9. The equilibrated phases are labeled on the same micrographs. WDS analysis of all the equilibrated key alloys is shown graphically in Figure 10, where the arrows point to the detected phases.
The existence of ternary compounds τ1, τ2, τ3, and τ5, detected by diffusion couple experiments, was confirmed using the equilibrated key alloys. Furthermore, key alloys revealed the presence of a ternary compound equilibrating with (α-Mg)Zn. This compound was given the formula Nd(Mg,Zn)11.5 in the work of Huang et al. [1] at 400 °C. It is denoted as τ6 in the current work. We assume that τ4 was not detected by key alloys due to the low Nd concentration, which falls within the WDS detection limits. Thus, the phase might be read as Mg12Zn13 for negligible Nd concentration. However, it was clearly recognized in diffusion couple #2, where τ4 is in equilibrium with (α-Mg)Zn, Mg12Zn13, and τ1. More data and discussion regarding the ternary compounds and solid solutions are provided in the following sections.
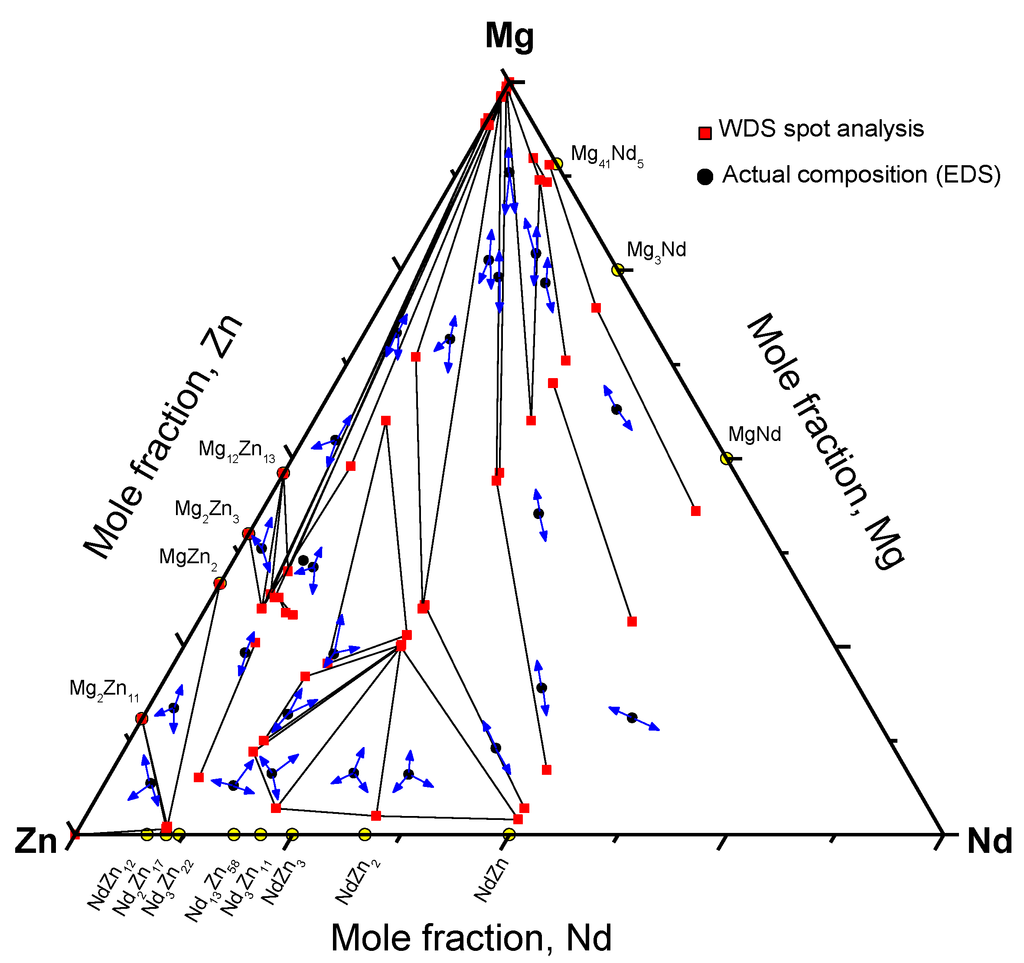
Figure 10.
Phase equilibrium results obtained from WDS spot analysis of equilibrated key alloys, where the arrows point to the detected phases.
Figure 10.
Phase equilibrium results obtained from WDS spot analysis of equilibrated key alloys, where the arrows point to the detected phases.
3.2.1. Ternary Compounds
Six ternary compounds in the Mg-Nd-Zn system were confirmed experimentally at 300 °C by diffusion couples and key alloys. The homogeneity range of these compounds was determined by WDS analysis. τ1 extends from 29.0 to 35.0 atom % Mg at a constant Nd concentration of ~6.8 atom % and has a hexagonal crystal structure with lattice parameters of a = b = 1.5 nm and c = 0.87 nm [14]. τ2 extends from 10.0 to 12.0 atom % Mg at a constant Nd concentration of 15.1 atom %. τ3 extends from 25.0 to 36.0 atom % Mg at a constant Nd concentration of 25.0 atom % and has a face-centered cubic crystal structure with lattice parameters of a = b = c = 0.68 nm [1]. τ5 was found with a homogeneity range of 22.0–23.5 atom % Mg, 15.5–17.6 atom % Nd and 59.1–61.8 atom % Zn. τ6 extends from 54.1 to 61.3 atom % Mg at a constant Nd of 8.0 atom % and has a C-centered orthorhombic crystal structure with lattice parameters of a = 0.965–0.984 nm, b = 1.18–1.135 nm and c = 0.946–0.963 nm [1].
3.2.2. Solid Solutions
Although the binary solid solubility of Nd in Mg is negligible [10,11], Kinzhibalo et al. [13] showed that (α-Mg) contains ~5 atom % Nd in the Mg-Nd-Zn isothermal section at 300 °C. In this work, the solubility of Nd in α-Mg is negligible and the maximum solid solubility of Zn in (α-Mg)Zn was measured as 4.8 atom % Zn at 300 °C.
The ternary solubility of Zn in Mg-Nd compounds was found to increase with a decrease in Mg concentration. For instance, (Mg41Nd5) was found to have an extended solubility of 3.1 atom % Zn, whereas (Mg3Nd) was found to have 30.0 atom % Zn. MgNd was found to have a complete substitution of Mg by Zn. Thus, the complete solid solubility line Nd(Mg,Zn) was established between MgZn and NdZn. This was also reported in the literature for this system at 300 °C [13] and confirmed in the current work.
3.3. Mg-Nd-Zn Isothermal Section at 300 °C
The Mg-Nd-Zn isothermal section at 300 °C, established using the diffusion couples and key alloy results, is shown in Figure 11. The existence of six ternary compounds was confirmed by WDS analysis. The ternary solubility ranges were determined using key alloy experiments. Because of many wide two-phase fields, many key alloys are required to determine the boundary tie-lines. In this work, tie-lines were interpolated based on the mass balance principle as described in [19]. In this method, each two-phase field must be determined experimentally by at least three tie-lines. Two lines, parallel to the boundary composition lines, are extended from the two ends of each experimental tie-line until they intersect. For each region, three intersection points are assigned. Then, these points are connected together to give the balance curve, which represents the amount of the equilibrated phases versus composition. Each point on the produced curve represents an intersection of a tie-line that occurs in that field with the extended composition axis. Once the curve is determined, the process can be reversed and additional tie-lines can be interpolated by extending two lines parallel to the phase boundary composition lines. Using this method, many regions in the Mg-Nd-Zn isothermal section could be determined.
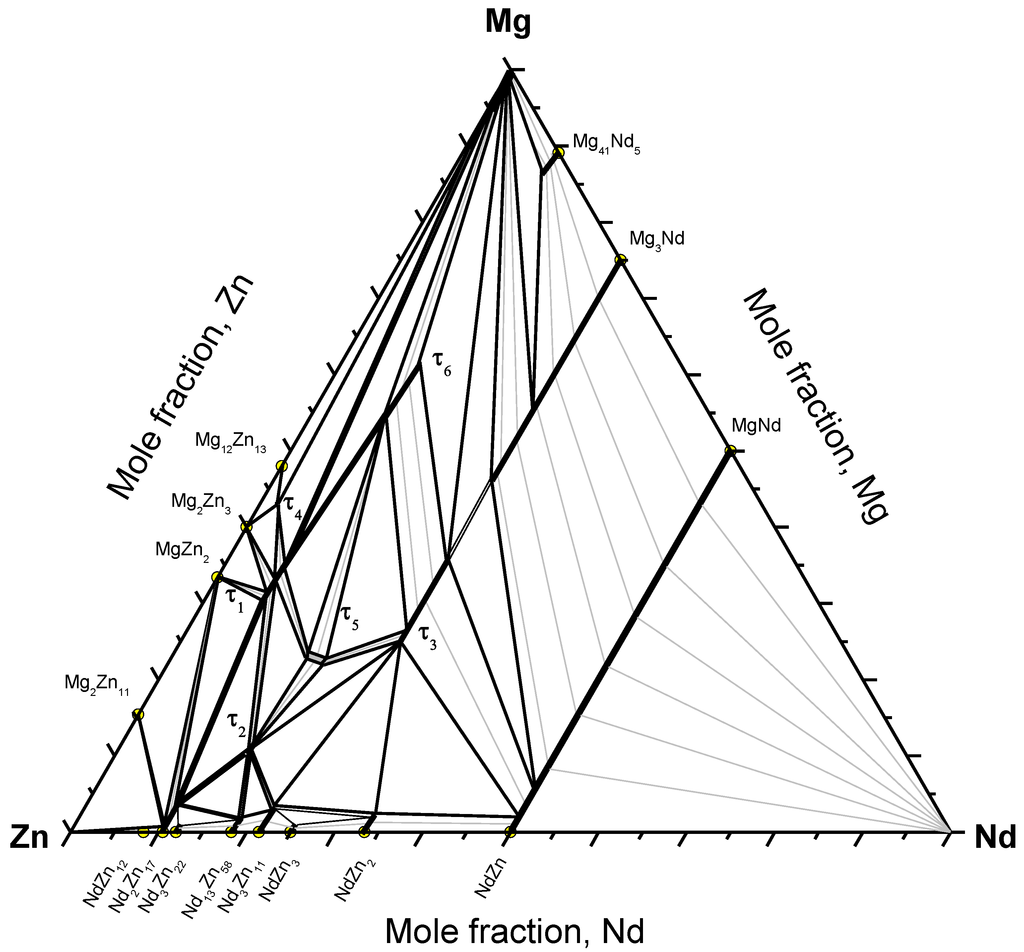
Figure 11.
The Mg-Nd-Zn isothermal section at 300 °C.
Figure 11.
The Mg-Nd-Zn isothermal section at 300 °C.

The current study showed different phase relations than those reported by Qi et al. [8], Drits et al. [11], and Kinzhibalo et al. [13] at 300 °C. However, the phase relations near the Mg-rich corner are consistent with Huang et al. [1] except for the presence of the liquid phase, and consistent with Zhang et al. [17] except for the presence of τ4 at 300 °C.
4. Experimental Procedures
In order to study the phase relationships in the Mg-Nd-Zn isothermal section at 300 °C, solid-solid diffusion couples along with key alloys were prepared and analyzed using a PANalytical (Almelo, The Netherlands) X-ray diffractometer (Cu K-α radiations) and a Hitachi (Tokyo, Japan) S-3400N SEM equipped with Oxford® (Abingdon, UK) EDS/WDS detectors. EDS and WDS analyses were used to determine the phases and to quantify their compositions. Pure metals (Mg, Nd, and Zn) were used as standards for WDS calibration. X-ray scans were performed on powder-form samples, in the range from 20 to 120 degree 2θ with 0.02° step size, to identify and confirm the phases obtained by WDS measurements. X-ray phase analysis was carried out using X’pert Highscore Plus software (Almelo, The Netherlands). The standard intensity data were taken from Pearson’s Crystal Data software (Crystal Impact, Materials Park, OH, USA). Silicon was added to the powder samples and used as a calibration standard to correct for the zero shift and specimen displacement of the obtained diffraction patterns.
4.1. Key Alloy Preparation
Pure elements were used for sample preparation and diffusion couple end-members. Mg ingots with purity of 99.8% were supplied by CANMET Materials Technology Laboratory (Ottawa, ON, Canada). Nd ingots with purity of 99.9% were supplied by STREM Chemicals Incorporated (Newburyport, MA, USA). Zn rods with purity of 99.9% were supplied by Alfa Aesar Company (Haverhill, MA, USA). The key alloys, 3–4 gm each, were prepared in a tantalum crucible under argon atmosphere using induction-melting furnace. The melts were left to solidify in the crucible.
Alloys near the Zn-rich corner were prepared by adding pure Zn to previously prepared Mg-Nd binary alloys to avoid the exothermic reaction between Zn and Nd. The other compositions were prepared by melting the three pure metals together. Excess amounts of Mg and Zn (around 10%) were added to compensate for losses due to evaporation. The actual global composition was determined using EDS/SEM area analysis. An average of three readings from three different locations was taken as the actual composition. The WDS error of measurements was estimated as ±1 atom %.
4.2. Solid-Solid Diffusion Couples
The end-members of the solid-solid diffusion couples were prepared from pure metals and/or alloys. The contacting surfaces were ground gradually up to 1200 SiC paper using 99% pure ethanol to reduce friction and to prevent oxidation. The ground surfaces were polished down to 1 µm using an alcohol diamond suspension. The end-members were attached together strongly using stainless steel clamping rings.
For annealing purposes, samples and diffusion couples were wrapped in tantalum foil and encapsulated inside an argon-purged quartz tube with an internal pressure of about 8 × 10⁻¹ torr. To reach equilibrium, diffusion couples and key alloys were heated up to 300 °C for a predefined period of time. Annealing time was chosen based on the composition of the selected end-members. After annealing, the quartz tubes, containing samples and diffusion couples, were rapidly quenched in cold water in order to maintain the high temperature structure. The equilibrated samples and the diffusion couples were analyzed using SEM/WDS spot analysis and line-scans. The isothermal section of the Mg-Nd-Zn phase diagram at 300 °C was constructed based on these results.
5. Conclusions
The Mg-Nd-Zn isothermal section at 300 °C was established for the whole composition range by solid-solid diffusion couples and equilibrated key alloys. The microstructural characterization was performed using XRD, SEM/EDS/WDS, and metallography. An annealing temperature of 300 °C was chosen to avoid the liquid phase formation upon annealing and to resolve the inconsistent phase relations found in the literature [1,8,10,11,13,14,17]. The current study showed different phase relations from those reported by Qi et al. [8], Drits et al. [11], and Kinzhibalo et al. [13] at 300 °C. However, the phase relations near the Mg-rich corner are consistent with Huang et al. [1] and Zhang et al. [17].
Six ternary compounds were detected in the Mg-Nd-Zn system at 300 °C. These are: τ1 (Nd5Mg21+xZn45−x; 0 ≤ x ≤ 4), τ2 (Nd5Mg3+yZn25−y; 0 ≤ y ≤ 1), τ3 (NdMg1+zZn2−z; 0 ≤ z ≤ 0.44), τ4 (Mg40Nd5Zn55), τ5 (Mg22–23.5Nd15.5–17.5Zn59.1–61.8), and τ6 (Nd2(Mg,Zn)23). The ternary solubility of Zn in Mg-Nd compounds was found to increase with decrease in Mg concentration so that (Mg41Nd5) and (Mg3Nd) were found to have an extended solubility of 3.1 and 30.0 atom % Zn, respectively. MgNd was found to have a complete substitution of Mg by Zn.
Acknowledgments
This research was supported by funding from the Magnesium Strategic Research Network (MagNET), www.MagNET.ubc.ca.
Author Contributions
Ahmad Mostafa carried out the experiments and analysis of the results. Ahmad Mostafa and Mamoun Medraj prepared and revised the manuscript. Mamoun Medraj initiated and directed the project. He helped in the interpretation of the results and followed up on the progress step by step.
Conflicts of Interest
The authors declare no conflict of interest.
References
- Huang, M.; Li, H.; Ding, H.; Tang, Z.; Mei, R.; Zhou, H.; Ren, R.; Hao, S. A ternary linear compound T2 and its phase equilibrium relationships in Mg-Zn-Nd system at 400 °C. J. Alloy. Compounds 2010, 489, 620–625. [Google Scholar] [CrossRef]
- Mordike, B.; Ebert, T. Magnesium: Properties—applications—potential. Mater. Sci. Eng. 2001, 302, 37–45. [Google Scholar] [CrossRef]
- Mordike, B.L. Creep-resistant magnesium alloys. Mater. Sci. Eng. A 2002, 324, 103–112. [Google Scholar] [CrossRef]
- Ghosh, P.; Mezbahul-Islam, M.; Medraj, M. Critical assessment and thermodynamic modeling of Mg-Zn, Mg-Sn, Sn-Zn and Mg-Sn-Zn systems. Calphad 2012, 36, 28–43. [Google Scholar] [CrossRef]
- Okamoto, H. Supplemental literature review of binary phase diagrams: Cs-In, Cs-K, Cs-Rb, Eu-In, Ho-Mn, K-Rb, Li-Mg, Mg-Nd, Mg-Zn, Mn-Sm, O-Sb, and Si-Sr. J. Phase Equilib. Diff. 2013, 34, 251–263. [Google Scholar] [CrossRef]
- Mezbahul-Islam, M.; Mostafa, A.O.; Medraj, M. Essential magnesium alloys binary phase diagrams and their thermochemical data. J. Mater. 2014, 2014. [Google Scholar] [CrossRef]
- Ferro, R.; Saccone, A.; Borzone, G. Rare earth metals in light alloys. J. Rare Earth 1997, 15, 45–61. [Google Scholar]
- Qi, H.-Y.; Huang, G.-X.; Bo, H.; Xu, G.-L.; Liu, L.-B.; Jin, Z.-P. Thermodynamic description of the Mg-Nd-Zn ternary system. J. Alloy. Compounds 2011, 3274–3281. [Google Scholar]
- Okamoto, H. Nd-Zn (neodymium-zinc). J. Phase Equilib. Diff. 2012, 33. [Google Scholar] [CrossRef]
- Drits, M.; Padezhnova, E.; Miklina, N. Phase diagram of the magnesium-neodymium-zinc system in the magnesium-rich phase. Izvestiya Vysshikh Uchebnykh Zavedenii Tsvetn. Met. 1971, 14, 104–107. [Google Scholar]
- Drits, M.; Padezhnova, E.; Miklina, N. The combined solubility of noedymium and zinc in solid magnesium. Rus. Metallurgy 1974, 3, 143–146. [Google Scholar]
- Raynor, G. Constitution of ternary and some complex alloys of magnesium. Int. Mater. Rev. 1977, 22, 65–96. [Google Scholar] [CrossRef]
- Kinzhibalo, V.; Tyvanchuk, A.; Melnik, E. Stable and metastable phase equilibria in metallic systems. Nauka Mosc. USSR 1985, 70–74. [Google Scholar]
- Huang, M.; Li, H.; Yang, J.; Ren, Y.; Ding, H.; Hao, S. Research on a ternary compound T1 at the low Nd side in the Mg-Zn-Nd alloy. ACTA Metall Sin. 2008, 44, 385–390. [Google Scholar]
- Zhang, J.; Yan, J.; Liang, W.; Xu, C.; Zhou, C. Icosahedral quasicrystal phase in Mg-Zn-Nd ternary system. Mater. Lett 2008, 62, 4489–4491. [Google Scholar] [CrossRef]
- Zhang, J.; Yan, J.; Liang, W.; Du, E.; Xu, C. Microstructures of Mg-Zn-Nd alloy including small quasicrystalline grains. J. Non-Cryst. Solids 2009, 355, 836–839. [Google Scholar] [CrossRef]
- Zhang, C.; Luo, A.A.; Peng, L.; Stone, D.S.; Chang, Y.A. Thermodynamic modeling and experimental investigation of the magnesium-neodymium-zinc alloys. Intermetallics 2011, 19, 1720–1726. [Google Scholar] [CrossRef]
- Kirkendall, E.O. Diffusion of zinc in alpha brass. Trans. AIME Metall Pet. Eng. 1942, 147, 104–110. [Google Scholar]
- Mostafa, A.; Medraj, M. Phase equilibria of the Ce-Mg-Zn ternary system at 300 °C. Metals 2014, 4, 168–195. [Google Scholar] [CrossRef]
- Callister, W.; Rethwisch, D. Materials Science and Engineering: An Introduction, 7th ed.; John Wiley & Sons, Inc.: New York, NY, USA, 2007. [Google Scholar]
- Chen, Y.C.; Zhang, Y.G.; Chen, C.Q. Quantitative descriptions of periodic layer formation during solid state reactions. Mater. Sci. Eng. A 2003, 362, 135–144. [Google Scholar] [CrossRef]
- Mostafa, A.; Medraj, M. On the atomic interdiffusion in Mg-{Ce, Nd, Zn} and Zn-{Ce, Nd} binary systems. J. Mater. Res. 2014, 29, 1463–1479. [Google Scholar] [CrossRef]
- Dybkov, V.I. Solid state growth kinetics of the same chemical compound layer in various diffusion couples. J. Phys. Chem. Solids 1986, 47, 735–740. [Google Scholar] [CrossRef]
© 2015 by the authors; licensee MDPI, Basel, Switzerland. This article is an open access article distributed under the terms and conditions of the Creative Commons Attribution license (http://creativecommons.org/licenses/by/4.0/).