Article

Study of the Mechanical Behavior of Dual-Phase Steel Based on Crystal Plasticity Modeling Considering Strain Partitioning

Department of Engineering Mechanics and Innovation Center for Advanced Ship and Deep-Sea Exploration, School of Naval Architecture, Ocean and Civil Engineering, Shanghai Jiao Tong University, Shanghai 200240, China
*
Authors to whom correspondence should be addressed.
Metals 2018, 8(10), 782; https://doi.org/10.3390/met8100782
Submission received: 28 August 2018 / Revised: 25 September 2018 / Accepted: 25 September 2018 / Published: 29 September 2018

Abstract

:
The similar crystal structures of martensite (BCT) and ferrite (BCC) cause difficulty in distinguishing the grain orientations of individual phases in dual-phase (DP) steels. A dislocation-based multiphase mixed hardening model is presented, considering both ferrite and martensite strain partitioning, to describe the texture-dependent mechanical behavior of DP steels more precisely. This model is based on the ideals that (i) the volume fractions of the constituent phases and the corresponding strain partitioning function are obtained through in situ tensile experimentation, and (ii) the grain orientations of ferrite and martensite are assumed to be in accordance with the overall texture. We applied the model to calculate the macroscopic and microscopic mechanical behavior of DP800 steel using a crystal plasticity finite element (CPFE) code. The results show that the calculated stress-strain response and textural evolution are in good agreement with the experimental results. The dislocation evolution indicates that the rapid hardening of ferrite induces a high hardening rate for DP steels early in plastic deformation. In addition, for the grains corresponding to the texture center orientations of DP800, the activity and dislocation density evolutions of the slip systems are studied.

1. Introduction

The ever-increasing demands for lightweighting in manufacturing inspired increasing research on advanced high-strength steels (AHSS). Advanced high-strength dual-phase (DP) steels have both high strength and good ductility. Therefore, much effort is devoted to studying the mechanical behavior (i.e., strength, elongation, forming ability, etc.) of DP steels [1,2,3].
Many scholars performed experimental studies on the mechanical behavior of DP steels. Bleck et al. [4] and Papaefthymiou et al. [5] pointed out that the tensile strength of DP steel increases with higher martensite volume fraction and carbon content. Armaki et al. [6] in 2014 investigated the inhomogeneity of strength and hardness in different regions of DP steel by nanoindentation and micropillar compression tests. Yu et al. [7] in 2014 experimentally measured the mechanical properties of DP steels, of which samples were prestrained by uniaxial tension, plane strain, and equal biaxial stretching. Employing nanoindentation experiments, Mazaheri et al. [8] in 2015 found that with the increase in hardness ratio between martensite and ferrite, the strength of materials improved, but the ductility deteriorated. Amaral et al. [9] in 2017 also measured the hardening curves and yield loci of various DP steels, utilizing bulge and uniaxial tensile tests.
In recent decades, many numerical methods were adopted to study the mechanical behavior of materials. Paul et al. [10] showed that an empirical formula based on the iso-energy hypothesis could not accurately reflect the flow curves of DP steel, and the results were consistent with the experiment under various strain partitioning coefficients associated with deformation. Xiong et al. [11] also calculated the mechanical behavior of DP steel using the modified iso-work model, and pointed out that the strain-induced ferrite had higher strength than polygonal ferrite. Based on the crystal plasticity constitutive model, the crystal plasticity finite element method (CPFEM) is widely used and a number of positive results were achieved. Kadkhodapour et al. [12] analyzed void initiation and growth during the material failure of DP steel. Woo et al. [13] in 2012 predicted the stress-strain relationships of martensite and ferrite in DP steel based on electron backscattered diffraction (EBSD) data. In 2012, Kim et al. [14] investigated the Bauschinger effect and permanent softening behavior of DP steels. In 2007, using the experiments and a representative volume element (RVE) model, Prahl et al. [15] analyzed the crack initiation and propagation of five kinds of microstructure multiphase steel. In 2017, coupling the crystal plasticity and RVE methods, Kim et al. [16] inspected the effects of crystal orientation and martensite morphology of the ferrite/martensite (F/M) interfacial de-cohesion in DP980 steel. Ogata et al. [17] in 2017 analyzed the effects of different phase boundaries and microstructural evolution on the strain-hardening behavior by CPFEM. They also attributed the inhomogeneity of DP steels during secondary processing to the differences in deformability between martensite and ferrite.
On the other hand, hard-phase martensite and soft-phase ferrite were unequivalent in both stress and strain responses [18,19,20]. Kuang et al. [21] in 2009 reported that the strain ratio of ferrite to martensite was increased almost linearly with the macro-strain of DP steel. Kang [22] in 2007 and Ghadbeigi [23] in 2010 measured the strain distributions of DP steels utilizing the digital image correlation (DIC) method. Tasan et al. [24,25,26] in 2010 and 2014 also studied the corresponding strain distributions of DP steels utilizing a method integrating micro-DIC experiments and CPFEM simulations. In 2012, Dan et al. [27] proposed an exponential strain partitioning function to describe the strain distributions of ferrite and martensite. Employing the finite element method (FEM), Paul [10] and Han [28] in 2014 predicted the plastic strain partitioning of ferrite and martensite in DP steels. Chen et al. [29] in 2014 investigated the flow strength and strain rate partitioning of DP980, utilizing micropillar compression experiments and microstructure-based numerical simulations. Fillafer et al. [30] in 2015 reported that the averaged plastic equivalent strains of ferrite and martensite behaved as functions of the macro strain and loading angle. Based on metallographic pictures, the strain distributions of ferrite and martensite under uniaxial tension were exhibited using the point interpolation method [31]. In 2017, Sun et al. [32] analyzed the strain partitioning coefficient of ferrite-austenite duplex medium-manganese steels with different manganese contents. All the above studies show that the deformation of multiphase composite materials containing both a soft phase and a hard phase is not uniform, and the strain of the hard phase is less than that of the soft phase.
In summary, the macro-mechanical behavior (i.e., yield strength, tensile strength, elongation, etc.) of materials can be obtained by experimental methods, but the micro-deformations (i.e., grain deformation, grain rotation, slip systems activity, etc.) thereof are difficult to observe and acquire. As a numerical method, the FEM can construct the grain-to-grain or phase-to-phase morphology, and thus, facilitate the study of micro-deformation mechanisms. However, because of limitations in computational ability, the FE model is not able to calculate too many grains, and therefore, fails to accurately reveal the effects of texture on macro-mechanical behavior. For dual-phase steels, the deformation of martensite and ferrite is nonuniform, and the strain partitioning of each phase significantly affects the overall deformation and hardening behavior of materials. However, existing research rarely considers the effects of texture and strain partitioning on the mechanical behavior of DP steels; thus, further studies are necessary.
In this study, a multiphase mixed hardening law for similar crystal structures was constructed to describe the mechanical behavior of DP steel. In DP steels, the martensitic phase takes a low-tetragonality crystal structure [33], which is difficult to distinguish texturally from ferrite using existing X-ray diffraction methods [13]. However, the existing literature suggests that these two phases can be treated as similar in texture [16,28,29]. Considering these characteristics, this research examines the idea of superimposing the respective hardening effects of martensite and ferrite, and combining the strain partitioning function with the hardening law. Based on the texture and the micro-strain partitioning function, the mechanical behavior of DP800 steel was predicted by CPFEM using the new multiphase hardening law.
This paper is organized as follows: the crystal plasticity theory and the improved multiphase hardening law are introduced briefly in Section 2. Section 3 describes the materials and experiments; the main results and discussions are presented in Section 4. Section 5 provides some concluding remarks.

2. Theory and Methodology

2.1. The Crystal Plasticity Model

Here, the crystal plasticity model is briefly described. Although these theories can be found in other works [34,35,36], the following description of the model is necessary for a more concise understanding of polycrystalline theory.
Firstly, the single-crystal model with the deformation gradient tensor F and velocity gradient tensor L is introduced [37,38,39,40]:
F = F e F p ,
where F = x / X is the deformation gradient tensor, and x and X are the coordinates of a point in the deformed and reference configurations, respectively. F e and F p are the elastic and plastic parts of the deformation gradient, respectively.
L = F ˙ F 1 = L e + L p ,
where L = v / X is the velocity gradient tensor. v is the velocity of the point x in the deformed configuration. L e is the elastic part of the velocity gradient, and L p is the plastic part, which can be decomposed according to the following formulas:
L e = d e + w e ,
L p = d p + w p ,
where d and w are the symmetrical and asymmetrical parts of the velocity gradient tensor, respectively.
F ˙ p = L p F p ,
L p = g = 1 n γ ˙ g m g n g ,
where vectors m g and n g are unit vectors describing the slip direction and normal to slip plane of the slip system g, respectively. γ ˙ g is the shear strain rate of slip system g.
In order to connect single-crystal deformation and polycrystalline macroscopic mechanical behavior, the mean field homogenization method was adopted. This study uses the extended Taylor hypothesis [40,41], i.e.,
D = d · W = w · Σ = σ ,
where D , W , and Σ are the macroscopic deformation rate tensor, the macroscopic spin rate tensor, and the macroscopic Cauchy stress tensor, respectively. d , w , and σ are the corresponding microscopic quantities. The symbol < > means the volume average of the enclosed tensor.

2.2. Single-Crystal Viscous Model

For a single grain, the rate-dependent kinetic law of a slip system is described as follows [40,42,43,44,45]:
γ ˙ g = γ ˙ 0 × | τ ( g ) τ c ( g ) | 1 m × s i g n ( τ ( g ) ) ,
where γ ˙ 0 is a reference shear rate; the exponent m is a plastic strain rate sensitivity parameter m = ln τ ln γ ˙ ) τ c ( γ ) , where 0 < m < 1. τ c ( g ) is the critical resolved shear stress of slip system g.
The critical resolved shear stress is determined by the interactions of all slip systems, and the expression of the strain-hardening law is [45]
τ ˙ c ( g ) = h H ( gh ) | γ ˙ h | ,
where H is the strain-hardening matrix, which is determined by the corresponding hardening models.

2.3. Multiphase Hardening Model

The overall deformation of a multiphase material is a superimposition of the deformations of all the constituent phases. In order to accurately describe the hardening process of a multiphase material, it is necessary to simulate the deformation of each phase separately and establish the relationship between the individual strengthening and overall hardening. As mentioned in Section 1, similar crystal structures are assumed to have similar slip systems. In addition, because the textures of the ferrite and martensite in DP steels are similar and difficult to distinguish, it is assumed that the grain orientations of these phases are the same. Based on the evolution of dislocation density, the hardening model of DP steels is constructed below.
The shear strain and shear rate for slip system g of the i-th phase can be defined as
γ i ( g ) = f i ( γ total ( g ) ) ,
γ ˙ i ( g ) = f i ( γ total ( g ) ) γ ˙ total ( g ) ,
where γ i ( g ) and γ ˙ i ( g ) denote the shear strain and shear strain rate, respectively, of slip system g of the i-th phase. γ total ( g ) is the overall shear strain. f i ( ) denotes the strain partitioning function of the i-th phase.
The critical resolved shear stress of the i-th phase affected by dislocation is defined as Δ τ i c ( g ) :
Δ τ i c ( g ) = α i × μ i × b i h a i ( gh ) ρ i h ,
where μ i , b i , and ρ i h are the shear modulus, magnitude of the Burgers vector, and dislocation density of slip system h, respectively. a i ( gh ) is the dislocation-dislocation coefficient. The evolution of the dislocation density of i-th phase can be defined as [45,46].
ρ ˙ i ( g ) = 1 b i ( 1 L i ( g ) 2 × y i c × ρ i ( g ) ) × | γ ˙ i ( g ) | ,
L i ( g ) = K i ( i g s ρ i ( l ) ) 1 / 2 ,
where y i c is the dislocation annihilation length of the i-th phase. L i ( g ) is the mean free path of the i-th phase. K i and s are numerical parameters.
Combining all the component phases, the overall hardening formula for multiphase steels is defined as follows:
τ c ( g ) = τ c 0 ( g ) + R i v i × c i × Δ τ i c ( g ) ,
where R is the grain-boundary hardening coefficient. v i denotes the volume fraction of the i-th phase. c i is the strain partitioning ratio of the i-th phase, determined experimentally.
The value τ c 0 ( g ) is defined as the overall internal friction term of multiphase steel. It is the result of the friction stress τ i c 0 ( g ) of the i-th phase, volume fraction v i , initial dislocation density ρ initial , and grain size g of all component phases. It can be more coarsely calculated as the experimental yield stress σ s :
τ c 0 ( g ) = f ( τ i c 0 ( g ) , v i , ρ i , g i ) σ s M R i v i × α i × μ i × b i h a ( gh ) ρ initial h ,
where M is the Taylor factor.

3. Materials and Experiments

3.1. Materials and In Situ Stretch Experiment

The studied material is AHSS DP800 of 0.8 mm in thickness, having the ultimate strength of approximately 800 MPa. The industrial dual-phase steel sheets were supplied by BAOSTEEL, and the specific composition and mechanical properties of DP800 are presented in Table 1 and Table 2 respectively. Through uniaxial tensile testing in MTS universal test systems, the engineering stress-strain curve of DP800 steel was obtained as shown in Figure 1a. For DP steel, the microstructure features, such as phase composition and grain size, have a decisive influence on the mechanical properties [4]. Therefore, we observed the metallographic structure of DP800 (as shown in Figure 1b), in which martensite accounts for about 46%. The dual-phase micro-structure of martensite and ferrite was obtained by annealing after cold continuous rolling.
As already known, the martensite strain is smaller than the overall strain, while the ferrite strain is greater. To identify the strain partitioning of each phase, the in situ stretch experiments were done. For the in situ experiments, to observe a clear phase boundary and grain boundary, the sample was first subjected to a local polishing treatment, and then a 4% nitric acid alcohol solution was used for etching in the polishing region for about 5 s. The in situ stretch experiments at room temperature were performed at a quasi-static stretch speed. At the same time, the deformation area was image-captured using a portable microscope (Shanghai Wanheng Precision Instruments Co., Ltd., Shanghai, China) containing a charge-coupled device (CCD) module. The DP800 sample and experiment platform are shown in Figure 2 and Figure 3, respectively.
As shown in Figure 4, the corresponding strain partitioning was obtained by in situ tensile experimentation, and the micro-strain experimental results were acquired by the point interpolation method (PIM) [31]. To facilitate numerical calculation, we assumed that the strain partitioning functions of the constituent phases were exponential [27,31]. The specific coefficients of DP800 are shown in Table 3. We assumed that the form of the slip system shear strain partitioning function fi () (Equation (10)) was consistent with Equation (17), whereby ε i was replaced with γ i ( g ) and ε with γ total ( g ) .
ε i = ε × c i = ε × e ( p i 1 + p i 2 × ε ) ,
where ε i and ε represent the strain of the i-th phase and overall strain, respectively. p i 1 , p i 2 are the corresponding fitting coefficients.

3.2. Texture Measurement

The texture of the DP800 sample was measured using D8 ADVANCE (BRUKER 3kW/*D8 ADVANCE Da Vinci, Germany), a poly-functional X-ray diffractometer with a ceramic X-ray generator and copper target. The {110}, {200}, {211}, and {220} diffraction data were obtained from a non-deformed specimen and a specimen with the tensile plastic strain of 0.125. The generated pole figures are shown in Figure 5.
As can be seen from the pole figures, the orientation aggregation intensities of DP800 steel are weak. The specimen presents a typical cold-rolled and annealed texture [33,47,48].

4. Results and Discussion

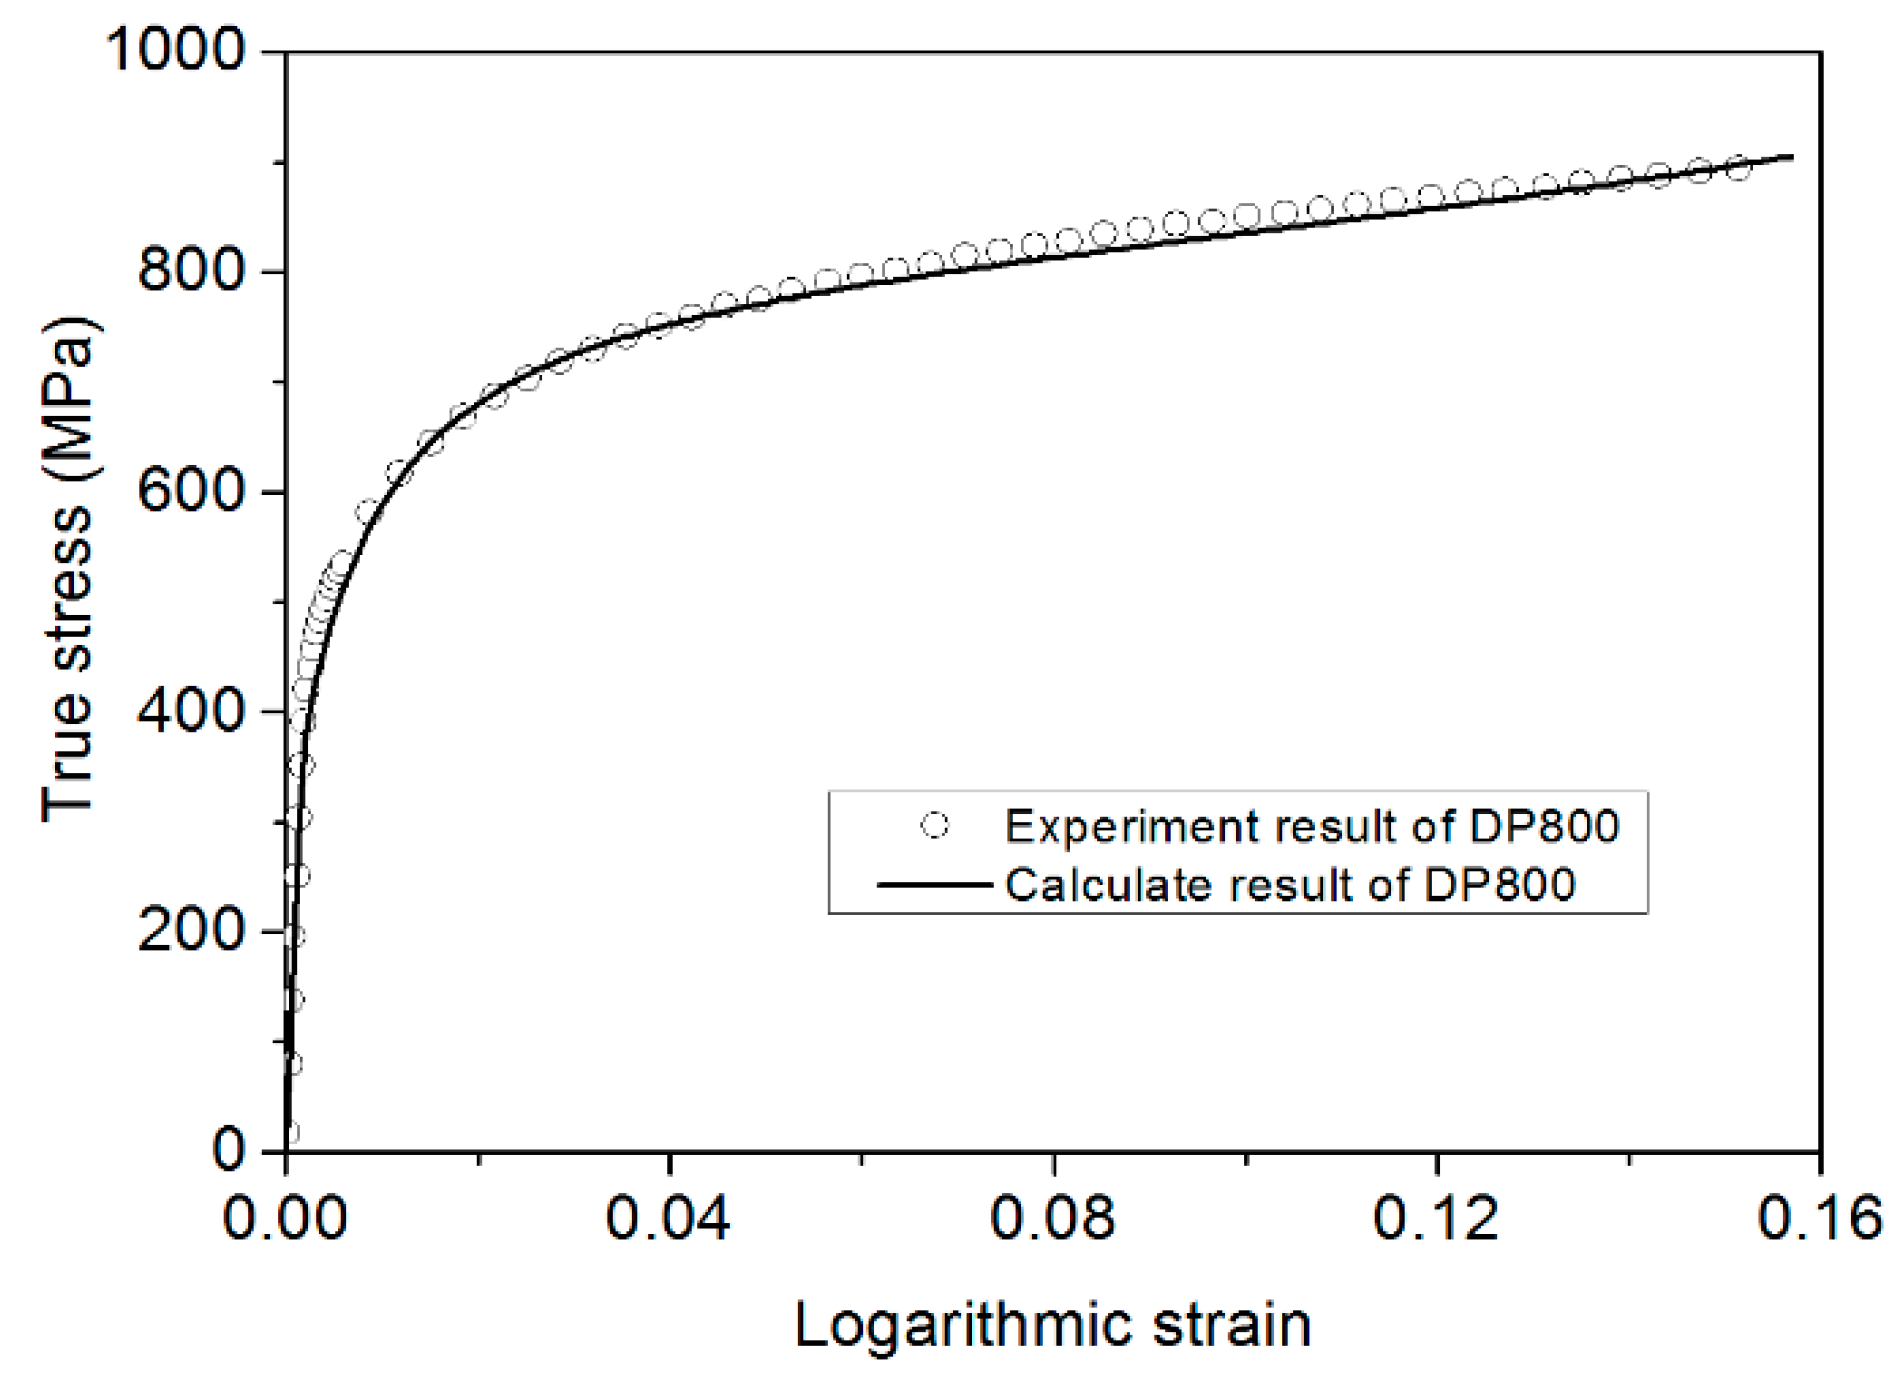
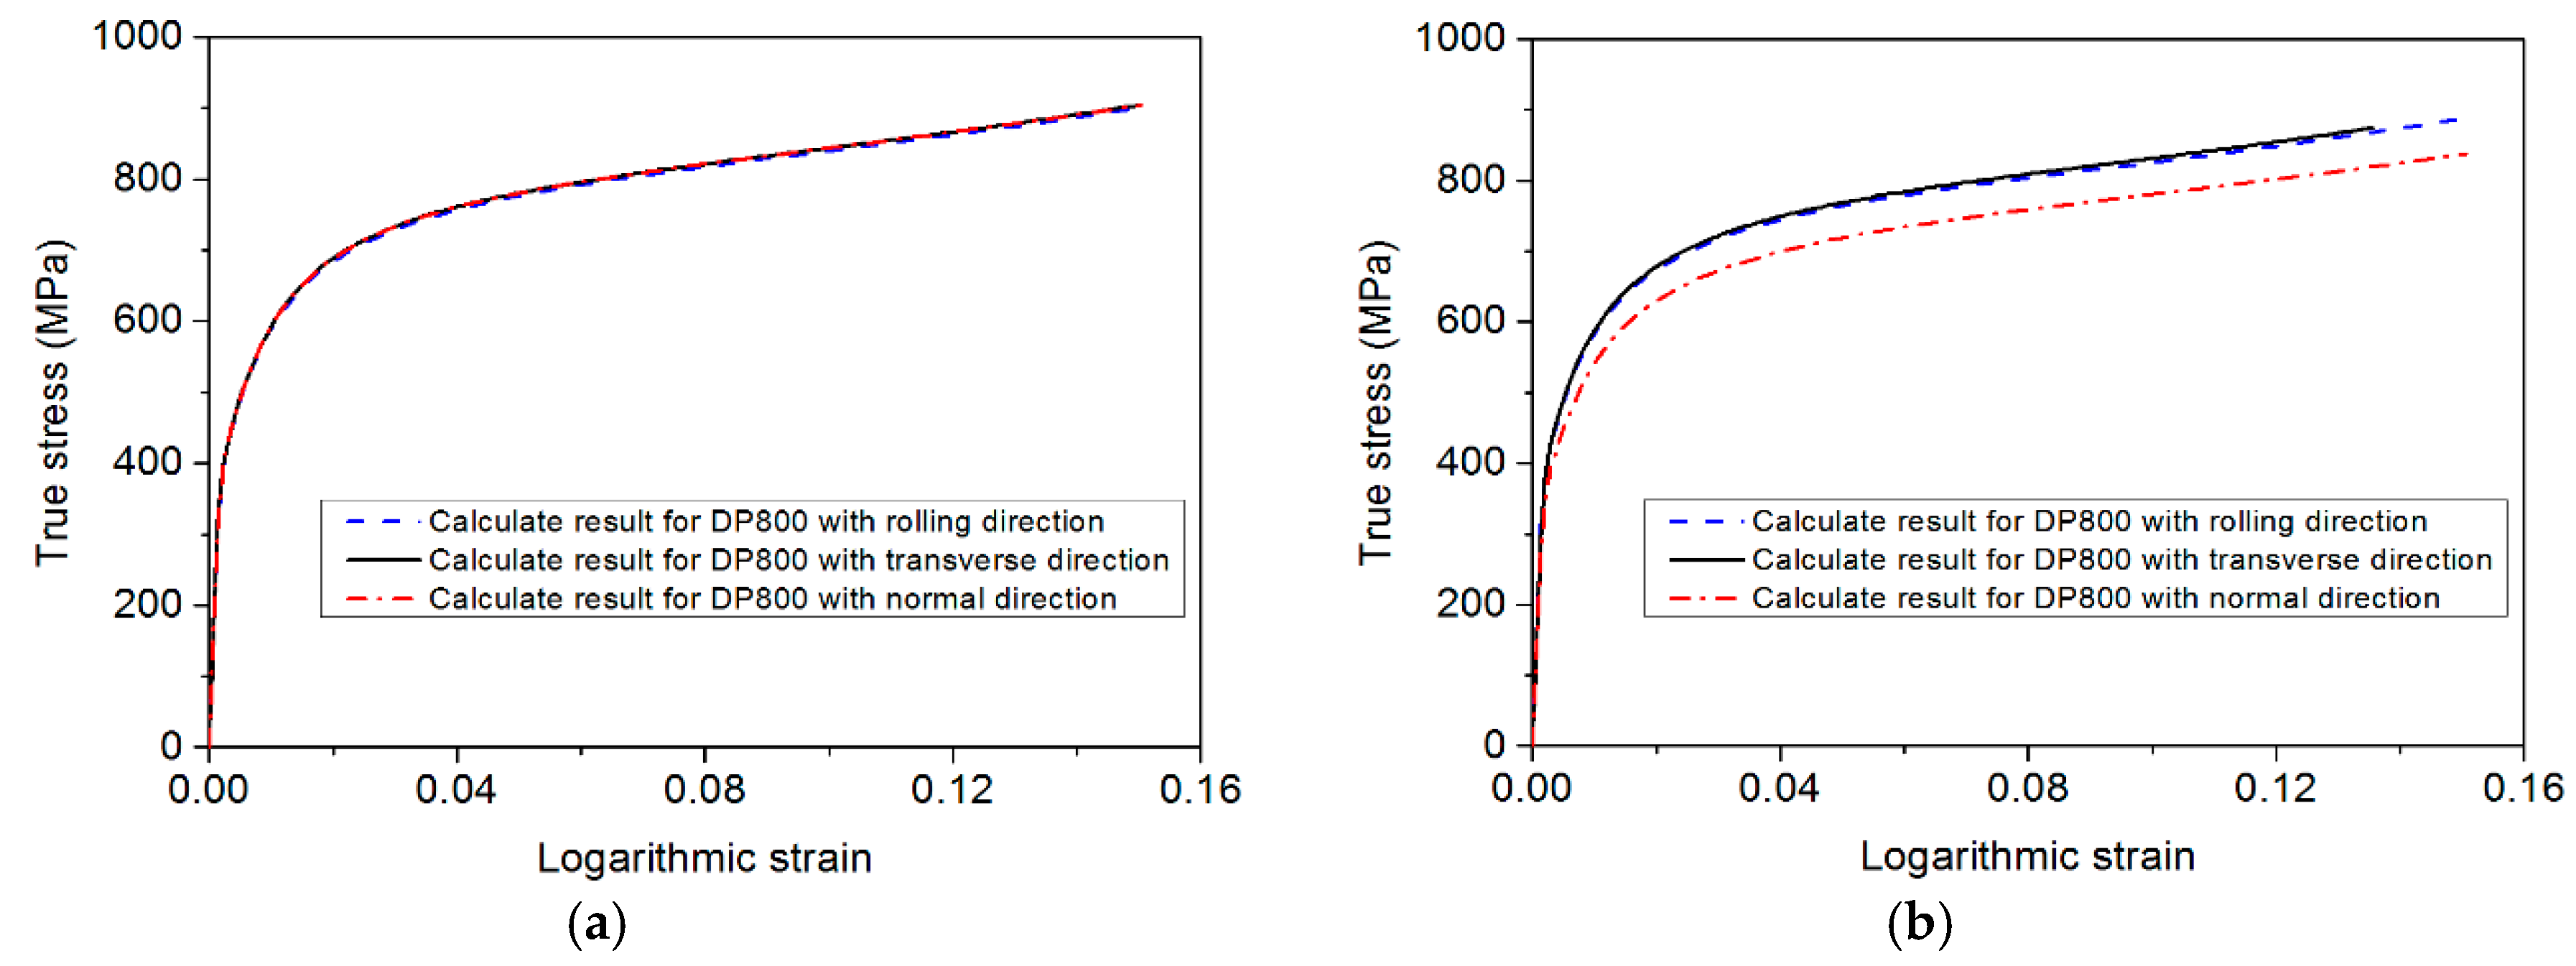
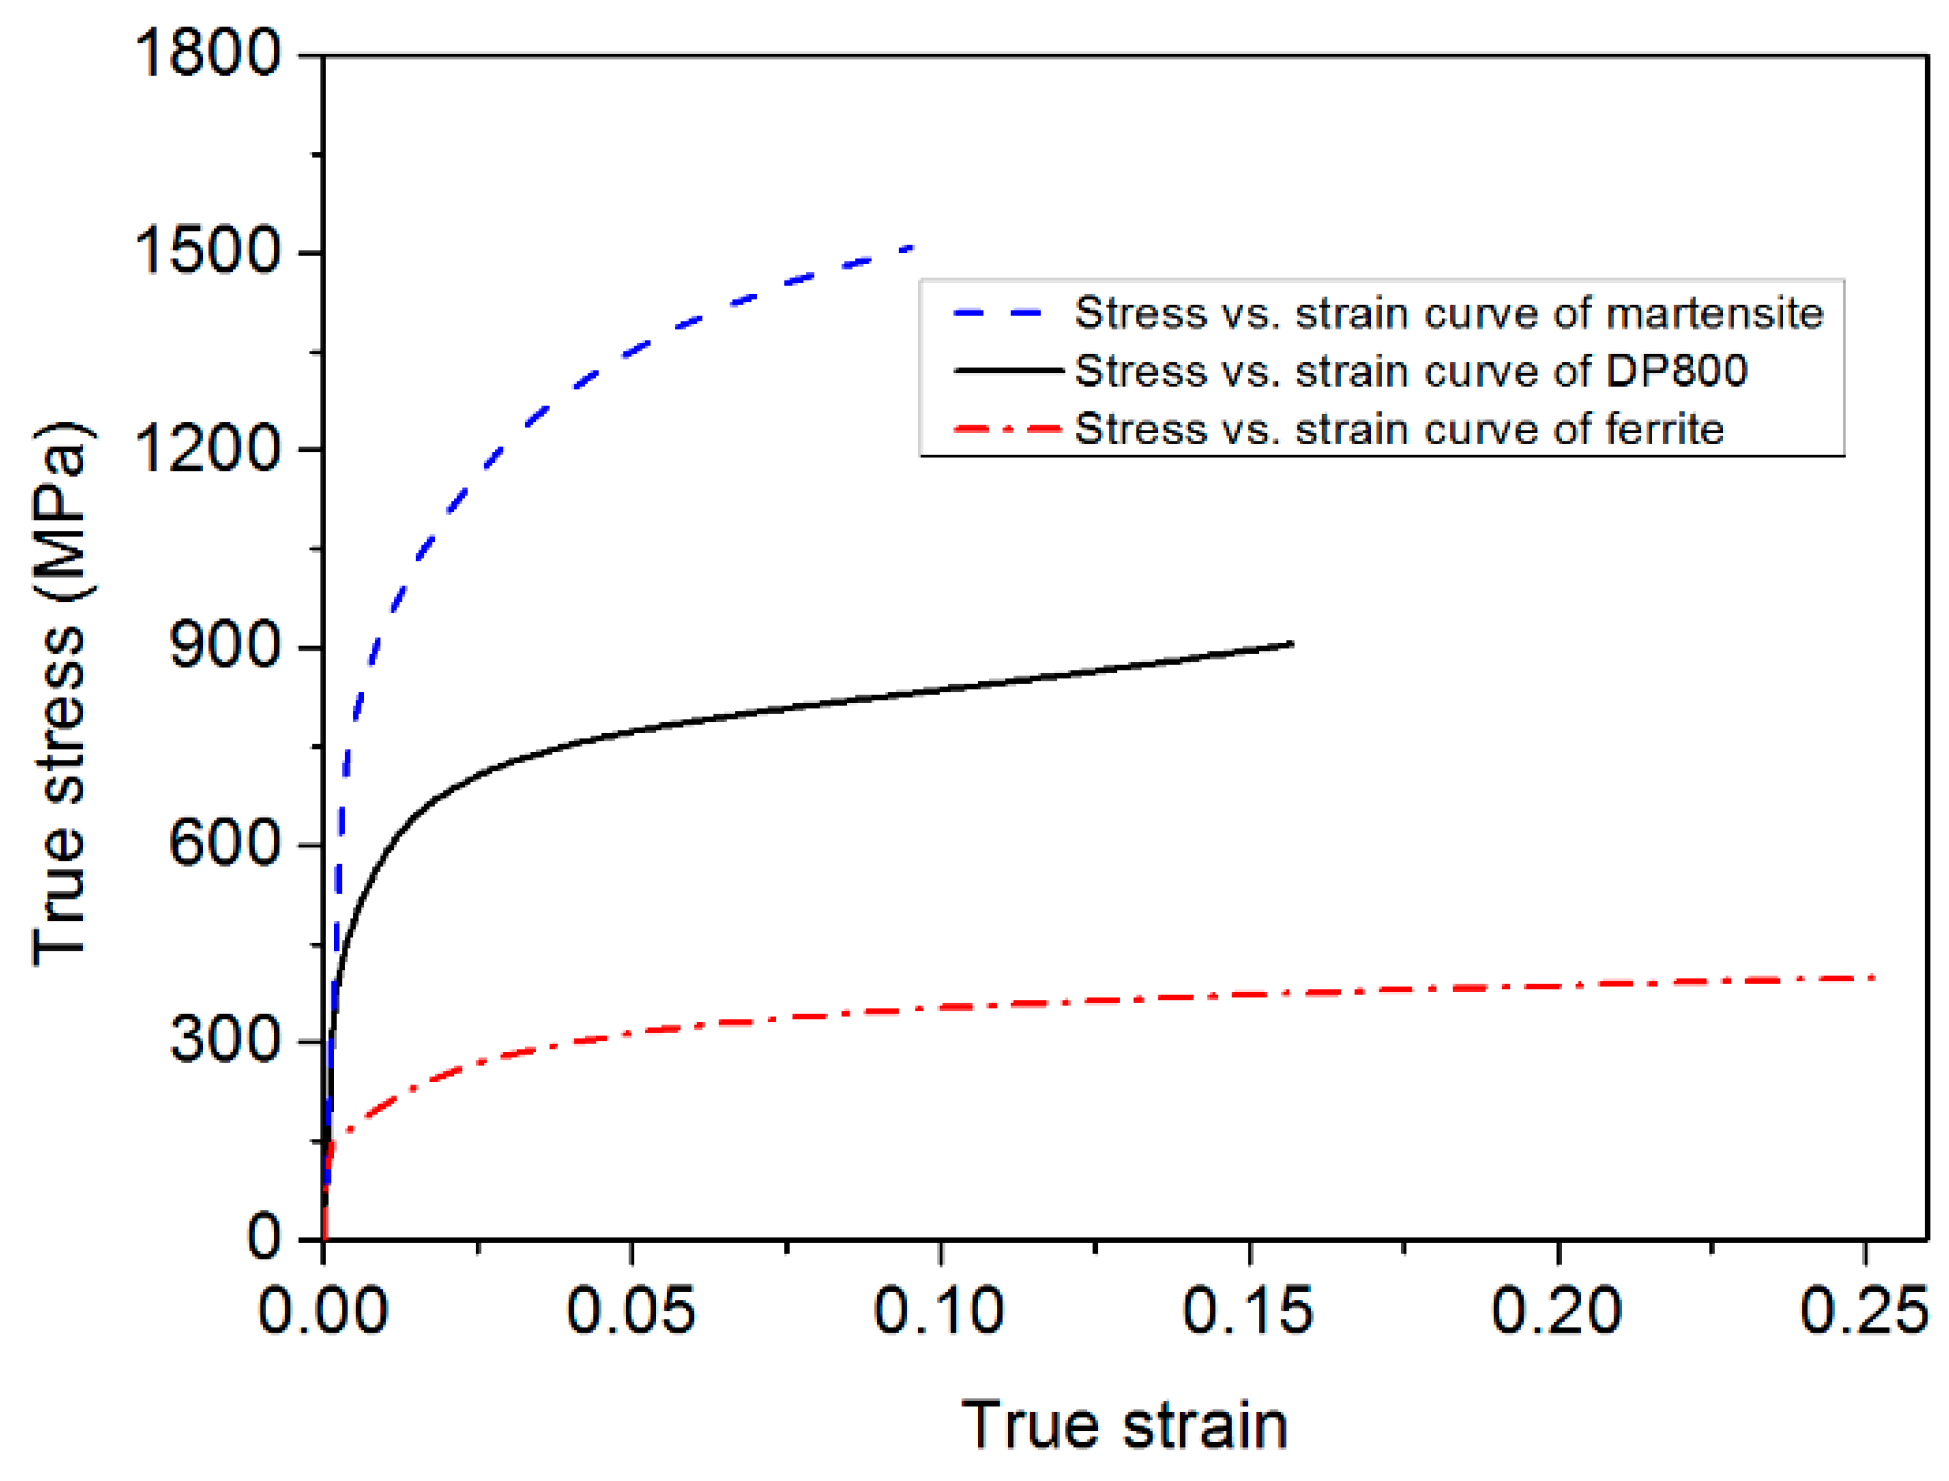
4.1. Mechanical Behavior of DP800

Some parameters of the crystal model were selected from the existing literature. The magnitudes of the Burgers vectors of ferrite and martensite are 2.5 × 10⁻¹⁰ m and 3 × 10⁻¹⁰ m, respectively [14,49]. The initial dislocation densities of the slip systems were set to 1013 m−2 for martensite and 109 m−2 for ferrite [45,47]. The initial internal friction values for martensite and ferrite are 250 MPa and 55 MPa, respectively [47,50,51]. The dislocation-dislocation coefficient a ( gh ) was set as 0.5 [51]. Each grain contained three independent elastic constants [26]. All crystal parameters are shown in Table 4.
The martensitic crystal structure has a body-centered tetragonal (BCT) structure similar to the body-centered cubic (BCC) lattice [45], and the {110} <111> and {112} <111> slip systems, with a 24 × 24 hardening matrix, were mainly considered. For the individual phases, the relationship between the shear strain of each slip system and overall shear strain is the same as that of the micro-strain. The reference shear strain rate γ ˙ 0 and the strain rate sensitivity index m associated with the plastic flow law were set as 1 s−1 and 0.05, respectively [26].
In addition, some parameters for the strain hardening model, such as the material parameter K and annihilation length yc, could be determined based on the actual material properties (in Table 5). Based on the DP800 tensile experimental results, the yield stress was approximately 500 MPa, and the overall internal friction term τ c 0 was finally determined as 155 MPa.
With the parameters above, the stress-strain curves of DP800 steel were calculated during quasi-static stretching in the rolling direction (in Figure 6). The results show that the calculated result is in good agreement with the experimental result. Moreover, the transverse and normal direction stress-strain responses of the DP800 steel sheet were also calculated (Figure 7a). The results indicate that the stress in the rolling direction is close to that in the transverse and normal direction [7,52]. In other words, the cold-rolled texture after annealing is weak and the mechanical properties of the sheet in different directions are almost the same. However, as the texture is strengthened, the anisotropy of the steel sheet is enhanced, as can be seen from Figure 7b, which indicates that the formability of DP steel with the rotated cube (Rt-C) texture is weakened.
In the hardening process of the material, the critical resolved shear stress of the grain is qualified by the dislocation density, and the dislocation density is increased with strain. For the DP800 steel, the relationships between the mean dislocation density and the overall strain and true stress of each phase are shown in Figure 8.
The results show that the mean dislocation densities of both martensite and ferrite are positively correlated with the true stress, as shown in Figure 8a. For ferrite, when the stress is greater than 250 MPa, the dislocation density increases rapidly, making DP steel harden early (Figure 8b). For martensite, when the stress is greater than 550 MPa, the dislocation density increases rapidly and the tensile strength of DP steel increases (Figure 8c). The dislocation evolution of individual phases can note the deformation characteristics of DP steels. At the initial plastic deformation period, the hardening rate of the DP steel is high and there is no obvious yielding plateau. With straining, the dislocation density of martensite increases rapidly, which makes the subsequent strengthening of the DP steel obvious. Therefore, the DP steel has a high tensile strength. Combined with Figure 8d, when the overall strain is greater than 0.03, the ferrite dislocation density tends to saturate; thus, subsequent material hardening is mainly attributed to martensite. Due to a high internal friction stress and the dislocation density of martensite, the martensitic stress is much higher than that of the ferrite and the overall stress (Figure 9) [13,47,53,54,55,56,57,58].

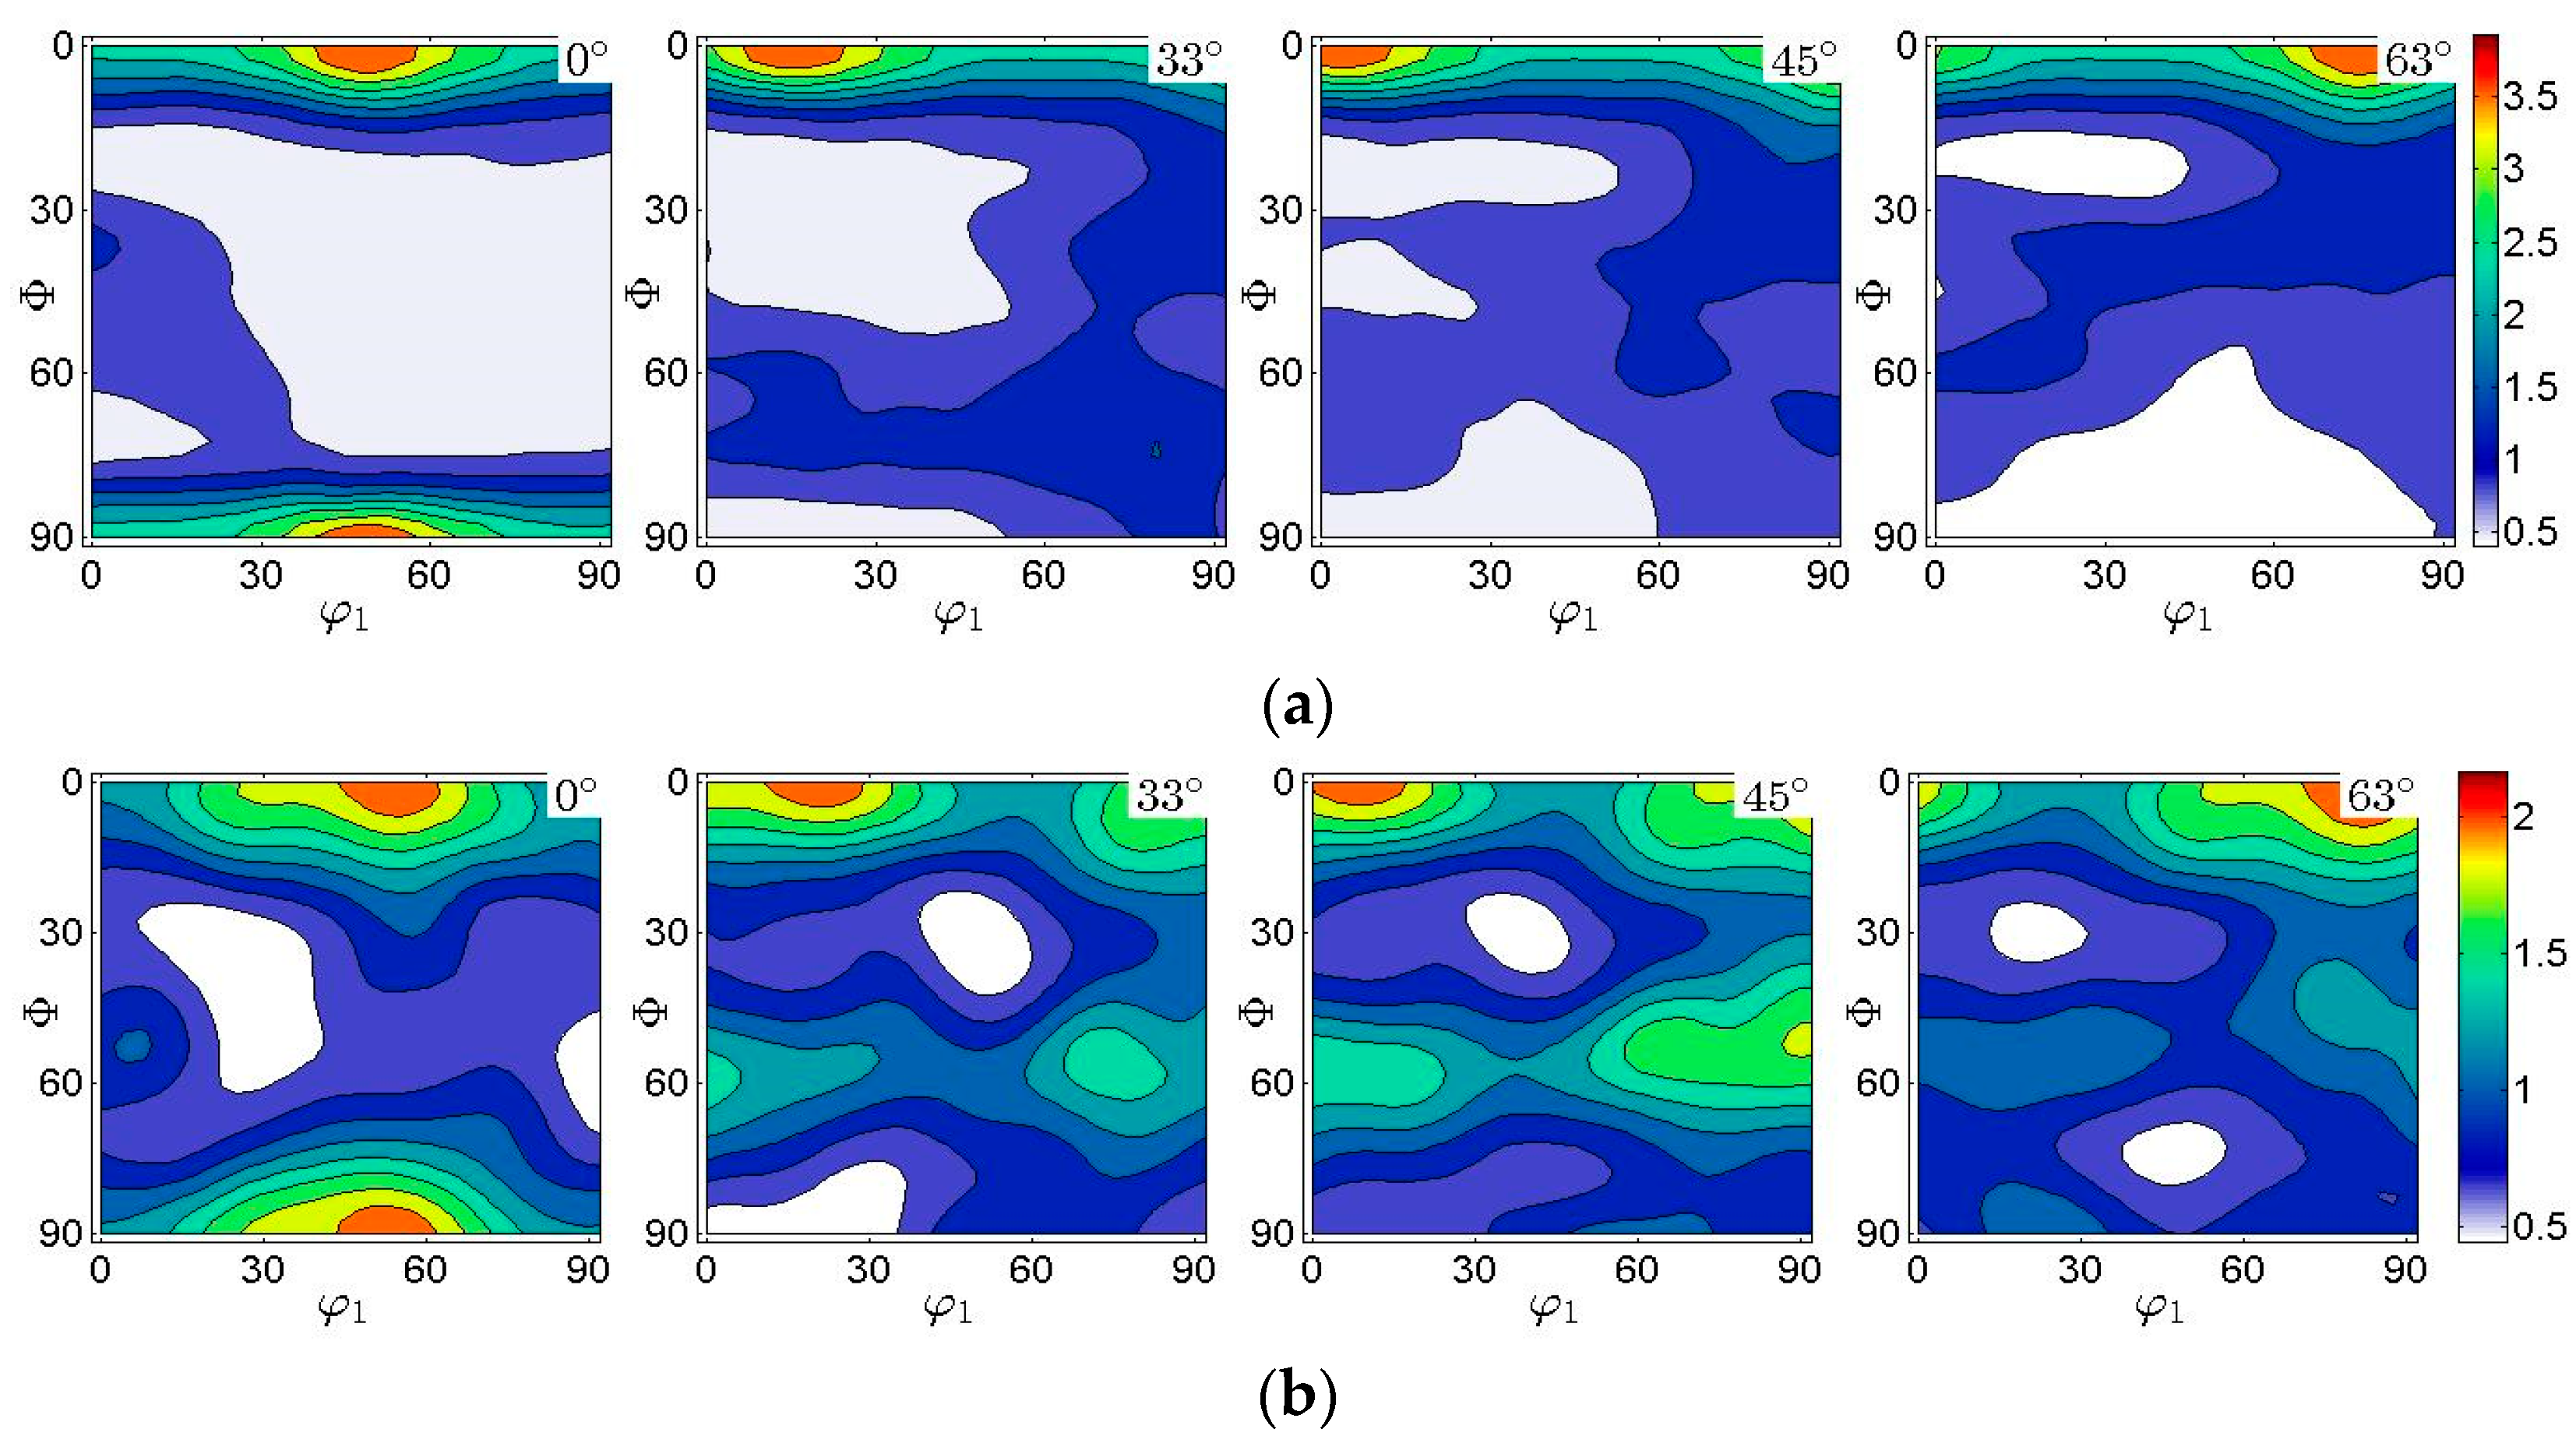
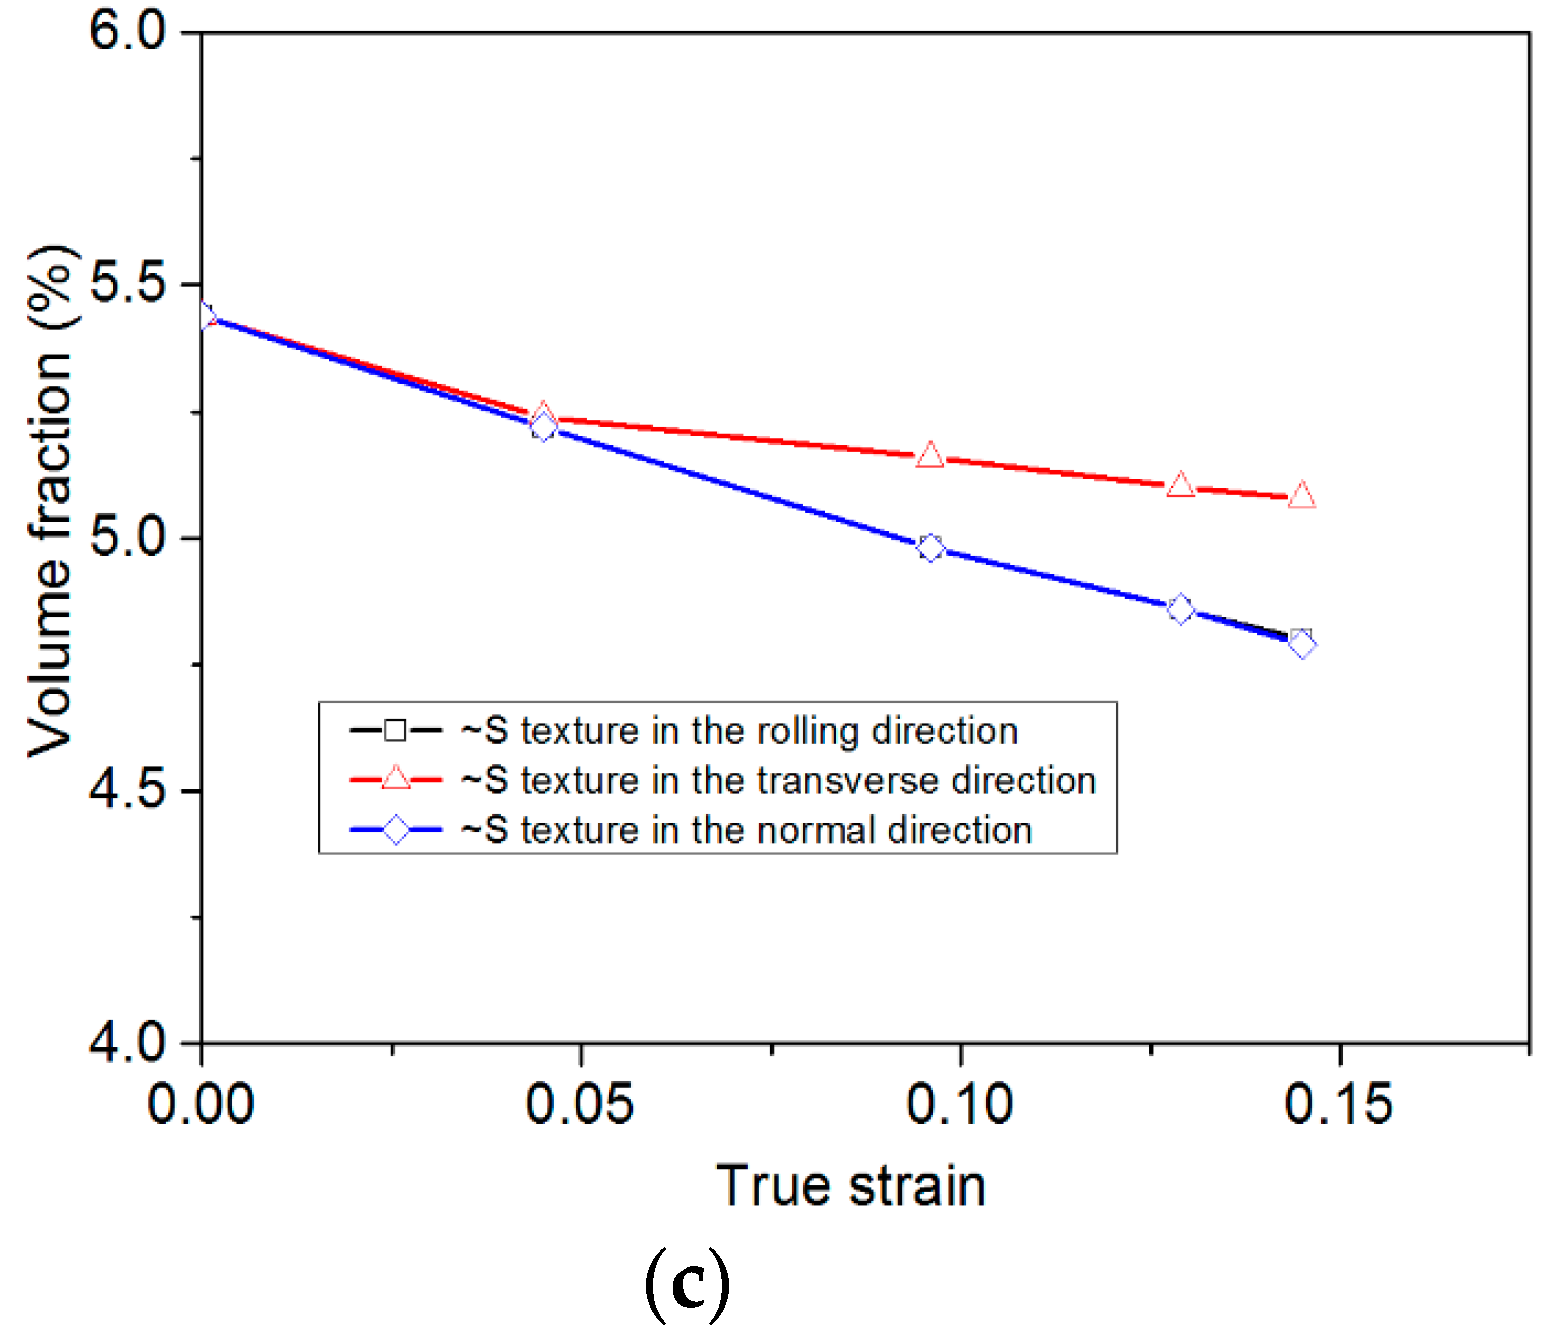
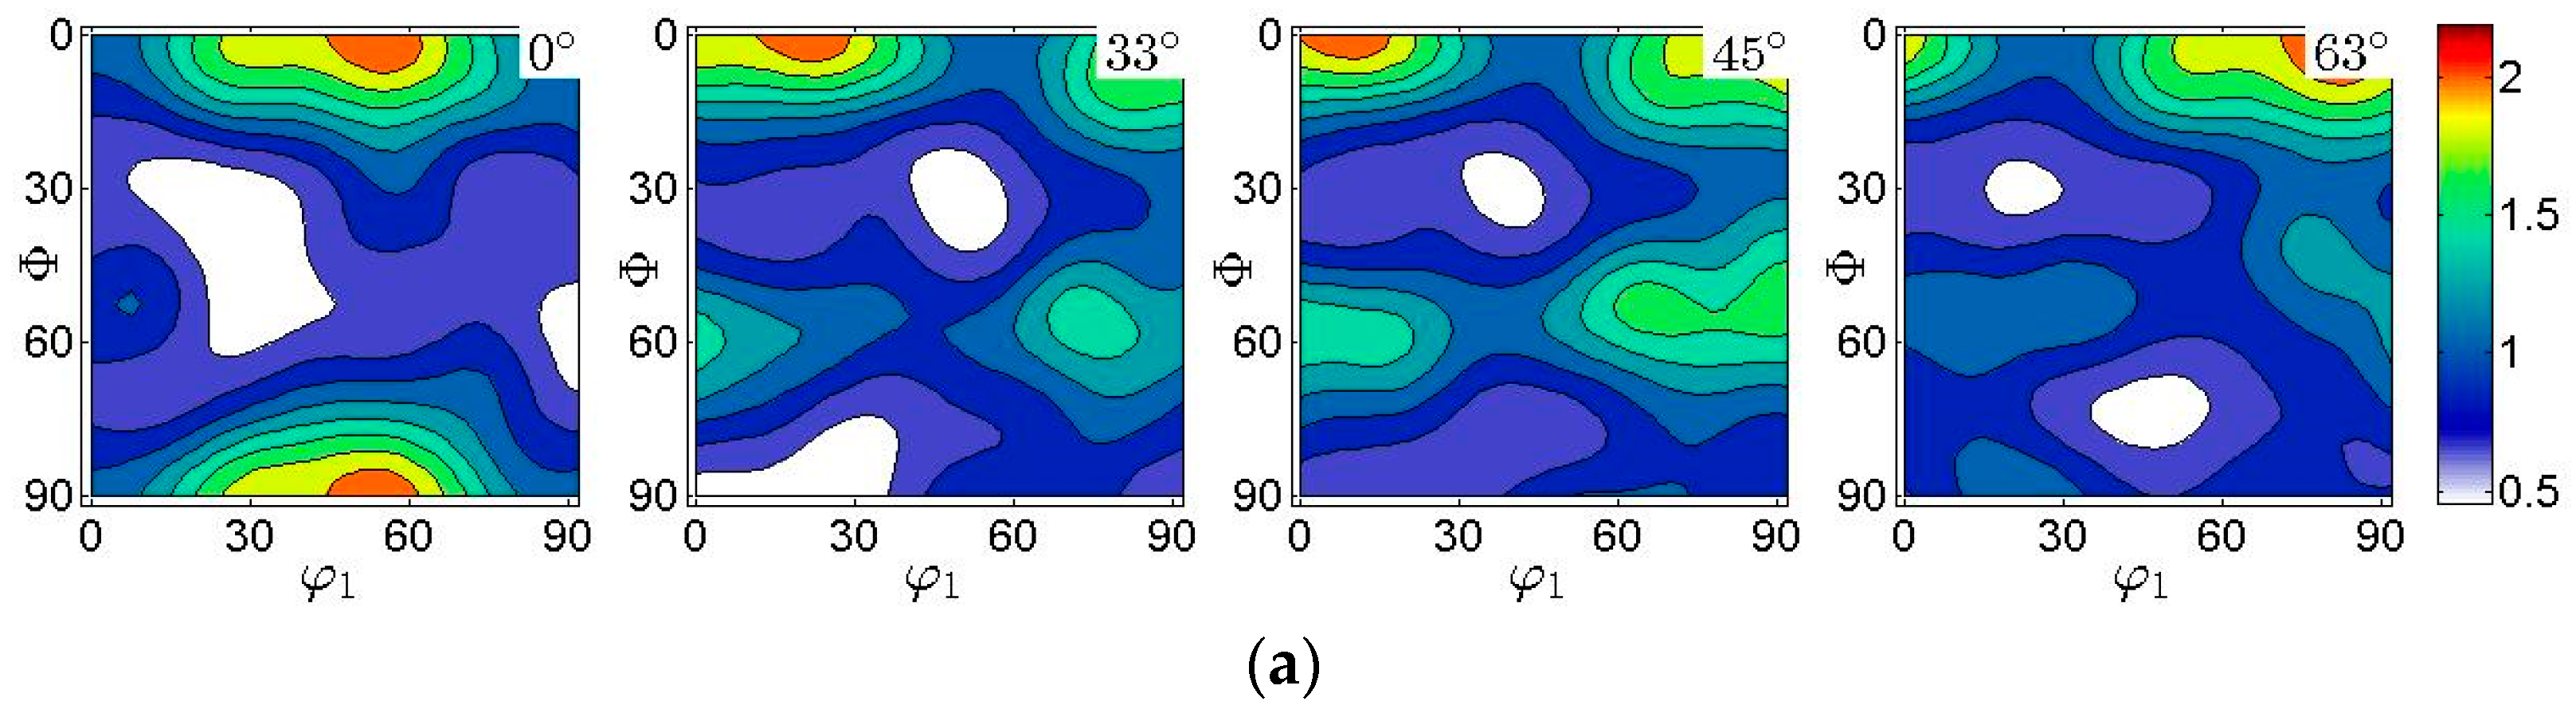
4.2. Textural Evolution of DP800

All polycrystalline materials contain a large number of grains with different orientations, and all the grains tend to become concentrated in specific directions during a deformation process [59,60]. The aggregation of grain orientation leads to texture formation and affects the macro-mechanical behavior. Hence, the study of textural evolution is necessary.
This section discusses the textural evolution of DP800 steel during uniaxial tensile experiments. The orientation distribution function (ODF) of the sample is calculated from the experimental pole figures and is used to generate 1000 sets of Euler angle data for CPFEM. For the BCC crystal, the important cross-sectional figures of the ODF at φ2 equal to 0°, 33°, 45°, and 63° are shown in Figure 10.
The results show that the DP800 steel mainly contains rotated cube (Rt-C), {111} <112>, and ~S textures, and the Rt-C texture is dominant (Figure 10 and Table 6). The texture volume fractions were quantitatively analyzed by the MTEX software (MTEX 4.2.1, Ralf Hielscher, Germany), an additional toolbox for MATLAB. The function “volume” of MTEX returns the ratio of an orientation similar to a given orientation (the center) within a misorientation tolerance (the radius) to the volume of the entire ODF. Here, the radius was set to 15°. The evolution of a series of textures of DP800 in different stretching directions is shown in Figure 11.
Examining the results in Figure 11a, the Rt-C texture is strengthened in all tension directions, and the Rt-C component increase is the fastest when the sample is stretched in the transverse direction. The calculation results show that the grain orientations generally follow the Rt-C texture direction during transverse stretching. For the {111} <112> texture, the volume fraction of the texture is almost constant, and the texture component is slightly reduced in all directions of stretching (Figure 11b). The ~S texture intensity also decreases in all stretching directions (Figure 11c).
The important ODF cross-sectional figures of the rolling-direction stretching process are shown in Figure 12, which shows the orientation distribution at overall strains of 0.050, 0.107, 0.125, and 0.161. Examining the ODF figures and Figure 10b, it is apparent that the Rt-C texture tends to intensify, which is consistent with the trend of the {110} and {200} pole figures.

4.3. Grain Deformation of DP800

From the previous section, we can conclude that the three main textures of DP800 steel are Rt-C, {111} <112>, and ~S, with the corresponding three sets of Euler angles as (45° 0° 0°), (90° 55° 45°), and (75° 37° 63°). In this section, the corresponding strain rates, strains, and dislocation densities of the slip systems of the center orientation grains corresponding to the DP800 steel textures are studied under tensile deformation. The BCC crystal has 24 slip systems, and the corresponding slip systems are listed in Table 7.
Due to the differences in the Schmid factor, the shear stress of each slip system is different. In addition, the shear strain rates of the slip systems can be calculated by the corresponding shear stress, based on the kinetic law of the slip systems. For the grains corresponding to the texture center orientation of DP800, the strain rates of the slip systems under rolling-direction stretching are shown in Figure 13.
Comparing the slip strain rates in different orientations, the initial orientation has a decisive influence on the activity of the slip system during deformation. Under stretching, the strain rates of the ferrite slip systems are decreased with increasing macro strain, and the corresponding strain rates of the martensite slip systems are increased. However, the absolute values of the ferrite strain rates remain higher than those of martensite. From the distribution of average strain rates, the main active slip systems of DP800 steel are {112} <111>. In addition, the absolute values of the strain rates of the {112} <111> slip systems are similar, indicating that the textures of the steel are weak and the crystal orientations close to random, consistent with the results of the pole figures (Figure 5). As can be clearly seen in Figure 13, the strain rates of the {112} <111> slip systems are significantly larger than the strain rates of the {110} <111> slip systems. This could be caused by the higher strain rate sensitivity index amplifying the difference in the Schmid factors of the different slip systems.
Figure 14 presents the strain distributions of all slip systems. Corresponding to Figure 4, the strain partitioning of the same orientation of ferrite and martensite is consistent with the phase strain. In comparing Figure 14g,h, the strain of ferrite is much higher than that of martensite in the early stage of deformation. However, the martensite strain increases rapidly with increased macro strain. It is speculated that the rapid increase in ferrite slip strain in the early stage of stretching is the cause of the rapid hardening of ferrite, which leads to a high hardening rate of DP800 steel in the initial plastic stage.
In order to analyze the evolution of dislocation density of different slip systems, the dislocation densities of grains with different orientations were extracted, with the results shown in Figure 15. The dislocation densities on the active slip systems are very large, while those of the inactive slip systems retain their initial values. Compared with the strain distribution and the dislocation density data, it can be seen that the dislocation densities of the large-strain slip systems are higher than those of the smaller-strain slip systems. In addition, all the dislocation densities of the active slip systems are much higher than the overall average values. However, for all active slip systems, the differences in dislocation density among slip systems is not as disproportionate as the differences in corresponding strains. This arises from the fact that the dislocation evolution law includes an annihilation mechanism, and as the dislocation density increases, the annihilation rate increases. Hence, the overall dislocation density tends to become saturated. According to the results of dislocation evolution, the active slip systems are decisive in the hardening of grains, and the inactive slip systems do not contribute to strain hardening.

5. Summary and Conclusions

In this study, a multiphase mixed hardening model incorporating the strain partitioning of each phase was proposed to describe the mechanical behavior of DP800 steel. For establishing this model, the single-crystal material parameters of each phase were first set, and then the strain partitioning equation of each constituent phase was determined by in situ stretching experiments. This hardening model was used to analyze the macro-mechanical response, textural evolution, and grain deformation behavior of DP800 steel, and the results were analyzed and discussed. The calculated results are consistent with the experimental results and existing literature. According to the analysis of hardening and deformation behavior of DP steel, the following conclusions can be drawn:
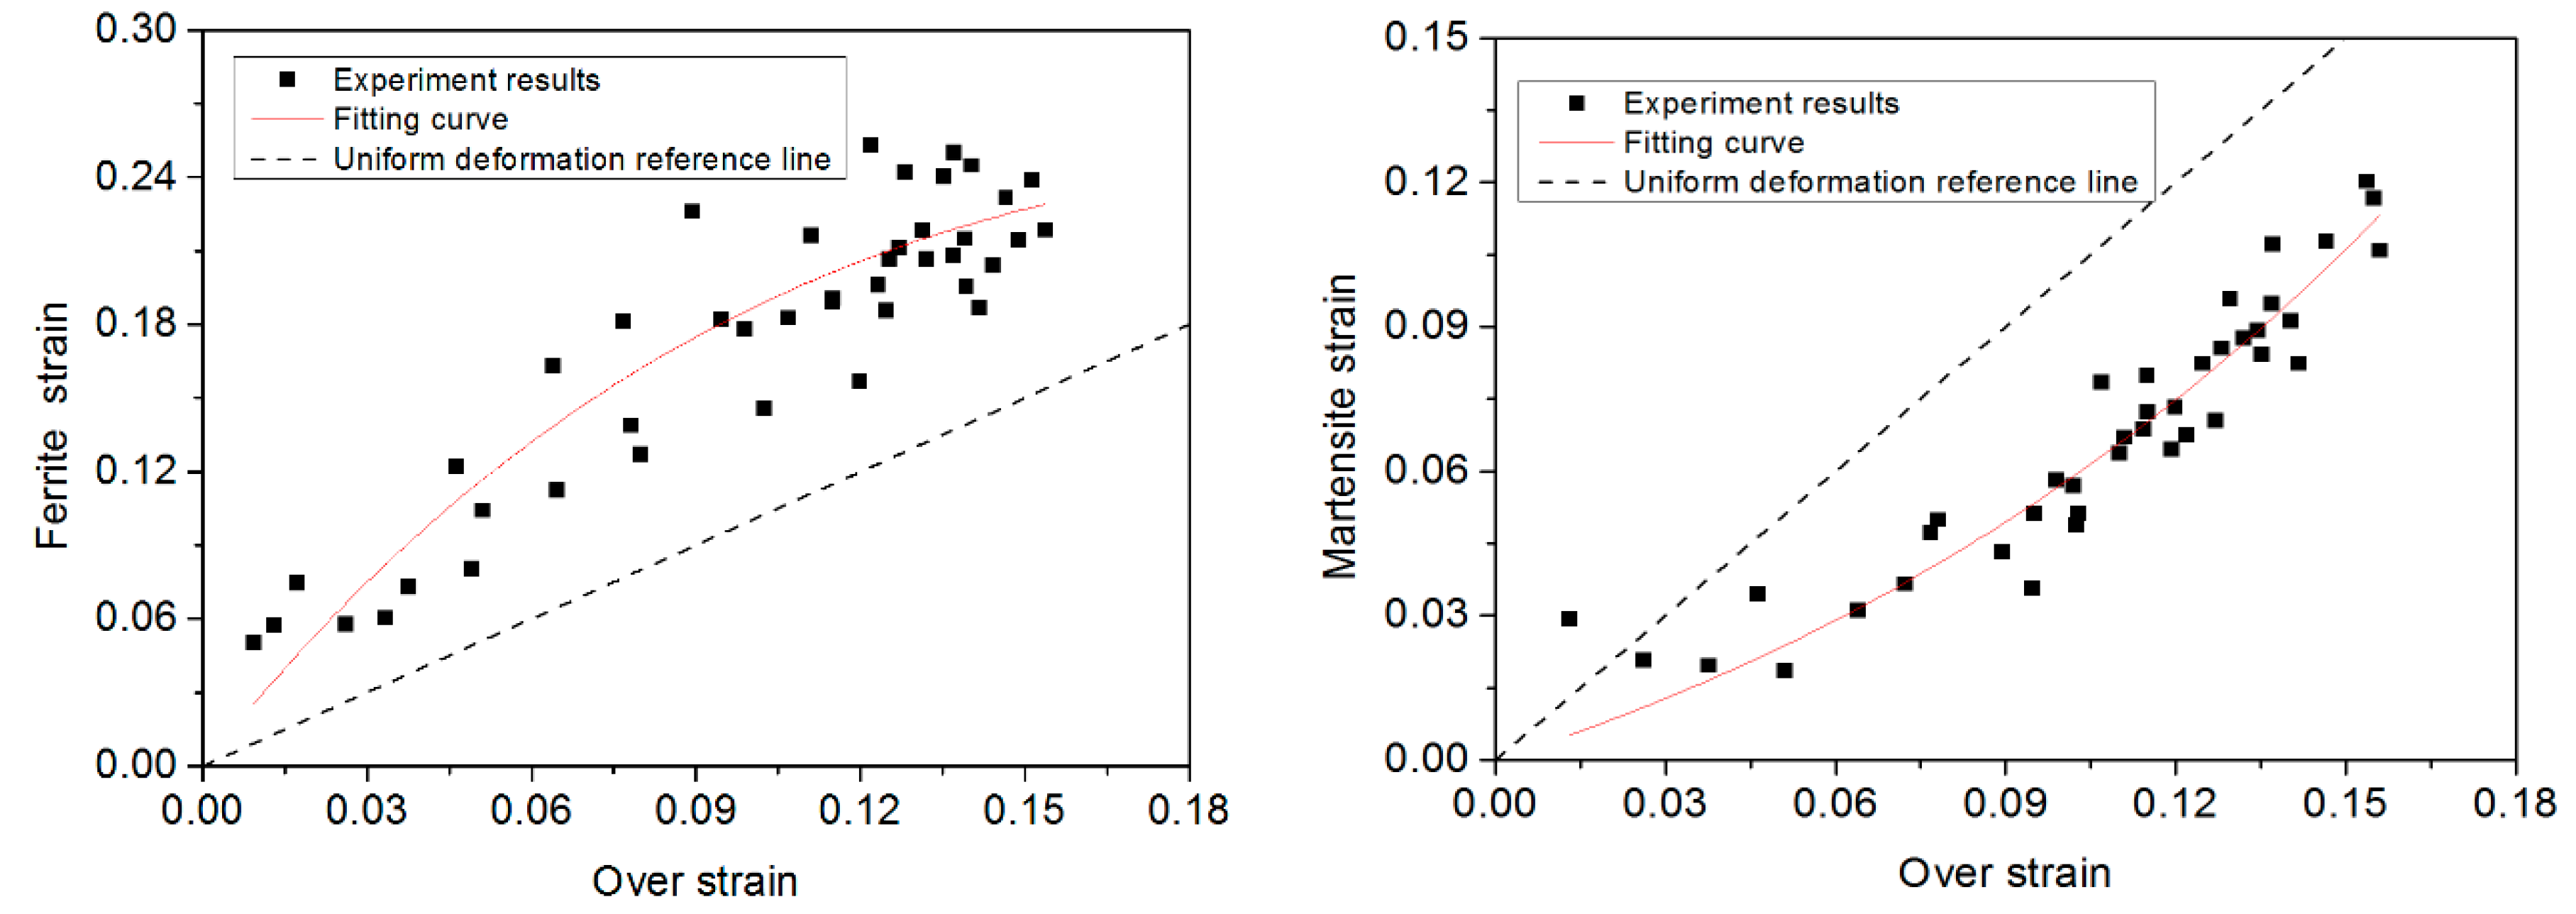
  • For DP800 steel, the initial strain of the soft ferrite phase is greater than the overall strain, which leads to the rapid hardening of the ferrite. This hardening phenomenon of ferrite promotes a higher overall hardening rate in early deformation, and this mechanism can explain the initial high hardening rate of DP steels.
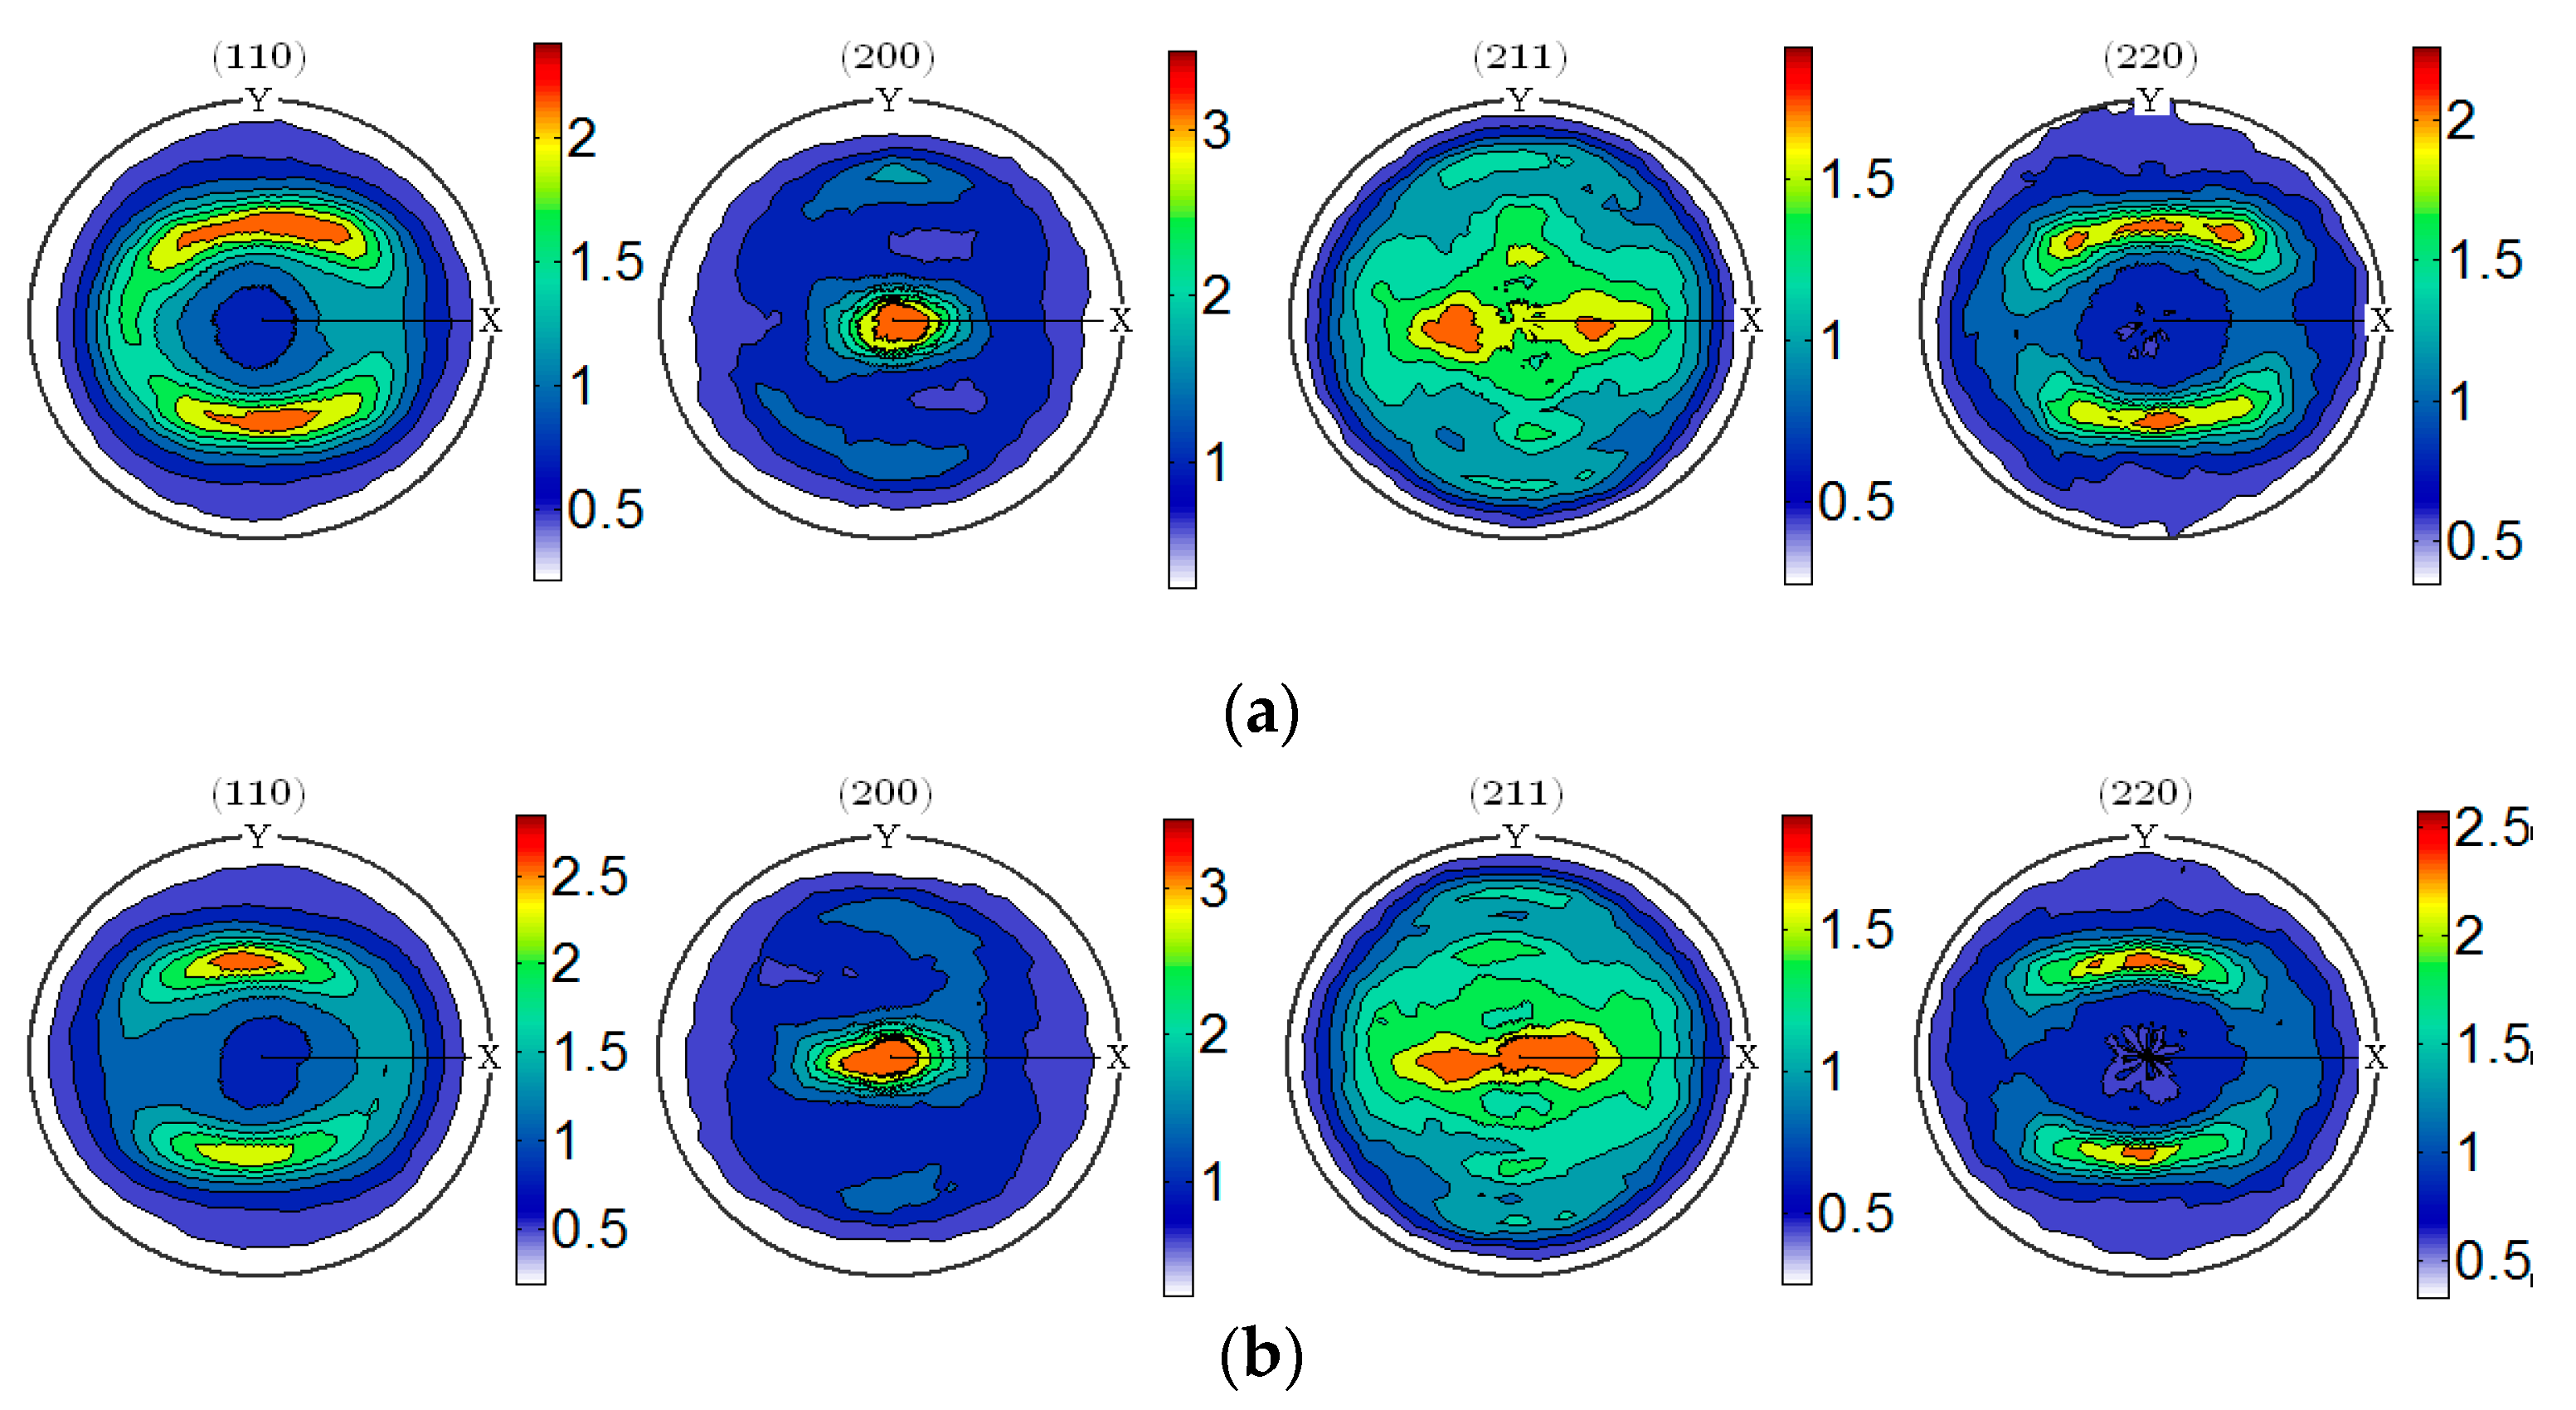
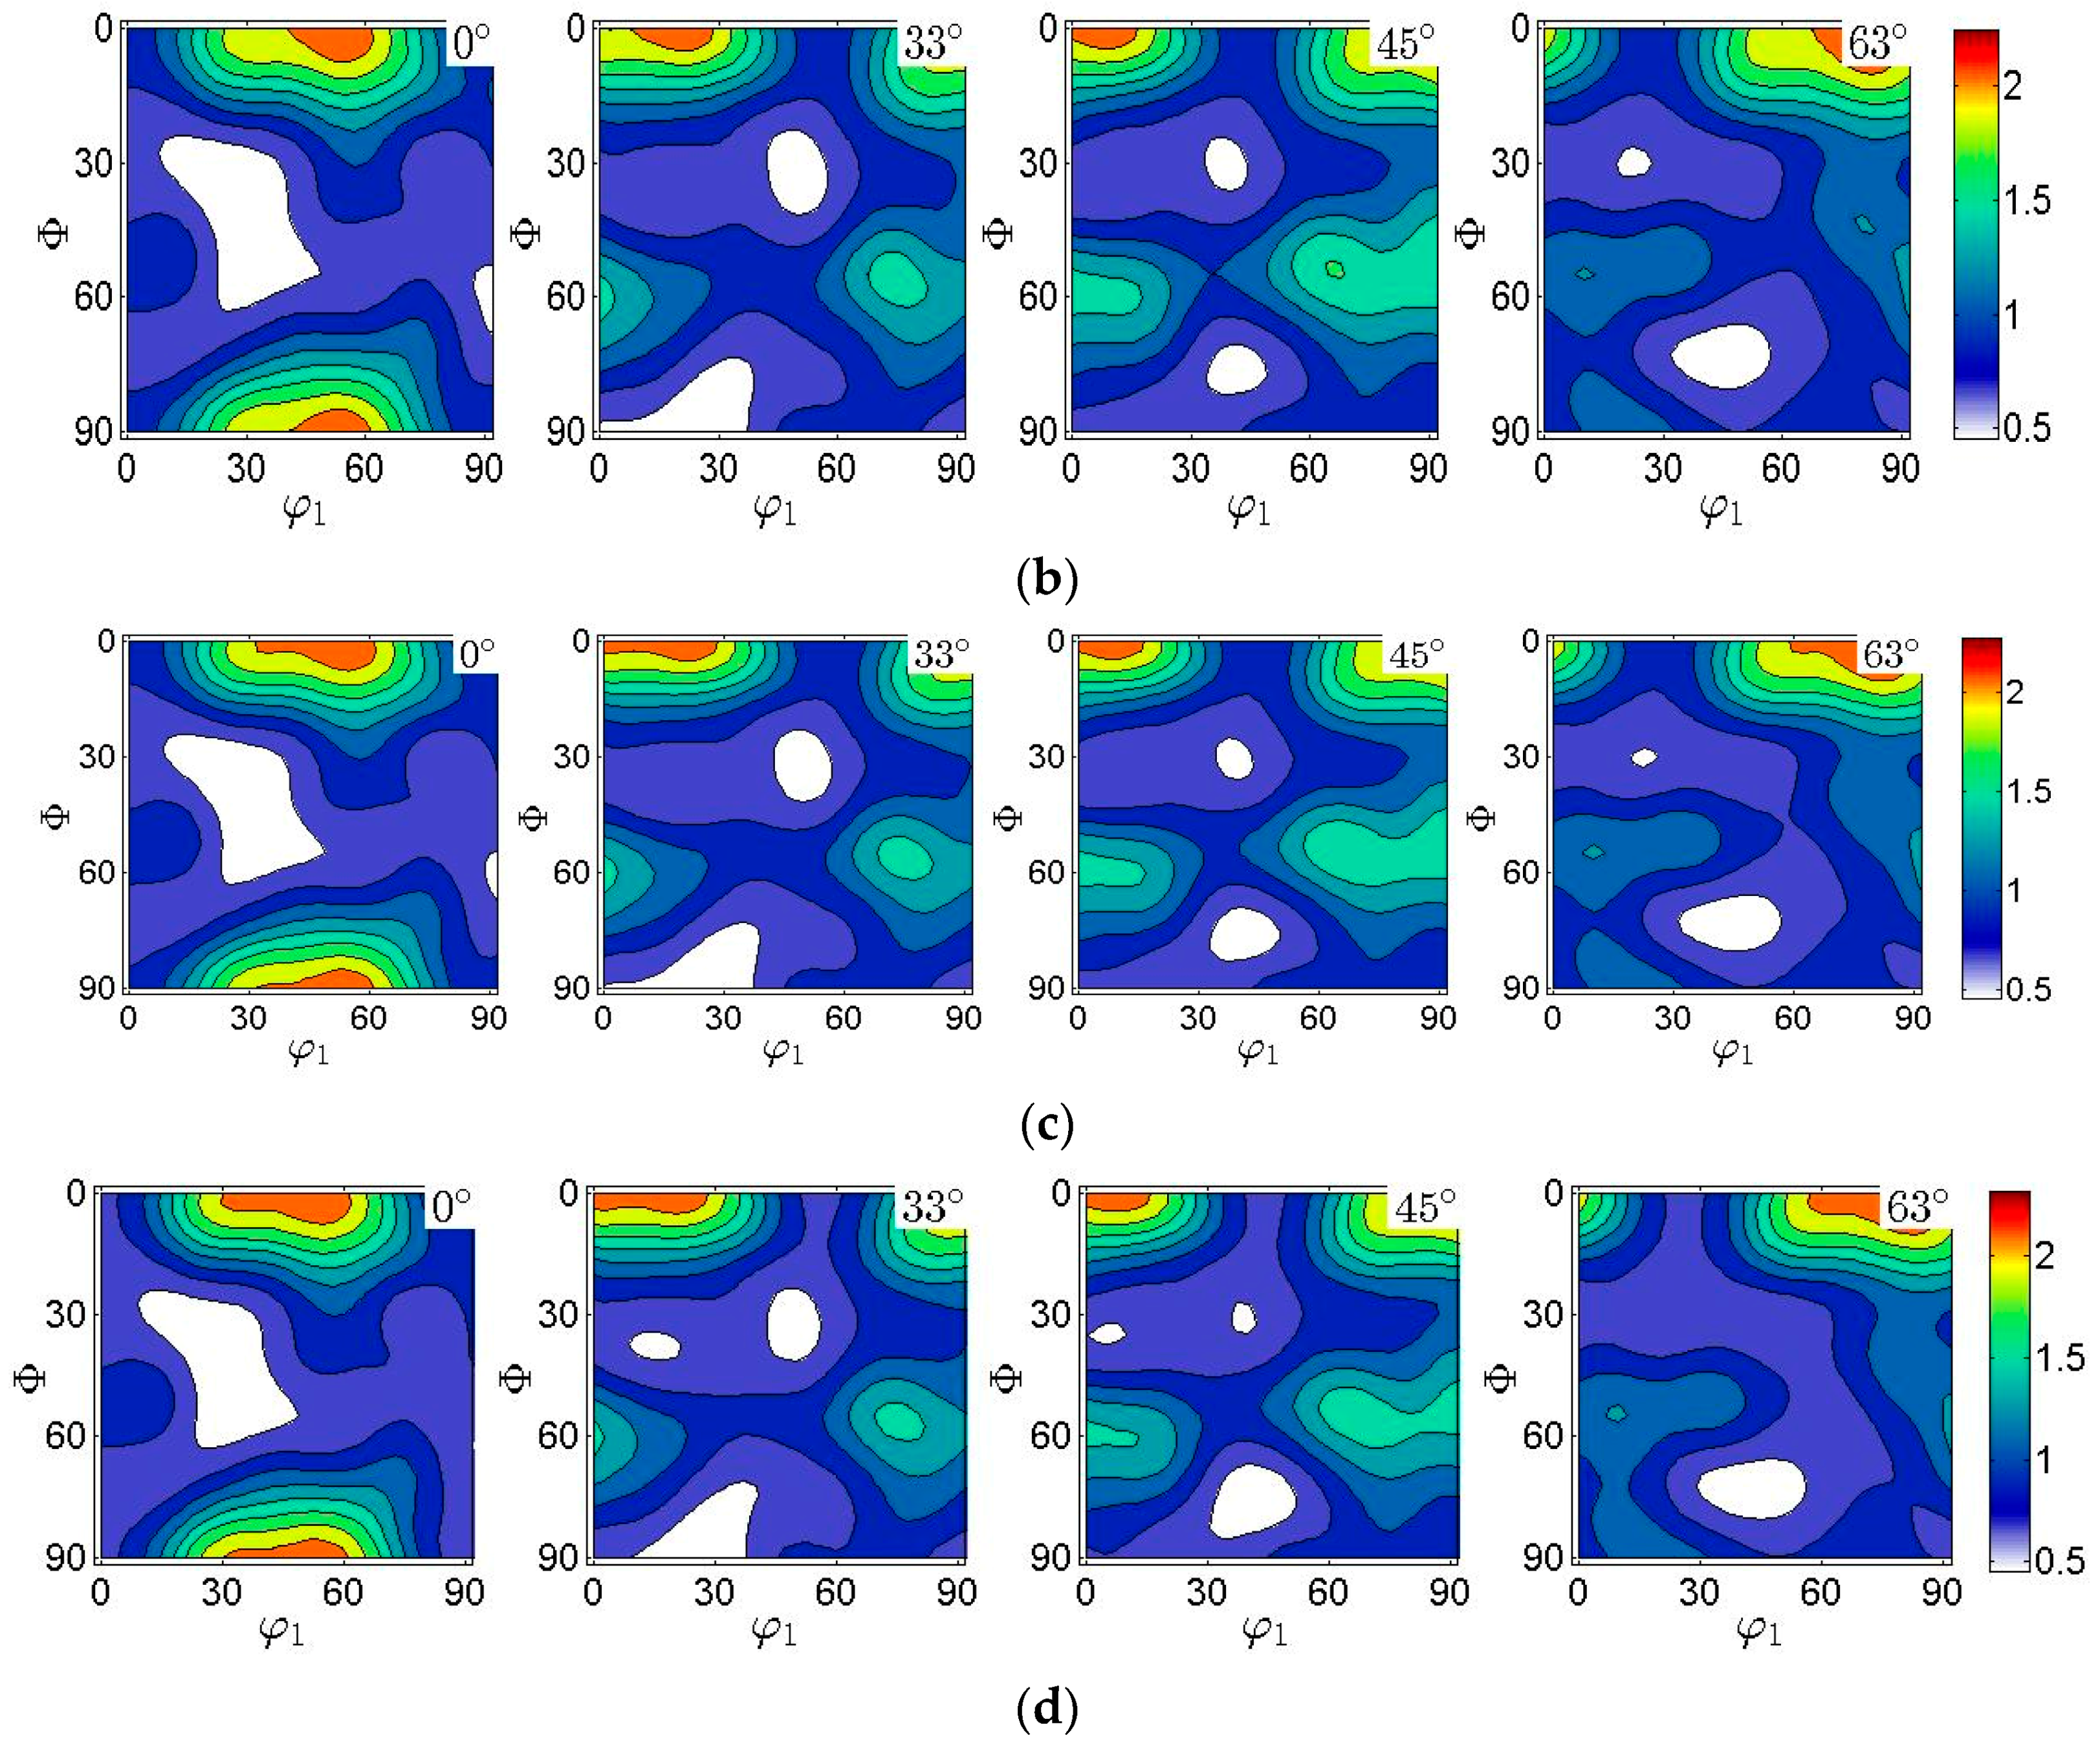
  • Probing the evolution of texture, the initial texture of DP steel is weak and grain orientations tend to be random. However, as the deformation increases, the DP steel tends to enhance the Rt-C texture.
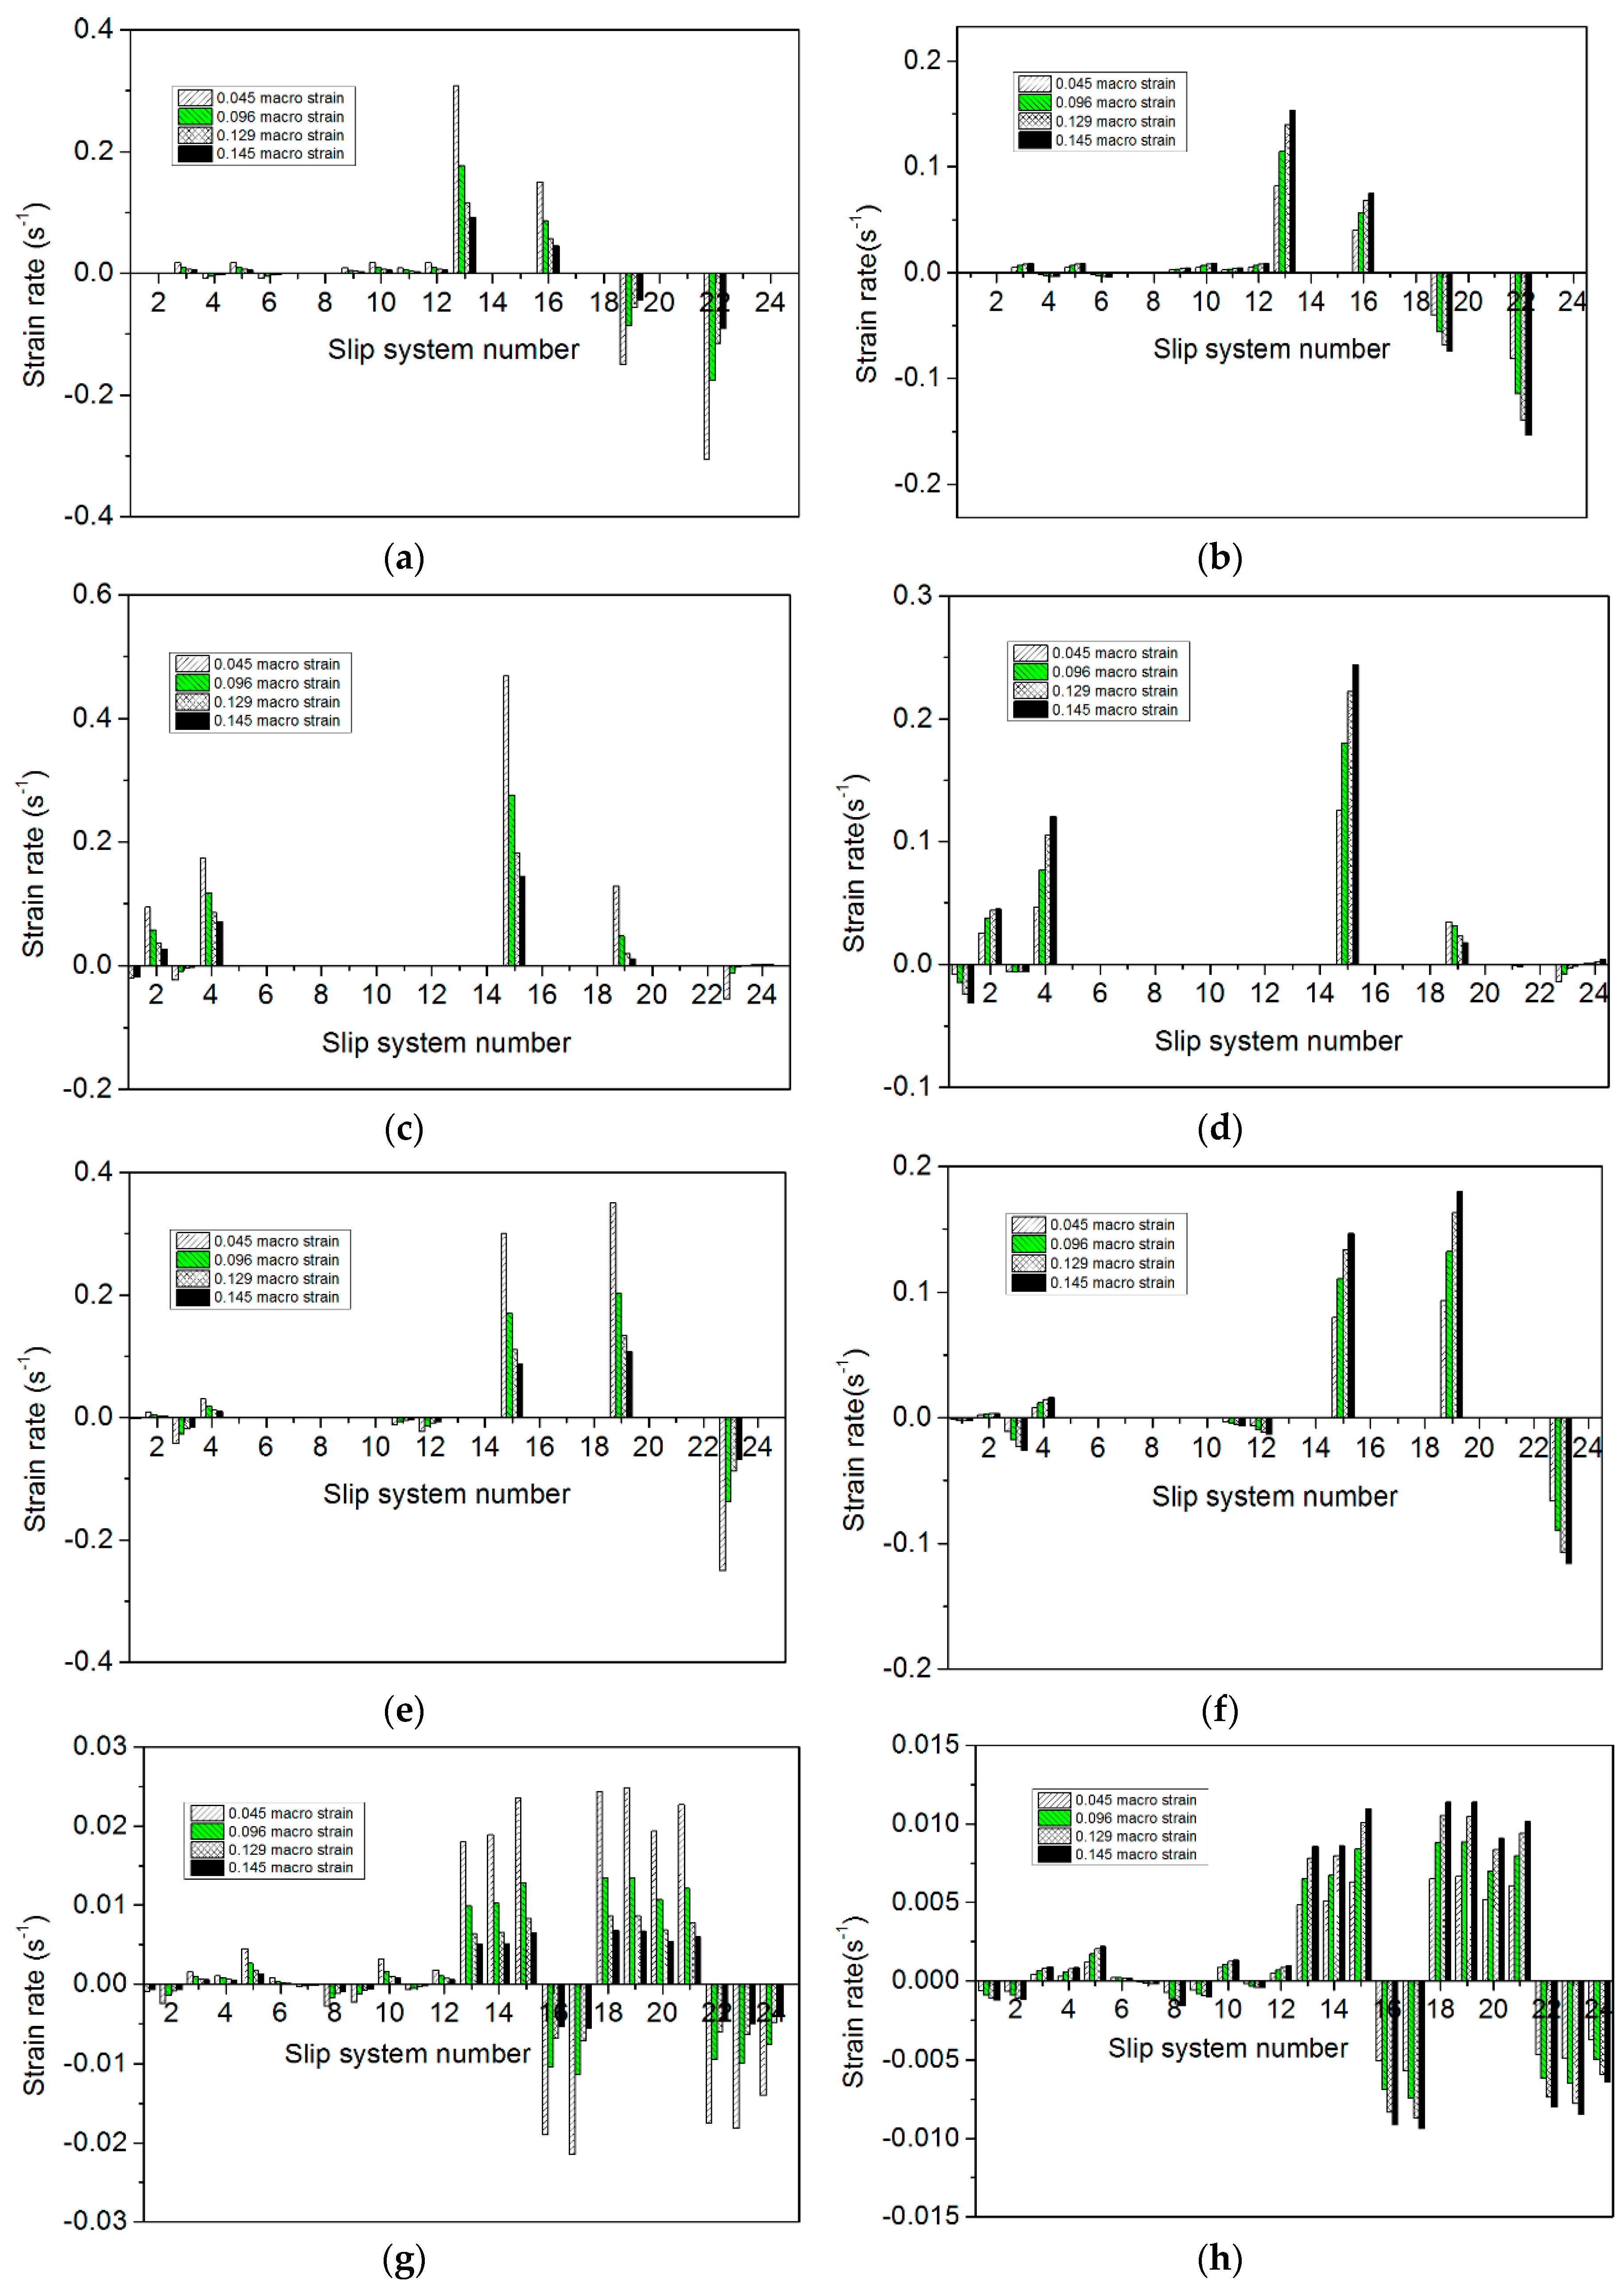
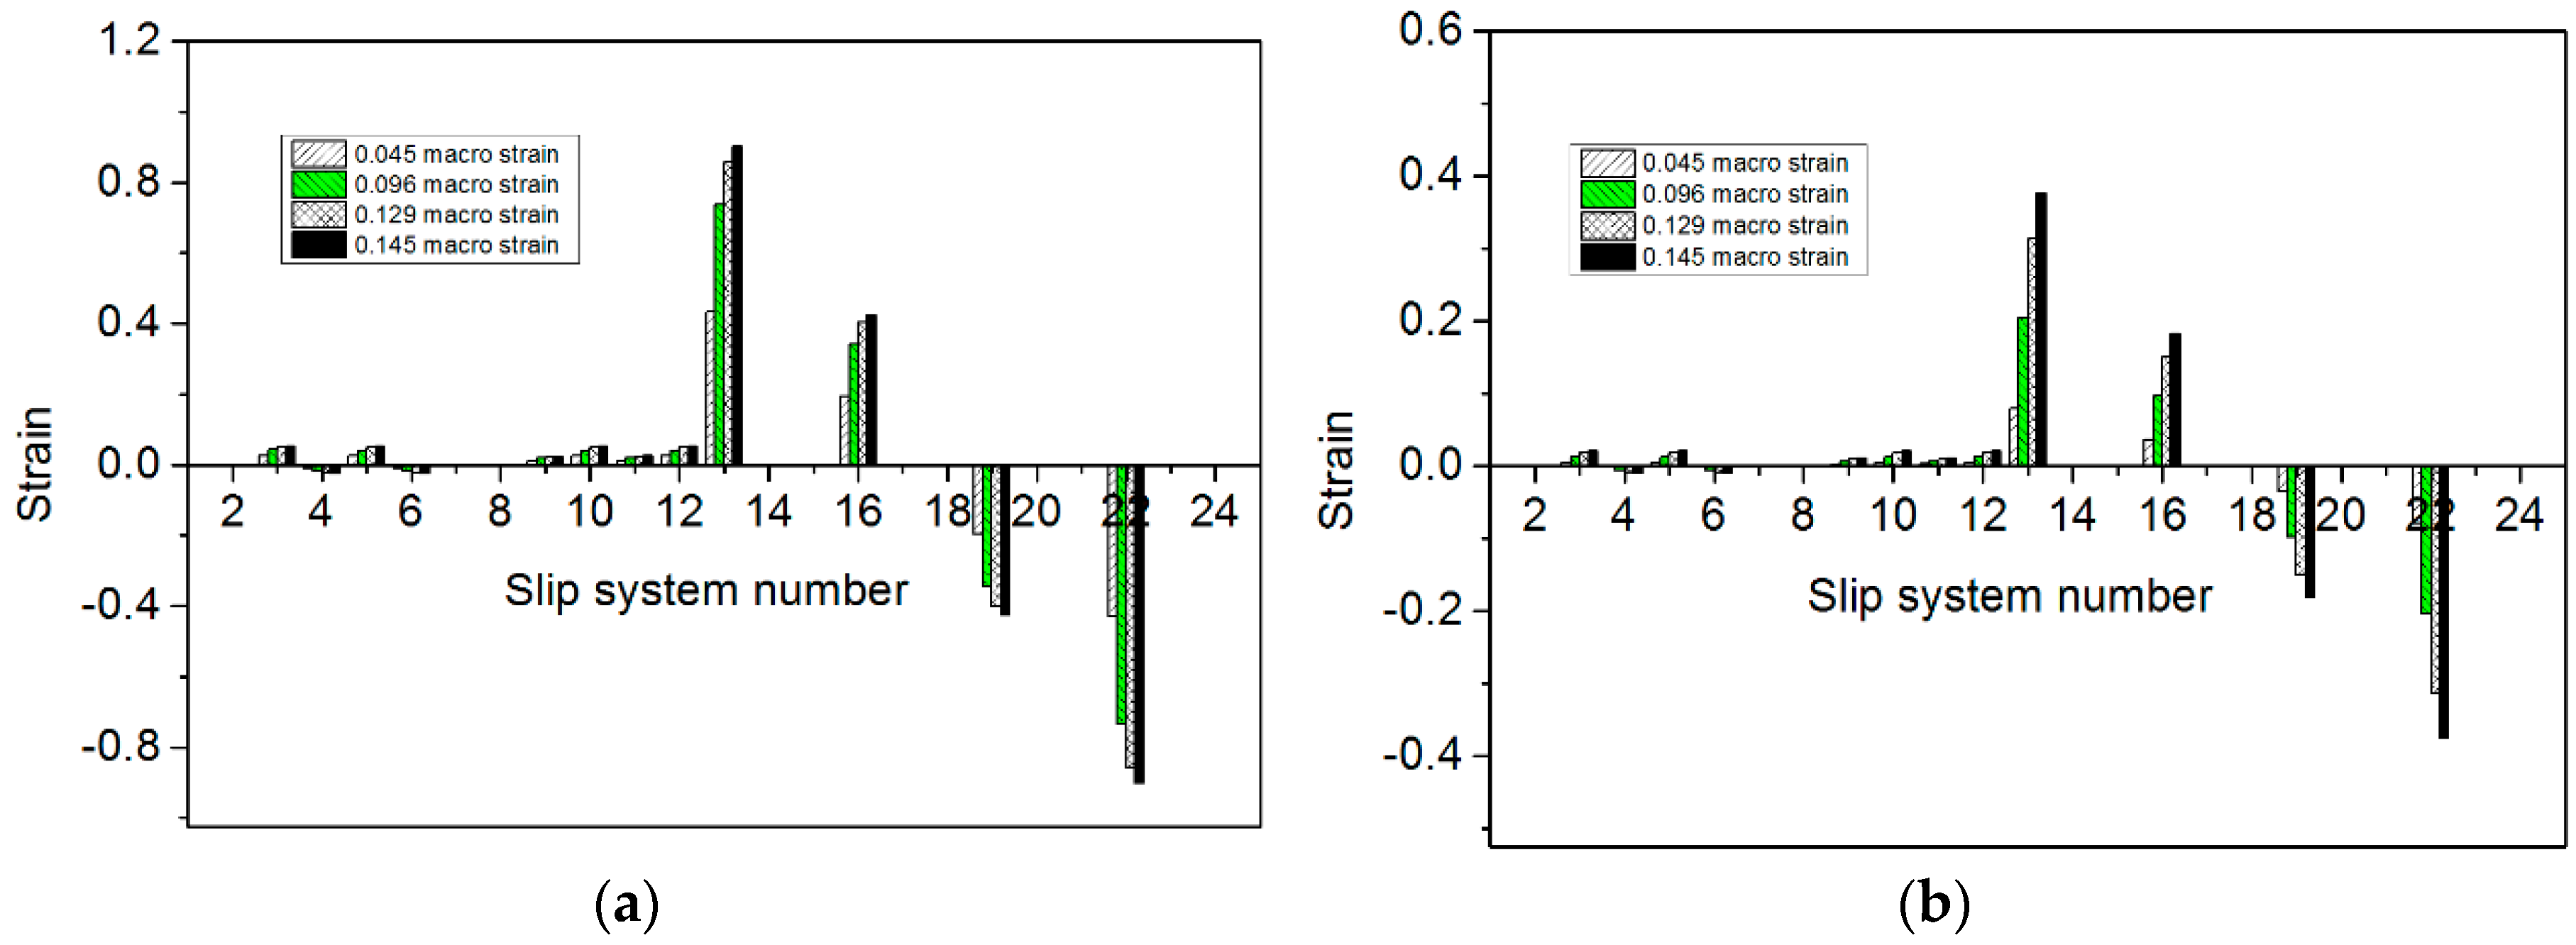
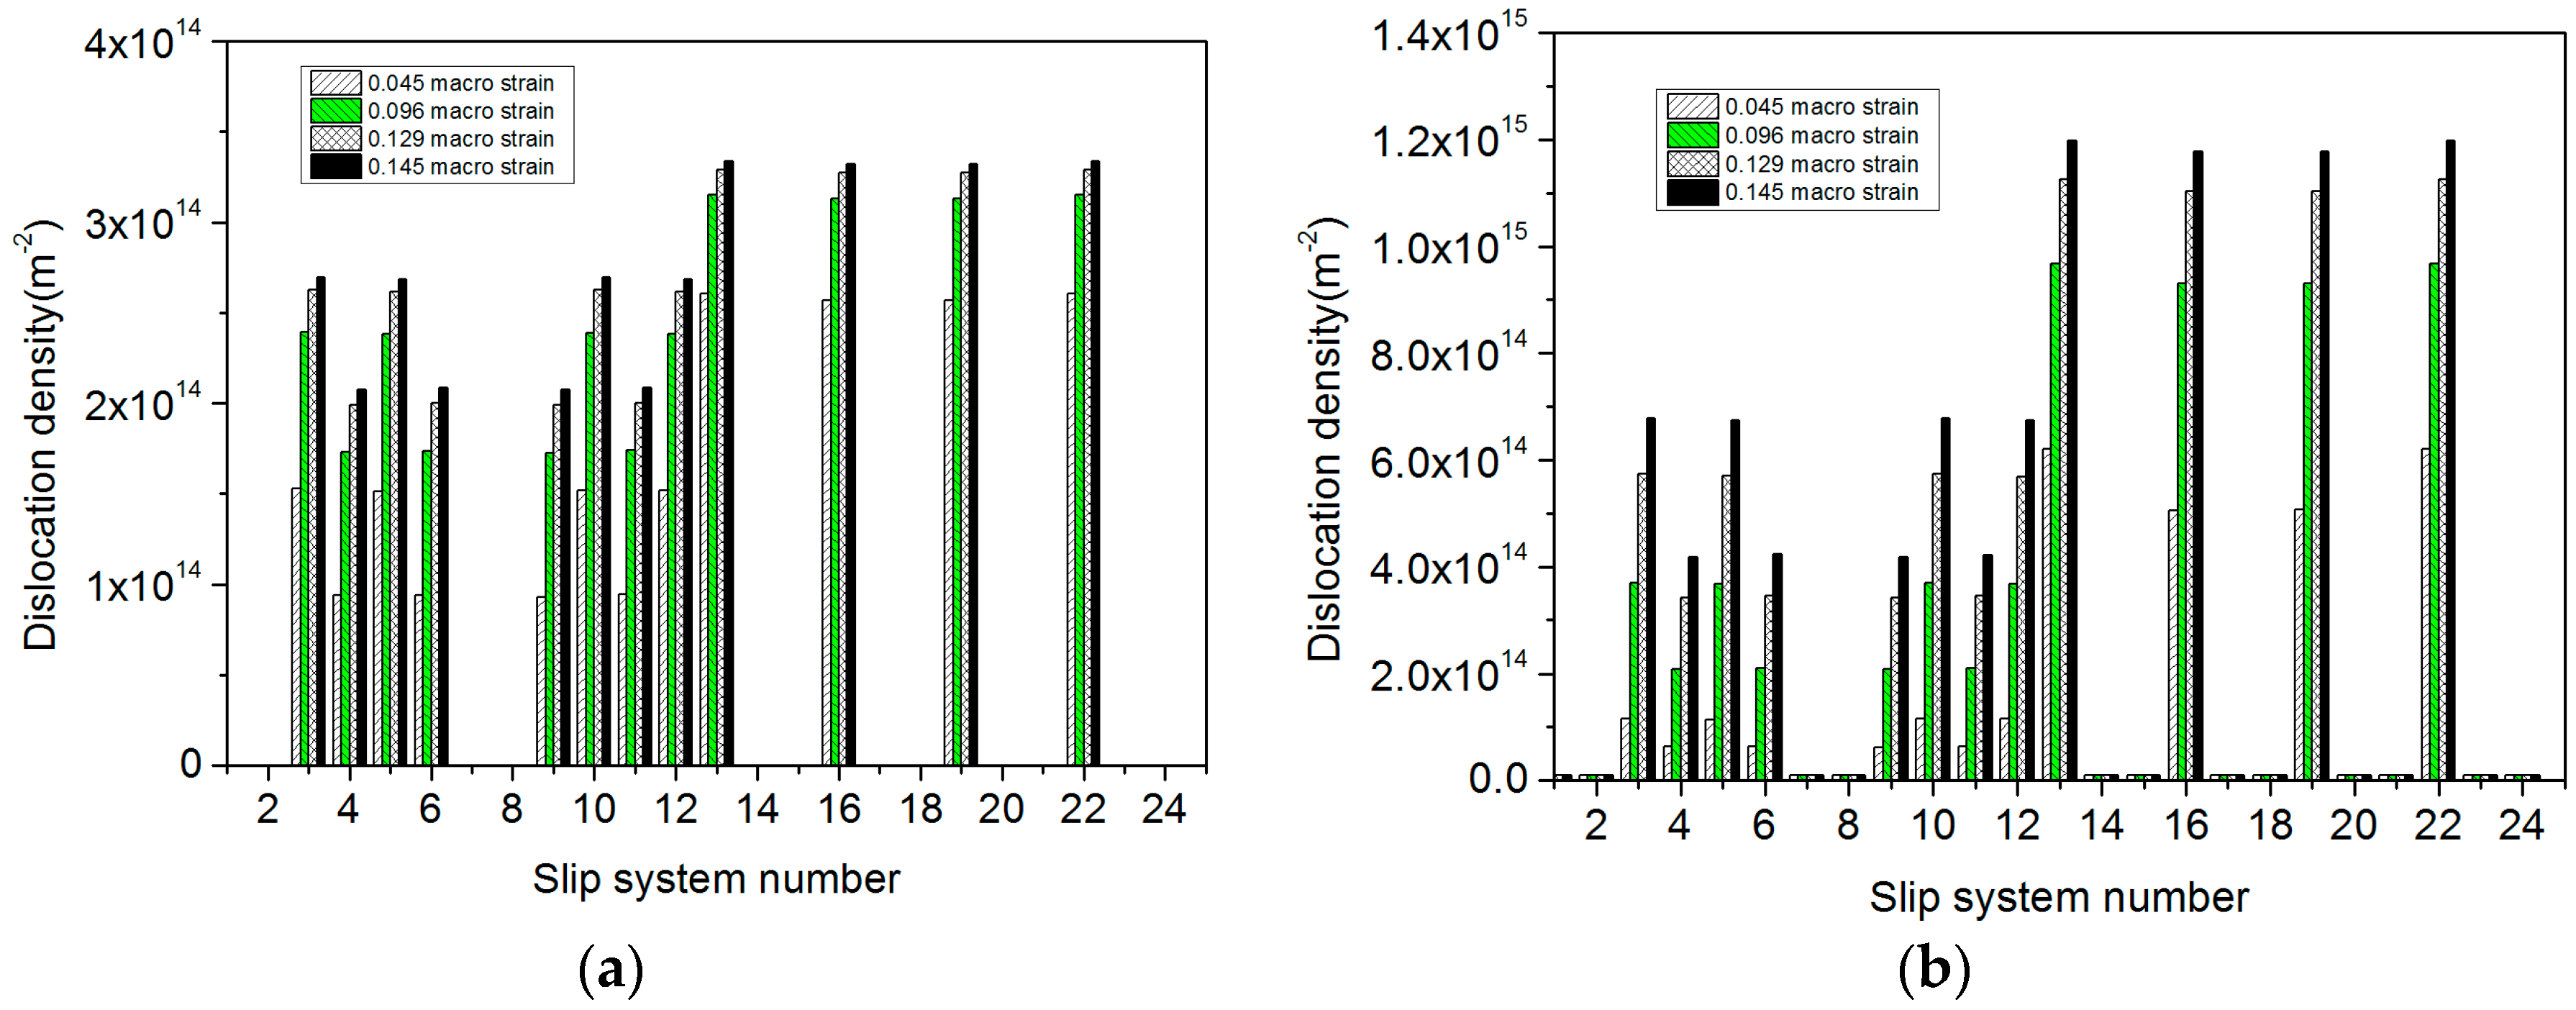
  • The plastic deformation of DP800 is mainly concentrated in the {112} <111> slip systems, and the activities of the slip systems are closely related to the crystal orientations. The average strain of each slip system is significantly different, but the average dislocation density is similar.

Author Contributions

Methodology, Y.X. and W.D.; Software, Y.X. and T.H.; Validation, W.Z.; Investigation, W.D. and C.R.; Data Curation, C.R. and T.H.; Writing-Original Draft Preparation, Y.X.; Writing-Review & Editing, W.D.; Project Administration, W.Z.

Funding

This research received no external funding.

Conflicts of Interest

The authors declare no conflict of interest.

References

  1. Kuziak, R.; Kawalla, R.; Waengler, S. Advanced high strength steels for automotive industry. Arch. Civ. Mech. Eng. 2008, 8, 103–117. [Google Scholar] [CrossRef]
  2. Tasan, C.C.; Diehl, M.; Yan, D.; Bechtold, M.; Roters, F.; Schemmann, L.; Zheng, C.; Peranio, N.; Ponge, D.; Koyama, M.; et al. An Overview of Dual-Phase Steels: Advances in Microstructure-Oriented Processing and Micromechanically Guided Design. Annu. Rev. Mater. Res. 2015, 45, 391–431. [Google Scholar] [CrossRef]
  3. Hardwick, A.P.; Outteridge, T. Vehicle lightweighting through the use of molybdenum-bearing advanced high-strength steels (AHSS). Int. J. Life Cycle Assess. 2016, 21, 1616–1623. [Google Scholar] [CrossRef]
  4. Bleck, W.; Papaefthymiou, S.; Frehn, A. Microstructure and Tensile Properties in Dual Phase and Trip Steels. Steel Res. Int. 2004, 75, 704–710. [Google Scholar] [CrossRef]
  5. Papaefthymiou, S.; Prahl, U.; Bleck, W.; Zwaag, S.V.D.; Sietsma, J. Experimental observations on thecorrelation between microstructure andfracture of multiphase steels. Int. J. Mater. Res. 2006, 97, 1723–1731. [Google Scholar] [CrossRef]
  6. Ghassemi-Armaki, H.; Maaß, R.; Bhat, S.P.; Sriram, S.; Greer, J.R.; Kumar, K.S. Deformation response of ferrite and martensite in a dual-phase steel. Acta Mater. 2014, 62, 197–211. [Google Scholar] [CrossRef]
  7. Yu, H.Y.; Shen, J. Evolution of mechanical properties for a dual-phase steel subjected to different loading paths. Mater. Des. 2014, 63, 412–418. [Google Scholar] [CrossRef]
  8. Mazaheri, Y.; Kermanpur, A.; Najafizadeh, A. Nanoindentation study of ferrite-martensite dual phase steels developed by a new thermomechanical processing. Mater. Sci. Eng. A 2015, 639, 8–14. [Google Scholar] [CrossRef]
  9. Rui, A.; Santosa, A.D.; Lopes, A. Mechanical properties determination of dual-phase steels using uniaxial tensile and hydraulic bulge test. Cienc. E Technol. Mater. 2017, 29, e239–e243. [Google Scholar]
  10. Paul, S.K.; Mukherjee, M. Determination of bulk flow properties of a material from the flow properties of its constituent phases. Comput. Mater. Sci. 2014, 84, 1–12. [Google Scholar] [CrossRef]
  11. Xiong, Z.P.; Saleh, A.A.; Kostryzhev, A.G.; Pereloma, E.V. Strain-induced ferrite formation and its effect on mechanical properties of a dual phase steel produced using laboratory simulated strip casting. J. Alloys Compd. 2017, 721, 291–306. [Google Scholar] [CrossRef]
  12. Kadkhodapour, J.; Butz, A.; Ziaei-Rad, S.; Schmauder, S. A micro mechanical study on failure initiation of dual phase steels under tension using single crystal plasticity model. Int. J. Plast. 2011, 27, 1103–1125. [Google Scholar] [CrossRef]
  13. Woo, W.; Em, V.T.; Kim, E.Y.; Han, S.H.; Han, Y.S.; Choi, S.H. Stress-strain relationship between ferrite and martensite in a dual-phase steel studied by in situ neutron diffraction and crystal plasticity theories. Acta Mater. 2012, 60, 6972–6981. [Google Scholar] [CrossRef]
  14. Kim, J.H.; Kim, D.; Barlat, F.; Lee, M.G. Crystal plasticity approach for predicting the Bauschinger effect in dual-phase steels. Mater. Sci. Eng. A 2012, 53, 259–270. [Google Scholar] [CrossRef]
  15. Prahl, U.; Papaefthymiou, S.; Uthaisangsuk, V.; Bleck, W.; Sietsma, J.; Zwaag, S.V.D. Micromechanics-based modelling of properties and failure of multiphase steels. Comput. Mater. Sci. 2007, 39, 17–22. [Google Scholar] [CrossRef]
  16. Kim, D.K.; Kim, E.Y.; Han, J.; Woo, W.; Choi, S.H. Effect of microstructural factors on void formation by ferrite/martensite interface decohesion in DP980 steel under uniaxial tension. Int. J. Plast. 2017, 9, 3–23. [Google Scholar] [CrossRef]
  17. Ogata, S.; Mayama, T.; Mine, Y.; Takashima, K. Effect of microstructural evolution on deformation behavior of pre-strained dual-phase steel. Mater. Sci. Eng. A 2017, 68, 353–365. [Google Scholar] [CrossRef]
  18. Tamura, I.; Tomota, Y.; Yamaoka, Y.; Kanatani, S.; Ozawa, M.; Akao, A. The Strength and Ductility of Two-phase Iron Alloys. Tetsu Hagane 1973, 59, 283–292. [Google Scholar]
  19. Araki, K.; Takada, Y.; Nakaoka, K. Work hardening of continuously annealed dual phase steels. Trans. Iron Steel Inst. Jpn. 1977, 17, 710–717. [Google Scholar]
  20. Tomota, Y.; Umemoto, M.; Komatsubara, N.; Hiramatsu, A.; Nakajima, N.; Moriya, A.; Higo, Y. Prediction of mechanical properties of multi-phase steels based on stress-strain curves. ISIJ Int. 1992, 32, 343–349. [Google Scholar] [CrossRef]
  21. Kuang, S.; Kang, Y.; Yu, H.; Liu, R.D. Stress-strain partitioning analysis of constituent phases in dual phase steel based on the modified law of mixture. Int. J. Miner. Metall. Mater. 2009, 16, 393–398. [Google Scholar] [CrossRef]
  22. Kang, J.; Ososkov, Y.; Embury, J.D.; Wilkinson, D.S. Digital image correlation studies for microscopic strain distribution and damage in dual phase steels. Scr. Mater. 2007, 56, 999–1002. [Google Scholar] [CrossRef]
  23. Ghadbeigi, H.; Pinna, C.; Celotto, S.; Yates, J.R. Local plastic strain evolution in a high strength dual-phase steel. Mater. Sci. Eng. A 2010, 527, 5026–5032. [Google Scholar] [CrossRef] [Green Version]
  24. Tasan, C.C.; Hoefnagels, J.P.M.; Geers, M.G.D. Microstructural banding effects clarified through micrographic digital image correlation. Scr. Mater. 2010, 62, 835–838. [Google Scholar] [CrossRef]
  25. Tasan, C.C.; Hoefnagels, J.P.M.; Diehl, M.; Yan, D.; Roters, F.; Raabe, D. Strain localization and damage in dual phase steels investigated by coupled in-situ deformation experiments and crystal plasticity simulations. Int. J. Plast. 2014, 6, 198–210. [Google Scholar] [CrossRef]
  26. Tasan, C.C.; Diehl, M.; Yan, D.; Zambaldi, C.; Shanthraj, P.; Roters, F.; Raabe, D. Integrated experimental–simulation analysis of stress and strain partitioning in multiphase alloys. Acta Mater. 2014, 8, 386–400. [Google Scholar] [CrossRef]
  27. Dan, W.J.; Lin, Z.Q.; Li, S.H.; Zhang, W.G. Study on the mixture strain hardening of multi-phase steels. Mater. Sci. Eng. A 2012, 55, 1–8. [Google Scholar] [CrossRef]
  28. Han, Q.; Asgari, A.; Hodgson, P.D.; Stanford, N. Strain partitioning in dual-phase steels containing tempered martensite. Mater. Sci. Eng. A 2014, 61, 90–99. [Google Scholar] [CrossRef]
  29. Chen, P.; Ghassemi-Armaki, H.; Kumar, S.; Bower, A.; Bhat, S.; Sadagopan, S. Microscale-calibrated modeling of the deformation response of dual-phase steels. Acta Mater. 2014, 6, 133–149. [Google Scholar] [CrossRef]
  30. Fillafer, A.; Krempaszky, C.; Werner, E. On strain partitioning and micro-damage behavior of dual-phase steels. Mater. Sci. Eng. A 2014, 61, 180–192. [Google Scholar] [CrossRef]
  31. Huang, T.T.; Gou, R.B.; Dan, W.J.; Zhang, W.G. Strain-hardening behaviors of dual phase steels with microstructure features. Mater. Sci. Eng. A 2016, 67, 88–97. [Google Scholar] [CrossRef]
  32. Sun, B.; Fazeli, F.; Scott, C.; Yan, X.; Liu, Z.; Qin, X.; Yue, S. Critical role of strain partitioning and deformation twinning on cracking phenomenon occurring during cold rolling of two duplex medium manganese steels. Scr. Mater. 2017, 13, 49–53. [Google Scholar] [CrossRef]
  33. Schwindt, C.D.; Bertinetti, M.A.; Iurman, L.; Rossit, C.A.; Signorelli, J.W. Numerical study of the effect of martensite plasticity on the forming limits of a dual-phase steel sheet. Int. J. Mater. Form. 2016, 9, 499–517. [Google Scholar] [CrossRef]
  34. Marin, E.B.; Dawson, P. On modelling the elasto-viscoplastic response of metals using polycrystal plasticity. Comput. Methods Appl. Mech. Eng. 1998, 165, 1–21. [Google Scholar] [CrossRef]
  35. Groh, S.; Marin, E.B.; Horstemeyer, M.F.; Zbib, H.M. Multiscale modeling of the plasticity in an aluminum single crystal. Int. J. Plast. 2009, 25, 1456–1473. [Google Scholar] [CrossRef]
  36. Roters, F.; Eisenlohr, P.; Hantcherli, L.; Tjahjanto, D.D.; Bieler, T.R.; Raabe, D. Overview of constitutive laws, kinematics, homogenization and multiscale methods in crystal plasticity finite-element modeling: Theory, experiments, applications. Acta Mater. 2010, 58, 1152–1211. [Google Scholar] [CrossRef]
  37. Hill, R. Generalized constitutive relations for incremental deformation of metal crystals by multislip. J. Mech. Phys. Solids 1966, 14, 95–102. [Google Scholar] [CrossRef]
  38. Hill, R.; Rice, J. Constitutive analysis of elastic-plastic crystals at arbitrary strain. J. Mech. Phys. Solids 1972, 20, 401–413. [Google Scholar] [CrossRef]
  39. Asaro, R.J.; Rice, J. Strain localization in ductile single crystals. J. Mech. Phys. Solids 1977, 25, 309–338. [Google Scholar] [CrossRef]
  40. Asaro, R.J.; Needleman, A. Overview no. 42, Texture development and strain hardening in rate dependent polycrystals. Acta Metall. 1985, 33, 923–953. [Google Scholar] [CrossRef]
  41. Taylor, G. Plastic strain in metals. J. Inst. Met. 1938, 6, 307–324. [Google Scholar]
  42. Hutchinson, J. Bounds and self-consistent estimates for creep of polycrystalline materials. Proc. R. Soc. Lond. A 1976, 348, 101–127. [Google Scholar] [CrossRef]
  43. Pan, J.; Rice, J. Rate sensitivity of plastic flow and implications for yield-surface vertices. Int. J. Solids Struct. 1983, 19, 973–987. [Google Scholar] [CrossRef] [Green Version]
  44. Harren, S. The finite deformation of rate-dependent polycrystals—I. A self-consistent framework. J. Mech. Phys. Solids 1991, 39, 345–360. [Google Scholar] [CrossRef]
  45. Paquin, A.; Berbenni, S.; Favier, V.; Lemoine, X.; Berveiller, M. Micromechanical modeling of the elastic–viscoplastic behavior of polycrystalline steels. Int. J. Plast. 2001, 17, 1267–1302. [Google Scholar] [CrossRef]
  46. Teodosiu, C.; Raphanel, J.L.; Tabourot, L. Finite element simulation of the large elastoplastic deformation of multicrystals. In Proceedings of the International Seminar MECAMAT’91, Fontainebleau, France, 7–9 August 1991. [Google Scholar]
  47. Lyu, H.; Ruimi, A.; Zbib, H. A dislocation-based model for deformation and size effect in multi-phase steels. Int. J. Plast. 2015, 7, 44–59. [Google Scholar] [CrossRef]
  48. Liao, J.; Sousa, J.A.; Lopes, A.B.; Xue, X.; Barlat, F.; Pereira, A.B. Mechanical, microstructural behavior and modelling of dual phase steels under complex deformation paths. Int. J. Plast. 2017, 9, 269–290. [Google Scholar] [CrossRef]
  49. Hatem, T.M.; Zikry, M. Dynamic shear-strain localization and inclusion effects in lath martensitic steels subjected to high pressure loads. J. Mech. Phys. Solids 2010, 58, 1057–1072. [Google Scholar] [CrossRef]
  50. Queyreau, S.; Monnet, G.; Devincre, B. Slip systems interactions in α-iron determined by dislocation dynamics simulations. Int. J. Plast. 2009, 25, 361–377. [Google Scholar] [CrossRef]
  51. Kitayama, K.; Tomé, C.N.; Rauch, E.F.; Gracio, J.J.; Barlat, F. A crystallographic dislocation model for describing hardening of polycrystals during strain path changes. Application to low carbon steels. Int. J. Plast. 2013, 4, 54–69. [Google Scholar] [CrossRef]
  52. Schwindt, C.; Schlosser, F.; Bertinetti, M.A.; Stout, M.; Signorelli, J.W. Experimental and Visco-Plastic Self-Consistent evaluation of forming limit diagrams for anisotropic sheet metals: An efficient and robust implementation of the M-K model. Int. J. Plast. 2015, 7, 62–99. [Google Scholar] [CrossRef]
  53. Anbarlooie, B.; Hosseini-Toudeshky, H.; Kadkhodapour, J. High cycle fatigue micromechanical behavior of dual phase steel: Damage initiation, propagation and final failure. Mech. Mater. 2017, 10, 8–19. [Google Scholar] [CrossRef]
  54. Wei, X.; Asgari, S.A.; Wang, J.T.; Rolfe, B.F.; Zhu, H.C.; Hodgson, P.D. Micromechanical modelling of bending under tension forming behavior of dual phase steel 600. Comput. Mater. Sci. 2015, 10, 72–79. [Google Scholar] [CrossRef]
  55. Zhou, J.; Gokhale, A.M.; Gurumurthy, A.; Bhat, S.P. Realistic microstructural RVE-based simulations of stress–strain behavior of a dual-phase steel having high martensite volume fraction. Mater. Sci. Eng. A 2015, 63, 107–115. [Google Scholar] [CrossRef]
  56. Ramazani, A.; Mukherjee, K.; Schwedt, A.; Goravanchi, P.; Prahl, U.; Bleck, W. Quantification of the effect of transformation-induced geometrically necessary dislocations on the flow-curve modelling of dual-phase steels. Int. J. Plast. 2013, 4, 128–152. [Google Scholar] [CrossRef]
  57. Rieger, F.; Wenk, M.; Schuster, S.; Bohlke, T. Mechanism based mean-field modeling of the work-hardening behavior of dual-phase steels. Mater. Sci. Eng. A 2017, 68, 126–138. [Google Scholar] [CrossRef]
  58. Ha, J.; Lee, J.; Kim, J.H.; Lee, M.G.; Barlat, F. Investigation of plastic strain rate under strain path changes in dual-phase steel using microstructure-based modeling. Int. J. Plast. 2017, 9, 89–111. [Google Scholar] [CrossRef]
  59. Jia, N.; Peng, R.L.; Chai, G.C.; Johansson, S.; Wang, Y.D. Direct experimental mapping of microscale deformation heterogeneity in duplex stainless steel. Mater. Sci. Eng. A 2008, 491, 425–433. [Google Scholar] [CrossRef]
  60. Saleh, A.A.; Pereloma, E.V.; Gazder, A. Microstructure and texture evolution in a twinning-induced-plasticity steel during uniaxial tension. Acta Mater. 2013, 61, 2671–2691. [Google Scholar] [CrossRef] [Green Version]
Figure 1. Mechanics and metallographic of DP800 steel. (a) The engineering stress-strain curve of DP800. (b) The metallograph of DP800.
Metals 08 00782 g001
Figure 2. Dimensions of DP800 sample for in situ tensile test (mm).
Metals 08 00782 g002
Figure 3. Diagrammatic sketch of in situ tensile test platform. 1, Metallurgical microscope and charge-coupled device (CCD) Image capture card; 2, In situ test machine; 3, DP800 sample; 4, Fixture; 5, Gauge.
Metals 08 00782 g003
Figure 4. The experimental and fitting micro-strains of ferrite and martensite.
Metals 08 00782 g004
Figure 5. The pole figures of DP800, (a) before and (b) after deformation with ε = 0.125.
Metals 08 00782 g005
Figure 6. True stress vs. logarithmic strain curve from experiment and simulation.
Metals 08 00782 g006
Figure 7. True stress vs. logarithmic strain curves with different stretching directions. (a) Real texture results. (b) With 30% rotated cube (Rt-C) texture results added.
Metals 08 00782 g007
Figure 8. The dislocation density evolution. (a) The evolution curves of ferrite/martensite dislocation densities with true stress. (b) Partial curve of ferrite dislocation density evolution with true stress. (c) Partial curve of martensite dislocation density evolution with true stress. (d) The evolution curves of ferrite/martensite dislocation densities with true strain.
Metals 08 00782 g008aMetals 08 00782 g008b
Figure 9. The stress vs. strain curves of martensite, ferrite, and DP800.
Metals 08 00782 g009
Figure 10. The important cross-section of the initial orientation distribution function (ODF). (a) Calculated by the pole figures. (b) Calculated by the Euler angles.
Metals 08 00782 g010
Figure 11. The volume fraction evolution of several textures in different stretching directions. (a) Rt-C texture; (b) {111} <112> texture; (c) ~S texture.
Metals 08 00782 g011aMetals 08 00782 g011b
Figure 12. The ODF evolution during stretching in the rolling direction. (a) When the strain is 0.050. (b) When the strain is 0.107. (c) When the strain is 0.125. (d) When the strain is 0.161.
Metals 08 00782 g012aMetals 08 00782 g012b
Figure 13. The strain rate of each slip system with different overall strain. (a) Ferrite strain rate of Rt-C. (b) Martensite strain rate of Rt-C. (c) Ferrite strain rate of {111} <112>. (d) Martensite strain rate of {111} <112>. (e) Ferrite strain rate of ~S. (f) Martensite strain rate of ~S. (g) The average ferrite strain rate for all grains. (h) The average martensite strain rate for all grains.
Metals 08 00782 g013
Figure 14. The strain of each slip system with different overall strains. (a) Ferrite strain of Rt-C. (b) Martensite strain of Rt-C. (c) Ferrite strain of {111} <112>. (d) Martensite strain of {111} <112>. (e) Ferrite strain of ~S. (f) Martensite strain of ~S. (g) The average ferrite strain for all grains. (h) The average martensite strain for all grains.
Metals 08 00782 g014aMetals 08 00782 g014b
Figure 15. The dislocation density of each slip-system with different macro strains. (a) Ferrite dislocation density of Rt-C. (b) Martensite dislocation density of Rt-C. (c) Ferrite dislocation density of {111} <112>. (d) Martensite dislocation density of {111} <112>. (e) Ferrite dislocation density of ~S. (f) Martensite dislocation density of ~S. (g) The average ferrite dislocation density for all grains. (h) The average martensite dislocation density for all grains.
Metals 08 00782 g015aMetals 08 00782 g015b
Table 1. Chemical composition of DP800 steel.
ElementCCrCuMnMoNiPSiS
Content (wt. %)0.16580.03470.00611.5140.00960.0270.01230.18210.00172
Table 2. Mechanical properties of DP800 steel.
MaterialYM a (GPa)YS b (MPa)UTS c (MPa)TE d (%)
DP80020750077020
a Young’s modulus; b Yield strength; c Ultimate tensile strength; d Total elongation.
Table 3. Fitting coefficients of each phase.
PhaseFerriteMartensite
p11.04092−0.97854
p2−4.181054.22
Table 4. The simulated parameters of single crystals.
PhaseMartensiteFerrite
τ c 0 (internal friction term)250 MPa55 MPa
ρ i (initial dislocation density)1 × 10¹³ m−21 × 109 m−2
B (Burgers vector)3.0 × 10⁻¹⁰ m2.5 × 10−10 m
G (shear modulus)98.4 GPa55 GPa
C11 (anisotropic elasticity constant)417.4 GPa233.3 GPa
C12 (anisotropic elasticity constant)242.4 GPa135.5 GPa
C44 (anisotropic elasticity constant)211.1 GPa118 GPa
Table 5. The simulated parameters of DP800.
Itemv (%)KαRyc (m)
Martensite461.10.21.13.6 × 10−8
Ferrite542.50.21.13.4 × 10−8
Table 6. Miller indices and Euler angles for common texture components in cubic-crystal metals.
Texture Component{hkl} <uvw>φ1Φφ2
Cube (C){001} <100>000
Rotated cube (Rt-C){001} <110>4500
Copper (Cu){112} <111>903545
Brass{011} <211>35450
Goss (G){011} <100>0450
S{123} <634>593763
R{124} <211>572963
~S{123} <111>753763
Rotated Goss (Rt-G){011} <011>09045
BRASS R{236} <385>793133
{111} <112>905545
{111} <110>05545
Table 7. Slip systems and reference numbers.
Number12345678
Slip system{1–10}
<111>
{1–10}
<11–1>
{10–1}
<111>
{10–1}
<1–11>
{01–1}
<111>
{01–1}
<–111>
{110}
<–111>
{110}
<1–11>
Number910111213141516
Slip system{101}
<–111>
{101}
<11–1>
{011}
<1–11>
{011}
<11–1>
{11–2}
<111>
{1–21}
<111>
{–211}
<111>
{1–12}
<–111>
Number1718192021222324
Slip system{12–1}
<–111>
{211}
<–111>
{1–1–2}
<1–11>
{121}
<1–11>
{–2–1 1}
<1–11>
{–1–1–2}
<11–1>
{–121}
<11–1>
{2–11}
<11–1>

