Article

Effects of Trace Alloying Elements Fe and Cr on the Microstructure and Aging Properties of Cu-3Ti Alloy Foils

1
School of Materials Science and Engineering, Zhengzhou University, Zhengzhou 450001, China
2
Lingbao Jinyuan Zhaohui Copper Co., Ltd, Lingbao 472500, China
*
Author to whom correspondence should be addressed.
Metals 2018, 8(11), 881; https://doi.org/10.3390/met8110881
Submission received: 10 October 2018 / Revised: 25 October 2018 / Accepted: 26 October 2018 / Published: 29 October 2018

Abstract

:
In this work, the effects of an addition of trace alloying elements, Fe and Cr, on the mechanical and electrical properties and corrosion resistance of Cu-3Ti alloy foils, have been investigated. The results showed that the individual addition of Fe leads to the formation of Fe2Ti intermetallic phase, which refines the grain size, in the solution-treated condition. With a combined addition of Fe and Cr, the formation of the (FeCr)2Ti phase and the precipitation of the β′-Cu4Ti phase resulted in increased hardness in the peak-aged condition. The ultimate tensile strength and yield strength of the peak-aged Cu-Ti-Fe-Cr alloy were 13% and 5.7% higher, than those of the Cu-3Ti alloy, respectively. The electrical conductivity of the peak-aged Cu-Ti-Fe-Cr alloy was 3.3% higher than that of the Cu-Ti-Fe alloy, due to the finer (FeCr)2Ti phase and the less residual Ti atoms, in the Cu matrix. The combined addition of Fe and Cr elements could improve the corrosion resistance of the Cu-Ti alloy. The Cu-Ti-Fe-Cr alloy foil could obtain the best integrated properties, and the hardness, ultimate tensile strength, and electrical conductivity were 357.1 HV, 1068 MPa and 12.5% IACS, respectively.

1. Introduction

Age-hardenable Cu-based alloys, which have good mechanical and electrical properties, are widely used in components of various electronic devices, such as connectors, relays, and switches [1,2,3,4,5,6,7]. Recent rapid advances of densely-integrated and the reductions in size and thickness of electronic components have led to more severe requirements for excellent mechanical and electrical properties of the Cu-based alloys. Among them, Cu-Be alloys appear to be an ideal choice to exhibit superior mechanical and electrical properties, but the high-cost of raw materials and toxic effects of the Beryllium compounds restrict their applications. Cu-Ti alloys strengthened by the formation of the ordered, metastable, and coherent β′-Cu4Ti phase have comparable mechanical properties to the Cu-Be alloys, after suitable treatment [6,7,8,9,10], which has been regarded to be one of the potential materials that could replace the Cu-Be alloys.
Addition of alloying element appears to be an effective way to improve the mechanical and electrical properties of the age-hardenable Cu-Ti alloys [11,12,13,14,15]. Extensive investigations have been carried out to realize the effects of various alloying elements on the age hardening behavior of the Cu-Ti alloys. The Fe element can effectively suppress the grain coarsening of the Cu-Ti alloys, in the solution-treated condition, which improves the mechanical properties of the Cu-Ti alloys, due to formation of the Fe-Ti intermetallic phases. Markandeya et al. have reported that addition of 1% Cr results in an improvement of the mechanical properties of Cu-3Ti alloy [11].
It has been reported that both the hardness and electrical conductivity of the Cu-2Fe-0.7Cr alloy are higher than those of the Cu-1Fe alloy, after the same heat treatment [16]. It is of interest to investigate the age-hardening effect of the Cu-3Ti alloy by a combined addition of the Fe and Cr elements. Furthermore, the application of the Cu-Ti alloys, in a corrosive environment, has created a strong requirement for an improved corrosion resistance and better mechanical and electrical properties [17]. In this study, the effects of trace amounts of Fe- and Cr-addition on the mechanical and electrical properties and the corrosion resistance of Cu-3Ti alloy foils have been investigated. The precipitation kinetics of the phase transformation of the studied alloys has also been studied.

2. Experimental Procedure

The studied alloys were melted and cast in an induction furnace (NMS-GYI, Sichuan, China), and the nominal compositions of the studied alloys were Cu-3Ti, Cu-3Ti-0.2Fe, and Cu-3Ti-0.2Fe-0.2Cr (wt. %) alloys, respectively. Raw materials were used as 99.99% electrolytic copper, 99.9% titanium, 99.99% ferrous, and 99.95% chromium. The ingots, thus obtained, were homogenized at 840 °C, for 12 h, in an Ar atmosphere. Then the plates, with a thickness of 5 mm, after soaking, were subsequently polished to obtain flats, with a thickness of 4.5 mm. Flats were solution-treated at 900 °C, for 4 h, in a heat-treatment furnace (SX 2-5-12, Shanghai, China), in an Ar atmosphere, immediately followed by water quenching. Then, the solution-treated plates were ground mechanically to 4 mm, by using the emery paper, which were cold-rolled to foil (0.1 mm), with a reduction of 97.5%. Three different samples that were cut from cold-rolled foils were aged at 450 °C, for different times, respectively.
Metallographic specimens of any condition were etched in a solution of 5 g FeCl3, 20 mL HCl, and 100 mL distilled water, after mechanical polishing, and then the microstructures were characterized by optical microscopy (OM; Leica DM 4000M, Wetzlar, Germany) and scanning electron microscopy (SEM; Philips Quanta 200, Amsterdam, The Netherlands). The fracture surfaces were observed, using SEM. Hardness tests were carried out on an Vickers micro-hardness tester (HXD-1000TMSC/LCD, Shanghai, China), with a load of 500 g and holding time of 15 s, taking the average of seven or more indentations. Electrical conductivity was measured at 20 °C, using an electrical conductivity device (STR-B, Shanghai, China), taking the average of five values, and presented by International Annealed Copper Standard (IACS). Tensile specimens with a shape of a dog-bone, and gauge dimension of 30 mm × 3 mm × 0.1 mm, were tested on the electric universal testing machine (Shimadzu AG-IC, Tokyo, Japan), at a crosshead speed of 0.5 mm/min, at room temperature. Electrochemical measurements were examined using an electrochemical workstation (RST5000, Suzhou, China), in 3.5 wt. % NaCl solution, taken three times, for each sample, and replicating the results. After all samples were immersed in the 3.5 wt. % NaCl solution, for 90min, the electrochemical measurements were conducted in a three-electrode cell, which consisted of a platinum counter electrode and an saturated calomel electrode (SCE) reference electrode and a working electrode.

3. Results and Discussion

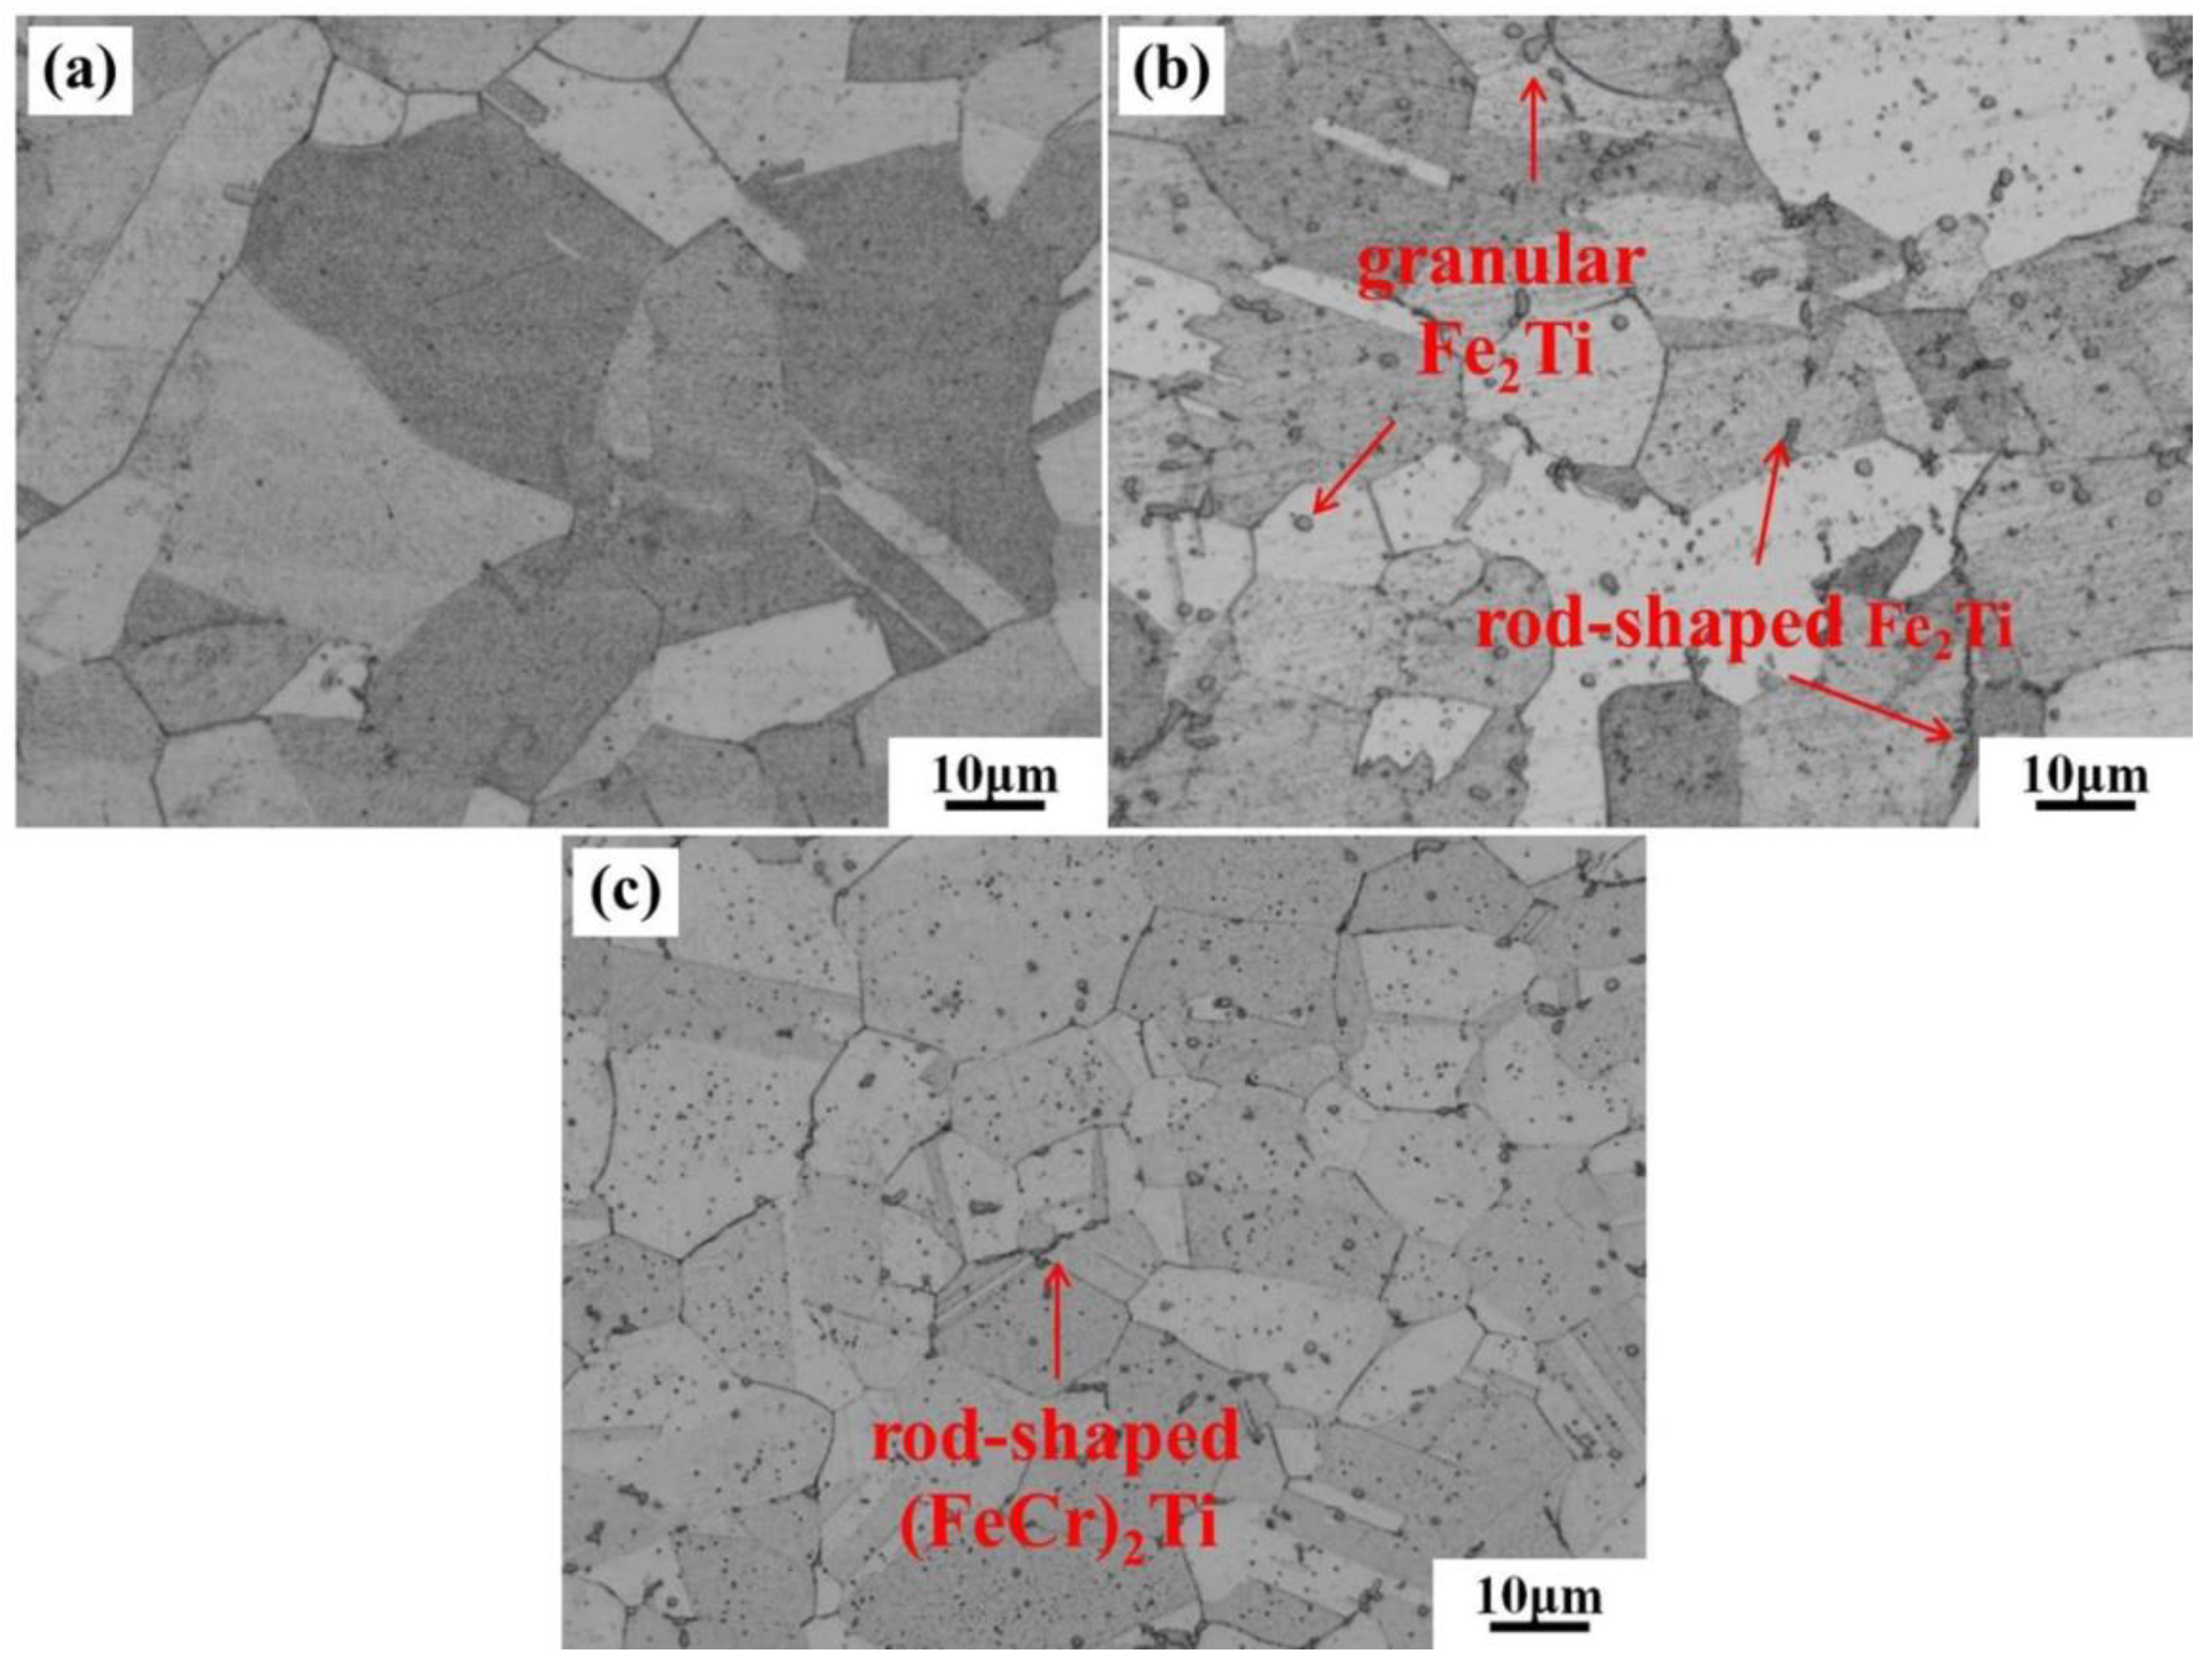
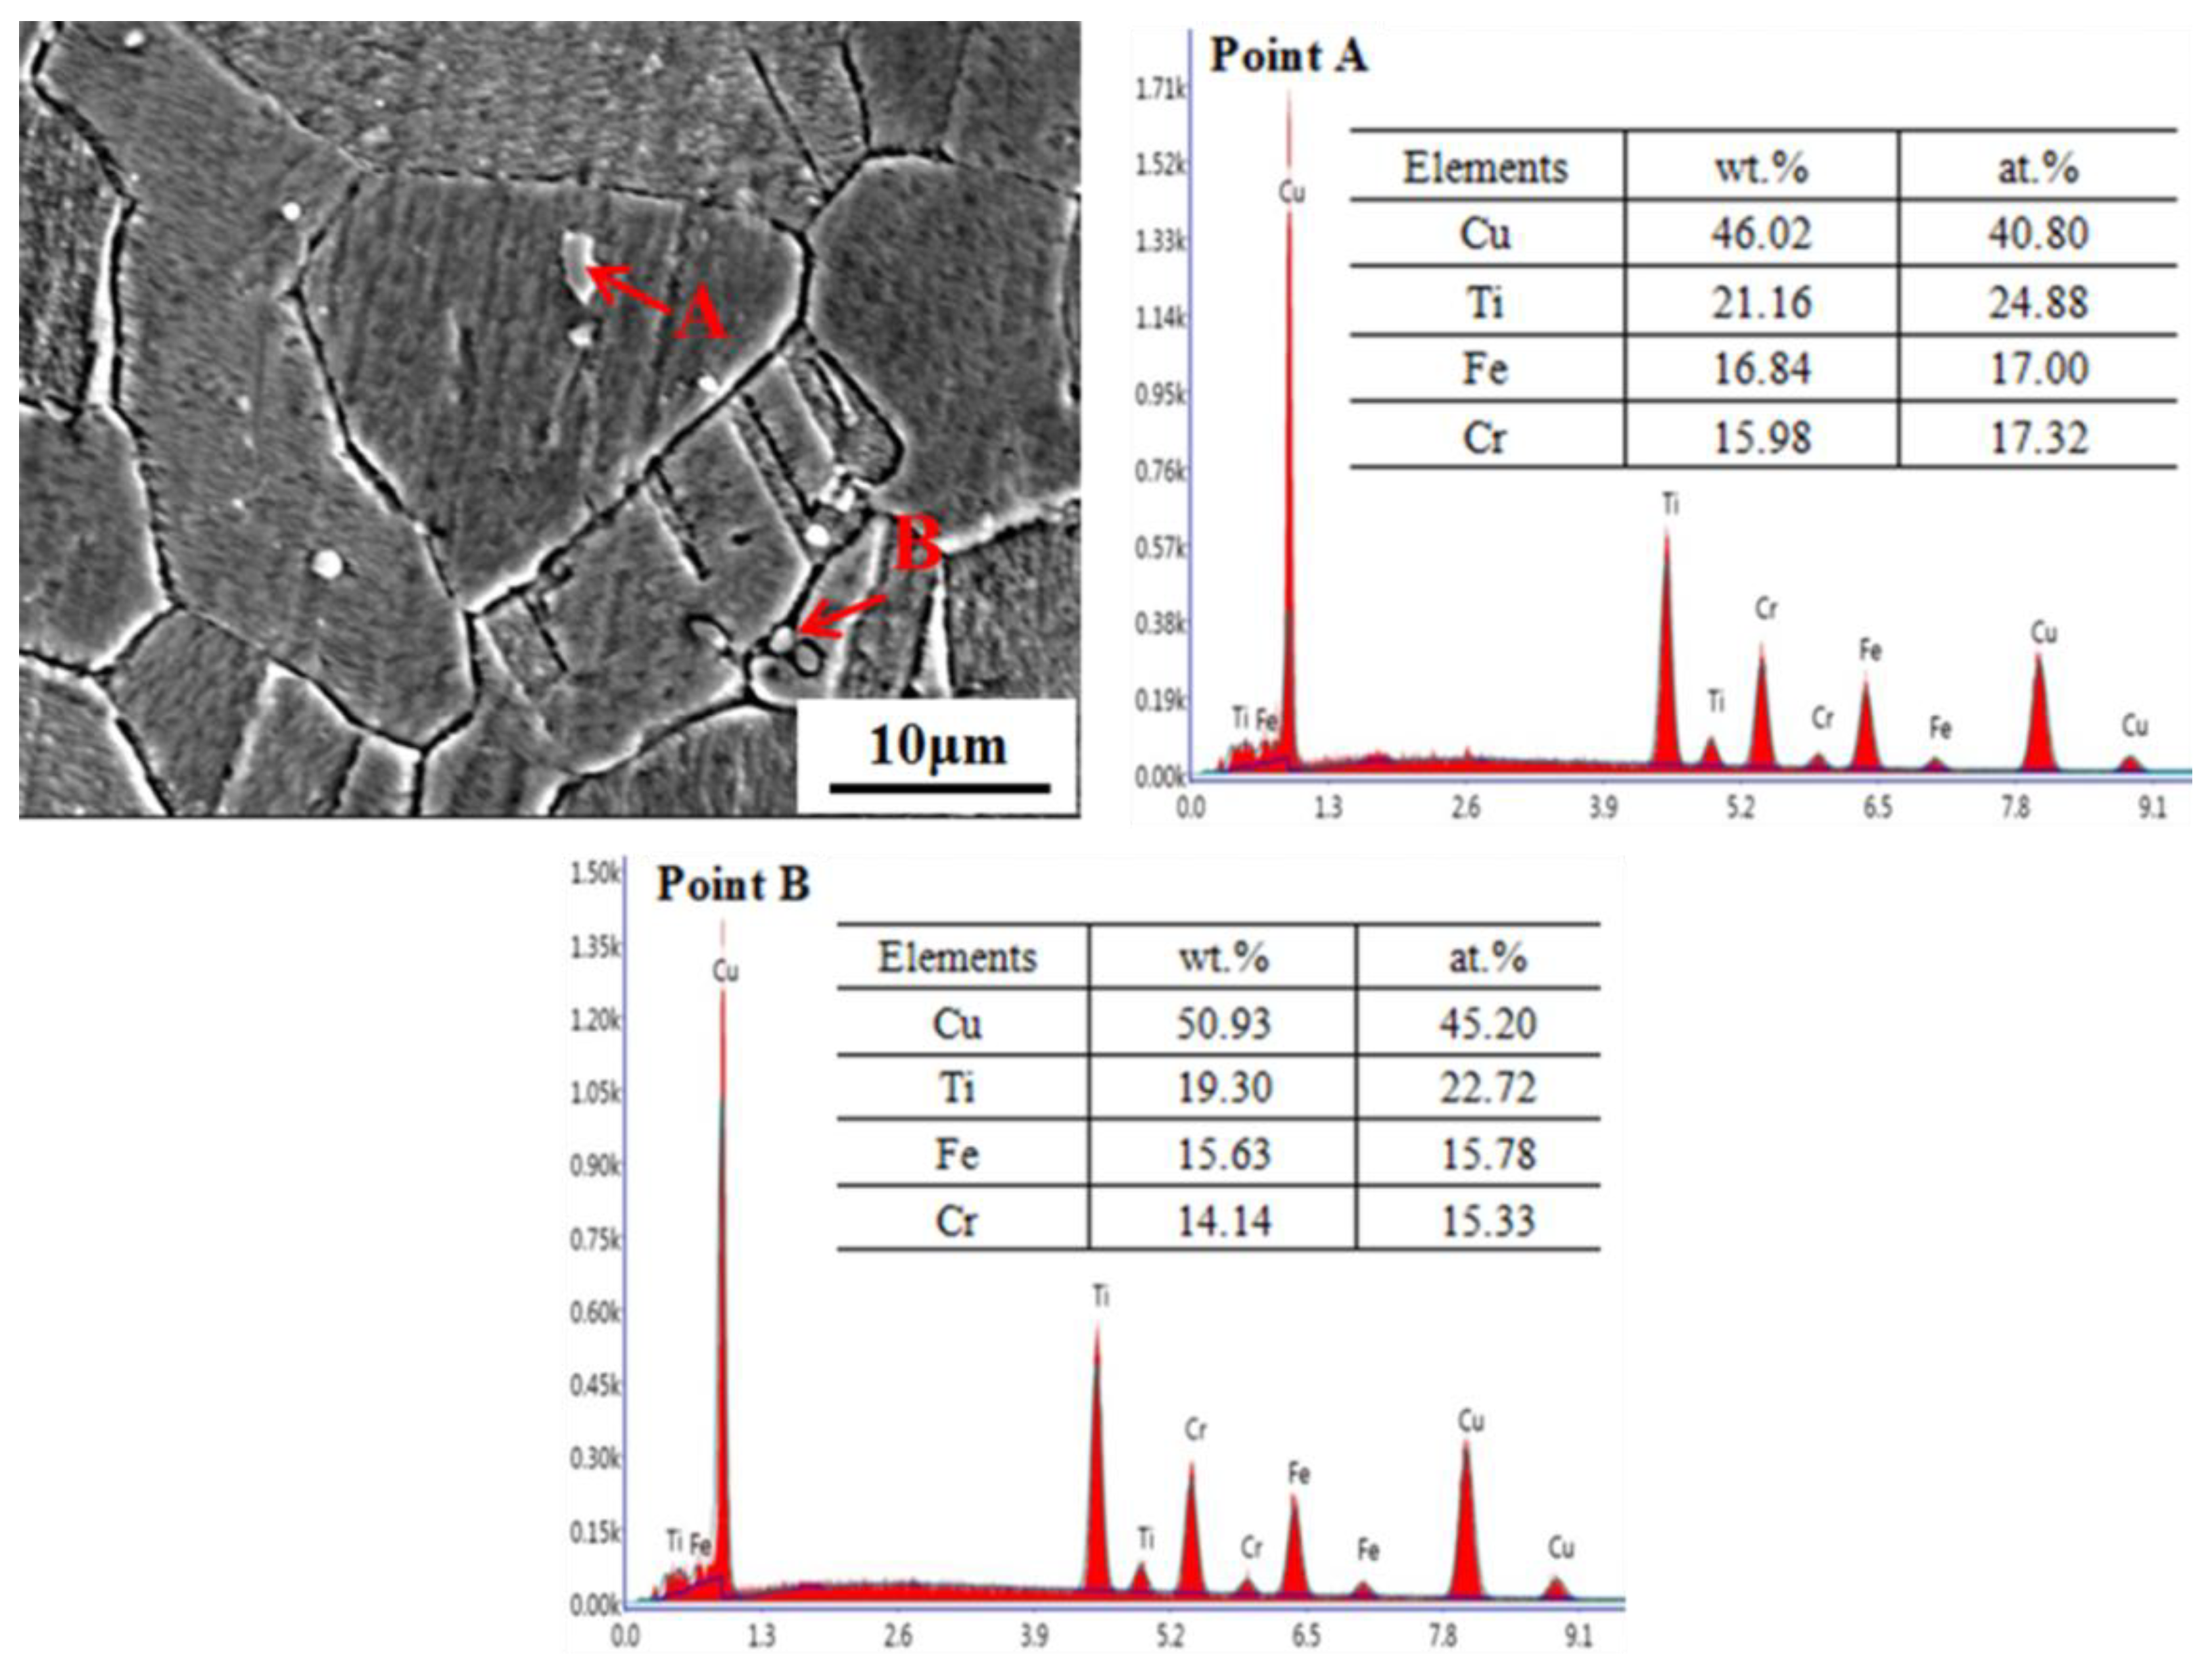
3.1. Microstructure of the Specimens in the Solution-Treated Condition

Solution treatment is a significant process to obtain a supersaturated solid solution and to prepare for the later aging treatment [17,18]. Figure 1 shows the optical micrographs of the Cu-3Ti, Cu-Ti-Fe, and Cu-Ti-Fe-Cr alloys, in the solution-treated condition. It can be seen that the equiaxed grains existed in the three alloys. With the addition of the Fe and Cr elements, grain size decreased gradually, from 25 ± 5 μm in the Cu-3Ti, to 12 ± 2 μm in the Cu-Ti-Fe-Cr alloy. As shown in Figure 1b, the rod-shaped and granular phases were mostly distributed in the equiaxed grains and the grain boundaries, by an individual addition of the Fe element, and these phases were the Fe2Ti intermetallic phase, as has been confirmed by Mineau et al. [18]. Measured by the Image J software, the volume fraction of the rod-shaped phase shown in Figure 1b was about 7.8%, more than 5.7% of that shown in Figure 1c. Therefore, the combined addition of Fe and Cr elements decreased the number of rod-shaped phases, in the grain boundaries.
The SEM image and the EDS results of the solution-treated Cu-Ti-Fe-Cr alloy are shown in Figure 2, to confirm the composition of the intermetallic phase. The intermetallic phases were distributed in the grain boundaries and the interior of grains. Most of intermetallic phases, distributed in the interior of grains, had a granular shape. Additionally, the sizes of the intermetallic phases were in the range of 1~2 μm. According to the EDS results, it could be seen that the Cr element had mostly dissolved into the Fe-Ti intermetallic phases, which indicated that the intermetallic phases were (FeCr)2Ti, belonging to the substitutional solid solution and the C14-Laves phases [19].

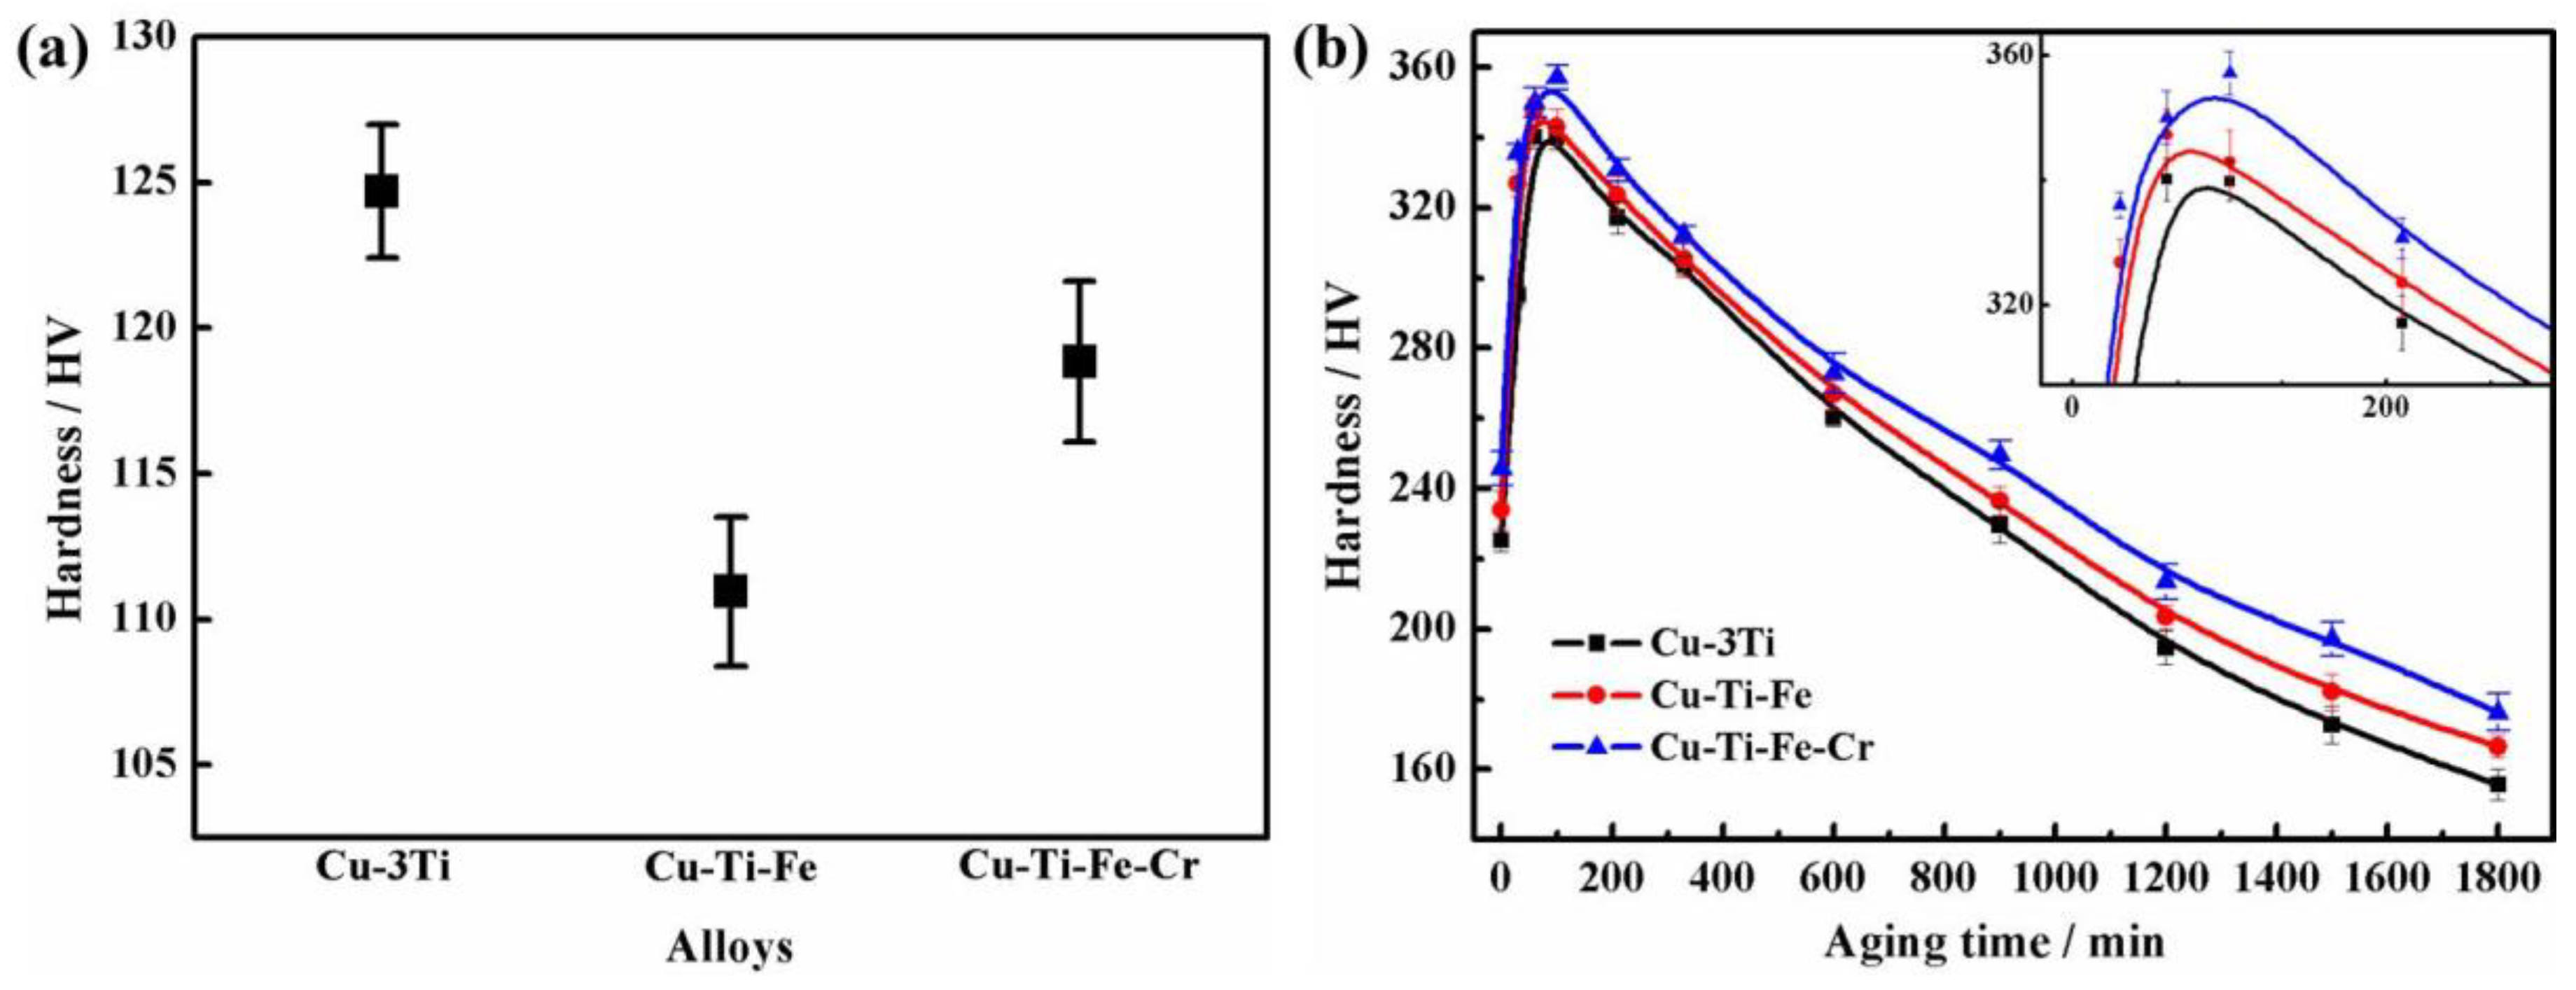
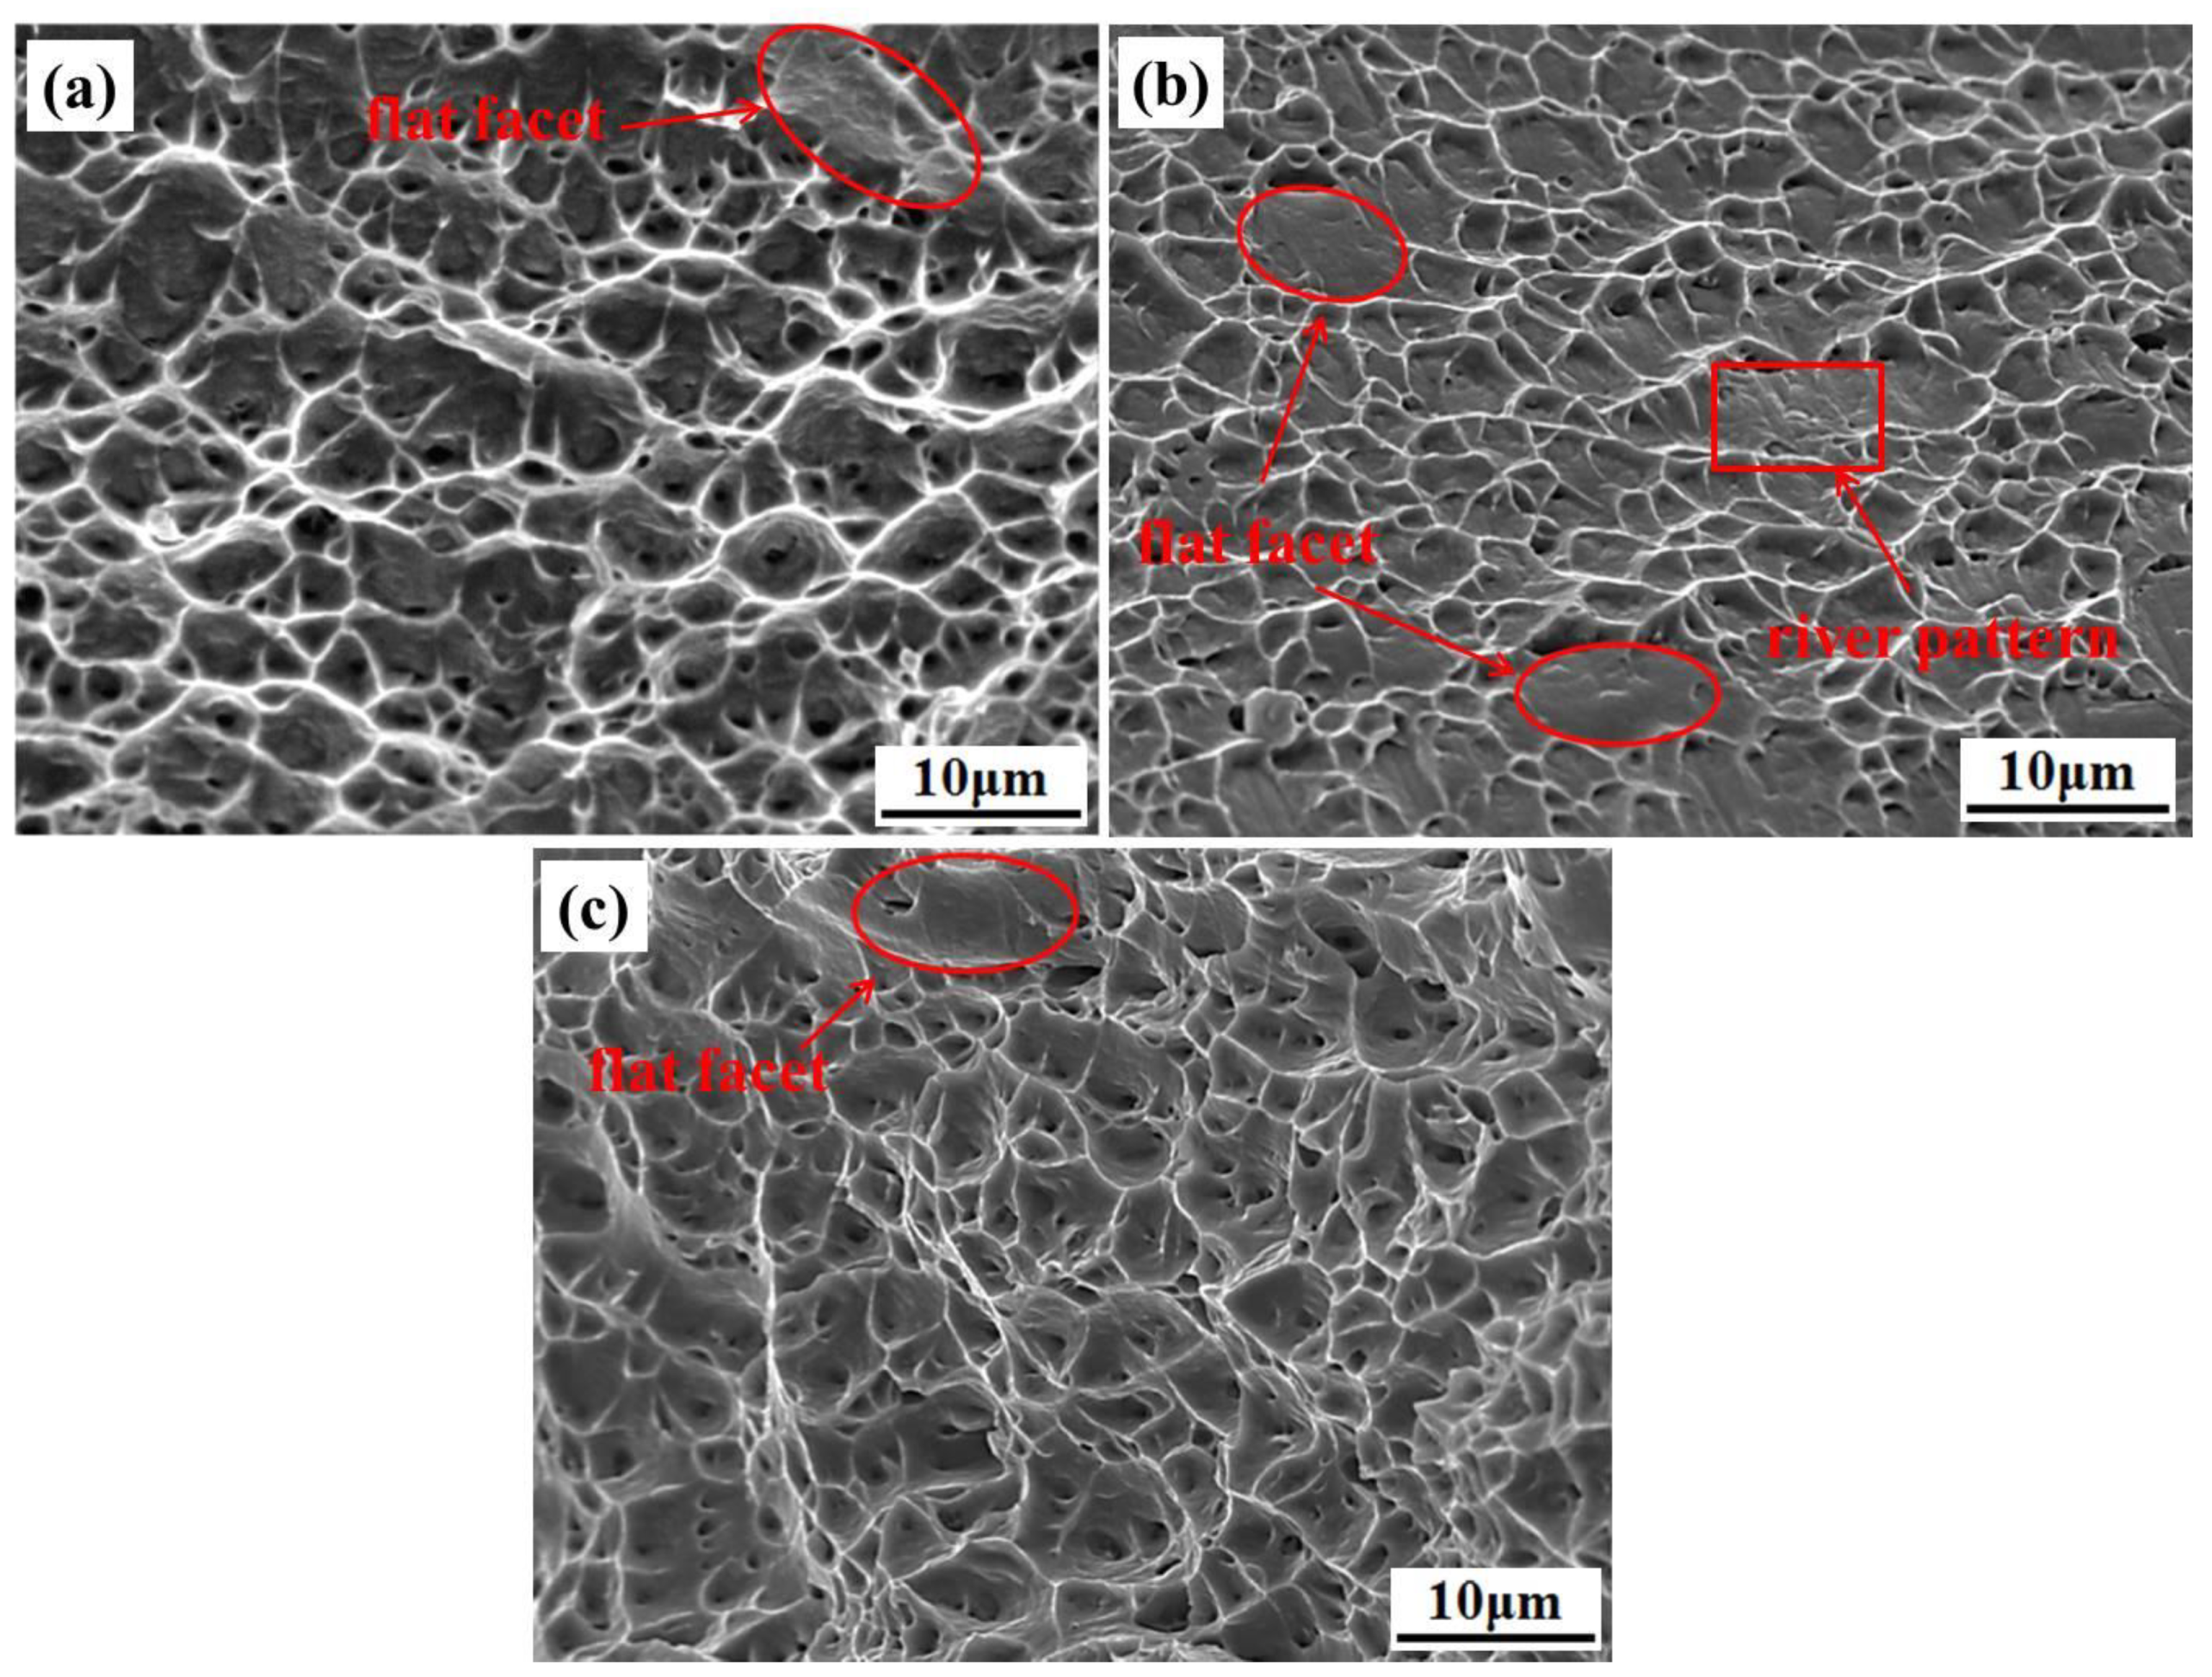
3.2. Mechanical Properties

The variations in hardness of the three alloys, in the different conditions, are shown in Figure 3. The mechanical properties of the alloys in the solution-treated condition had significant effects on the subsequent cold deformation [20]. Figure 3a shows the variation in hardness of the three alloys, in the solution-treated condition. When 0.2% Fe was added into the Cu-3Ti alloy, the value of the hardness had decreased to 110.9 ± 3.1 HV from 124.7 ± 3.8 HV of the Cu-3Ti alloy. The hardness of the Cu-Ti-Fe-Cr alloy was 7.1% higher than that of the Cu-Ti-Fe alloy, due to the stronger grain refinement strengthening caused by the finer grain size, and the stronger second phase strengthening caused by the finer (FeCr)2Ti phase. The formation of the Fe2Ti and the (FeCr)2Ti phases could decrease the number of Titanium atoms in the Cu matrix. Therefore, even though the Fe2Ti and the (FeCr)2Ti phases played some part in the grain refinement and the precipitate strengthening processes, the hardness of the Cu-3Ti alloy was still higher than the Cu-Ti-Fe and the Cu-Ti-Fe-Cr alloys, which was consistent with that found in Reference [3], and was ascribed to the stronger solution strengthening effect of the Titanium atoms.
All solution-treated alloys were cold-rolled to 0.1 mm, with the same reduction of 97.5%, and then the aging treatments were carried out, at 450 °C. Figure 3b shows the influence of aging time in the hardness of the three alloys. For all three samples, the hardness rapidly increased to peak values but then moderately reduced with an increase in the aging time. It could also be observed that both the values of the peak hardness and the peak aging time increased with the addition of the Fe and Cr. In the binary Cu-3Ti alloy, a peak value of 340.2 ± 4.0 HV was obtained at the aging time of 60 min, whereas, the Cu-Ti-Fe-Cr alloy exhibited the highest value of peak hardness, 357.1 ± 4.6 HV, at the longest peak aging time of 100 min.
The mechanical properties of the three peak-aged alloy foils have been compared in Table 1. The ultimate tensile strength (UTS) value of the Cu-Ti-Fe alloy was 996 ± 17 MPa, which was 5.4% higher than that of the Cu-3Ti alloy, whereas, the value of yield strength (YS) was nearly equal to the peak-aged Cu-3Ti alloy. Addition of the Fe element also decreased the elongation from 2.2% of the Cu-3Ti alloy to 1.9%. The UTS and YS values of the Cu-Ti-Fe-Cr alloy were significantly higher than those of the Cu-3Ti, 13% and 5.7%, respectively, while the elongation of the Cu-Ti-Fe-Cr alloy was similar to that of the binary Cu-3Ti alloy.
There were two stages of interpretation for the variation of mechanical properties during the aging process. In the initial period of the aging process, the fine coherent β′-Cu4Ti phase precipitated from the supersaturated Cu matrix. Therefore, the hardness rapidly increased to the peak value, indicating a strong coherent strengthening effect of the β′-Cu4Ti phase [21]. In the mid-late period of the aging process, further aging gave rise to the transformation from coherent β′-Cu4Ti phase to the incoherent β-Cu4Ti phase, and the coarsening of the β-Cu4Ti phase [22]. As the strengthening effect of the β′-Cu4Ti phase was stronger than that of the β-Cu4Ti phase, the value of hardness reduced, moderately. The formation rate of the discontinuous β-Cu4Ti phase depended on the diffusion rate of the Ti atoms [15]. The Fe2Ti intermetallic phase suppressed the diffusion of the Ti atoms, resulting in the suppression of the phase transformation from the β′-Cu4Ti to the β-Cu4Ti phase. During the cold-rolling, the high density dislocation interacted with the Fe2Ti phase, in a bypass mode, which is called the Orowan mechanism. The peak-aged hardness and the tensile strength of the Cu-Ti-Fe alloy increased due to the addition of the Fe. The Cr increased the high temperature stability of the Fe2Ti phase, which resulted in the lengthened peak-aging time. The (FeCr)2Ti phase, with a smaller size, showed a stronger strengthening effect caused by the Orowan mechanism, resulting in an improvement of the mechanical properties. Therefore, the synergistic effect of the (FeCr)2Ti and the β′-Cu4Ti phases was responsible for the most-optimized mechanical properties of the Cu-Ti-Fe-Cr alloy, in the peak-aged condition.
The influence of alloying elements on the fracture mechanism of the Cu-3Ti alloy foils was realized, and the fracture surfaces of all three alloys in the peak-aged condition, scanned by SEM, are shown in Figure 4. It reveals that the fractographies of all three alloys were composed of flat facets resembling cleavage and dimples, manifesting a mixed-rupture mode. For the Cu-Ti-Fe alloy, the size of the Fe2Ti phase was larger than the (FeCr)2Ti phase, and there was a greater number of fracture positions, due to the dislocation pile-up and tangling around the Fe2Ti phase during the tensile tests. Therefore, more flat facets and shallower dimples were found, and there were also a few river-like morphologies of the quasi-cleavage, as shown in Figure 4b. The more-uniform distribution and smaller size of the (FeCr)2Ti phase, improved the formation of dimples. Therefore, the fracture surface of the Cu-Ti-Fe-Cr alloy was dominated by dimples, whose size was close to that of the Cu-3Ti alloy.

3.3. Electrical Properties

The solute Ti atoms, precipitated from the Cu matrix during aging could lead to the increment of electrical conductivity [13]. The electrical conductivities of all three alloys, in the peak-aged condition, are listed in Table 2. Individual addition of the Fe lowered the electrical conductivity of the Cu-3Ti alloy in the peak-aged condition. Additionally, the Cu-Ti-Fe-Cr alloy had an electrical conductivity of 12.5 ± 0.1% IACS, which was 3.3% higher than that of the peak-aged Cu-Ti-Fe alloy due to the refinement of the Fe2Ti phase and the precipitation of the β′-Cu4Ti phase.
The electrical conductivity of the copper titanium alloys mainly depends on the residual content of the solute Ti atoms, in the matrix [10]. The more phases precipitated, the purer the Cu matrix is, and the higher the electrical conductivity is. The precipitation kinetics of the phase transformation of the three alloys could be studied through a variation of electrical conductivity [23].
Volume fractions of the precipitates are linearly related to the electrical conductivity, as in Equation (1) [24].
σ = σ 0 + A f  
where σ is electrical conductivity of the aged specimen, σ0 is the electrical conductivity of the cold-rolled specimen, A is the aging constant, and f is the volume fraction of the precipitates. When f = 1, A = σmax-σ0.
With the increment of aging time, f can be expressed using Avrami’s empirical equation [25],
f = 1 exp ( b t n )  
where b is the constant related to the phase transformation temperature and the composition of the matrix, and n is the constant related to the type of phase transformation and the nucleation position.
Equation (3) can be transformed by Equation (2),
ln ( ln 1 1 f ) = ln b + n ln t  
The electrical conductivity of the Cu-Ti-Fe-Cr alloy was obtained in range of 0 min to 1800 min, and the value of σmax was the electrical conductivity of the alloys aged at 1800 min. The electrical conductivity and the volume fraction of the precipitates, with different aging times, are listed in Table 3. After the alloys were treated with solution process and the cold deformation, the electrical conductivity increased remarkably, during the aging process, because the high storing energy produced by the cold-rolling accelerated the precipitation process. The volume fraction of precipitates was calculated by substituting the values of σ, A, and σ0, in Equation (1). Figure 5 shows the relation between the volume fraction and the transformation time, when aging at 450 °C. Figure 5a exhibits ln(ln(1/(1-f))) as a function of lnt. The relative parameters b and n were obtained by fitting the curves, according to Equation (3). According to the transformation kinetics equations calculated by the values of b and n, the kinetic curves of the phase transformation and the corresponding Avrami-equations of the phase transformation are shown in Figure 5b. It can be seen that the transformation trend of all three alloys were similar. The transformation rates increased gradually but then decreased by an increase in the aging time. In the initial period of the aging process, the dissolution of the Fe and Cr elements, into the Cu matrix, led to a lower volume fraction in the Cu-Ti-Fe-Cr alloy, due to the suppression of the precipitation. Both the electrical conductivity and the volume fraction of the three alloys increased with the increment of the aging time, due to the precipitation of the Ti atoms from the supersaturated solid solution. The slope change of the f-t curves could be related to the n-value, which depends on the type of phase transformation and the nucleation location. A long time later, the content of the solute Ti atoms decreased, and the Contrell atmospheres could be formed by the interaction between the high-density dislocation and the residual Ti atoms in the Cu matrix, which suppressed the precipitation of the Ti atoms [26]. As a result, the transformation rate and the electrical conductivity tended to be constant with the lengthened aging time.

3.4. Electrochemical Measurements

Electrochemical measurements of all three peak-aged alloy foils were taken in a 3.5 wt. % NaCl solution, to study the corrosion resistance. The potentiodynamic polarization curves of the three alloys, in the peak-aged condition, are illustrated in Figure 6; it can be seen that all three alloys exhibit the similar polarization behavior. Polarization resistance Rp was calculated by the Stern-Geary equation [27]:
R P = b a × b c 2.303 ( b a + b c ) × i c o r r  
where icorr is the corrosion-current density, and ba and bc are the Tafel constant of the anode and the cathode process, respectively.
Relative polarization parameters have been summarized in Table 4. It shows that the Cu-Ti-Fe alloy had the highest corrosion current density icorr and the lowest corrosion potential Ecorr. The presence of the cathodic second phase Fe2Ti accelerated the cathode depolarization process, due to the enlargement of the cathodic area. Therefore, an addition of Fe decreased the Rp from 1.392 kΩ⋅cm2 of Cu-3Ti to 0.809 kΩ⋅cm2, indicating a faster corrosion rate. A more uniform potential was obtained on the surface of the Cu-Ti-Fe-Cr alloy, due to the more uniform distribution and smaller size of the (FeCr)2Ti phase. In addition, the Cr element could improve the thermal stability of the Fe2Ti phase and suppressed the anodic dissolution, which promoted the intensification of passive films, resulting in an increment of Ecorr from -185.1 ± 3.4 mV/SCE, for the Cu-Ti-Fe alloy, to -165.8 ± 3.7 mV/SCE, and the remarkable increment of the Rp from 0.809 kΩ⋅cm2 to 6.538 kΩ⋅cm2. It is also worth noting that the passive region (ΔE=Epit-Ecorr) of the Cu-Ti-Fe alloy was higher than that of the Cu-3Ti and the Cu-Ti-Fe-Cr alloys, indicating a better blunt ability. The difference of the passive regions might be attributed to the rapture and recovery of the passive film, on the surface of the Cu-Ti series alloys. It is known that a good corrosion resistance is evaluated by a low value of icorr and high values of Ecorr and Rp. Therefore, on the basis of the relative polarization parameters, the Cu-Ti-Fe-Cr alloy represented a better corrosion resistance, in 3.5 wt. % NaCl solution.

4. Conclusions

In the present work, we examined the mechanical properties, the electrical properties, and the corrosion resistance of the Cu-3Ti, Cu-Ti-Fe, and the Cu-Ti-Fe-Cr alloy foils. The results are summarized as follows. (1) Addition of Fe and Cr, in the binary Cu-3Ti alloy, had not only increased the aging time, for obtaining peak hardness, from 60 to 100 min, but also increased the peak hardness value from 340.2 ± 4.0 HV to 357.1 ± 4.6 HV. The UTS and YS values of the peak-aged Cu-Ti-Fe-Cr alloy were significantly higher than those of Cu-3Ti alloy, 13% and 5.7%, respectively. (2) All modes of fracture of the alloys were in the mixed mode, which composed of flat facets that resembled cleavage and dimples.(3) The electrical conductivity of the peak-aged Cu-Ti-Fe-Cr alloy was 12.5 ± 0.1 %IACS, which was 3.3% higher than that of the Cu-Ti-Fe alloy, due to the fewer Ti atoms in the Cu matrix. (4) Cu-Ti-Fe-Cr alloy with the lowest icorr, and the highest Ecorr and Rp, represented the better corrosion resistance, in a 3.5 wt. % NaCl solution.

Author Contributions

H.Z., Y.D. and X.D. designed and drafted the manuscript; Y. D. and R.L. contributed to the sample preparation; Y. D. and M.W. performed the statistical analysis; H.Z., Y.D. and X.D. revised the manuscript; H.Z., Y.D. and M.W. provided assistance for data acquisition and data analysis; all authors read and approved the final manuscript.

Funding

This research was funded by the National Natural Science Foundation of China (No.51801186), the Fund of the State Key Solidification Laboratory of Solidification Processing in Northwestern Polytechnical University (No. SKLSP 20814), and the Key Technologies R & D Program of Sanmenxia City (2016010108).

Conflicts of Interest

The authors declare no conflict of interest.

References

  1. Nagarjuna, S.; Sharma, K.K.; Sudhakar, I.; Sarma, D.S. Age hardening studies in a Cu-4.5Ti-0.5Co alloy. Mater. Sci. Eng. A 2001, 313, 251–260. [Google Scholar] [CrossRef]
  2. Xiao, X.P.; Yi, Z.Y.; Chen, T.T.; Liu, R.Q.; Wang, H. Suppressing spinodal decomposition by adding Co into Cu-Ni-Si alloy. J. Alloys Compd. 2016, 660, 178–183. [Google Scholar] [CrossRef]
  3. Wei, H.; Cui, Y.C.; Cui, H.Q.; Wei, Y.H.; Hou, L.F. Effects of multiple trace alloying elements on the microstructure and properties of Cu-4wt% Ti alloys. Mater. Sci. Eng. A 2017, 707, 392–398. [Google Scholar] [CrossRef]
  4. Nagarjuna, S.; Srinivas, M.; Balasubramanian, K.; Sarma, D.S. The alloy content and grain size dependence of flow stress in Cu-Ti alloys. Acta Mater. 1996, 44, 2285–2293. [Google Scholar] [CrossRef]
  5. Li, S.; Li, Z.; Xiao, Z.; Li, S.H.; Shen, L.N.; Dong, Q.Y. Microstructure and property of Cu-2.7Ti-0.15Mg-0.1Ce-0.1Zr alloy treated with a combined aging process. Mater. Sci. Eng. A 2016, 650, 345–353. [Google Scholar]
  6. Nagarjuna, S.; Balasubramanian, K.; Sarma, D.S. Effect of prior cold work on mechanical properties, electrical conductivity and microstructure of aged Cu-Ti alloys. J. Mater. Sci. 1999, 34, 2929–2942. [Google Scholar] [CrossRef]
  7. Betra, I.S.; Laik, A.; Kale, G.B.; Dey, G.K.; Kulkarni, U.D. Microstructure and properties of a Cu-Ti-Co alloy. Mater. Sci. Eng. A 2005, 402, 118–125. [Google Scholar] [CrossRef]
  8. Suzuki, S.; Hirabayashi, K.; Shibata, H.; Mimura, K.; Isshiki, M.; Waseda, Y. Electrical and thermal conductivities in quenched and aged high–purity Cu-Ti alloys. Scripta Mater. 2003, 48, 431–435. [Google Scholar] [CrossRef]
  9. Soffa, W.A.; Laughlin, D.E. High-strength age hardening copper-titanium alloys: redivivus. Prog. Mater. Sci. 2004, 49, 347–366. [Google Scholar] [CrossRef]
  10. Nagarjuna, S.; Balasubramanian, K.; Sarma, D.S. Effect of Ti additions on the electrical resistivity of copper. Mater. Sci. Eng. A 1997, 225, 118–124. [Google Scholar] [CrossRef]
  11. Markandeya, R.; Nagarjuna, S.; Sarma, D.S. Effect of prior cold work on age hardening of Cu-3Ti-1Cr alloy. Mater. Charact. 2006, 57, 348–357. [Google Scholar] [CrossRef]
  12. Markandeya, R.; Nagarjuna, S.; Sarma, D.S. Influence of prior cold work on age hardening of Cu-Ti-Zr alloys. Mater. Sci. Tech-lond 2005, 21, 1171–1180. [Google Scholar] [CrossRef]
  13. Liu, J.; Wang, X.H.; Ran, Q.N.; Zhao, G.; Zhu, X.X. Microstructure and properties of Cu-3Ti-1Ni alloy with aging process. T. Nonferr. Metal. Soc. 2016, 26, 3183–3188. [Google Scholar] [CrossRef]
  14. Toyohiko, J.K.; Rimi, N.; Satoshi, S.; Tetsu, O.; Eiji, O. Aging behavior of Cu-Ti-Al alloy observed by transmission electron microscopy. J. Mater. Sci. 2008, 43, 3761–3768. [Google Scholar]
  15. Wang, X.H.; Chen, C.Y.; Guo, T.T.; Zou, J.T.; Yang, X.H. Microstructure and properties of ternary Cu-Ti-Sn alloy. J. Mater. Eng. Perform. 2015, 24, 2738–2743. [Google Scholar] [CrossRef]
  16. Fernee, H.; Nairn, J.; Atrens, A. Precipitation hardening of Cu-Fe-Cr alloys. J. Mater. Sci. 2001, 36, 2711–2719. [Google Scholar] [CrossRef]
  17. Wei, H.; Wei, Y.H.; Hou, L.F.; Dang, N. Correlation of aging precipitates with the corrosion behavior of Cu-4wt.% Ti alloys in 3.5wt.% NaCl solution. Corros. Sci. 2016, 111, 382–390. [Google Scholar] [CrossRef]
  18. Mineau, L.; Hamar-Thibault, S.J.; Allibert, C.H. Precipitation in Cu-rich Cu-Fe-Ti ternary alloys. Phys. Status. Solidi. A 1993, 137, 87–100. [Google Scholar] [CrossRef]
  19. Bo, H.; Wang, J.; Duarte, L.; Leinenbach, C.; Liu, L.B.; Liu, H.S.; Jin, Z.P. Thermodynamic re-assessment of Fe-Ti binary system. T. Nonferr. Metal. Soc. 2012, 22, 2204–2211. [Google Scholar] [CrossRef]
  20. Wang, X.F.; Zhao, J.Z.; He, J. Investigation on the microstructure and mechanical properties of the spray-formed Cu-Cr alloys. Mater. Sci. Eng. A 2007, 460, 69–76. [Google Scholar] [CrossRef]
  21. Atsunori, K.; Takahiro, K.; Mauo, O. Effects of dehydrogenation heat-treatment on electrical-mechanical properties for hydrogenated Cu-3 mass% Ti alloys. J. Alloys Compd. 2013, 566, 1–4. [Google Scholar]
  22. Satoshi, S.; Mikio, I.; Shigeo, S.; Kazuaki, W.; Takayuki, T. Extraction of precipitates from age-hardenable Cu-Ti alloys. Mater. Charact. 2013, 82, 23–31. [Google Scholar]
  23. Satoshi, S.; Shintaro, A.; Jie, F.; Akihiro, I.; Takayuki, T. Kinetics and equilibrium of age-induced precipitation in Cu-4at.% Ti binary alloy. Metall. Mater. Trans. A 2017, 48, 1501–1511. [Google Scholar]
  24. Lei, Q.; Li, Z.; Pan, Z.Y.; Wang, M.P.; Xiao, Z.; Chen, C. Dynamics of phase transformation of Cu-Ni-Si alloy with super-high strength and high conductivity during aging. T. Nonferr. Metal. Soc. 2010, 20, 1006–1011. [Google Scholar] [CrossRef]
  25. Avrami, M. Kinetics of phase change I general theory. J. Chem. Phys. 1939, 7, 1103–1112. [Google Scholar] [CrossRef]
  26. Cahn, J.W. Thermodynamic aspects of Cottrell atmospheres. Philos. Mag. 2013, 93, 3741–3746. [Google Scholar] [CrossRef]
  27. Stern, M.; Geary, A.L. Electrochemical polarization I. A Theoretical analysis of the shape of polarization curves. J. Electrochem. Soc. 1957, 104, 56–63. [Google Scholar] [CrossRef]
Figure 1. Optical micrographs of the solution-treated specimens, at 900 °C, for 4 h. (a) Cu-3Ti; (b) Cu-Ti-Fe; and (c) Cu-Ti-Fe-Cr.
Metals 08 00881 g001
Figure 2. SEM image and the EDS results of the solution-treated Cu-Ti-Fe-Cr alloy, at 900 °C, for 4 h.
Metals 08 00881 g002
Figure 3. Variation of Hardness of the three alloys. (a) In the solution-treated condition; (b) aging at 450 °C, after the cold-rolling.
Metals 08 00881 g003
Figure 4. SEM images of the fracture surfaces of the three alloy foils in the peak-aged condition. (a) Cu-3Ti; (b) Cu-Ti-Fe; (c) Cu-Ti-Fe-Cr.
Metals 08 00881 g004
Figure 5. Relation between the volume fraction and the transformation time aging, at 450 °C. (a) Fitting data; (b) kinetic curves of the phase transformation.
Metals 08 00881 g005
Figure 6. Polarization curves of the three alloys, aging at 450 °C, for the peak-aging time, in 3.5 wt. % NaCl solution.
Metals 08 00881 g006
Table 1. Comparison of mechanical properties of three alloy foils in the peak-aged condition.
Mechanical propertiesCu-3TiCu-Ti-FeCu-Ti-Fe-Cr
Peak hardness (HV)340.2 ± 4.0347.3 ± 5.4357.1 ± 4.6
Ultimate tensile strength (MPa)945 ± 16996 ± 171068 ± 21
Yield strength (MPa)923 ± 8926 ± 6976 ± 11
Elongation (%)2.2 ± 0.11.9 ± 0.12.2 ± 0.1
Table 2. Electrical conductivities of the three alloy foils, in the peak-aged condition.
AlloysPeak aging EC (%IACS)
Cu-3Ti13.1 ± 0.1
Cu-Ti-Fe12.1 ± 0.2
Cu-Ti-Fe-Cr12.5 ± 0.1
Table 3. Electrical conductivities and volume fractions of the three alloy foils, with different aging times, at 450 °C.
t/minCu-3TiCu-Ti-FeCu-Ti-Fe-Cr
σ/%IACSfσ/%IACSfσ/%IACSf
04.5 ± 0.104.8 ± 0.104.5 ± 0.10
6013.1 ± 0.10.361312.1 ± 0.10.330310.6 ± 0.10.2919
10015.0 ± 0.10.441214.0 ± 0.10.416312.5 ± 0.10.3828
33021.0 ± 0.10.693320.0 ± 0.10.687818.2 ± 0.20.6555
60022.4 ± 0.20.752121.7 ± 0.10.764720.8 ± 0.10.7799
90024.3 ± 0.10.831923.5 ± 0.20.846222.4 ± 0.10.8565
120025.3 ± 0.10.874024.9 ± 0.10.909523.7 ± 0.10.9187
150027.4 ± 0.10.962226.0 ± 0.20.959324.6 ± 0.20.9617
180028.3 ± 0.1126.9 ± 0.2125.4 ± 0.11
Table 4. Polarization parameters of the three alloys aging, at 450 °C, for the peak-aging times.
Alloysicorr
(μA⋅cm-2)
Ecorr
(mV/SCE)
Epit
(mV/SCE)
ΔE
(V/SCE)
bc
(mV/dec)
ba
(mV/dec)
Rp
(kΩ⋅cm2)
Cu-3Ti2.887 ± 0.055-171.3 ± 4.2-121.2 ± 2.550.1111.1 ± 3.310.1 ± 1.81.392
Cu-Ti-Fe10.244 ± 0.036-185.1 ± 3.4-122.4 ± 2.962.7170.2 ± 5.121.5 ± 2.70.809
Cu-Ti-Fe-Cr2.689 ± 0.034-165.8 ± 3.7-115.2 ± 3.150.6116.7 ± 3.962.0 ± 2.46.538

