Abstract
In this paper, the static and fatigue properties of a Cu-Ni-Sn alloy are investigated. Tensile tests, hardness tests and microstructural analyses using optical and scanning electron microscopy (SEM) were performed and two sets of fatigue tests, with load ratio (R) and , respectively, were carried out. The results showed the capability of the alloy to bear high static stress, thanks to its good strength properties. However, the fatigue tests showed a strong sensitivity of the alloy fatigue properties depending on the raw material batch. The comparison between microstructural analyses and fatigue test results showed a strong correlation; in particular, the specimens having a more inhomogeneous microstructure showed lower durability. In addition, the different microstructure also affected the fracture surface morphology as highlighted by SEM analyses.
1. Introduction
The use of Ni-Cu-Sn spinodal alloys gained interest for some industrial applications in recent years [1]. Such alloy was originally developed and used in the industry in the 1970s by Bell Laboratiories [2] but did not spread due to technological issues in the manufacturing process [3,4]. Up to the early 1990s, the alloy was only obtained through powder metallurgy which does not allow to manufacture large size parts. More recently, a new casting technology called Equacast, which allows to produce large bars, tubes and plates was patented by Materion Brush and was used for industrial applications.
In this paper a wrought spinodally hardened Cu-15Ni-8Sn alloy with UNS (Universal Numbering System) C72900 is considered; such alloy is typically used for bushings and bearings in corrosion resistant and heavy applications [5,6,7], where high strength and excellent wear behavior are generally required. This alloy is obtained through casting followed by a heat treatment.
Since its main applications are related to bearings, some papers deal with the tribological characterization of the Cu-15Ni-8Sn cast alloy in terms of the pressure-velocity (PV) limit and wear rate determined by experiments [8] and their relationship with the microstructural and hardness properties of the alloy. In some papers it is shown how these properties are strongly related to the aging time [9,10].
Concerning the mechanical properties, to the best of the authors’ knowledge, few papers have dealt with the strength and fatigue behavior of Cu-15Ni-8Sn, and none deals with the mechanical behavior of Cu-15Ni-8Sn cast alloy. Indeed, only the alloy obtained by powder metallurgy was investigated in [11,12], where the influence of the aging treatment was assessed in terms of the yield stress, ultimate stress and fatigue endurance of thin sheets. In particular, concerning the fatigue analysis, strain controlled tests were performed and the results focused on the alloy behavior in the range of low cycle fatigue, highlighting some differences between genuine and heat treated specimens in terms of fatigue life only at very low cycles.
In this paper, an in depth characterization of the microstructure and of the fatigue behavior of the Cu-15Ni-8Sn alloy is described. Tests were performed on specimens cut from two different bars, as received from the supplier, which exhibited a different behavior. The fatigue properties were investigated in the range cycles, by employing a resonance testing machine. The effect of the mean stress was also investigated by performing tests with two load ratios, i.e., and . Microstructural investigation and hardness measures were also performed to relate the fatigue behavior to the microstructure.
2. Materials and Mechanical Tests Description
The material used in this research was received as two 25.4 mm diameter bars, named Bar A and Bar B in the following. The chemical composition was the same for both bars as reported in Table 1.

Table 1.
Chemical composition of the alloy.
The material was received in the following condition:
- homogenization treated at 840 C for 8 h;
- after solution treatment at 820 C for 1 h;
- quenched into water;
- isothermal aging at 400 C for 4 h.
as typical for this kind of alloys [13].
Tensile, hardness and fatigue tests, along with microstructural analysis, were performed on several specimens extracted from both bars, as described in the following sections.
2.1. Tensile Test Description
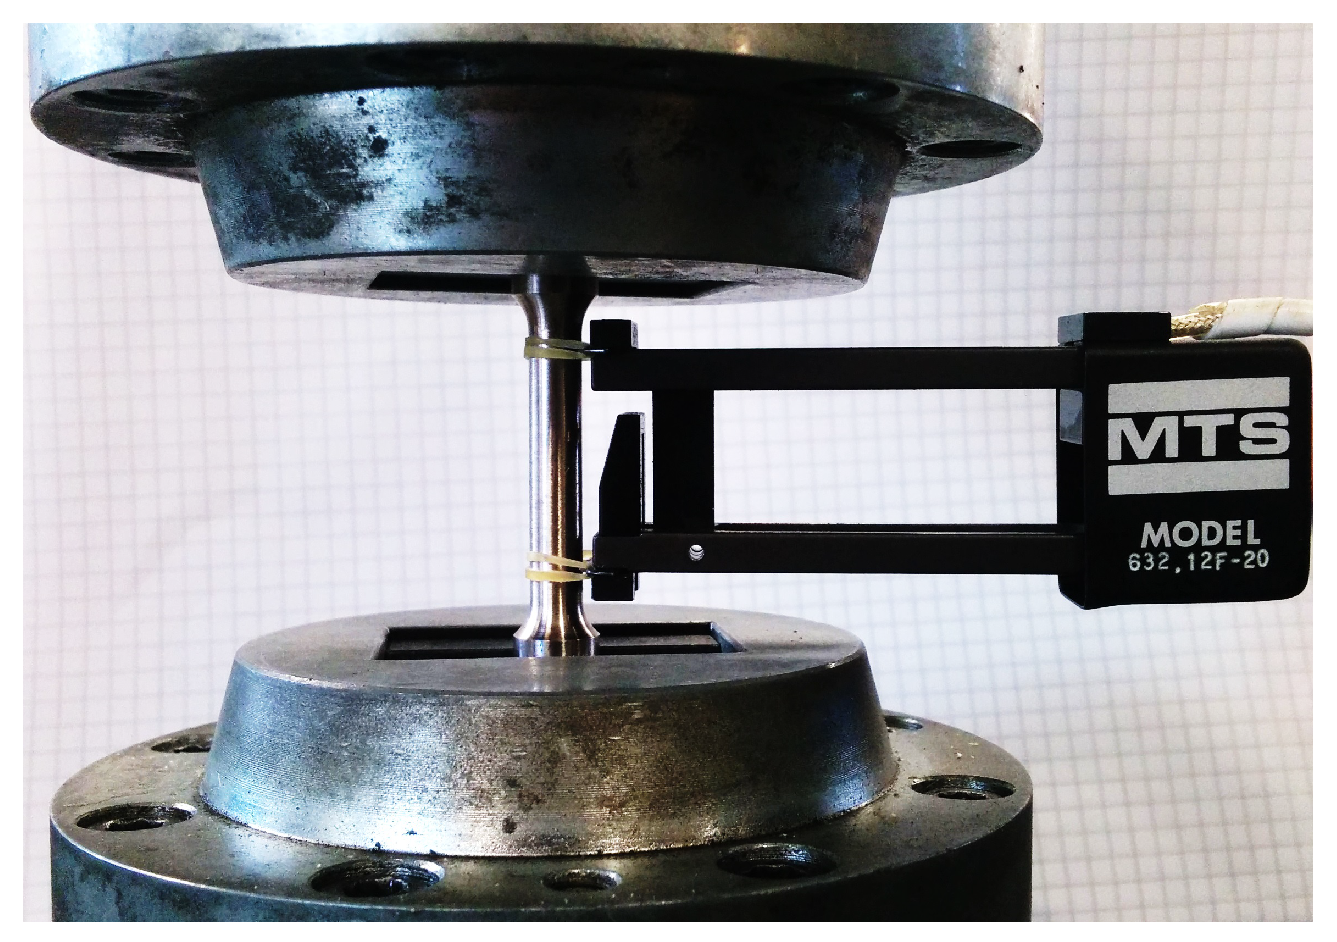
Two cylindrical specimens having a 6.25-mm diameter were extracted from each bar and tested through a quasi-static tensile test on a MTS hydraulic test machine. The tensile load N was recorded by a 50 kN load cell and the elongation of a 25 mm reference test length was measured by an estensometer, as shown in Figure 1. The engineering stress and strain were then computed according to standard engineering definitions.
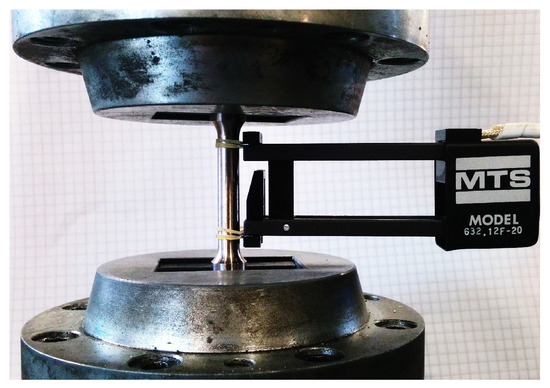
Figure 1.
Picture taken during a tensile test.
2.2. Microstructural Analysis and Hardness Test Description
A 5-mm thickness and 25-mm diameter flat disc specimen was extracted from each bar for microstructural analysis. The specimens were polished and etched (with a solution of the following volumetric fractions 0.5 of HO, 0.25 of NHOH, 0.25 of HO) before optical microscope investigation.
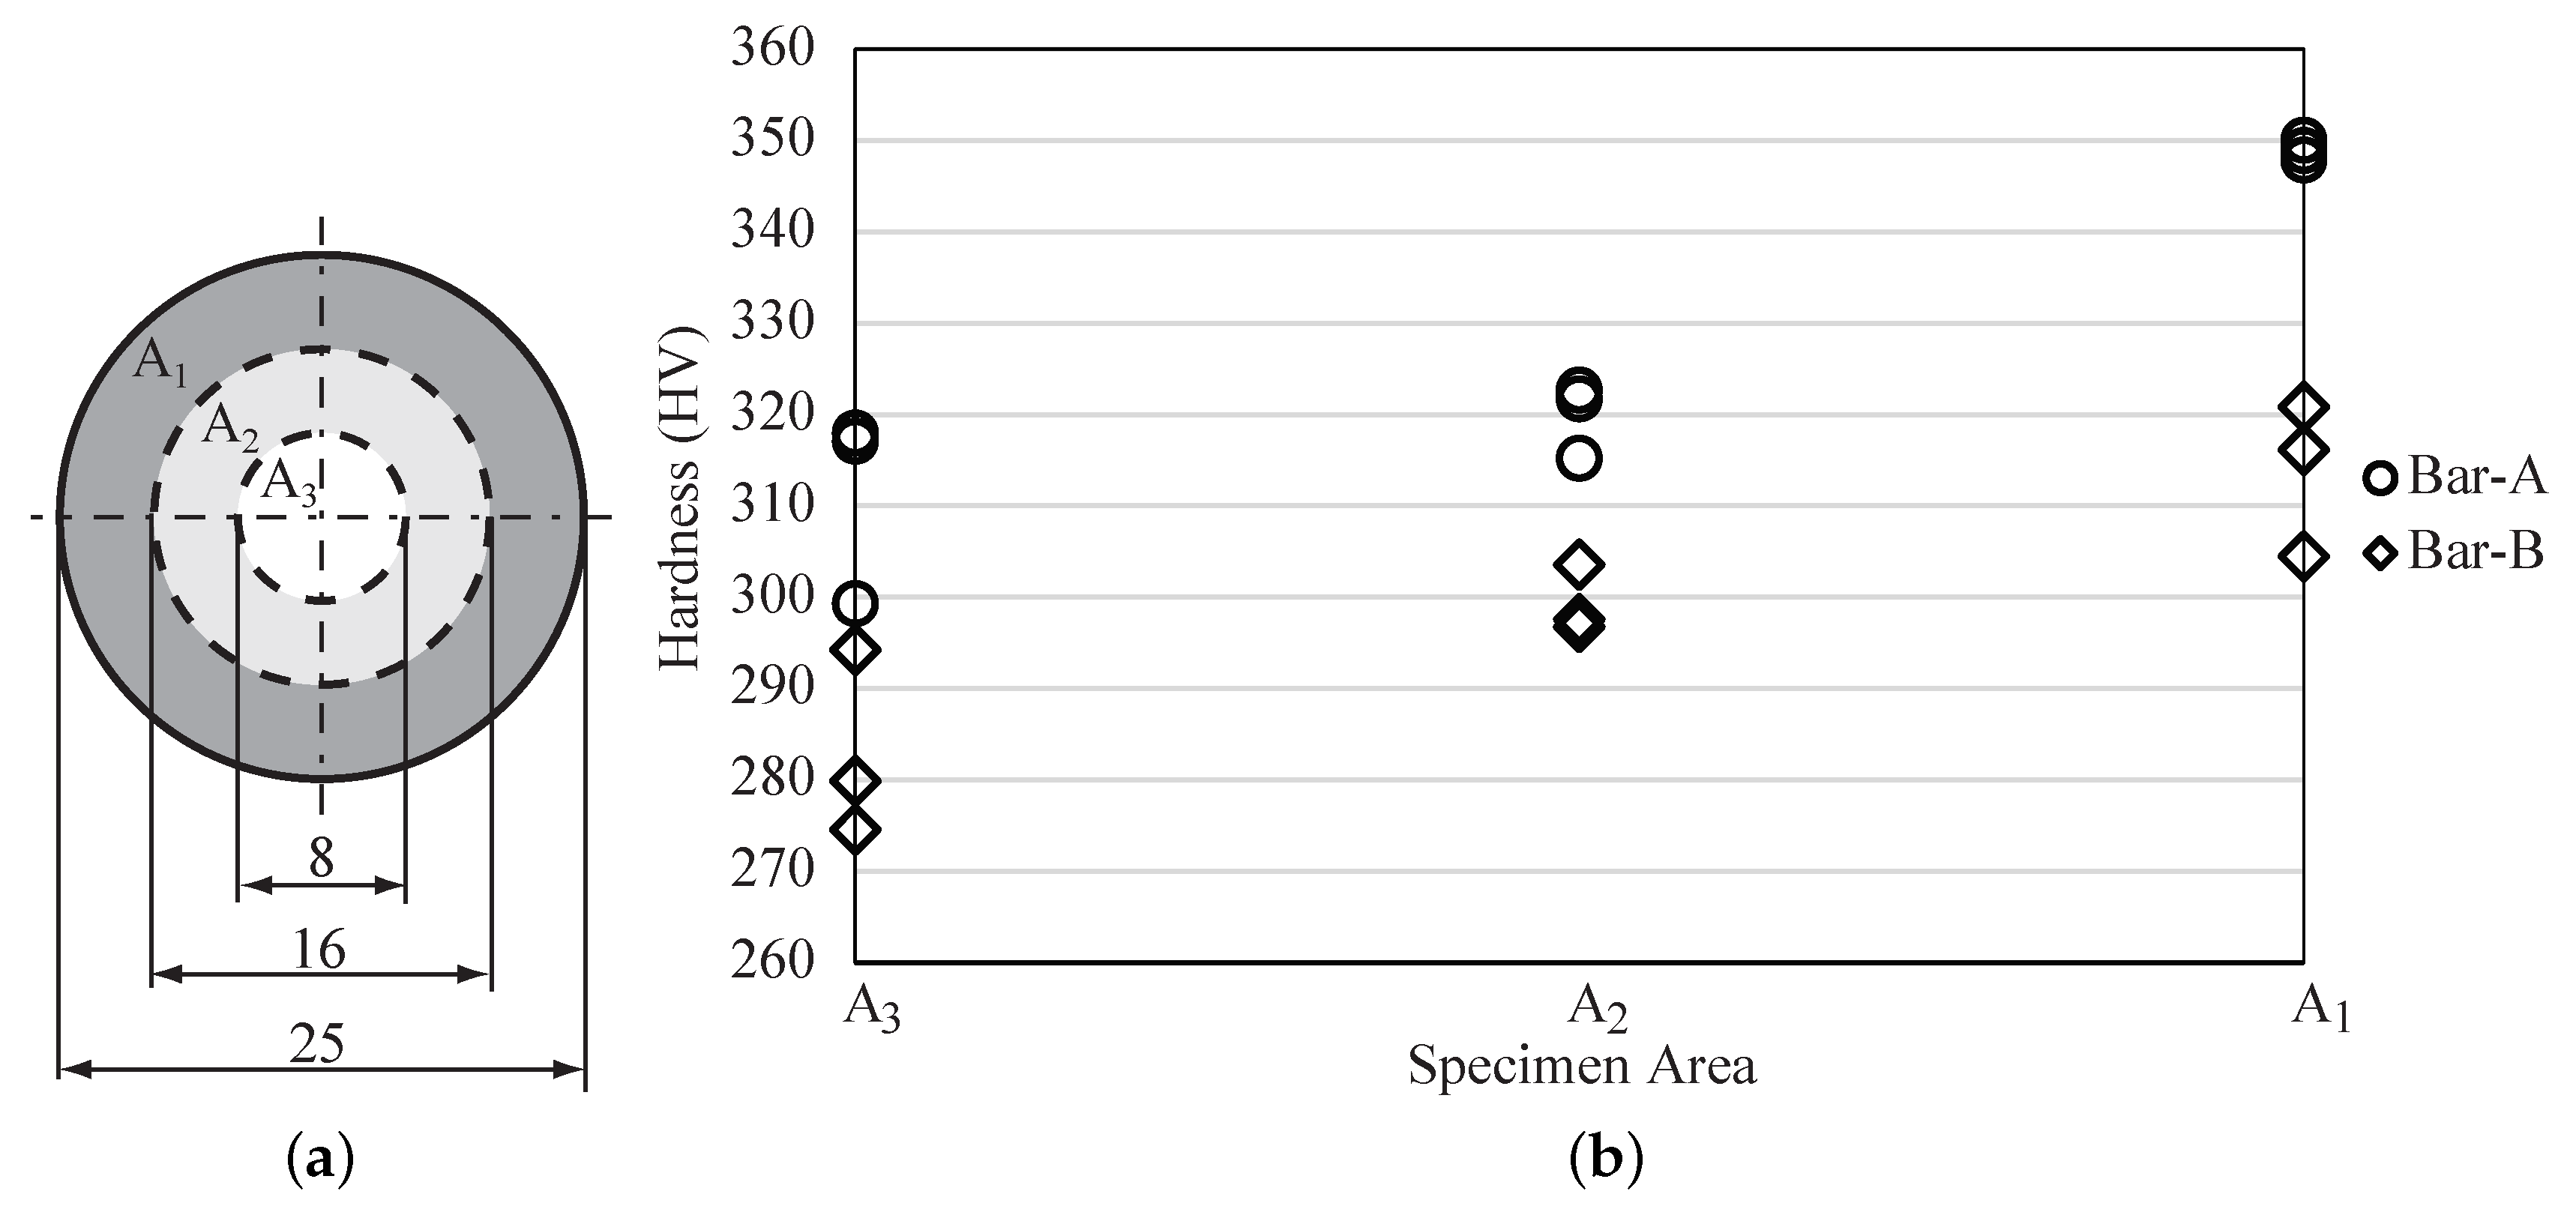
Vickers hardness tests (20 kg) were also performed in the three areas of the cross section, as shown later in Figure 7a (outer region , middle region and inner region ) using the same specimens employed for the microstructural analysis; the measure tip stamp diagonal was about 0.3 mm (area about ), substantially larger than the average grain dimension.
2.3. Fatigue Tests Description
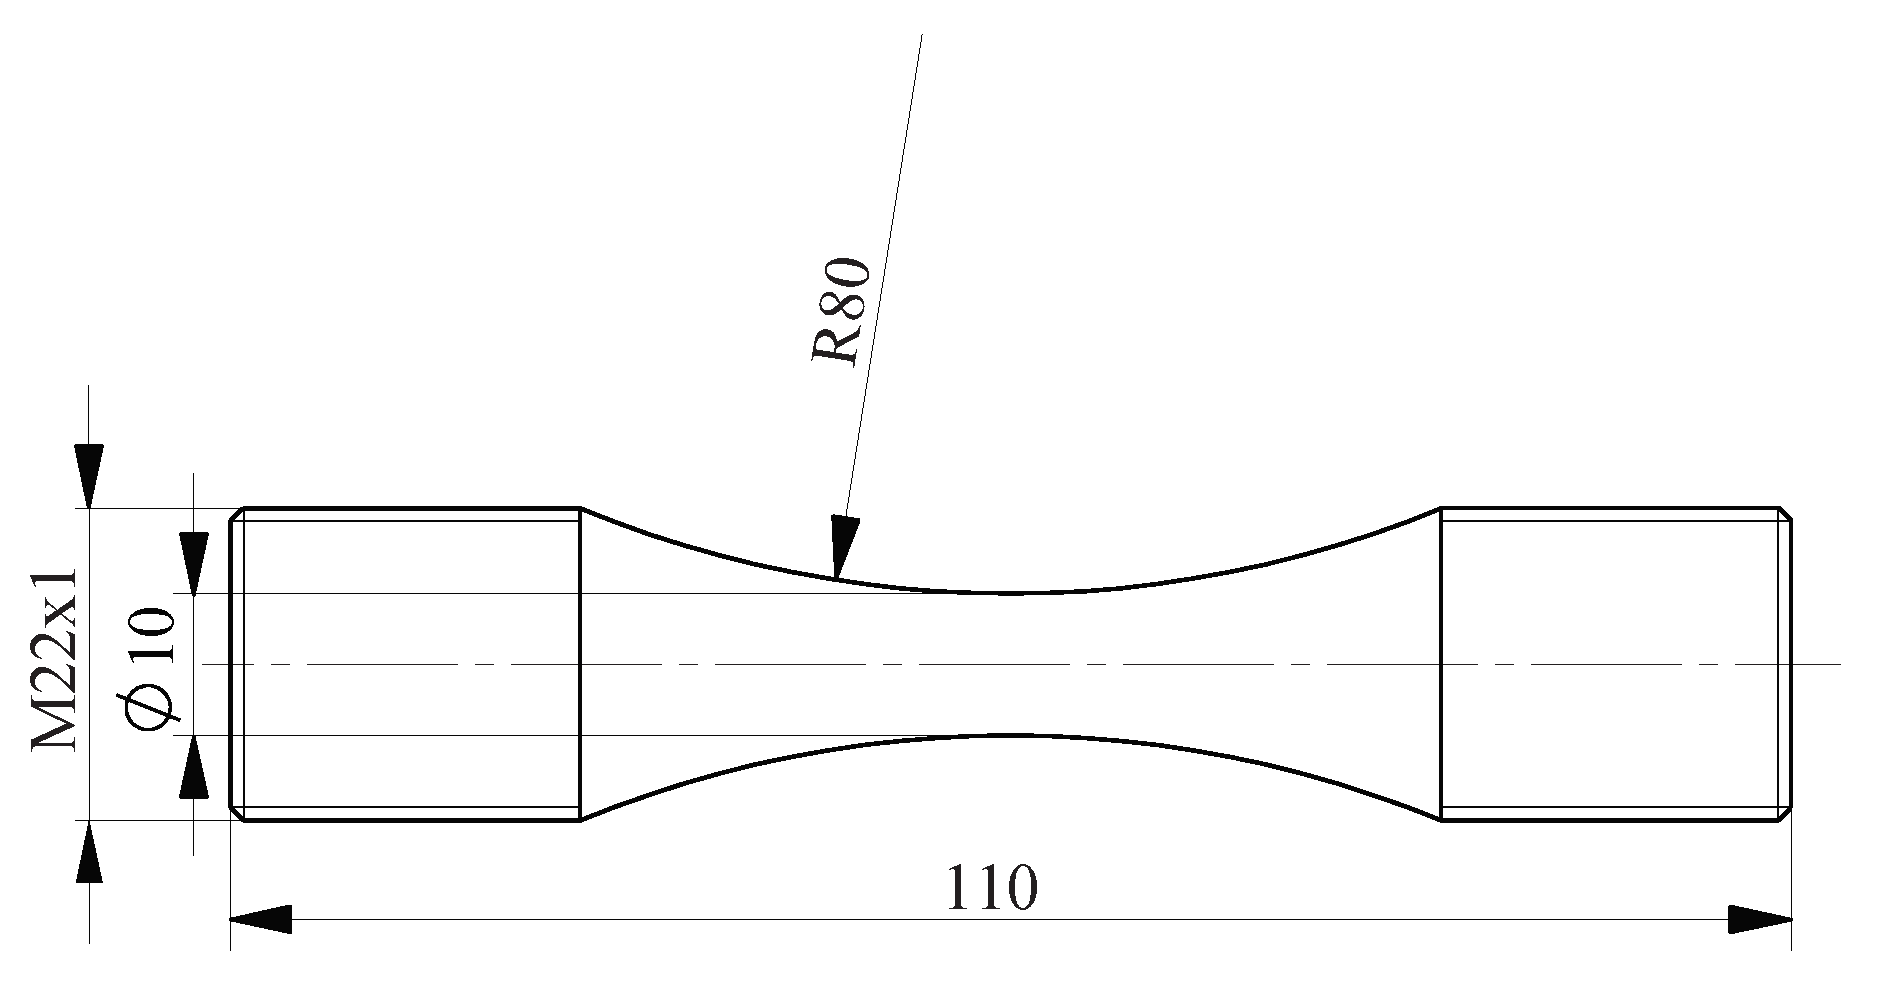
Fatigue tests were performed at environmental temperature and 150 Hz frequency by using a Rumul resonant testing machine. The specimen geometry is shown in Figure 2 and the specimen list is given in Table 2, where the 41 specimens that were employed are grouped by bar type and load ratio R.
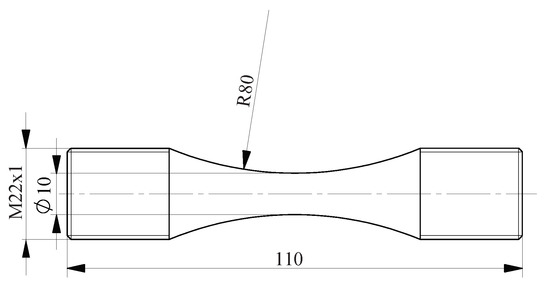
Figure 2.
Fatigue test specimen.
Table 2.
Number of specimens tested for each bar and each load ratio.
3. Results
3.1. Tensile Tests Results
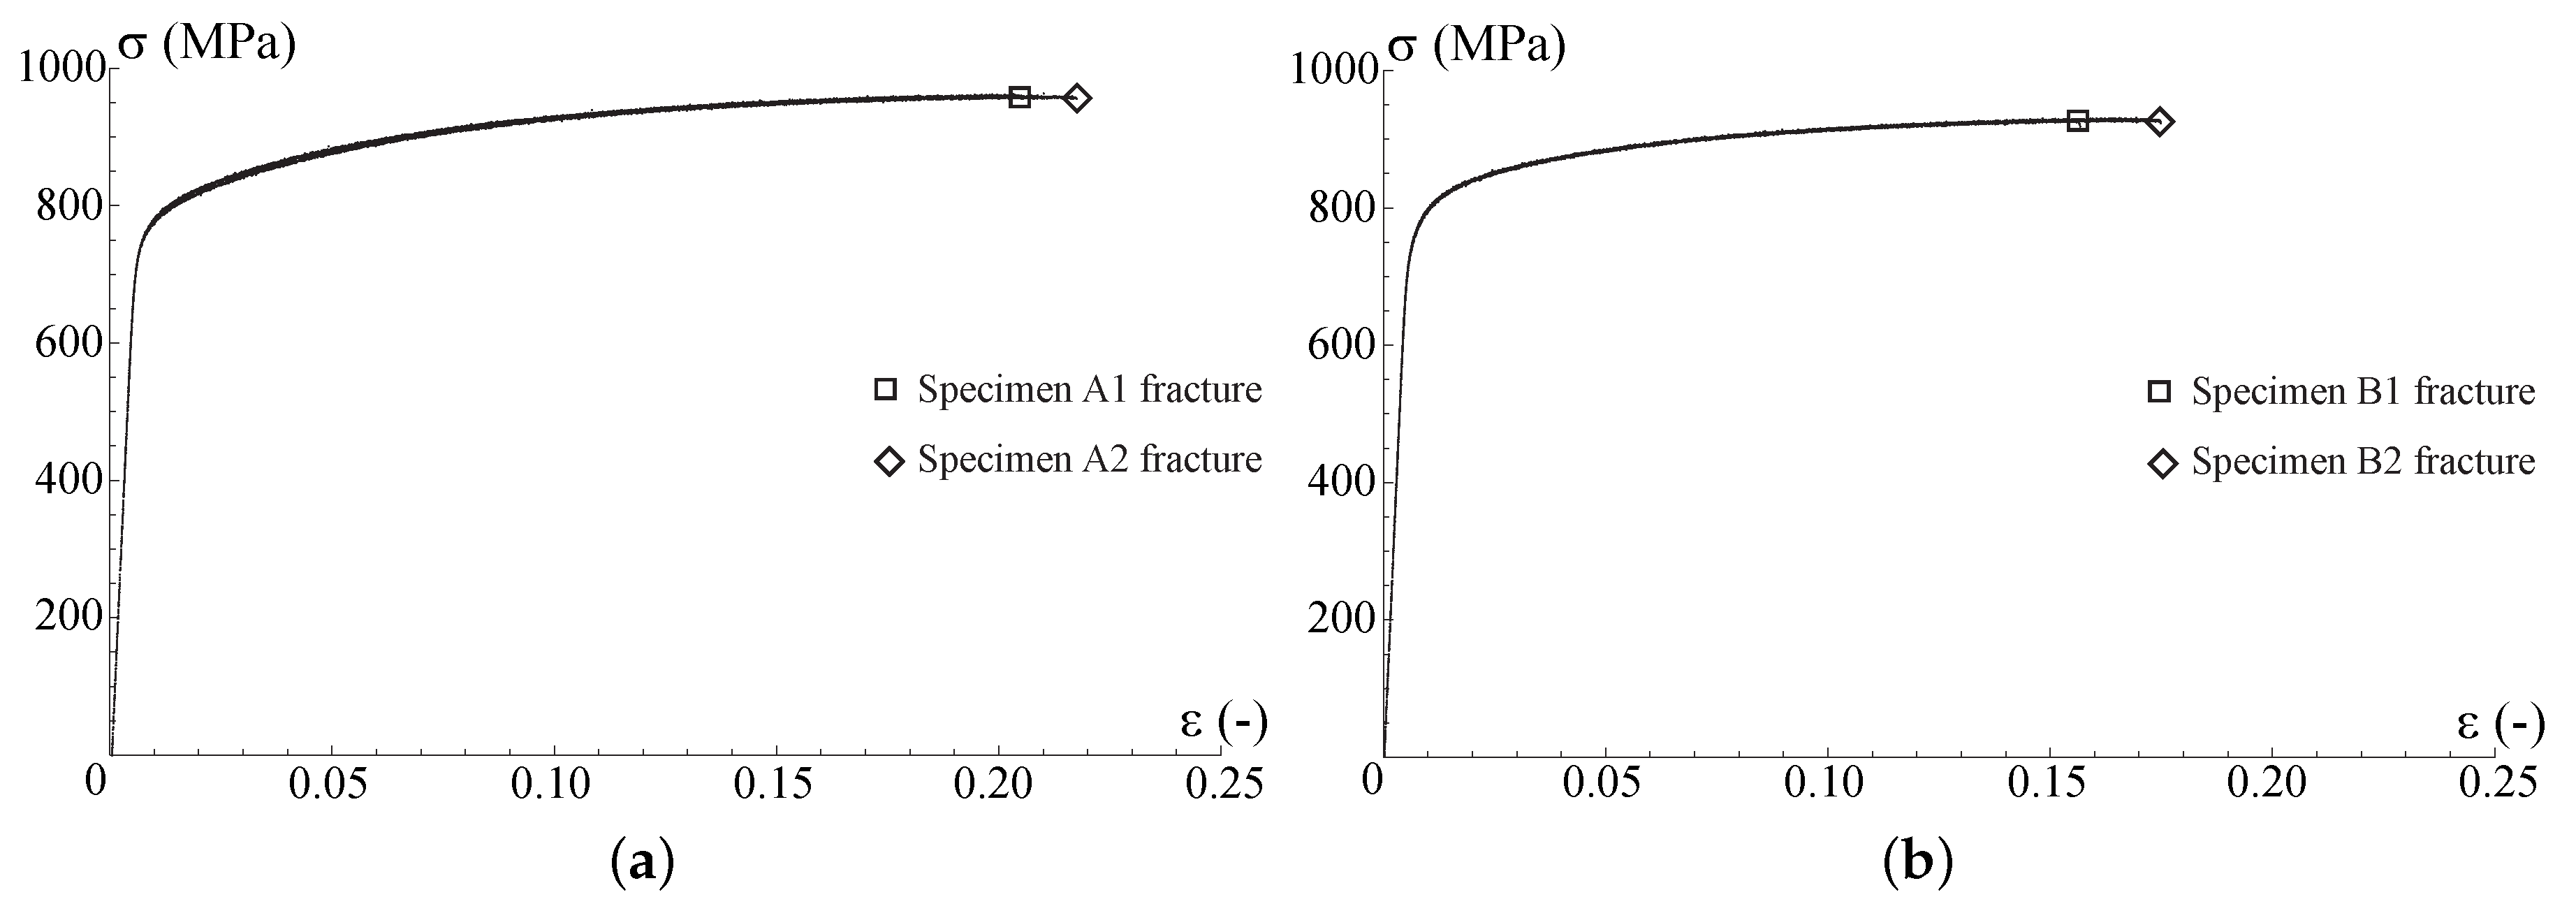
The results of the tensile tests for Bar A and Bar B specimens are shown in Figure 3. The tensile curves obtained from specimens belonging to the same bar are in very good mutual agreement and only some slight differences can be observed in the engineering ultimate stress and in the engineering fracture strain . The engineering ultimate stress was obtained from the experimental data as the maximum stress recorded during the tensile test. The yield stress was computed considering the stress which, after unloading, produces 0.2% residual strain.
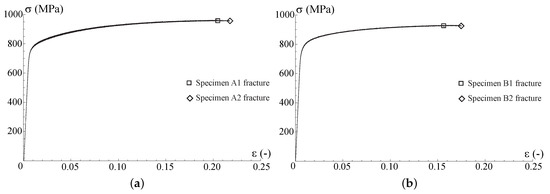
Figure 3.
Tensile test characteristics. (a) Tensile tests–Bar A; (b) Tensile tests–Bar B.
If the Bar A and Bar B tensile curves are compared, some slight but appreciable differences in the mechanical properties can be identified as shown in Table 3, which gives the material parameters obtained from all the tests.
Table 3.
Material parameters computed on the basis of tensile tests.
Since the data variability within each set was very low (see Table 3), the average values obtained for the two bars are considered for the following discussion. The main differences between the material parameters belonging to Bar A and Bar B are related to the engineering ultimate stress and the engineering fracture strain . In particular, the specimens extracted from Bar A exhibit an appreciably higher ultimate stress and fracture strain, proving that these specimens are somewhat more resilient (greater area under the curve) than the ones extracted from Bar B. The relative differences observed in the elastic moduli and in the yield stress between Bar A specimens and Bar B specimens were smaller and about 2% and 0.5%, respectively. With regards to the obtained results it has to be considered that tensile tests, representing static properties as obtained from the volume of the tested specimens, can provide only partial information on the in-service material behavior; this is what actually came out from the fatigue tests, where significant differences were observed for the specimens machined from different bars.
3.2. Microstructure Analysis Results
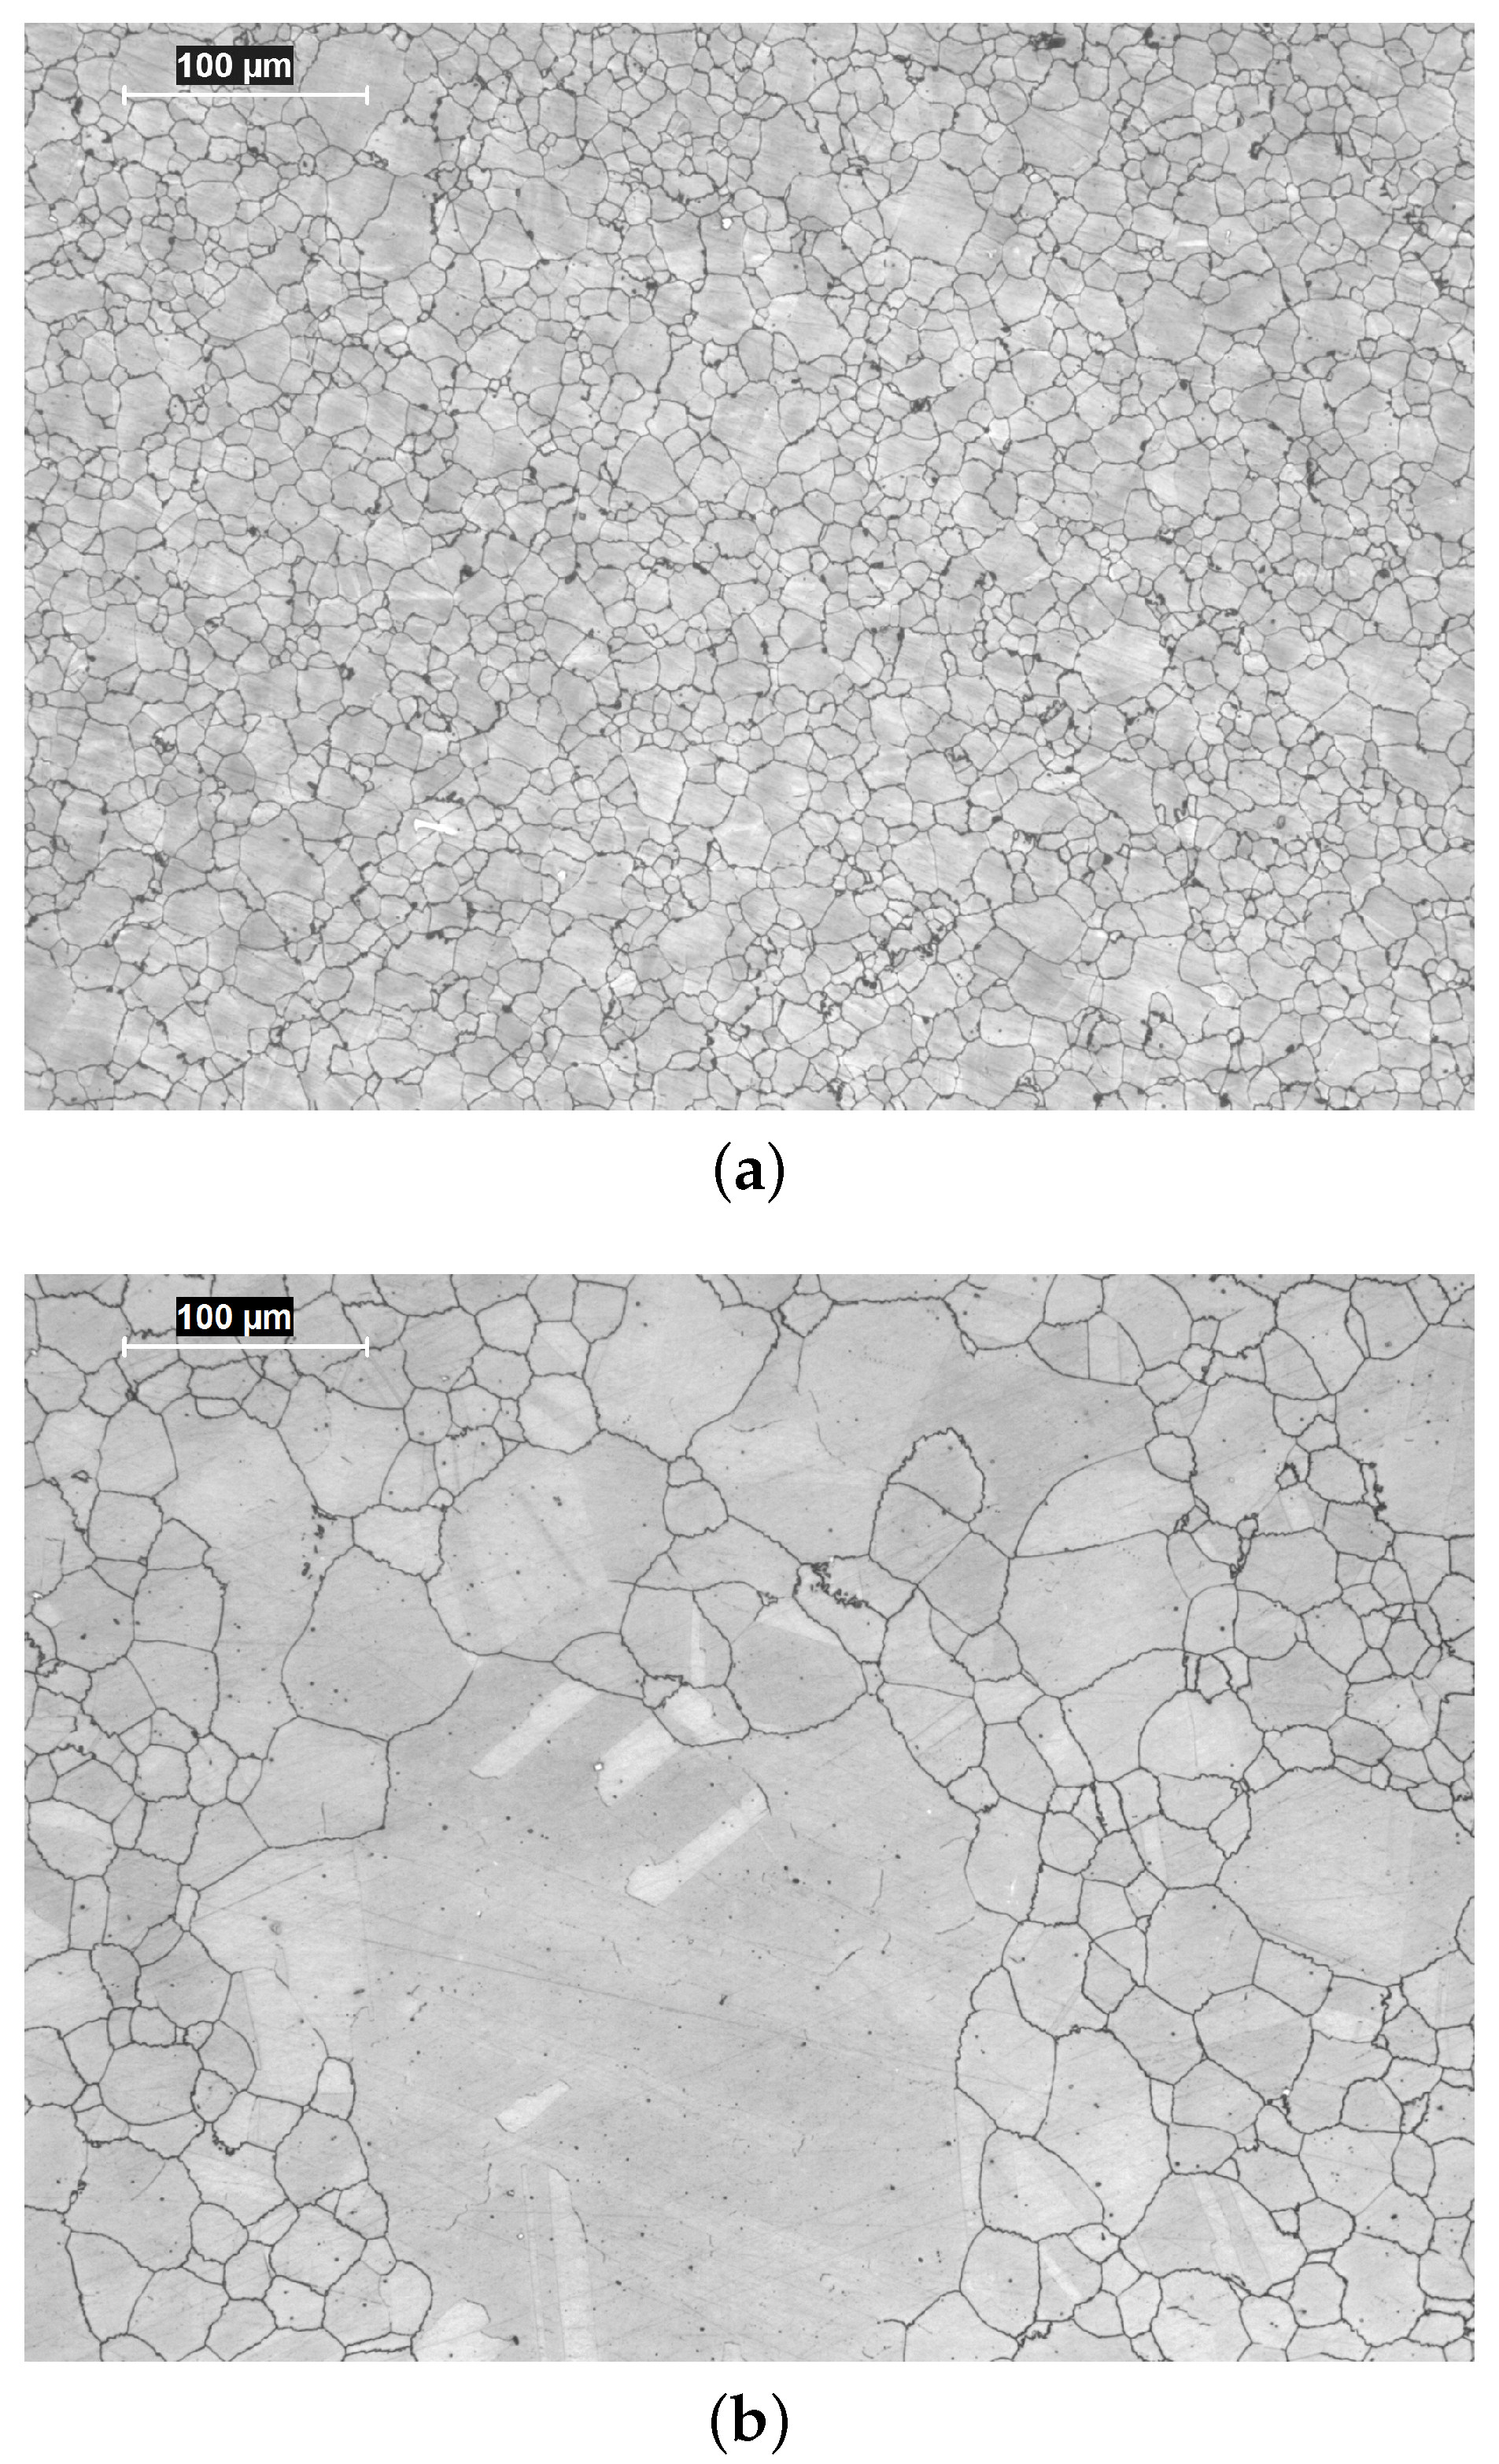
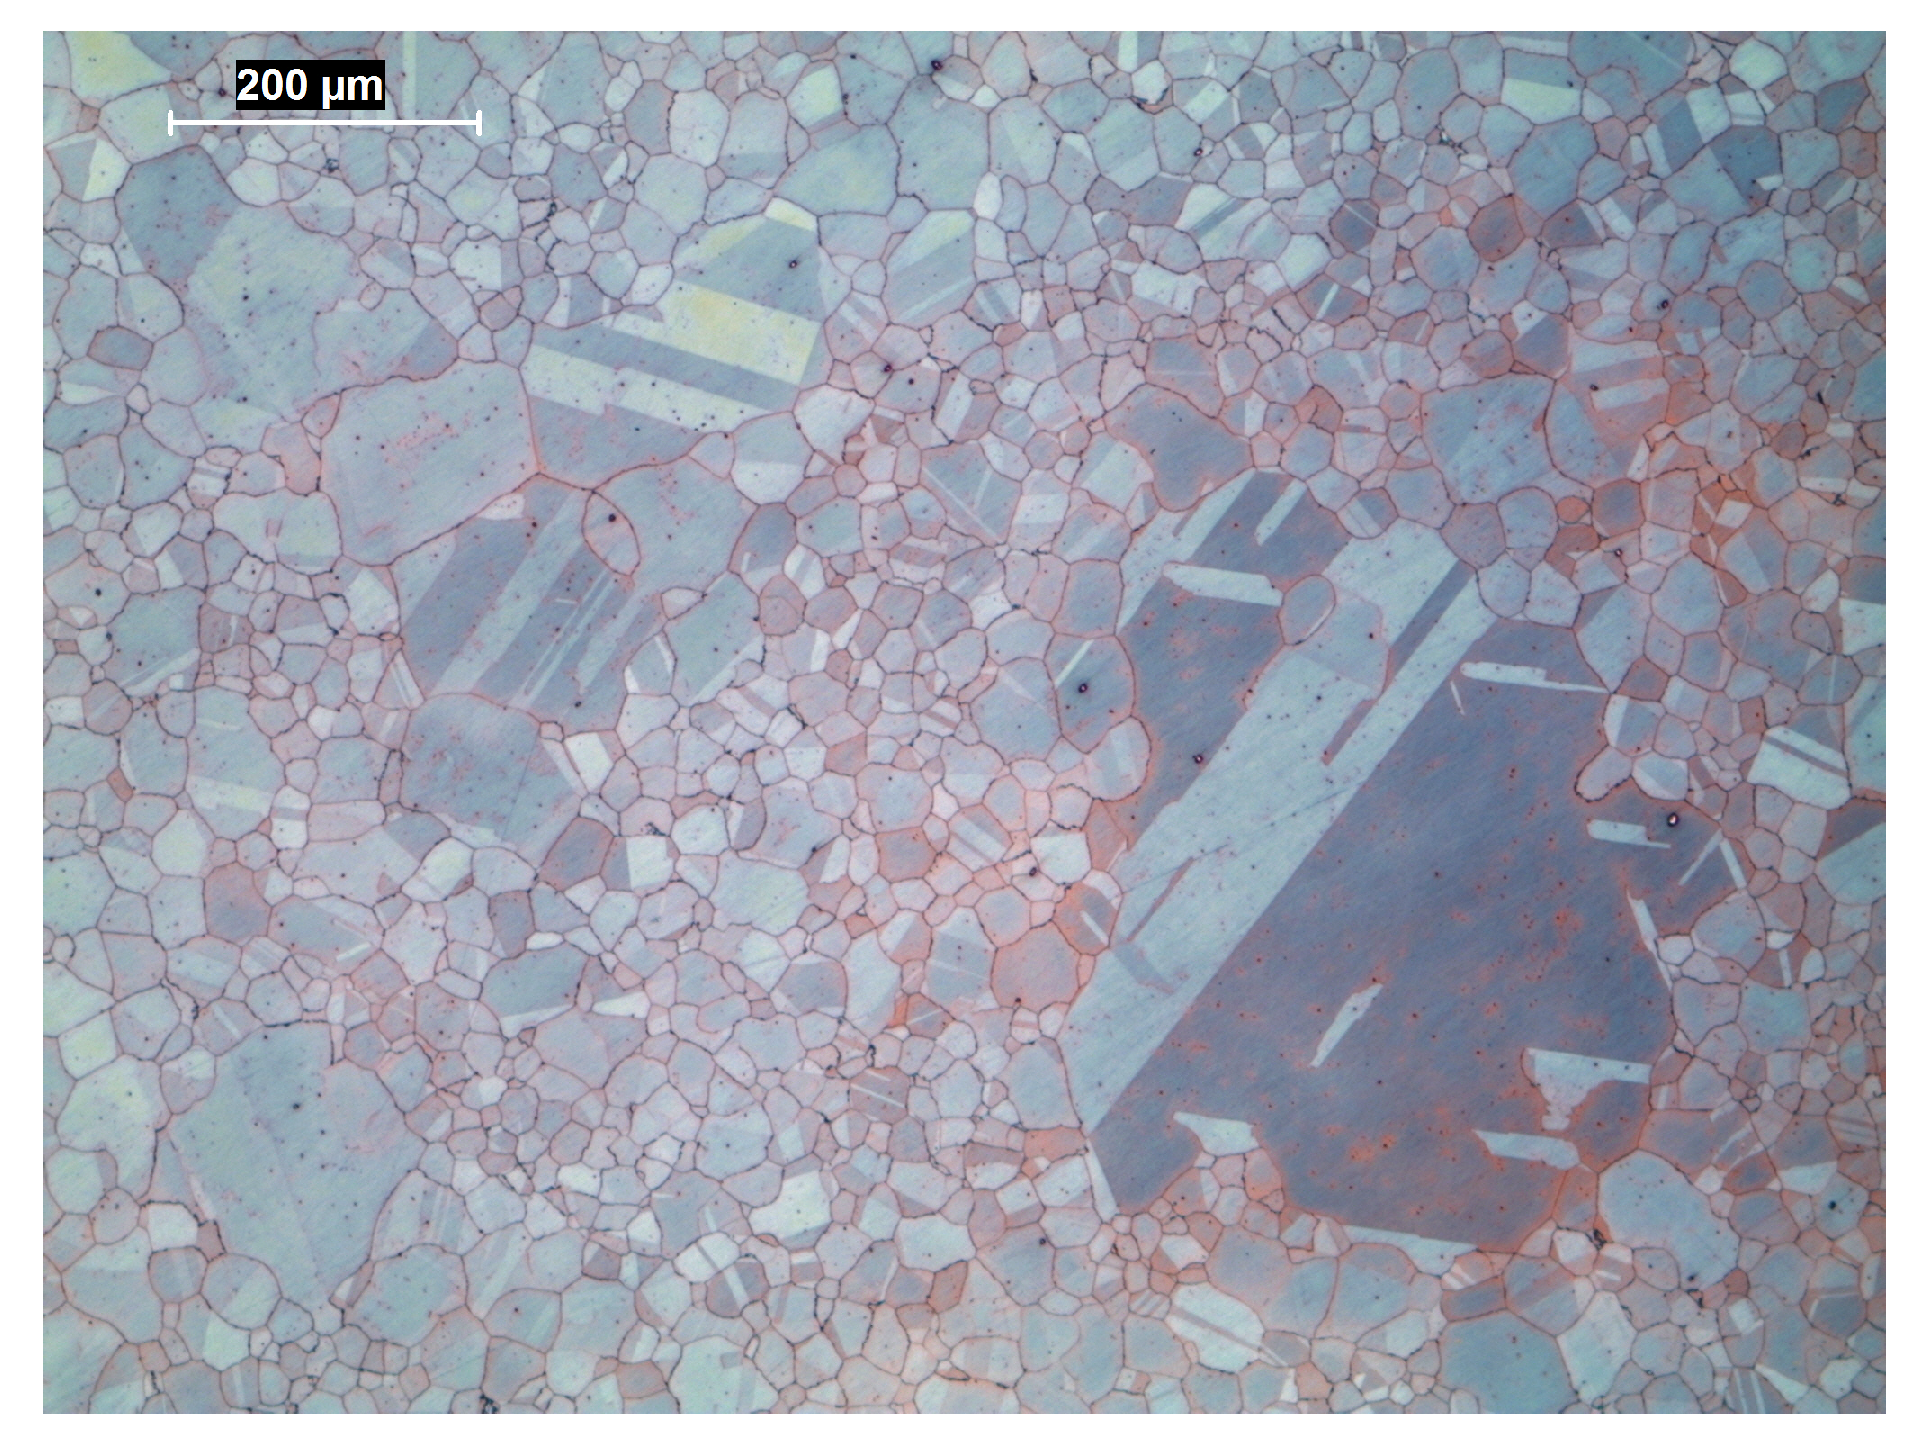
Figure 4a,b and Figure 5 show the microstructures of two reference specimens extracted form Bar A and Bar B, respectively. The specimen extracted from Bar A has a finer and more uniform grain size than the specimen extracted from Bar B. Some -phase inclusions can be noticed in Bar A specimen. On the other side, the Bar B specimen was characterized by larger grains and, occasionally, showed the presence of some very large grains. The microstructure of Bar B is hence inhomogeneous and characterized by the presence of abnormal grain growth. The presence of -phase in this case was negligible. The typical twinned austenitic microstructure was observed in the specimen extracted from Bar B (Figure 5).

Figure 4.
Pictures showing the microstructure of specimens extracted from Bar A (a) and Bar B (b).
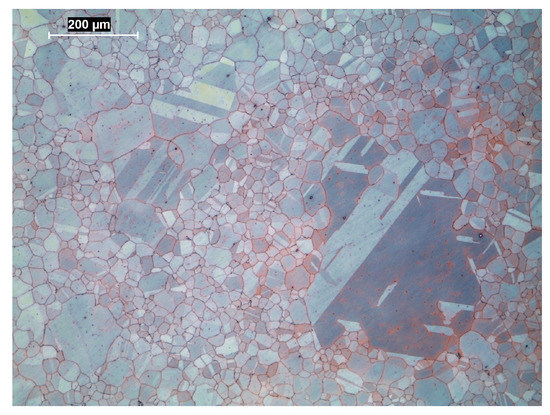
Figure 5.
Image showing the austenitic microstructure in Bar B.
In this alloy there is no evidence of mechanism of grain boundary control.
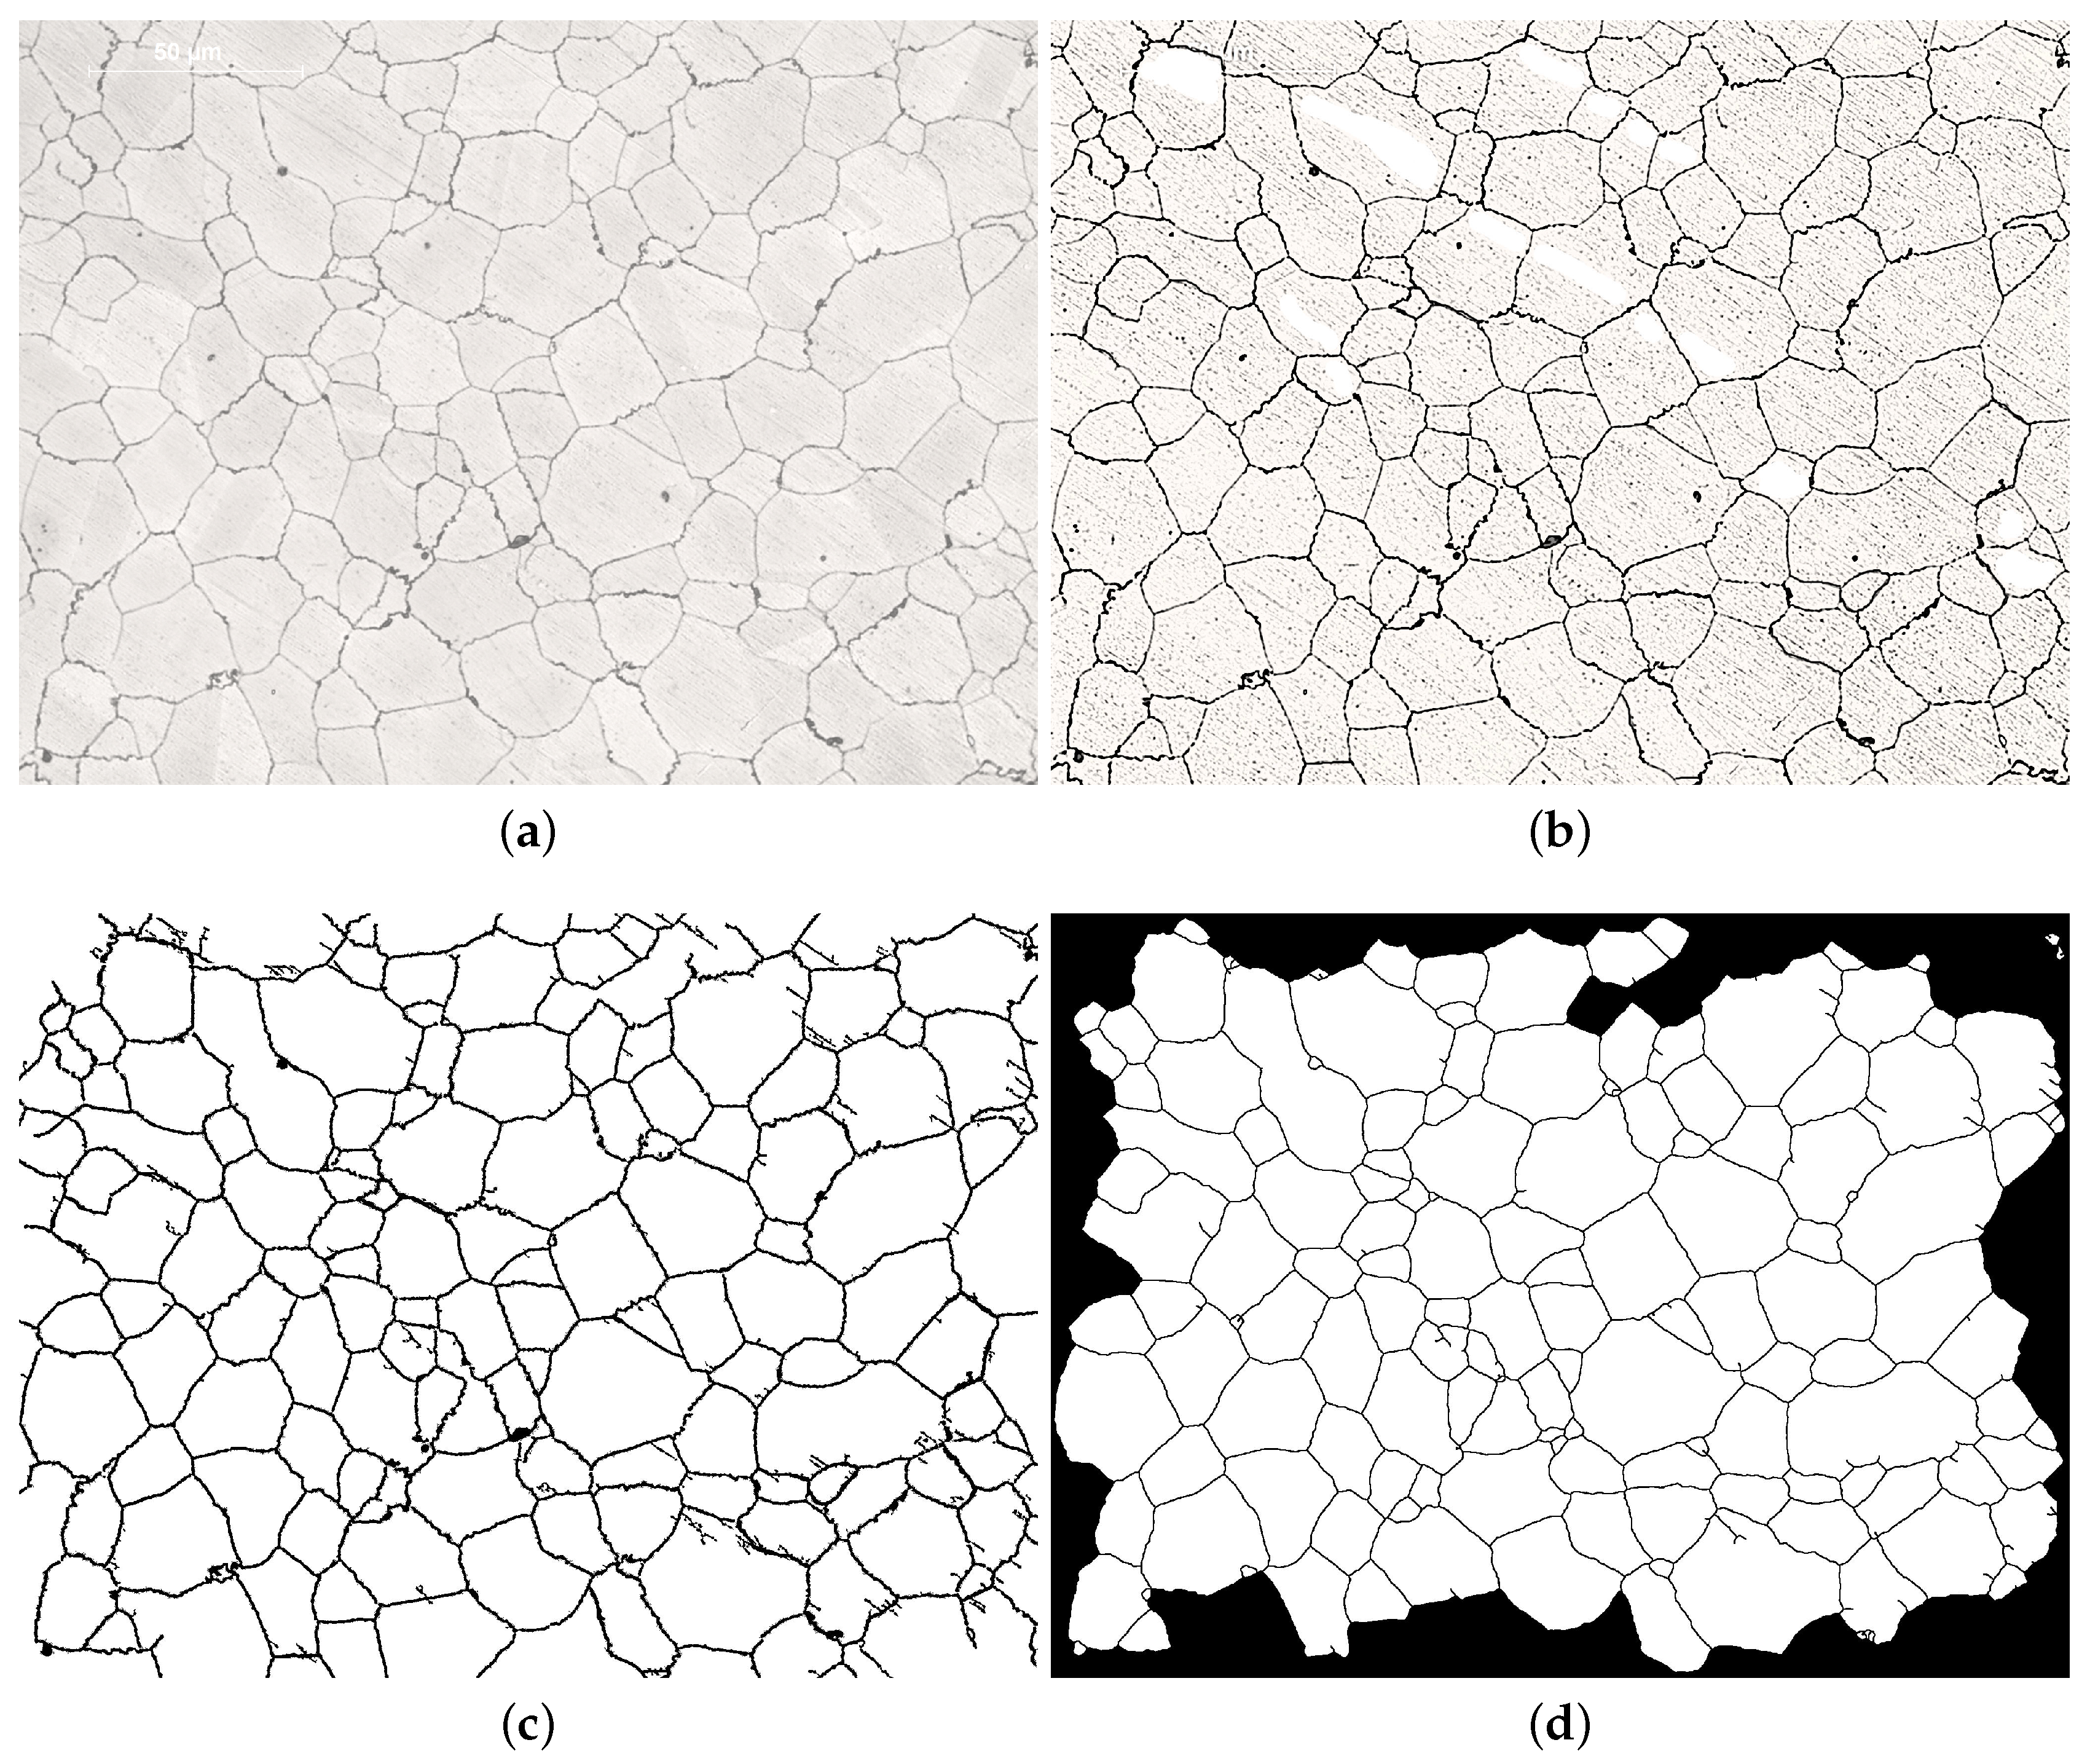
In order to achieve an objective evaluation of the average grain size and of the grain size distribution, an ad-hoc semi-automated image processing procedure was developed, as described in the following, with reference to one of the acquired images. The original image (Figure 6a), as acquired by optical microspcopy, was firstly edited by a photo-editor (Figure 6b) software in order to set luminosity and sharpness, and to manually remove some evident scratches. Subsequently, the image was imported into an image-processing software where it was binarized and cleared of small black spots, thus obtaining the image shown in Figure 6c. Finally, the grain boundaries were enlarged in order to join the discontinuous lines and, after that, the boundary lines thickness was reduced back to the final dimension (5 pixels). In addition, the grains which were over the image border were deleted, obtaining the final image shown in Figure 6d.
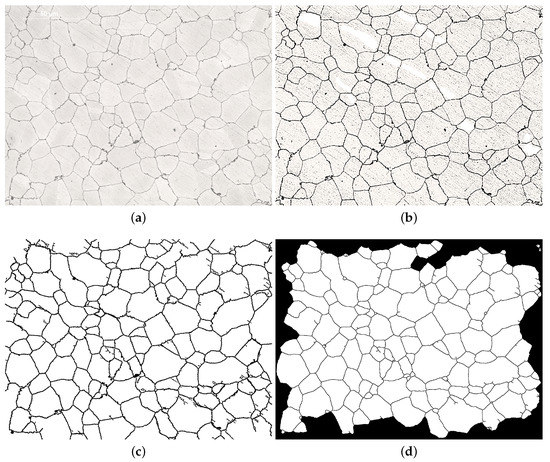
Figure 6.
Semi-automated procedure to detect grains. (a) Original image; (b) Photo editor processed and scratches manual removal; (c) Binarization and black spots removal; (d) Border grains removal.
Comparing Figure 6a,d, almost all the grain boundaries are correctly detected by the developed procedure and only few very small grains, which can be recognized only at high magnification factor, are erroneously detected. After the above described elaboration, an automated tool which detects white pixels within closed regions was used to measure the area of each grain.
For each one of the three regions delimited in Figure 7a (i.e., inner, middle and outer bar regions), four indices, each one resulting from five images, were then obtained:
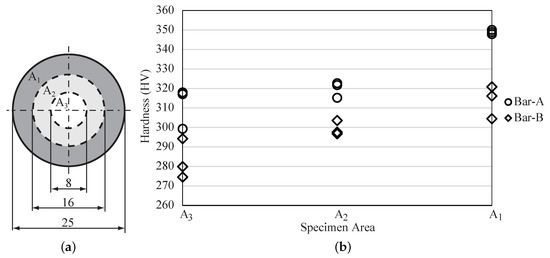
Figure 7.
Hardness tests: identification of specimen regions (a) and hardness measures (b).
- Bar A, average grain area in region (i.e., outer);
- Bar A, average grain area in region (i.e., middle);
- Bar A, average grain area in region (i.e., center);
- Bar B, average grain area random.
Concerning Bar A, three different evaluations were obtained in order to observe possible differences in grain size between the external and internal area of the bar as a consequence of the quenching process. In case of Bar B specimens, an average grain area was obtained considering five images, which were randomly distributed over the specimen cross section, since the presence of very big grains did not allow to identify uniform grain size regions within each of the regions indicated in Figure 7a. Indeed, due to their large size, statistical data could misrepresent the grain size information of different region depending whether on the presence or not of such large grains in the analyzed image.
The results of the grain size analysis are listed in Table 4, where is the total area resulting from the analyzed five images, N is the total number of grains considering all the five images, is the average value of the grain area, is the standard deviation of the values of the grain area, is the area of the biggest grain that was found over the five images, n is the average number of grains per unit of area and G is the grain size number as defined by the ASTM standard [14].
Table 4.
Grain area analysis.
For Bar A, very similar values of the average grain size , as well as and were obtained in the outer and middle regions of the cross section, i.e., and respectively, while slightly higher values were obtained in the center region . On the other side, for Bar B, completely different microstructure parameters were obtained: is about three times larger than in Bar A but the main differences can be found especially on and , where the two bars differ for about one order of magnitude due to the presence of very large grains in Bar B specimens.
3.3. Hardness Tests Results
Three different measures were taken on each area; the results are given in Figure 7b. For both specimens an increase of the hardness value can be observed moving from the center to the outer region; such an increase can be related, especially in the case of Bar A, to the smaller microstructural pattern of the external area (see Table 4). In addition, due to its finer granular microstructure, the hardness of the specimen extracted from Bar A resulted in 20–40 HV higher values than the hardness obtained on the specimen extracted from Bar B (see Figure 7b).
3.4. Fatigue Tests Results
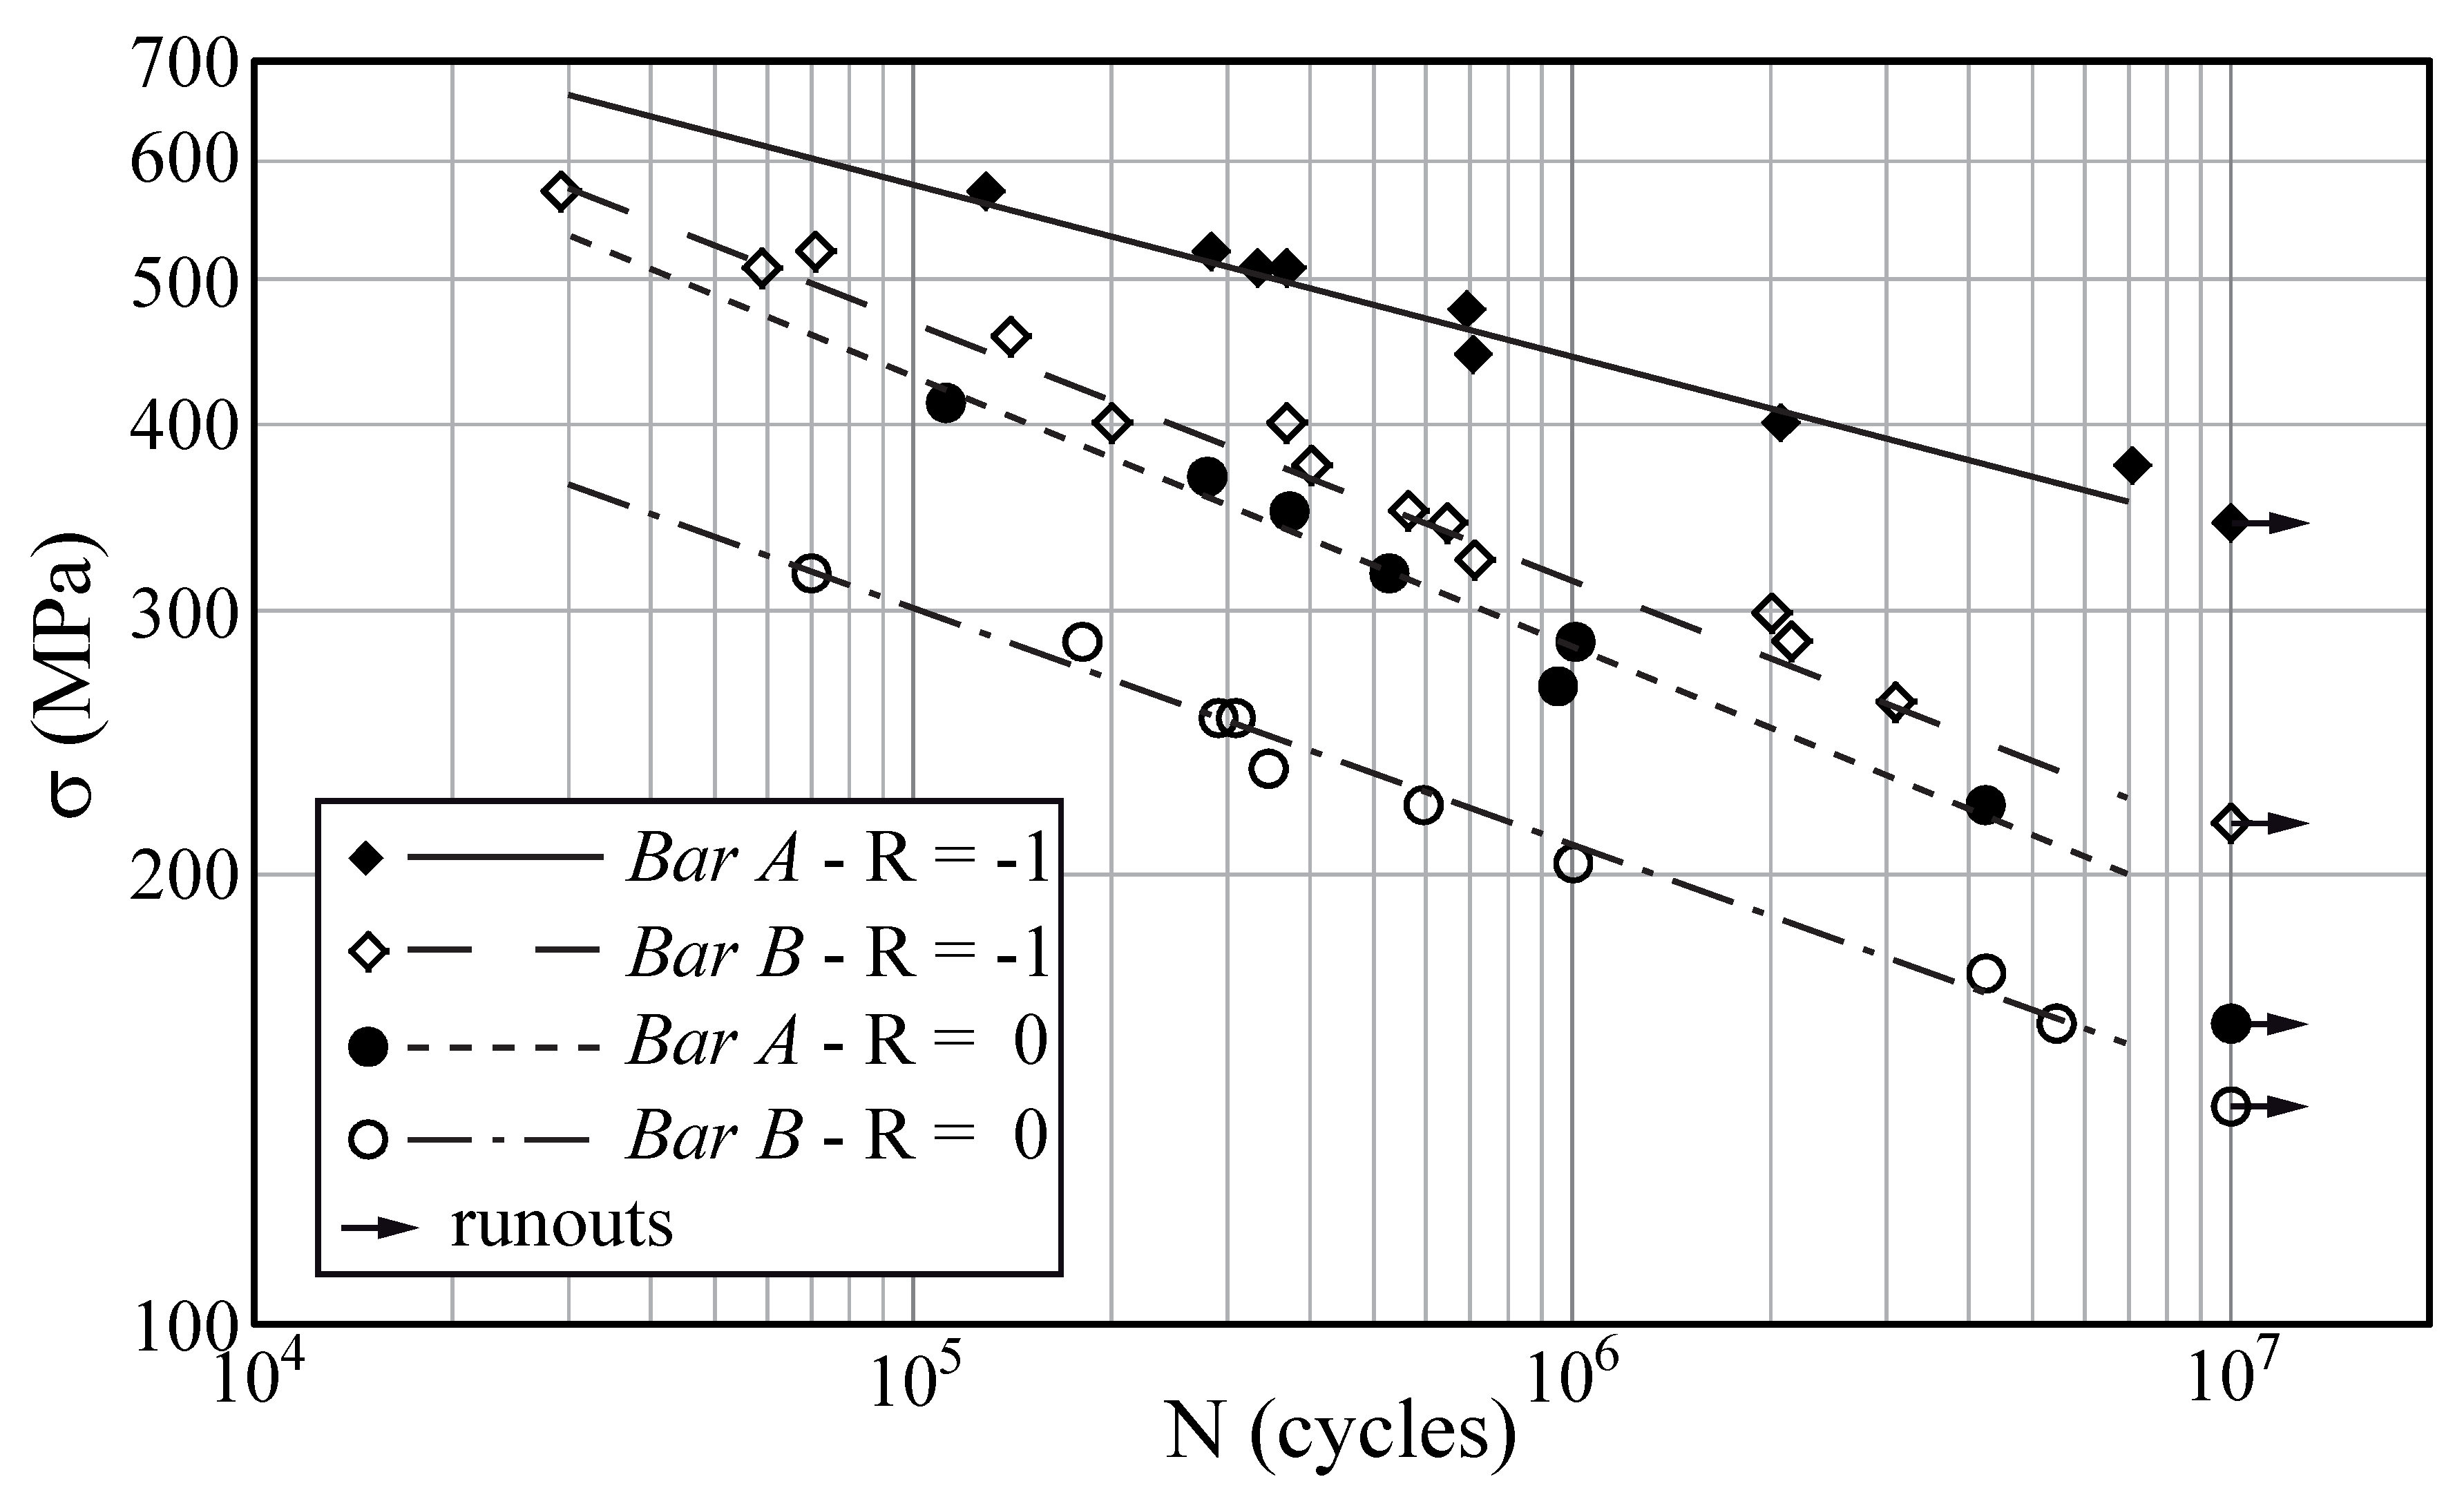
The results of the fatigue tests performed with and are shown in Figure 8. The parameters representative of the fatigue curves, i.e., slope coefficient k, endurable (alternate) stress at cycles and scatter band (intended as the ratio between the curves at 90% and 10% failure probability ) are given in Table 5.

Figure 8.
Fatigue test results for and with regression lines.
Table 5.
Fatigue statistical data.
As it can be observed Bar B specimens exhibited a significantly lower fatigue endurance than specimens extracted from Bar A and this, again, can be ascribed to the different microstructure. The presence of very large austenitic grains, which act as microstructural notches, was responsible for the lower fatigue endurance. For alternating fatigue tests (i.e., ), that difference is about a decade and seems to slightly increase with the number of cycles to failure. The difference in the observed endurance seems to vanish below cycles. For pulsating fatigue tests (i.e., ) the difference in the observed endurance is slightly lower and seems to be almost constant over the examined range of cycles to failure. This is confirmed also by the exponent coefficients k in Table 5, which are 9.1 and 6 for Bar A and Bar B, respectively, in case of and 5.5 and 6.3 in case of . For both bars a high sensitivity to the mean stress can be observed. The fatigue endurance is reduced more than by a factor of 10, passing from to . A relatively small scatter band was observed in all tests.
4. Discussion
The final failure surfaces of the specimens belonging to Bar A and Bar B appear significantly different, and this happened for all the specimens, confirming a different fatigue failure mechanism between specimens extracted from the different bars.
In case of specimens extracted from Bar A, Figure 9, the final failure surface was characterized by two different areas which can be easily recognized with naked eye. The inner zone was brillant, while the outer area looked more opaque. The center zone, which as it will be discussed later on, corresponds to the final rupture also presented a cone shape in a transverse side view (see Figure 9a,c). On the other side, for specimens extracted from Bar B, the final failure surface appeared flat and perpendicular with respect to the specimen axis (see Figure 10).
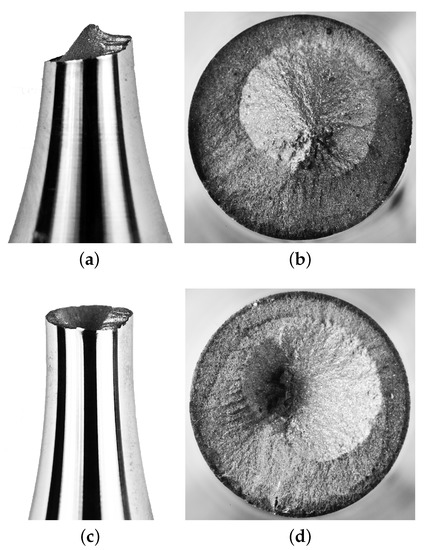
Figure 9.
Final failure surface in case of specimens extracted from Bar A. (a) Cone, side view; (b) Cone, upper view; (c) Cup, side view; (d) Cup, upper view.
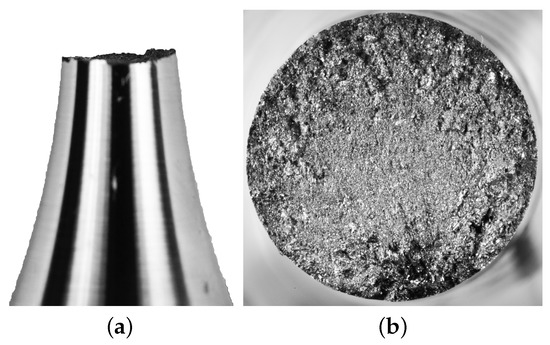
Figure 10.
Final failure surface in case of specimens extracted from Bar B. (a) Side view; (b) Upper view.
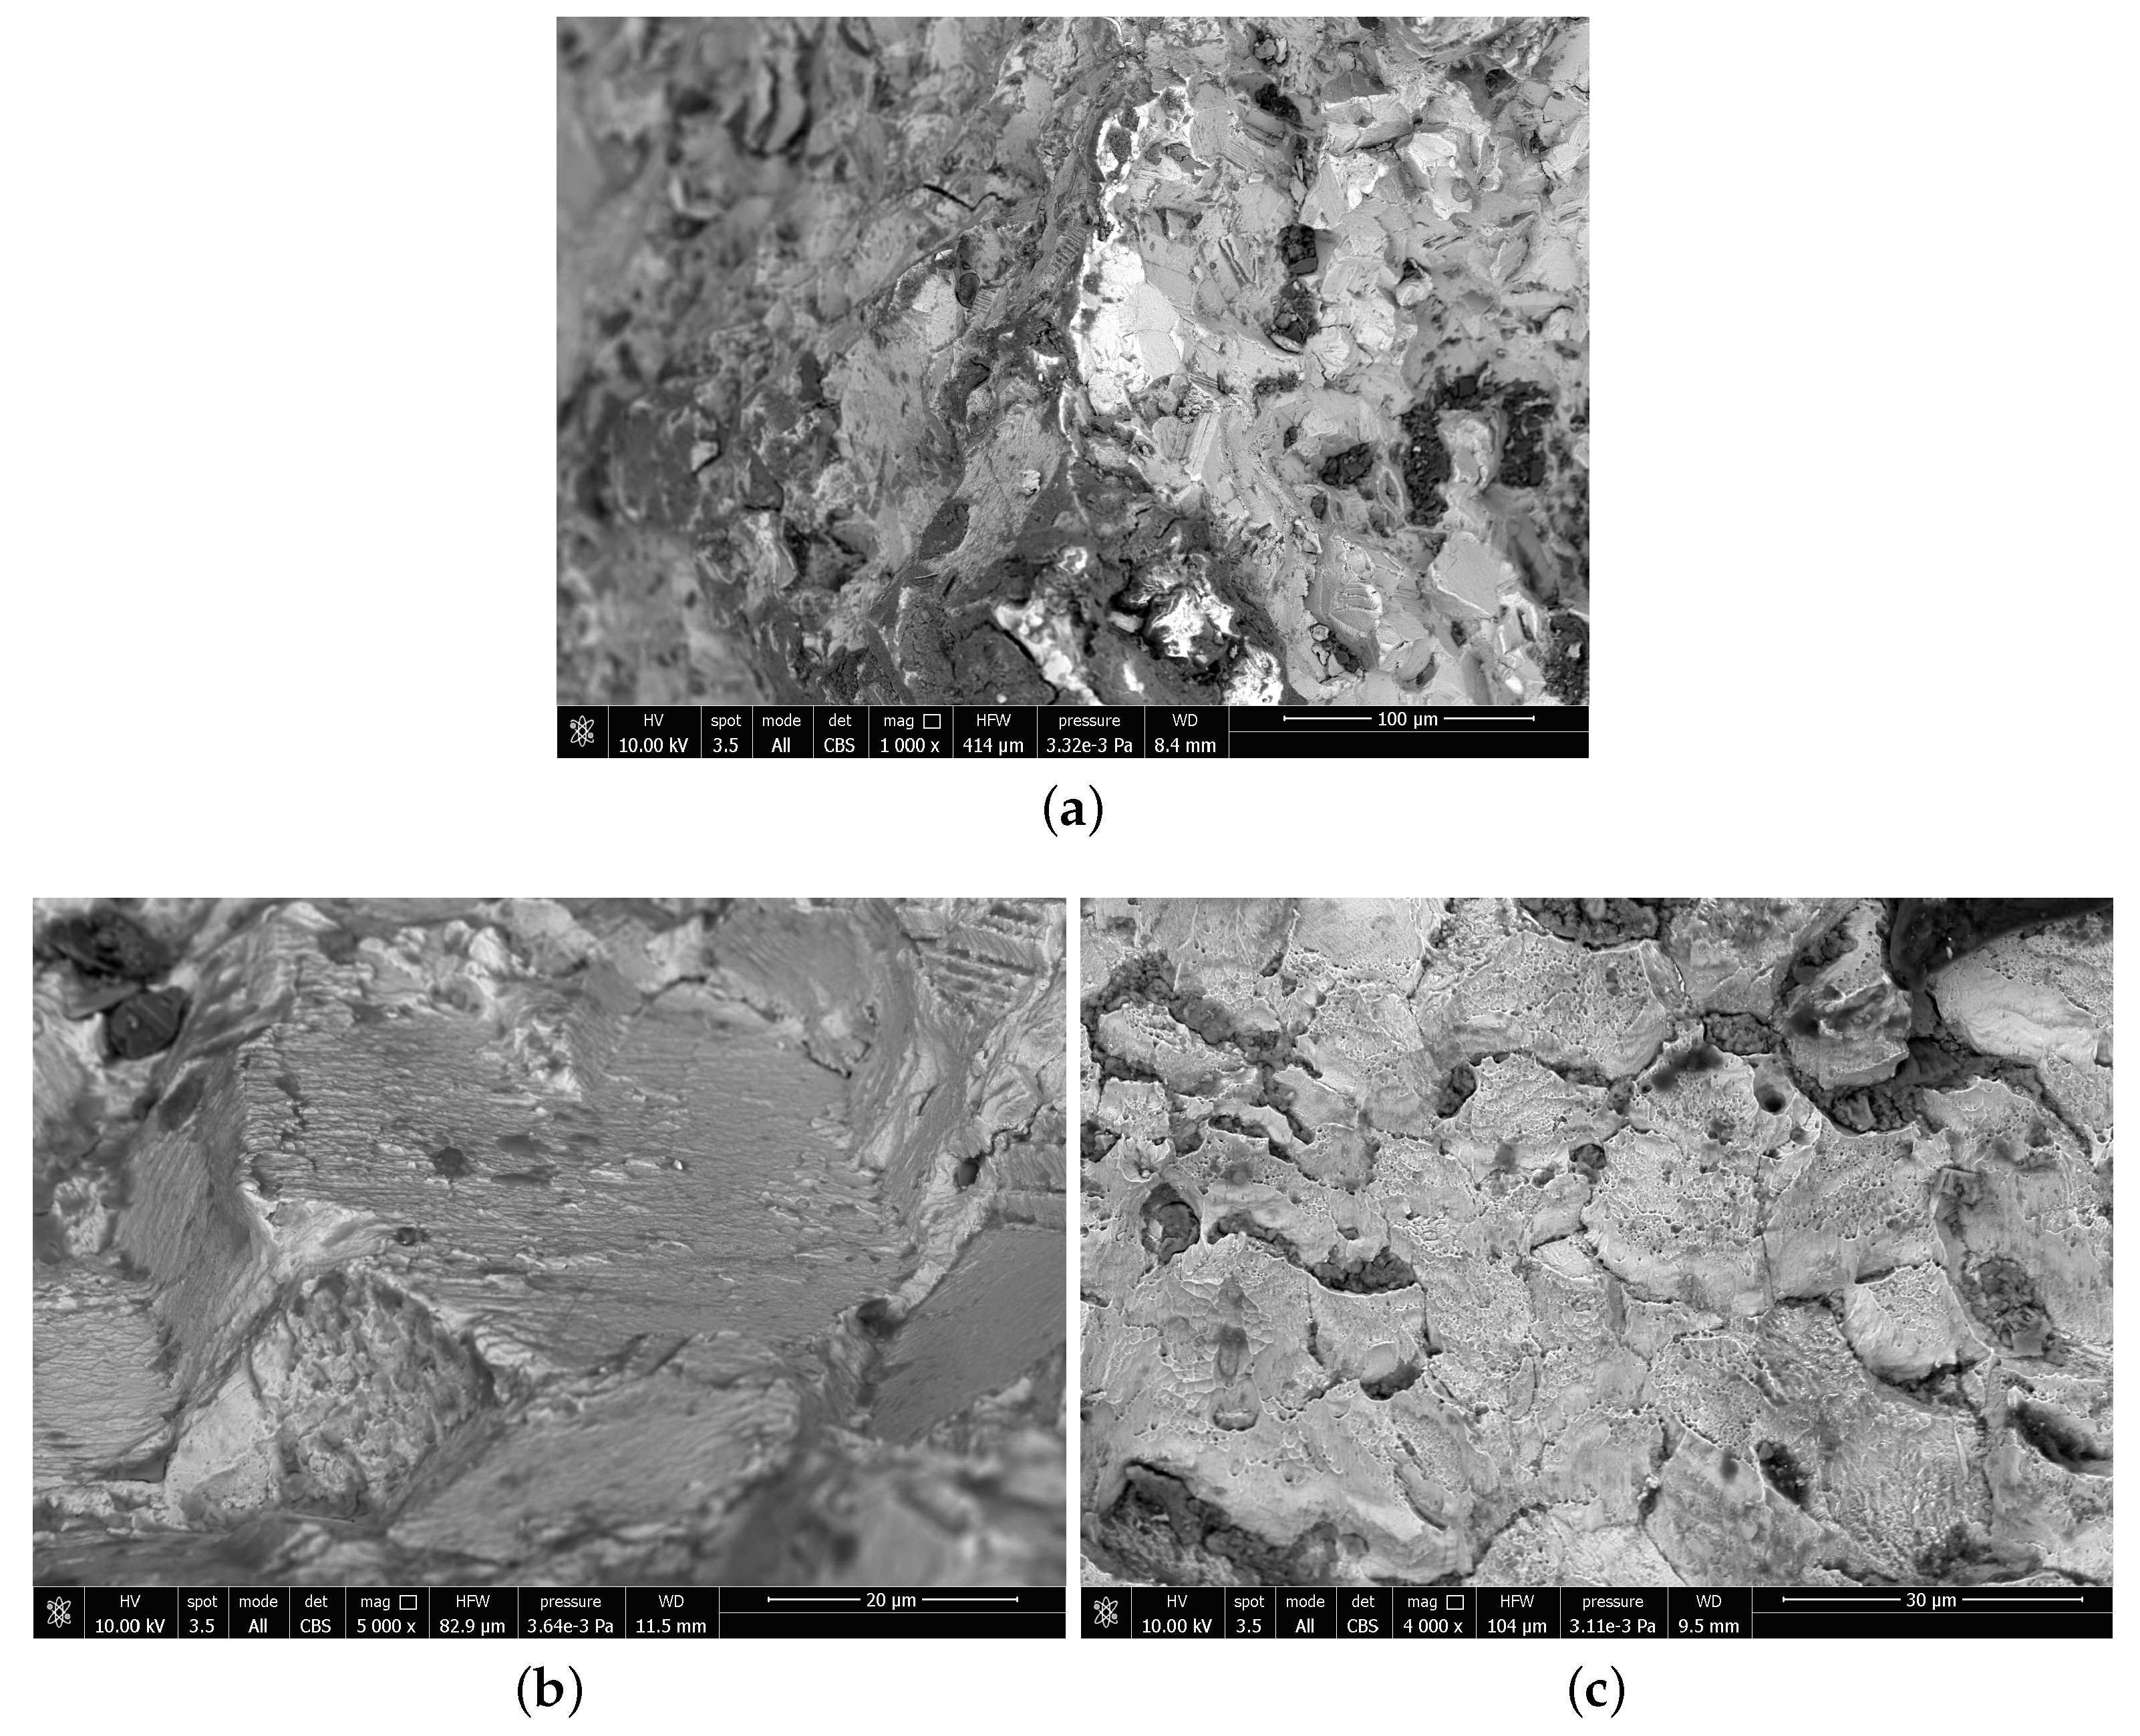
To analyze the fracture surface and identify both the crack growth region and the final failure area SEM microscopy was used. Indeed, as shown in Figure 11a, the boundary between the two areas was easy identifiable and, using higher magnifications, several growth lines can be observed in the opaque external zone (Figure 11b), while the central brilliant zone (crystallize) was characterized by porous surfaces, which most likely is due to the transgranular final fracture of the specimen (Figure 11c).

Figure 11.
SEM microscopy of specimens extracted from Bar A: (a) border line, (b) opaque zone, (c) brilliant zone.
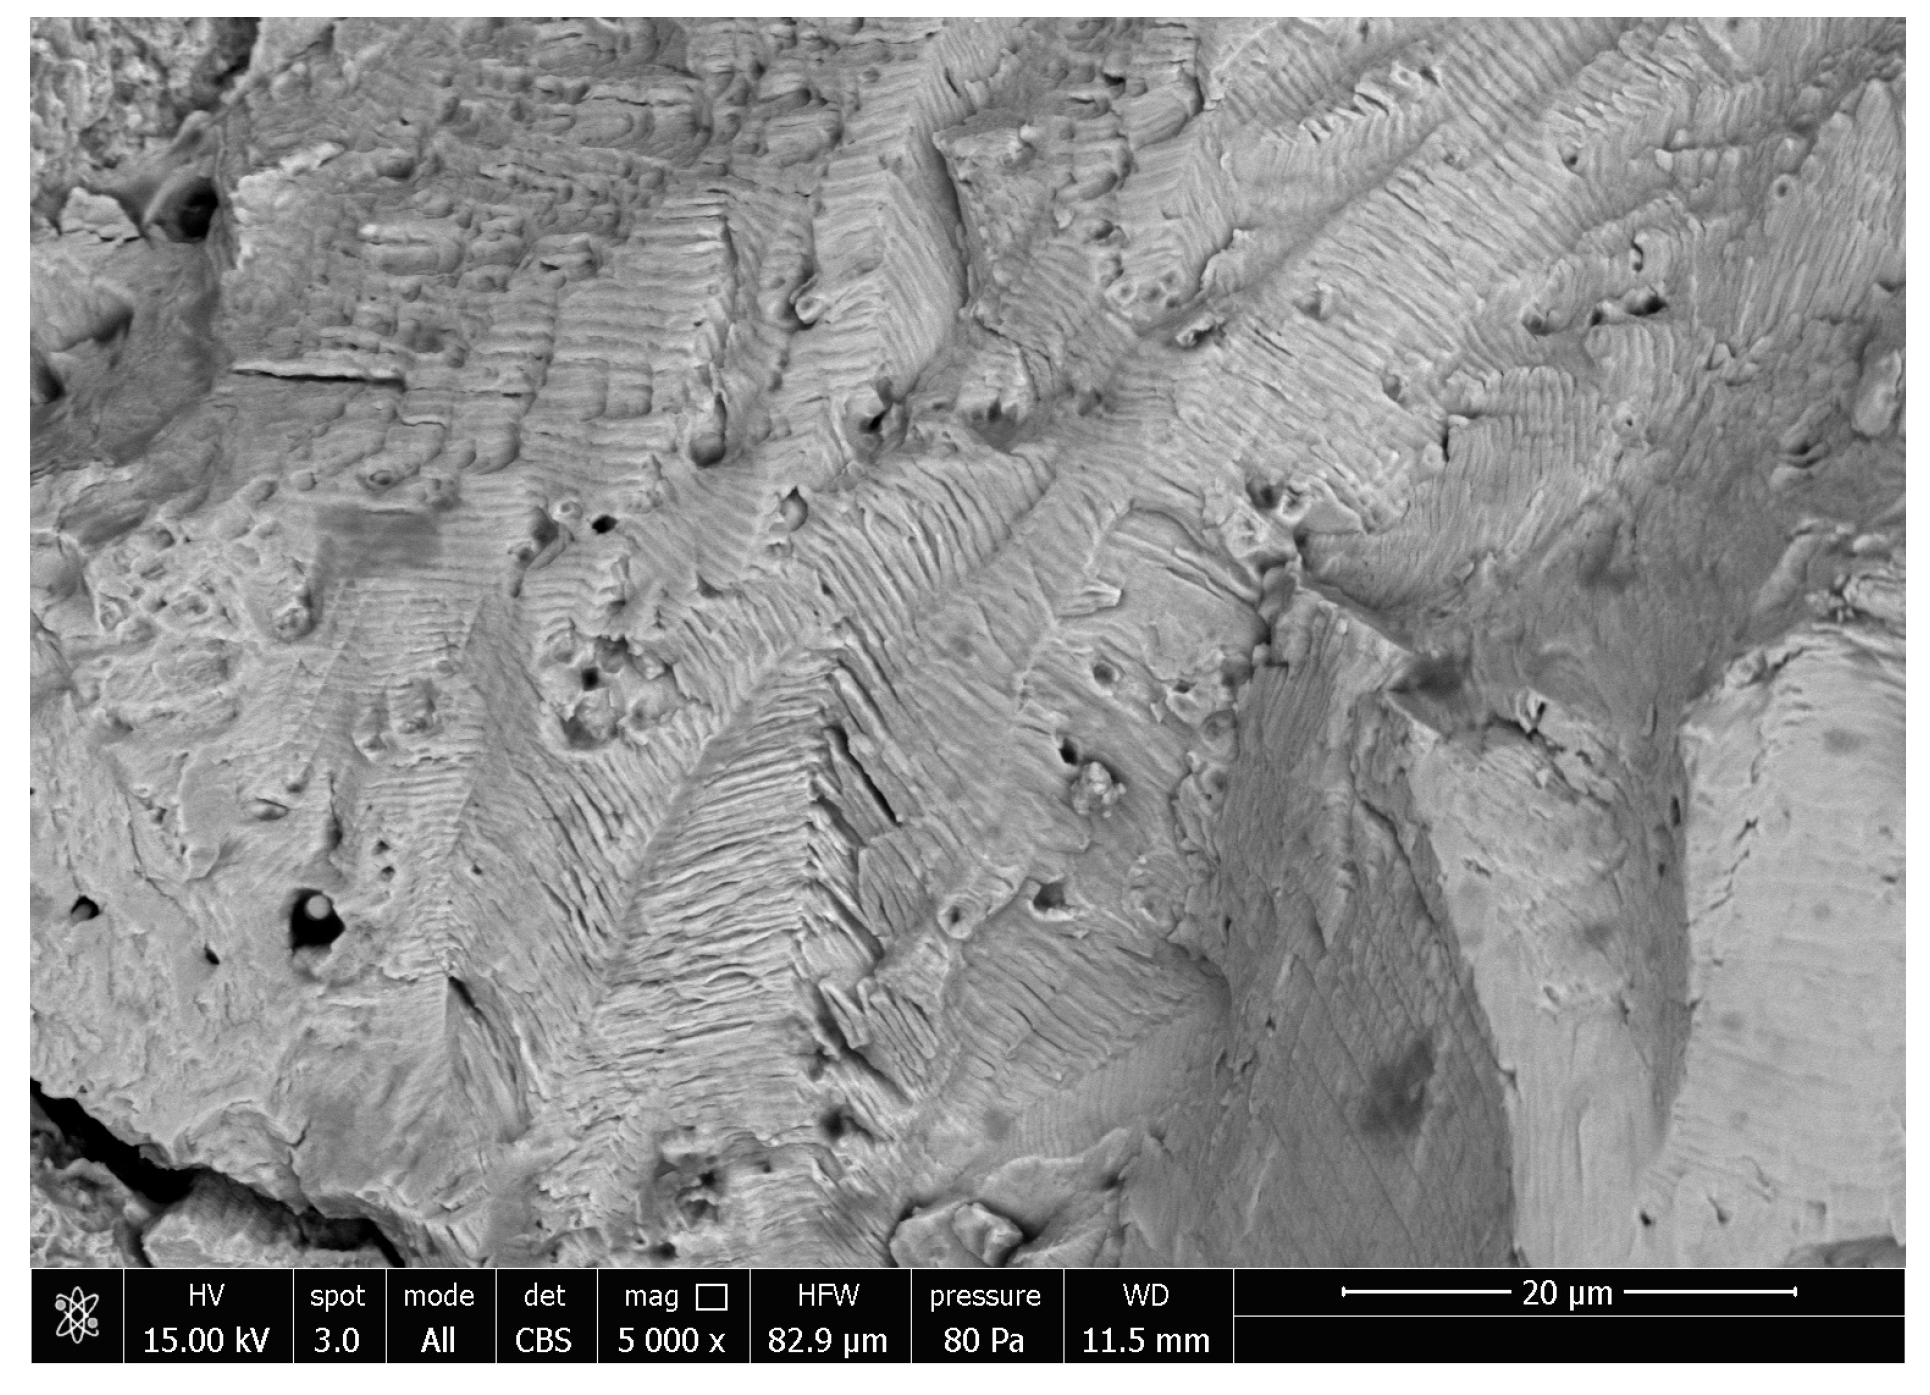
The microstructure of specimens extracted from Bar B was characterized by the presence of very large austenitic grains (size of the order of 300 m considering the area given in Table 4 and shown in Figure 5), with a random distribution inside the bar volume, which represents geometric and material discontinuities and act as microstructural notches for fatigue crack initiation. In this case the failure surface was mainly dominated by the microstructure, and the fracture was intergranular (Figure 12).

Figure 12.
Intergranular fracture observed in specimens extracted from Bar B.
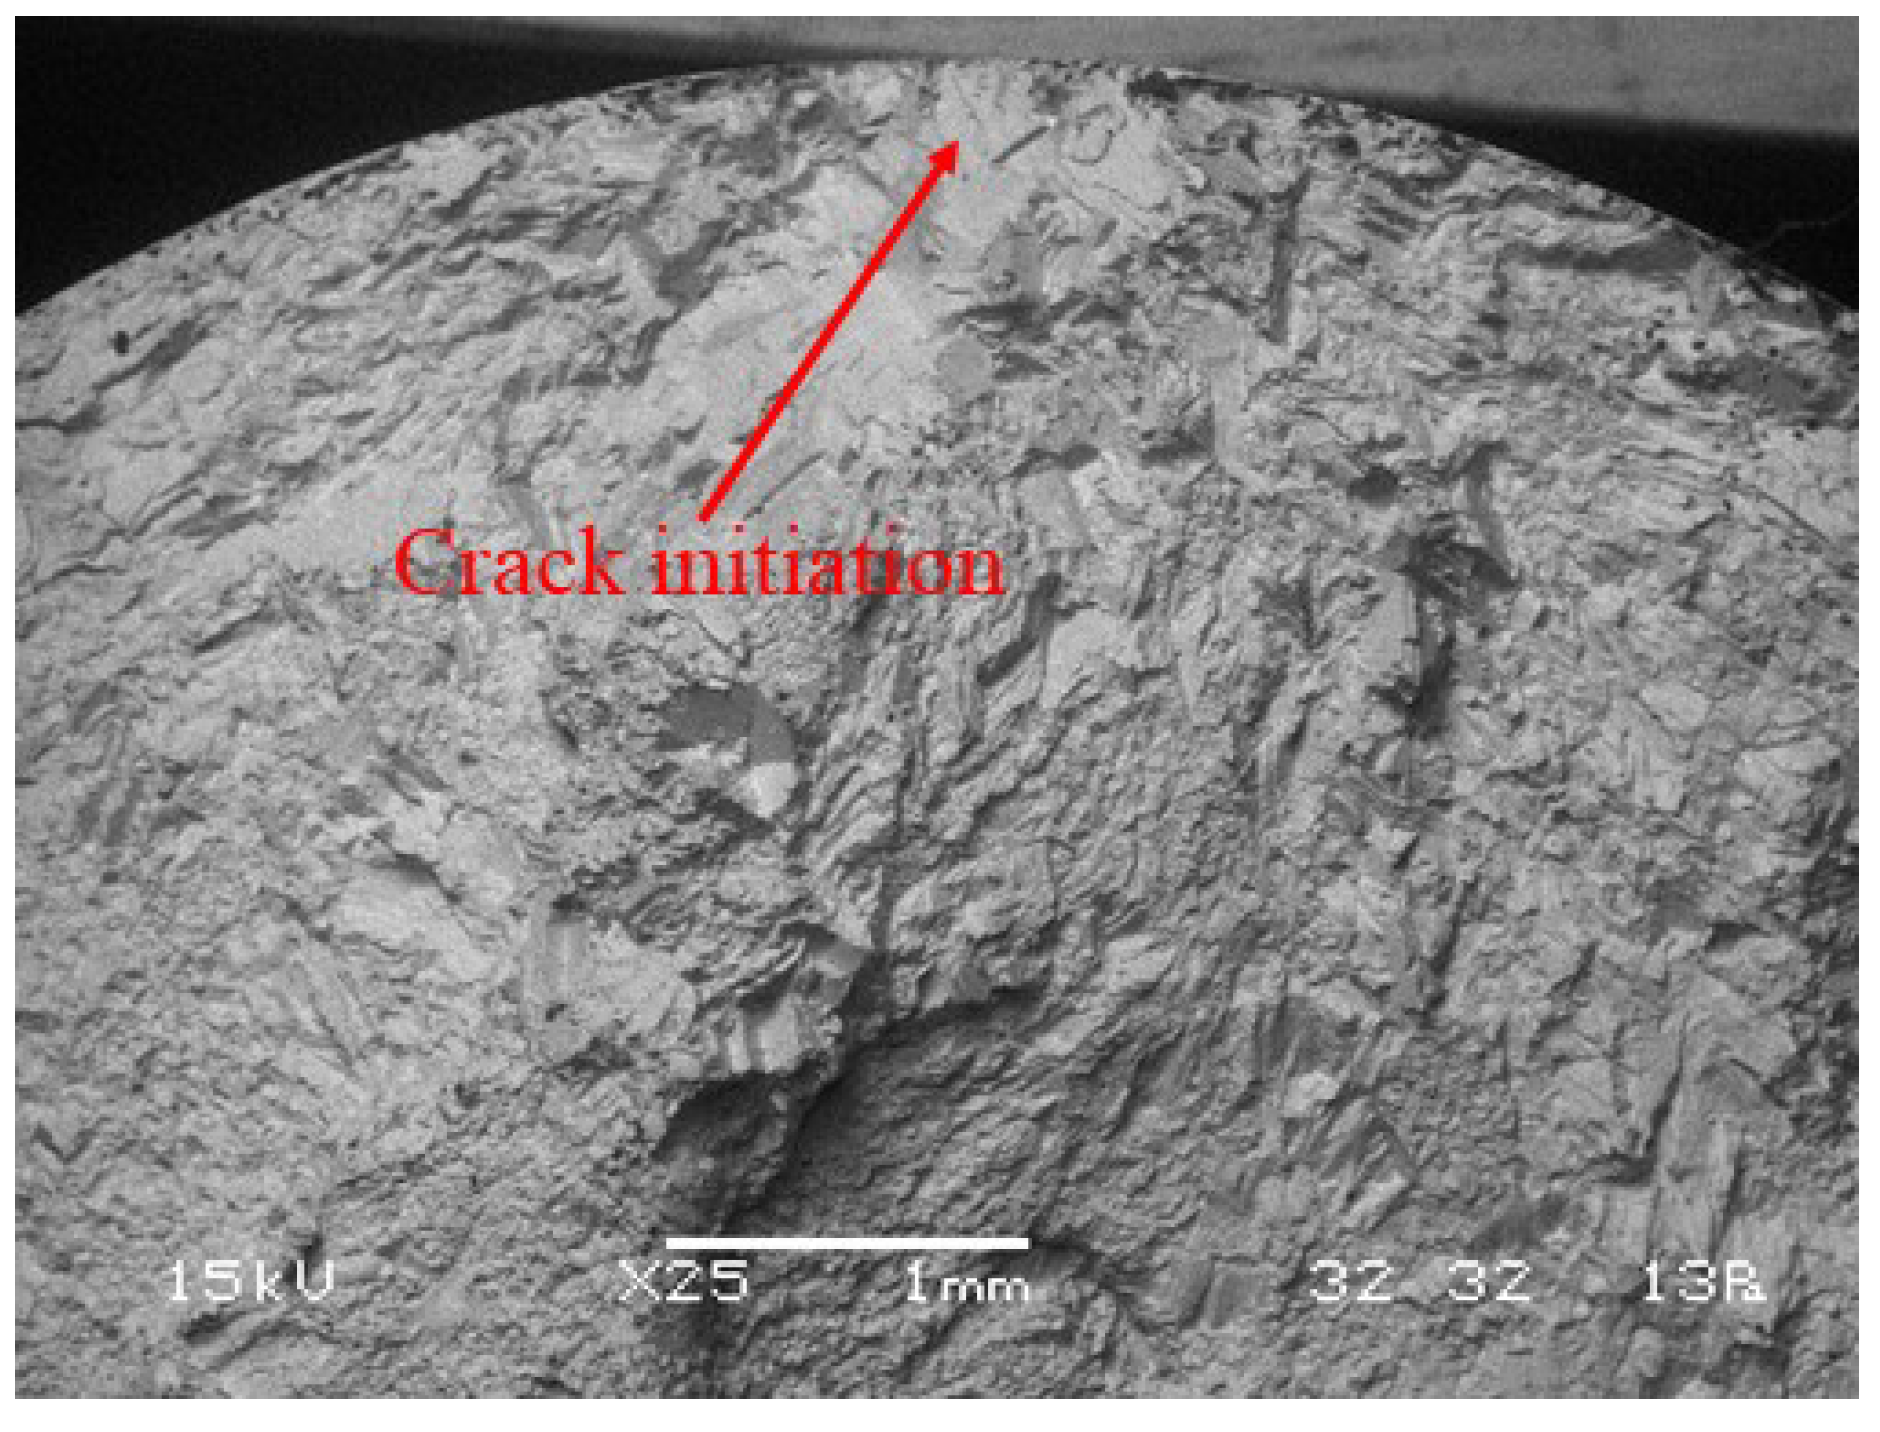
Figure 13 shows the typical crack initiation site for a specimen extracted from Bar B, which was identified on the external surface of the specimens and was promoted by the presence of a very large grains. On the contrary, due to the finer microstructure of specimen extracted from Bar A it was not possible to identify a single crack initiation zone and, due to the presence of growth line in the external opaque zone, it can be concluded that multiple small crack initiation took place on the external surface of the specimen.

Figure 13.
Crack initiation site for a specimen extracted from Bar B.
5. Conclusions
In the present work, static and fatigue behavior of a wrought spinodally hardened Cu-15Ni-8Sn cast alloy was investigated by experiments executed on specimens extracted from two different bars, which were supposed to be in the range of the capability of the production process. If, on one hand, relatively small differences were observed in the static properties, on the other hand a significantly different fatigue behavior and a different morphological aspect of the failure surfaces were found.
The microstructural analysis allowed to explain the differences observed in the fatigue behavior, showing that the bars were characterized by different microstructures, with significantly different grain sizes and grain size distributions. In particular, in specimens extracted from Bar B, the presence of strong inhomogeneous grain size, randomly distributed over the the bar volume, was observed.
The different microstructures had a lower influence on the static properties obtained by standard tensile tests due to the different mechanism of failure of metals under static and cyclic loads. The yield and ultimate stress, as well as the engineering fracture strain, were similar to those of an alloy steel, while the elastic modulus was smaller than the one of steel and about 145 MPa.
The presented work confirmed that the Cu-15Ni-8Sn cast alloy has very interesting mechanical properties but, at the same time, confirmed a high sensitivity of the fatigue behavior on the microstructure.
Author Contributions
The contribution to the paper is equally split among all the authors.
Funding
This research received no public funding.
Conflicts of Interest
The authors declare no conflict of interest.
References
- Findik, F. Improvements in spinodal alloys from past to present. Mater. Des. 2012, 42, 131–146. [Google Scholar] [CrossRef]
- Lefevre, B.; D’annessa, A.; Kalish, D. Age hardening in Cu-15Ni-8Sn alloy. Metall. Trans. A 1978, 9, 577–586. [Google Scholar] [CrossRef]
- Cribb, W.; Grensing, F. Spinodal copper alloy C72900-new high strength antifriction alloy system. Can. Metall. Q. 2011, 50, 232–239. [Google Scholar] [CrossRef]
- Cribb, W.R.; Gedeon, M.J.; Grensing, F.C. Performance Advances in Copper-Nickel-Tin Spinodal Alloys. Adv. Mater. Process. 2013, 171, 20–25. [Google Scholar]
- Cribb, W.R.; Ratka, J.O. Copper spinodal alloys. Adv. Mater. Process. 2002, 160, 27–30. [Google Scholar]
- Krus, D.; Juba, D. Bearing up under 300 tons. Mach. Des. 2005, 5, 82–90. [Google Scholar]
- Krus, D.; Geertson, S.; Metzger, S. ToughMet Load Roller Bushings Extend Maintenance Cycles on a Large Electric Shovel. Eng. Min. J. 2007, 208, 40–42. [Google Scholar]
- Krus, D.; Cribb, W.R. ToughMet Alloy: Improving Thrust Bearing Performance Through Enhanced Material Properties; Technical Report; SAE Technical Paper; SAE: Troy, MI, USA, 2004. [Google Scholar]
- Zhang, S.Z.; Jiang, B.H.; Ding, W.J. Wear of Cu–15Ni–8Sn spinodal alloy. Wear 2008, 264, 199–203. [Google Scholar] [CrossRef]
- Zhang, S.; Jiang, B.; Ding, W. Dry sliding wear of Cu–15Ni–8Sn alloy. Tribol. Int. 2010, 43, 64–68. [Google Scholar] [CrossRef]
- Caris, J.; Varadarajan, R.; Stephens, J.J.; Lewandowski, J.J. Microstructural effects on tension and fatigue behavior of Cu–15Ni–8Sn sheet. Mater. Sci. Eng. A 2008, 491, 137–146. [Google Scholar] [CrossRef]
- Caris, J.; Li, D.; Stephens, J.J.; Lewandowski, J.J. Microstructural effects on tension behavior of Cu–15Ni–8Sn sheet. Mater. Sci. Eng. A 2010, 527, 769–781. [Google Scholar] [CrossRef]
- Zhao, C.; Zhang, W.; Wang, Z.; Li, D.; Luo, Z.; Yang, C.; Zhang, D. Improving the Mechanical Properties of Cu-15Ni-8Sn Alloys by Addition of Titanium. Materials 2017, 10, 1038. [Google Scholar] [CrossRef] [PubMed]
- ASTM International. Standard Test Methods for Determining Average Grain Size; ASTM E-112; ASTM International: West Conshohocken, PA, USA, 2010. [Google Scholar]


© 2018 by the authors. Licensee MDPI, Basel, Switzerland. This article is an open access article distributed under the terms and conditions of the Creative Commons Attribution (CC BY) license (http://creativecommons.org/licenses/by/4.0/).