Abstract
In the present work, the magnetization of Ni50Mn17.5Ga25Cu7.5 alloy undergoing the first-order phase transition from paramagnetic austenite to ferromagnetic martensite was measured to evaluate the magnetic-field-induced entropy change (MFIEC) and refrigerant capacity (RC) of the alloy. A standard method (SM) of evaluation of MFIEC is based on thermodynamic Maxwell relation. In view of the criticism of SM expressed by some scientists, the alternative method (AM), which is based on thermodynamic relationships for free energy, was proposed recently for the determination of MFIEC. We developed this method and computed MFIEC in two ways—by AM and SM. The values of MFIEC obtained for Ni50Mn17.5Ga25Cu7.5 alloy by these methods appeared to be large but very different from each other. Moreover, AM reveals the possibility of both normal and inverse magnetocaloric effects in the adjoining temperature ranges, while SM results only in the normal magnetocaloric effect.
1. Introduction
The normal/inverse magnetocaloric effect (MCE) is the decrease/increase of the temperature of a solid in the presence of a decreasing or increasing magnetic field. The solid cooled under a variable magnetic field can absorb the heat from the environment, so magnetic materials exhibiting large MCEs can be used for the design of magnetic refrigerators. Magnetic shape memory alloys (SMAs) are among materials considered to be promising for application in magnetic refrigeration technology, and have, accordingly, been studied in detail [1,2].
To describe the heat transfer between a solid exhibiting MCE and the environment, the isothermal entropy change induced by the external magnetic field increasing from to is evaluated, usually from the equation
where is the magnetization value in the magnetic material [3]. Equation (1) is a consequence of thermodynamic Maxwell relations; it shows that a large entropy change and most pronounced MCE should be expected in the temperature range corresponding to the abrupt change of magnetization value. This feature of magnetization behavior has attracted the attention of researchers to martensitic transformations (MTs) from ferromagnetic austenite to paramagnetic martensite, observed in the metamagnetic SMAs [1,2]. However, the abrupt change in magnetization also appears in the temperature range of first-order phase transformation of SMA, from paramagnetic austenite to ferromagnetic martensite [4,5,6]. Therefore, a theoretical estimation of the magnetic-field-induced entropy change for SMA undergoing such phase transformation may be a guide for experiments aimed at the improvement of magnetic refrigeration technology. However, sound arguments against the applicability of thermodynamic Maxwell relations to ferromagnetic solids undergoing first-order phase transitions were presented (see Refs. [1,7,8] and references therein). It was argued, firstly, that these relations were obtained for the equilibrium thermodynamic phase, and therefore, that they are not applicable to the mixed two-phase thermodynamic state arising in the temperature range of first-order phase transitions. It was found, secondly, that the MCE value strongly depends on the shift of phase transition temperature under magnetic field [9]. This feature of MCE obviously cannot follow from the equation obtained for the equilibrium thermodynamic phase. In this connection, other ways of evaluating MCE deserve careful attention.
In the present study, we analyze the possibility of evaluating MCE from the fundamental thermodynamic relationship
which relates entropy function S to the temperature derivative of Helmholtz free energy F. The expression for free energy is a starting point of the Landau-type theories of magnetic, structural, and magnetostructural phase transitions. Due to this, Equation (2) was used recently for the evaluation of the magnetic-field-induced entropy change and heat capacity of metamagnetic SMA [10,11]. The free energy depends on temperature through the temperature-dependent magnetization value. Therefore, for the detailed theoretical analysis of MCE we used the experimental temperature dependences of magnetization of a Ni50Mn17.5Ga25Cu7.5 alloy, which undergoes the phase transformation from paramagnetic austenite to ferromagnetic martensite. These dependences enabled the estimation of the MCE value not only from Equation (2), but from the Equation (1) as well. The function obtained using Equation (2) appeared to be qualitatively and quantitatively different from that computed from Equation (1). In this respect, the theory of the first-order magnetic phase transition presented in Ref. [12] should be mentioned. Comparing the predictions of the theory with the results obtained using the Maxwell relations, the author of this work concluded that these relations are applicable to the evaluation of the field-induced entropy change in the temperature range of the first-order magnetic phase transition with narrow temperature hysteresis, but that the phase transitions in multiferroic systems need special consideration. The SMAs belong to such systems.
2. Experimental
A polycrystalline alloy with nominal composition Ni50Mn17.5Ga25Cu7.5 was prepared from high-purity elements by arc melting under Ar atmosphere. The ingots were homogenized in vacuum quartz ampoules at 1170 K for 24 h and quenched in water at room temperature. The actual composition of the homogenized alloy was determined by energy-dispersive X-ray spectroscopy (EDS, Bruker X-flash detector 4010, EDS, Bruker X-flash detector 4010, Bruker, Germany) in a scanning electron microscope (Hitachi S-3400 N, Hitachi S-3400 N, Hitachi, Japan), and shown to be Ni49.3Mn17.8Ga25.2Cu7.7. The temperature dependences of magnetization of this alloy measured for different values of external magnetic field are shown in Figure 1.
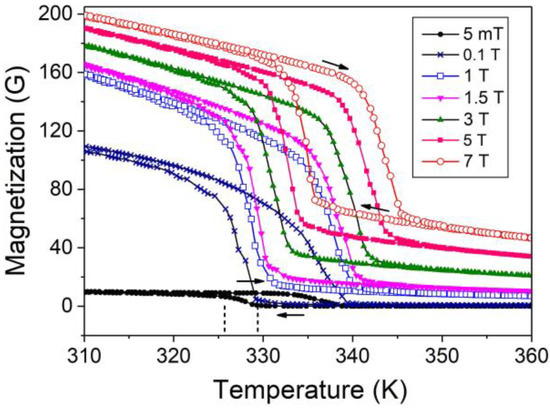
Figure 1.
Temperature dependences of magnetization of Ni50Mn17.5Ga25Cu7.5 alloy measured for different values of external magnetic field. Vertical dashed lines point to the martensite start and martensite finish temperatures used for theoretical modeling of experimental dependences.
3. Evaluation of Magnetocaloric Effect of PM Austenite–FM Martensite Transformation within the Framework of Simplified Theoretical Model
3.1. Model Formulation
Experimentally-measured magnetization of SMA, , corresponds to magnetization of the austenitic phase at and the martensitic phase at . In the temperature range , the experimentally-measured magnetization is the average value of magnetizations of coexisting microscopic domains of the austenitic and martensitic phases. To simplify the theoretical description of MCE, the average value of the magnetic exchange parameter is used below. This value is expressed through the magnetic exchange parameters of austenitic, , and martensitic, , phases, and the volume fraction of martensite, , which is equal to zero in the austenitic phase and to one in the martensitic phase. The free energy density of SMA is expressed as
where
The parameters and are not equal, because the PM austenite–FM martensite transformation is accompanied by the volume change of ferromagnetic SMA (FSMA) and the intensity of spin-exchange process drastically depends on the distances between the magnetic atoms. The magnetic exchange parameters are interrelated as
where is the relative volume change during MT, is the magnetoelastic constant describing the volume magnetostriction, and is the sum of magnetic moments of atoms contained in the unit volume of SMA [13]. The volume fraction of martensite can be modeled by the function
where is the temperature range of MT, . The function tends to zero in the high-temperature limit and is close to one if . This function qualitatively represents the experimental temperature dependence of the volume fraction of martensite measured for Ni2MnGa alloy with a MT temperature of about 210 K [14]. Therefore, Equations (3) and (4) describe the free energy of SMA at any temperature achievable in the experiments.
The ferromagnetic ordering of austenitic phase appears when changes its sign, that is, at Curie temperature, . Thus, the equation is accepted in the Landau theory of phase transitions. To describe the first-order magnetic phase transition, the terms proportional to and must be included in the expression for the free energy [12]. In Ni-Mn-Ga-based alloys, the second-order PM−FM phase transitions are observed, so such terms can be omitted in Equation (3). The first-order character of the PM austenite−FM martensite phase transition is caused by the jump-like change of lattice parameters.
Equations (3), (4) and (6) illustrate a very important feature of the PM austenite–FM martensite transformation: the average value of magnetic exchange energy depends on the magnetic field not only through the magnetization value, but also through the volume fraction of martensite, which is involved in Equation (4) for the average value of exchange parameter. It should be emphasized, moreover, that the dependence of the exchange parameter on the magnetic field vanishes in the limiting case , because in this case and .
The magnetic-field-induced entropy change is expressed through the free energy as
(One ought not to confuse the field-induced entropy change with the entropy change accompanying martensitic transformation.) According to Equation (3), the expression for the entropy change Equation (7) includes the terms, which are proportional to and . It may be expected that these summands give the main contribution to the field-induced entropy change in the temperature range of the phase transition, due to the abrupt change of magnetization value (see Figure 1).
3.2. Application of Simplified Model to Ni50Mn17.5Ga25Cu7.5 Alloy
The magnetic-field-induced entropy change computed from Equations (2)–(7) using the experimental values measured in the fields and (see Figure 1) is presented by a dashed line in Figure 2. The wavy shape of this line is an artefact caused by the interpolation of experimental points performed by the software. The physical parameters used for computation are given in the Appendix A, and the mode of evaluation of these parameters is explained there. The meaning of the solid line is explained in Section 4.2.
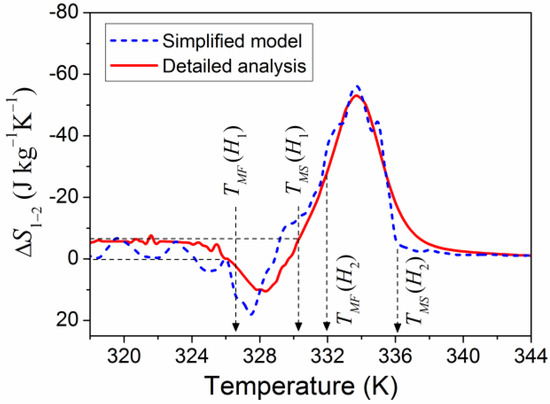
Figure 2.
MCE computed in the frame of simplified model and detailed theoretical analysis.
Figure 2 shows that the magnetic-field-induced entropy change can reach negative values of about −50 J kg−1K−1 due to the quick change of magnetization in the temperature range of MT in the magnetic field of 7 T, that is, between the temperatures and (see also Figure 1). The entropy change can be positive as well, due to the quick change of magnetization in the temperature range of MT in the magnetic field of 1 T, that is, between the temperatures and . The point is that the temperature ranges of MT in the fields H1 and H2 do not overlap (), so the positive term S(T,H2) in Equation (7) is not overcompensated by the negative term −S(T, H1) in the temperature interval . The inverse MCE arises due to the shift of phase transition temperature under the magnetic field. This effect will be analyzed below in the course of a detailed theoretical analysis of the field-induced entropy change.
Two important remarks are appropriate here:
(i) The high magnitude of the entropy change −30 J kg−1K−1 caused by the field change was reported for the La-Fe-Si compound, which exhibited magnetization behavior similar to that shown in Figure 2 [15].
(ii) An almost linear dependence of maximal value of the entropy change on the magnetic field has been reported (see Ref. [12] and references therein). Therefore, the high absolute value of negative entropy change, , which corresponds to strong “conventional” MCE, can be predicted for the moderate field change . It makes the alloys exhibiting a PM austenite–FM martensite phase transition promising for applications in magnetic refrigeration. The negative values of the entropy change are interesting because they point to possibility of inverse MCE. This possibility arises from the shift of MT temperature under a magnetic field, and does not follow from Equation (1) because the temperature derivative of magnetization is negative at all temperature and field values.
4. Detailed Theoretical Analysis of the Field-Induced Entropy Change
4.1. Theoretical Basis
For a detailed thermodynamic analysis of MCE observed during MT, one must take into account the fact that MT is a first-order phase transition, which goes through the mixed austenitic-martensitic state, and calculate the field-induced entropy change from the free energies and of austenitic and martensitic phases, respectively. For this purpose, the theoretical magnetization functions and must be derived from certain physical considerations, and substituted into the expressions
The free energy of the alloy,
must be used then for the calculation of entropy change.
The function , which models the volume fraction of martensite, depends on the martensite start and martensite finish temperatures. The experiments show that these temperatures almost linearly depend on the magnetic field, that is
where are constants.
In contrast to the equations of the simplified model, the values of magnetization and exchange parameter of the mixture of austenitic and martensitic domains are not involved in Equations (8) and (9) for the free energy of the alloy. Instead, the free energy is expressed through the individual characteristics of mixed phases , , and . This is an appreciable difference between the simplified model and the theory in question. Therefore, the equations describing the magnetization functions and of the austenitic and martensitic phases must be used for the evaluation of the field-induced entropy change. As shown in Refs. [13,16], a quantitative agreement between the theoretical and experimental temperature dependences of magnetization in the saturating magnetic field could be achieved starting from the conception of the local Curie temperatures attributed to small spatial domains of FSMA. (The integer enumerates the spatial domains.) The difference between the local temperatures is assumed to be caused by the difference in the values of magnetic exchange parameters inherent to different domains. It was found empirically that the temperature dependences of magnetization measured in strong magnetic fields (~2–10 T) can be described by the introduction of field-dependent parameters
involved into the equations for magnetization value in the nth spatial domain being in the austenitic or martensitic state, respectively. According to the fundamentals of phase transitions theory, these parameters are not the phase transition temperatures from the paramagnetic to ferromagnetic phase, but they satisfactorily describe the temperature dependences of heat capacity and entropy change if the constant parameter is adjusted properly by fitting the theoretical magnetization values to experimental ones [10,11]. The magnetization values in the nth spatial domain of alloy, which undergoes phase transformation, are expressed by the standard equation
with for austenitic phase, or for martensitic phase. The small spatial domains of alloy contribute to the magnetization values involved in Equation (9) for the free energy with different statistical weights . The difference in statistical weights is caused by the difference in the volume fractions of spatial domains with different Curie temperatures. The computations performed previously for the Ni-Mn-Ga alloys showed that the theoretical temperature dependence of magnetization could be fitted to experimental one using the Gauss-like distributions of statistical weights
where , for austenitic phase, , for martensitic phase, and are constant parameters of Gauss-like distributions inherent to austenitic and martensitic phases, respectively. The magnetization values involved in the equation for the free energy are
The terms depending on the “ordinary” magnetic susceptibility of the austenitic and martensitic phases, , are included into Equation (14). These terms are not of principal importance, but they increase the accuracy of fitting theoretical magnetization curves to experimental ones.
Equations (3)–(13) enable the study of MCE caused by martensitic transformations of FSMAs with different MT temperatures and Curie points. Formally, the magnetostructural phase transformation from paramagnetic austenite to ferromagnetic martensite corresponds to the Curie point of martensite situated above MT temperature.
4.2. MCE in Ni50Mn17.5Ga25Cu7.5 Alloy
The experimental temperature dependences of magnetization depicted in Figure 3 show that the Curie point of Ni50Mn17.5Ga25Cu7.5 alloy is situated not far from the MT temperature range.
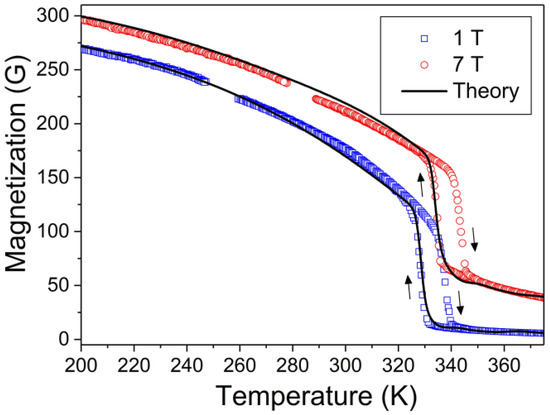
Figure 3.
Theoretical temperature dependences of magnetization of Ni50Mn17.5Ga25Cu7.5 alloy (lines) fitted to experimental ones (symbols) for the field of 1 T and 7 T values.
To comprehend the result obtained within the framework of the simplified model of MCE and compare it with the findings of detailed theoretical analysis, let us first consider the theoretical magnetization curves fitted to experimental values. The theoretical magnetization curves were computed using the formula
Figure 3 shows a good fit of theoretical curves computed for and with experimental ones. The values of physical parameters which provide this fit are shown in the Appendix A with the appropriate explanations and references. These values give the functions and , which enable the computation of the free energies of two phases (Equation (8)) and the free energy of alloy undergoing the MT through the mixed austenitic-martensitic state (Equation (9)). It should be stressed that is not used for the computation of free energy and entropy change; it is needed only for the determination of physical values involved in Equations (12)–(14). However, the values are plotted in Figure 3 as the functions of temperature to illustrate the accuracy of theoretical description of MCE presented below.
Figure 4a shows the values of magnetic entropy and field-induced entropy change computed from Equations (7)–(9) for two field values, , , and different temperatures. The computations were carried out using the theoretical temperature dependences of magnetization, , , expressed by Equation (14). The entropy change shown in Figure 4a is presented also in Figure 2 to illustrate the accuracy of simplified model of MCE.
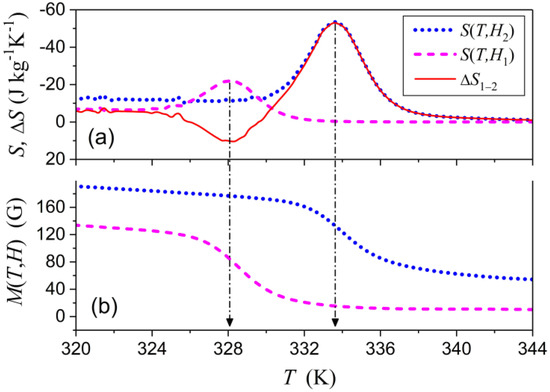
Figure 4.
(a) Theoretical entropy functions computed for two values of magnetic field and the difference of these functions. (b) The fragments of theoretical magnetization curves shown in Figure 3.
The behavior of magnetic entropy functions is in agreement with fundamental principles of thermodynamics, namely:
(i) The value is equal to zero, because in general an entropy function is unique up to a constant, and therefore, one can put (in agreement with the third law of thermodynamics).
(ii) The magnetic entropy functions are negative, because the magnetic free energy is negative in ferromagnetic phase (as far as it is lower than the energy of paramagnetic phase), its absolute value decreases with temperature, and therefore, the value is positive.
(iii) The absolute values of and functions are maximal at the temperatures which are close to the points of fastest change of magnetization values (see Figure 4b), that is, of the fastest change of the rate of magnetic disorder on heating. The peaks of the entropy functions are shifted with respect to the points of fastest decrease of magnetization values because these functions are proportional to the product , and the maximum of this product is shifted toward the large magnetization values, that is, low temperatures.
The possibility of the change of sign of function shown in Figure 2 and Figure 4a is an unforeseen prediction of the theory, which points to possibility of both conventional and inverse MCE in different temperature ranges, while the function is monotone in this temperature range. (The observation of “neighboring” conventional and inverse magnetocaloric effects in metamagnetic SMAs is caused by the nonmonotonic change of below the Curie temperature [17,18,19].) This result follows from two features of Ni50Mn17.5Ga25Cu7.5 alloy: first, the noticeable field-induced shift of MT temperature (~5 K), and second, abrupt change of large magnetization value during MT. These features result in the positive contribution to the field-induced entropy change, which is not overcompensated by the negative term . In this connection, one more peculiarity of experimental dependences and should be noted: the change of during MT is smaller than the change of , because of the huge contribution of the magnetic field to magnetization value measured above MT temperature (see Figure 3). This peculiarity may be explained by the field-induced shift of MT temperature in the case of the “paramagnetic Curie temperature” of austenite, which is involved in the Curie−Weiss low, and is lower but close enough to MT temperature. In this case, the magnetic field of 7 T approaches the MT temperature to the maximum point of magnetic susceptibility of austenite and therefore induces large magnetization value.
The magnetic-field-induced entropy change resulting from Equations (8)–(14) is shown in Figure 4a and represented by solid line in Figure 2 to illustrate the quantitative agreement between the predictions of the simplified model and detailed analysis of MCE. In this relation, it should be emphasized that both the simplified model and detailed analysis are based only on three principal points, namely, (i) the experimentally-observed shift of MT temperature under a magnetic field, (ii) the relationship between the entropy and free energy (Equation (2)), and (iii) the expression for the magnetic free energy of a ferromagnetic solid (Equations (3) and (8)). It should be emphasized that the Equation (2) is one of fundamental relationships of thermodynamics; the Equations (3) and (8) are derived from the quantum mechanical Heisenberg expression for the Hamiltonian describing the spin-exchange interaction and from the fundamental electrodynamic equation for the energy of magnetic moment in an external magnetic field. Therefore, the predicted possibility of the observation of conventional and inverse MCE in two neighboring temperature intervals is well-grounded, and may be considered as a guide for experiments. One of the obstacles to the observation of inverse MCE may be related to the narrow (~2–5 K) temperature interval of negative entropy change (see Figure 2). However, this difficulty is surmountable: conventional and inverse MCE were observed in Ni50Mn35In15 in the narrow temperature interval ~10K [17,18,19].
4.3. MCE in the Ni50Mn18Ga25Cu7 Ribbon
The detailed experimental study of the transformational behavior and magnetic properties of a Ni50Mn18Ga25Cu7 ribbon was carried out in Ref. [5] and the maximum value was reported. Experimental data presented in this work enable an additional verification of the theory developed above. The magnetization values determined in Ref. [5] for provide the physical parameters needed for the detailed theoretical description of MCE (see Appendix A). These parameters result in a good fit of the theoretical magnetization curve to experimental values obtained in the field , and enable the computation of temperature dependences of magnetization for the other field values, in particular, . Figure 5 shows the entropy functions, , , and field-induced entropy change computed using the magnetization curves shown in the Inset. The entropy functions noticeably depend on temperatures in the range shown in Figure 5, but become almost constant in the low-temperature range (below 200 K), where the magnetization value is close to its low-temperature limit .
Figure 5.
Entropy functions computed for the field values of 5 T (dashed line) and 1 T (dash-doted line). Solid line depicts the difference of these functions, that is the magnetic-field-induced entropy change. Inset: Experimental values of magnetization of Ni50Mn18Ga25Cu7 ribbon in the magnetic field of 5 T (symbols, extracted from Ref. [5]) and theoretical curves computed for the field values of 5 T and 1 T (solid and dashed lines, respectively).
It should be stressed, first, that the maximal entropy change resulting from computations (19.8 J kg−1K−1, see Figure 5) is close to the experimental value 17.8 J kg−1K−1 reported in Ref. [5]. (This fact may be considered as verification of the results obtained from the thermodynamic relationship for the free energy, Equation (2)). Secondly, it is important that the computations performed for Ni50Mn18Ga25Cu7 ribbon do not point to the possibility of inverse MCE because of the smooth variation of function, and, correspondingly, feebly-marked minimum of the entropy.
5. Comparison of Obtained MCE Values with Evaluation Resulting from Maxwell Relations
The good fit of theoretical and curves to experimental magnetization values obtained for Ni50Mn17.5Ga25Cu7.5 alloy encourage the use of theoretical magnetization values, , for evaluation of magnetocaloric effect from Equation (1), which results from Maxwell relations. These functions have been computed from Equations (12)–(15) for the discrete temperature values , with the step and substituted into Equation (1). In such a way, the discrete values of the field-induced entropy change have been computed from this equation by the integration of theoretical functions from to with the integration step of 0.01 T. These values are shown in Figure 6 by the open circles; the connecting line serves merely as a guide for eye. The increase of the integration step by factor 10 did not noticeably change the result of integration. The function obtained above from Equations (2) and (7) is represented in Figure 6 for reference, and thus, the drastic difference between the MCE values obtained from these equations, on one hand, and Equation (1), on the other hand, is illustrated.
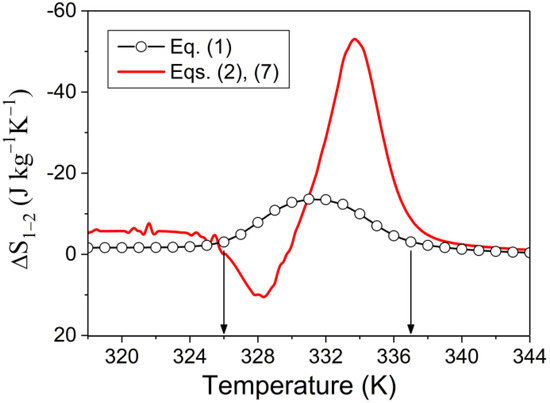
Figure 6.
Entropy changes computed from Equation (1) and Equations (2) and (7). The vertical arrows point to the temperatures used for estimation of refrigerant capacity (see Equation (16)).
6. Refrigerant Capacity
The practically important parameter of MCE is the refrigerant capacity (RC), which is most commonly defined as
where the temperatures and correspond to the half-maximum values of function [20]. However, for the comparison of two ways of estimating MCE, it is more instructive to have these temperatures equal to the and , because these temperatures bound the temperature interval of large absolute values of entropy changes computed in two different ways, that is, from the Maxwell relationship and from the free energy (as shown in Figure 6 by the vertical arrows). In this case, the refrigerant capacity calculated from the curve estimated from Maxwell relations is , while the simplified model and detailed analysis give . Thus, the relative difference in RC values is much smaller than the relative difference of maximum values of functions shown in Figure 6, because in our theory, the positive contribution to refrigerant capacity partially compensates for the negative one.
7. Discussion and Conclusion
The disagreement between the results obtained from Equations (1) and (2) is not completely clear from a physical point of view. To become aware of the formal reasons for the difference, let us recall that the results of the simplified model, which uses free energy with average values of magnetization and magnetic exchange parameter, appeared to be in agreement with the findings of the detailed analysis, which uses the free energies and magnetization values of two phases. Therefore, the difference between the and curves, shown in Figure 6, arises not from the averaging of physical values over the domains of two phases; rather, it arises, firstly, because the integration in finite terms, , , predetermined by Equation (1), smooths over the influence of two functions, and , on the entropy change and, due to this, smooths away two separate peaks of function. Secondly, the difference between the two approaches to MCE description is caused by the fact that the derivative of magnetization value is strongly different from the derivative of free energy, because the latter is proportional to the squired magnetization value and involves the temperature-dependent magnetic exchange parameter, which is absent in Equation (1).
One more fact should be emphasized: the field-induced entropy change can be calculated from Equation (1) following two different procedures: first, using experimental magnetic isofields (as it was done above), and second, using the experimental magnetic isotherms. Both procedures were realized in Ref. [7] for Gd5Ge2Si2, which exhibited a first-order phase transition from the high-temperature paramagnetic phase to the low-temperature ferromagnetic one, and the resultant functions were plotted. The shapes of the peaks and maximum values appeared to be noticeably different when calculated from experimental data and curves.
It can be concluded that:
(i) alloys exhibiting the first-order phase transitions from the paramagnetic austenitic phase to ferromagnetic martensitic phase are promising for application in magnetic refrigeration technology;
(ii) the results of our computations support other scientists’ doubts about the applicability of Maxwell relations to the first-order phase transitions;
(iii) not only the field-induced change of magnetization value, but also the “spontaneous” magnetization value have influences on the MCE: the larger the magnetization value, the more pronounced the MCE, because the magnetic entropy function is proportional to the product .
Author Contributions
P.L. and C.S. performed the experiments and arranged the experimental data, A.K. performed the theoretical computations, V.A.L. and E.C. analyzed the results and wrote the paper.
Funding
This research was funded by AEI/FEDER, UE (projects MAT2014-56116-C04-01-R and MAT2012-37923-C02-01), NASU (project 0117U000433), MESU (project 0117U004340) and SFFR (President’s of Ukraine grant F75/156-2018).
Conflicts of Interest
The authors declare no conflict of interest.
Appendix A. Physical Parameters Used for Computations
The magnitude of magnetocaloric effect is predetermined by the physical values involved in (i) magnetization function ; (ii) volume fraction of martensite ; (iii) magnetic exchange parameters and .
(i) The function depends on few physical parameters. We determined the MT start and MT finish temperature from the experimental curve measured at . The theoretical isofields were fitted to experimental ones obtained for Ni50Mn17.5Ga25Cu7.5 bulk specimen and Ni50Mn18Ga25Cu7 ribbon (see Figure 3 and Inset in Figure 5) using the sets of parameters shown in the Table A1. These parameters provide correct slope of the abrupt fragments of isofield curves fitted to experimental values. We cannot state that the only these sets provide a satisfactory fit, but it is not crucially important for our study of MCE because all parameters resulting in the similar magnetization curves also result in the similar values of the entropy change.

Table A1.
Parameters used for computations.
Table A1.
Parameters used for computations.
| Alloy | TC (K) | M(0,0) (G) | TMS (K) | TMF (K) | dTMS,MF/d(μ0H) (K/T) | TGA (K) | TGM (K) | ΔT (K/T2/3) | χ (G/T) |
|---|---|---|---|---|---|---|---|---|---|
| Ni50Mn17.5Ga25Cu7.5, Bulk | 323 | 292 | 329.4 | 325.7 | 0.9 | 3 | 40 | 14 | 6 |
| Ni50Mn18Ga25Cu7, Ribbon | 294 ** | 400 | 313 * | 306 * | 2 *, 2.4 * | 9.4 | 23.5 | 46.4 | 8 |
* Experimental values reported in Ref. [5]; ** The linear dependence of Curie temperature on the content of copper x was reported in Ref. [5] for x varying from 0 to 6 atomic percent; the value shown for 7 atomic percent is the result of extrapolation of experimental line.
(ii) The volume fraction of martensite, Equation (6), depends only on the characteristic temperatures shown in the Table A1.
(iii) The exchange parameters were taken in the form postulated by the Landau theory of phase transitions and substantiated for Ni-Mn-Ga alloys in Refs. [13,16]:
where the parameter and combination of parameters were evaluated in Refs. [13,16] for the Ni-Mn-Ga alloy with Curie temperature of 375 K. The Curie temperatures of austenitic and martensitic phases are related to each other as
The value corresponds to the experimental Curie temperature.
References
- Khovaylo, V. Inconvenient magnetocaloric effect in ferromagnetic shape memory alloys. J. Alloys Comp. 2013, 577, S362–S366. [Google Scholar] [CrossRef]
- Franco, V.; Blázquez, J.S.; Ipus, J.J.; Law, J.Y.; Moreno-Ramírez, L.M.; Conde, A. Magnetocaloric effect: From materials research to refrigeration devices. Prog. Mat. Sci. 2018, 93, 112–232. [Google Scholar] [CrossRef]
- Pecharsky, V.K.; Gschneidner, K.A., Jr.; Pecharsky, A.O.; Tishin, A.M. Thermodynamics of the magnetocaloric effect. Phys. Rev. B 2001, 64, 144406. [Google Scholar] [CrossRef]
- Jiang, C.; Wang, J.; Li, P.; Jia, A.; Xu, H. Search for transformation from paramagnetic martensite to ferromagnetic austenite: NiMnGaCu alloys. Appl. Phys. Lett. 2009, 95, 012501. [Google Scholar] [CrossRef]
- Li, Z.; Zou, N.; Sánchez-Valdés, C.F.; Sánchez Llamazares, J.L.; Yang, B.; Hu, Y.; Zhang, Y.D.; Esling, C.; Zhao, X.; Zuo, L. Thermal and magnetic field-induced martensitic transformation in Ni50Mn25−xGa25Cux (0 ≤ x ≤ 7) melt-spun ribbons. J. Phys. D Appl. Phys. 2015, 49, 025002. [Google Scholar] [CrossRef]
- Devarajan, U.; Kannan, M.; Thiyagarajan, R.; Manivel Raja, M.; Rama Rao, N.V.; Singh, S.; Venkateshwarlu, D.; Ganesan, V.; Ohashi, M.; Arumugam, S. Coupled magnetostructural transition in Ni-Mn-V-Ga Heusler alloys and its effect on the magnetocaloric and transport properties. J. Phys. D: Appl. Phys. 2015, 49, 065001. [Google Scholar] [CrossRef]
- Carvalho, A.M.G.; Coelho, A.A.; Von Ranke, P.J.; Alves, C.S. The isothermal variation of the entropy (ΔST) may be miscalculated from magnetization isotherms in some cases: MnAs and Gd5Ge2Si2 compounds as examples. J. Alloys Comp. 2011, 509, 3452–3456. [Google Scholar] [CrossRef]
- Caron, L.; Ou, Z.Q.; Nguyen, T.T.; Thanh, D.C.; Tegus, O.; Brück, E. On the determination of the magnetic entropy change in materials with first-order transitions. J. Magn. Magn. Mater. 2009, 321, 3559–3566. [Google Scholar] [CrossRef]
- Gottschall, T.; Skokov, K.P.; Burriel, R.; Gutfleisch, O. On the S(T) diagram of magnetocaloric materials with first-order transition: Kinetic and cyclic effects of Heusler alloys. Acta Mater. 2016, 107, 1–8. [Google Scholar] [CrossRef]
- L’vov, V.A.; Kosogor, A.; Barandiaran, J.M.; Chernenko, V.A. Theoretical description of magnetocaloric effect in the shape memory alloy exhibiting metamagnetic behavior. J. Appl. Phys. 2016, 119, 013902. [Google Scholar] [CrossRef]
- Kosogor, A.; Barandiaran, J.M.; L’vov, V.A.; Fernandez, J.R.; Chernenko, V.A. Magnetic and nonmagnetic contributions to the heat capacity of metamagnetic shape memory alloy. J. Appl. Phys. 2017, 121, 183901. [Google Scholar] [CrossRef]
- Kataoka, M. Ferromagnetic system with the first order transition and applicability of the Maxwell relation to its magnetocaloric effect. J. Magn. Magn. Mater. 2019, 469, 494–503. [Google Scholar] [CrossRef]
- Chernenko, V.A.; L’vov, V.A.; Pasquale, M.; Besseghini, S.; Sasso, C.; Polenur, D.A. Magnetoelastic behavior of Ni-Mn-Ga martensitic alloys. Int. J. Appl. Electrom. Mech. 2000, 12, 3–8. [Google Scholar]
- Singh, S.; Bednarcik, J.; Barman, S.R.; Felser, C.; Pandey, D. Premartensite to martensite transition and its implications for the origin of modulation in Ni2MnGa ferromagnetic shape-memory alloy. Phys. Rev. B 2015, 92, 054112. [Google Scholar] [CrossRef]
- Fujita, A.; Fujieda, S.; Hasegawa, Y.; Fukamichi, K. Itinerant-electron metamagnetic transition and large magnetocaloric effects in La(FexSi1−x)13 compounds and their hydrides. Phys. Rev. B 2003, 67, 104416. [Google Scholar] [CrossRef]
- Chernenko, V.A.; L’vov, V.A.; Zagorodnyuk, S.P.; Takagi, T. Ferromagnetism of thermoelastic martensites: Theory and experiment. Phys. Rev. B 2003, 67, 064407. [Google Scholar] [CrossRef]
- Quetz, A.; Koshkid’ko, Y.S.; Titov, I.; Rodionov, I.; Pandey, S.; Aryal, A.; Ibarra-Gaytan, P.J.; Prudnikov, V.; Granovsky, A.; Dubenko, I.; et al. Giant reversible inverse magnetocaloric effects in Ni50Mn35In15 Heusler alloys. J. Alloys Comp. 2016, 683, 139–142. [Google Scholar] [CrossRef]
- Koshkid’ko, Y.; Pandey, S.; Quetz, A.; Aryal, A.; Dubenko, I.; Cwik, J.; Dilmieva, E.; Granovsky, A.; Lähderanta, E.; Zhukov, A.; et al. Inverse magnetocaloric effects in metamagnetic Ni-Mn-In-based alloys in high magnetic fields. J. Alloys Comp. 2017, 695, 3348–3352. [Google Scholar] [CrossRef]
- Wójcik, A.; Maziarz, W.; Szczerba, M.; Kowalczyk, M.; Cesari, E.; Dutkiewicz, J. Structure and inverse magnetocaloric effect in Ni-Co-Mn-Sn(Si) Heusler alloys. Intermetallics 2018, 100, 88–94. [Google Scholar] [CrossRef]
- Gschneidner, K.A., Jr.; Pecharsky, V.K.; Tsokol, A.O. Recent developments in magnetocaloric materials. Rep. Prog. Phys. 2005, 68, 1479–1539. [Google Scholar] [CrossRef]


© 2018 by the authors. Licensee MDPI, Basel, Switzerland. This article is an open access article distributed under the terms and conditions of the Creative Commons Attribution (CC BY) license (http://creativecommons.org/licenses/by/4.0/).