
A Robust Construction Safety Performance Evaluation Framework for Workers’ Compensation Insurance: A Proposed Alternative to EMR


 ,
,  , and
, and
Abstract
:1. Introduction
2. Literature Review
3. Research Goals and Methodology
3.1. Criteria Selection through a Comprehensive Literature Analysis
3.2. DEA Modeling for Safety Evaluation
4. Results and Discussion
4.1. Case Study of Insurance Company
4.2. Case Study of a Company’s Annual Safety Assessment
5. Limitations
6. Conclusions
Author Contributions
Funding
Institutional Review Board Statement
Informed Consent Statement
Data Availability Statement
Conflicts of Interest
References
- Hong, W.K.; Kim, G.; Lim, C.; Kim, S. Development of a steel-guide connection method for composite precast concrete components. J. Civ. Eng. Manag. 2017, 23, 59–66. [Google Scholar] [CrossRef]
- Nnaji, C.; Karakhan, A.A. Technologies for safety and health management in construction: Current use, implementation benefits and limitations, and adoption barriers. J. Build. Eng. 2020, 29, 101212. [Google Scholar] [CrossRef]
- Khalafallah, A.; Kartam, N.; Razeq, R.A. Bilevel Standards-Compliant Platform for Evaluating Building Contractor Safety. J. Constr. Eng. Manag. 2019, 145, 04019054. [Google Scholar] [CrossRef]
- Al-Saffar, O.T. Decision-Making Tool to Select Construction Contractors Based on Safety Performance. Master’s Thesis, Oregon State University, Corvallis, OR, USA, 2020. [Google Scholar]
- BLS Injuries, Illnesses, and Fatalities: Survey of Occupational Injuries and Illnesses Data. 2019. Available online: https://data.bls.gov/gqt/RequestData (accessed on 22 June 2021).
- Teo, E.A.L.; Ling, F.Y.Y. Developing a model to measure the effectiveness of safety management systems of construction sites. Build. Environ. 2006, 41, 1584–1592. [Google Scholar] [CrossRef]
- Ammad, S.; Alaloul, W.S.; Saad, S.; Qureshi, A.H. Personal protective equipment (PPE) usage in construction projects: A scientometric approach. J. Build. Eng. 2020, 35, 102086. [Google Scholar] [CrossRef]
- Bavafa, A.; Mahdiyar, A.; Marsono, A.K. Identifying and assessing the critical factors for effective implementation of safety programs in construction projects. Saf. Sci. 2018, 106, 47–56. [Google Scholar] [CrossRef]
- Trinh, M.T.; Feng, Y.; Jin, X. Conceptual Model for Developing Resilient Safety Culture in the Construction Environment. J. Constr. Eng. Manag. 2018, 144, 06018003. [Google Scholar] [CrossRef]
- Gao, R.; Chan, A.P.C.; Utama, W.P.; Zahoor, H. Workers’ Perceptions of Safety Climate in International Construction Projects: Effects of Nationality, Religious Belief, and Employment Mode. J. Constr. Eng. Manag. 2017, 143, 04016117. [Google Scholar] [CrossRef]
- Niu, M.; Leicht, R.M.; Rowlinson, S. Developing Safety Climate Indicators in a Construction Working Environment. Pract. Period. Struct. Des. Constr. 2017, 22, 04017019. [Google Scholar] [CrossRef]
- Schwatka, N.V.; Hecker, S.; Goldenhar, L.M. Defining and measuring safety climate: A review of the construction Industryliterature. Ann. Occup. Hyg. 2016, 60, 537–550. [Google Scholar] [CrossRef] [Green Version]
- Zhou, Z.; Goh, Y.M.; Li, Q. Overview and analysis of safety management studies in the construction industry. Saf. Sci. 2015, 72, 337–350. [Google Scholar] [CrossRef]
- Zhou, Q.; Fang, D.; Mohamed, S. Safety Climate Improvement: Case Study in a Chinese Construction Company. J. Constr. Eng. Manag. 2011, 137, 86–95. [Google Scholar] [CrossRef]
- Molenaar, K.R.; Park, J.-I.; Washington, S. Framework for Measuring Corporate Safety Culture and Its Impact on Construction Safety Performance. J. Constr. Eng. Manag. 2009, 135, 488–496. [Google Scholar] [CrossRef] [Green Version]
- Awolusi, I.G.; Marks, E.D. Safety Activity Analysis Framework to Evaluate Safety Performance in Construction. J. Constr. Eng. Manag. 2017, 143, 05016022. [Google Scholar] [CrossRef] [Green Version]
- Vinodkumar, M.N.; Bhasi, M. Safety management practices and safety behaviour: Assessing the mediating role of safety knowledge and motivation. Accid. Anal. Prev. 2010, 42, 2082–2093. [Google Scholar] [CrossRef]
- Choudhry, R.M.; Fang, D.; Lingard, H. Measuring Safety Climate of a Construction Company. J. Constr. Eng. Manag. 2009, 135, 890–899. [Google Scholar] [CrossRef]
- Haupt, T.C. A Study of Management Attitudes to a Performance Approach to Construction Worker Safety. J. Constr. Res. 2003, 4, 87–100. [Google Scholar] [CrossRef]
- Flin, R.; Mearns, K.; O’Connor, P.; Bryden, R. Measuring safety climate: Identifying the common features. Saf. Sci. 2000, 34, 177–192. [Google Scholar] [CrossRef]
- Zohar, D.; Luria, G. A multilevel model of safety climate: Cross-level relationships between organization and group-level climates. J. Appl. Psychol. 2005, 90, 616–628. [Google Scholar] [CrossRef]
- OSHA. Recommended Practices for Safety and Health Programs; Occupational Safety & Health Administration: Washington, DC, USA, 2021. Available online: https://www.osha.gov/safety-management (accessed on 7 May 2021).
- Hallowell, M.R. Safety-knowledge management in American construction organizations. J. Manag. Eng. 2012, 28, 203–211. [Google Scholar] [CrossRef]
- Choudhry, R.M.; Fang, D.; Ahmed, S.M. Safety management in construction: Best practices in Hong Kong. J. Prof. Issues Eng. Educ. Pract. 2008, 134, 20–32. [Google Scholar] [CrossRef]
- Mitropoulos, P.; Abdelhamid, T.S.; Howell, G.A. Systems Model of Construction Accident Causation. J. Constr. Eng. Manag. 2005, 131, 816–825. [Google Scholar] [CrossRef]
- Liu, K.H.; Tessler, J.; Murphy, L.A.; Chang, C.C.; Dennerlein, J.T. The Gap Between Tools and Best Practice: An Analysis of Safety Prequalification Surveys in the Construction Industry. New Solut. 2019, 28, 683–703. [Google Scholar] [CrossRef]
- Abudayyeh, O.; Fredericks, T.K.; Butt, S.E.; Shaar, A. An investigation of management’s commitment to construction safety. Int. J. Proj. Manag. 2006, 24, 167–174. [Google Scholar] [CrossRef]
- Choudhry, R.M.; Zahoor, H. Strengths and Weaknesses of Safety Practices to Improve Safety Performance in Construction Projects in Pakistan. J. Prof. Issues Eng. Educ. Pract. 2016, 142, 04016011. [Google Scholar] [CrossRef]
- Emerson, R.D.; Minchin, R.E.; Gruneberg, S. Workers’ Compensation in Construction: Workers’ Benefits under Alternative Dispute Resolution Systems. J. Leg. Aff. Disput. Resolut. Eng. Constr. 2013, 5, 113–121. [Google Scholar] [CrossRef]
- Azmi, M.A. Workers’ Compensation Modeling Using Multiple Regression; North Dakota State University of Agriculture and Applied Science: Fargo, ND, USA, 2018. [Google Scholar]
- El-Mashaleh, M.S.; Rababeh, S.M.; Hyari, K.H. Utilizing data envelopment analysis to benchmark safety performance of construction contractors. Int. J. Proj. Manag. 2010, 28, 61–67. [Google Scholar] [CrossRef]
- Imriyas, K.; Low, S.P.; Teo, A.L.; Chan, S.L. Premium-Rating Model for Workers’ Compensation Insurance in Construction. J. Constr. Eng. Manag. 2008, 134, 601–617. [Google Scholar] [CrossRef]
- Hoonakker, P.; Loushine, T.; Carayon, P.; Kallman, J.; Kapp, A.; Smith, M.J. The effect of safety initiatives on safety performance: A longitudinal study. Appl. Ergon. 2005, 36, 461–469. [Google Scholar] [CrossRef]
- Everett, J.G.; Thompson, W.S. Experience Modification Rating for Workers’ Compensation Insurance. J. Constr. Eng. Manag. 1995, 121, 66–79. [Google Scholar] [CrossRef]
- Hinze, B.J.; Piepho, N. Experience modification rating. Engineering 1995, 121, 455–458. [Google Scholar]
- Jazayeri, E.; Liu, H.; Dadi, G.B. Assessing and evaluating subcontractor management safety policies. Construction Research Congress 2018, New Orleans, LA, USA, 2—4 April 2018; pp. 251–261. [Google Scholar] [CrossRef]
- Karakhan, A.A.; Rajendran, S.; Gambatese, J.; Nnaji, C. Measuring and Evaluating Safety Maturity of Construction Contractors: Multicriteria Decision-Making Approach. J. Constr. Eng. Manag. 2018, 144, 04018054. [Google Scholar] [CrossRef]
- Liu, M.; Chong, H.Y.; Liao, P.C.; Xu, L. Incorporation of hazard rectification performance for safety assessment. Int. J. Occup. Saf. Ergon. 2021, 1–14. [Google Scholar] [CrossRef]
- Gunduz, M.; Talat Birgonul, M.; Ozdemir, M. Development of a safety performance index assessment tool by using a fuzzy structural equation model for construction sites. Autom. Constr. 2018, 85, 124–134. [Google Scholar] [CrossRef]
- Carvajal-Arango, D.; Vásquez-Hernández, A.; Botero-Botero, L.F. Assessment of subjective workplace well-being of construction workers: A bottom-up approach. J. Build. Eng. 2021, 36, 102154. [Google Scholar] [CrossRef]
- Farrell, M.J. The Measurement of Productive Efficiency. J. R. Stat. Soc. 1957, 120, 253–281. [Google Scholar] [CrossRef]
- Tatari, O.; Kucukvar, M. Eco-Efficiency of Construction Materials: Data Envelopment Analysis. J. Constr. Eng. Manag. 2012, 138, 733–741. [Google Scholar] [CrossRef]
- Sun, L.; Rong, J.; Yao, L. Measuring Transfer Efficiency of Urban Public Transportation Terminals by Data Envelopment Analysis. J. Urban Plan. Dev. 2010, 136, 314–319. [Google Scholar] [CrossRef]
- Grilo, A.; Jardim-Goncalves, R. Value proposition on interoperability of BIM and collaborative working environments. Autom. Constr. 2010, 19, 522–530. [Google Scholar] [CrossRef]
- Cooper, W.; Seiford, L.; Tone, K. Data Envelopment Analysis: A Comprehensive Text with Models, Applications, References and DEA-Solver Software, 2nd ed.; Kluwer Academic Publishers: Norwell, MA, USA, 2006. [Google Scholar]
- Charnes, A.; Cooper, W.W.; Rhodes, E. Measuring the efficiency of decision making units. Eur. J. Oper. Res. 1978, 2, 429–444. [Google Scholar] [CrossRef]
- Saghafi, S.; Ebrahimi, A.; Mehrdadi, N.; Nabi Bidhendy, G. Energy-Efficiency Index in Industrial Wastewater Treatment Plants Using Data-Envelopment Analysis. J. Environ. Eng. 2020, 146, 04019112. [Google Scholar] [CrossRef]
- El-Mashaleh, M.S.; Horta, I.M. Evaluating Contractors for Bonding: DEA Decision Making Model for Surety Underwriters. J. Manag. Eng. 2016, 32, 04015020. [Google Scholar] [CrossRef]
- Xin, S.; Xu, H.; Li, S.; Wang, W.; Guo, J.; Yang, W. Efficiency evaluation of a floor standing air conditioner with different installation positions and air supply parameters applied to a large laboratory. J. Build. Eng. 2020, 32, 101701. [Google Scholar] [CrossRef]
- El-Mashaleh, M.S.; Minchin, R.E. Concessionaire Selection Model Based on Data Envelopment Analysis. J. Manag. Eng. 2014, 30, 04014013. [Google Scholar] [CrossRef]
- Sowlati, T.; Paradi, J.C. Establishing the “practical frontier” in data envelopment analysis. Omega 2004, 32, 261–272. [Google Scholar] [CrossRef] [Green Version]
- Aldous, D.J. Descriptive Statistics; Magnum Publishing LLC: New York, NY, USA, 2016; ISBN 978-1682501054. [Google Scholar]

| Number | Criteria | Method of Measurement | Inputs (I)/Outputs (O) | Type of Indicator | Number | Criteria | Method of Measurement | Inputs (I)/Outputs (O) | Type of Indicator |
|---|---|---|---|---|---|---|---|---|---|
| 1 | Fatalities | Number of fatal accidents In the past 1 year | I1 | lagging | 12 | Conducting accident investigations | Yes/No | O9 | lagging |
| 2 | Working hours per week | Number of hours | I2 | leading | 13 | Requiring personal protective equipment | Yes/No | O10 | leading |
| 3 | Safety budget | Monetary value $ | O1 | leading | 14 | Safety audits/inspections | Number of inspections per project | O11 | leading |
| 4 | Safety management position represented in the company | Number of positions | O2 | leading | 15 | Non-fatal accidents | Number of non-fatal accidents In the past 1 year | I3 | lagging |
| 5 | Safety managers or safety personnel at the construction sites | Number of personnel | O3 | leading | 16 | Posting safety signs for identifying hazards | Yes/No | O12 | leading |
| 6 | Training programs and safety orientation/refresher | Average number of hours per construction workers and field supervisors | O4 | leading | 17 | Drugs and alcohol consumption of employees during working hours | Number of inspections | O13 | leading |
| 7 | First-aid trained personnel | Number of first-aid trained personnel | O5 | leading | 18 | Availability of hazards reporting system | Yes/No | O14 | leading |
| 8 | Safety handbooks/manuals | Yes/No | O6 | leading | 19 | Cost of accidents | Monetary value $ | I4 | lagging |
| 10 | Incentives, awards and recognition | Number of awards offered each year | O7 | leading | 20 | Fines and penalties | Monetary value $ | I5 | lagging |
| 11 | Safety committees | Number of meetings made by committees each year | O8 | leading | 21 | Lost construction days | Number or lost days in the past 1 year | I67 | lagging |
| Year | Client | Y1 | Y2 | Y3 | Y4 | Y5 | Y6 | Y7 | Y8 | Y9 | Y10 |
| Criteria | |||||||||||
| Fatalities (I1) | 1 | 10 | 6 | 8 | 8 | 7 | 4 | 5 | 3 | 4 | 7 |
| 2 | 2 | 10 | 7 | 8 | 7 | 5 | 5 | 1 | 5 | 1 | |
| 3 | 9 | 3 | 3 | 3 | 9 | 4 | 3 | 10 | 0 | 2 | |
| 4 | 4 | 10 | 1 | 1 | 7 | 5 | 0 | 2 | 7 | 3 | |
| 5 | 10 | 6 | 6 | 5 | 8 | 3 | 5 | 10 | 5 | 2 | |
| Artificial = 0 | |||||||||||
| Working hours per week (I2) | 1 | 43 | 54 | 42 | 44 | 37 | 51 | 48 | 39 | 39 | 40 |
| 2 | 45 | 52 | 43 | 46 | 47 | 36 | 49 | 53 | 51 | 51 | |
| 3 | 50 | 41 | 37 | 42 | 50 | 43 | 36 | 44 | 50 | 36 | |
| 4 | 53 | 50 | 45 | 39 | 54 | 36 | 38 | 48 | 38 | 44 | |
| 5 | 45 | 46 | 38 | 39 | 53 | 46 | 38 | 47 | 46 | 47 | |
| Artificial = 36 | |||||||||||
| Safety managers or safety personnel at the construction sites (O3) | 1 | 3 | 8 | 1 | 8 | 5 | 6 | 1 | 1 | 0 | 8 |
| 2 | 9 | 1 | 0 | 2 | 0 | 2 | 10 | 1 | 10 | 8 | |
| 3 | 10 | 6 | 2 | 1 | 4 | 1 | 4 | 5 | 5 | 5 | |
| 4 | 3 | 2 | 3 | 7 | 1 | 0 | 6 | 8 | 9 | 4 | |
| 5 | 0 | 4 | 10 | 6 | 5 | 1 | 4 | 6 | 9 | 9 | |
| Artificial = 10 | |||||||||||
| Training programs and safety orientation/refresher (O4) | 1 | 2 | 1 | 5 | 2 | 4 | 1 | 2 | 0 | 1 | 2 |
| 2 | 3 | 4 | 2 | 4 | 0 | 5 | 5 | 4 | 4 | 2 | |
| 3 | 1 | 4 | 3 | 5 | 5 | 4 | 3 | 3 | 3 | 0 | |
| 4 | 3 | 4 | 3 | 4 | 5 | 2 | 4 | 5 | 4 | 1 | |
| 5 | 4 | 4 | 3 | 4 | 5 | 0 | 5 | 5 | 5 | 2 | |
| Artificial = 5 | |||||||||||
| Fines and penalties (I5) | 1 | 15350 | 5081 | 13676 | 15866 | 14544 | 21688 | 21593 | 21367 | 28684 | 14702 |
| 2 | 8956 | 21453 | 5186 | 16641 | 28579 | 17248 | 11095 | 21803 | 27009 | 19260 | |
| 3 | 15269 | 18480 | 5105 | 21187 | 20120 | 29919 | 29123 | 17692 | 24056 | 8187 | |
| 4 | 29119 | 29935 | 9623 | 13390 | 8094 | 5095 | 20025 | 18219 | 5712 | 10391 | |
| 5 | 26675 | 19857 | 8559 | 29396 | 6397 | 7660 | 19101 | 14887 | 19575 | 12209 | |
| Artificial = 5081 | |||||||||||
| Cost of accidents (I4) | 1 | 43188 | 28899 | 66741 | 46229 | 60318 | 58237 | 73405 | 46679 | 65825 | 37549 |
| 2 | 66675 | 66577 | 57531 | 45895 | 36745 | 52745 | 47070 | 45812 | 25441 | 61078 | |
| 3 | 51281 | 58375 | 58678 | 58417 | 37096 | 61162 | 66046 | 26626 | 47715 | 54210 | |
| 4 | 54721 | 73915 | 26066 | 50891 | 46007 | 42649 | 30936 | 58288 | 71425 | 67609 | |
| 5 | 50286 | 67932 | 46398 | 48935 | 62835 | 51272 | 51810 | 62940 | 25379 | 56830 | |
| Artificial = 25379 | |||||||||||
| Safety budget (O1) | 1 | 47738 | 57089 | 40115 | 68974 | 42547 | 32129 | 37032 | 49410 | 59592 | 70274 |
| 2 | 49095 | 53939 | 68287 | 44769 | 56536 | 70846 | 31860 | 53871 | 46621 | 63825 | |
| 3 | 65225 | 64111 | 75990 | 33159 | 64101 | 45495 | 41715 | 41992 | 75536 | 30265 | |
| 4 | 60190 | 71282 | 44912 | 71998 | 77412 | 42168 | 33287 | 79530 | 56814 | 51744 | |
| 5 | 31082 | 45540 | 61141 | 69152 | 30989 | 33284 | 69265 | 37257 | 53418 | 38586 | |
| Artificial = 79530 | |||||||||||
| Lost construction days (I6) | 1 | 15 | 40 | 15 | 31 | 30 | 6 | 9 | 15 | 25 | 38 |
| 2 | 14 | 30 | 10 | 28 | 32 | 39 | 7 | 37 | 16 | 19 | |
| 3 | 30 | 33 | 13 | 6 | 38 | 27 | 22 | 35 | 40 | 14 | |
| 4 | 39 | 38 | 9 | 37 | 33 | 9 | 34 | 9 | 21 | 14 | |
| 5 | 12 | 8 | 18 | 39 | 40 | 10 | 39 | 9 | 10 | 35 | |
| Artificial = 6 | |||||||||||
| Availability of hazards reporting system (O14) | 1 | 0 | 1 | 1 | 0 | 1 | 1 | 0 | 1 | 1 | 0 |
| 2 | 1 | 1 | 0 | 1 | 0 | 0 | 1 | 1 | 1 | 0 | |
| 3 | 0 | 1 | 0 | 1 | 1 | 0 | 0 | 0 | 1 | 0 | |
| 4 | 0 | 1 | 0 | 1 | 0 | 0 | 0 | 1 | 0 | 0 | |
| 5 | 1 | 0 | 0 | 0 | 1 | 1 | 1 | 1 | 1 | 0 | |
| Artificial = 1 | |||||||||||
| Safety management position represented in the company (O2) | 1 | 5 | 6 | 0 | 6 | 5 | 6 | 8 | 5 | 1 | 7 |
| 2 | 9 | 6 | 0 | 3 | 5 | 3 | 4 | 3 | 2 | 5 | |
| 3 | 8 | 2 | 4 | 1 | 4 | 7 | 6 | 10 | 10 | 7 | |
| 4 | 3 | 2 | 3 | 7 | 1 | 0 | 6 | 8 | 10 | 4 | |
| 5 | 6 | 4 | 2 | 8 | 7 | 2 | 4 | 6 | 10 | 5 | |
| Artificial = 10 | |||||||||||
| First-aid trained personnel (O5) | 1 | 6 | 3 | 5 | 0 | 7 | 0 | 1 | 3 | 3 | 6 |
| 2 | 7 | 8 | 1 | 6 | 4 | 0 | 10 | 5 | 2 | 7 | |
| 3 | 9 | 6 | 7 | 7 | 8 | 2 | 3 | 2 | 6 | 1 | |
| 4 | 5 | 3 | 1 | 4 | 0 | 2 | 3 | 1 | 10 | 0 | |
| 5 | 0 | 1 | 10 | 4 | 0 | 8 | 6 | 0 | 7 | 3 | |
| Artificial = 10 | |||||||||||
| Safety handbooks/manuals (O6) | 1 | 1 | 0 | 1 | 0 | 1 | 1 | 1 | 0 | 0 | 1 |
| 2 | 1 | 0 | 1 | 1 | 0 | 1 | 0 | 1 | 0 | 0 | |
| 3 | 1 | 0 | 0 | 1 | 1 | 1 | 0 | 1 | 0 | 0 | |
| 4 | 0 | 1 | 1 | 0 | 0 | 1 | 1 | 0 | 0 | 1 | |
| 5 | 0 | 1 | 0 | 1 | 0 | 0 | 0 | 0 | 0 | 0 | |
| Artificial = 1 | |||||||||||
| Safety committees (O8) | 1 | 4 | 3 | 2 | 3 | 1 | 7 | 2 | 6 | 6 | 1 |
| 2 | 6 | 0 | 4 | 5 | 4 | 2 | 5 | 4 | 2 | 6 | |
| 3 | 6 | 5 | 1 | 2 | 2 | 0 | 6 | 6 | 7 | 7 | |
| 4 | 5 | 0 | 2 | 5 | 7 | 7 | 4 | 1 | 6 | 6 | |
| 5 | 3 | 2 | 6 | 0 | 4 | 4 | 3 | 3 | 0 | 1 | |
| Artificial = 7 | |||||||||||
| Safety audits/inspections (O11) | 1 | 2 | 4 | 1 | 2 | 1 | 4 | 7 | 6 | 1 | 1 |
| 2 | 5 | 2 | 2 | 5 | 0 | 1 | 6 | 0 | 3 | 3 | |
| 3 | 0 | 1 | 0 | 0 | 3 | 6 | 3 | 2 | 6 | 4 | |
| 4 | 7 | 5 | 1 | 3 | 5 | 0 | 2 | 1 | 3 | 0 | |
| 5 | 0 | 2 | 3 | 5 | 2 | 4 | 6 | 6 | 4 | 6 | |
| Artificial = 7 | |||||||||||
| Year | Client | Y1 | Y2 | Y3 | Y4 | Y5 | Y6 | Y7 | Y8 | Y9 | Y10 |
| Criteria | |||||||||||
| Incentives, awards and recognition (O7) | 1 | 4 | 4 | 3 | 4 | 3 | 3 | 4 | 0 | 5 | 3 |
| 2 | 0 | 4 | 2 | 0 | 0 | 4 | 0 | 0 | 3 | 4 | |
| 3 | 4 | 2 | 3 | 0 | 4 | 0 | 3 | 3 | 5 | 2 | |
| 4 | 1 | 4 | 1 | 2 | 2 | 4 | 2 | 4 | 3 | 1 | |
| 5 | 5 | 4 | 2 | 5 | 5 | 5 | 5 | 4 | 5 | 5 | |
| Artificial = 5 | |||||||||||
| Non-fatal accidents (I3) | 1 | 11 | 4 | 4 | 9 | 7 | 10 | 8 | 11 | 15 | 12 |
| 2 | 7 | 16 | 5 | 18 | 6 | 7 | 12 | 16 | 4 | 16 | |
| 3 | 14 | 16 | 14 | 12 | 11 | 6 | 14 | 7 | 9 | 7 | |
| 4 | 14 | 11 | 4 | 14 | 15 | 11 | 5 | 5 | 15 | 10 | |
| 5 | 14 | 5 | 12 | 5 | 5 | 4 | 5 | 5 | 17 | 10 | |
| Artificial = 4 | |||||||||||
| Posting safety signs for identifying hazards (O12) | 1 | 1 | 0 | 1 | 0 | 1 | 1 | 1 | 0 | 0 | 1 |
| 2 | 1 | 0 | 1 | 0 | 1 | 0 | 0 | 1 | 0 | 1 | |
| 3 | 0 | 0 | 0 | 0 | 1 | 0 | 0 | 1 | 1 | 0 | |
| 4 | 1 | 1 | 0 | 1 | 0 | 0 | 0 | 1 | 0 | 1 | |
| 5 | 1 | 1 | 0 | 0 | 1 | 1 | 1 | 0 | 0 | 0 | |
| Artificial = 10 | |||||||||||
| Drugs and alcohol consumption of employees during working hours (O13) | 1 | 4 | 2 | 4 | 2 | 5 | 3 | 8 | 2 | 3 | 2 |
| 2 | 4 | 5 | 3 | 5 | 0 | 4 | 4 | 10 | 1 | 3 | |
| 3 | 5 | 10 | 3 | 5 | 5 | 3 | 9 | 5 | 1 | 3 | |
| 4 | 0 | 4 | 10 | 1 | 6 | 5 | 3 | 4 | 4 | 5 | |
| 5 | 3 | 6 | 6 | 4 | 8 | 3 | 6 | 9 | 8 | 10 | |
| Artificial = 10 | |||||||||||
| Conducting accident investigations (O9) | 1 | 0 | 1 | 0 | 0 | 1 | 1 | 1 | 1 | 1 | 0 |
| 2 | 1 | 0 | 0 | 0 | 1 | 0 | 1 | 1 | 0 | 0 | |
| 3 | 1 | 1 | 1 | 0 | 0 | 1 | 0 | 0 | 1 | 0 | |
| 4 | 1 | 0 | 1 | 0 | 0 | 0 | 0 | 1 | 1 | 0 | |
| 5 | 0 | 0 | 1 | 0 | 1 | 0 | 0 | 0 | 0 | 1 | |
| Artificial = 1 | |||||||||||
| Requiring personal protective equipment (O10) | 1 | 1 | 0 | 1 | 0 | 1 | 0 | 0 | 1 | 1 | 1 |
| 2 | 1 | 1 | 0 | 1 | 1 | 1 | 0 | 0 | 0 | 0 | |
| 3 | 0 | 0 | 0 | 1 | 0 | 1 | 1 | 1 | 0 | 0 | |
| 4 | 1 | 0 | 0 | 0 | 0 | 0 | 1 | 0 | 1 | 1 | |
| 5 | 1 | 0 | 0 | 1 | 1 | 1 | 1 | 0 | 1 | 0 | |
| Artificial = 1 | |||||||||||
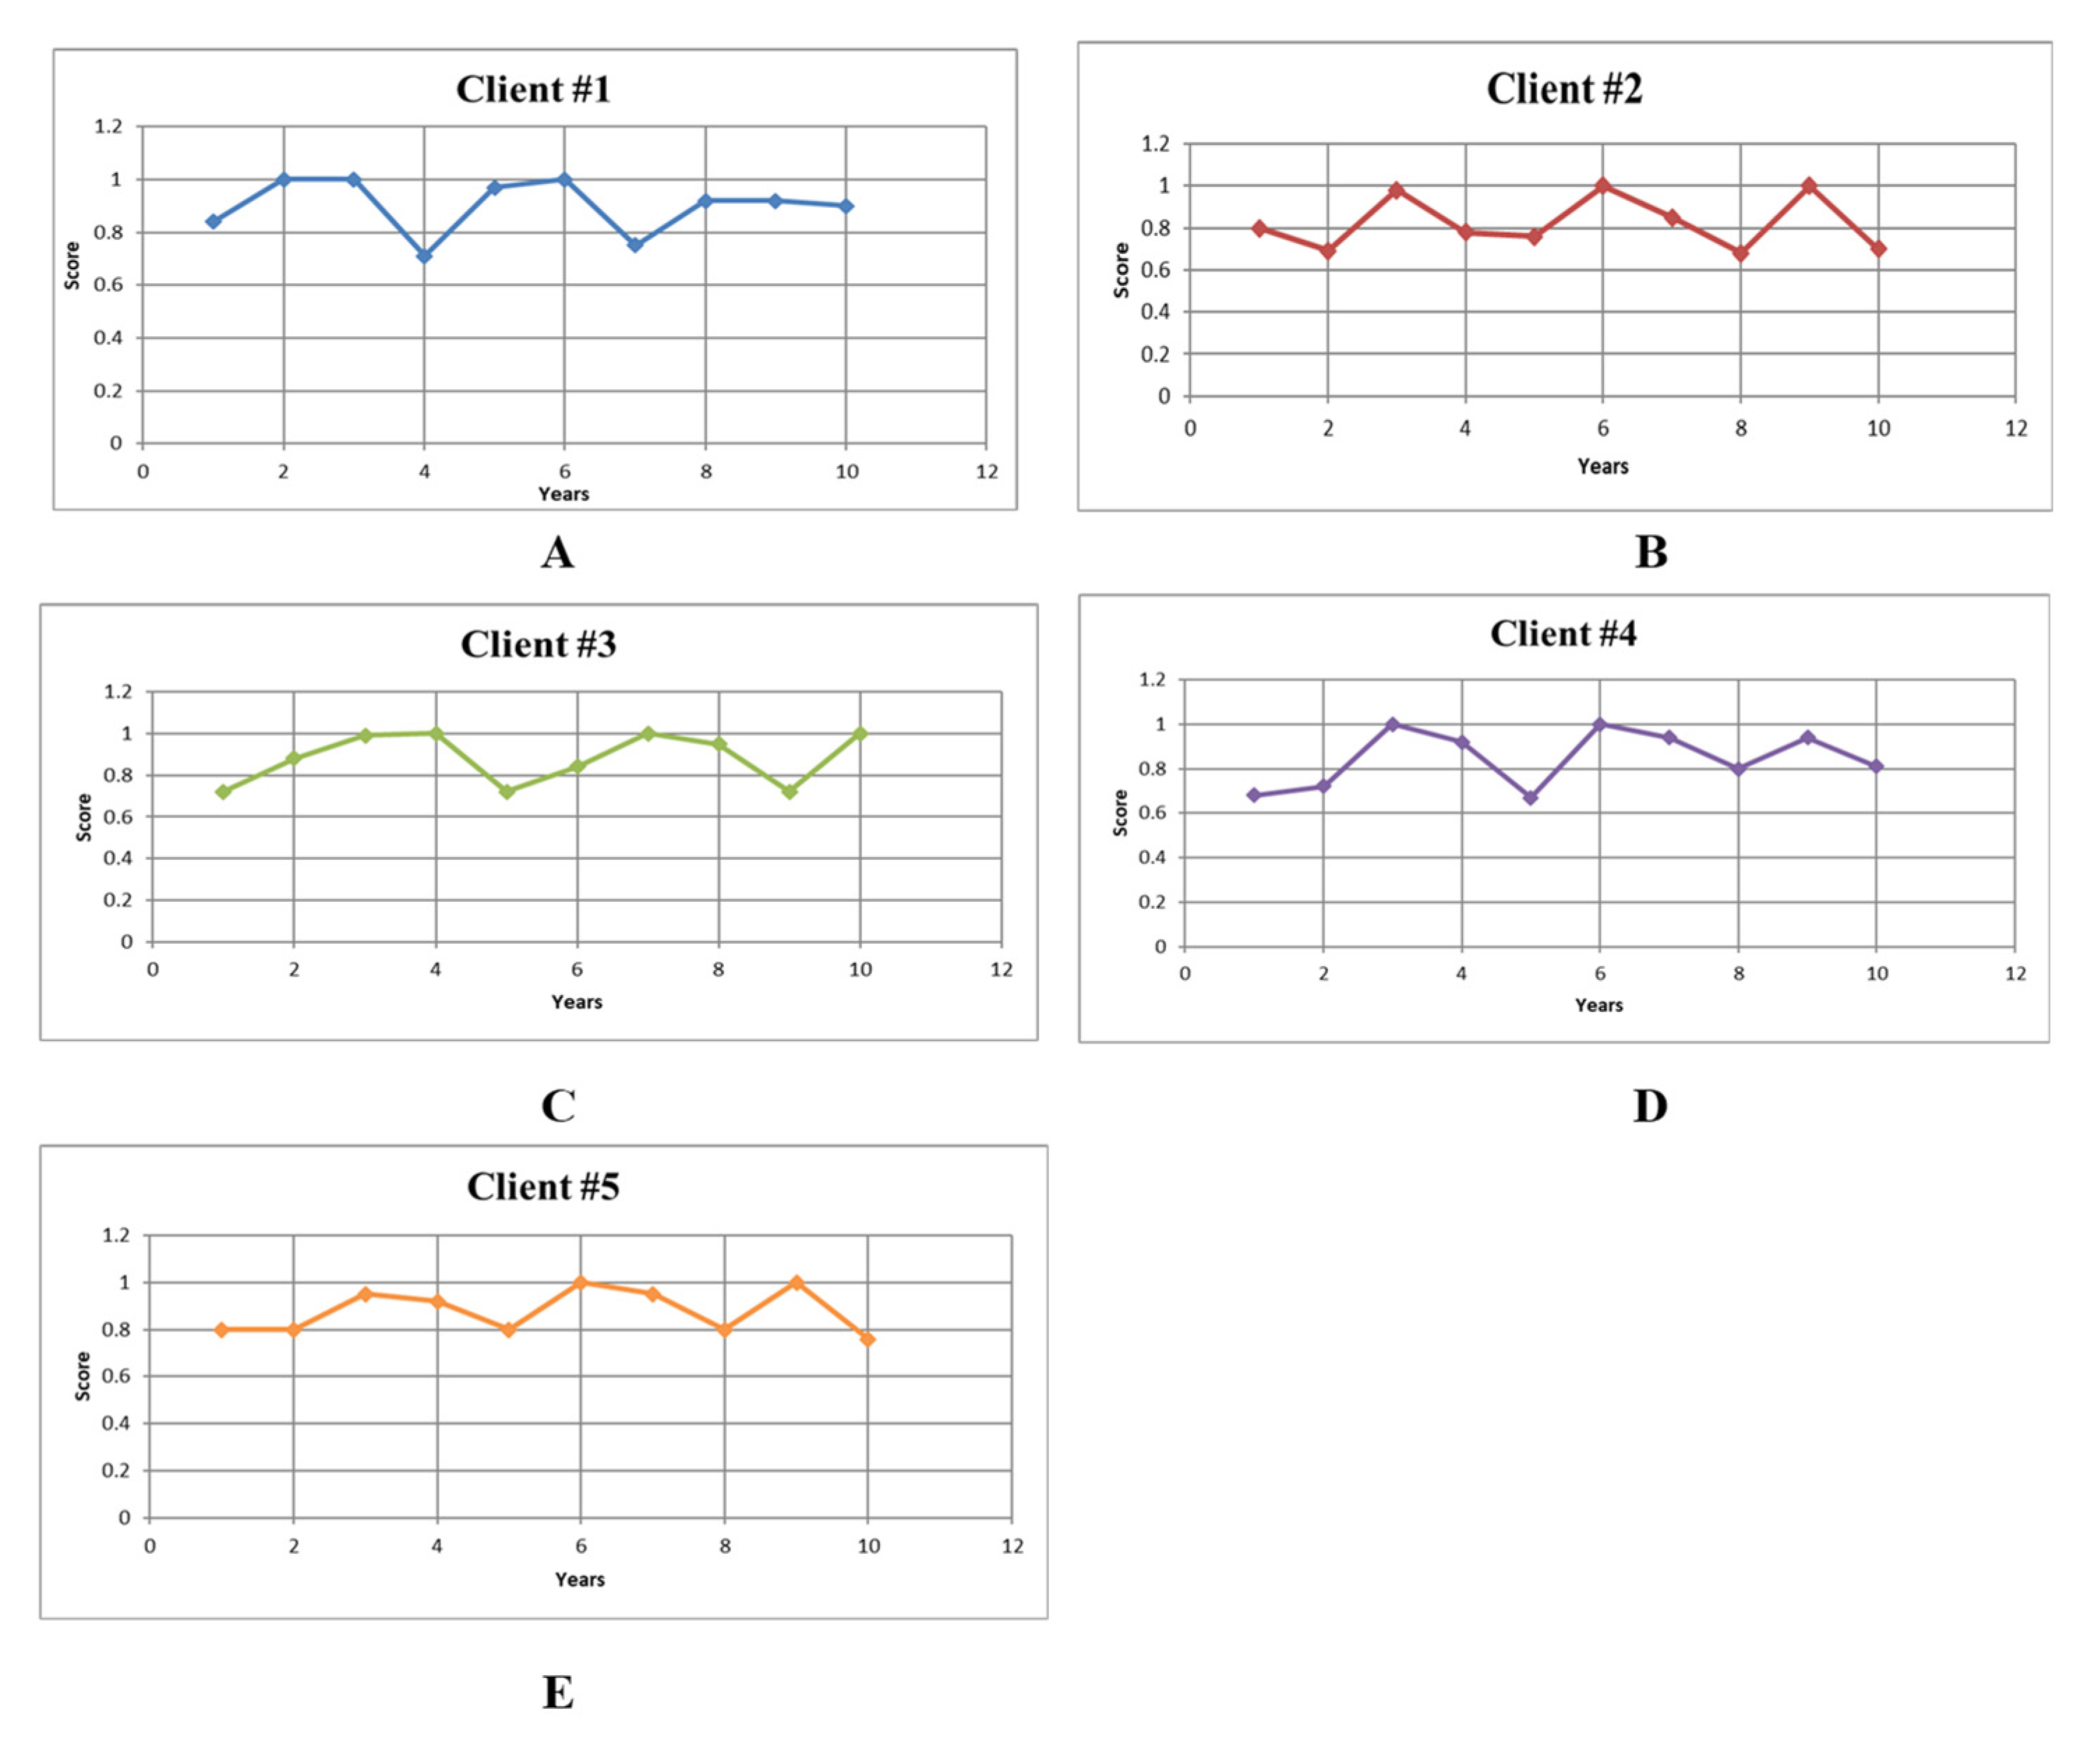
| Quartile | Client 1 | Client 2 | Client 3 | Client 4 | Client 5 |
|---|---|---|---|---|---|
| Q1 | 0.905 | 0.77 | 0.7825 | 0.75 | 0.8 |
| Q2 (Median) | 0.95 | 0.845 | 0.935 | 0.93 | 0.9 |
| Q3 | 0.9975 | 0.9625 | 0.9975 | 0.97 | 0.95 |
| Year | Y1 | Y2 | Y3 | Y4 | Y5 | Y6 | Year | Y1 | Y2 | Y3 | Y4 | Y5 | Y6 | Year | Y1 | Y2 | Y3 | Y4 | Y5 | Y6 |
|---|---|---|---|---|---|---|---|---|---|---|---|---|---|---|---|---|---|---|---|---|
| Criteria | Criteria | Criteria | ||||||||||||||||||
| Fatalities (I1) | 5 | 5 | 5 | 5 | 3 | 3 | Lost construction days (I6) | 30 | 30 | 22 | 22 | 22 | 22 | Incentives, awards and recognition (O7) | 0 | 0 | 0 | 0 | 0 | 1 |
| Artificial = 3 | Artificial = 22 | Artificial = 1 | ||||||||||||||||||
| Working hours per week (I2) | 56 | 45 | 45 | 40 | 40 | 40 | Availability of hazards reporting system (O14) | 0 | 0 | 0 | 0 | 0 | 1 | Non-fatal accidents (I3) | 10 | 10 | 10 | 10 | 8 | 8 |
| Artificial = 40 | Artificial = 1 | Artificial = 8 | ||||||||||||||||||
| Safety managers or safety personnel at the construction sites (O3) | 0 | 0 | 0 | 0 | 0 | 0 | Safety management position represented in the company (O2) | 1 | 1 | 2 | 2 | 2 | 3 | Posting safety signs for identifying hazards (O12) | 0 | 0 | 0 | 0 | 0 | 1 |
| Artificial = 0 | Artificial = 3 | Artificial = 1 | ||||||||||||||||||
| Training programs and safety orientation/refresher (O4) | 10 | 10 | 10 | 10 | 10 | 17 | First-aid trained personnel (O5) | 3 | 3 | 3 | 4 | 4 | 5 | Drugs and alcohol consumption of employees during working hours (O13) | 0 | 0 | 0 | 0 | 0 | 0 |
| Artificial = 17 | Artificial = 5 | Artificial = 0 | ||||||||||||||||||
| Fines and penalties (I5) | 10000 | 10000 | 6700 | 6700 | 6700 | 6700 | Safety handbooks/manuals (O6) | 0 | 0 | 0 | 0 | 0 | 0 | Conducting accident investigations (O9) | 0 | 0 | 0 | 0 | 0 | 1 |
| Artificial = 6700 | Artificial = 0 | Artificial = 1 | ||||||||||||||||||
| Cost of accidents (I4) | 50000 | 40000 | 40000 | 40000 | 37000 | 37000 | Safety committees (O8) | 2 | 2 | 2 | 2 | 2 | 6 | Requiring personal protective equipment (O10) | 0 | 0 | 0 | 0 | 0 | 0 |
| Artificial = 37000 | Artificial = 6 | Artificial = 0 | ||||||||||||||||||
| Safety budget (O1) | 30000 | 40000 | 40000 | 40000 | 50000 | 50000 | Safety audits/inspections (O11) | 1 | 1 | 1 | 1 | 1 | 4 | |||||||
| Artificial = 50000 | Artificial = 4 | |||||||||||||||||||
| Year | Efficiency Score |
|---|---|
| Y1 | 0.48 |
| Y2 | 0.74 |
| Y3 | 0.8 |
| Y4 | 0.8 |
| Y5 | 1 |
| Y6 | 1 |
| Y Artificial | 1 |
Publisher’s Note: MDPI stays neutral with regard to jurisdictional claims in published maps and institutional affiliations. |
© 2021 by the authors. Licensee MDPI, Basel, Switzerland. This article is an open access article distributed under the terms and conditions of the Creative Commons Attribution (CC BY) license (https://creativecommons.org/licenses/by/4.0/).
Share and Cite
Al-Kasasbeh, M.; Abudayyeh, O.; Olimat, H.; Liu, H.; Al Mamlook, R.; Alfoul, B.A. A Robust Construction Safety Performance Evaluation Framework for Workers’ Compensation Insurance: A Proposed Alternative to EMR. Buildings 2021, 11, 434. https://doi.org/10.3390/buildings11100434
Al-Kasasbeh M, Abudayyeh O, Olimat H, Liu H, Al Mamlook R, Alfoul BA. A Robust Construction Safety Performance Evaluation Framework for Workers’ Compensation Insurance: A Proposed Alternative to EMR. Buildings. 2021; 11(10):434. https://doi.org/10.3390/buildings11100434
Chicago/Turabian StyleAl-Kasasbeh, Maha, Osama Abudayyeh, Hosam Olimat, Hexu Liu, Rabia Al Mamlook, and Bilal Abu Alfoul. 2021. "A Robust Construction Safety Performance Evaluation Framework for Workers’ Compensation Insurance: A Proposed Alternative to EMR" Buildings 11, no. 10: 434. https://doi.org/10.3390/buildings11100434
APA StyleAl-Kasasbeh, M., Abudayyeh, O., Olimat, H., Liu, H., Al Mamlook, R., & Alfoul, B. A. (2021). A Robust Construction Safety Performance Evaluation Framework for Workers’ Compensation Insurance: A Proposed Alternative to EMR. Buildings, 11(10), 434. https://doi.org/10.3390/buildings11100434