
Seismic Vulnerability Assessment for Masonry Churches: An Overview on Existing Methodologies


Abstract
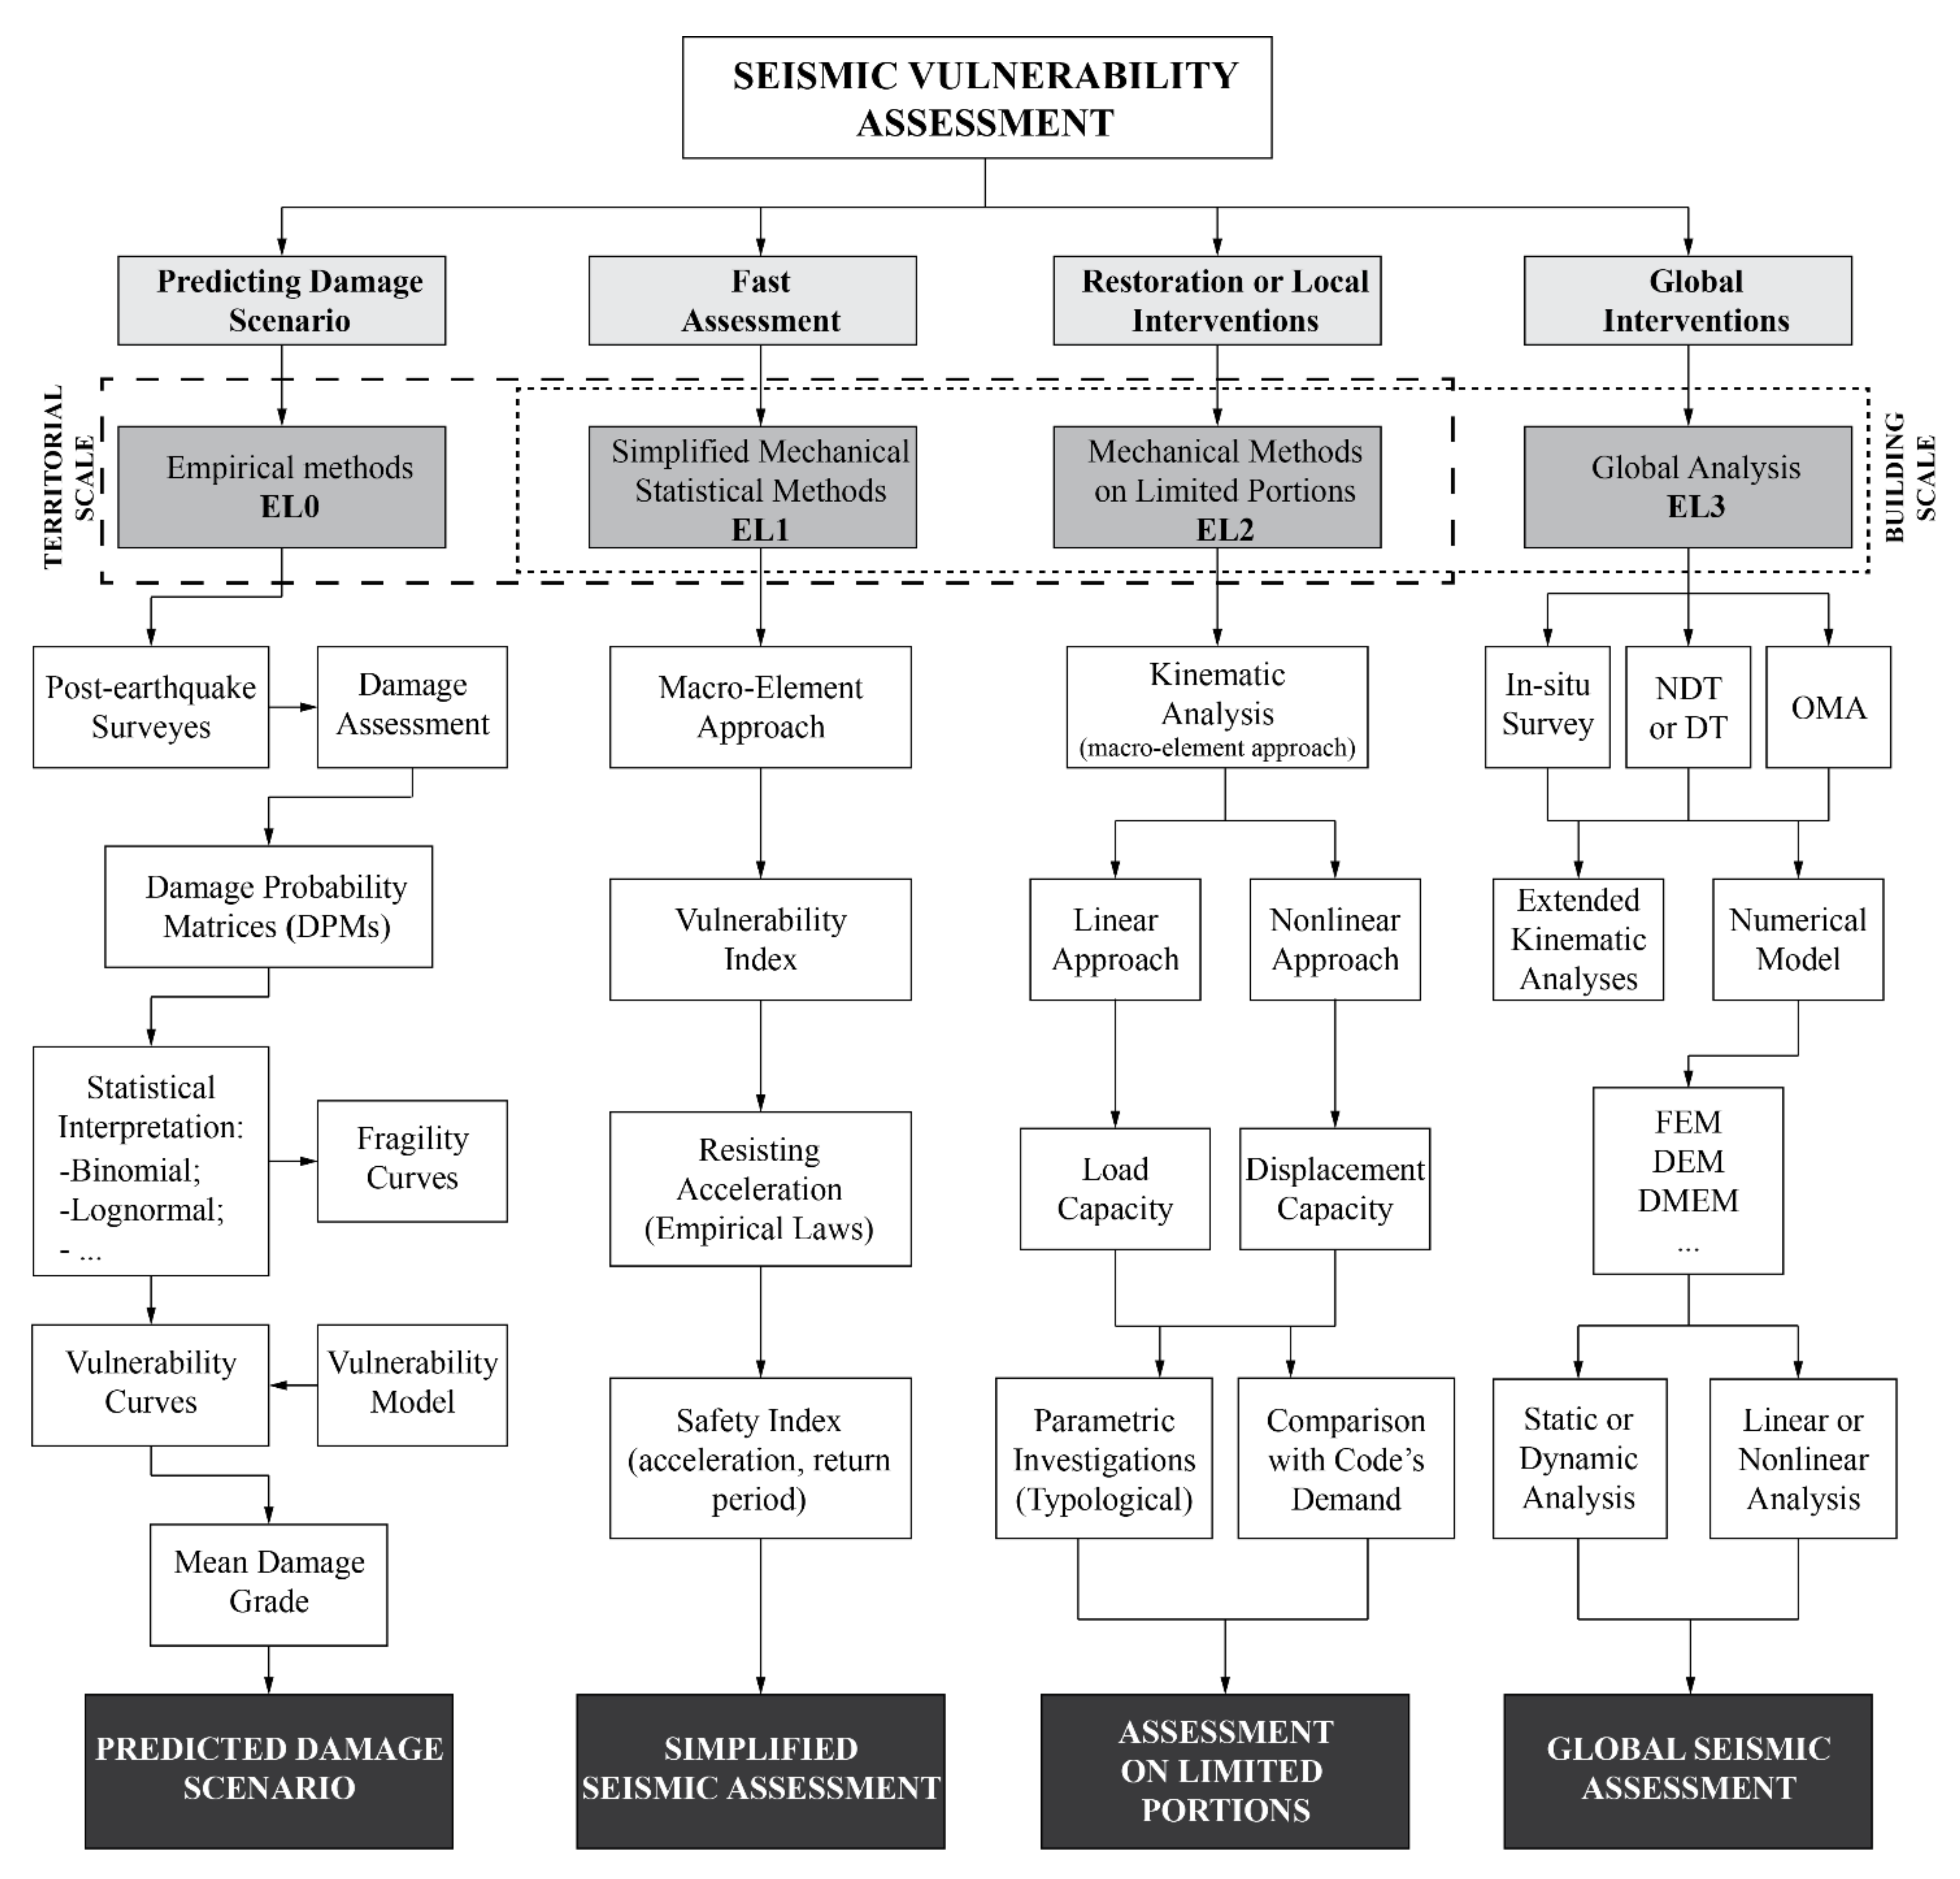
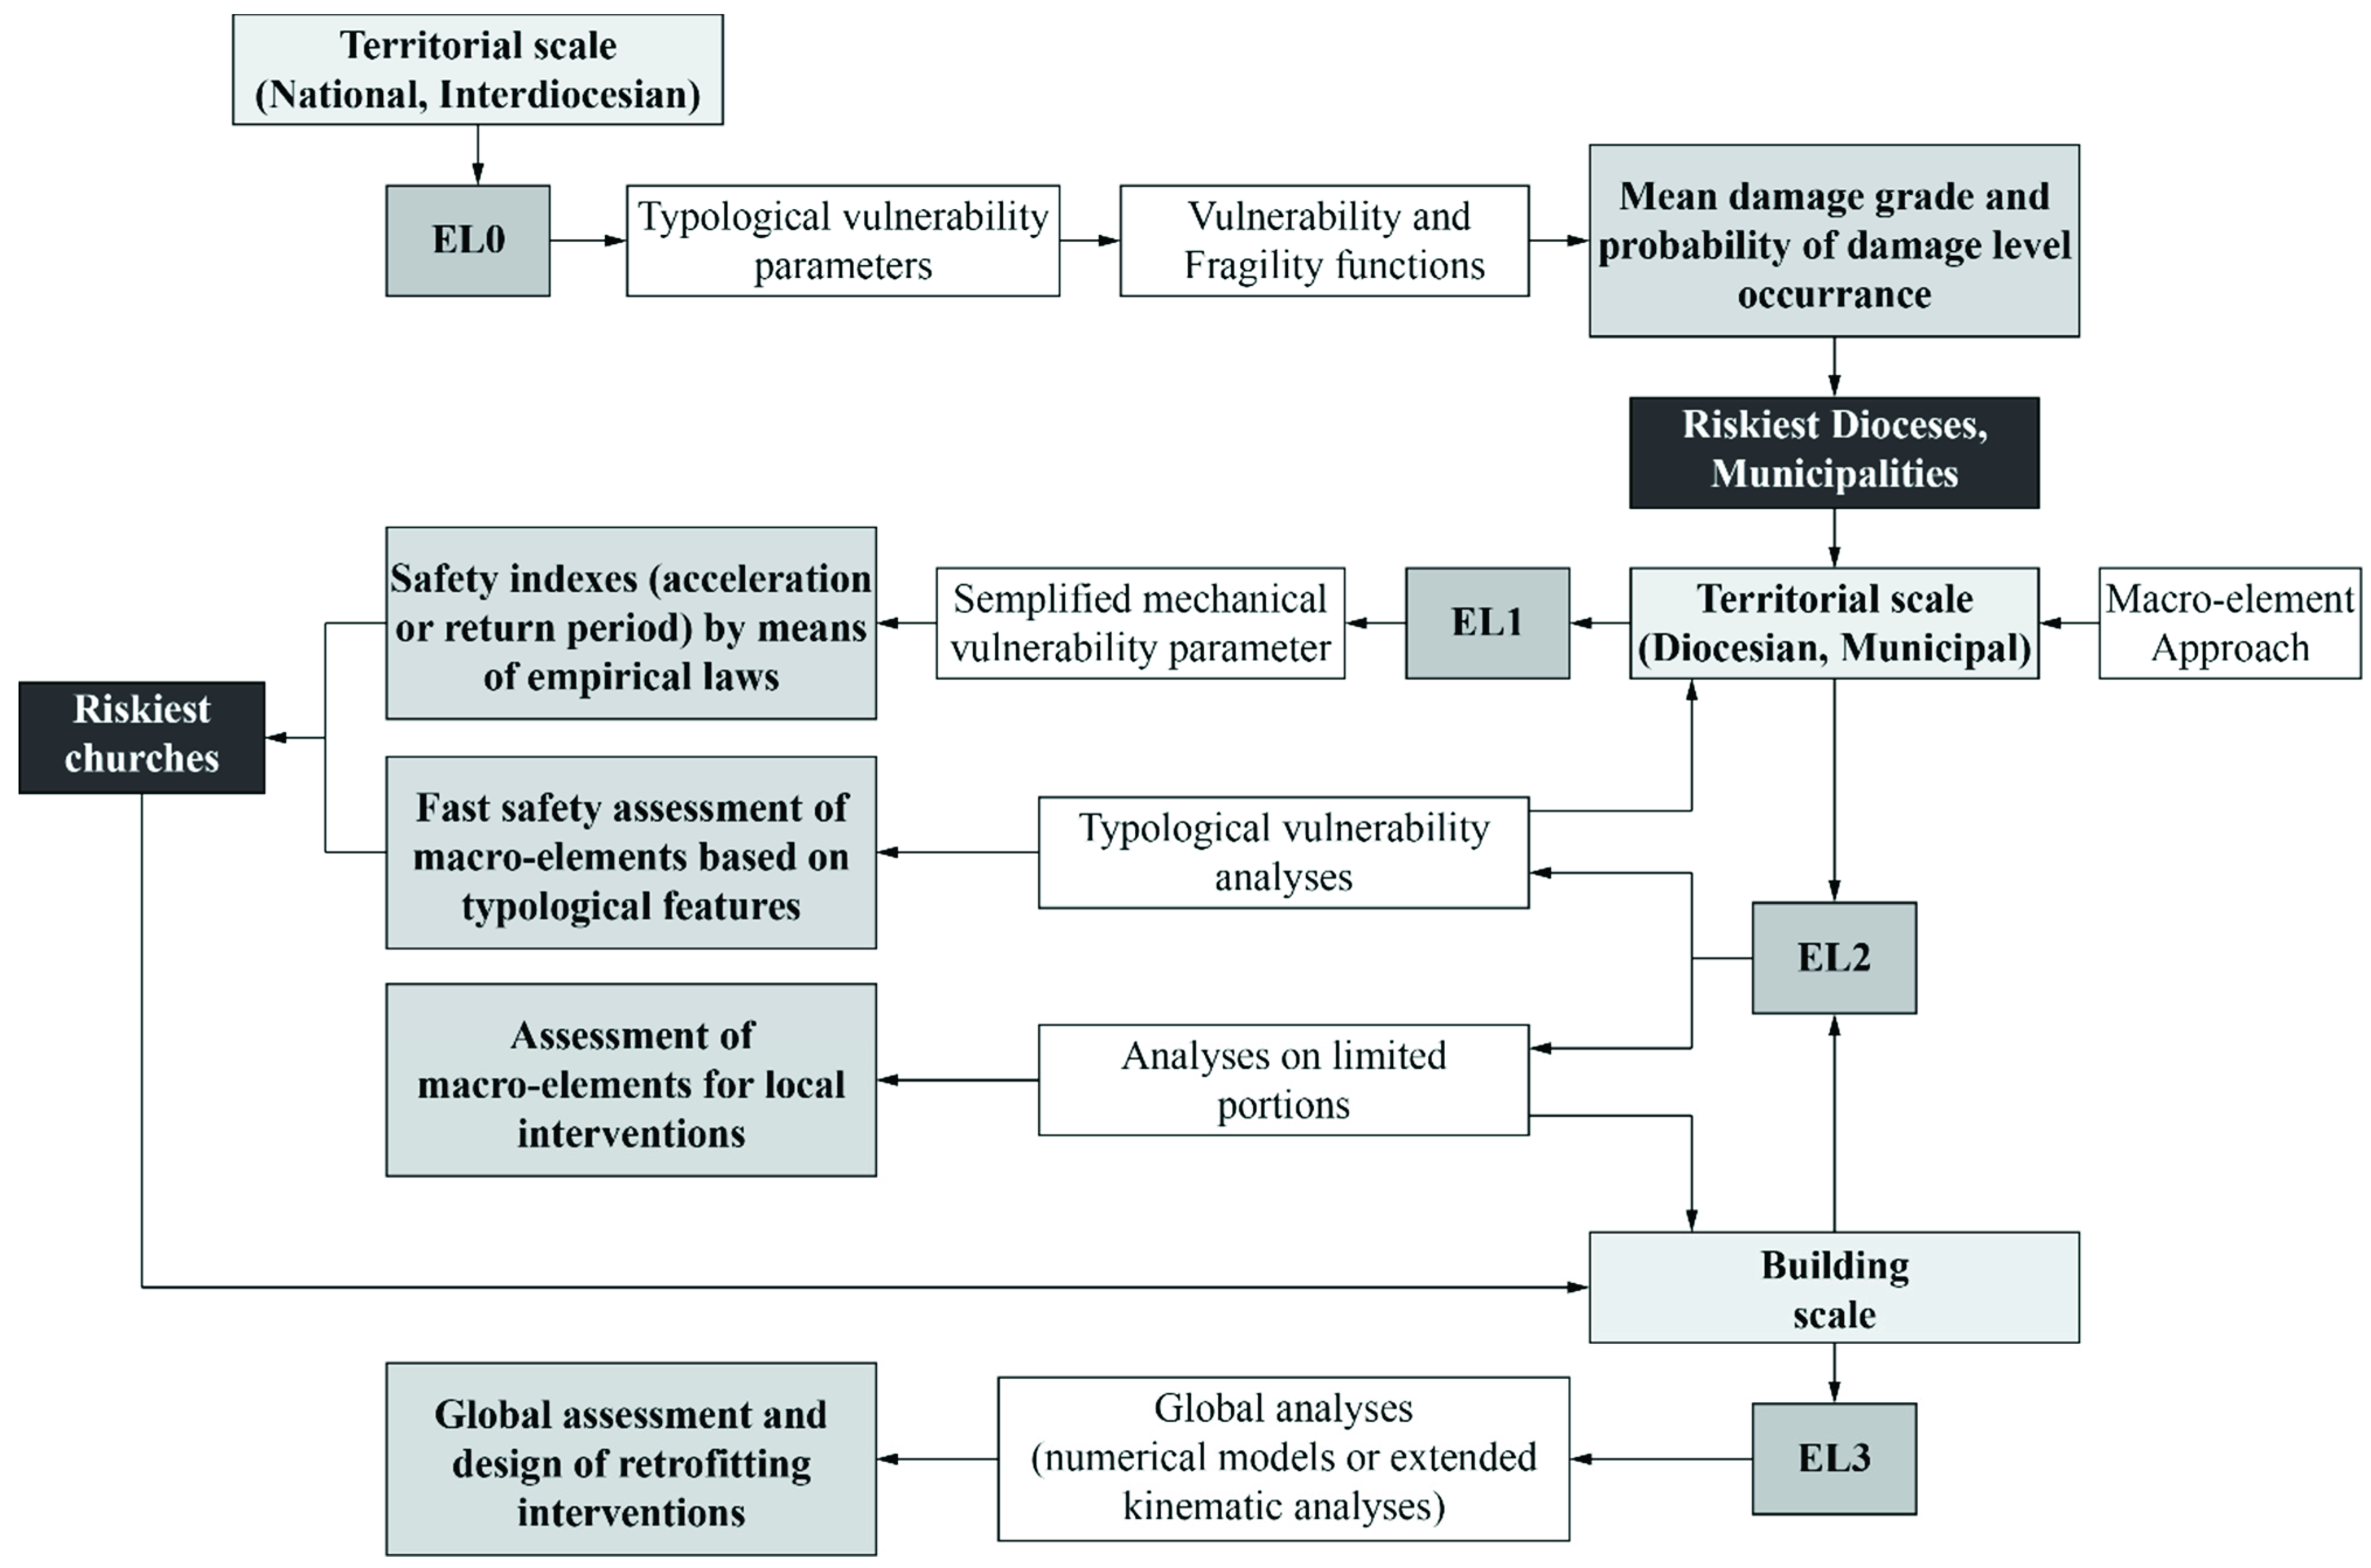
:1. Introduction
- EL1: qualitative analysis and assessment by means of simplified mechanical and statistical models.
- EL2: assessment of single macro-elements (local collapse mechanisms).
- EL3: global assessment of the seismic response of the structure.
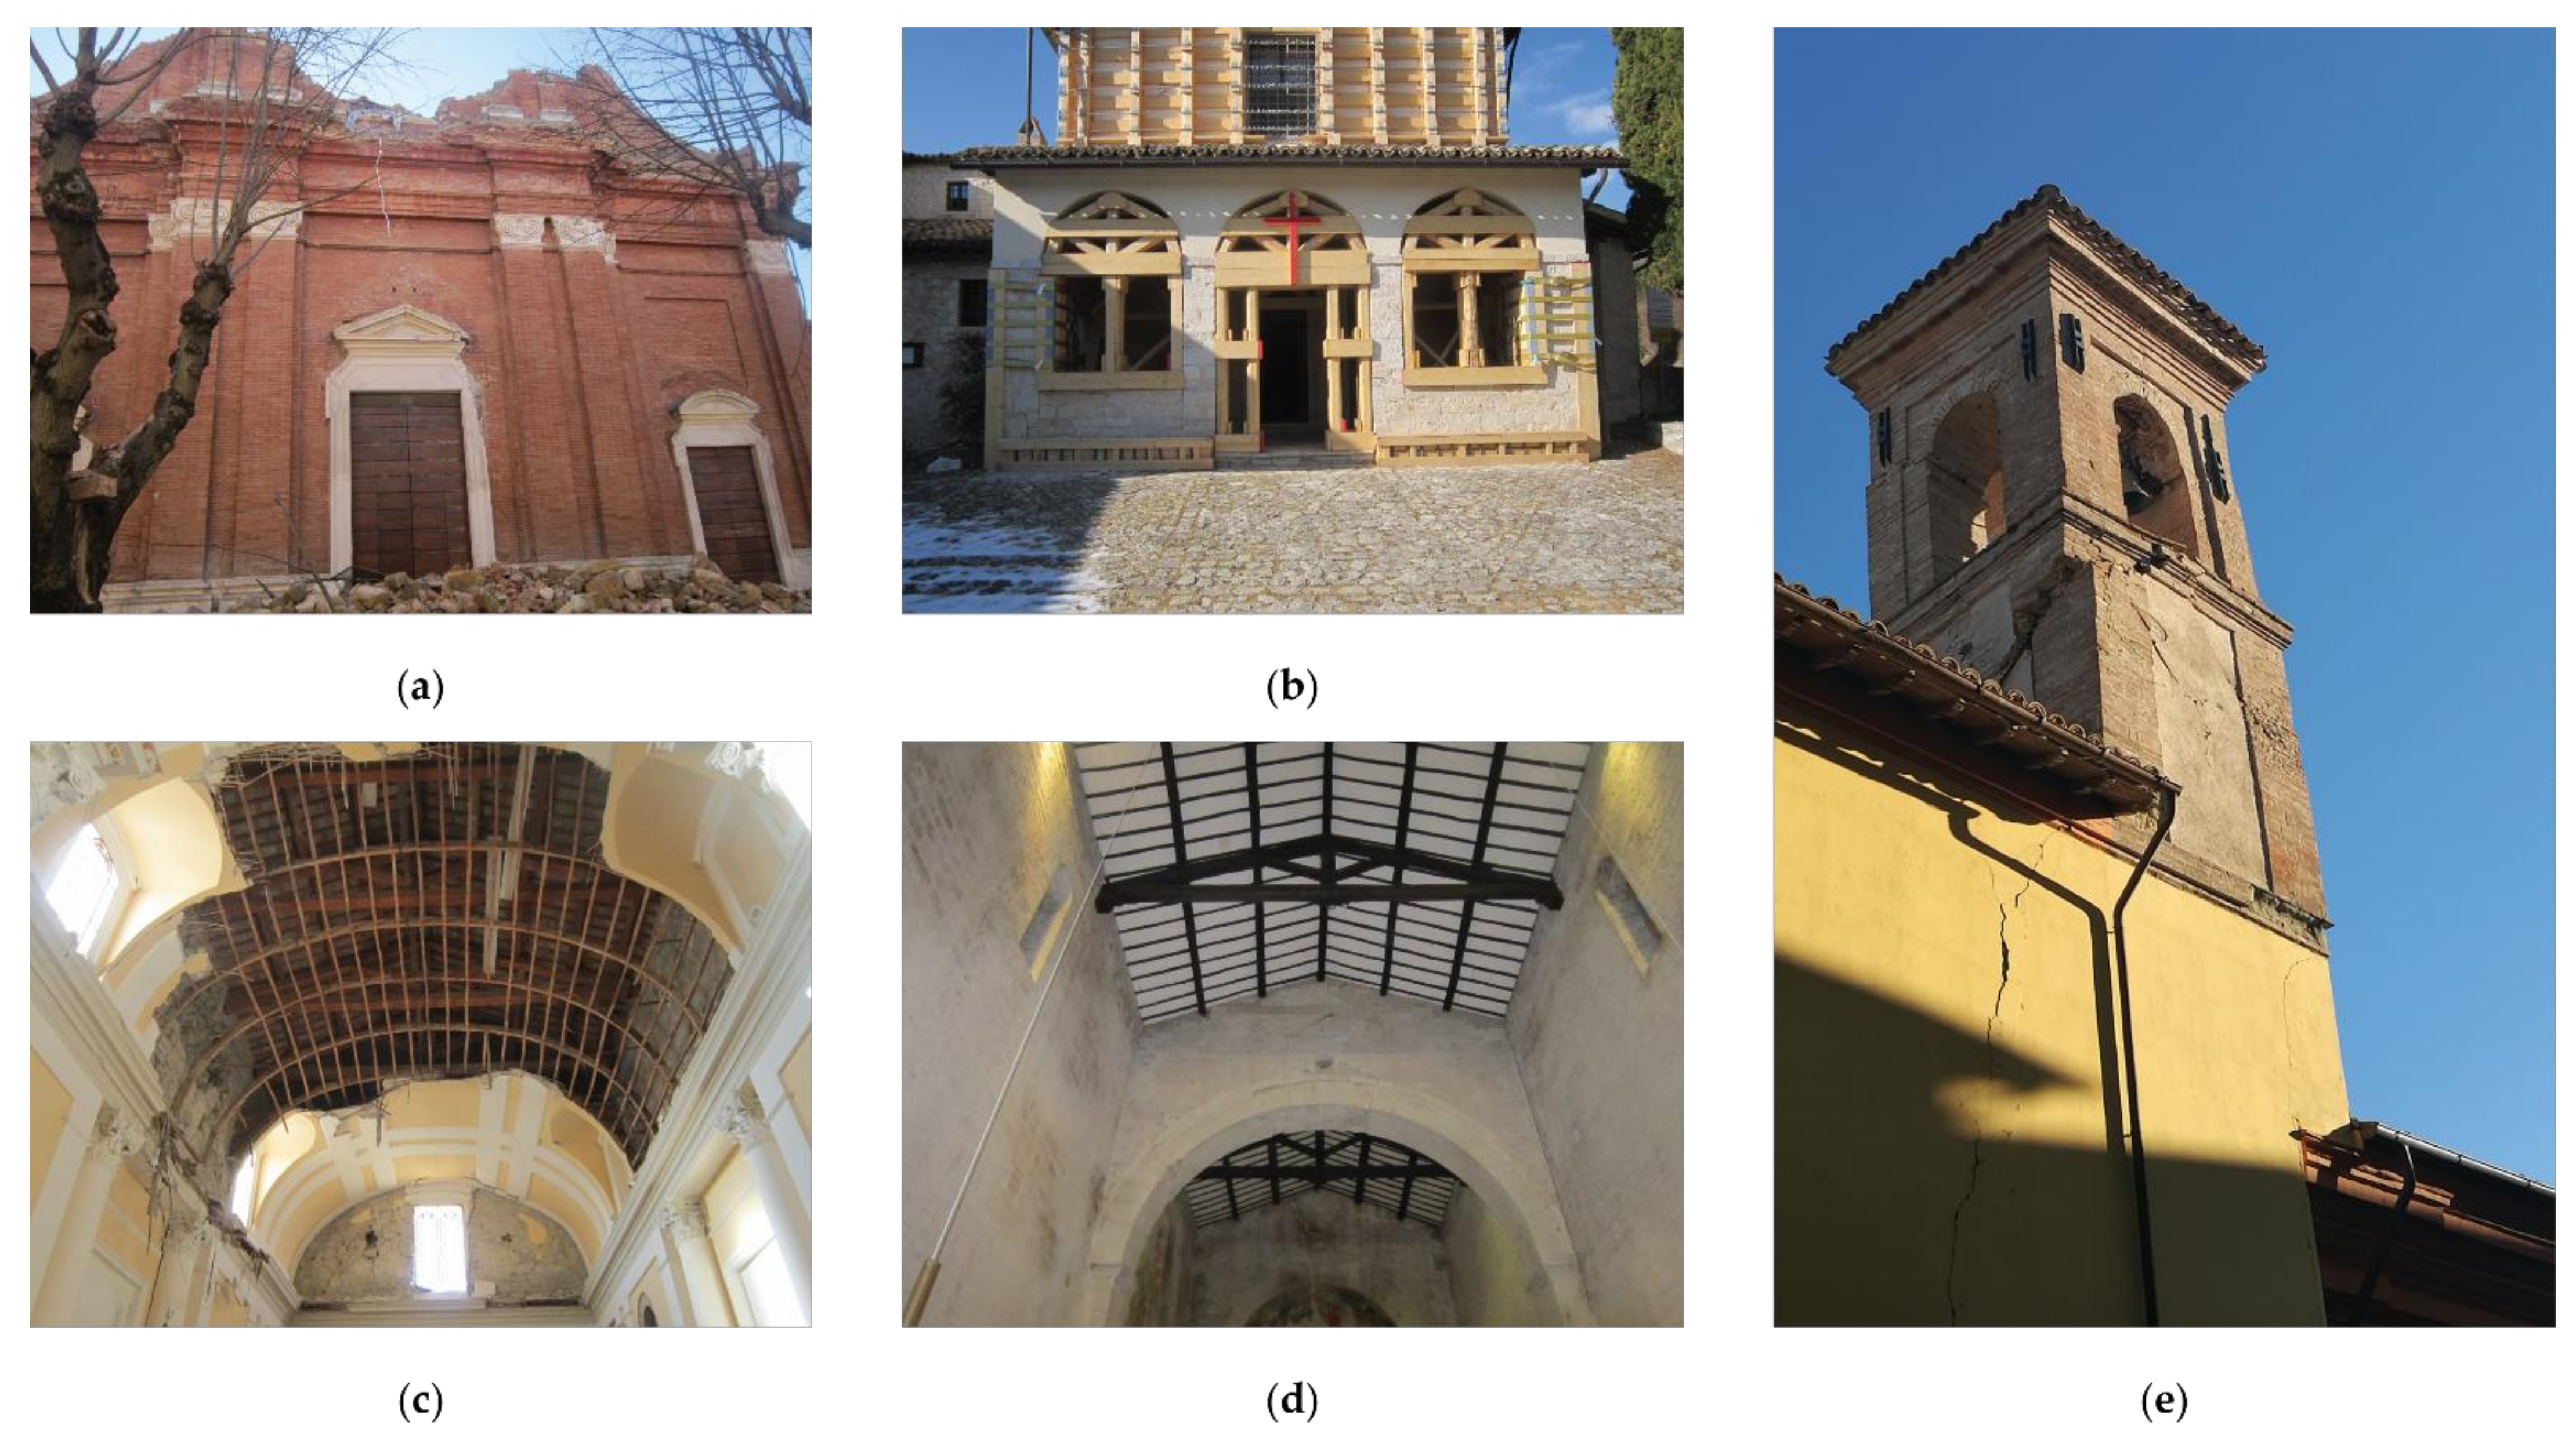
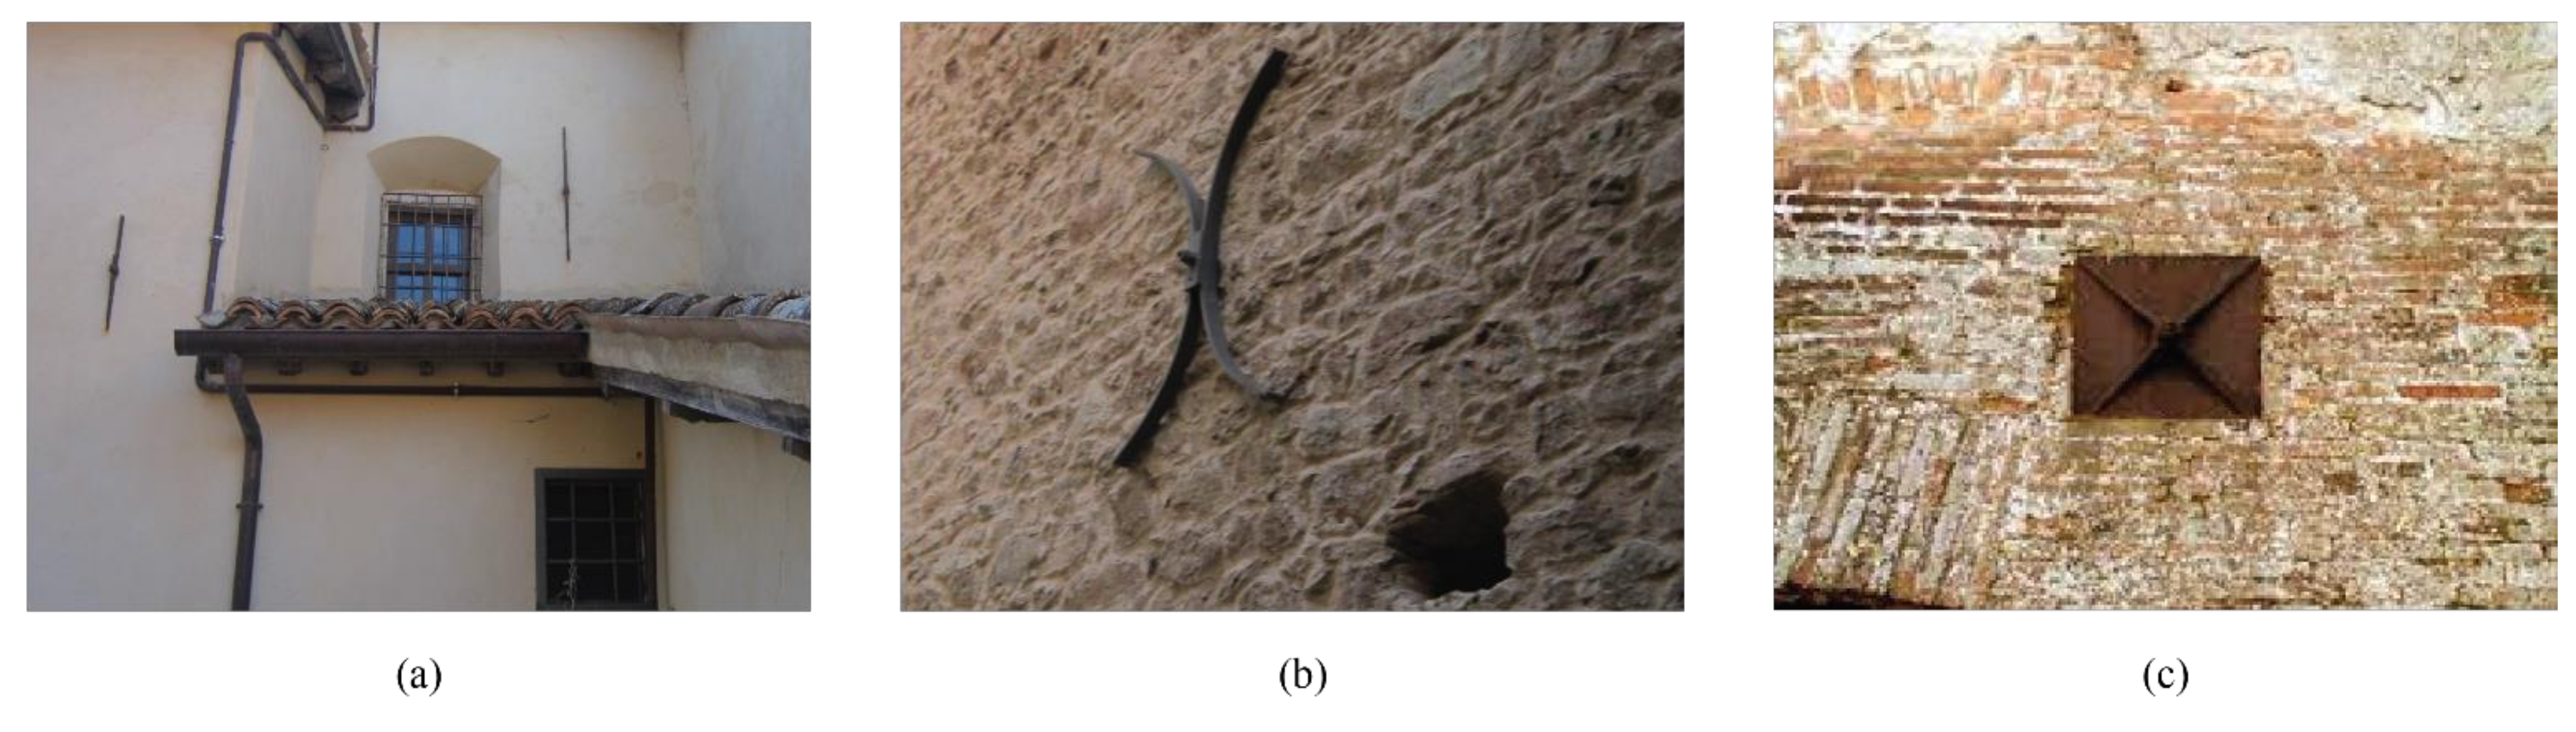
2. Seismic Response of Existing Masonry Churches
3. Territorial Scale Approaches: EL0 and EL1
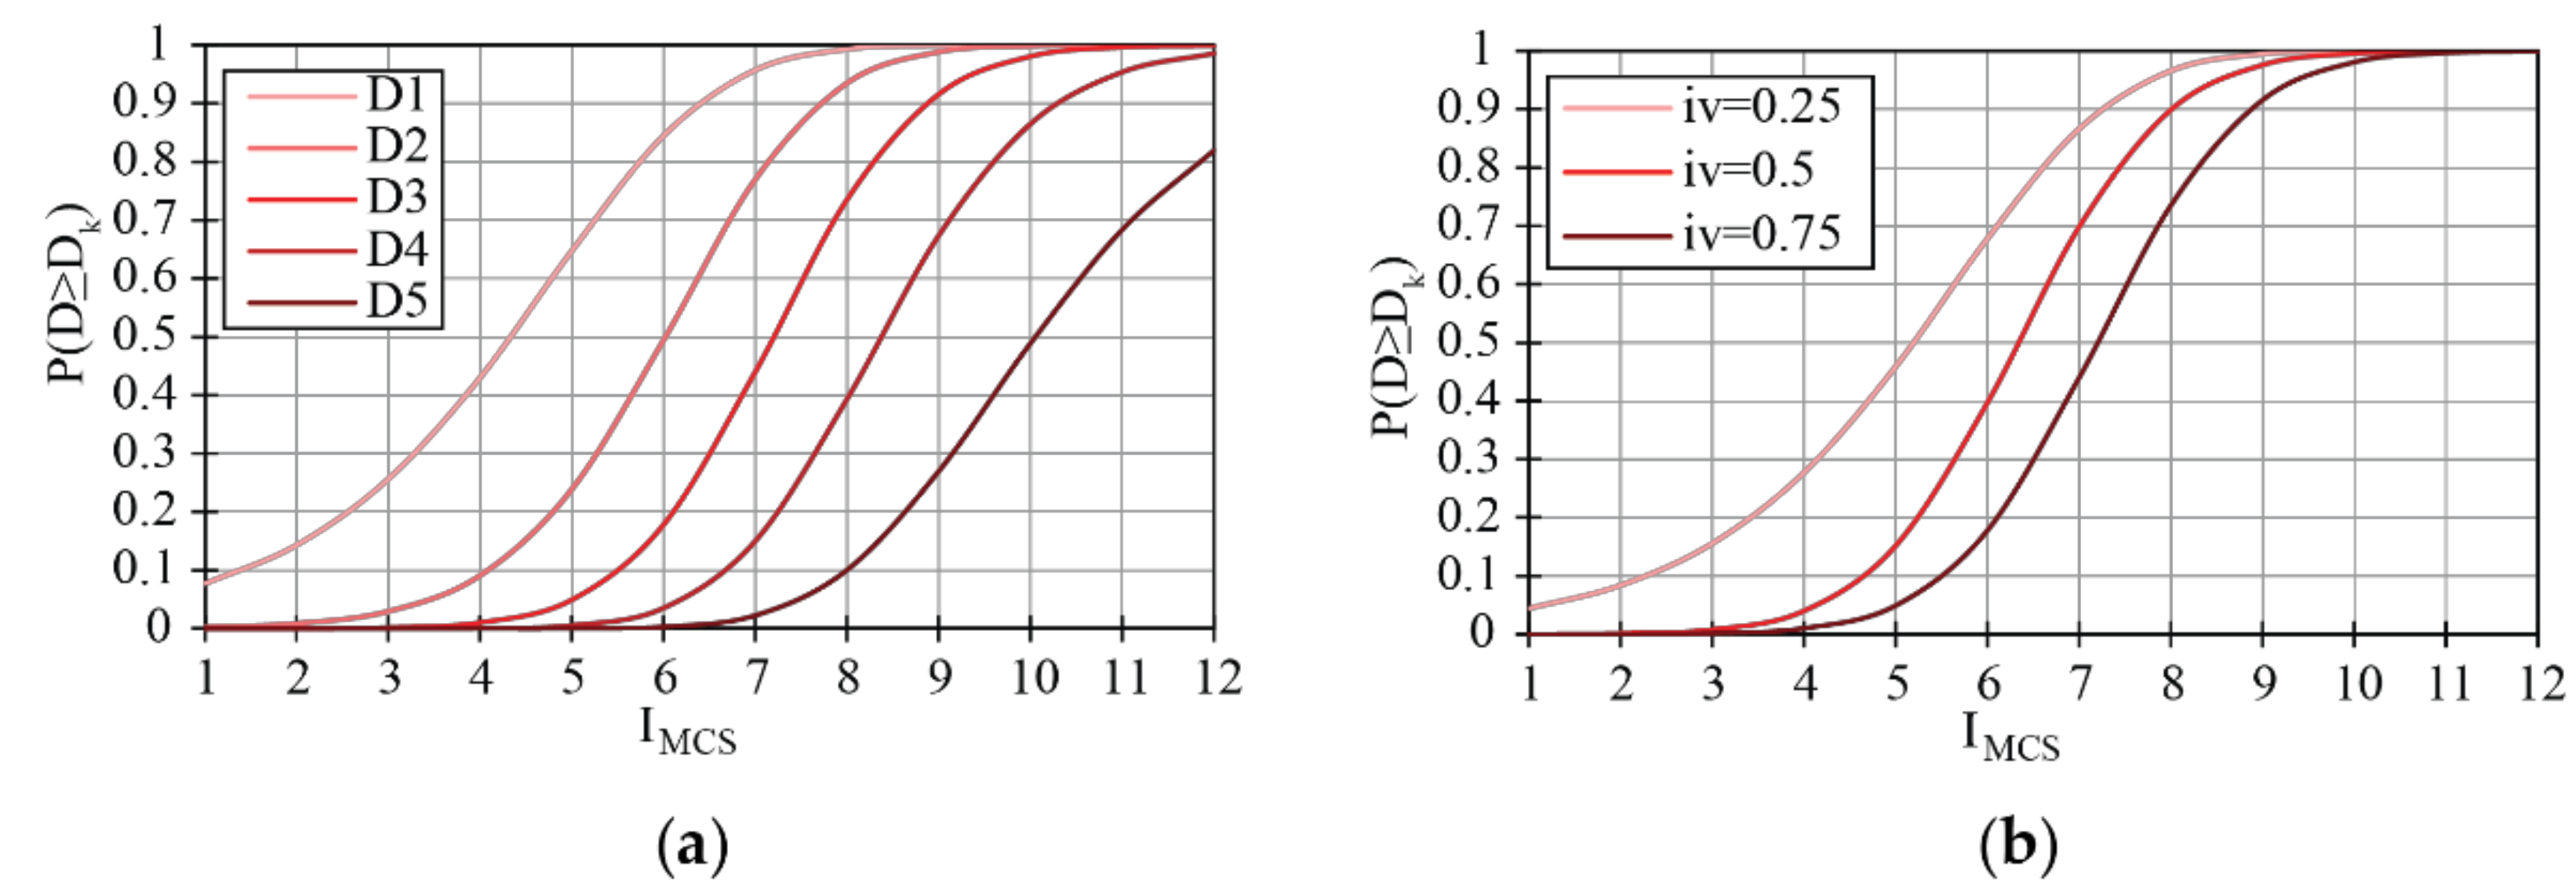
3.1. Empirical and Statistical Methods: EL0
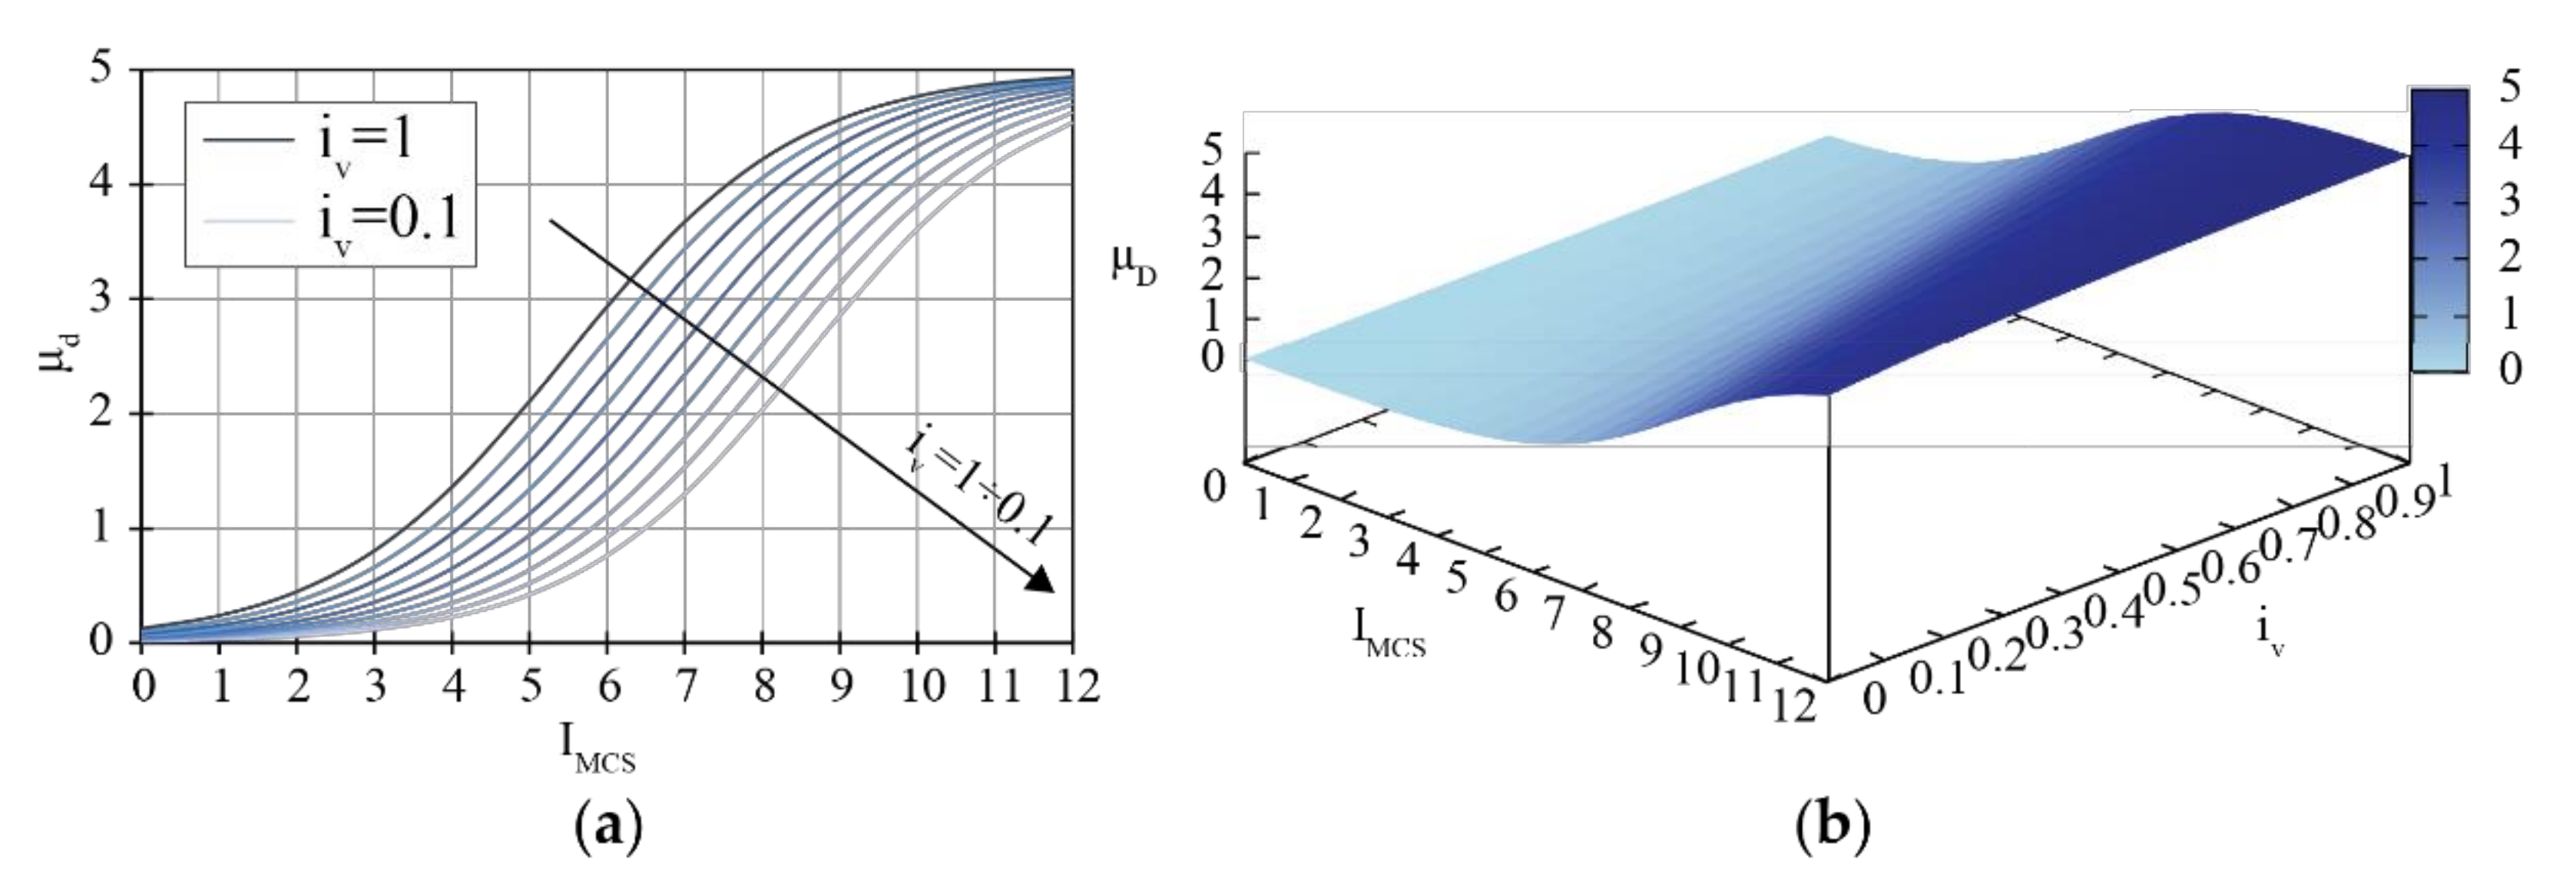
3.1.1. From Observed Damage to Predictive Models: Fragility and Vulnerability Functions
3.1.2. Vulnerability Assessment: EL0 Methods and Applications
3.2. Simplified Mechanical, Statistical and Qualitative Models: EL1
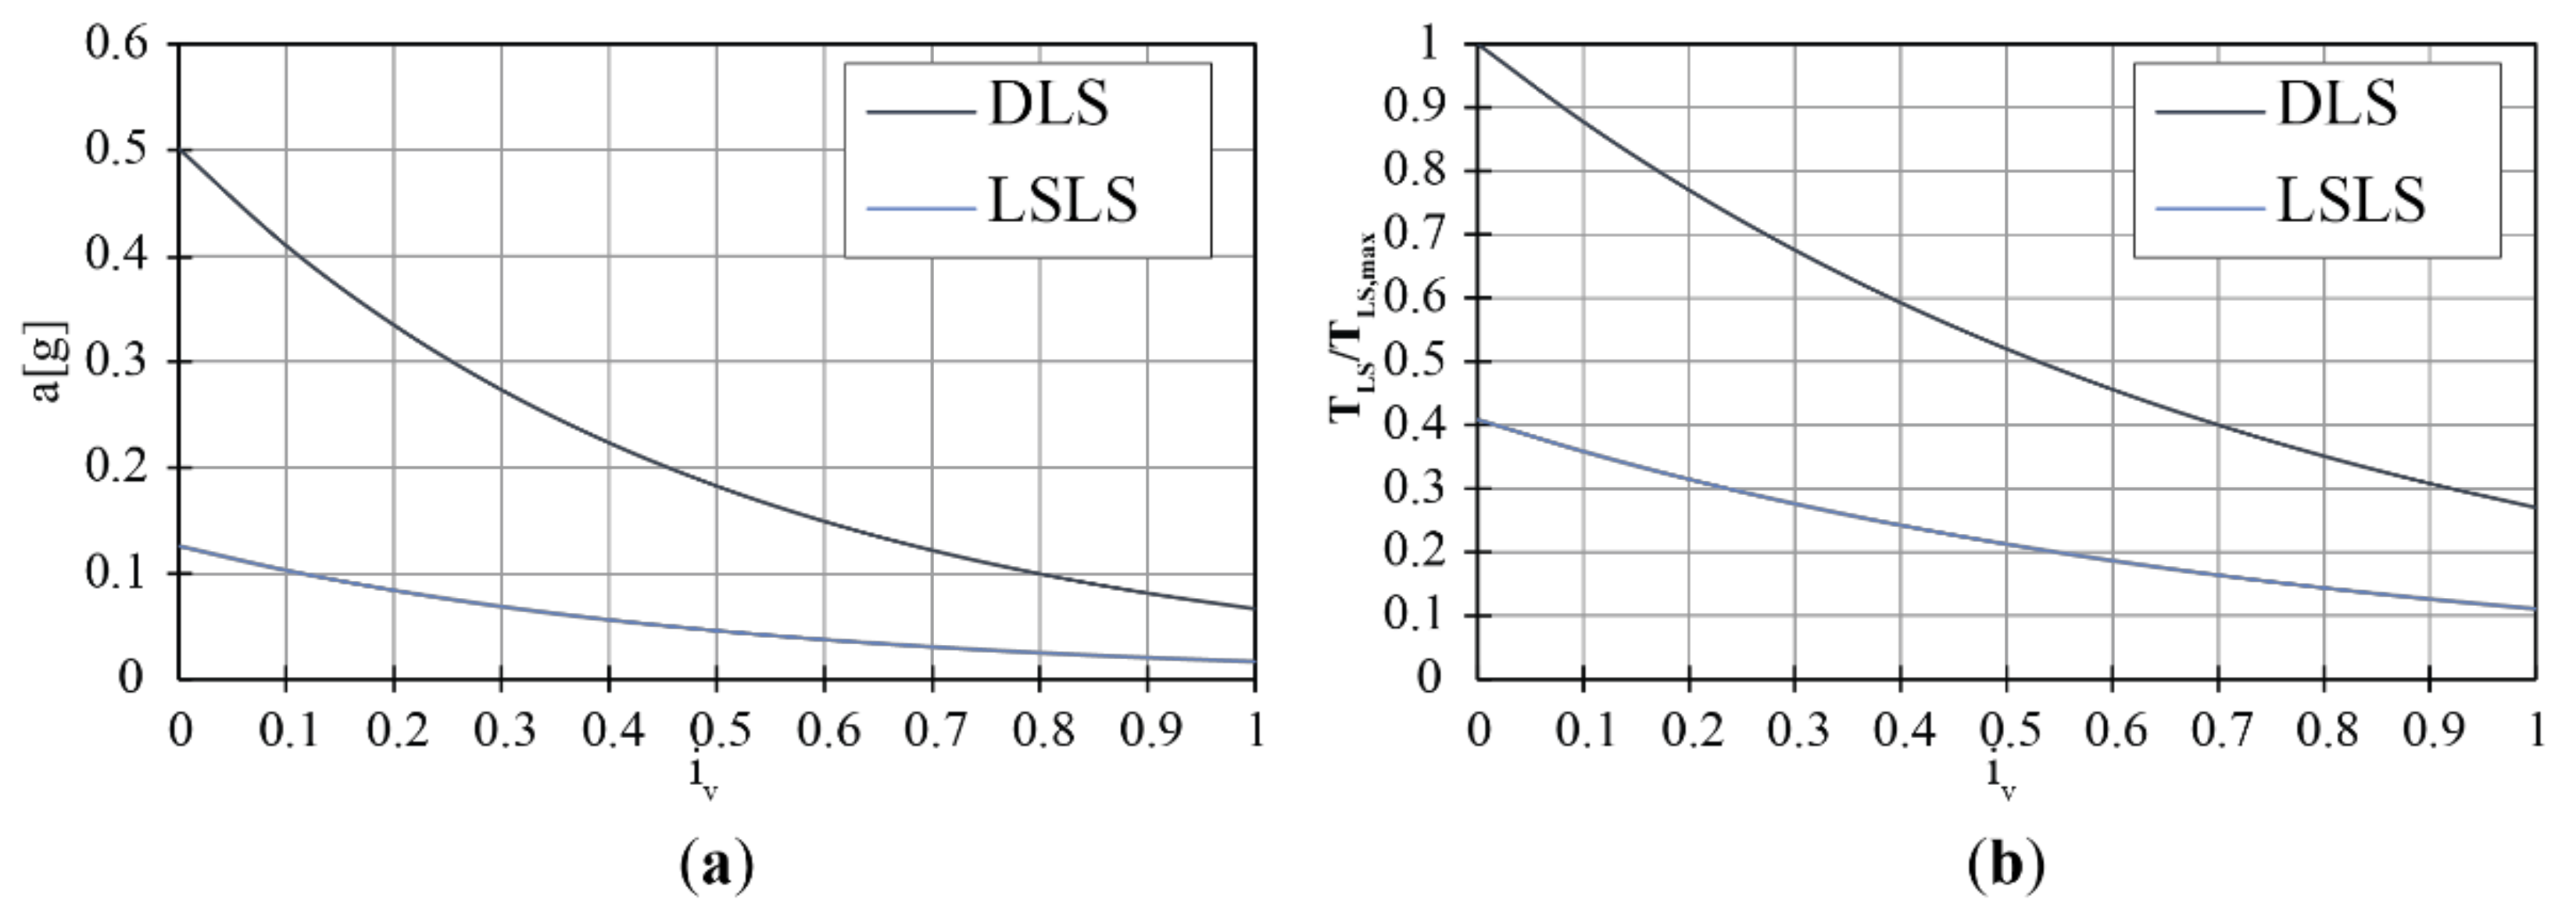
3.2.1. Safety Assessment
- The Life Safety Limit State (LSLS), which is considered attained when the building, after a seismic event, experiences collapse of nonstructural elements and relevant damage of the structural components, thus provoking a significant loss of global stiffness with respect to horizontal actions.
- The Damage Limit State (DLS), which is considered attained when the building, after a seismic event, experiences a global damage level (including both structural and non-structural elements) so that the safety of people and the capacity of the structure in bearing vertical and horizontal loads are not endangered.
- The Damage Limit State for Artistic Assets (ALS), which is considered attained when the artistic assets (such as such as frescoes, wall paintings, stone carving, etc.) in the building suffer low damage so that they can be restored without a significant loss of their cultural value.
3.2.2. Vulnerability Assessment: EL1 Methods and Applications
4. Building Scale Approaches: EL2 and EL3
4.1. Assessment Based on Limit Analysis Concept: EL2
4.1.1. Field of Applications and Fundamentals of Limit Analysis
4.1.2. Limit Analysis by Means of Kinematic Approach
4.2. Detail Global Seismic Assessment: EL3
4.2.1. General
4.2.2. Numerical Models and Fields of Application
- the representation of masonry, i.e., detailed or simplified micromodelling and macromodelling [51].
4.2.3. Types of Analysis and Typical Issues
5. Critical Discussion and Proposal of a Smart Management Policy
5.1. Inclusion of Strengthening Solutions
5.2. Pros and Cons of Different Detail Levels
5.3. Proposal of a Smart Management Policy
6. Conclusions
Author Contributions
Funding
Institutional Review Board Statement
Data Availability Statement
Acknowledgments
Conflicts of Interest
References
- Despotaki, V.; Silva, V.; Lagomarsino, S.; Pavlova, I.; Torres, J. Evaluation of Seismic Risk on UNESCO Cultural Heritage sites in Europe. Int. J. Archit. Herit. 2018, 12, 1231–1244. [Google Scholar] [CrossRef]
- Lagomarsino, S. On the vulnerability assessment of monumental buildings. Bull. Earthq. Eng. 2006, 4, 445–463. [Google Scholar] [CrossRef]
- Valente, M.; Milani, G. Seismic response and damage patterns of masonry churches: Seven case studies in Ferrara, Italy. Eng. Struct. 2018, 177, 809–835. [Google Scholar] [CrossRef]
- dei Ministri, P.D.C. Valutazione e Riduzione del Rischio Sismico del Patrimonio Culturale con Riferimento alle Norme Tecniche per le Costruzioni di Cui al D.M. 14/01/2008; G.U. No. 47; Ministero per i Beni e le Attività Culturali: Rome, Italy, 2011. (In Italian) [Google Scholar]
- Burton, H.V.; Deierlein, G.; Lallemant, D.; Lin, T. Framework for Incorporating Probabilistic Building Performance in the Assessment of Community Seismic Resilience. J. Struct. Eng. 2016, 142, C4015007. [Google Scholar] [CrossRef] [Green Version]
- Vona, M.; Mastroberti, M.; Mitidieri, L.; Tataranna, S. New resilience model of communities based on numerical evaluation and observed post seismic reconstruction process. Int. J. Disaster Risk Reduct. 2018, 28, 602–609. [Google Scholar] [CrossRef]
- Lagomarsino, S.; Podestà, S. Seismic Vulnerability of Ancient Churches: I. Damage Assessment and Emergency Planning. Earthq. Spectra 2004, 20, S377–S394. [Google Scholar] [CrossRef]
- Lagomarsino, S.; Podestà, S. Damage and Vulnerability Assessment of Churches after the 2002 Molise, Italy, Earthquake. Earthq. Spectra 2004, 20, S271–S283. [Google Scholar] [CrossRef]
- D’Ayala, D.; Paganoni, S. Assessment and analysis of damage in L’Aquila historic city centre after 6th April 2009. Bull. Earthq. Eng. 2011, 9, 81–104. [Google Scholar] [CrossRef]
- Lagomarsino, S. Damage assessment of churches after L’Aquila earthquake. Bull. Earthq. Eng. 2012, 10, 73–92. [Google Scholar] [CrossRef]
- Da Porto, F.; Silva, B.; Costa, C.; Modena, C. Macro-scale analysis of damage to churches after earthquake in Abruzzo (Italy) on April 6, 2009. J. Earthq. Eng. 2012, 16, 739–758. [Google Scholar] [CrossRef]
- De Matteis, G.; Criber, E.; Brando, G. Damage Probability Matrices for Three- Nave Masonry Churches in Abruzzi After the 2009 L’Aquila Earthquake. Int. J. Archit. Herit. 2016, 10, 120–145. [Google Scholar]
- Sorrentino, L.; Liberatore, L.; Decanini, L.D.; Liberatore, D. The performance of churches in the 2012 Emilia earthquakes. Bull. Earthq. Eng. 2014, 12, 2299–2331. [Google Scholar] [CrossRef]
- Cescatti, E.; Salzano, P.; Casapulla, C.; Ceroni, F.; Da Porto, F.; Prota, A. Damages to masonry churches after 2016–2017 Central Italy seismic sequence and definition of fragility curves. Bull. Earthq. Eng. 2020, 18, 297–329. [Google Scholar] [CrossRef]
- Hofer, L.; Zampieri, P.; Zanini, M.A.; Faleschini, F.; Pellegrino, C. Seismic damage survey and empirical fragility curves for churches after the August 24, 2016 Central Italy earthquake. Soil Dyn. Earthq. Eng. 2018, 111, 98–109. [Google Scholar] [CrossRef]
- Penna, A.; Calderini, C.; Sorrentino, L.; Carocci, C.F.; Cescatti, E.; Sisti, R.; Borri, A.; Modena, C.; Prota, A. Damage to churches in the 2016 central Italy earthquakes. Bull. Earthq. Eng. 2019, 17, 5763–5790. [Google Scholar] [CrossRef]
- De Matteis, G.; Zizi, M. Seismic Damage Prediction of Masonry Churches by a PGA-based Approach. Int. J. Archit. Herit. 2019, 13, 1165–1179. [Google Scholar] [CrossRef]
- Salzano, P.; Casapulla, C.; Ceroni, F.; Prota, A. Seismic Vulnerability and Simplified Safety Assessments of Masonry Churches in the Ischia Island (Italy) after the 2017 Earthquake. Int. J. Archit. Herit. 2020, 1–27. [Google Scholar] [CrossRef]
- Claudia, N.; Cancino, C. Damage assessment of historic earthen sites after the 2007 earthquake in Peru. Adv. Mater. Res. 2010, 133–134, 665–670. [Google Scholar] [CrossRef]
- D’Ayala, D.; Benzoni, G. Historic and traditional structures during the 2010 Chile Earthquake: Observations, codes, and conservation strategies. Earthq. Spectra 2012, 28, S425–S451. [Google Scholar] [CrossRef]
- Palazzi, N.C.; Favier, P.; Rovero, L.; Sandoval, C.; De La Llera, J.C. Seismic damage and fragility assessment of ancient masonry churches located in central Chile. Bull. Earthq. Eng. 2020, 18, 3433–3457. [Google Scholar] [CrossRef]
- Leite, J.; Lourenco, P.B.; Ingham, J.M. Statistical assessment of damage to churches affected by the 2010–2011 Canterbury (New Zealand) earthquake sequence. J. Earthq. Eng. 2013, 17, 73–97. [Google Scholar] [CrossRef] [Green Version]
- Marotta, A.; Sorrentino, L.; Liberatore, D.; Ingham, J.M. Vulnerability Assessment of Unreinforced Masonry Churches Following the 2010-2011 Canterbury Earthquake Sequence. J. Earthq. Eng. 2017, 21, 912–934. [Google Scholar] [CrossRef]
- Peña, F.; Chávez, M.M. Seismic behavior of Mexican colonial churches. Int. J. Archit. Herit. 2016, 10, 332–345. [Google Scholar] [CrossRef]
- Giuffrè, A. Restauro e Sicurezza in Zona Sismica. La Cattedrale di S. Angelo dei Lombardi; Nuova serie 1; Palladio: Rome, Italy, 1998; pp. 95–120. (In Italian) [Google Scholar]
- Grünthal, G.; Musson, R.M.W.; Schwarz, J.; Stucchi, M. (Eds.) European Macroseismic Scale 1998. (EMS-98). In Cahiers du Centre Européen de Géodynamique et de Séismologie; Centre Européen de Géodynamique et de Séismologie: Luxembourg, 1998; volume 15, p. 99. [Google Scholar] [CrossRef]
- D’Amato, M.; Laterza, M.; Diaz Fuentes, D. Simplified Seismic Analyses of Ancient Churches in Matera’s Landscape. Int. J. Archit. Herit. 2020, 14, 119–138. [Google Scholar] [CrossRef]
- Braga, F.; Dolce, M.; Liberatore, D. A Statistical Study on Damaged Buildings and an Ensuing Review of the MSK-76 Scale. In Proceedings of the Seventh European Conference on Earthquake Engineering, Athens, Greece, 20–25 September 1982; pp. 431–450. [Google Scholar]
- Lagomarsino, S.; Podestà, S. Seismic Vulnerability of Ancient Churches: II. Statistical Analysis of Surveyed Data and Methods for Risk Analysis. Earthq. Spectra 2004, 20, S395–S412. [Google Scholar] [CrossRef]
- Bernardini, A.; Lagomarsino, S. The seismic vulnerability of architectural heritage. Proc. Inst. Civ. Eng. Struct. Build. 2008, 161, 171–181. [Google Scholar] [CrossRef]
- Canuti, C.; Carbonari, S.; Dall’Asta, A.; Dezi, L.; Gara, F.; Leoni, G.; Morici, M.; Petrucci, E.; Prota, A.; Zona, A. Post-Earthquake Damage and Vulnerability Assessment of Churches in the Marche Region Struck by the 2016 Central Italy Seismic Sequence. Int. J. Archit. Herit. 2021, 15, 1000–1021. [Google Scholar] [CrossRef]
- De Matteis, G.; Brando, G.; Corlito, V. Predictive model for seismic vulnerability assessment of churches based on the 2009 L’Aquila earthquake. Bull. Earthq. Eng. 2019, 17, 4909–4936. [Google Scholar] [CrossRef]
- Lagomarsino, S.; Giovinazzi, S. Macroseismic and mechanical models for the vulnerability and damage assessment of current buildings. Bull. Earthq. Eng. 2006, 4, 415–443. [Google Scholar] [CrossRef]
- Sandi, H.; Floricel, I. Analysis of seismic risk affecting the existing building stock. In Proceedings of the 10th European Conference on Earthquake Engineering, Vienna, Austria, 28 August–2 September 1994; A.A. Balkema: Rotterdam, The Netherlands, 1994; Volume 2, pp. 1105–1110. [Google Scholar]
- Brandonisio, G.; Lucibello, G.; Mele, E.; De Luca, A. Damage and performance evaluation of masonry churches in the 2009 L’Aquila earthquake. Eng. Fail. Anal. 2013, 34, 693–714. [Google Scholar] [CrossRef]
- Lagomarsino, S.; Cattari, S.; Ottonelli, D.; Giovinazzi, S. Earthquake damage assessment of masonry churches: Proposal for rapid and detailed forms and derivation of empirical vulnerability curves. Bull. Earthq. Eng. 2019, 17, 3327–3364. [Google Scholar] [CrossRef]
- Faenza, L.; Michelini, A. Regression analysis of MCS intensity and ground motion parameters in Italy and its application in ShakeMap. Geophys. J. Int. 2010, 180, 1138–1152. [Google Scholar] [CrossRef] [Green Version]
- Masi, A.; Lagomarsino, S.; Dolce, M.; Manfredi, V.; Ottonelli, D. Towards the updated Italian seismic risk assessment: Exposure and vulnerability modelling. Bull. Earthq. Eng. 2021, 19, 3253–3286. [Google Scholar] [CrossRef]
- Mouroux, P.; Le Brun, B. Presentation of RISK-UE Project. Bull. Earthq. Eng. 2006, 4, 323–339. [Google Scholar] [CrossRef]
- Goded, T.; Lewis, A.; Stirling, M. Seismic vulnerability scenarios of Unreinforced Masonry churches in New Zeland. Bull. Earthq. Eng. 2018, 16, 3957–3999. [Google Scholar] [CrossRef]
- National Group for Earthquakes Defense (GNDT). First and Second Level Form for Exposure, Vulnerability and Damage Survey (Masonry and Reinforced Concrete); GNDT: Rome, Italy, 1994. [Google Scholar]
- Lourenço, P.B.; Roque, J.A. Simplified indexes for the seismic vulnerability of ancient masonry buildings. Constr. Build. Mater. 2006, 20, 200–208. [Google Scholar] [CrossRef] [Green Version]
- Palazzi, N.C.; Rovero, L.; De La Llera, J.C.; Sandoval, C. Preliminary assessment on seismic vulnerability of masonry churches in central Chile. Int. J. Archit. Herit. 2019, 14, 829–848. [Google Scholar] [CrossRef]
- Heyman, J. The Masonry Arch; Ellis Horwood Ltd.: Chichester, UK, 1982. [Google Scholar]
- De La Hire, P. Sur la construction des voûtes dans les édifices. In Mémoires de l’Académie Royale des Sciences de Paris; Académie Royale des Sciences: Paris, France, 1712. (In French) [Google Scholar]
- Mèry, E. Sur l’equilibre des voutes en berceu. In Annales de Ponts et Chaussess; PYC Édition: Paris, France, 1840. (In French) [Google Scholar]
- Criber, E.; Brando, G.; De Matteis, G. The effects of L’Aquila earthquake on the St. Gemma church in Goriano Sicoli: Part I: Damage survey and kinematic analysis. Bull. Earthq. Eng. 2015, 13, 3713–3732. [Google Scholar] [CrossRef]
- Cavalagli, N.; Gusella, V.; Severini, L. Lateral loads carrying capacity and minimum thickness of circular and pointed masonry arches. Int. J. Mech. Sci. 2016, 115–116, 645–656. [Google Scholar] [CrossRef]
- Brandonisio, G.; Mele, E.; De Luca, A. Limit analysis of masonry circular buttressed arches under horizontal loads. Meccanica 2017, 52, 2547–2565. [Google Scholar] [CrossRef]
- Zizi, M.; Cacace, D.; Rouhi, J.; Lourenço, P.B.; De Matteis, G. Automatic procedures for the safety assessment of stand-alone masonry arches. Int. J. Archit. Herit. 2021, 1–19. [Google Scholar] [CrossRef]
- Lourenço, P.B. Computational Strategies for Masonry Structures. Ph.D. Thesis, University of Porto, Porto, Portugal, 1996. [Google Scholar]
- Roca, P.; Molins, C.; Mari, A.R. Strength capacity of masonry wall structures by the equivalent frame method. J. Struct. Eng. 2005, 131, 1601–1610. [Google Scholar] [CrossRef]
- Lagomarsino, S.; Penna, A.; Galasco, A.; Cattari, S. TREMURI program: An equivalent frame model for the nonlinear seismic analysis of masonry buildings. Eng. Struct. 2013, 56, 1787–1799. [Google Scholar] [CrossRef]
- Dejong, M.J.; Beletti, B.; Hendriks, M.A.N.; Rots, J.G. Shell elements for sequentially linear analysis: Lateral failure of masonry structures. Eng. Struct. 2009, 31, 1382–1392. [Google Scholar] [CrossRef]
- Noor-E-Khuda, S.; Dhanasekar, M.; Thambiratnam, D.P. An explicit finite element modelling method for masonry walls under out-of-plane loading. Eng. Struct. 2016, 113, 103–120. [Google Scholar] [CrossRef] [Green Version]
- Casolo, S.; Milani, G. Semplified out-of-plane modelling of three-leaf masonry walls accounting for the material texture. Constr. Build. Mater. 2013, 40, 330–351. [Google Scholar] [CrossRef]
- Betti, M.; Galano, L.; Vignoli, A. Finite Element Modelling for Seismic Assessment of Historic Masonry Buildings. In Earthquakes and Their Impact on Society; D’Amico, S., Ed.; Springer: Cham, Switzerland, 2013; pp. 377–415. [Google Scholar]
- Borst, R.; Remmers, J.; Needleman, A.; Abellan, M.A. Discrete vs smeared crack models for concrete fracture: Bridging the gap. Int. J. Numer. Anal. Methods Geomech. 2004, 28, 583–607. [Google Scholar] [CrossRef]
- Alfarah, B.; López-Almansa, F.; Oller, S. New methodology for calculating damage variables evolution in Plastic Damage Model for RC structures. Eng. Struct. 2017, 132, 70–86. [Google Scholar] [CrossRef] [Green Version]
- Betti, M.; Vignoli, A. Numerical assessment of the static and seismic behaviour of the basilica of Santa Maria all’Impruneta (Italy). Constr. Build. Mater. 2011, 25, 4308–4324. [Google Scholar] [CrossRef]
- Formisano, A.; Vaiano, G.; Fabbrocino, F.; Milani, G. Seismic vulnerability of Italian masonry churches: The case of the Nativity of Blessed Virgin Mary in Stellata of Bondeno. J. Build. Eng. 2018, 20, 179–200. [Google Scholar] [CrossRef]
- Grazzini, A.; Chiarabrando, F.; Foti, S.; Sammartano, G.; Spanò, A. Multidisciplinary Study on the Seismic Vulnerability of St. Agostino Church in Amatrice following the 2016 Seismic Sequence. Int. J. Archit. Herit. 2020, 14, 885–902. [Google Scholar] [CrossRef]
- De Matteis, G.; Mazzolani, F.M. The Fossanova Church: Seismic Vulnerability Assessment by Numeric and Physical Testing. Int. J. Archit. Herit. 2010, 4, 222–245. [Google Scholar] [CrossRef]
- Kujawa, M.; Lubowiecka, I.; Szymczak, C. Finite element modelling of a historic church structure in the context of a masonry damage analysis. Eng. Fail. Anal. 2020, 107, 104233. [Google Scholar] [CrossRef]
- Karanikoloudis, G.; Lourenço, P.B. Structural assessment and seismic vulnerability of earthen historic structures. Application of sophisticated numerical and simple analytical models. Eng. Struct. 2018, 160, 488–509. [Google Scholar] [CrossRef] [Green Version]
- Alforno, M.; Monaco, A.; Venuti, F.; Calderini, C. Validation of simplified micro-models for the static analysis of masonry arches and vaults. Int. J. Archit. Her. 2021, 15, 1196–1212. [Google Scholar] [CrossRef]
- Gaetani, A.; Bianchini, N.; Lourenço, P.B. Simplified micro-modelling of masonry cross vaults: Stereotomy and interface issues. Int. J. Mason. Res. Innov. 2021, 6, 97–125. [Google Scholar] [CrossRef]
- Milani, G.; Valente, M. Comparative pushover and limit analyses on seven masonry churches damaged by the 2012 Emilia-Romagna (Italy) seismic events: Possibilities of non-linear finite elements compared with pre-assigned failure mechanisms. Eng. Fail. Anal. 2015, 47, 129–161. [Google Scholar] [CrossRef]
- Betti, M.; Vignoli, A. Modelling analysis of a Romanesque church under earthquake loading: Assessment of seismic resistance. Eng. Struct. 2008, 30, 352–367. [Google Scholar] [CrossRef]
- Addessi, D.; Marfia, S.; Sacco, E. A plastic nonlocal damage model. Comput. Methods Appl. Mech. Eng. 2002, 19, 1291–1310. [Google Scholar] [CrossRef]
- Trovalusci, P.; Masiani, R. Non-linear micropolar and classical continua for anisotropic discontinuous materials. Int. J. Solids Struct. 2003, 40, 1281–1297. [Google Scholar] [CrossRef]
- Petracca, M.; Pelà, L.; Rossi, R.; Oller, S.; Camata, G.; Spacone, E. Regularization of first order computational homogeni-zation for multiscale analysis of masonry structures. Comput. Mech. 2016, 57, 257–276. [Google Scholar] [CrossRef] [Green Version]
- Cundall, P.A.; Strack, O.D.L. A discrete numerical model for granular assemblies. Géotechnique 1979, 29, 47–65. [Google Scholar] [CrossRef]
- Pulatsu, B.; Ercdogmus, E.; Lourenço, P.B.; Lemos, V.; Tuncay, K. Simulation of the in-plane structural behavior of unreinforced masonry walls and buildings using DEM. Structures 2020, 27, 2274–2287. [Google Scholar] [CrossRef]
- Foti, D.; Vacca, V.; Facchini, I. DEM modeling and experimental analysis of the static behavior of a dry-joints masonry cross vaults. Constr. Build. Mater. 2018, 170, 111–120. [Google Scholar] [CrossRef]
- Mclnerney, J.; Dejong, M.J. Discrete Element Modeling of Groin Vault Displacement Capacity. Int. J. Archit. Her. 2015, 9, 1037–1049. [Google Scholar] [CrossRef]
- Lemos, J.V. Discrete Element Modeling of the Seismic Behavior of Masonry Construction. Buildings 2019, 9, 43. [Google Scholar] [CrossRef] [Green Version]
- Gonen, S.; Pulatsu, B.; Erdogmus, E.; Karaesmen, E.; Karaesmen, E. Quasi-Static Nonlinear Seismic Assessment of a Fourth Century, A.D. Roman Aqueduct in Istanbul, Turkey. Heritage 2021, 4, 401–421. [Google Scholar] [CrossRef]
- Ferrante, A.; Loverdos, D.; Clementi, F.; Milani, G.; Formisano, A.; Lenci, S.; Sarhosis, V. Discontinuous approaches for nonlinear dynamic analyses of an ancient masonry tower. Eng. Struct. 2021, 230, 111626. [Google Scholar] [CrossRef]
- Pantò, B.; Cannizzaro, F.; Caddemi, S.; Caliò, I. 3D macro-element modelling approach for seismic assessment of historical masonry churches. Adv. Eng. Softw. 2016, 97, 40–59. [Google Scholar] [CrossRef]
- Zizi, M.; Corlito, V.; Lourenço, P.B.; De Matteis, G. Seismic vulnerability of masonry churches in Abruzzi region, Italy. Structures 2021, 32, 662–680. [Google Scholar] [CrossRef]
- Yacila, J.; Camata, G.; Salsavilca, J.; Tarque, N. Pushover analysis of confined masonry walls using a 3D macro-modelling approach. Eng. Struct. 2019, 201, 109731. [Google Scholar] [CrossRef]
- Jain, A.; Acito, M.; Chesi, C. Seismic sequence of 2016–17: Linear and non-linear interpretation models for evolution of damage in San Francesco church, Amatrice. Eng. Struct. 2020, 211, 110418. [Google Scholar] [CrossRef]
- Papa, G.S.; Tateo, V.; Parisi, M.A.; Casolo, S. Seismic response of a masonry church in Central Italy: The role of interventions on the roof. Bull. Earthq. Eng. 2021, 19, 1151–1179. [Google Scholar] [CrossRef]
- Milani, G.; Shehu, R.; Valente, M. A kinematic limit analysis approach for seismic retrofitting of masonry towers through steel tie-rods. Eng. Struct. 2018, 160, 212–228. [Google Scholar] [CrossRef]
- Chisari, C.; Cacace, D.; De Matteis, G. Parametric Investigation on the Effectiveness of FRM-Retrofitting in Masonry Buttressed Arches. Buildings 2021, 11, 406. [Google Scholar] [CrossRef]
- Lourenço, P.B.; Ciocci, M.P.; Greco, F.; Karanikoloudis, G.; Cancino, C.; Torrealva, D.; Wong, K. Traditional techniques for the rehabilitation and protection of historic earthen structures: The seismic retrofitting project. Int. J. Archit. Her. 2019, 13, 15–32. [Google Scholar] [CrossRef]
- Milani, G.; Shehu, R.; Valente, M. Possibilities and limitations of innovative retrofitting for masonry churches: Advanced computations on three case studies. Constr. Build. Mater. 2017, 147, 239–263. [Google Scholar] [CrossRef]
- Angjeliu, G.; Coronelli, D.; Cardani, G.; Boothby, T. Structural assessment of iron tie rods based on numerical modelling and experimental observations in Milan Cathedral. Eng. Struct. 2020, 206, 109690. [Google Scholar] [CrossRef]
- Chiozzi., A.; Grillanda, N.; Milani, G.; Tralli, A. UB-ALMANAC: An adaptive limit analysis NURBS-based program for the automatic assessment of partial failure mechanisms in masonry churches. Eng. Fail. Anal. 2018, 85, 201–220. [Google Scholar] [CrossRef]
- Portioli, F.; Casapulla, C.; Gilbert, M.; Cascini, L. Limit analysis of 3D masonry block structures with non-associative frictional joints using cone programming. Comput. Struct. 2014, 143, 108–121. [Google Scholar] [CrossRef]
- Li, H.X.; Yu, H.S. Kinematic limit analysis of frictional materials using nonlinear programming. Int. J. Solids Struct. 2005, 42, 4058–4076. [Google Scholar] [CrossRef]
- Funari, M.F.; Spadea, S.; Lonetti, P.; Fabbrocino, F.; Luciano, R. Visual programming for structural assessment of out-of-plane mechanisms in historic masonry structures. J. Build. Eng. 2020, 31, 101425. [Google Scholar] [CrossRef]
- Shakya, M.; Varum, H.; Vicente, R.; Costa, A. Seismic vulnerability assessment methodology for slender masonry structures. Int. J. Archit. Herit. 2018, 12, 1297–1326. [Google Scholar] [CrossRef]
- Cattari, S.; Magenes, G. Benchmarking the software packages to model and assess the seismic response of unreinforced masonry existing buildings through nonlinear static analyses. Bull. Earthq. Eng. 2021. [Google Scholar] [CrossRef]
- Zizi, M.; Chisari, C.; Rouhi, J.; De Matteis, G. Comparative analysis on macroscale material models for the prediction of masonry in-plane behavior. Bull. Earth. Eng. 2021, 1–34. [Google Scholar] [CrossRef]
- Chisari, C.; Macorini, L.; Amadio, C.; Izzuddin, B.A. Identification of mesoscale model parameters for brick-masonry. Int. J. Solids Struct. 2018, 146, 224–240. [Google Scholar] [CrossRef]
- Gentile, C.; Saisi, A.; Cabboi, A. Structural identification of a masonry tower based on operational modal analysis. Int. J. Archit. Herit. 2015, 9, 98–110. [Google Scholar] [CrossRef]
- Ramos, L.F.; Marques, L.; Lourenço, P.B.; De Roeck, G.; Campos-Costa, A.; Roque, J. Monitoring historical masonry structures with operational modal analysis: Two case studies. Mech. Syst. Signal Process. 2010, 24, 1291–1305. [Google Scholar] [CrossRef] [Green Version]
- Aloisio, A.; Di Pasquale, A.; Alaggio, R.; Fragiacomo, M. Assessment of Seismic Retrofitting Interventions of a Masonry Palace Using Operational Modal Analysis. Int. J. Archit. Herit. 2020, 1–13. [Google Scholar] [CrossRef]
- Pellegrini, D.; Girardi, M.; Lourenço, P.B.; Masciotta, M.G.; Mendes, N.; Padovani, C.; Ramos, L.F. Modal analysis of historical masonry structures: Linear perturbation and software benchmarking. Constr. Build. Mater. 2018, 189, 1232–1250. [Google Scholar] [CrossRef]


| Macro-Element | Damage Mechanism |
|---|---|
| Façade | M1. Façade overturning |
| M2. Overturning of the top façade | |
| M3. In-plane mechanism of façade | |
| Naves | M4. Narthex |
| M5. Transversal response | |
| M6. Shear mechanisms in the lateral walls | |
| M7. Longitudinal response | |
| M8. Central nave vaults | |
| M9. Aisles vaults | |
| Transept | M10. Overturning of the transept façade |
| M11. Shear mechanisms in the transept wall | |
| M12. Transept vaults | |
| Triumphal arch | M13. Triumphal arch |
| Dome | M14. Dome |
| M15. Lantern | |
| Apse | M16. Apse overturning |
| M17. Shear mechanisms in the apse | |
| M18. Apse vaults | |
| Roof | M19. Mechanisms in nave roof |
| M20. Mechanisms in transept roof | |
| M21. Mechanisms in apse roof | |
| Chapels and annexed bodies | M22. Chapel overturning |
| M23. Shear mechanisms in chapels | |
| M24. Chapel vaults | |
| M25. Plain-height irregularities | |
| Bell tower | M26. Decorations |
| M27. Bell tower | |
| M28. Belfry |
| Classification of Damage to Masonry Buildings | |
|---|---|
 | Grade 1: Negligible to slight damage (no structural damage, slight non-structural damage) |
| Hair-line cracks in very few walls. | |
| Fall of small pieces of plaster only. | |
| Fall of loose stones from upper parts of buildings in very few cases. | |
 | Grade 2: Moderate damage (slight structural damage, moderate non-structural damage). |
| Cracks in many walls. | |
| Fall of fairly large pieces of plaster. | |
| Partial collapse of chimneys | |
 | Grade 3: Substantial to heavy damage (moderate structural damage, heavy non-structural damage) |
| Large and extensive cracks in most walls. | |
| Roof tiles detach. | |
| Chimneys fracture at the roof line; failure of individual non-structural elements (partitions, gable walls). | |
 | Grade 4: Very heavy damage (heavy structural damage, very heavy non-structural damage) |
| Serious failure of walls. | |
| Partial structural failures of roofs and floors. | |
 | Grade 5: Destruction (very heavy structural damage) |
| Total or near total collapse. | |
| Dk | id | Description |
|---|---|---|
| 0 | id ≤ 0.05 | No damage: light damage only in one or two mechanisms |
| 1 | 0.05 < id ≤ 0.25 | Negligible to slight damage: light damage in some mechanisms |
| 2 | 0.25 < id ≤ 0.4 | Moderate damage: light damage in many mechanisms, with one or two mechanisms activated at medium level |
| 3 | 0.4 < id ≤ 0.6 | Substantial to heavy damage: many mechanisms have been activated at medium level, with severe damage in some mechanisms |
| 4 | 0.6 < id ≤ 0.8 | Very heavy damage: severe damage in many mechanisms, with the collapse of some macroelements of the church |
| 5 | id > 0.8 | Collapse: at least 2/3 of the mechanisms exhibit severe damage |
| Damage Mechanism | ρk,i | |||
|---|---|---|---|---|
| [8] | [4] | [17] | [27] | |
| M1. Façade overturning | 1 | 1 | 1 | 1 |
| M2. Overturning of the top façade | 1 | 1 | 1 | 1 |
| M3. In-plane mechanism of façade | 1 | 1 | 0.5 | 1 |
| M4. Narthex | 0.5 ÷ 1 | 0.5 | 0.25 | 0.9 |
| M5. Transversal response | 1 | 1 | 1 | 0.9 |
| M6. Shear mechanisms in the lateral walls | 1 | 1 | 1 | 0.9 |
| M7. Longitudinal response | 1 | 1 | 1 | 1 |
| M8. Central nave vaults | 1 | 1 | 0.75 | 1 |
| M9. Aisles vaults | 1 | 1 | 0.75 | 0.5 |
| M10. Overturning of the transept façade | 0.5 ÷ 1 | 0.5 ÷ 1 | 0.75 | 1 |
| M11. Shear mechanisms in the transept wall | 0.5 ÷ 1 | 0.5 ÷ 1 | 0.5 | 1 |
| M12. Transept vaults | 0.5 ÷ 1 | 0.5 ÷ 1 | 1 | 0.9 |
| M13. Triumphal arch | 1 | 1 | 1 | 1 |
| M14. Dome | 1 | 1 | 0.75 | 0.9 |
| M15. Lantern | 0.5 | 0.5 | 0.25 | 1 |
| M16. Apse overturning | 1 | 1 | 0.75 | 0.9 |
| M17. Shear mechanisms in the apse | 1 | 1 | 0.5 | 0.9 |
| M18. Apse vaults | 0.5 ÷ 1 | 0.5 ÷ 1 | 0.75 | 0.9 |
| M19. Mechanisms in nave roof | 1 | 1 | 0.5 | 0.9 |
| M20. Mechanisms in transept roof | 0.5 ÷ 1 | 0.5 ÷ 1 | 0.5 | 0.8 |
| M21. Mechanisms in apse roof | 1 | 1 | 0.5 | 1 |
| M22. Chapel overturning | 0.5 ÷ 1 | 0.5 ÷ 1 | 0.25 | 1 |
| M23. Shear mechanisms in chapels | 0.5 ÷ 1 | 0.5 ÷ 1 | 0.25 | 1 |
| M24. Chapel vaults | 0.5 ÷ 1 | 0.5 ÷ 1 | 0.5 | 1 |
| M25. Plain-height irregularities | 0.5 ÷ 1 | 0.5 ÷ 1 | 1 | 1 |
| M26. Decorations | 0.8 | 0.5 ÷ 1 | 0.25 | 0.9 |
| M27. Bell tower | 1 | 1 | 1 | 0.9 |
| M28. Belfry | 1 | 1 | 1 | 0.9 |
| Parameter | Vk | |||
|---|---|---|---|---|
| State of Maintenance | very bad = 0.08 | bad = 0.04 | Medium = 0 | good = −0.04 |
| Quality of Materials | bad = 0.04 | medium = 0 | good = −0.04 | |
| Planimetric Regularity | irregular = 0.04 | regular = 0 | symmetrical = −0.04 | |
| Regularity in elevation | irregular = 0.02 | regular = −0.02 | ||
| Interactions (aggregate) | corner position = 0.04 | isolated = 0 | included = −0.04 | |
| Retrofitting Interventions | effective interventions = −0.08 | |||
| Site Morphology | ridge = 0.08 | slope = 0.04 | flat = 0 | |
| Number of Vulnerability Indicators or Antiseismic Devices | Judgment of Effectiveness | vk |
|---|---|---|
| At least 1 | 3 | 3 |
| At least 2 | 2 | 3 |
| 1 | 2 | 2 |
| At least 2 | 1 | 2 |
| 1 | 1 | 1 |
| None | 0 | 0 |
| Evaluation Level (EL) | Pros | Cons |
|---|---|---|
| EL0 |
|
|
| EL1 |
|
|
| EL2 |
|
|
| EL3 |
|
|
Publisher’s Note: MDPI stays neutral with regard to jurisdictional claims in published maps and institutional affiliations. |
© 2021 by the authors. Licensee MDPI, Basel, Switzerland. This article is an open access article distributed under the terms and conditions of the Creative Commons Attribution (CC BY) license (https://creativecommons.org/licenses/by/4.0/).
Share and Cite
Zizi, M.; Rouhi, J.; Chisari, C.; Cacace, D.; De Matteis, G. Seismic Vulnerability Assessment for Masonry Churches: An Overview on Existing Methodologies. Buildings 2021, 11, 588. https://doi.org/10.3390/buildings11120588
Zizi M, Rouhi J, Chisari C, Cacace D, De Matteis G. Seismic Vulnerability Assessment for Masonry Churches: An Overview on Existing Methodologies. Buildings. 2021; 11(12):588. https://doi.org/10.3390/buildings11120588
Chicago/Turabian StyleZizi, Mattia, Jafar Rouhi, Corrado Chisari, Daniela Cacace, and Gianfranco De Matteis. 2021. "Seismic Vulnerability Assessment for Masonry Churches: An Overview on Existing Methodologies" Buildings 11, no. 12: 588. https://doi.org/10.3390/buildings11120588
APA StyleZizi, M., Rouhi, J., Chisari, C., Cacace, D., & De Matteis, G. (2021). Seismic Vulnerability Assessment for Masonry Churches: An Overview on Existing Methodologies. Buildings, 11(12), 588. https://doi.org/10.3390/buildings11120588