Article

Influence of the Jeziorsko Dam Reservoir on Water Flow in the Warta River

1
National Water Holding Polish Waters, Regional Water Management Board in Poznań, Chlebowa 4/8, 61-003 Poznań, Poland
2
Institute of Meteorology and Water Management, National Research Institute, Podleśna 61, 01-673 Warszawa, Poland
3
Department of Hydrology and Water Management, Adam Mickiewicz University, Krygowskiego 10, 61-680 Poznań, Poland
4
Department of Meteorology and Climatology, Adam Mickiewicz University, Krygowskiego 10, 61-680 Poznań, Poland
5
Department of Land Improvement, Environmental Development and Spatial Management, Poznań University of Life Sciences, Piątkowska 94E, 60-649 Poznań, Poland
*
Author to whom correspondence should be addressed.
Buildings 2022, 12(10), 1624; https://doi.org/10.3390/buildings12101624
Submission received: 9 September 2022 / Revised: 28 September 2022 / Accepted: 5 October 2022 / Published: 7 October 2022
(This article belongs to the Special Issue Sustainable Hydraulic Structures: Design, Monitoring, and Management)

Abstract

:
The progressing development of civilisation and climate change require access to an appropriate quantity of environmental resources. One of the key resources is water. Both its deficit and excess evidently affect human life. Control over water circulation is possible owing to water management, largely involving introduction of hydraulic structures. The paper analyses the effect of the Jeziorsko dam reservoir on the flows of the Warta River, the third largest river in Poland. It analyses water flows in the Warta River in the years 1993–2020 for hydrological stations above and below the reservoir. The conducted research showed that the construction of the Jeziorsko reservoir also substantially contributed to an increase in minimum flows and a decrease in maximum flows. Moreover, the simulation showed that in the case of abscence of the reservoir, the flows of the Warta River would be higher in the period from January to June, and in the period from July to October the opposite situation would occur. In November and December, the flows would be at a similar level. Results obtained in the study, show that hydraulic structures are an effective solution in the context of stabilisation of the hydrological situation in a given region, particularly in terms of hydrological lows occurring with increasing intensity mitigated on sections of rivers below the reservoirs.

1. Introduction

Hydraulic structures have been shaping water conditions for centuries, contributing to the development of many areas of human activity, and consequently the development of entire civilizations. As shown by numerous studies from different regions around the globe [1,2,3,4,5], there are currently hardly any places where hydraulic structures play no role in shaping water circulation—both in the context of its excess and deficit. The key objective of water management, is general stabilisation of water relations to retain excess water that can be redistributed in the period of its deficit [6,7]. Considering the increasing water needs of the human population, distribution of appropriate water resources is a priority for meeting the basic needs and providing economic activity in different sectors such as industry [8,9] or agriculture [10,11,12].
Next to human activity, another crucial factor is becoming increasingly evident, namely global warming, affecting the climatic-hydrological conditions [13,14]. Pradhan et al. [15], analysing the situation in the catchment of the Sre Pok River (Vietnam), accessibility of water will decrease in the future, demand for water for irrigation will increase, and production of hydraulic energy will be subject to reduction. In reference to the upper catchment of the Indus River, Ougahi et al. [16] determined that the predicted warming in the winter and spring period may largely contribute to seasonal river flows, with important implications for water supply. According to Morán-Tejeda et al., [17] the observed and forecasted hydrological changes must be considered in the sustainable management of water resources.
In the case of Poland, the actual retention capacity resulting from the topographic, demographic, and economic conditions is estimated for 15% of the average annual outflow. The objective is met through the application of diverse types of solutions with simultaneous maintenance of permanent equilibrium of the water balance and the desired state of the natural environment [18]. Such solutions are implemented and controlled by the governmental institution State Water Holding Polish Waters, responsible for among others supervision over water bodies. Water bodies currently fulfil numerous functions, aimed at their optimal use in the natural environment. According to Rzętała [19] and Machowski [20] the basic functions include: flood protection, retention, water supply, energy production, tourism, including navigation and angling, and others (e.g., fish farming).
The Warta River catchment analysed in the paper has some of the lowest water resources in Poland [21], resulting from both the natural conditions (low precipitation, high evapotranspiration index) and strong human pressure (strong industrialisation of the region, intensive agriculture, or water-consuming energy production). Therefore, there is a need to improve the situation through the introduction of hydraulic structures. This paper corresponds with the broad research trend regarding the effect of dams on rivers [22,23,24]. The innovative aspect of the paper is the determination of detailed changes in the hydro-logical regime related to the functioning of the hydrotechnical infrastructure in the Warta catchment, providing among others the theoretical basis for undertaking further investments of the type
The primary objective of the paper was the identification of transformations of the hydrological regime of Warta—the third largest river in Poland, as a result of functioning of the Jeziorsko reservoir. In detail, the paper focuses on the analyses of water flow in the river, in the present situation as well as under the simulation of the absence of the existing dam and the related reservoir.

2. Materials and Methods
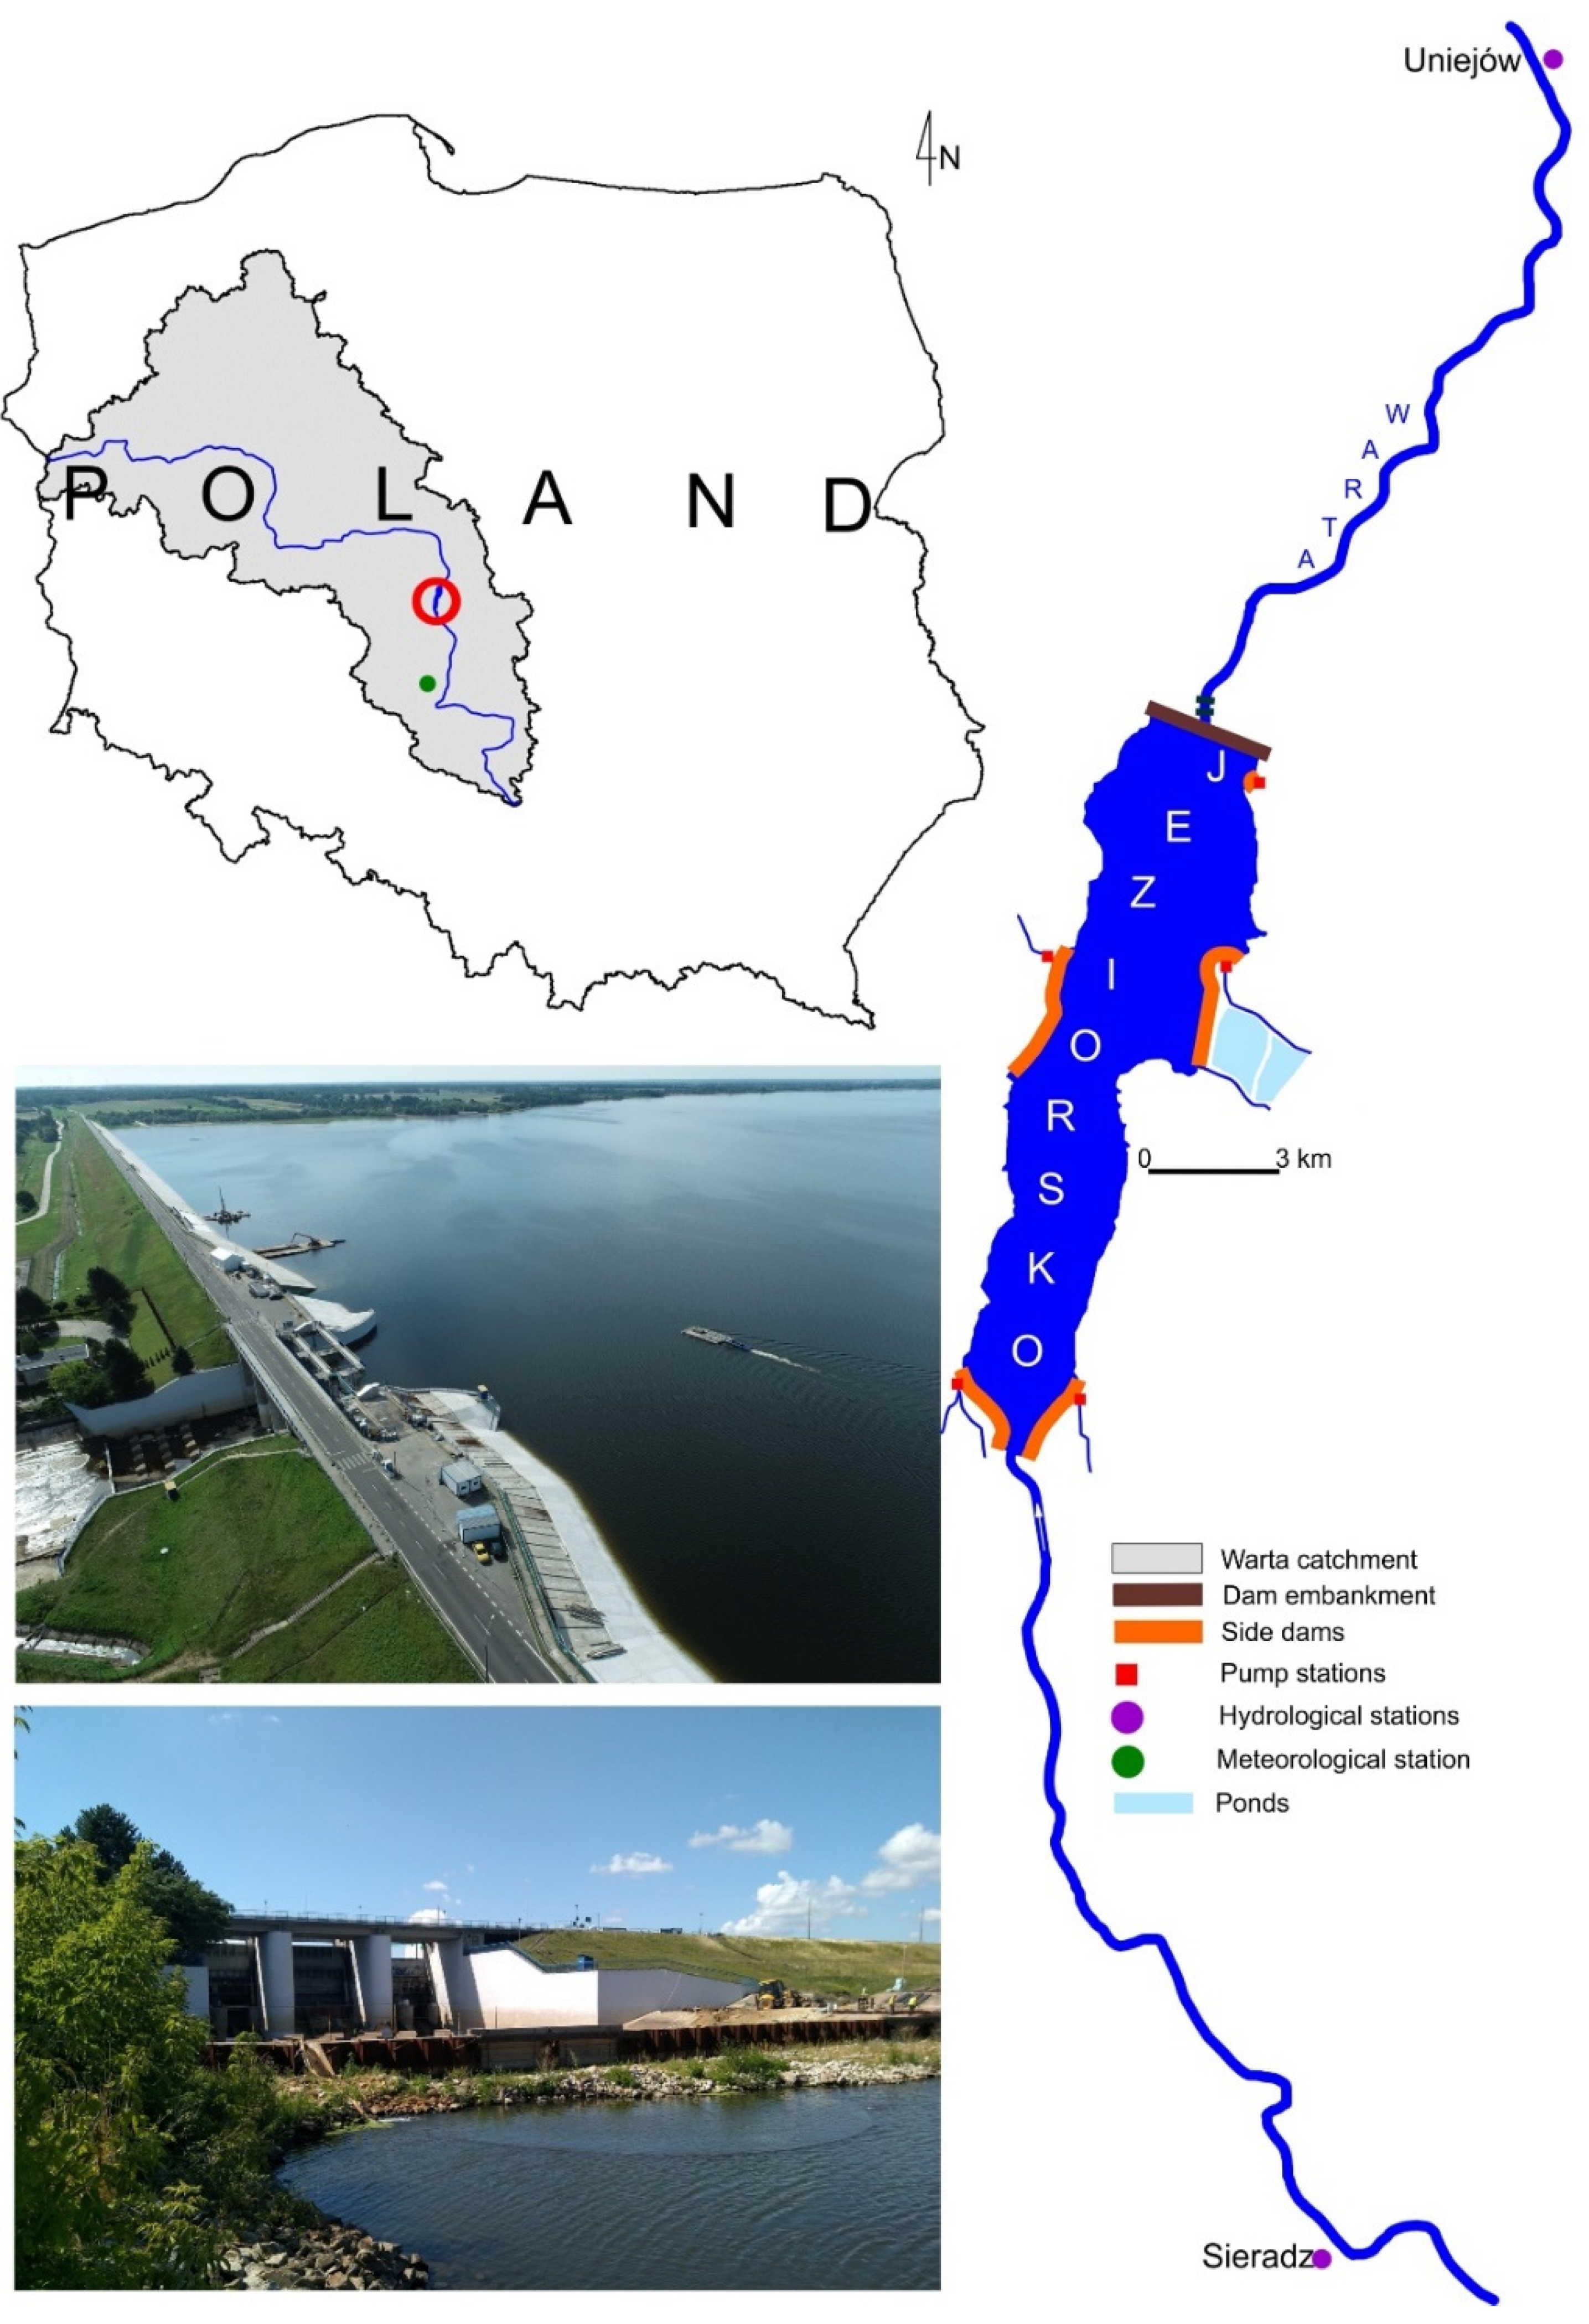
2.1. Study Object

Warta is the third longest river in Poland (808.2 km) with a catchment area of 54,519.6 km2. Its headwater section has a character of an upland river. In the subsequent section it is a lowland river. Its maximum flows occur in the period of summer floods, although statistically, high stages usually predominate in the spring period after snowmelt. The average unitary outflow for the Warta River in the zone above the Jeziorsko reservoir is approximately 5.2 dm3 s1 km2, and the average annual flows for the nearest water gauge cross-section Sieradz above the reservoir are at a level of 25–75 m3 s1. The minimum recorded flow was less than 10.0 m3 s1, and the maximum 408.0 m3 s1 (based on the data of IMGW-PIB). Considering such variable flows at the multi-annual and seasonal scale in the 1970’s, a decision was made to build the reservoir in the middle course of the river (on km 484.3). In 1986, a reservoir was commissioned, called Jeziorsko after a nearby municipality (Figure 1). It closes the catchment of the Warta River with an area of 9012.6 km2. The basic tasks of the reservoir include: reduction of flood threat in the Warta River valley below the reservoir through the reduction of floods; shaping water resources in the Warta River valley through controlling water flow in the scope of low and high flows; guaranteeing the base flow below the reservoir; guaranteeing water for industrial plants in the region of the Middle Warta River, meeting potential water supply needs of the municipal engineering, use of retained water for irrigations in agriculture, improvement of navigation conditions on the navigable sections of the Warta River, electricity production in a hydraulic power plant at the dam embankment, development of recreation and tourism around the reservoir, conducting fishery economy, and maintenance of habitat conditions for waterfowl (in the upper part of the reservoir).
The Jeziorsko reservoir resulted from the construction of a dam embankment with a gate-controlled spillway weir on km 484.3 of the Warta River. Technical details concerning the dam embankment are included in the Manual of water management [25]. Damming the river resulted from the construction of an embankment dam from medium-grained sands with a reinforced concrete facing on the waterside. Its basic parameters are as follows: length 2.73 km, height 12 m, width of the dam crest 12 m (in the vicinity of the weir 24 m), slope of the landside scarp 1:3, ordinate of the dam crest 124.40 m a.s.l.

2.2. Materials

The landside scarp is secured with reinforced concrete slabs with a thickness of 15 cm on concrete with a thickness of 10 cm, width of 6.0 m, and length of 12 m with the dam crest ending with buffer sill. Dilatations between the slabs are sealed with tape with PVC and bituminous mass. The landside scarp is secured with grass growth on a hummus layer with a thickness of 10 cm. On the side of the upper water level, at the foot of the dam at the interface with the reinforced concrete screen, there is a clay trench with a thickness of 0.5 m, in a 50 m wide belt, covered with a layer of soil with a thickness of 0.50 m [25]. The bottom of the reservoir in front of the dam is sealed with polyethylene foil along a section of 800 m from the dam. The sealing surface is 200 ha.
The dam’s drainage is made of perforated clay pipes with a diameter of 30 cm, with filter fabric replacing the reversed filter. The drainage collector features control wells with a diameter of 1.0 m at distances of approximately 80 m. Water from the wells is drained through reinforced concrete outlets to the drainage ditch. Two drainage-melioration ditches run along the landside scarp of the dam, with the bottom and scarps secured with reinforced concrete and openwork concrete slabs. The gate-controlled spillway weir is located in the central part of the dam embankment, and has three overflow openings with a diameter of 4.5 × 12.0 m each, with steel gates with a hydraulic drive system. In concrete overflow thresholds, in two lateral spans, there are 4 bottom sluices with dimensions 3.30 × 2.20 m each, closed with steel segments with a hydraulic drive system.
Next to the aforementioned dam embankment and the directly related gate-controlled spillway weir and hydraulic power plant, the hydrotechnical object constituting the Jeziorsko dam reservoir also comprises: lateral dam Pęczniew with a pumping station, lateral dam Siedlątków with a pumping station, lateral dam Teleszyna with pumping stations Jeziorsko and Miłkowice, backwater dam Glinno with a pumping station, backwater dam Proboszczowice with a pumping station, redirected channel of the Pichna River, and two adjustment thresholds below the reservoir. Moreover, the dam embankment features a gravitational water inlet to Struga Spicimierska, permitting irrigation of arable land in the left-bank Warta River valley below the reservoir.
The paper employs data on daily water stages in the Jeziorsko dam reservoir in the period 1993–2020. Water stages were recorded with a frequency of once per day at 7.00. Moreover, data on mean daily discharges and water outflows from the Jeziorsko reservoir were used. The data were provided by the National Water Holding Polish Waters, Regional Water Management Board in Poznań. The data regarding mean daily water discharges from the reservoir carry slight uncertainty. It results from recording the volume of discharged water by the hydraulic power plant and on sluice facilities based on calculations conducted for different conditions of their operation and implemented every several years to adjust measurements of the flow rate. The verification of water discharges from the reservoir used data from water gauge station Uniejów. The station is located 17.5 km below the dam on the Jeziorsko reservoir. Data regarding water inflows to the reservoir carry greater uncertainty. The volume of water flowing into the reservoir is calculated based on a change in the water level in the reservoir and the curve of the surface area and volume. Due to this, the verification of the date emloyed daily flow rate values recorded in water gauge station Sieradz. The Sieradz station is located approximately 17.2 km above the inlet to the Jeziorsko dam reservoir. It should be emphasised that water levels in the reservoir are also determined by direct precipitation onto the surface of the reservoir and evaporation from its surface. Until 2018, the water resources of the reservoir were additionally reduced through water uptake for the purposes of cooling of the Adamów power plant, implemented in the Miłkowice II pumping station on the left shore of the reservoir. Water consumption for such purposes, however, usually did not exceed 1 m3 s−1, and was limited to the warm half-year. The effect of the reservoir on the variability of mean monthly flow rates and extreme flows of 1-, 3-, and 7-day minima and maxima was analysed based on hydrological station Uniejów. Hydrological data was analyzed on the background of temperature and precipitation conditions from the climatological station Wieluń. The Wieluń climatological station is located about 60 km south of the Jeziorsko dam reservoir. Data on daily water flows in hydrological stations Sieradz and Uniejów and daily values of air temperature and precipitation were provided by the Institute of Meteorology and Water Management—National Research Institute. The data analysis was conducted in reference to hydrological years. The hydrological year begins in November of the previous year, and ends in October of the current year.

2.3. Methods

The first stage of the analysis involved verification of data on daily water inflows and outflows to and from the Jeziorsko dam reservoir. It employed measurement data from water gauge stations Sieradz and Uniejów. An adjustment of mean daily water inflows to the Jeziorsko reservoir was performed each time when the values were lower than those recorded in hydrological station Sieradz. The adjustment of data for the Warta River catchment to the Sieradz profile involved the calculation of daily values of unitary discharge. Unitary discharge constitutes the ratio of mean daily flow rate and the area of the catchment. Then, based on the difference of the area of the Warta River catchment until the dam of the Jeziorsko reservoir and until hydrological station Sieradz, and value of unitary discharge, mean daily values of water inflows to the reservoir were adjusted. The surface area of the Warta River catchment until hydrological station Sieradz is 8150.3 km2, and until the dam of the reservoir 9007.0 km2. The value of water inflow to the reservoir is the flow value recorded in hydrological station Sieradz increased by the flow from the differential catchment. Verification of data regarding outflow from the reservoir was conducted in a similar manner. It employed daily flow values recorded in water gauge station Uniejów. The surface area of the Warta River catchment until Uniejów is 9195.8 km2. In this case, the data showed high consistency. Only single errors were detected in the data set. The method of their adjustment was analogical to that for water inflow to the reservoir.
Next, based on the difference between water inflow and outflow to and from the reservoir, flows were calculated for water gauge station Uniejów. A second sequence of data resulted, i.e., flows of the Warta River if the Jeziorsko dam reservoir had never been constructed. This permitted the designation of two data series on flows of the Warta River in water gauge cross-section Uniejów, one illustrating the actual state resulting from the effect of the Jeziorsko reservoir, and the other hypothetical for the Warta River without the reservoir.
The assessment of the effect of the reservoir on the flows of the Warta River employed selected Indices of Hydrological Alteration (IHA) (Table 1) [26]. A total of 12 parameters were applied from group 1, characterising the magnitude of monthly water conditions, and 7 parameters from group 2, characterising the magnitude and duration of annual extreme water conditions. Moreover, the original data provided the basis for the determination of the flow duration curve, allowing for the determination of flows Q70% and Q90%. They provided the basis for the identification of the times of occurrence of flows below Q70% and Q90% for both data sets for each year.
The determination of the effect of the construction of the reservoir on flows in the Warta River involved the comparison of equivalent values by means of a non-parametric Wilcoxon matched-pairs test, also known as the Wilcoxon test for dependent groups [27]. The Wilcoxon test is a non-parametric equivalent of the t Student test for dependent samples.
At the second stage, the directions and magnitudes of changes in flows were performed by means of a Mann-Kendall tests [28] and a Sen test [29]. The analysis was conducted for the original measurement data from water gauge station Uniejów, and for data calculated for this location if the Jeziorsko reservoir had never been built. The analysis covered the period 1993–2020 for all hydrological variables. Moreover, in order to demonstrate changes of water flows in relation to changes of climatic conditions, trend analysis for air temperatures and precipitation was performed in a similar way. The applied tests belong to the group of non-parametric tests usually used in analyses of hydrological and climatic data [30]. The analysis employed the modified package developed by Patakamuri and O’Brien [31]. Statistical analyses were performed in programmes Statistica 13.1 and R with RStudio interface at a significance level of 0.05 and 0.01.

3. Results

Water flows in water gauge cross-section Uniejów in the years 1993–2020, both actual and hypothetical in a situation in which the Jeziorsko dam reservoir had never been built are presented in Figure 2.
The diagram shows that flows in the Warta River in water gauge station Uniejów are affected by the Jeziorsko dam reservoir. The effect of the Jeziorsko reservoir is evident in as many as ten months, with the exception of November and December. The comparison of mean monthly values of flows in the Warta River currently occurring in water gauge station Uniejów with hypothetical flows—in a situation in which the reservoir had never been built, are presented in Figure 3a. The obtained results suggest that in the case of absence of the reservoir, flows in the Warta River in the Uniejów profile would be higher in the period from January to June. In the period from July to October, the opposite situation would occur. In November and December, the flow rates would be at an approximate level.
The construction of the Jeziorsko reservoir also substantially contributed to an increase in 1-, 3- and 7-day minimum flows (Figure 3b). The reservoir also contributes to a decrease in maximum flows in the Warta River (Figure 3c). The effect of the reservoir is the greatest in reference to 1-day flows, and the lowest for 7-day flows in reference to minimum flows. In the case of maximum flows, the effect of the reservoir is the same for 1-, 3-, and 7-day maximum flows. The functioning of the reservoir is of greater importance in the case of reduction of maximum flows than minimum flows. The Jeziorsko dam reservoir also contributes to an increase in the characteristics of the base flow index (Figure 3d).
The comparison of the aforementioned characteristics of flows for the state with and without the reservoir by means of a Wilcoxon test is presented in Figure 4.
The obtained results point to considerable changes, primarily at a significance level of 0.01, resulting from the functioning of the Jeziorsko reservoir. Lack of significant changes only concerns mean monthly flows in November and December, and durations of flows below Q70% and Q90%, reaching 33.2 and 25.7 m3s−1, respectively. The reservoir has the most substantial effect on 1-, 3-, and 7-day maximum flows. Moreover, the reservoir has a strong effect on the reduction of flows in the period from February to April. The functioning of the reservoir also results in an increase in flows in the period from August to October.
The analysis of changes in the characteristics of flows in the Warta River in hydrological station Uniejów in the years 1993–2020 showed the occurrence of negative trends of mean monthly flows in April, July, August, and September. The changes are statistically significant at a significance level of 0.01. The changes in the flows range from −2.56 to −3.26 m3s−1 per year (Table 2). Moreover, statistically significant changes were determined for mean annual flows. The range of such changes is −2.73 m3s−1 per year. In subsequent years of the period 1993–2020, the number of days with flows below Q70% and Q90% increased at an average rate of 6.38 and 3.16 day per year. Moreover, significant changes occurred in reference to 1-, 3-, and 7-day minimum and maximum flows.
In the case of absence of the Jeziorsko reservoir, the range of changes in the years 1993–2020 would be even more evident for water gauge station Uniejów. The results of the trend analysis show that additionally, changes in mean monthly flows would occur in March, June, and October. Considering the remaining characteristics of changes in flows, a trend for their decrease is also evident.
The results of the trend analysis of air temperature and precipitation provide the climatic background for the reported flow changes. The results show an increasing trend of average annual air temperatures at the Wieluń station at 0.6 °C per decade (Table 3). Also in November, December, June and August significant increases in air temperature were observed in a range of 0.6 to 1.4 °C per decade. There was a generally upward tendency in air temperatures in the other months as well. Only in January and May there was a downward tendency of −0.1 and −0.3 °C per decade, respectively. Analysis of precipitation showed that the changes were not statistically significant over the 1993–2020. With regard to the values of annual precipitation, there was a downward tendency at −48 mm per decade. Also in November, December, February, March, April, May, July and August, there was a tendency to decrease precipitation at −9 to −4 mm per decade. There was a slight upward tendency in the remaining months.

4. Discussion

The above results suggest that in hydrological terms, the Jeziorsko reservoir fulfils its role through mitigating the course of extreme situations, namely the occurrence of water excess and deficit in the Warta River. Water management is dependent on the conditions of water circulation occurring in a given area. In those terms, the Warta River shows nival regime developed to a medium degree. This means that the average flow in a spring month (March-April) constitutes130–180% of the average annual flow [32]. The schedule of operation of the reservoir is related to seasonal (cyclical) changes in water supply to the analysed catchment. According to the Manual of Water Management [25], in the winter period (December-January), a minimum damming level should be maintained in the reservoir in a range of 116.00–116.30 m a.s.l. to ensure appropriate useful capacity (~6 million m3) during the occurrence of ice phenomena, when a rapid decrease in water inflow to the reservoir is observed. In the period from 1 February to 15 April, the reservoir is filled for the purpose of accumulation of a sufficient quantity of water to be used in the summer period. During that time, the ordinate of the reservoir should reach the regular damming level that currently equals 120.00 m a.s.l., and until 2014 reached 120.50 m a.s.l. The maintenance of a constant damming level in the period from 16 April to 15 September is related to the habitat protection of birds in the Jeziorsko reserve, and to meeting the needs of the recreational and tourist use of the reservoir. In the period from 16 September to 31 December, retention is maintained between the regular damming level and minimum damming ordinate, permitting shaping water resources in the river valley through obtaining a substantial effect on the value of the current flow. Water management implemented in that period aims at among others guaranteeing an appropriate water level in the river below the reservoir, used for the purposes of the Pątnów and Konin Power Plants, and in earlier years additionally the Adamów Power Plant, as well as allowing for potential water needs of municipal management in periods of occurrence of natural hydrological low flows.
Hydraulic structures, and particularly dam reservoirs (due to high water retention capacity) are an effective tool permitting control of water resources. The analysis conducted for the Nielisz reservoir in the Wieprz River showed a positive effect on balancing low flows [33]. The flood protection function of the reservoir is particularly evident in the case of small floods, including delaying the occurrence of accumulated flow without a decrease in the magnitude of the flood. In the Amazon catchment, the existing dams affect water flow in the river. In particular large dams have changed the amplitude of water flow down the river by 3 orders of magnitude [34]. Dams constructed on the Dolores River (USA) caused a decrease in maximum flows, but an increase in minimum summer flows [35]. The neglect of flow regulation by means of dams shows that the average number of people exposed to floods below dams will reach 9.1 (RCP 2.6) and 15.3 (RCP 6.0) million annually by the end of the 21st century [36]. The functioning of dams decreased that index by 20.6% and 12.9%, respectively. Long-term draught in the Tigris-Euphrates catchment (2007–2018) caused considerable losses in water resources, recovered in 50% after extensive precipitation in 2019, and in that year, the dam reservoirs intercepted water equivalent to 40% of earlier losses [37]. Research in the Ilan River catchment (Iran) showed that the area of zones of “very low”, “low”, and “moderate” flood threat increased from 2.2% to 7.3%, from 8.6% to 19.6%, and from 22.7% to 31.2%, respectively after constructing the dams [38]. The determination of deviations from the natural flow regime for rivers in the United States shows that the size and purpose of the dams explained high variability of changes in flows [39]. Maddu et al. [40] emphasise that changes in the patterns of precipitation and temperature in the scope of climate changes cause changes in river flows, affecting the hydrological and environmental conditions. In reference to the territory of Poland, an evident increase in air temperature is already currently recorded [41,42], and will progress at least until the end of the 21st century [43]. Such a situation will affect changes in the components of the water balance, and consequently a change in water resources management. For example, climate changes in the area of Mekong will lead to an increase in precipitation, resulting in the necessity of change in the operation of dams, from the maintenance of low flows to improvement of flood safety [44]. Due to direct impact on climate change on the hydrological regime, Saudi Arabia has constructed more than 500 dams with different capacities in the scope of economic and environmental development [45]. Also in the case of Poland, hydraulic structures are an important element of shaping water conditions, implemented by Polish Waters. In reference to the discussed Warta catchment, it covers among others tasks aimed at stabilising the water level and limiting the outflow in approximately 300 hydrotechnical facilities [18]. Such facilities represent various classes and sizes, and according to the results obtained in the paper, the largest of them plays an important role in fulfilling such tasks, namely the Jeziorsko reservoir. The above analysis used hydrological data from the Sieradz hydrological station, volumes of water stored in the reservoir, and inflows and outflows of water from the reservoir recorded by the Jeziorsko hydropower plant and at the reservoir’s outlet structures. In the future, horizontal water exchange of precipitation and evaporation and underground water exchange between the reservoir and adjacent areas should be considered in such calculations. In addition, it is necessary to verify the reservoir area-volume curve which has changed, over the years 1993–2020, due to the process of sedimentation and loss of reservoir volume. The authors are currently preparing a water balance model for the reservoir that takes into account vertical water exchange (precipitation–evaporation) and underground water exchange, and attempting to verify the reservoir area-volume curve based on Landsat satellite data [46].

5. Conclusions

The functioning of the Jeziorsko reservoir presented in the paper in the context of water flows in the Warta River should be regarded positive. According to the obtained results, in the case of absence of the reservoir, water flows for station Uniejów (below the reservoir) would be higher in the period from January to June. In the period from July to October, the opposite situation would occur. The construction of the Jeziorsko reservoir largely contributed to an increase in 1-, 3-, and 7-day minimum flows, and a decrease in maximum flows. The effect of the reservoir is the greatest in reference to 1-day flows, and the smallest for 7-day flows. In the case of maximum flows, the effect of the reservoir is of the same importance for 1-, 3-, and 7-day values of the parameter. The functioning of the reservoir affects the regulation of maximum flows stronger than minimum flows. It is particularly evident in periods of occurrence of the largest floods on the Warta River. The progressing civilisation development and climate changes require access to appropriate quantities of environmental resources. One of the key ones is water. Both its excess and deficit strongly affect human life. The practical analysis presented in the article clearly shows the detailed scale of the effect of the reservoir on water flow in Warta. It is important for decision making regarding further undertakings in the scope of water management in the region featuring some of the smallest water resources in Poland.

Author Contributions

Conceptualization, B.N.; methodology, M.S.; software, M.S.; validation, M.S.; formal analysis, M.S.; investigation, M.S.; resources, B.N.; data curation, B.N.; writing—original draft preparation, M.P.; writing—review and editing, M.P. and K.S.-P., visualization, M.P. and M.S.; supervision, M.P.; project administration, M.P. All authors have read and agreed to the published version of the manuscript.

Funding

This research received no external funding.

Institutional Review Board Statement

Not applicable.

Informed Consent Statement

Not applicable.

Data Availability Statement

Not applicable.

Conflicts of Interest

The authors declare no conflict of interest.

References

  1. Munyaneza, O.; Nzeyimana, Y.K.; Wali, U.G. Hydraulic structures design for flood control in the Nyabugogo Wetland Secondary document. Nile Basin Water Sci. Eng. J. 2013, 6, 26–37. [Google Scholar]
  2. Ptak, M.; Choiński, A.; Strzelczak, A.; Targosz, A. Disappearance of Lake Jelenino since the end of the XVIII century as an effect of anthropogenic transformations of the natural environment. Pol. J. Environ. Stud. 2013, 22, 191–196. [Google Scholar]
  3. Hailemariam, F.M.; Brandimarte, L.; Dottori, F. Investigating the influence of minor hydraulic structures on modeling flood events in lowland areas. Hydrol. Processes 2014, 28, 1742–1755. [Google Scholar] [CrossRef]
  4. Lienou, G.; Mahe, G.; Piih, S.L.; Sighomnou, D.; Paturel, J.E.; Bamba, F. Is the building of dams an adaptation strategy to fight against drought in the basin of the River Niger? IAHS-AISH Proc. Rep. 2014, 363, 197–202. [Google Scholar]
  5. Kim, J.; Park, J.; Kwon, H. Assessment of Termination Criteria at Each Drought Response Stage on Climate Change in a Multi-Purpose Dam. Appl. Sci. 2022, 12, 5801. [Google Scholar] [CrossRef]
  6. Nowak, B.; Ptak, M.; Bartczaka, J.; Sojka, M. Hydraulic structures as a key component of sustainable water management in a catchment scale-case study of the Rgilewka River (Central Poland). Buildings 2022, 12, 675. [Google Scholar] [CrossRef]
  7. Nowak, B.; Ptak, M. Natural and anthropogenic conditions of water level fluctuations in lakes–Powidzkie Lake case study (Central-Western Poland). J. Water Land Dev. 2019, 40, 13–25. [Google Scholar] [CrossRef]
  8. Yao, L.; Zhao, L.; Pan, L.; Chen, X. Optimal water resource allocation based on stability–considering the correlation between water consumption and output value in different industries. Water Supply 2020, 20, 2499–2513. [Google Scholar] [CrossRef]
  9. Kosolapova, N.A.; Matveeva, L.G.; Nikitaeva, A.Y.; Molapisi, L. The Rational Use of Water Resources in the Strategy of Industry 4.0. Water Resour. Manag. 2021, 35, 3023–3041. [Google Scholar] [CrossRef]
  10. Donoso, G. Management of Water Resources in Agriculture in Chile and its Challenges. Int. J. Agric. Nat. Resour. 2021, 48, 171–185. [Google Scholar] [CrossRef]
  11. Wang, W.; Straffelini, E.; Pijl, A.; Tarolli, P. Sustainable water resource management in steep-slope agriculture. Geogr. Sustain. 2022, 3, 214–219. [Google Scholar] [CrossRef]
  12. Hämmerling, M.; Kałuża, T.; Zawadzki, P.; Zaborowski, S.; Sojka, M.; Liberacki, D.; Ptak, M. Application of the multi-criteria analytic methods for technical conditions assessment of small hydraulic structures. Buildings 2022, 12, 115. [Google Scholar] [CrossRef]
  13. Choiński, A.; Ptak, M.; Strzelczak, A. Changeability of accumulated heat content in alpine-type lakes. Pol. J. Environ. Stud. 2015, 24, 2363–2369. [Google Scholar] [CrossRef]
  14. Ptak, M.; Nowak, B. Variability of oxygen-thermal conditions in selected lakes in Poland. Ecol. Chem. Eng. 2016, 23, 639–650. [Google Scholar] [CrossRef] [Green Version]
  15. Pradhan, P.; Pham, T.T.H.; Shrestha, S.; Loc, H.H.; Park, E. Projecting the impact of human activities and climate change on water resources in the transboundary Sre Pok River Basin. Clim. Chang. 2022, 172, 26. [Google Scholar] [CrossRef]
  16. Ougahi, J.H.; Cutler, M.E.J.; Cook, S.J. Modelling climate change impact on water resources of the Upper Indus Basin. J. Water Clim. Chang. 2022, 13, 482–504. [Google Scholar] [CrossRef]
  17. Morán-Tejeda, E.; López-Moreno, J.I.; Sanmiguel-Vallelado, A. Changes in Climate, Snow and Water Resources in the Spanish Pyrenees: Observations and Projections in a Warming Climate. Adv. Glob. Chang. Res. 2017, 62, 305–323. [Google Scholar]
  18. Nowak, B.; Władczyk, J. Działania retencyjne Wód Polskich na obszarze Pojezierza Wielkopolsko-Kujawskiego. Gospod. Wodna 2022, 2, 12–19. [Google Scholar] [CrossRef]
  19. Rzętała, M. Funkcjonowanie Zbiorników Wodnych oraz Przebieg Procesów Limnicznych w Warunkach Zróżnicowanej Antropopresji na Przykładzie Regionu Górnośląskiego; Wydawnictwo Uniwersytetu Śląskiego: Katowice, Poland, 2008. [Google Scholar]
  20. Machowski, R. Przemiany Geosystemów Zbiorników Wodnych Powstałych w Nieckach Osiadania na Wyżynie Katowickiej; Wydawnictwo Uniwersytetu Śląskiego: Katowice, Poland, 2010. [Google Scholar]
  21. Instytut Meteorologii i Gospodarki Wodnej. Hydrological Atlas of Poland; Instytut Meteorologii i Gospodarki Wodnej: Warszawa, Poland, 1987. (In Polish) [Google Scholar]
  22. Wiatkowski, M.; Wiatkowska, B. Changes in the flow and quality of water in the dam reservoir of the Mała Panew catchment (South Poland) characterized by multidimensional data analysis. Arch. Environ. Prot. 2019, 45, 26–41. [Google Scholar]
  23. Penas, F.J.; Barquin, J. Assessment of large-scale patterns of hydrological alteration caused by dams. J. Hydrol. 2019, 572, 706–718. [Google Scholar] [CrossRef]
  24. Peng, F.; Shi, X.; Li, K.; Wang, Y.; Feng, J.; Li, R.; Liang, R. How to comprehensively evaluate river discharge under the influence of a dam. Ecol. Inform. 2022, 69, 101637. [Google Scholar] [CrossRef]
  25. Regionalny Zarząd Gospodarki Wodnej w Poznaniu. Instrukcja Gospodarowania wodą. Zbiornik Jeziorsko; Regionalny Zarząd Gospodarki Wodnej w Poznaniu: Poznań, Poland, 2014. [Google Scholar]
  26. Gao, Y.; Vogel, R.M.; Kroll, C.N.; Poff, N.L.; Olden, J.D. Development of representative indicators of hydrologic alteration. J. Hydrol. 2009, 374, 136–147. [Google Scholar] [CrossRef]
  27. Wilcoxon, F. Individual comparisons by ranking methods. Biometries 1945, 1, 80–83. [Google Scholar] [CrossRef]
  28. Kendall, M.G.; Stuart, A. The Advanced Theory of Statistics, 3rd ed.; Charles Griffin Ltd.: London, UK, 1968. [Google Scholar]
  29. Gilbert, R.O. Statistical Methods for Environmental Pollution Monitoring; Van Nostrand Reinhold, Co.: New York, NY, USA, 1987; p. 320. [Google Scholar]
  30. Sojka, M. Directions and Extent of Flows Changes in Warta River Basin (Poland) in the Context of the Efficiency of Run-of-River Hydropower Plants and the Perspectives for Their Future Development. Energies 2022, 15, 439. [Google Scholar] [CrossRef]
  31. Patakamuri, S.K.; O’Brien, N. Modified Versions of Mann Kendall and Spearman’s Rho Trend Tests, Version 1.6. 2021. Available online: https://cran.r-project.org/web/packages/modifiedmk/modifiedmk.pdf (accessed on 5 August 2022).
  32. Wrzesiński, D.; Perz, A. Cechy reżimu odpływu rzek w zlewni Warty. Bad. Fizjogr. 2016, 67, 289–304. [Google Scholar]
  33. Raczynski, K. Influence of a Multipurpose Retention Reservoir on Extreme River Flows, a Case Study of the Nielisz Reservoir on the Wieprz River (Eastern Poland). Water Resour. 2020, 47, 29–40. [Google Scholar] [CrossRef]
  34. Chaudhari, S.; Pokhrel, Y. Alteration of River Flow and Flood Dynamics by Existing and Planned Hydropower Dams in the Amazon River Basin. Water Resour. Res. 2022, 58, e2021WR030555. [Google Scholar] [CrossRef]
  35. Dott, C.; Bombaci, S.; Kasprak, A.; Korb, J. A tale of two rivers: Dam-induced hydrologic drought on the lower Dolores River and its impact on tamarisk establishment. Ecohydrology 2022, 15. [Google Scholar] [CrossRef]
  36. Boulange, J.; Hanasaki, N.; Yamazaki, D.; Pokhrel, Y. Role of dams in reducing global flood exposure under climate change. Nat. Commun. 2021, 12, 417. [Google Scholar] [CrossRef]
  37. Abdelmohsen, K.; Sultan, M.; Save, H.; Abotalib, Z.; Yan, E.; Zahran, K.H. Buffering the impacts of extreme climate variability in the highly engineered Tigris Euphrates river system. Sci. Rep. 2022, 12, 4178. [Google Scholar] [CrossRef]
  38. Sepehri, M.; Ildoromi, A.R.; Malekinezhad, H.; Ghahramani, A.; Ekhtesasi, M.R.; Cao, C.; Kiani-Harchegani, M. Assessment of check dams’ role in flood hazard mapping in a semi-arid environment. Geomat. Nat. Hazards Risk 2019, 10, 2239–2256. [Google Scholar] [CrossRef] [Green Version]
  39. Chalise, D.R.; Sankarasubramanian, A.; Ruhi, A. Dams and Climate Interact to Alter River Flow Regimes Across the United States. Earth’s Future 2021, 9, e2020EF001816. [Google Scholar] [CrossRef]
  40. Maddu, R.; Ganta, K.M.; Shaik, R.; Dhanya, C.T. Impact Assessment of Environmental Flows Using CORDEX Regional Climate Models: Case Study of Nagarjuna Sagar Dam, Krishna River, India. Lect. Notes Civ. Eng. 2022, 176, 187–204. [Google Scholar]
  41. Ptak, M.; Sojka, M.; Kozłowski, M. The increasing of maximum lake water temperature in lowland lakes of Central Europe: Case study of the Polish Lakeland. Ann. Limnol.-Int. J. Limnol. 2019, 55, 11. [Google Scholar] [CrossRef]
  42. Ptak, M.; Sojka, M.; Kałuża, T.; Choiński, A.; Nowak, B. Long-term water temperature trends of the Warta River in the years 1960-2009. Ecohydrol. Hydrobiol. 2019, 19, 441–451. [Google Scholar] [CrossRef]
  43. Czernecki, B.; Ptak, M. The impact of global warming on lake surface water temperature in Poland-the application of empirical-statistical downscaling, 1971–2100. J. Limnol. 2018, 77, 330–348. [Google Scholar] [CrossRef] [Green Version]
  44. Mohammed, I.N.; Bolten, J.D.; Souter, N.J.; Shaad, K.; Vollmer, D. Diagnosing challenges and setting priorities for sustainable water resource management under climate change. Sci. Rep. 2022, 12, 796. [Google Scholar] [CrossRef] [PubMed]
  45. Al-Munqedhi, B.M.; El-Sheikh, M.A.; Alfarhan, A.H.; Alkahtani, A.M.; Arif, I.A.; Rajagopal, R.; Alharthi, S.T. Climate change and hydrological regime in arid lands: Impacts of dams on the plant diversity, vegetation structure and soil in Saudi Arabia. Saudi J. Biol. Sci. 2022, 29, 3194–3206. [Google Scholar] [CrossRef] [PubMed]
  46. Sojka, M.; Nowak, B.; Ptak, M.; Jaskuła, J. Historia funkcjonowania zbiornika Jeziorsko opisana zobrazowaniami satelitarnymi Landsat. Gospod. Wodna 2022, 9, 5–12. [Google Scholar] [CrossRef]
Figure 1. Location of the study object (photos: material of the Regional Water Management Board in Poznań and Wojciech Poręba).
Buildings 12 01624 g001
Figure 2. Course of daily flows in the Warta River in hydrological station Uniejów with and without the Jeziorsko dam reservoir.
Buildings 12 01624 g002
Figure 3. Effect of the Jeziorsko reservoir on monthly flows (a), minimum flows (b), maximum flows (c), and base flow index (d).
Buildings 12 01624 g003
Figure 4. Changes in characteristics of flows resulting from the construction of the Jeziorsko dam reservoir.
Buildings 12 01624 g004
Table 1. IHA Parameters used for the assessment of the effect of the Jeziorsko dam reservoir on the flows of the Warta River in water gauge cross section Uniejów.
IHA Parameter GroupHydrologic ParametersDesignation
  • Magnitude of monthly water conditions
Mean value for each calendar month
NovemberQNov
DecemberQDec
JanuaryQJan
FebruaryQFeb
MarchQMar
AprilQApr
MayQMay
JuneQJun
JulyQJul
AugustQAug
SeptemberQSep
OctoberQOct
2.
Magnitude and duration of annual extreme water conditions
Annual minima, 1-day meanQ1Min
Annual minima, 3-day meansQ3Min
Annual minima, 7-day meansQ7Min
Annual maxima, 1-day meanQ1Max
Annual maxima, 3-day meansQ3Max
Annual maxima, 7-day meansQ7Max
Base flow index: 7-day minimumBFI
flow/mean flow for year
Table 2. Results of trend analyses for water flows at the Uniejów hydrological station with and without the Jeziorsko dam reservoir.
ParameterWith JeziorskoWithout Jeziorsko
SZ-Valuep-ValueSen’s SlopeSZ-Valuep-ValueSen’s Slope
November−35−0.750.454−0.33−65−1.410.158−0.49
December−51−1.100.270−0.42−45−0.970.332−0.31
January−31−0.660.508−0.32−59−1.280.201−0.48
February−59−1.280.201−0.81−69−1.500.134−0.80
March−53−1.150.252−0.55−119−2.600.009 **−0.99
April−141−3.090.002 **−1.83−147−3.220.001 **−1.37
May−39−0.840.402−0.41−71−1.540.123−0.51
June−83−1.810.071−0.47−91−1.980.047 *−0.56
July−149−3.260.001 **−1.10−119−2.600.009 *−0.87
August−145−3.170.002 **−1.04−131−2.870.004 **−0.84
September−117−2.560.011 *−0.83−117−2.560.011 *−0.81
October−33−0.710.481−0.36−147−3.220.001 **−0.68
Year−125−2.730.006 **−0.79−143−3.130.002 **−0.87
Q70days1292.820.005 **6.381633.570.000 **6.09
Q90days1593.480.000 **3.161192.600.009 **2.83
1-day_min−159−3.480.000 **−0.39−53−1.150.252−0.18
1-day_max−95−2.070.038 *−2.11−97−2.120.034 *−3.25
3-day_min−165−3.610.000 *−0.43−93−2.030.043 *−0.30
3-day_max−95−2.070.038 *−1.82−99−2.160.031 *−3.23
7-day_min−165−3.610.000 **−0.46−115−2.510.012 *−0.37
7-day_max−91−1.980.047 *−1.59−97−2.120.034 *−2.90
BFI90.180.8600.0050.090.9300.00
*-statistical significant changes at a level of 0.05; **-statistical significant changes at a level of 0.01.
Table 3. Results of trend analyses for air temperatures and precipitation at the climatological station Wieluń.
ParameterTemperature (°C)Precipitation (mm)
SZ-Valuep-ValueSen’s Slop
(per Decade)
SZ-Valuep-ValueSen’s Slope
(per Decade)
November1052.170.030 *1.1−51−1.040.297−6.4
December1292.670.008 **1.4−49−1.000.317−3.8
January−9−0.170.868−0.1170.330.7392.2
February190.380.7070.5−67−1.380.169−5.3
March891.830.0670.7−35−0.710.478−3.5
April811.670.0950.7−83−1.710.087−9.1
May−53−1.080.278−0.3−33−0.670.505−4.9
June1072.210.027 *0.6210.420.6773.7
July170.330.7390.1−37−0.750.453−5.8
August1132.330.020 *0.7−83−1.710.087−9.4
September911.880.0610.870.130.9001.1
October350.710.4780.5310.630.5325.3
Year1132.330.020 *0.6−55−1.130.260−47.9
*-statistical significant changes at a level of 0.05; **-statistical significant changes at a level of 0.01.
Publisher’s Note: MDPI stays neutral with regard to jurisdictional claims in published maps and institutional affiliations.

