Article

Wind-Induced Vibration Coefficient of Landscape Tower with Curved and Twisted Columns and Spiral Beams Based on Wind Tunnel Test Data

1
School of Civil Engineering and Architecture, Chongqing University of Science & Technology, Chongqing 401331, China
2
Chongqing Key Laboratory of Energy Engineering Mechanics & Disaster Prevention and Mitigation, Chongqing 401331, China
3
China Construction Second Engineering Bureau Ltd., Beijing 100160, China
4
CMCU Engineering Co., Ltd., Chongqing 400039, China
*
Author to whom correspondence should be addressed.
Buildings 2022, 12(10), 1635; https://doi.org/10.3390/buildings12101635
Submission received: 28 July 2022 / Revised: 8 September 2022 / Accepted: 19 September 2022 / Published: 9 October 2022

Abstract

:
The complex aerodynamic shape and structural form affect the wind-induced vibration coefficient β of landscape towers with a twisted column and spiral beam (short for LTs). To clarify the β distribution characteristics, evaluate the applicability of existing load codes, and provide accurate design wind loads, wind tunnel tests and numerical simulations were carried out on a LT. The LT’s aerodynamic coefficients and wind-induced responses were measured using rigid sectional and aeroelastic models. Furthermore, the displacement wind-induced vibration coefficient βd and inertial load wind-induced vibration coefficient βi(z) of the LT were calculated from these measured data. Combined with test data and a finite element model, the impacts of the wind speed spectrum type, the structural damping ratio ξ, and the peak factor g on β of the LT are analyzed. The accuracy of β of the LT calculated by Chinese and American load codes was examined and given the correction method. The results showed that the wind yaw angle had a significant impact on βd of the LT, which cannot be neglected in current load codes. The abrupt mass increase at the platform location makes the distribution characteristics of βi(z) of the LT different from conventional high-rise structures. The values of ξ and g have a significant impact on the calculation results of β, which are the key to the accurate design wind loads of LTs. The existing load codes are not suitable for LTs, and the correction method proposed in this paper can be used to improve them.

1. Introduction

A landscape tower with curved and twisted columns and spiral beams (short for LT) is usually one of the landmark buildings in the city, which is not only beautiful in appearance but also convenient for pedestrians to enjoy the scenery [1], for example, the double spiral observation tower in Marsk, Denmark, and the ArcelorMittal orbital tower in the UK. The landscape tower construction is usually made of steel, the structure form is long and thin, and the damping ratio ξ is small, and the wind load is usually the control load of such towering structures. The wind-induced vibration coefficient β is an important parameter in the structural wind-resistant design [2], but the unique shape of landscape tower will have a favorable or unfavorable influence on the coefficient, which needs to be further studied.
Numerical simulation and wind tunnel testing are excellent methods for obtaining the wind-induced vibration response of a structure, which is crucial for calculating the β. Zhao et al. [3] used the finite element time domain calculation to verify the accuracy of the proposed equivalent static wind load (ESWL) method based on the load-response-correlation method [4] for geometrically nonlinear structures, and carried out the parameter analysis of the influence of the wind speed v, nominal height, sag-to-span ratio, and ground roughness on the β. Based on the wind pressure test data of a rigid model, Han and Gu [5] analyzed the β of a double-sided billboard under different wind yaw angles, and found that the coefficient reached its maximum under 0° wind yaw angle θ due to the influence of the structural mean wind force coefficient. Through synchronous pressure-measured wind tunnel tests and the full- transient dynamic analysis [6] utilizing a finite element model, Yu et al. [7] improved the reinforcement-area-based ESWL to consider the influence of the time-variant weighted internal forces and non- Gaussian peak factor g in the reinforcement area envelope. This improved method can obtain the most realistic β in the wind-resistant design of cooling towers. Wind tunnel test can not only obtain accurate structural aerodynamic coefficient, but also verify the correctness of an established finite element model (FEM). Numerical simulation technology has the advantages of not being limited by the number of synchronous measurement points and being conducive to parameter analyses. Therefore, it is desirable to use these two methods to study the β of LTs.
LTs belong to the category of towering structures. Since towering structures are widely used in infrastructure construction, many scholars at home and abroad have carried out research on β of different types of towering structures. The cross-sectional shape can affect the β value. By changing the aspect ratio of a prismatic cross-section, Ghosh and Sil [8] observed that when the ratio is close to 1, the structural wind-induced vibration is small, so the β is also small. An aeroelastic modeling was used to determine the β of a lattice tower. The research shows that the influence of the turbulence intensity variation along the height of the tower on this coefficient should be considered, and when the tower resonant response is in the order of 1% to 18%, this coefficient determined by the test is in agreement with the result determined by the code [9]. However, there are few researches focus on the β of LTs. In order to extend this kind of structure in practical engineering, the study of its β needs more attention.
The method of calculating structural β and, thus, structural wind-resistant design wind loads using codes is concise and convenient and is still widely used by designers at this stage. The American load code [10] based on the gust wind load factor method [11] for wind-resistant design uses the vibration type decomposition method to calculate the background response and gives an approximate distribution of the equivalent background wind load. Ma et al. [12] calculated the ESWL of a large-span truss structure based on this method, showing that the method matches the transient analysis results from the perspective of the overall structural stress equivalence. The Chinese load code [13] based on the inertial wind load method [14] for wind-resistant design, by using stochastic vibration theory and vibration type decomposition method to determine the equivalent wind-induced vibration force and then calculate the β, Zhao et al. [15] calculated the β of transmission tower based on this method combined with wind tunnel test data, showing that the equivalent displacement determined by it is close to the test value. However, the code is not applicable for some specific towering structures, for example, for transmission towers with cross arms and cross partitions, it is not suitable for direct code calculation due to the uneven variation of their shape and mass distribution, and the accuracy of β calculation for such transmission towers can be improved by considering the influence of local shape, mass and windshielding area as well as the correction factor of spatial correlation of fluctuating wind [16]. The above-mentioned Chinese and American load codes in the calculation of β part of the structure shape and mass distribution made the assumption of uniform changes along the height, however, for LTs there are certain parts of the structure does not meet the assumption of the code on the shape change, so the accuracy of using the code to calculate β of LT structures remains to be studied.
The aforementioned research efforts provide a reference for LTs’ β. However, the influence of the complex aerodynamic shapes and structural forms of twisted columns and spiral beams on β has not received attention in those pieces of research and the rationality of using existing load codes for the wind-resistant design of LTs needs to be assessed. In this paper, a unique distribution characteristic for β of the LT is discussed and a correction method for two general load code that take into account the influences of the local shape and θ change is proposed. We determine the aerodynamic force coefficient and wind-induced response of the LT through a wind tunnel test, establish a FEM to calculate the displacement response time history of each node, and calculate the displacement wind-induced vibration coefficient βd (also known as gust load factor) and inertial load wind-induced vibration coefficient βi(z) of the LT by combining the FEM and wind tunnel test data. The distribution of β under different θ, v, and heights is analyzed. On this basis, the influences of wind spectrum type, ξ, and g on β are analyzed. By considering the influence of the local shape and θ change to correct β when calculating the Chinese load code and American load code. The research results of this paper can provide a reference for the wind-resistant design and wind effect estimation of spiral landscape tower structures.

2. Wind Tunnel Test and Wind-Induced Vibration Coefficient Analysis of the LT

2.1. Design and Manufacture of Wind Tunnel Scale Model

2.1.1. Aeroelastic Model

The LT is one landmark structure in Chongqing, China. It comprises upper and lower structures (Figure 1a). The upper structure contains the sphere on the top of the tower, ribbon, and platform (as shown in Figure 1b), with a total height of ~25.66 m. The lower part is the whole spiral staircase, with a height of ~38.10 m. The total height of the LT is 63.76 m. The sphere on the top of the building is a light hollow thin-walled steel ball, the ribbon is a lattice system formed by two box girders and intermediate connecting box girders, and the platform is composed of a box girder skeleton. Additionally, the lower spiral staircase is composed of an arc-shaped box girder and a counterclockwise torsion steel box column.
The test was conducted in the TK-400 DC wind tunnel laboratory of Tianjin Research Institute for Water Transport Engineering, MOT. The size of the wind tunnel laboratory is 15 m × 4.4 m × 2.5 m, and the test wind speed is continuously adjustable from 0 to 30 m/s. Based on the laboratory size and the requirement that the model’s blocking ratio is less than 5%, the geometric similarity ratio of the scaled aeroelastic model is designed to be λL = Lm/Lp = 1/50, where L is geometric dimension; λ is the similarity ratio; Subscripts m and p are the scaled aeroelastic model and prototype, respectively. The total height of the prototype LT is 63.76 m, and the scaled aeroelastic model is 1.28 m. According to the inertia force similarity criterion, the mass similarity ratio λm is determined as λm = (λL)3 = 1/125,000, where m is mass. The LT is a sharp-edge structure with an obvious separation point. It has a little alteration in dislocation under gravity; therefore, the Reynolds number and Froude number similarity criterion can be ignored in the model design [17,18]. Thus, the frequency similarity ratio is not a distinctive value, making the design of the aeroelastic model more flexible. Furthermore, the aeroelastic model design of the LT should meet the requirements of Strouhal number, Cauchy number, density ratio, and ξ [19].
When making the handrail and stair surface of the LT, Acrylonitrile–Butadiene–Styrene (ABS) plastic is employed to prepare the pneumatic coat to meet the requirements of similar aerodynamic shape. Additionally, the handrail and stair surface are cut and separated at a particular distance to prevent the pneumatic coat form a whole and providing more stiffness and damping to the whole structure. The lead sheet is evenly arranged on the stair surface to ensure that the model meets the mass similarity ratio. The model force skeleton is made of the same steel as the real structure and meets the similarity of the aerodynamic shape. The finished scaled aeroelastic model is depicted in Figure 1a.
Conducting free vibration tests under artificial excitation [20], weighing on the finished LT model, and the data of the acceleration time histories at the top of the tower were explored to determine the primary frequency, first-order modal ξ, and mass of the model tower, which were 5.407 Hz, 0.022, and 2.930 kg, respectively. Furthermore, compared with the corresponding values of 0.329 Hz, 0.020, and 2.912 kg of the prototype structure determined by the FEM. The relative error of ξ simulation was 9.1%, and the relative error of the mass simulation was 0.6%. The comparison results indicate that the aeroelastic model meets the test requirements. According to the fundamental frequency ratio between the manufactured scale model and the prototype, the frequency similarity ratio λn is determined as λn = nm/np = 16.43, where n is the frequency. According to Strouhal number similarity criterion, the wind velocity similarity scale λv is determined as λv = λn λL = 0.33, where v is the wind velocity. According to the dimensional relationship, the acceleration similarity scale λa is determined as λa = λL·(λn)2 = 5.40, where a is the acceleration. The same component materials and refined model manufacturing make ξ of the model and prototype the same, so the damping similarity ratio λξ equals to 1. Based on the requirements of the stated similarity laws, the similarity ratios of this scaled model are presented in Table 1.

2.1.2. Rigid Sectional Model

As each part of the LT has a unique geometric shape, the representative aerodynamic shape section is chosen as the research area for designing the rigid model. The analysis of the ultimate aerodynamic shape of the LT can be categorized into two parts. One part is the upper part of the LT, and the other is a spiral staircase with a rotation cycle. Following the various heights of the upper part and the spiral stairs, the geometric similarity ratios of the two parts are determined to be 1/50 and 1/20, respectively, under the condition that the blocking ratio is less than 5%. The rigid sectional model is made by increasing the wall thickness of the prototype steel box girder to ensure that the model’s rigidity is significantly sufficient. Figure 1b,c depict the fabricated rigid sectional model.

2.2. Simulation of Wind Fields

Following the Chinese load code [13] requirements, the 1/50 scale turbulent wind field of class B landform was simulated by arranging sharp splits and various rows of distributed harsh elements in the test section of the wind tunnel laboratory. The test arrangement is depicted in Figure 1b, in which class B landform generally refers to the suburban landform with sparse houses [21]. The equations for mean wind profile v(z) and turbulence profile Iz(z) are presented as follows:
v ( z ) = v ¯ 10 ( z 10 ) α
I z ( z ) = I 10 ( z 10 ) 2 α
where is v ¯ 10 the mean wind speed at 10 m standard height; α is the ground roughness index, and the value of 0.15 is used under the B class landform; I 10 is the nominal turbulence intensities at the height of 10 m, and the value of 0.14 is used under the B class landform. The Davenport wind speed power spectrum [22] can be determined by Equations (3) and (4).
n S v ( n ) K v ¯ 10 2 = 4 x 2 ( 1 + x 2 ) 4 / 3
x = 1200 n v ¯ 10   , n 0
where K is the ground roughness coefficient, ranging from 0.003~0.030; and S v ( n ) is the power spectrum of fluctuating wind speed.
The along-wind mean wind speed, turbulence, and wind power spectrum at the corresponding prototype height of 10 m at the model test location were compared with the recommended values in the Chinese load code [13], as depicted in Figure 2. The comparison shows that the simulated wind field fulfills the code requirements.

2.3. Layout of Measuring Points and Test Conditions

It is necessary to use the atmospheric boundary layer model wind tunnel test to obtain the wind-induced response time history value of the landscape tower for calculating βd and βi(z) of the landscape tower test. The acceleration sensor 4507-B-006 produced by B&K company in Denmark and the high-precision laser displacement sensor HL-C235BE produced by Panasonic industrial equipment company in Japan were used to measure the acceleration response and displacement response of the LT, respectively.
To explore the effect of the θ and v change on βd of the LT, θ is characterized as 0° when it is in the positive direction along the x-axis and 90° in the positive direction along the y-axis. The definition of θ is depicted in Figure 3. For the LT with asymmetric cross-section, its model needs to be rotated once to fully consider the influence of θ. Therefore, the test θ conditions are set as 0°~345°, with 15° intervals. The wind speed in the laboratory is controlled by voltage. The design average wind speed at the reference height of 10 m of the LT is 28.5 m/s, whose corresponding model wind speed is 12 m/s. The sensitivity of measuring equipment and its wind-induced vibration should also be considered in the selection of test wind speed. Considering the above three factors, the test v conditions are set as 7.5, 8.6, 9.8, 10.7, 11.9, and 13 m/s. The wind speed in the aforementioned working conditions is the model’s mean wind speed at 1 m. Furthermore, the laser displacement sensor has a sampling frequency of 1024 Hz, and a sampling time of 60 s.
Since βd is determined by the top displacement response, two measuring pieces of laser displacement meter are arranged at the measuring point A1 of the sphere on the top of the LT, and the displacement of the sphere in the along-wind and crosswind directions are measured, as shown in Figure 4a. The dynamic signal acquisition analyzer in the laboratory can realize the synchronous acquisition of 8 measured accelerations. Two accelerometers are arranged at each measuring point, which can realize the simultaneous measurement of four different positions. To determine the distribution curve of βi(z), the distance between adjacent measuring points should be approximately equal, and they should be arranged on the same side of the spiral staircase. Moreover, the measuring points should be arranged on the top and platform position with large acceleration. Thus, measuring points A1–A4 were arranged from top to bottom at the top sphere position, the platform position, and the tower at different heights, as shown in Figure 4a. Additionally, two acceleration sensors in the x and y directions are installed at each measuring point, totaling eight acceleration sensors. The sampling frequency of the acceleration sensor is 1024 Hz, and the sampling time is 60 s.
The aerodynamic force of the LT is obtained through the wind tunnel test of the rigid sectional model. As there are upper and lower structural connections in the LT for a rotating cycle spiral stair, the rigid sectional model is added with a cover plate to affect the two-dimensional flow during the rigid sectional force test to simulate the real situation. Furthermore, the upper structure has no structural connection above the actual LT structure; therefore, it is not necessary to consider the two-dimensional flow simulation. The test mean wind speed of the rigid sectional model of the upper part is v ¯ = 11.5 m/s (0.675 m above the ground), the spiral staircase with a rotation cycle is v ¯ = 8.34 m/s (0.32 m above the ground), and θ is 150°. The sampling frequency of the aerodynamic drag on the balance is 1024 Hz and the sampling time is 60 s.

2.4. Analysis of the Wind-Induced Vibration Coefficient

2.4.1. Displacement Wind-Induced Vibration Coefficient

The height independent βd determined by the gust load factor method [23] is,
β d = 1 + g σ y / y ¯
where the g is the gust load factor, and the value range of g is generally 3.0–4.0. Subsequently, according to the measured displacement extremum response at the tower top, g is determined to be 3.5, σ y is the standard deviation of along wind displacement, and y ¯ is the mean along-displacement.
βd of the top sphere under different wind directions and wind speeds was estimated by Equation (5) using the along-wind displacement wind tunnel test data of the top sphere. The result is depicted in Figure 5a. In Figure 5a, βd changes obviously under various wind yaw angles. For example, when θ is 30°, the maximum value of βd is 3.366, the minimum value of βd is 1.688, and when θ is 165°, the maximum value is 1.994 times the minimum value. Therefore, the impact of θ on βd cannot be neglected while designing the LTs, and its impact should be supplemented in current codes. However, in Figure 5b, βd does vary substantially significantly with the increase in wind speed, and the maximum value is only 1.04 times the minimum value. Therefore, for the wind-resistant design of LTs, the effect of wind speed on βd can be neglected.

2.4.2. Inertial Load Wind-Induced Vibration Coefficient

According to the Chinese load code [13], the first vibration mode plays a primary role for general cantilever high-rise structures because the spectrum is relatively sparse. Due to the irregular wind-shielding area distribution and mass distribution along the height along the height, obtaining the calculated parameters at a point is challenging. Therefore, this study selects representative sections based on the layout of the measuring points of the scaled aeroelastic model (see Figure 4b) for the model sections) and calculates βi(z) of each section of the LT according to Equation (6) [15].
β i ( z i ) = 1 + g M ( z i ) σ a ( z i ) μ z ( z i ) C d ( z i ) ω 0 A ( z i )
where z i is the height of the measuring point in section i, σ a ( z i ) is the RMS value of the along-wind acceleration at the measuring point in section i of the structure, which can be calculated according to Equation (7):
a ( z i , t ) = a x ( z i , t ) cos α + a y ( z i , t ) sin α
where a x ( z i , t ) and a y ( z i , t ) are the test acceleration time histories of measuring point of section i of the structure on the x- and y-axes, respectively. Furthermore, we can convert to prototype data following the similarity ratio in Table 1. μ z ( z i ) is the variation coefficient of wind pressure height based on μ z ( z i ) = ( z i / 10 ) 2 α and ω 0 is the primary wind pressure according to ω 0 = ρ a v 0 2 / 2 , where ρ a is the air density with a value of 1.225 kg/m3, v 0 is the essential wind speed, which is 28.5 m/s following the design data, M ( z i ) and A ( z i ) are the mass and windshielding area of section i of the structure, which can be estimated through the FEM, and C d ( z i ) is the drag coefficient of section i of the structure, which is estimated by Equation (8).
C d ( z i ) = F x sin α + F y cos α 0.5 ρ a A x v ¯ 2
where Fx and Fy are the test data of force balance of the rigid sectional model in the x- and y-axis, respectively, Ax is the area of the projection surface of the rigid sectional model perpendicular to the direction of the incoming wind. The rigid sectional model of the upper structure and spiral staircase is 0.014 and 0.009 m2, respectively, and v ¯ is the mean wind speed at the center height of the rigid sectional model the body axis of the rigid sectional model refits with the balance axis. According to Equation (8), the drag coefficient of the upper part of the LT and the spiral staircase under 150°wind yaw angles are 0.615 and 0.755, respectively.
Following the test data, βi(z) along the height at the 150° wind yaw angle is determined by Equation (6), as depicted in Figure 6. βi(z) of the LT grows with the height, reaching a maximum value of 3.018 at the top.

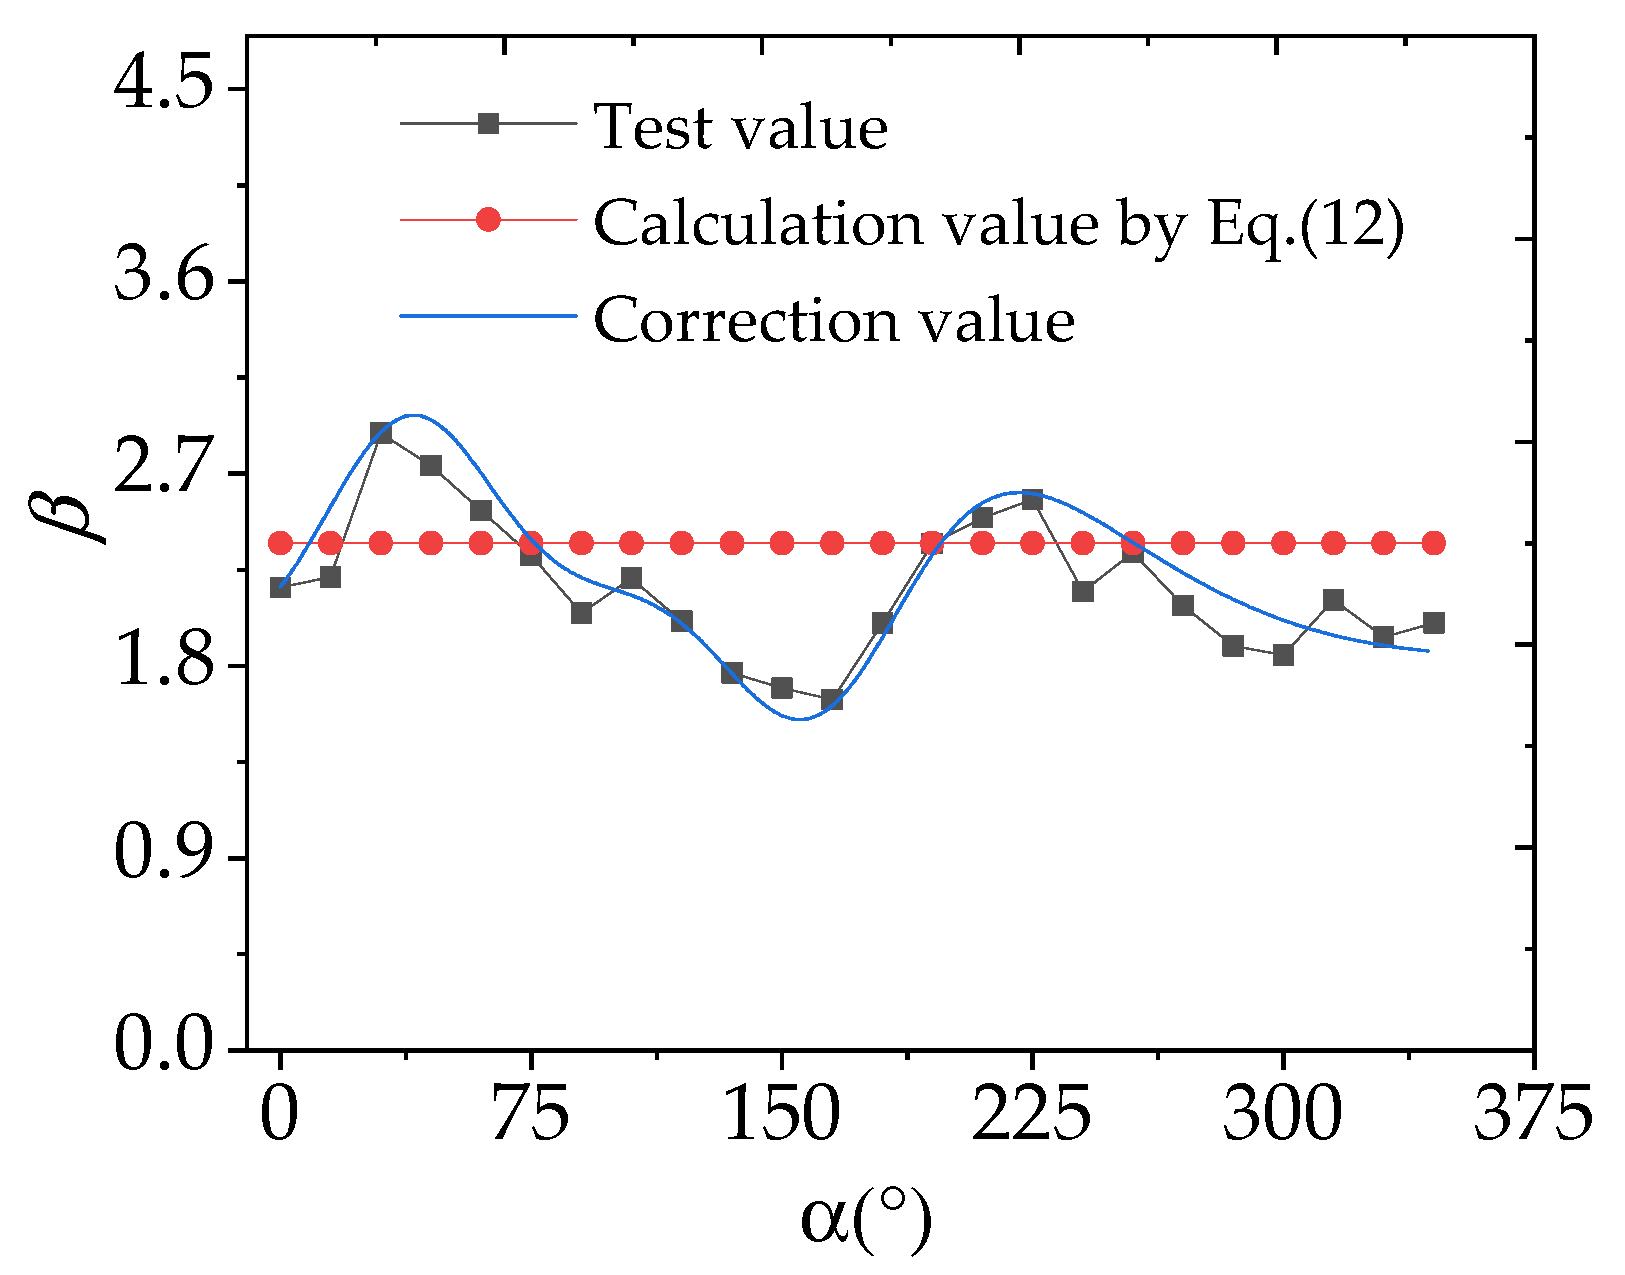
3. Calculation of Wind-Induced Vibration Coefficient and Analysis of Influence Parameters

Due to the limitations of measuring points that are insufficient to fully reflect the variation of βi(z) of the LT along the height. Therefore, the time history values of the wind-induced vibration responses of various measuring points along the height of the LT are obtained through numerical simulation to calculate βi(z). In addition, there are differences in the selection of wind spectrum type, ξ and g in the current national codes. Therefore, this paper studies the influence of different wind spectrum type, ξ and g on the calculation of βi(z) through time-domain analysis and evaluates and revises the accuracy of using the Chinese and American load codes to calculate β of the LT.

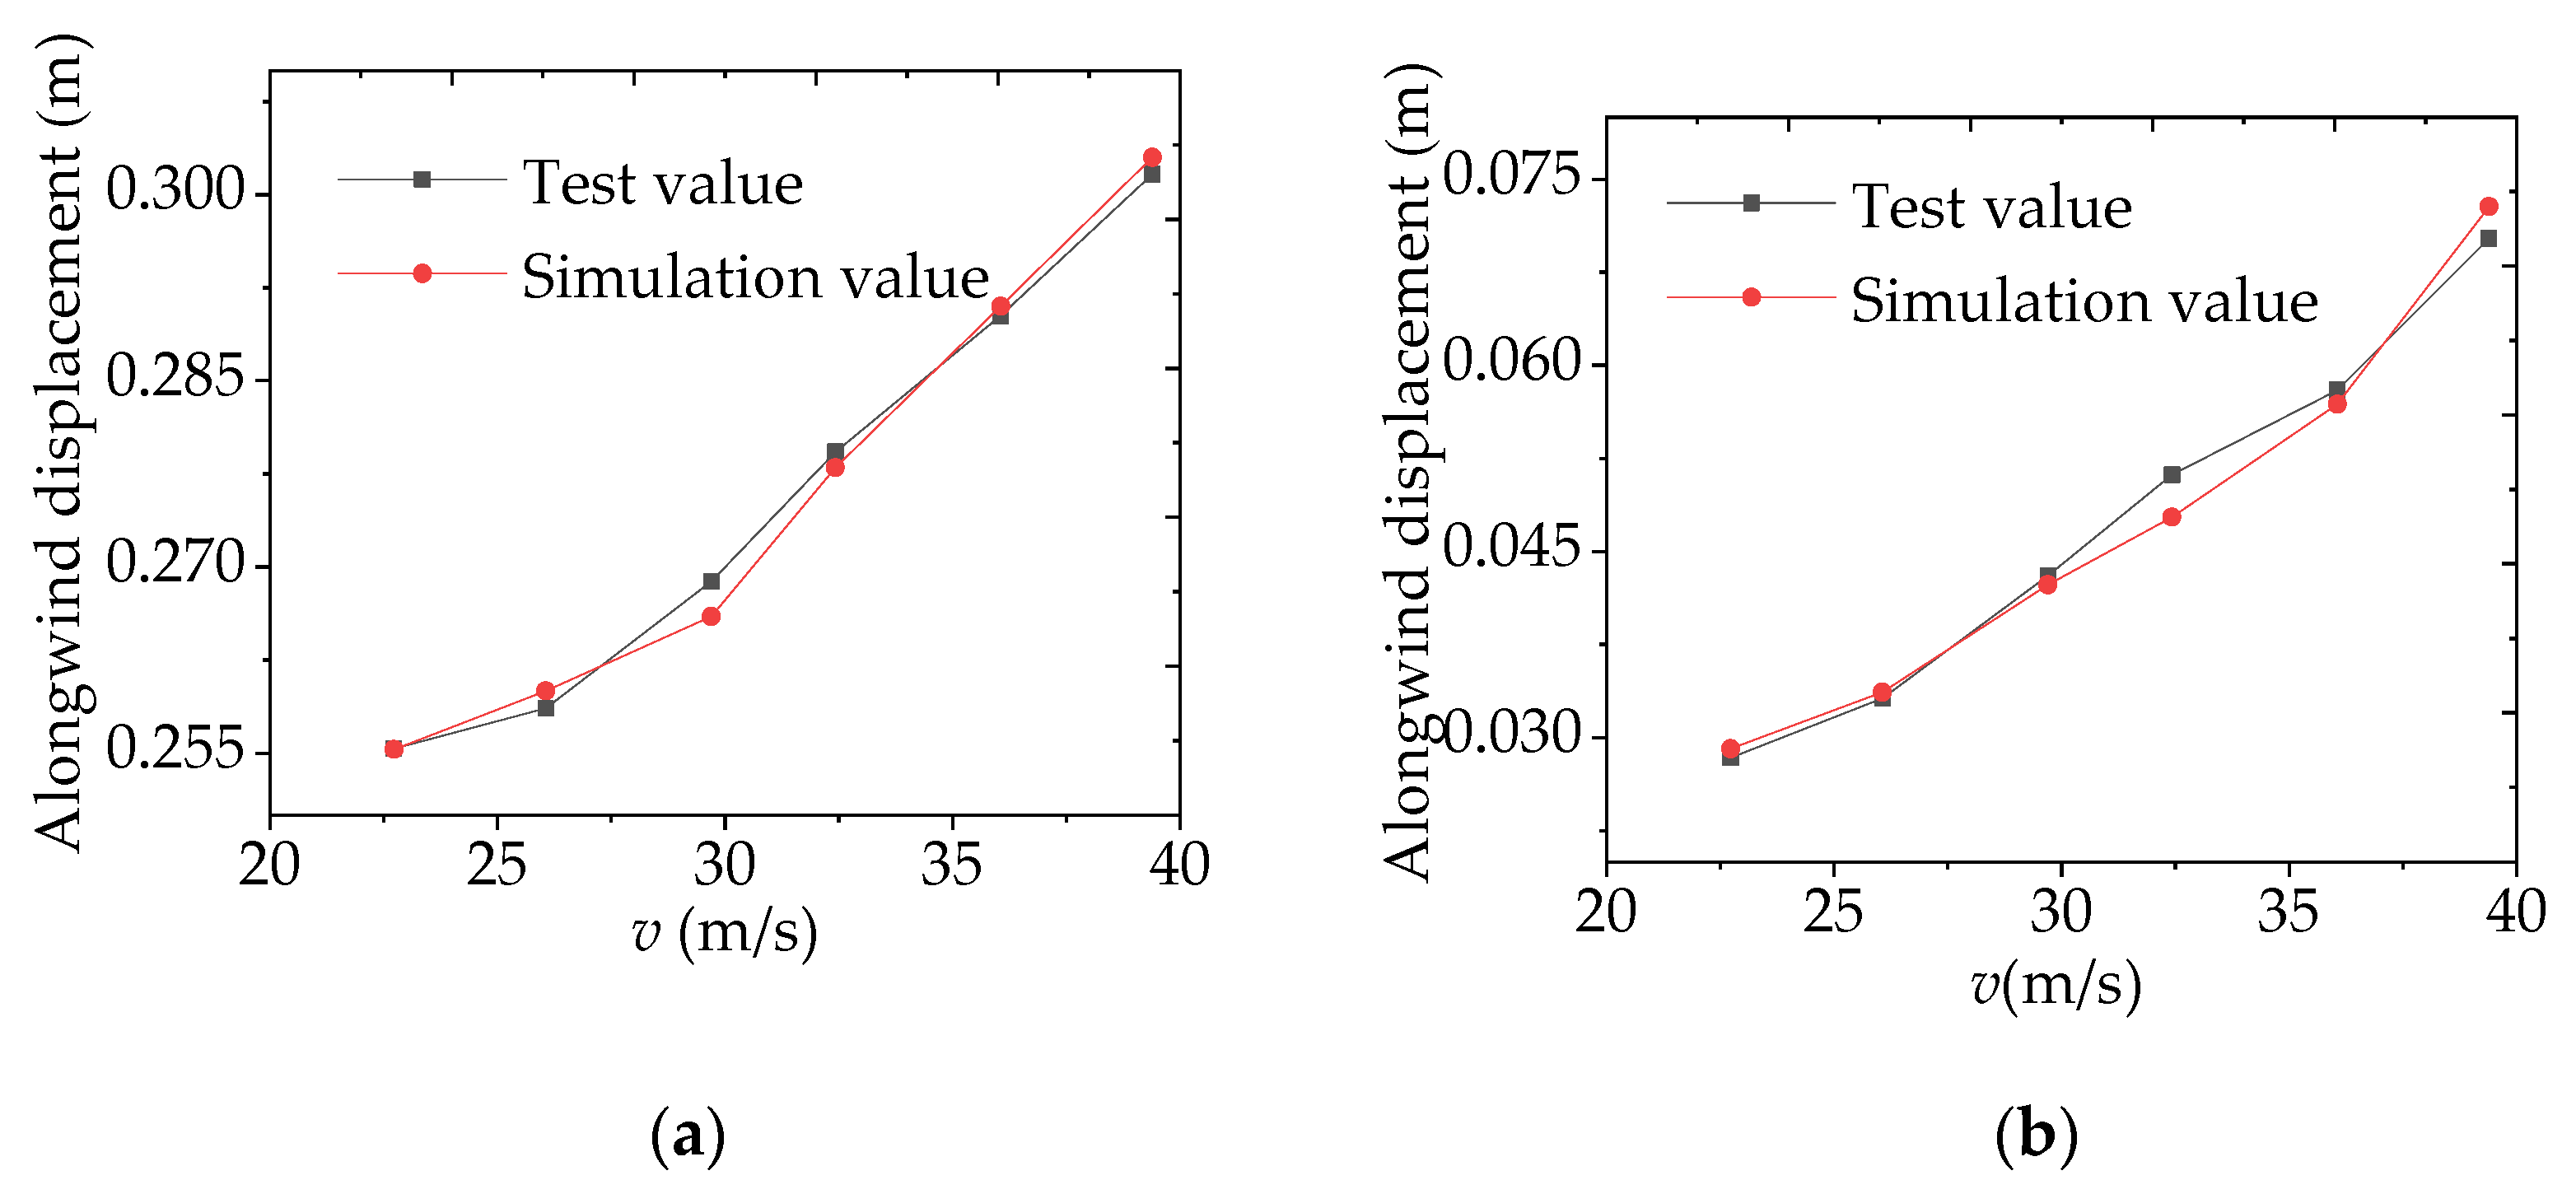
3.1. Establishment and Verification of Finite Element Model

The LT’s spatial structure model is established using ANSYS finite element software. In the pre-processor module, a FEM of the LT is built with a medium, thin steel box girder, and the beam188 element [24], also known as the 3D linear finite strain beam element, which satisfies the mechanical deformation requirements of elastic, creep, and plastic material models. Furthermore, the nodes at both ends have 6–7 degrees of freedom and can sustain axial tension, compression, and bending loads. The influence of shear deformation is calculated based on the Timoshenko beam theory [25]. The section and material characteristics of the LT are given according to actual design parameters. Fixed support is used at the bottom of the FEM. Next, the FEM is meshed by intelligent meshing commands. In the process module, the aerodynamic damping of the LT is considered, and the transient dynamic analysis is used for the time domain calculation of the FEM. In the post-processor module, the displacement and acceleration of the target measurement point are obtained. The completed FEM is depicted in Figure 4a.
We calculated the along-wind vibration response of the LT under a 150° wind yaw angle and five different wind speed through the FEM and compared the response of measuring point A1 with that determined by the aeroelastic model testing, as shown in Figure 7. Figure 7 indicates that the wind vibration response data obtained through numerical simulation accurately calculates the wind-induced vibration coefficient of the landscape tower. The mean and standard deviation of displacement determined by the FEM and the wind tunnel test of the aeroelastic model is reasonably close.

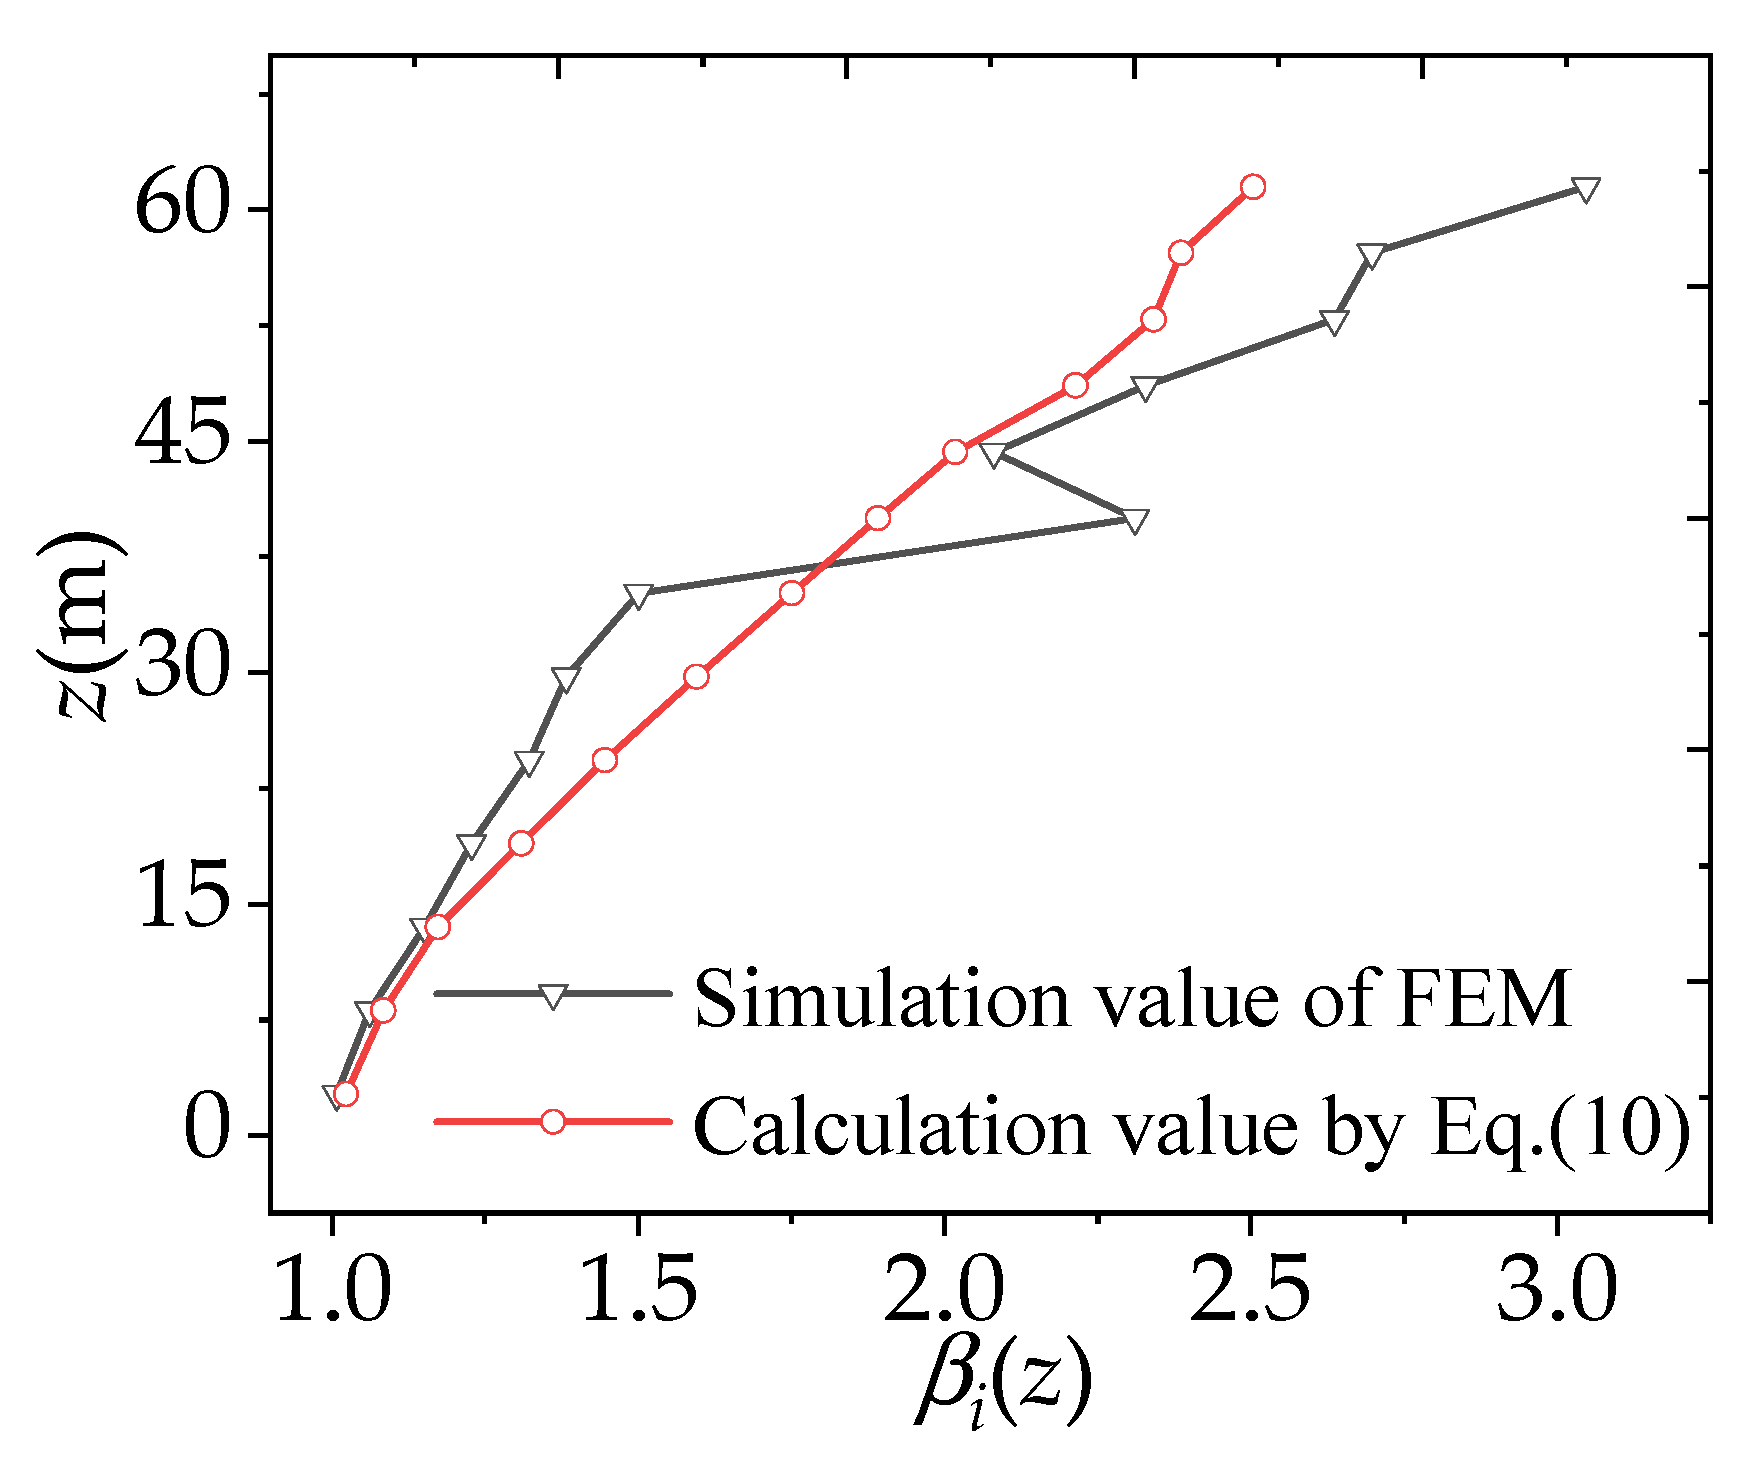
3.2. Analysis of the Influence Parameters of Wind-Induced Vibration Coefficient

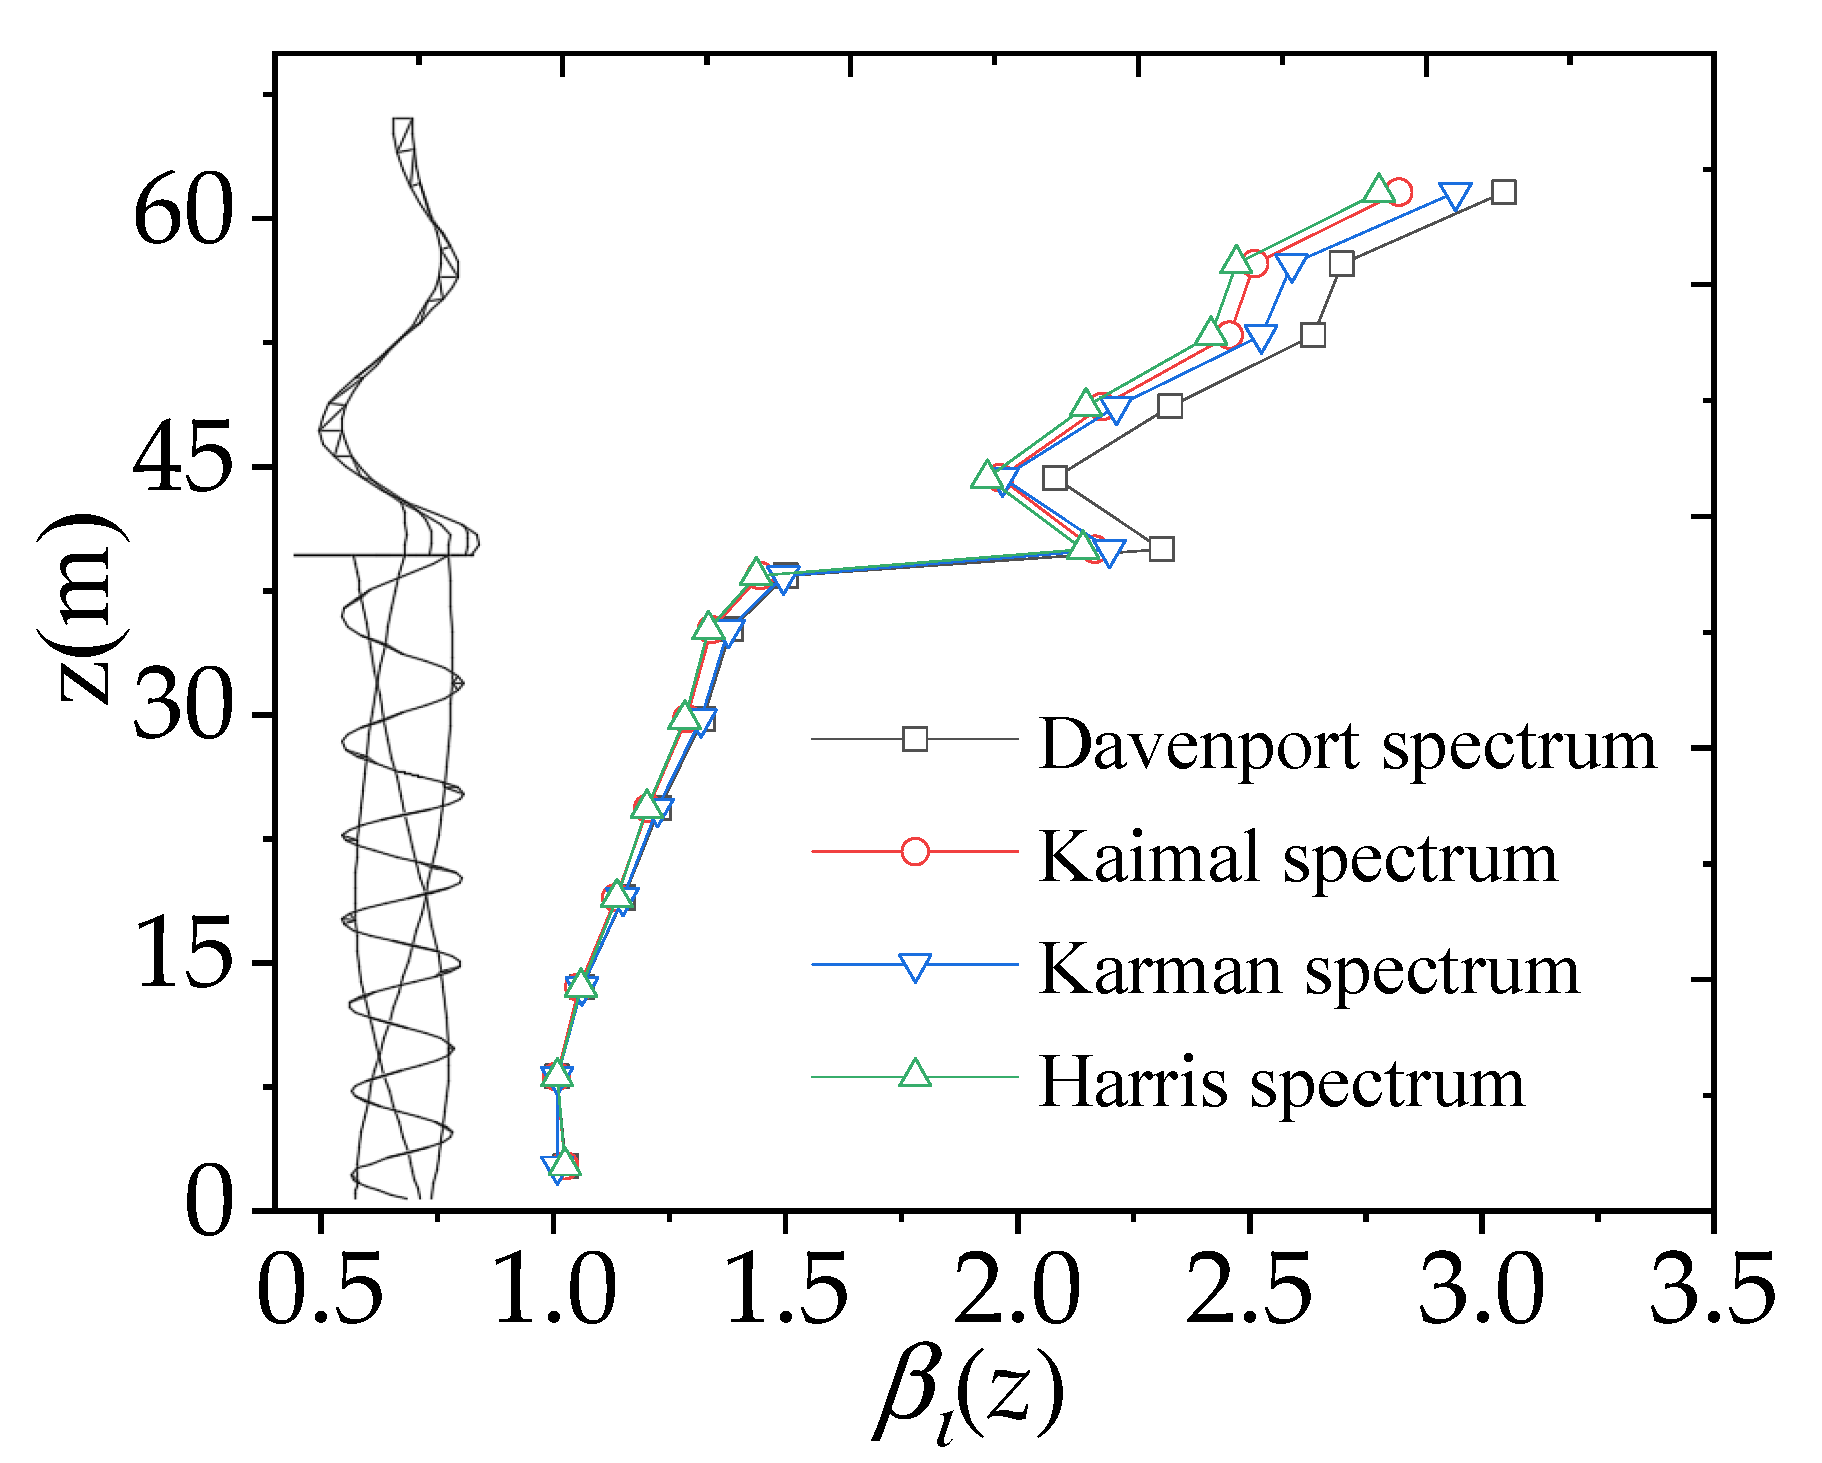
3.2.1. Wind Spectrum Type

Various fluctuating wind speed spectra are used in calculating design wind load in current codes at home and abroad. Chinese and Canadian building structure codes adopt the Davenport wind speed spectrum that does not change along the height. The codes of Europe, America, Japan, and Australia adopt significantly important fluctuating wind speed spectrum, among which Australia adopts the Harris wind speed spectrum [26], Japan adopts the Karman wind speed spectrum [27], and American and Europe adopt the Kaimal wind speed spectrum [28]. This study uses Davenport, Harris, Karman, and Kaimal’s four typical wind speed spectra as the input spectrum. It uses finite element software to analyze and acquire the acceleration response of the LT under various wind spectra to investigate the variations between the selection of different wind speed spectra and the value of the wind-induced vibration coefficient of the landscape tower. Based on Equation (6), βi(z) of each section of the LT under 150°wind yaw angles are calculated. The comparison curve of βi(z) varying along the tower height is shown in Figure 8. It can be observed that βi(z) of the LT under different wind speed spectra increases along the height as a whole and increases sharply at the platform, and its distribution characteristics are distinct from other common towering structures. The alteration of the wind spectrum has a minor impact on the distribution shape of βi(z).
Based on Equation (9) [29], we computed the weighted value of the wind-induced vibration coefficient βw of the whole tower under various wind spectra, as presented in Table 2. Under different wind spectra, βw of the LT changes slightly. Additionally, βw corresponding to the Davenport spectrum is the largest, and the Kaimal spectrum is the smallest. The maximum value is 1.062 times the minimum value. βd of the LT under 150°wind yaw angle is 1.696, which is close to the value of βw calculated by the Kaimal spectrum. However, the physical significance of the weighted wind-induced vibration coefficients and βd differs. In contrast, the latter may be used to assess wind-induced vibration coefficients that change with height; Therefore, the ratio of wind-induced vibration coefficients determined by different wind spectra in Table 2 is approximately equal to the ratio of extreme values of wind-induced vibration displacement of the LT estimated by these wind spectra. Therefore, the Davenport wind speed is more conservative than the other three wind speed spectra in the wind-resistant design of LTs.
β w = i = 1 n β i ( z i ) μ z ( z i ) A i z i i = 1 n μ z ( z i ) A i z i

3.2.2. Damping Ratio
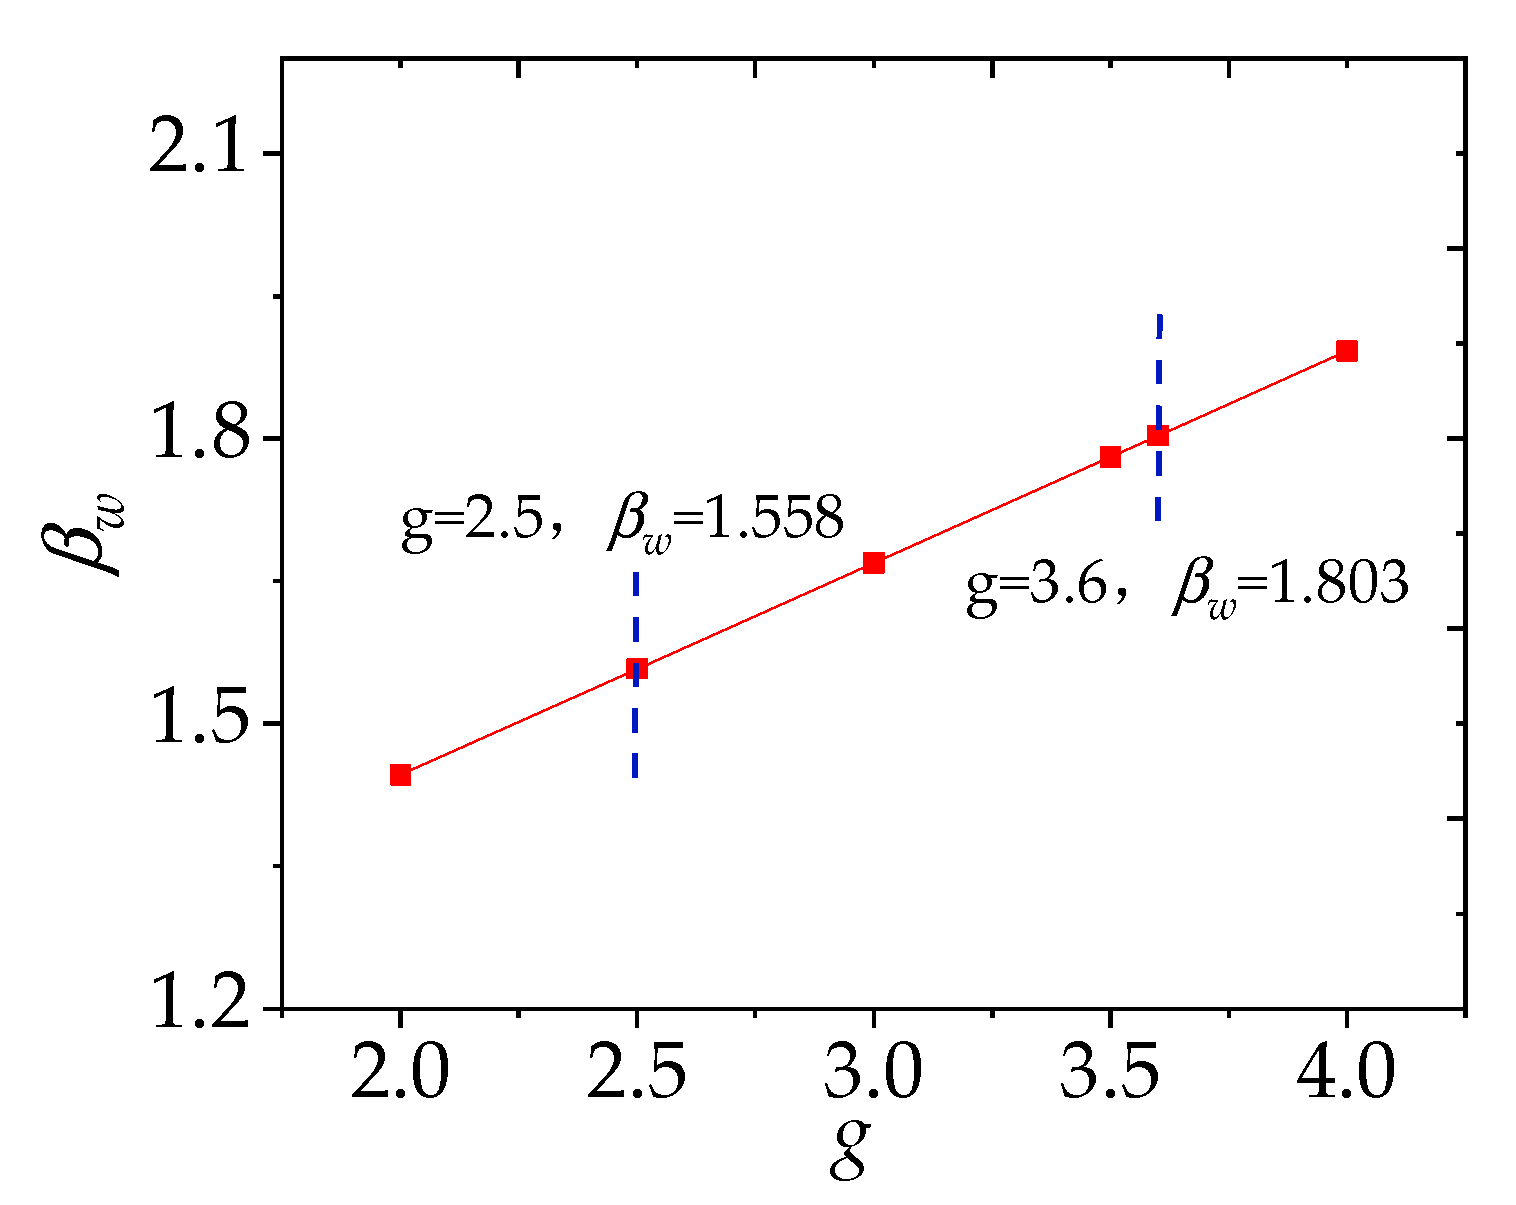
Structural damping substantially impacts the wind-induced vibration response of single tower structures. Chinese load code GB 50135-2006 [30] and Canadian code [31] stipulate that the first-order ξ of steel structure is 0.01; Japanese code [32] suggest that the frame steel tower be adjusted to 0.02; ξ of lattice iron tower is proposed as 0.04 in American load code [10]. This study uses the Davenport wind speed spectrum as the input spectrum. g = 3.5 is used to analyze the effect of various ξ value on βw. The value of βw of the LT calculated based on Equation (9), when the ξ is 0.01, 0.02, 0.03, 0.04, and 0.05, is presented in Table 3. With increasing ξ, the βw of the LT drops, and the rate of decline slows as the ξ rises. βw estimated using ξ = 0.01 is 10.70% and 24.33% larger than that calculated by ξ = 0.02 and ξ = 0.04, respectively. This indicates that the wind-resistant design for LTs using ξ value recommended by Chinese load code, Canadian code and Japanese code is more conservative than using that recommended by American load code.

3.2.3. Peak Factor

In American load code [10] and Canadian load code [31], the value range of g is 3.5–4.0, which is commonly considered to be 3.6. This is close to the recommended value of 3.7 in Australia and New Zealand load codes [33]. In contrast, in Chinese load code [13], g = 2.5 is quite different. Considering the Davenport wind speed spectrum as input spectrum and ξ = 0.02, when g is equal to 2.0, 2.5, 3.0, 3.5, 3.6 and 4.0, respectively, the variation curve of βw of the LT calculated based on Equation (9) is depicted in Figure 9. It can be observed that βw increases linearly with g, where g = 3.6, which is 15.73% greater than that of g = 2.5. This indicates that the wind-resistant design for LTs using g value recommended by American, Canadian and New Zealand codes are more conservative than using that recommended by Chinese load code, but after considering the influence of different ξ value, the design level of the two code is close.

3.3. Wind-Induced Vibration Coefficient Calculation Using Chinese and American Codes

In the Chinese load code [13], for general vertical cantilever structures, the wind-induced vibration coefficient βi(z) at height z can be calculated as follows:
β i ( z ) = 1 + 2 g I 10 B z 1 + R 2
where the specification of g is 2.5, and B z and R are the background component factor and resonance response molecule of fluctuating wind load, respectively. The comparison between βi(z) of the LT calculated using Equation (10) and the numerical simulation is shown in Figure 10. It can be observed in Figure 10 that the calculation result using the code is greater than that using the numerical simulation below the platform position, and vice versa above the platform position, and the shape distribution of the two βi(z) is different, which leads to insufficient equivalence to the internal force of the LT using βi(z) determined by the code. Using the βi(z) determined by the code and numerical simulation in Figure 10, the βw calculated by Equation (9) are 1.761 and 1.803, respectively. Next, these two βi(z) in Figure 10 are used to calculate the equivalent displacement of the LT, and the relative error of the top displacement obtained from the code compared to that obtained from the FEM is −7.2%, indicating that βi(z) determined by code is on the unsafe side. On the other hand, this also shows that βi(z) at the top contributes more to the response than that at the bottom, which cannot be represented by βw.
The influence of the nonuniform shape and mass distribution on βi(z) should be considered when calculating by Chinese load code. Since the ribbon shape is similar to the conical change (as shown in Figure 1b), the abrupt increase of the mass at the platform position results in a local increase in βi(z), and the lower part shape of the LT (as shown in Figure 1a) changes periodically, the local shape change correction coefficient θ(z) for βi(z) is provided in three parts. We obtain the distribution of θ(z) by the ratio of βi(z) determined by numerical simulation and the Chinese load code, respectively, and then determine the expression of θ(z) by nonlinear fitting method, as shown in Equation (11). Thus, βi(z) of LTs can first calculated using the Chinese load code, and then βi(z) is corrected with the correction coefficient θ(z) to determine βc(z) = θ(z) × βi(z). βc(z) was used to calculate the equivalent displacement of the LT, and the relative error of the top displacement obtained from βc(z) compared to that obtained from the FEM is 1.7%, which indicates that the correction effect is well.
θ ( z ) = { 1.218 ( z H ) 0.503 ,   z > z n 1.230 ,   z = z n 0.936 ,   z < z n
where H is the total height of LTs, zn is the height of the platform.
In the American load code [10], for flexible or dynamic sensitive buildings, βd is calculated using the following equation:
β d = 0.925 ( 1 + 1.7 I z ¯ g Q 2 Q 2 + g R 2 R 2 1 + 1.7 g v I z ¯ )
where g Q and g v will be taken as 3.4, g R is given by R, the resonant response factor, I z ¯ is the intensity of turbulence at height z ¯ , where z ¯ is the equivalent height of the structure defined as 0.6 h, and Q is background response.
The comparison of βd calculated from the test data and from the Equation (12) is depicted in Figure 11. Based on Figure 11, the βd of the LT estimated by the American load code envelops most of the wind yaw angles. However, βd of the tower top test is greater than the code value under the wind yaw angles of 30°–60°and 195°–225°. The normal value is unsafe under these wind yaw angles, of which the difference is the largest at θ of 30°, and it is 1.216 times of the code value. Therefore, when estimating βd of LTs using the American load code, the influence of the change of θ on βd should be regarded.
The multimodal fitting method [34] was used to obtain θ correction coefficient η(θ) of βd considering θ change. We acquire the distribution of η(θ) by the ratio of βd determined by wind tunnel test data and the American load code, respectively, and then determine the expression of θ(z) by the multimodal fitting method, as shown in Equation (13). The values of the fitting parameters y0i, xci, wi, Ai of Equation (13) are shown in Table 4. Since βd calculated by the code is almost the same as that determined by the wind tunnel test data at θ of 195°, we take this degree as the benchmark to correct βd. The specific steps are as follows: First, βd of LTs under the benchmark θ can be calculated by American load code. Next, the wind-induced vibration coefficient of LTs under different wind yaw angle βc(θ) is calculated by βc(θ) = η(θ) × βd. Using the above method, βd calculated by the code is corrected and compared with that determined by the wind tunnel test, as shown in Figure 11. In Figure 11, βd calculated by the proposed method is in good agreement with that determined by the wind tunnel test as a whole and can envelope the maximum and minimum values of βd calculated from the test data. Hence, the proposed method can be used in the wind-resistant design of LTs.
η ( θ ) = i = 1 3 η i ( θ ) = i = 1 3 y 0 i + A i / ( w i × π / 2 ) × e { 2 × [ ( θ x c i ) / w i ] 2 }
We assume that the change of θ only affects the magnitude of βi(z) and does not affect its distribution shape, so the influence of θ on βi(z) is equivalent to its influence on βw. Both βw and βd implicitly use height and windshielding area as weights to determine their values, so their values are usually close. Since the magnitude of β of a LT is close to that of its βw, η(θ) can be used to determine βi(z) of a LT under different θ. Thus, βi(z) of a LT under θ = 195° is first calculated using the Chinese load code, then θ(z) proposed in this paper is used to correct βi(z) by βi′(z) = θ(z) × βi(z) and finally the accurate inertial load wind vibration coefficient βi′(θ,z) of a LT under different θ is determined by βi′(θ,z) = η(θ) × βi′(z). It should be emphasized this correction method can be applied to other structures of the LT type.

4. Conclusions

The results reveal that the design and fabrication of the aeroelastic model and the simulation of the wind field meet the test requirements upon comparing the model’s mass, the measured and design values of damping, as well as the mean wind profile, turbulence profile, and wind speed power spectrum of the test wind field. The displacement wind-induced vibration coefficient βd of the landscape tower with curved and twisted columns and spiral beams (LT) noticeably varies with the wind yaw angle θ, and the maximum value is 1.994 times the minimum value. The influence of the change of θ on βd should be considered when designing similar structures of the LT. In this case, βd is little affected by the change in wind speed. The LT’s inertial load wind-induced vibration coefficient βi(z) increase roughly along the height but increases sharply at the platform. The maximum value of βi(z) is obtained at the tower’s top.
The mean value and standard deviation of the displacement response of the tower top of the finite element model (FEM) are in good agreement with the test value, which ensures the accuracy of the wind-induced vibration response data of the LT obtained through numerical simulation. βi(z) of the LT calculated under Davenport is the maximum value, and Kaimal is the minimum value. The weighted value of the inertial load wind-induced vibration coefficient βw decreases with the increase of the damping ratio ξ, and the reduction rate slows down with the increase of ξ. βw increases linearly with the increase of the peak factor g. Among the three influencing parameters, ξ and g significantly influence the wind-induced vibration coefficient, which are the key to accurate design wind load of LTs.
When calculating the LT’s βi(z) according to the Chinese load code GB 50009-2012, βi(z) of the substructure of the LT is greater than the value determined by the FEM. However, for the upper part of the LT, the value of βi(z) is smaller than the value determined by the FEM. βd of the LT calculated by ASCE 7–10 is too small under wind yaw angles of 30°~60°and 195°~225°, so it needs to be improved according to the correction method. The local shape change correction coefficient θ(z) and the wind yaw angle correction coefficient η(θ) proposed in this paper can be used to improve the wind-induced vibration coefficients of the LT calculated by the Chinese load code and the American load code.

Author Contributions

Methodology, S.Z. and J.Y.; software, S.Z. and J.Y.; formal analysis, S.Z. and C.Z.; resources, J.L., B.Z. and B.L.; writing—original draft preparation, S.Z. and C.Z.; writing—review and editing, S.Z., C.Z. and Z.Y.; visualization, S.Z.; project administration, S.Z.; funding acquisition, Z.Y. All authors have read and agreed to the published version of the manuscript.

Funding

This research was funded by the Science and Technology Research Program of Chongqing Municipal Education Commission (Grant No. KJQN202001548), the Open Fund of Chongqing Key Laboratory of Energy Engineering Mechanics & Disaster Prevention and Mitigation (EEMDPM2021104), the Chongqing Jiulongpo science Foundation (2021-01-017-Y) and the R&D Program of China Construction Second Engineering Bureau Co. Ltd. (2021ZX180001), Open Research Project of University-Enterprise Collaborative Innovation Center of Chongqing University of Science & Technology (Grant No. YKJCX2120623), the National Natural Science Foundation of China via (Grant No.52178458), the Foundation of Chongqing Science and Technology Commission (2022NSCQ-MSX3631).

Institutional Review Board Statement

Not applicable.

Informed Consent Statement

Not applicable.

Data Availability Statement

Not applicable.

Conflicts of Interest

The authors declare no conflict of interest.

References

  1. Yang, B.; Lv, Z.H.; Wang, F. Digital Twins for Intelligent Green Buildings. Buildings 2022, 12, 856. [Google Scholar] [CrossRef]
  2. Kim, S.; Kim, T. Machine-learning-based prediction of vortex-induced vibration in long-span bridges using limited information. Eng. Struct. 2022, 266, 114551. [Google Scholar] [CrossRef]
  3. Zhao, S.; Yue, J.H.; Savory, E.; Yan, Z.T.; Chen, J.H.; Zhang, B.; Peng, L.L. Dynamic Windage Yaw Angle and Dynamic Wind Load Factor of a Suspension Insulator String. Shock Vib. 2022, 2022, 6822689. [Google Scholar] [CrossRef]
  4. Davenport, A.G. Gust loading factors. J. Struct. Div. 1967, 93, 11–34. [Google Scholar] [CrossRef]
  5. Han, Z.H.; Gu, M. Wind induced response and wind vibration coefficient analysis of large outdoor independent column billboard. J. Vib. Shock. 2015, 34, 131–137. [Google Scholar] [CrossRef]
  6. Gupta, A.; Pradyumna, S. Geometrically nonlinear dynamic analysis of variable stiffness composite laminated and sandwich shell panels. Thin Walled Struct. 2022, 173, 109021. [Google Scholar] [CrossRef]
  7. Yu, M.; Zhao, L.; Zhan, Y.Y.; Cui, W.; Ge, Y.J. Wind-resistant design and safety evaluation of cooling towers by reinforcement area criterion. Eng. Struct. 2019, 193, 281–294. [Google Scholar] [CrossRef]
  8. Ghosh, T.; Sil, A. Effect of aspect ratio subjected to wind hazard in tall buildings situated along the coastal line of India. Struct. Des. Tall Spec. Build. 2022, 31, e1930. [Google Scholar] [CrossRef]
  9. Azzi, Z.; Elawady, A.; Irwin, P.; Chowdhury, A.G.; Shdid, C.A. Aeroelastic modeling to study the wind-induced response of a self-supported lattice tower. Eng. Struct. 2021, 245, 112885. [Google Scholar] [CrossRef]
  10. American Society of Civil Engineers (ASCE). Minimum Design Loads for Buildings and Other Structures; ASCE 7-10; American Society of Civil Engineers: Reston, VA, USA, 2013. [Google Scholar]
  11. Davenport, A.G. The application of statistical concepts to the wind loading of structures. Proc. Inst. Civ. Eng. 1961, 19, 449–472. [Google Scholar] [CrossRef]
  12. Ma, T.T.; Zhao, L.; Ji, T.F.; Tang, T. Case study of wind-induced performance and equivalent static wind loads of large-span openable truss structures. Thin Walled Struct. 2022, 175, 109206. [Google Scholar] [CrossRef]
  13. GB 50009—2012; Load Code for the Design of Building Structures. China Architecture and Building Press: Beijing, China, 2012. (In Chinese)
  14. Rajabi, E.; Sadeghi, H.; Hashemi, M.R. Wind effect on building with Y-shaped plan. Asian. J. Civ. Eng. 2022, 23, 141–151. [Google Scholar] [CrossRef]
  15. Zhao, S.; Yan, Z.T.; Li, Z.L.; Dong, J.X.; Wang, L.Z. Investigation on wind-induced vibration coefficients of Sutong long span transmission tower based on wind tunnel tests. J. Build. Struct. 2019, 40, 35–44. [Google Scholar] [CrossRef]
  16. Zhao, S.; Yan, Z.T.; Savory, E. Design wind loads for transmission towers with cantilever cross-arms based on the inertial load method. J. Wind Eng. Ind. Aerodyn. 2020, 205, 104286. [Google Scholar] [CrossRef]
  17. Jaroslawski, T.; Forte, M.; Moschetta, J.M.; Delattre, G.; Gowree, E.R. Characterisation of boundary layer transition over a low Reynolds number rotor. Exp. Therm. Fluid Sci. 2022, 130, 110485. [Google Scholar] [CrossRef]
  18. Estrella, J.; Wuthrich, D.; Chanson, H. Two-phase air-water flows in hydraulic jumps at low Froude number: Similarity, scale effects and the need for field observations. Exp. Therm. Fluid Sci. 2022, 130, 110486. [Google Scholar] [CrossRef]
  19. Abdelaziz, K.M.; Hobeck, J.D. Optimum aeroelastic control via iterative neural network training for wind-resistant cyber–physical buildings. Appl. Soft. Comput. 2022, 114, 108100. [Google Scholar] [CrossRef]
  20. Nikravesh, F.; Toopchi-Nezhad, H. Application of Viscoelastic Tuned Mass Dampers in Vibration Mitigation of Steel Joist Jack Arch Floor Structures. Shock Vib. 2022, 2022, 5196600. [Google Scholar] [CrossRef]
  21. Holdt, J.R.C.; Eckardt, F.D.; Baddock, M.C.; Hipondoka, M.H.T.; Wiggs, G.F.S. Influence of sampling approaches on physical and geochemical analysis of aeolian dust in source regions. Aeolian Res. 2021, 50, 100684. [Google Scholar] [CrossRef]
  22. Krug, D.; Baars, W.J.; Hutchins, N.; Marusic, L. Vertical coherence of turbulence in the atmospheric surface layer: Connecting the hypotheses of Townsend and Davenport. Bound.-Layer Meteorol. 2019, 172, 199–214. [Google Scholar] [CrossRef] [Green Version]
  23. Picozzi, V.; Malasomma, A.; Avossa, A.M.; Ricciardelli, F. The Relationship between Wind Pressure and Pressure Coefficients for the Definition of Wind Loads on Buildings. Buildings 2022, 12, 225. [Google Scholar] [CrossRef]
  24. ANSYS, Inc. Ansys Mechanical APDL Structural Analysis Guide; ANSYS, Inc.: Canonsburg, PA, USA, 2017. [Google Scholar]
  25. Hutchinson, J.R. Shear coefficients for Timoshenko beam theory. J. Appl. Mech. 2001, 68, 87–92. [Google Scholar] [CrossRef]
  26. Cook, N.J. Implications of the OEN mixture model of the mean wind vector for the generation of synthetic timeseries and for the assessment of extremes. J. Wind Eng. Ind. Aerodyn. 2021, 208, 104424. [Google Scholar] [CrossRef]
  27. de Morais, D.R.; Foschiera, L.C.; Gomes, H.M. Time and Frequency Domain Analysis of Wind Turbine Towers Under Spatially Correlated Wind Field. Int. J. Steel Struct. 2021, 21, 2028–2044. [Google Scholar] [CrossRef]
  28. Patro, S.R.; Banerjee, A.; Adhikari, S.; Ramana, G.V. Kaimal spectrum based H2 optimization of tuned mass dampers for wind turbines. J. Vib. Control. 2022. [CrossRef]
  29. Yang, F.L.; Chen, B.; Xu, Z.Y.; Xu, Q.; Shao, S. Study on Wind-induced Vibration Coefficients of the Transmission Tower in a 500 kV Long Span Line Crossing the Yangtze River. Proc. CSEE 2022, 42, 2542–2556. [Google Scholar] [CrossRef]
  30. GB 50135—2019; Standard for Design of High-Rising Structures. China Planning Press: Beijing, China, 2019. (In Chinese)
  31. NR24-28/2015E; National Building Code of Canada. Associate Committee on the National Building Code, National Research Council: Ottawa, ON, Canada, 2015.
  32. AIJ 2010; Recommendations for Loads on Buildings. Structural Standards Committee. Architectural Institute of Japan: Tokyo, Japan, 2010.
  33. Joint Technical Committee. AS/NZS 1170.2: 2011 Structural Design Actions-Part 2: Wind Actions; Australian/New Zealand Standard (AS/NZS), Joint Technical Committee BD-006; Joint Technical Committee: Brisbane, Australia; Wellington, New Zealand, 2011. [Google Scholar]
  34. Gulliford, M.J.S.; Orlebar, R.H.; Bird, M.H.; Acha, S.; Shah, N. Developing a dynamic carbon benchmarking method for large building property estates. Energy Build. 2022, 256, 111683. [Google Scholar] [CrossRef]
Figure 1. Wind tunnel test model of the LT: (a) Aeroelastic model, (b) Rigidity model of up part tower, (c) Rigidity model of the staircase.
Buildings 12 01635 g001
Figure 2. Simulated wind flow in the wind tunnel: (a) Mean wind speed and turbulence intensity profiles; (b) Wind power spectrum profiles.
Buildings 12 01635 g002
Figure 3. Wind yaw angle definition for wind tunnel test of aeroelastic model.
Buildings 12 01635 g003
Figure 4. Measurement point layout and section of different measurement points for calculating βi(z): (a) Measurement point layout, (b) Section division of different measurement points.
Buildings 12 01635 g004
Figure 5. Displacement wind-induced vibration coefficient of the LT among different cases: (a) Different wind yaw angles, (b) Different wind speeds.
Buildings 12 01635 g005
Figure 6. Test value of βi(z).
Buildings 12 01635 g006
Figure 7. Comparison between test and simulation value of wind-induced vibration displacements: (a) Mean value, (b) Standard deviation.
Buildings 12 01635 g007
Figure 8. Comparison of wind-induced vibration coefficients among different wind speed spectra.
Buildings 12 01635 g008
Figure 9. Variation curve of the weighted wind-induced vibration coefficient with g.
Buildings 12 01635 g009
Figure 10. Comparison among different methods of βi(z).
Buildings 12 01635 g010
Figure 11. Comparison of displacement wind-induced vibration coefficients determined by American load code, by model wind tunnel test data and by the proposed corrected method using η(θ).
Buildings 12 01635 g011
Table 1. Similarity ratios of the scaled LT model.
ParametersSymbolUnitFormulaSimilarity Scale
GeometryLmλL = Lm/Lp1:50
MassMkgλM = (λn)31:125,000
FrequencynHzλn = nm/np16.43:1
Wind velocityvm/sλv = λL·λn0.33:1
Accelerationam/s2λa = λL·(λn)25.40:1
Damping ratioξ--1:1
Table 2. Comparison of weighted wind-induced vibration coefficients among different wind spectra type.
Wind Spectrum TypeDavenport SpectrumKaimal SpectrumHarris SpectrumKarman Spectrum
β w 1.8031.6981.7141.754
Table 3. Comparison among different ξ value of weighted wind-induced vibration coefficients.
ξ0.010.020.030.040.05
β w 2.1411.9341.8231.7221.637
Table 4. Fitting parameter values of Equation (13).
Parameters η 1 ( θ ) η 2 ( θ ) η 3 ( θ )
y0i1.813191.813191.81319
xci38.56747160.1066186.31045
wi49.8929854.63147121.99468
Ai67.1764−82.0824156.67953
Publisher’s Note: MDPI stays neutral with regard to jurisdictional claims in published maps and institutional affiliations.

