Article

Flexural–Shear Performance of Lightweight Concrete Panels with High Insulation Capacity

1
Department of Architecture Engineering, Kyonggi University, Suwon 16227, Kyonggi-Do, Korea
2
Department of Architectural Engineering, Graduate School, Kyonggi University, Suwon 16227, Kyonggi-Do, Korea
3
DongShin Panel Co., Ltd., Anyang 14059, Kyonggi-Do, Korea
*
Author to whom correspondence should be addressed.
Buildings 2022, 12(10), 1741; https://doi.org/10.3390/buildings12101741
Submission received: 2 September 2022 / Revised: 21 September 2022 / Accepted: 17 October 2022 / Published: 19 October 2022
(This article belongs to the Section Building Structures)

Abstract

:
With the increased interest in the inherent fire resistance of organic insulators, various precast concrete insulation panels have been developed. However, precast concrete insulation panels still have structural and fire resistance problems resulting from a low composite action and unclosed cross-sectional details. To improve composite action and fire resistance, this study proposes the closed cross-sectional details of insulator panels with lightweight aggregate concrete, insulation material, and wire mesh. The objective of this study is to examine the flexural–shear performance of precast lightweight concrete panels with closed cross-sectional details developed for exterior cladding with high insulation capacity. Six full-sized insulation panels were tested under two-point top loadings. The main investigated test parameters to vary the moment–shear ratio of the insulation panels were the amount of the shear reinforcement and shear span–effective depth ratio. Test results indicate that the insulation panels with moment–shear ratios of 2.60 or higher were governed by shear, indicating that the longitudinal bars remained in an elastic state until the peak load of the insulation panels was reached. Thus, an increase in the moment–shear ratio of the insulation panels led to more brittle failure characteristics. Meanwhile, the insulation panels governed by flexure exhibited plastic flow performance in the applied load–deflection curve and well-distributed cracks. In particular, the maximal flexural moments of insulation panels with moment–shear ratios of 0.75 or less were higher than those calculated from the equations specified in ACI 318-19, indicating that the composite action was fully exerted. Overall, the developed insulation panels with cross-sectional details must be designed to a have moment–shear ratio of 0.75 or less to fulfil the ductile response under extreme lateral loads and exert full composite action.

1. Introduction

Conventional inorganic panels are commonly produced with normal-weight concrete (NWC), which generally consists of ordinary Portland cement (OPC) and natural aggregates [1]. The use of NWC in panels improves durability and crack resistance, but reduces the efficiency of thermal conductivity [2,3]. Hence, the heat-transmission coefficient of conventional inorganic panels is large, ranging between 0.1 and 0.4 W/m2·K, when compared with those of organic panels such as sandwich panels, polystyrene, and polyurethane [4]. This implies that, to maintain a small heat-transmission coefficient, a thicker depth is required for conventional inorganic panels than that for organic panels [5]. The thick panel depth is the cause of high production costs and installation difficulties at construction sites due to the heavy self-weight [6]. To reduce the panel depth while maintaining a low heat-transmission coefficient, various experimental studies [7,8,9,10] on insulating concrete or insulators embedded at the center were conducted.
With the global interest in the inherent fire resistance of organic insulators, precast concrete insulation panels overlain with two concrete wythes and an insulator were studied [7,8,9,10]. Many researchers [7,8,9,10] emphasized that precast concrete insulation panels should be designed to resist flexural loading due to wind, although they are nonstructural members. Thus, most studies have focused on flexural tests. Pessiki and Mlynarczyk [7] emphasized that two concrete wythes and an insulator act independently, resulting in low cracking resistance and a flexural moment. To act together in two concrete wythes and an insulator, various shear connectors were studied at interfaces between them [8,9,10]. Tomlinson and Fam [8] reported that the flexural behavior of precast concrete insulation panels was governed by the degree of composite action, and the shear connectors installed at interfaces between concrete wythes and an insulator effectively contributed to the composite action. O’Hegarty et al. [9] reported that the composite action developed at the interfaces between concrete wythes and an insulator should be cautiously considered in the flexural design of precast concrete insulation panels. However, previous studies focused on the structural tests of panels simply overlain with two concrete wythes and an insulator. As reviewed by O’Hegarty et al. [9], a further refinement of the details is still needed to retain high composite action and a low heat-transmission coefficient.
Recently, to improve the low cracking and shear resistances of insulation panels produced with lightweight aggregate concrete, Acharya et al. [10] suggested a perfectly closed cross-section surrounding the insulator with concrete and reinforcing bars [10], which was effective in improving the composite action. Yang and Mun [3] reported that a wire-mesh arrangement satisfying the minimal longitudinal tensile reinforcement specified in ACI 318-19 [11] was effective in enhancing the cracking moment of panels, indicating that the composite action was sufficiently exhibited. However, studies are still insufficient on the safety of the flexural and shear behaviors of insulation panels having a closed cross-section surrounding the insulator with concrete and reinforcing bars. In particular, few (if any) studies have been performed on the flexural ductility of insulation panels with a closed cross-section surrounding the insulator with concrete and reinforcing bars.
This study examines the flexural–shear behavior of panels having a closed cross-section surrounding the insulator with insulating concrete and wire meshes. A honeycomb cardboard was used as an insulator. Six full-sized insulation panels were prepared with different moment–shear ratios ( η = Μ n / V n d s ), where Μ n represents the nominal moment capacity, V n represents the shear capacity, and d s represents the effective depth. To determine η , the values of V n and Μ n were calculated according to specified predictions in ACI 318-19 [11]. To vary η , the arrangement type of the honeycomb cardboard, the amount of shear reinforcement ( A v ), and the shear span–effective depth ratio ( a / d s ) were varied. The flexural behavior of insulation panels governed by flexure was analyzed according to the load–deflection relationship, cracking and maximal moments, and flexural displacement ductility ratio. The shear behavior of insulation panels governed by flexural–shear or shear was analyzed according to the load–deflection relationship, diagonal cracking load, and maximal shear load. Using the test results, the minimal value of η for the flexural design of insulation panels was determined. Additionally, the safety of the ACI 318-19 [11] specification in predicting cracking moment capacity in the elastic state and nominal moment capacity in the ultimate state was verified through comparisons with the measured cracking and maximal moments. All the insulation panels were evaluated with the grade classification for load capacity specified in KS F 4736 [12]. Ultimately, on the basis of the comparison between the test results and predicted values obtained by ACI 318-19 and KS F 4736 specifications, we verified the stable flexural behavior of insulation panels having a closed cross-section surrounding the insulator with insulating concrete and wire meshes. In particular, the maximal required values of moment–shear ratio are proposed to satisfy fully composite action and fulfill the ductile response under extreme lateral loads.

2. Research Significance

The findings obtained from the analysis of the effect of η on the flexural or shear behavior of insulation panels are valuable data for the flexural design of insulation panels with a closed section enclosing the insulator with insulating concrete and wire meshes. Insulation panels with higher η values tend to be more brittle in the postpeak behavior. This paper proposes the optimal value of η for panels governed by flexure according to the test results for the load–deflection relationship, crack and maximal moments, strains in longitudinal reinforcement, and displacement ductility ratio. In addition, the safety of the ACI 318-19 [11] and KS F 4736 [12] specifications was verified.

3. Experimental Details

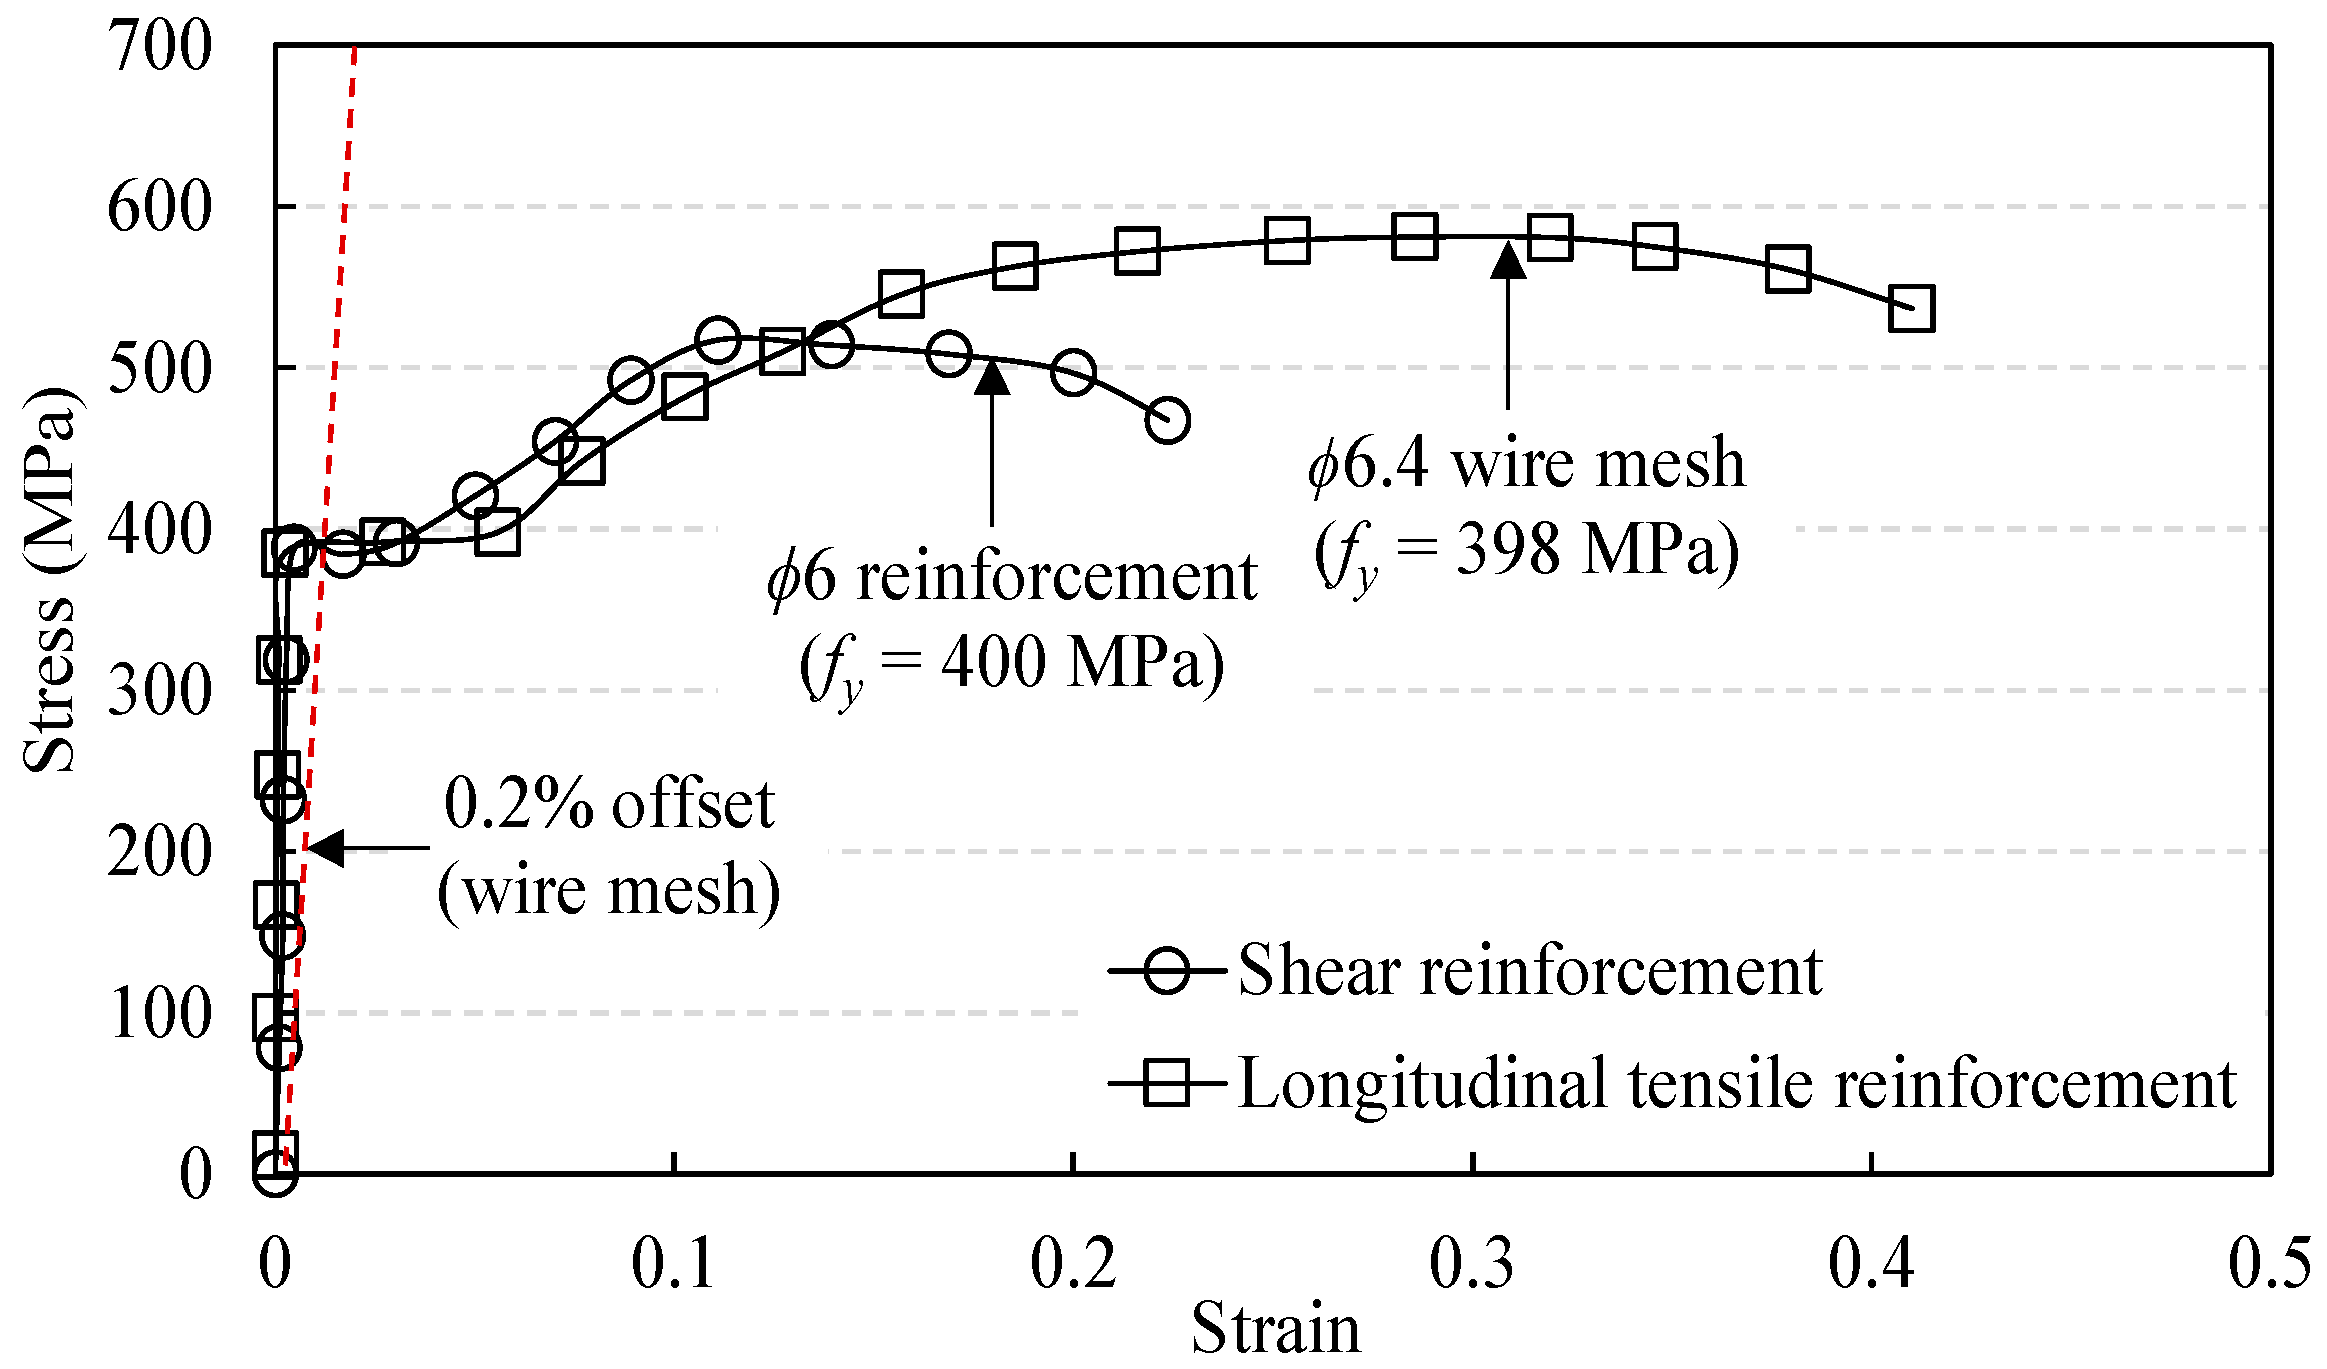
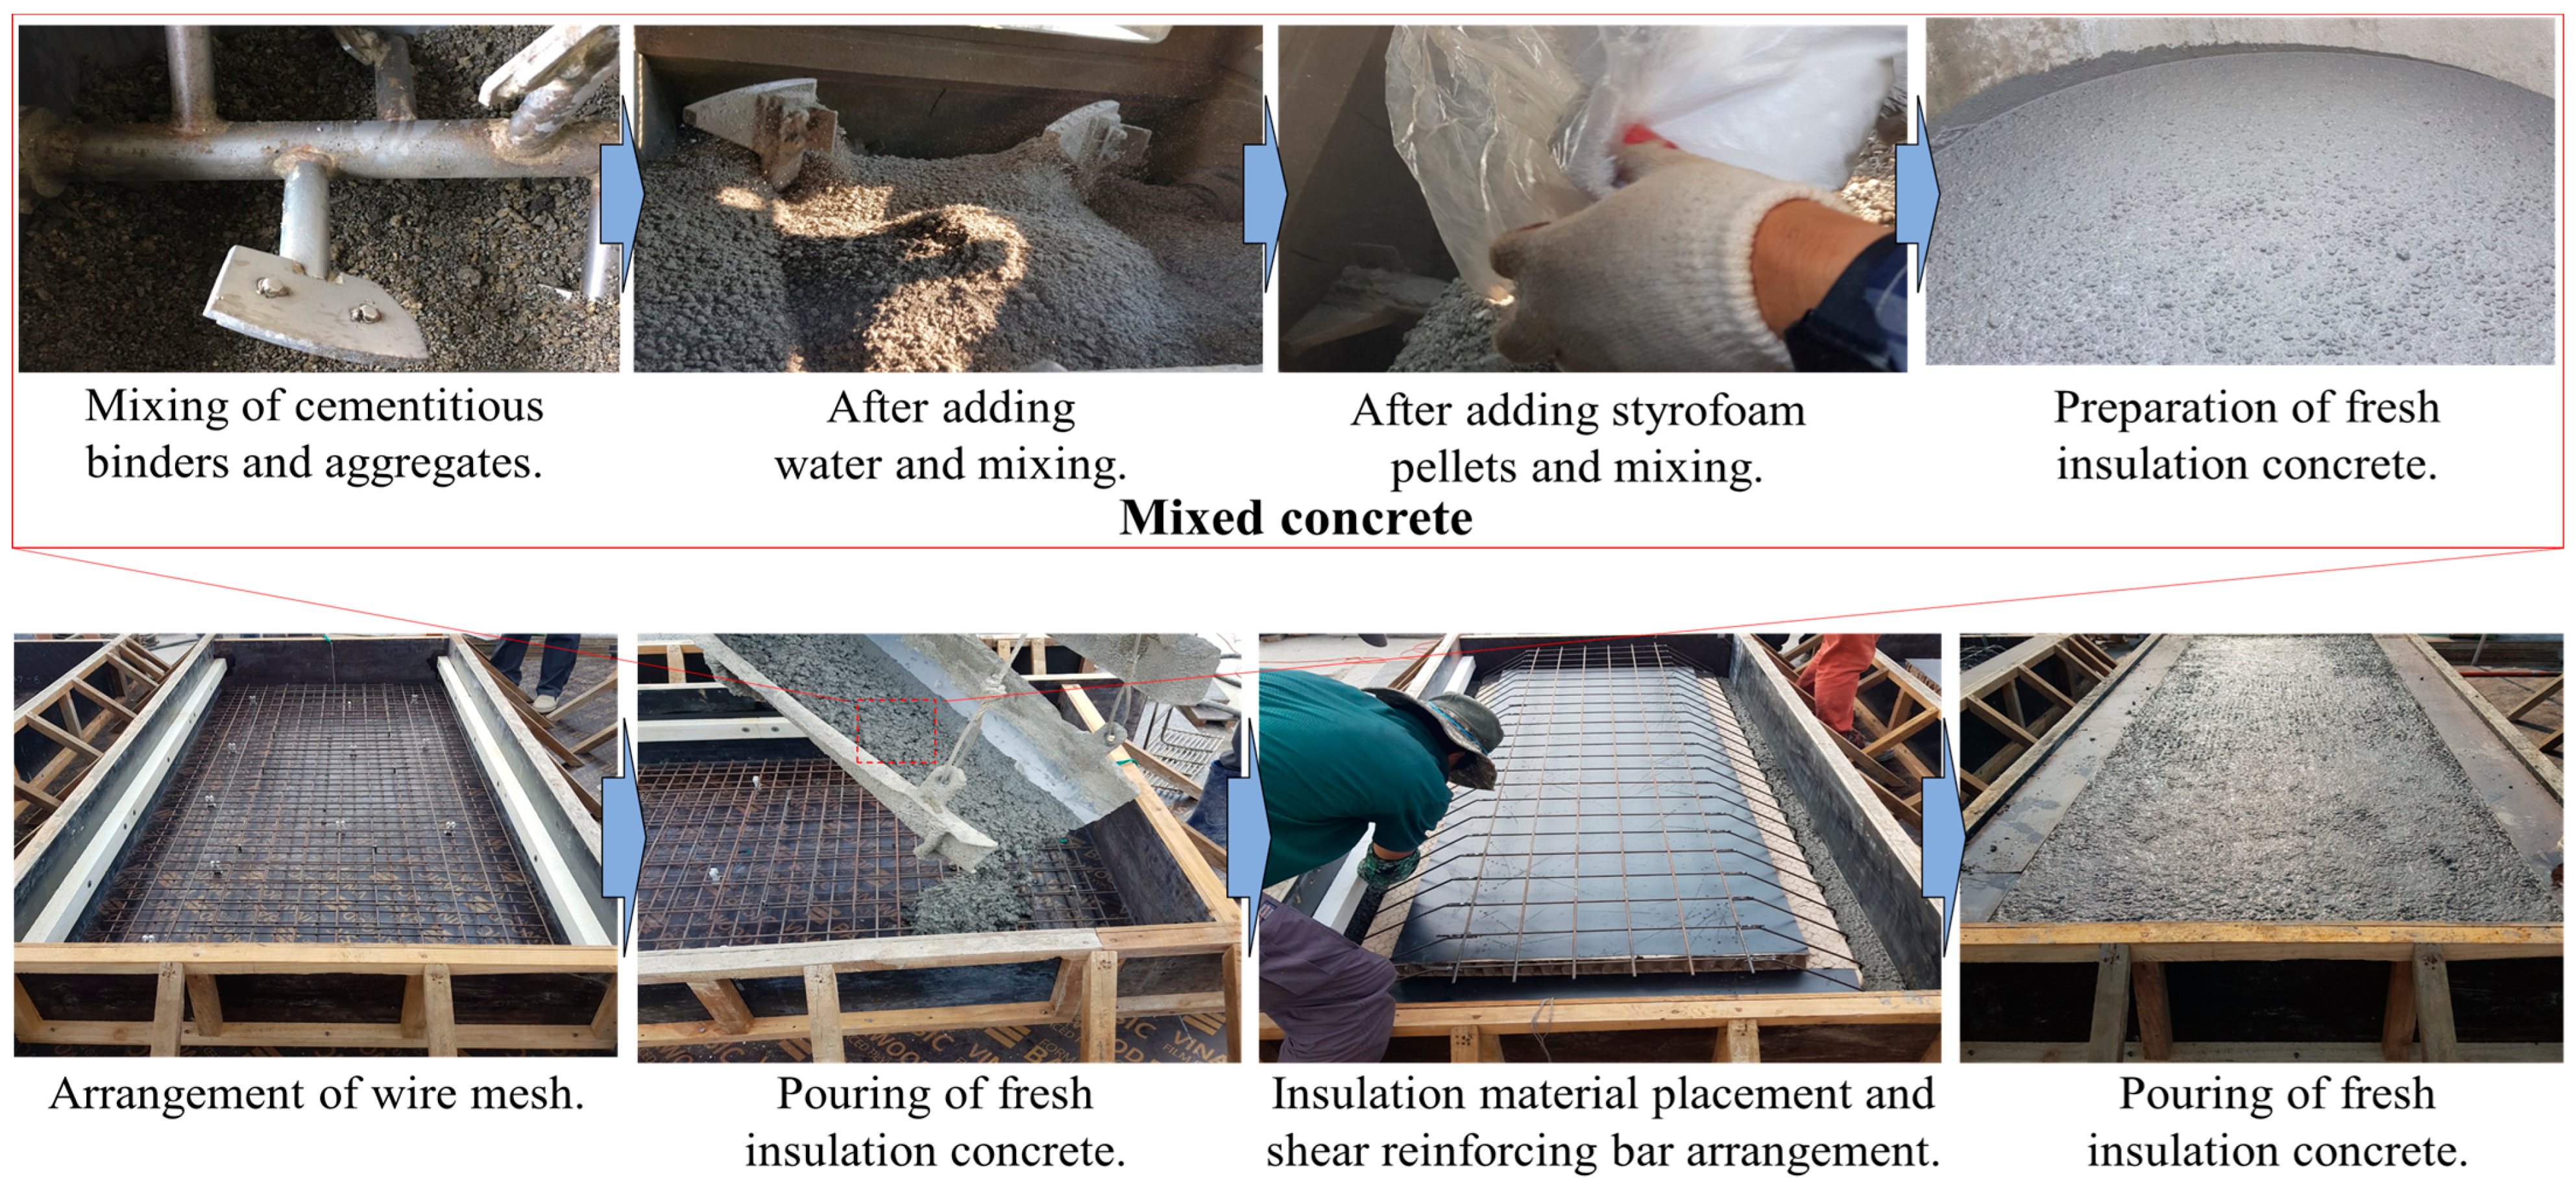
3.1. Material Properties

OPC, ground-granulated blast-furnace slag (GGBS), and fly ash (FA) were used as the cementitious materials in the insulating concrete. The specific gravity and specific surface area were 3.15 cm2/g and 3260 cm2/g, respectively, for the OPC; 2.94 g/cm3 and 4355 cm2/g, respectively, for the GGBS; and 2.2 g/cm3 and 4170 cm2/g, respectively, for the FA. To reduce the thermal conductivity of the concrete, insulating concrete was produced with bottom ash granules and Styrofoam pellets (Figure 1). The bottom ash granules were used as the fine and coarse aggregates. To satisfy the particle-size distribution specified in ASTM C 330 [13], the bottom ash granules with sizes of <2 and 2–4 mm were combined with a ratio of 7:3 by weight. The surface density and fineness of the combined fine aggregates were 1790 kg/m3 and 2.74, respectively. For the bottom ash granules used as coarse aggregates, the maximal size was 13 mm, and the surface density and fineness were 1180 kg/m3 and 6.55, respectively (Table 1). Styrofoam pellets with sizes between 2 and 5 mm were used, and their surface density was 33 kg/m3. As an insulator, paper honeycomb cardboard with laminate attached to the top and bottom was used. The density, specific heat, and thermal conductivity of the paper honeycomb cardboard were 180 kg/m3, 1.22 J/g·K, and 0.1 W/m·K, respectively. The corresponding values of the laminate sheets were 900 kg/m3, 1.44 J/g·K, and 0.3 W/m·K, respectively.
As indicated by Table 2, the designed compressive strength ( f c d ) of the insulating concrete was 12 MPa. The mixture proportion of insulating concrete was determined according to the test results obtained by Kim et al. [5]. Kim et al. [5] reported that lightweight aggregates and Styrofoam pellets were effective in reducing the low thermal conductivity of concrete and recommended that the optimal Styrofoam pellet volume ratio was 7.5% considering the insulating concrete compressive strength ( f c ) of more than 10 MPa. On the basis of the test results obtained by Kim et al. [5], the water-to-binder ratio and unit binder content were selected to be 30% and 450 kg/m3, respectively. In each mixture, the replacement ratios of the binders were 30% for OPC, 50% for GGBS, and 20% for FA. The compressive strength ( f c ) of the insulating concrete was measured using cylindrical samples with dimensions of 100 mm (diameter) and 200 mm (height), cured simultaneously with the insulation-panel specimens. The average f c was 12.3 MPa, and the average unit weight of concrete ( w c ) was 1408 kg/m3. As shown in Figure 2, the 6.4 mm diameter wire mesh with a mesh size of 100 × 100 mm2 used as longitudinal tensile and compressive reinforcements did not exhibit a clear yield point or plateau. Thus, the yield strength of the wire mesh was determined using the 0.2% offset method. The 6 mm diameter reinforcement used as shear reinforcement exhibited a clear yielding point. The yield strength, tensile strength, and elastic modulus of the wire mesh were 398, 530, and 190,776 MPa, respectively, and those of the shear reinforcement were 400, 517, and 198,000 MPa, respectively.

3.2. Specimen Details

As shown in Table 3 and Figure 3, six full-sized insulation-panel specimens were prepared to examine the effect of the moment–shear ratio ( η = Μ n / V n d s ) on the flexural behavior of the insulating concrete panel. To determine η , as the main parameters, the values of V n and Μ n were calculated according to predictions specified in ACI 318-19 [11]. To vary η , the amount of shear reinforcement ( A v ) and the shear span–effective depth ratio ( a / d s ) were varied. The insulation-panel specimens were divided into two target behaviors: flexure and shear. The η values were less than 1.0 for the target behavior of flexure, and more than 1.0 for the target behavior of shear. The main parameter of specimens with η < 1.0 was the arrangement type of the honeycomb cardboard, which was divided into two types: integral and divided units. For the former type, the honeycomb cardboard was arranged in the tension zone along the panel length, whereas for the latter type, three T-shaped honeycomb cardboards were arranged in the tension and compression zones (Figure 3a,b). To fix the divided units during concrete casting, the wire meshes were placed between the T-shaped honeycomb cardboards arranged in the tension and compression zones (Figure 4).
The longitudinal tensile ( ρ s ) and shear ( ρ v ) reinforcement ratios of the specimens were 0.0015 and 0.00053, respectively, which were calculated from the cracking moment (1.2 Μ c r ) and minimal amount of shear reinforcement ( A v ( min ) ) specified in KCI 2017 [14]. Consequently, using f c , the actual values of η were 0.64 for the integral-unit specimens and 0.75 for the divided-unit specimens. The main parameters of the specimens with η > 1.0 were A v and a / d s ; A v was set as 0.5, and 1.0 A v ( min ) , and a / d s was set as 1.17 and 2.56. To keep η higher than 1.0, ρ s was set to be 0.0036. Consequently, according to f c , the actual values of η varied between 1.26 and 5.82. In the specimen names, the letter refers to the designed governing behavior type (F = flexure and S = shear), and the number indicates the value of η . For example, F-0.64 corresponds to a specimen with η = 0.64 that was designed to be governed by flexure.
The width ( b w ) and height ( h ) of all the specimens were 1200 and 330 mm, respectively. The length ( L ) between the two simple supports was 2300 mm. The shear span ( a ) was 350 mm for a / d s = 1.17, and 767 mm for a / d s = 2.56.

3.3. Test Procedure and Instrumentation

As shown in Figure 5, all the specimens were tested under two-point top loadings using a 2000 kN capacity actuator. All the specimens were supported on a roller at one end and on a hinge at the other end. The applied loads during the test were measured using an actuator system. The vertical deflections in the maximal-moment region were measured using 100 mm capacity linear variable differential transducers installed at the loading points and midspan. To determine whether the specimens yielded, the strains in the wire mesh used as longitudinal tensile reinforcement were measured using electrical resistance strain gauges attached to the maximal-moment region.

4. Test Results and Discussion

4.1. Crack Propagation and Failure Mode

As shown in Figure 6, the failure mode of the insulation-panel specimens was significantly affected by η . The crack propagation and failure mode of the specimens with η < 1.0 were similar to those of conventional reinforced concrete beams governed by flexure [15]. The initial vertical cracks occurred in the maximal-moment region. Subsequently, as the applied load increased, the vertical cracks propagated toward the compression zone and the simple supports. The height of the vertical cracks that propagated toward the compression zone was approximately 0.85 h , regardless of the arrangement type of the honeycomb cardboard. More vertical cracks and a wider region of vertical cracks were observed in the divided-unit specimens than those in the integral-unit specimens. This implies that the larger sectional area of concrete in the tension zone was more effective for dispersing vertical cracks along the panel length. After the peak load had been reached, the vertical cracks were severely widened, and the wire mesh was fractured. The initial vertical cracks of the specimens designed with η > 1.0 also occurred in the maximal-moment region; subsequently, diagonal cracks occurred in the shear span as the applied load increased. The number of diagonal cracks in the shear span increased slightly with an increase in η , indicating a reduction in A v or a / d s . At the peak load, severely widened diagonal cracks occurred near the reaction and loading top points, and a horizontal crack simultaneously occurred along the embedded honeycomb cardboard. The horizontal-crack lengths of the specimens with η between 1.26 and 1.71 ranged from 0.33 to 0.45 L, implying that the effect of η on the horizontal-crack length was significant. The horizontal-crack length of the specimens with η = 5.82 was 0.8 L, which was approximately twice that of the specimens with η between 1.26 and 1.71.

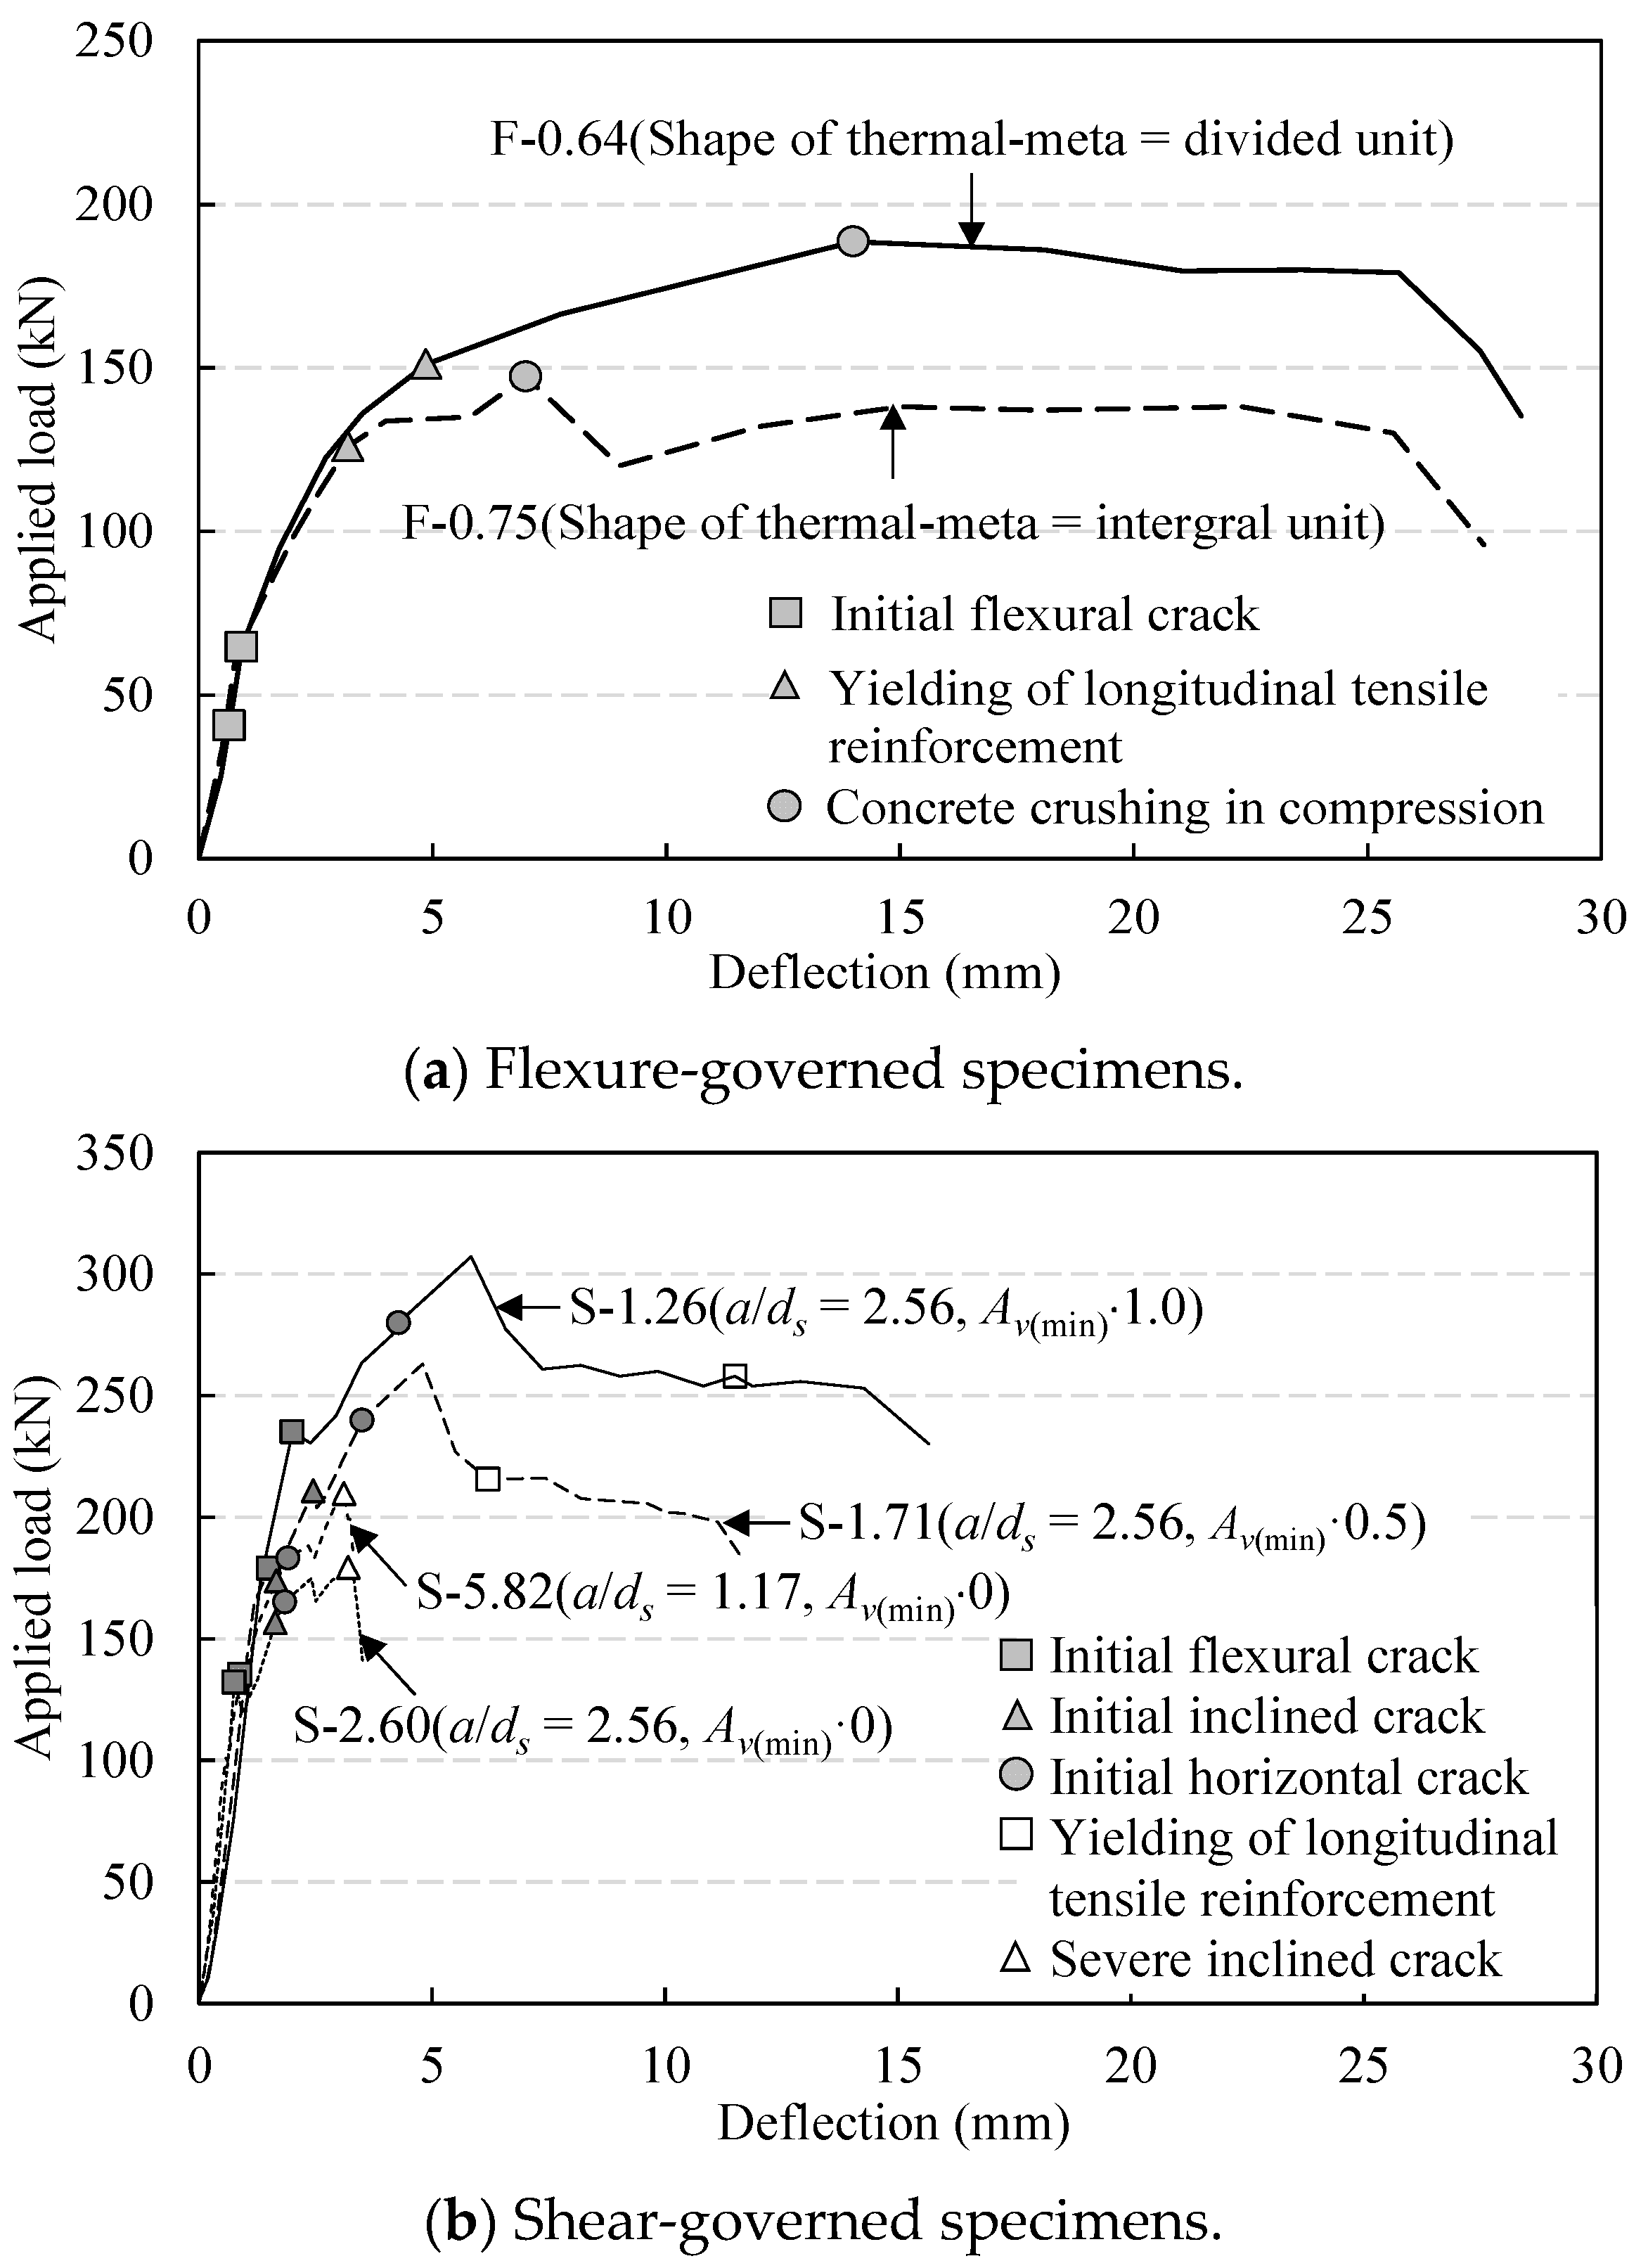
4.2. Load–Deflection Relationship

Figure 7 presents the load–deflection relationship of the insulation-panel specimens. After the initial cracks had been formed, the stiffness of the specimens designed with η < 1.0 decreased until the panels reached the yield state, which was when the wire mesh arranged as the longitudinal tensile reinforcement reached its yield strain. After the yield state, the deflection increased significantly up to the peak load. These trends were insignificantly affected by the arrangement type of the honeycomb cardboard. However, the postpeak behavior was more stable for the divided-unit specimens than that for the integral-unit specimens. For the integral-unit specimens, the applied load suddenly decreased by approximately 80% of the peak load immediately after the peak load had been reached. Then, a clear plastic plateau region was observed. However, for the divided-unit specimens, immediately after the peak load had been reached, the trend of a sudden drop of the load was not observed. After the peak load had been reached, the applied load gradually decreased until the termination of the test. This implies that the wire meshes for fixing the divided units during concrete casting contributed to the confinement of the compression zone [16]. After the initial cracks had been formed, the stiffnesses of the specimens with η > 1.0 were significantly affected by η . The stiffness increased with η up to the peak load. In the postpeak stage, the decreasing rate of the applied load increased with η . In particular, the deflection at 80% of the peak load ranged between 3.3 and 3.5 mm for the specimens with η > 2.60; these deflections were approximately 52% smaller than that with η = 1.26.

4.3. Strain in Longitudinal Tensile Reinforcement

As shown in Figure 8, for the specimens with η < 1.0, the wire mesh arranged as longitudinal reinforcement reached its yield strain before the peak load. Specimens with η < 1.0 were governed by flexure. However, for all specimens with η > 1.0, the wire mesh did not reach its yield strain during the test. The strain in the wire mesh for the specimens with η = 1.26 and 1.71 was close to the yield strain, with values of 0.0015 and 0.0017 at the peak loads, respectively. However, after the peak load had been reached, the yield strain was reached at approximately 80% of the peak load. For the specimens with η > 2.60, the yielding of the wire mesh was not observed until the termination of the test. These trends indicate that the specimens with η = 1.26 and 1.71 were governed by flexural–shear, and that those with η > 2.60 were governed by shear. Consequently, η ≤ 0.75 was required for the insulation panels governed by flexure.

4.4. Flexural and Shear Load Capacity

As indicated in Table 4, the initial cracking loads ( P c r ) of the divided-unit specimens were 1.24 times larger than those of the integral-unit specimens. This trend was similar to that of the peak loads ( P n ) of the specimens. The P n value of the divided-unit specimens was 189 kN, which was 1.3 times larger than that of the integral-unit specimens. This is because the additional arranged wire meshes for fixing the divided units during concrete casting contributed to the confinement of the compression zone [17]. The initial diagonal cracking load ( V c r ) of the specimens governed by shear increased by a factor of 1.16 when η increased from 2.60 to 5.82. This trend was similar to that of the maximal shear loads ( V n ( E x p ) ) of the specimens (Table 5). Additionally, V n ( E x p ) increased with η . However, the increasing rate was insignificant for the specimens governed by flexural–shear; it was 1.08 when η decreased from 1.71 to 1.26. The V n ( E x p ) values increased with a reduction in η , and the decreasing rate was approximately 0.85 for the specimens governed by shear.

4.5. Displacement Ductility Ratio

The displacement ductility ratios ( μ Δ ) of the specimens governed by flexure were calculated using the equation μ Δ = Δ n / Δ y defined by Park and Paulay [18], where Δ n and Δ y represent the displacements at P n and in the yield state, respectively. The analysis of μ Δ was performed only for the specimens governed by flexure, because the other specimens did not reach the yield state owing to flexural–shear or shear governing behavior before the peak loads. The μ Δ value of the integral-unit specimens was 2.57, which was 11% lower than that of the divided-unit specimens. Overall, the ductility of the insulation panels governed by flexure was comparable to that of conventional lightweight concrete (LWAC) beams with the minimal reinforcement ratio ( ρ s ( min ) ) specified in ACI 318-19 [11], indicating that the μ Δ values of conventional LWAC beams ranged between 2.5 and 2.8 [19].

5. Comparison with Predictions

5.1. Cracking Capacity

Table 4 and Table 5 present the experimental results and predictions for the cracking moment capacity ( M c r ) and initial diagonal cracking load ( V c r ). In addition, Table 4 shows a comparison between the predictions and test results of thin insulation panels with aa closed cross-section performed by Acharya et al. [10]. M c r values were obtained from the specimens governed by flexure, whereas the V c r values were obtained from the specimens governed by flexural–shear or shear. The cracking moment capacity ( M c r ( A C I ) ) predicted by ACI 318-19 [11] was approximately 1.8 times higher than that of the specimens governed by flexure. However, the M c r value was lower than that of the thin insulation panels designed by Acharya et al. [10]. This implies that ACI 318-19 [11] must consider the tensile resistance reduced by the bottom ash aggregates and Styrofoam pellets in predicting the M c r values of insulation panels because it overestimated the P c r values of the specimens. The shear capacity of concrete ( V c ( A C I ) ) predicted by ACI 318-19 [11] overestimated the V c r values of the specimens. The degree of overestimation decreased with a reduction in η . The V c r / V c ( A C I ) value of the specimens with η = 1.26 was 0.94, which was higher than those of the other specimens. This implies that ACI 318-19 [11] must also consider the shear resistance reduced by the bottom ash aggregates and Styrofoam pellets in predicting the V c values of insulation panels.

5.2. Moment and Shear Capacity

As indicated in Table 4, the nominal moment capacity ( M n ( A C I ) ) predicted by ACI 318-19 [11] underestimated the M n values of all the insulation-panel specimens. The M n / M n ( A C I ) value was 1.05 for the integral-unit specimens ( η = 0.75) and 1.06 for the divided-unit specimens ( η = 0.64). This trend was also observed in the test results of thin insulation panels of Acharya et al. [10], indicating that M n / M n ( A C I ) values ranged between 1.17 and 1.24. This implies that the safe flexural design of insulation panels with a closed cross-section surrounding the insulator with concrete and reinforcing bars is possible using the ACI 318-19 specification on the basis of the concept of the equivalent stress block. As reported by Acharya et al. [10], and O’Hegarty et al. [9], insulation panels with M n / M n ( A C I ) > 1.0 can be assumed to be 100% composite action. However, ACI 318-19 [11] overestimated the V n ( E x p . ) values of the specimens governed by flexural–shear and shear (Table 5). The degree of overestimation increased with a reduction in η ; it was 0.61 for the specimen with η = 1.26, which was lower than those for the other specimens. Hence, the V n ( E x p . ) values of insulation panels must be underestimated by approximately 27% in predicting the shear capacity, as specified in ACI 318-19 [11], because they decrease owing to the low mechanical properties in tension and shear resistance of insulating concrete produced with bottom ash aggregates and Styrofoam pellets.

5.3. Classification of Grade for Load Capacity

Table 6 presents the classification of the grade for the load capacity of lightweight concrete panels specified in KS F 4736 [12]. The panels retaining a load capacity of >3.4 kPa in the elastic state were classified as Grade 1. Considering the total area subjected to the wind load, the load capacity specified in KS F 4736 [12] could be transformed into >10.2 kN for the classification of Grade 1. When these values were compared with the test results, all the insulation-panel specimens were classified as Grade 1.

6. Conclusions

To evaluate the flexural–shear performance of insulation panels, six full-sized panels with different moment–shear ( η = M n / V n d s ) and shear span–effective depth ( a / d s ) ratios were tested. The following conclusions were drawn.
1
The failure mode of the insulation panels with η > 2.6 was similar to that of shear governed reinforced concrete beams, exhibiting severe diagonal cracks in the shear span and elastic state of the longitudinal tensile reinforcement.
2
The flexural behavior of the insulation panels with η ≤ 0.75 was ductile and showed plastic flow in the load–deflection curve with the yielding of longitudinal reinforcements before the peak load.
3
The displacement ductility ratio of the insulation panels with η ≤ 0.75 was more than 2.57, which was comparable to that of conventional lightweight aggregate concrete beams with the minimal reinforcement ratio specified in ACI 318-19.
4
The ACI 318-19 equations overestimated the flexural cracking moments, but underestimated the nominal moment capacities of insulation panels with η ≤ 0.75. Therefore, ACI 318-19 should be underestimated by 47% when estimating the flexural cracking moment of the insulation panels.
5
The ACI 318-19 equations overestimated the initial diagonal cracking and maximal shear capacities of the insulation panels. When the η values increased, the overestimations were notable, particularly for initial diagonal cracking shear capacity. Therefore, when estimating the shear capacity of the insulation panels using ACI 318-19, shear capacity should be designed considering the overestimation of ACI 318-19.
6
All the developed insulation panels were classified as Grade 1, specified in KS F 4736, indicating good lateral load resistance.
7
On the basis of the test results, the developed panels must be designed to a have moment–shear ratio of 0.75 or less to fulfil the ductile response under extreme lateral loads.

Author Contributions

Conceptualization, K.-H.Y.; methodology, K.-H.Y. and J.-H.M.; formal analysis, K.-H.Y. and J.-H.M.; investigation, S.-J.L.; writing—review and editing, K.-H.Y. and J.-H.M.; visualization, J.-W.K.; supervision, J.-H.M. All authors have read and agreed to the published version of the manuscript.

Funding

The Korea Agency for Infrastructure Technology Advancement (KAIA) grant funded by the Ministry of Land, Infrastructure and Transport (No. RS-2021-KA161724).

Institutional Review Board Statement

Not applicable.

Informed Consent Statement

Not applicable.

Data Availability Statement

The data presented in this study are available on request from the corresponding author.

Conflicts of Interest

The authors declare no conflict of interest.

References

  1. Ng, S.C.; Low, K.S. Thermal Conductivity of Newspaper Sandwiched Aerated Lightweight Concrete Panel. Energy Build. 2010, 42, 2452–2456. [Google Scholar] [CrossRef]
  2. Marani, A.; Madhkhan, M. Thermal Performance of Concrete Sandwich Panels Incorporating Phase Change Materials: An Experimental Study. J. Mater. Res. Technol. 2021, 12, 760–775. [Google Scholar] [CrossRef]
  3. Yang, K.H.; Mun, J.H. Evaluation of Flexural and Shear Behaviors of Lightweight Concrete Eco-Thermal Panel with Bottom Ash Aggregate and Air Foam. J. Korea Conc. Inst. 2021, 33, 245–251. [Google Scholar] [CrossRef]
  4. Fernando, P.L.N.; Jayasinghe, M.T.R.; Jayasinghe, C. Structural Feasibility of Expanded Polystyrene (EPS) Based Lightweight Concrete Sandwich Wall Panels. Constr. Build. Mater. 2017, 139, 45–51. [Google Scholar] [CrossRef]
  5. Kim, J.W.; Yang, K.H.; Mun, J.H. Evaluation on Mechanical Properties and Thermal Resistance of Lightweight Concrete Using Bottom Ash Aggregates and Expanded Polystyrene Bead. J. Korea Conc. Inst. 2021, 33, 567–577. [Google Scholar]
  6. Kim, K.C.; Koh, K.T.; An, G.H.; Son, M.S.; Kim, B.S. Evaluation of Flexural Behavior of Lightweight Precast Panel with Ultra High Performance Concrete. J. Korean Recycl. Constr. Resour. Inst. 2020, 8, 269–275. [Google Scholar]
  7. Pessiki, S.; Mlynarczyk, A. Experimental Evaluation of the Composite Behavior of Precast Concrete Sandwich Wall Panels. PCI J. 2003, 48, 54–71. [Google Scholar] [CrossRef]
  8. Tomlinson, D.; Fam, A. Flexural Behavior of Precast Concrete Sandwich Wall Panels with Basalt FRP and Steel Reinforcement. PCI J. 2015, 60, 51–70. [Google Scholar] [CrossRef]
  9. O’Hegarty, R.; Kinnane, O. Review of Precast Concrete Sandwich Panels and their Innovations. Constr. Build. Mater. 2020, 233, 117–145. [Google Scholar] [CrossRef]
  10. Acharya, M.; Gurung, K.; Mashal, M. Full-Scale Flexural Testing of Slabs made of Modular Structural Concrete Insulated Panels. PCI J. 2022, 67, 55–76. [Google Scholar] [CrossRef]
  11. ACI Committee 318. Building Code Requirements for Structural Concrete (ACI 318-19) and Commentary; American Concrete Institute: Farmington Hills, MI, USA, 2019. [Google Scholar]
  12. KATS. Extrusion Lightweight Concrete Panels (KS F 4736); Korean Standard Association: Seoul, Korea, 2018. [Google Scholar]
  13. ASTM C330; Annual Book of ASTM Standards: V. 4.02. ASTM International: West Conshohocken, PA, USA, 2012.
  14. KCI. Korea Concrete Institute Model Code (KCI 2017); Kimoondang Publishing Company, Korea Concrete Institute: Seoul, Korea, 2017. [Google Scholar]
  15. Im, C.R.; Yang, K.H.; Mun, J.H. Assessment of Maximum Longitudinal Reinforcement Ratios for Reinforced Lightweight Aggregate Concrete Beams. J. Korea Conc. Inst. 2022, 33, 419–425. [Google Scholar]
  16. Xie, Q.; Wang, S.; Liu, C. Axial Compression Behavior of a New Type of Prefabricated Concrete Sandwich Wall Panel. Mater. Sci. Eng. 2018, 317, 1–6. [Google Scholar]
  17. Joseph, J.D.R.; Prabakar, J.; Alagusundaramoorthy, P. Precast Concrete Sandwich One-Way Slabs Under Flexural Loading. Eng. Struct. 2017, 138, 447–457. [Google Scholar] [CrossRef]
  18. Park, R.; Paulay, T. Reinforced Concrete Structures. Wiley Interscience Publication: New York, NY, USA, 1975; pp. 196–199. [Google Scholar]
  19. Ahmed, A.M.; Ahlam, S.M.; Wissam, D.S. Effect of Longitudinal Steel Reinforcement Ratio on Deflection and Ductility in Reinforced Concrete Beams. Mater. Sci. Eng. 2020, 888, 1–6. [Google Scholar]
Figure 1. Materials used for concrete and thermal meta used for the insulator (units: mm).
Buildings 12 01741 g001
Figure 2. Stress–strain curves of reinforcing bars.
Buildings 12 01741 g002
Figure 3. Details of the insulation-panel specimens (units: mm).
Buildings 12 01741 g003aBuildings 12 01741 g003b
Figure 4. Casting of concrete in the insulation-panel specimens.
Buildings 12 01741 g004
Figure 5. Test setup for the insulation panels (units: mm).
Buildings 12 01741 g005
Figure 6. Failure modes of the insulation panels.
Buildings 12 01741 g006aBuildings 12 01741 g006b
Figure 7. Applied load–deflection relationship.
Buildings 12 01741 g007
Figure 8. Strain response of longitudinal tensile reinforcing bars as a function of the applied loads.
Buildings 12 01741 g008
Table 1. Physical properties of bottom ash aggregates and Styrofoam pellets.
TypeMaximal
Size
(mm)
Surface
Density
(kg/m3)
Dried
Density
(kg/m3)
Water
Absorption (%)
Fineness
Modulus
Bottom ash aggregatesCoarse aggregate13118090015.36.55
Fine aggregate41790152019.12.74
Styrofoam pellets533313.13.82
Table 2. Mixture proportions of lightweight concrete with insulation.
Designed
Values
W / B ( % ) S / a ( % ) Styrofoam Pellet
Volume
Ratio (%)
Unit Weight (kg/m3)Measured
Average Values
f c d
(MPa)
ρ c
(kg/m3)
W OPCGGBSFABottom Ash Coarse
Aggregate
Bottom Ash Fine
Aggregate
Styrofoam Pellets f c
(MPa)
w c
(kg/m3)
13 mm2 mm under2–4 mm
12140030427.5135135225904003081322.512.31408
f c d = designed compressive strength, ρ c = designed unit weight of concrete, W / B = water-to-binder ratio by weight, S / a = fine aggregate-to-total-aggregate ratio by volume, W = water, OPC = ordinary Portland cement, GGBS = ground-granulated blast-furnace slag, FA = fly ash, f c = measured compressive strength of concrete, w c = measured average unit weight of concrete.
Table 3. Details of the insulation-panel specimens.
SpecimensTarget
Behavior
Main ParametersLongitudinal Tensile
Reinforcement
Moment–Shear Ratio
f c
(MPa)
w c
(kg/m3)
Type of
Wire Mesh
(mm)
Shape of
Thermal Meta
a / d s ρ v Arrangement ρ s ρ s ( min ) M n
(kN·m)
V n
(kN)
η
(= M n / V n d s )
F-0.64Flexure12.21403100 × 100Divided unit2.560.0005312—ϕ 6.40.00150.0015691400.64
F-0.7512.41410100 × 100Integral unit54940.75
S-1.25Shear12.8142050 × 3400.0006228—ϕ 6.40.00360.00152442521.25
S-1.7112.2140650 × 1700.000312431851.71
S-2.6012.6141250 × 0-2431222.60
S-5.8212.1140650 × 01.17-2421195.82
a / d s = shear span–effective depth ratio, ρ v = shear reinforcement ratio, ρ s = longitudinal tensile reinforcement ratio, ρ s ( min ) = minimal longitudinal tensile reinforcement determined in accordance with ACI 318-19 procedure, M n = nominal moment capacity, V n = shear capacity, d s = effective depth ratio, η = shear–moment ratio.
Table 4. Test results for the specimens governed by flexure.
ResearcherSpecimensTest ResultsPredicted Values
Obtained by ACI 318-19
Comparison
(Test Results/Predicted Values)
P c r
(kN)
P y
(kN)
P n
(kN)
Δ y
(mm)
Δ n
(mm)
μ Δ M c r
(kN·m)
[1]
M n
(kN·m)
[2]
M c r ( A C I )
(kN·m)
[3]
M n ( A C I )
(kN·m)
[4]
[1]/[3][2]/[4]
This studyF-0.6462.41511894.86142.8821.972.336.268.60.611.05
F-0.7550.21261482.7272.5715.456.634.253.70.451.05
Acharya et al. [10]A-114.525.129.129.258.42..0110.821.814.918.60.731.17
A-215.226.929.836.884.32.2911.422.314.918.60.761.20
A-314.526.730.730.567.32.2110.923.014.918.60.731.24
P c r = initial cracking load, P y = yielding load, P n = peak load, Δ y = deflection at P y , Δ n = deflection at P n , μ Δ = displacement ductility ratio, M c r = cracking moment capacity, M n = nominal moment capacity, M c r ( A C I ) = cracking moment capacity predicted by ACI 318-19, M n ( A C I ) = nominal moment capacity predicted by ACI 318-19.
Table 5. Test results for the specimens governed by shear.
SpecimenTest ResultACI 318-19Comparison
V c r
(kN) [4]
V n ( E x p )
(kN) [5]
V c ( A C I )
(kN) [6]
V n ( A C I )
(kN) [7]
[4]/[6][5]/[7]
S-1.261151541232520.940.61
S-1.711061321201850.880.71
S-2.6078891221220.640.73
S-5.82911051191190.770.88
V c r = initial diagonal cracking load, V n ( E x p ) = maximal shear load, V c ( A C I ) = shear capacity of concrete predicted by ACI 318-19, V n ( A C I ) = maximal shear capacity predicted by ACI 318-19.
Table 6. Panel classification specified in KS F 4736.
Grade12345
Load range (kPa)>3.42.8–3.42.2–2.81.7–2.2<1.7
Transformed load ranges from the designed section details of the developed panels (kN)>10.28.4–10.26.6–8.45.1–6.6<5.1
Publisher’s Note: MDPI stays neutral with regard to jurisdictional claims in published maps and institutional affiliations.

