Article

Study on Flexural Performance of Prestressed Concrete Steel Strand Square Piles with Reinforcement

1
Center for Balance Architecture, Zhejiang University, Hangzhou 310028, China
2
The Architectural Design & Research Institute of Zhejiang University Co., Ltd., Hangzhou 310028, China
3
Ningbo Yizhong Pipe Pile Co., Ltd., Ningbo 315450, China
*
Author to whom correspondence should be addressed.
Buildings 2022, 12(11), 1801; https://doi.org/10.3390/buildings12111801
Submission received: 28 September 2022 / Revised: 23 October 2022 / Accepted: 24 October 2022 / Published: 27 October 2022
(This article belongs to the Section Building Structures)

Abstract

:
A new type of precast pile, namely steel strand square piles with reinforcement (PRS), is proposed in present study, which uses steel strand as a prestressed reinforcement and is equipped with hot-rolled reinforcement. Two kinds of full-scale pile specimens with different reinforcement were constructed to study the bending performance by the full-scale tests. The finite element model was also performed to study the differences in bending resistance, deformation capacity, crack resistance, and failure mode because of the reinforcement ratio. The results show that the steel strand in the pile was not pulled off, and the concrete in the compression zone was crushed. The finite element analysis results are close to the results of the full-scale test of the piles, which can simulate the flexural performance of the pile well. The experimental results were closer to the theoretical calculation of the cracking moment. The ultimate bending moment value is about 25% more than the theoretical value. The parametric analysis shows that for the PRS with 0.27% prestressed reinforcement, the best bending performance is achieved with 0.64% non-prestressed reinforcement. For the PRS with 0.64% of non-prestressed reinforcement, the best bending performance is achieved with 0.37% of prestressed reinforcement.

1. Introduction

Although ordinary prestressed concrete pipe piles are technically mature and widely used, they have defects, such as low horizontal bearing capacity and poor seismic performance, which have great restrictions on their development. Precast concrete solid square piles have high horizontal bearing capacity and good ductility. The prestressed steel bars used in ordinary prestressed pipe piles have poor ductility and are easily pulled off during bending. The cracking moment of ordinary prestressed pipe is similar with the ultimate bending moment and easily causing engineering accidents. Steel strands have high tensile strength and good ductility [1,2]. Combining the advantages of ordinary prestressed pipe piles, precast concrete solid square piles and steel strands, a new precast pile is proposed which uses steel strand as prestressed reinforcement and is equipped with hot-rolled reinforcement in present study. Hereinafter referred to as prestressed steel strand square piles with reinforcement (PRS).
The flexural performance of prestressed concrete piles has been studied internationally. Kishida et al. [3] stated that increasing the hoop ratio of spiral reinforcement can increase the shear bearing capacity of concrete pipe piles and cause ductile damage. Thusoo et al. [4] concluded that the core-filled piles have great ductility by experiment. Irawan et al. [5] concluded that filling concrete into the pile core increases the ductility of prestressed high strength concrete pipe (PHC) piles, and the failure of which is caused by the fracture of prestressed reinforcement. Shishegaran et al. [6,7] proposed a method which uses a new reinforcement bar system to increase the flexural capacity of simply supported reinforced concrete beams.
Gan et al. [1] proposed a pre-tensioned centrifugal concrete stranded pile and conducted flexural and shear experiments on it. The results showed that replacing steel bars with steel strands as the main reinforcement can effectively improve the deformation capacity and bearing capacity of the pipe pile under bending. The pre-tensioned centrifugal concrete strand pile has promising application in construction. Yasin et al. [8] conducted numerical and experimental studies on the steel fiber reinforced concrete (SFRC) structures and concluded that the use of (SFRC) can improve the energy dissipation as well as the shear capacities of the prestressed structure. Yang et al. [9,10] performed flexural tests on PHC piles under cyclic loading. Finite element analysis of PHC piles with different locations, numbers, and diameters of deformed reinforcement was carried out to derive the optimum arrangement of deformed reinforcement. Furthermore, Wu et al. [11] developed PHC piles reinforced with high-strength materials (glass fiber reinforced polymer (GFRP) bars). A flexural test study on GFRP and PHC with full-scale was conducted and concluded that GRFRP has a higher flexural resistance than PHC piles. It provides a theoretical basis for the application of PHC piles reinforced with hybrid GFRP bars and steel bars in marine structures. Ceyhun et al. and Yasin et al. [12,13] determined the optimum type of reinforcement for prefabricated dapped-end purlin beams by conducting experimental and numerical studies on specimens of different structural and reinforcement types. Muguruma et al. [14] concluded that the hoop configuration can effectively prevent the prestressed reinforcement from being pulled out by applying lateral restraint tests on concrete piles. Budek et al. [15] conducted comparative tests on prestressed concrete solid square piles and prestressed concrete pipe piles. It was concluded that pipe piles have poor energy dissipation capacity and sudden damage. Pipe piles need to be kept working in their elastic range for seismic resistance, while solid square piles can be considered for their seismic resistance in the plastic state.
The current study on the flexural performance of concrete piles is mainly focused on the improved ordinary prestressed concrete pipe piles and prestressed concrete square piles. Traditional square piles have poor cracking resistance and tend to occur crack when transporting. These defects limit their application and development in industrial and civil construction projects. A new pile has been developed to improve the cracking resistance of concrete square piles by applying prestress, to increase the bending capacity of the pile with hot-rolled bars, and to increase the horizontal capacity of the piles by using solid sections with reasonable configuration of hoop reinforcement. However, there is a lack of research on the mechanical properties of steel strand square piles using steel strand and hot rolled steel bars as the main reinforcement. Here, two kinds of PRS were designed and tested for flexural performance at full-scale. Finite element models based on full-scale tests were also performed to verify the flexural performance and deformation capacity of the PRS.

2. Experiment

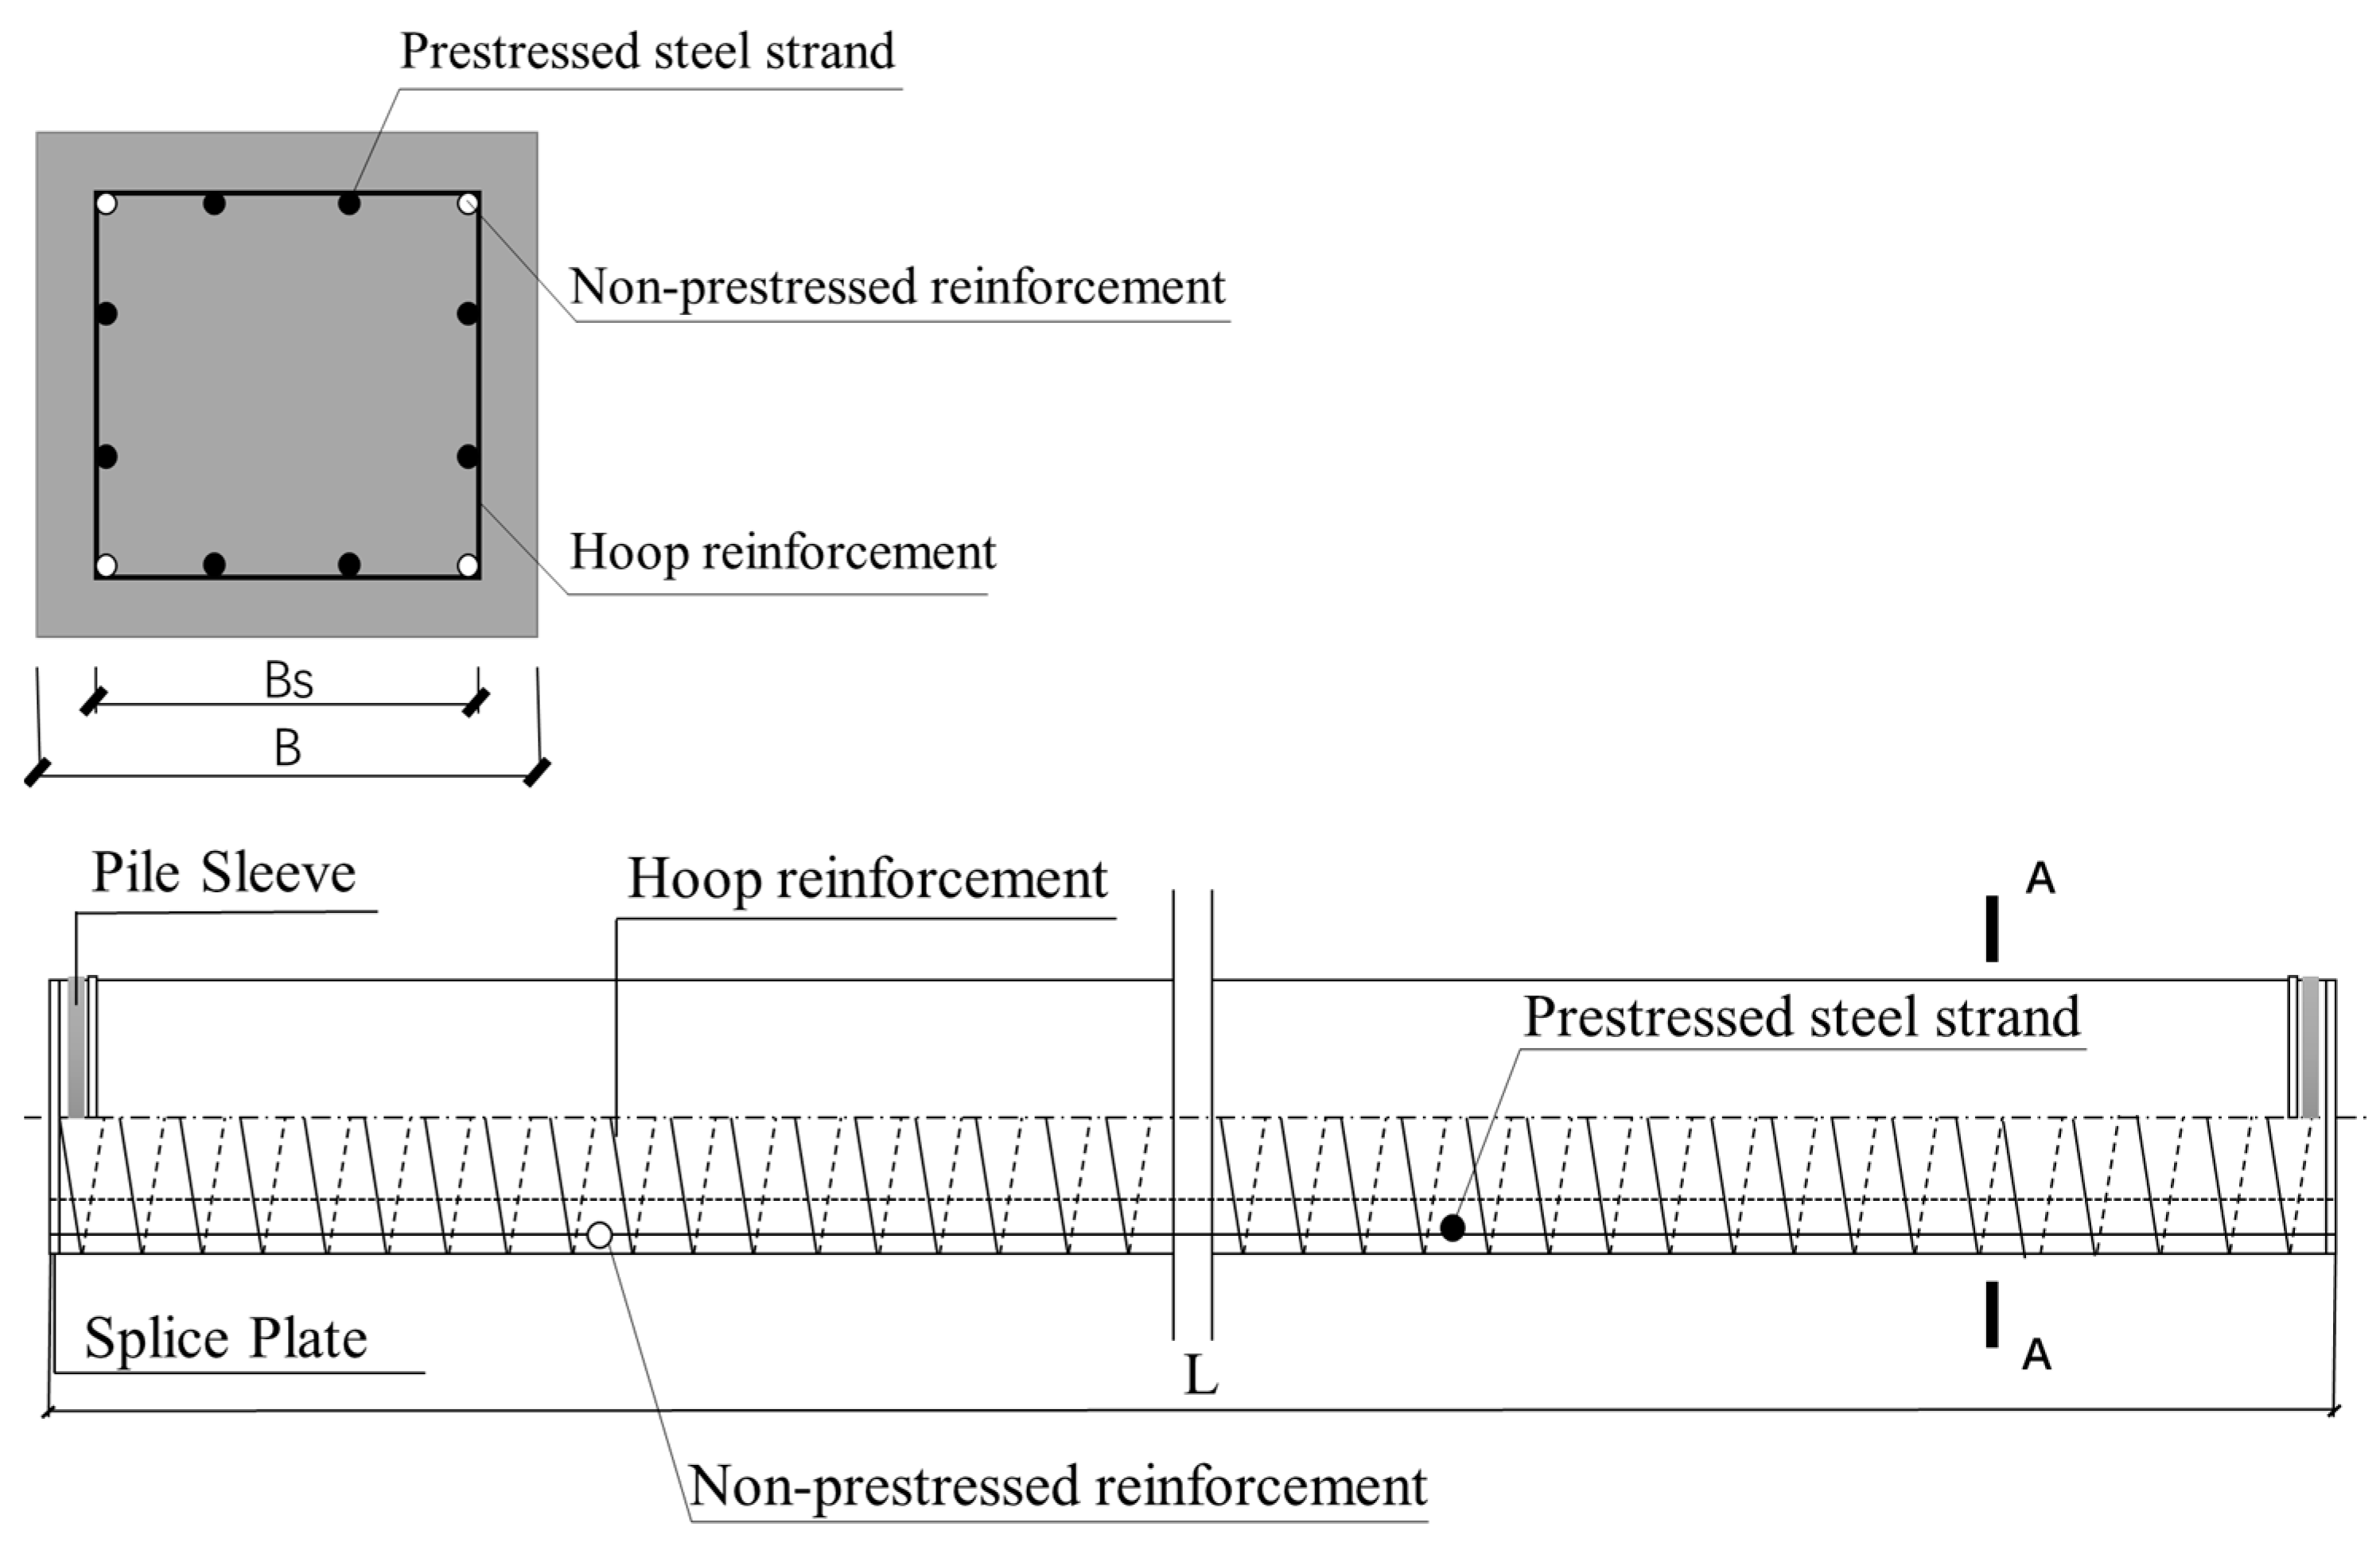
2.1. Design of Specimens

According to the actual demand for PRS in the project, two types of PRS with 400 mm side length are designed for the test. Specimens are numbered PRS400A1, PRS400A2, PRS400B1, and PRS400B2, respectively. Full scale flexural tests were performed on four specimens. The main dimensions and reinforcement are shown in Figure 1 and Table 1, where L is the length of the specimen, B s is the distance from the center of the non-prestressed reinforcement, ρ s is the longitudinal reinforcement ratio, and t is the thickness of the end plate. The production of the specimens was done by the concrete pile company in accordance with the standard technical procedures and process requirements. The tensile control stress σ c o n of prestressing strand is uniformly selected at 70% of the standard value of prestressed reinforcement in tension ( f p t k = 1860 MPa). The concrete effective compressive stress σ c e is calculated from it.

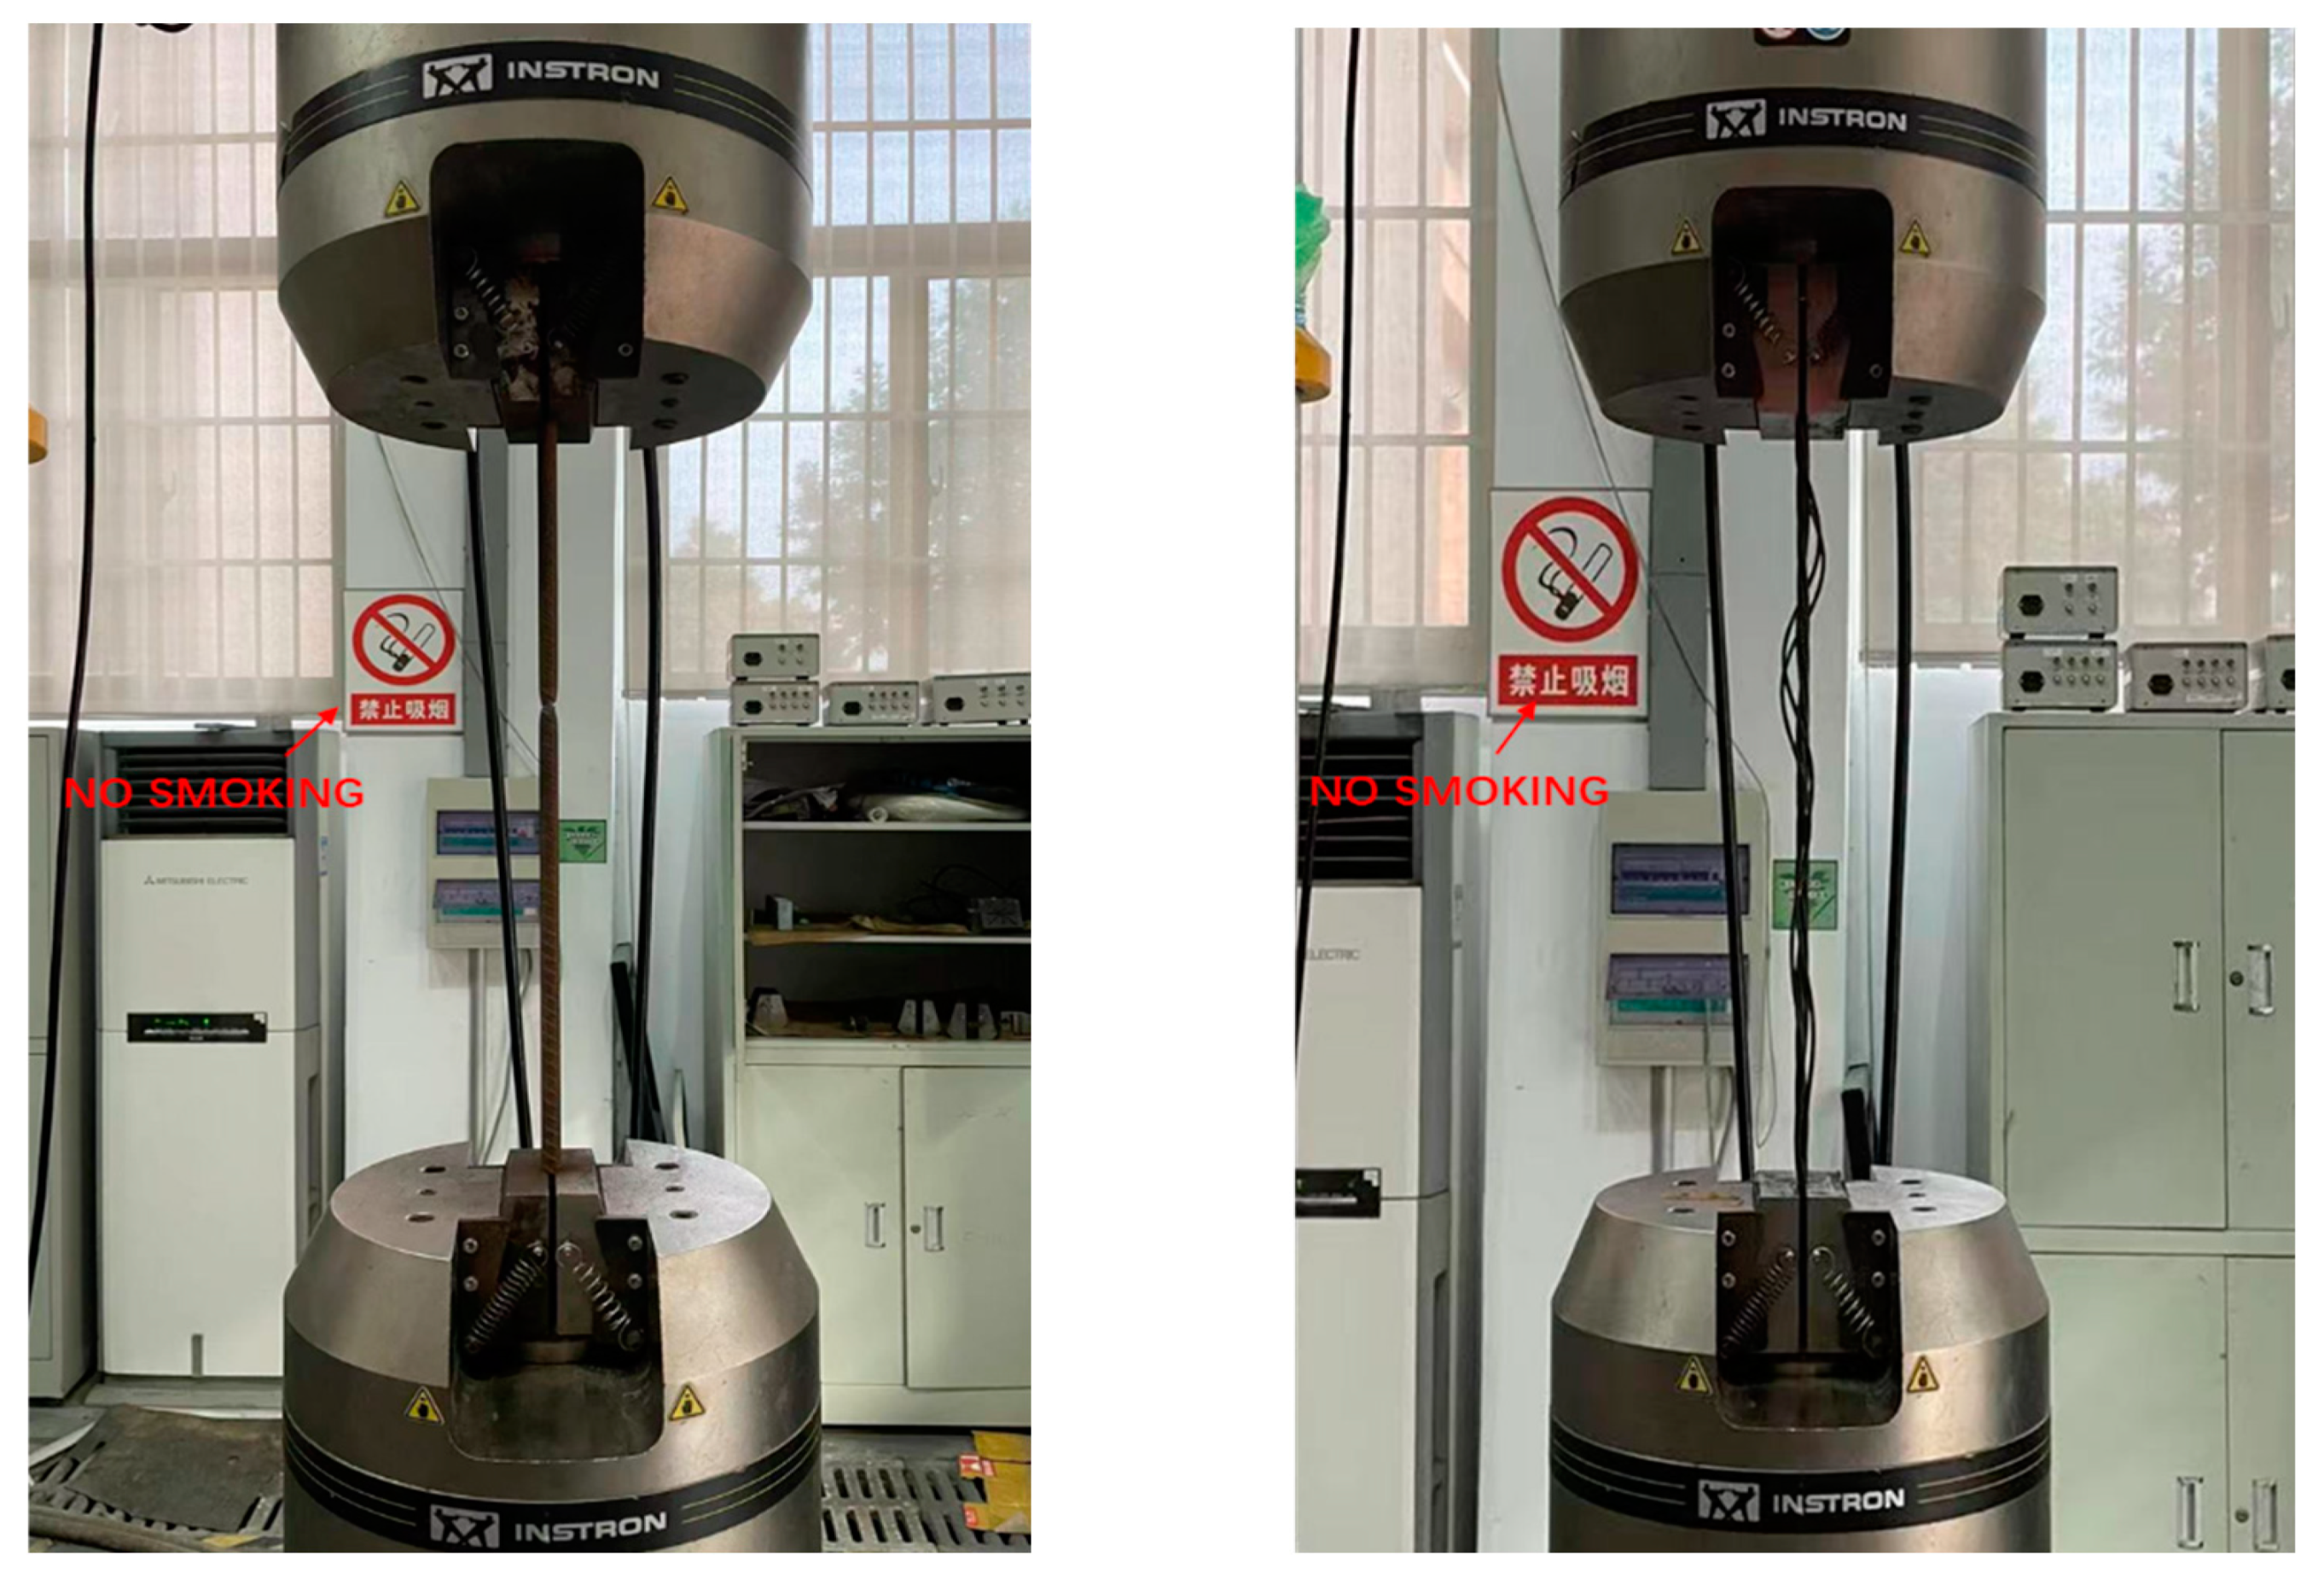
2.2. Physical Properties of Materials
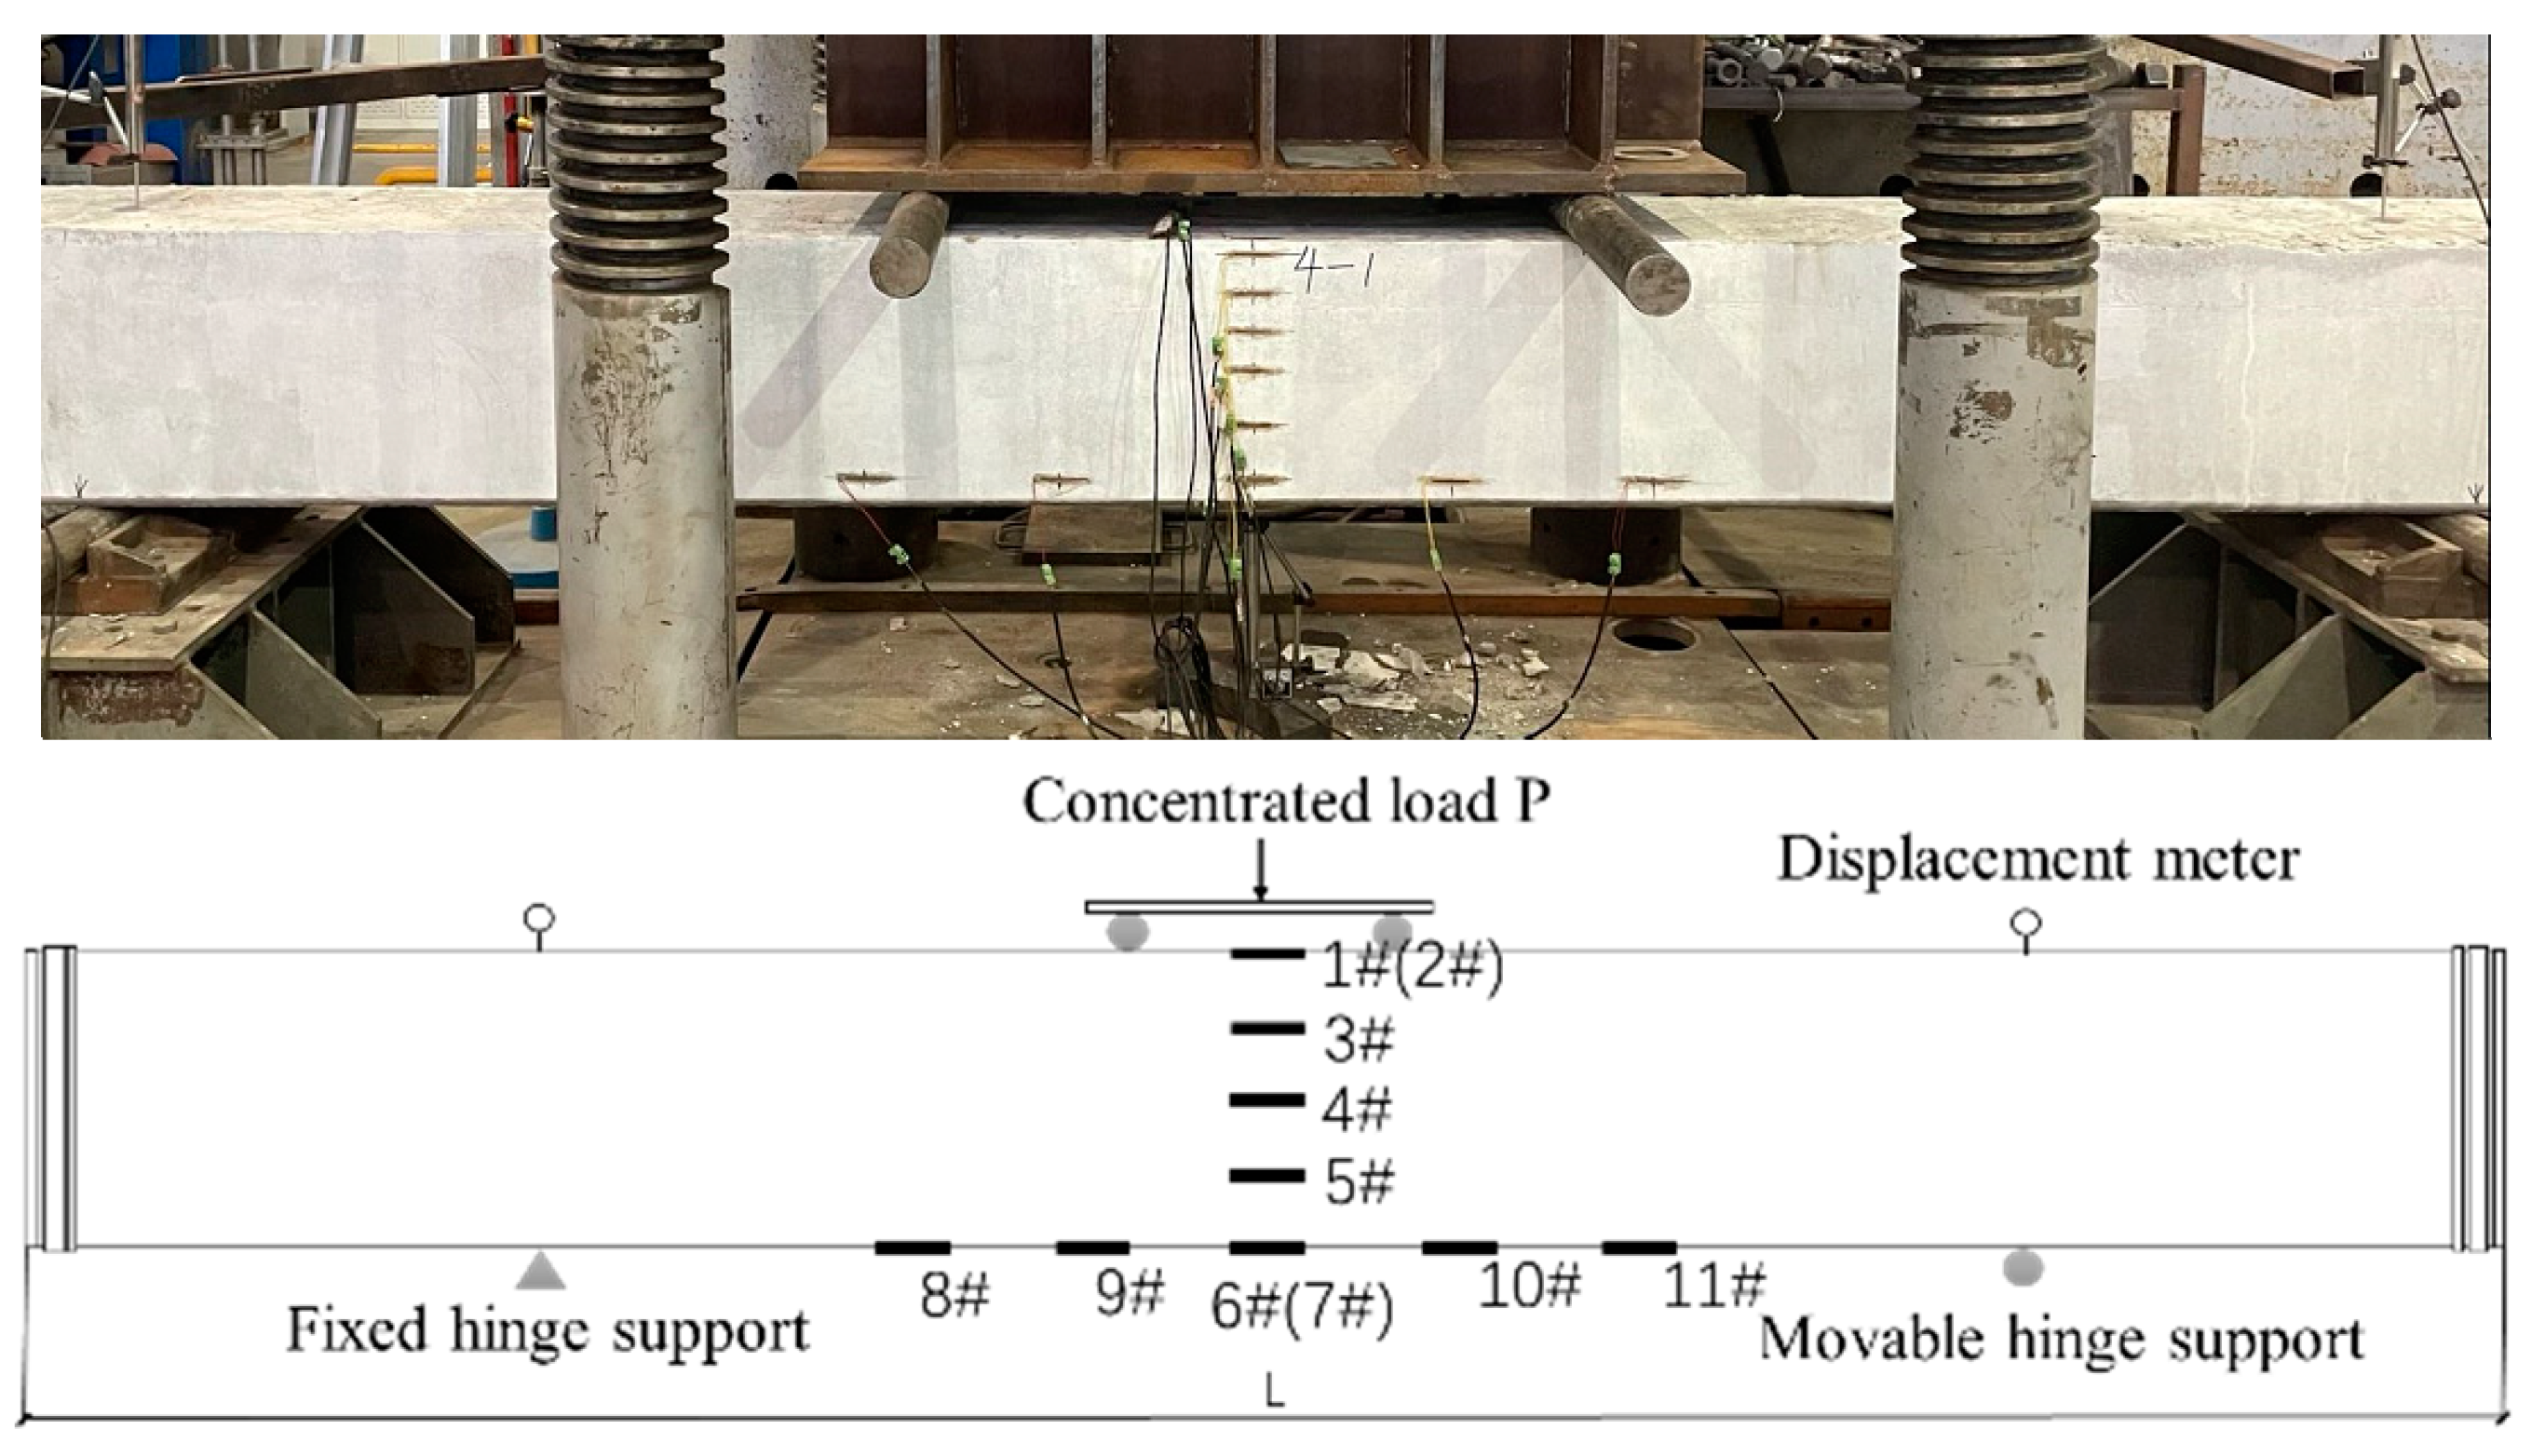
The concrete strength grade of PRS specimens is C55. 10 concrete cubes with side length of 100 mm were made and cured at the same time as the PRS specimens (see Figure 2). After reaching curing period, concrete cubes would be tested for compressive strength in accordance with the specification [16]. The measured compressive strength f c u , 10 = 59.9 MPa, the compressive strength f c u = 56.9 MPa, axial compressive strength f c , k = 36.6 MPa, and tensile strength f t = 2.9 MPa were calculated after the conversion of the standard [16].
Prestressed reinforcement used S 9.5, 7 strands of standard type steel strand. Non-prestressed reinforcement used 12 and 18 hot-rolled ribbed steel bars with a yield strength no less than 400 MPa respectively. Spiral hoop spacing 100 mm using 4 mm diameter cold-drawn low carbon steel wire of Grade A ( b 4@100). At least three pieces of each specification were taken for material properties tensile test according to the standard [17] (see Figure 3). Because the testing machine jig could not hold the b 4 hoop, so the b 6 hoop made in the same batch was used instead. The modulus of elasticity E s , yield strength f y , ultimate strength f u , nominal area A 0 , and maximum force total elongation A g t were measured for each reinforcement. The measured strengths of the reinforcement all met the standard [17], as shown in Table 2.

2.3. Flexural Test

Flexural test of specimens was carried out in accordance with the standard [18]. Specimens were loaded in a four-point symmetric loading mode. The arrangement of the specimen loading points was shown in Figure 4, in which the pure bending span is 1 m long, and the support spacing is 0.6 L. A total of three displacement meter were arranged at two supports and midspan to measure deflection. One strain gauge was arranged on the upper surface of midspan of the specimen, five strain gauges were arranged at equal intervals on the lateral surface, and one strain gauge was arranged on the lower surface to measure the strain change and crack development of midspan of the specimen.
The cracking moments M c r , k of the two types of specimens were 78 kN·m and 76 kN·m and the ultimate moments M u , k were 147.7 kN·m and 179.3 kN·m, according to the theoretical formula in the specification [19]. After preloading, formal loading was performed according to the criteria [19]. During the loading, each level of loading stays for 3 min to make the force stable.

2.4. Test Phenomena

The performance of the two types of specimens in the initial stage of loading is basically the same. The specimens are in the elastic deformation stage. The external load is linearly related to the displacement of midspan of the specimen. In the yielding stage, loading until the first vertical crack occurred in the pure bending section of the specimen, the concrete near the crack failed and the flexural stiffness of the specimen decreased. As the load continues to increase, other vertical cracks were generated near the first crack. The number of cracks kept increasing. The length and width of cracks were gradually expanded. The growth of displacement in the span was accelerated. In the damage stage, specimen PRS400A1 and specimen PRS400A2 were loaded to 295 kN and 304 kN, respectively, when the external load exceeded the ultimate capacity of the specimen. The concrete in the upper compressed zone was crushed, and the sound of crushed concrete was heard at the same time. The load capacity of the specimen decreased rapidly. The cracks in the pure bending section developed swiftly. The transverse cracks developed obviously. Continuing displacement loading, the non-prestressed reinforcement was pulled off with a crisp sound and the specimen could not continue to be loaded. When the specimen PRS400B1 was loaded to 250 kN, one of the cracks developed rapidly, the displacement in the span changed suddenly, and the bearing capacity of the specimen decreased rapidly. However, no concrete crushing damage and reinforcement pulling off occurred. The specimen could continue to load. After that, displacement loading was carried out and non-prestressed reinforcement was pulled off when loaded to 273 kN. Displacement loading was continued until the concrete was crushed. When the specimen PRS400B2 was loaded to 355 kN, a crisp sound was heard, and the reinforcement was pulled off. Displacement loading was continued until the concrete was crushed when loaded to 358 kN.

3. Finite Element Analysis

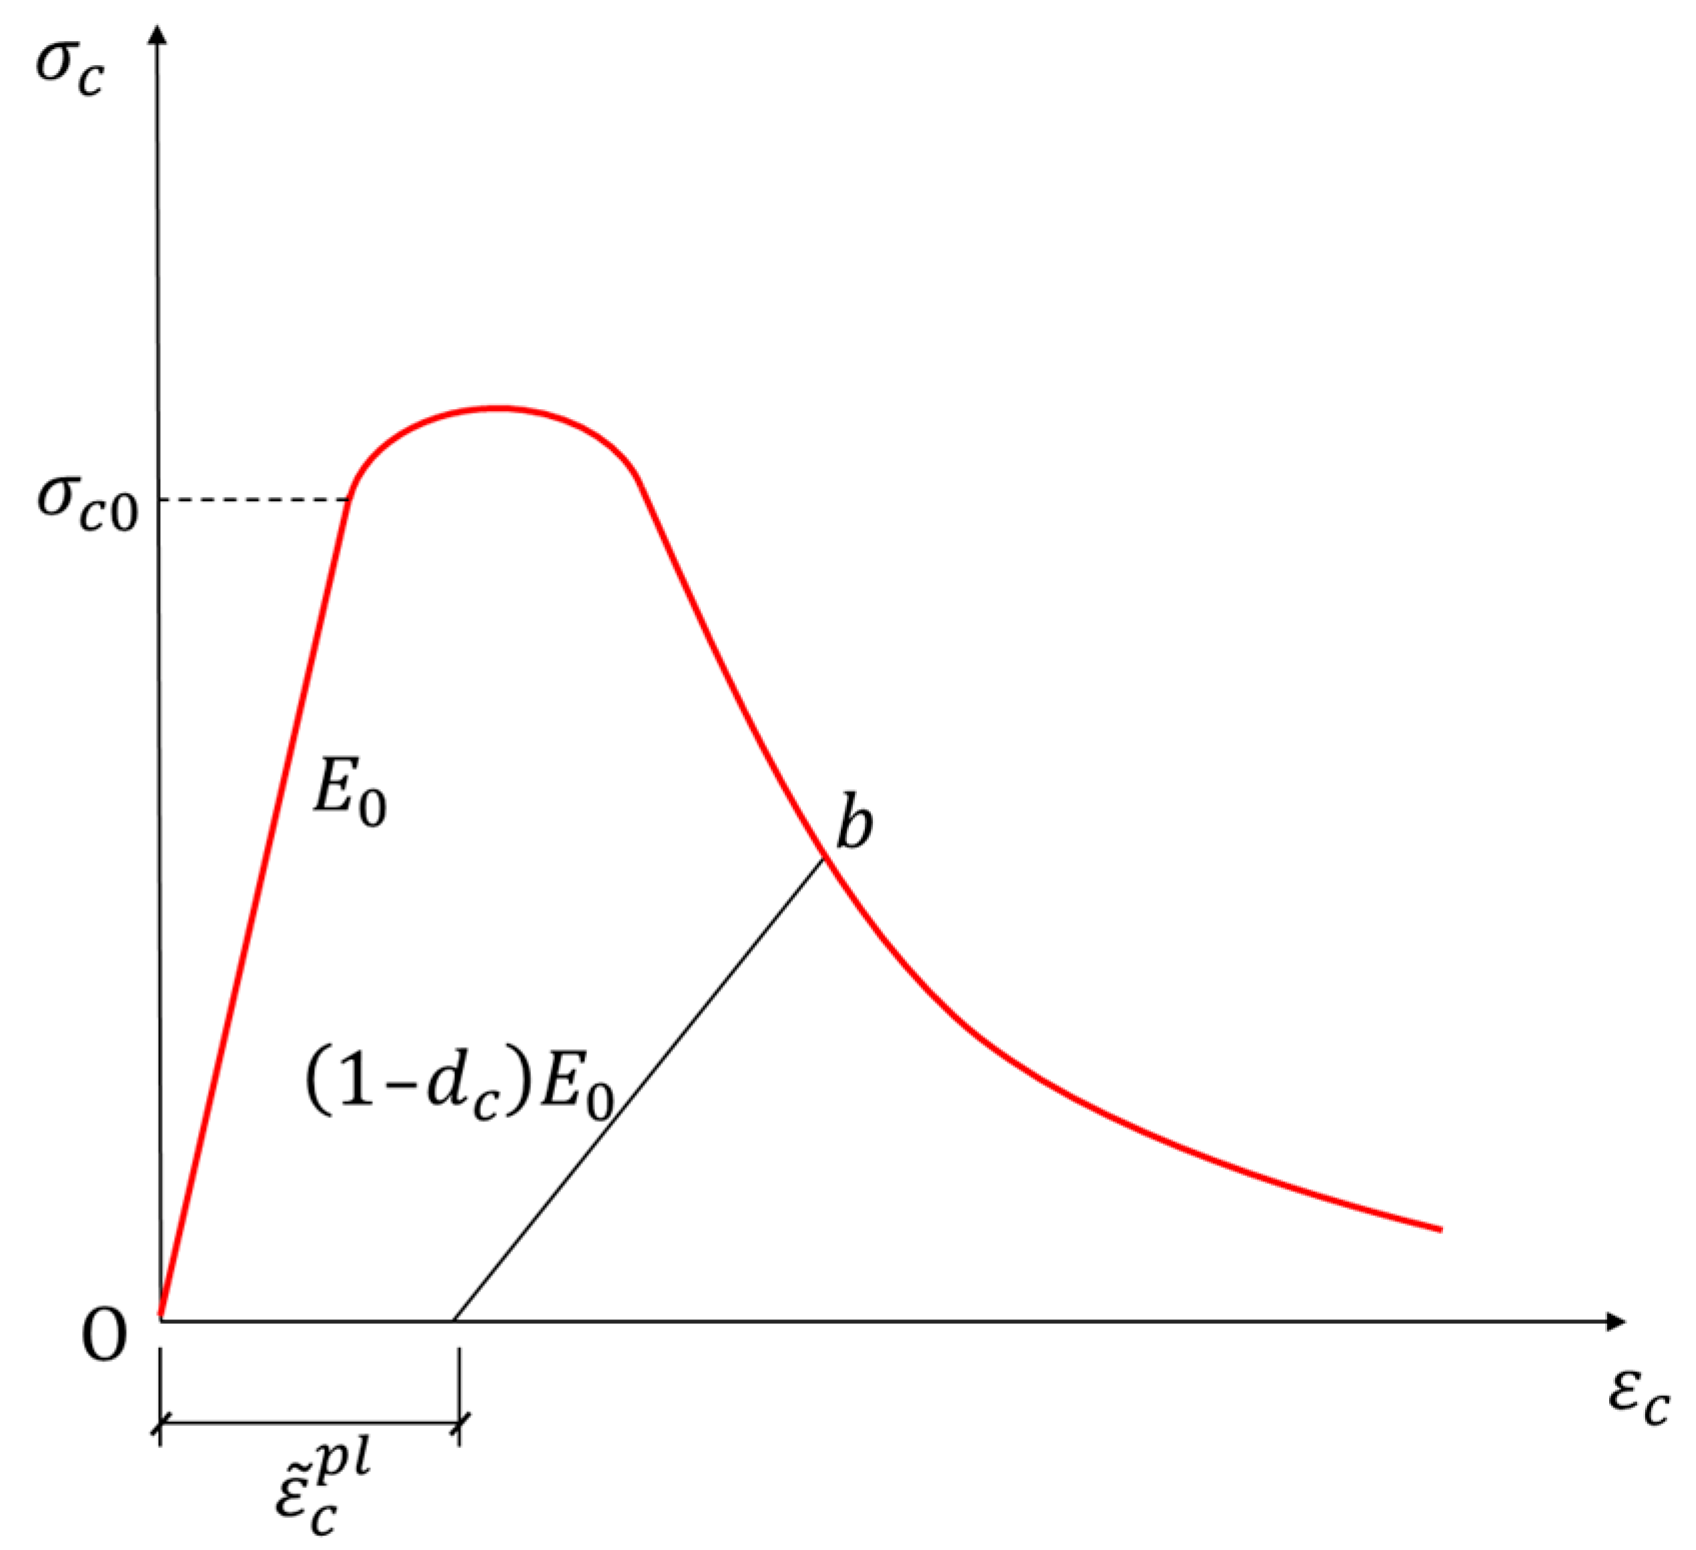
3.1. Constitutive Relation of Materials

In order to describe the stiffness degradation due to cracks and the damage cumulative behavior of the concrete, the Concrete Damaged Plasticity (CDP) model [20,21] was chosen as the analytical model. This model is highly suitable for simulating the behavior of concrete under monotonic and dynamic loads. The plastic damage parameters and stress-strain curves of the concrete were determined according to the standard [16] as shown in Table 3. Figure 5 and Figure 6 show the tensile stress-strain and compressive stress-strain relationships in the CDP model.
The stress-strain relationship of concrete after tensile and compressive yielding can be described by the following formula [19]. Where E 0 is the initial elastic modulus of concrete. ε ˜ t p l and ε ˜ c p l are the equivalent plastic strains of concrete in tension and compression. d t and d c are the tensile and compressive damage factors in the concrete plastic damage model.
σ t = ( 1 d t ) · E 0 · ( ε t ε ˜ t p l )
d c = { 1 ρ c n n 1 + x n x 1 1 ρ c α c ( x 1 ) 2 + x x > 1
n = E c ε c , r E c ε c , r f c , r
ρ c = f c , r E c ε c , r
x = ε ε c , r
σ c = ( 1 d c ) · E 0 · ( ε c ε ˜ c p l )
d t = { 1 ρ t [ 1.2 0.2 x 5 ] x 1 1 ρ t α t ( x 1 ) 1.7 + x x > 1
x = ε ε c , t
ρ t = f t , r E c ε t , r
Note: α c = the parameter of falling section of uniaxial compressive stress-strain curve of concrete, taken as 2.74; f c , r = the representative value of uniaxial compressive strength of concrete, taken as 55 MPa; ε c , r = the peak compressive strain of concrete corresponding to the uniaxial compressive strength f c , r , taken as 1.98 × 10⁻³; α t = the parameter of falling section of uniaxial tensile stress-strain curve of concrete, taken as 2.64; f t , r = the representative value of uniaxial tensile strength of concrete, taken as 2.9 MPa; ε t , r = the peak compressive strain of concrete corresponding to the uniaxial tensile strength f t , r , taken as 1.16 × 10⁻³.
Cracking strain of concrete is the total uniaxial tensile strain minus the elastic strain without damage. Compressive inelastic strain of concrete is the total uniaxial compressive strain minus the elastic strain without damage.
ε ˜ t c k = ε t σ t E c
ε ˜ c i n = ε c σ c E c
ABAQUS will calculate the plastic strain.
ε ˜ t p l = ε ˜ t c k d t ( 1 d t ) σ t E c
ε ˜ c p l = ε ˜ c i n d c ( 1 d c ) σ c E c
The stress-strain relationship diagram of the steel strand at different strain rates in the test [22] shows that the steel strand entered the strengthening stage directly after its stress reached the yield point. During the yielding stage, the steel strand does not have an obvious yield platform while the hot-rolled reinforcement will have a section of yield platform. To describe the principal structure relationship between prestressed steel, non-prestressed reinforcement and spiral hoops in a uniform way, the Esmaeily-Xiao model [23] was chosen to describe all the reinforcement in the model, as shown in Figure 7, with the following formula.
σ = { E s ε ,                                   ( ε ε y ) f y ,                                         ( ε y < ε k 1 ε y ) k 4 f y + E s ( 1 k 4 ) ε y ( k 2 k 1 ) 2 ( ε k 2 ε y ) 2 ,               ( ε > k 1 ε y )
where k 1 = hardening starting strain/yield strain; k 2 = peak strain/yield strain; k 3 = limiting strain/yield strain; k 4 = peak stress/yield strength.
According to the material property tests of each type of reinforcement, the material parameters can be acquired as shown in Table 4.

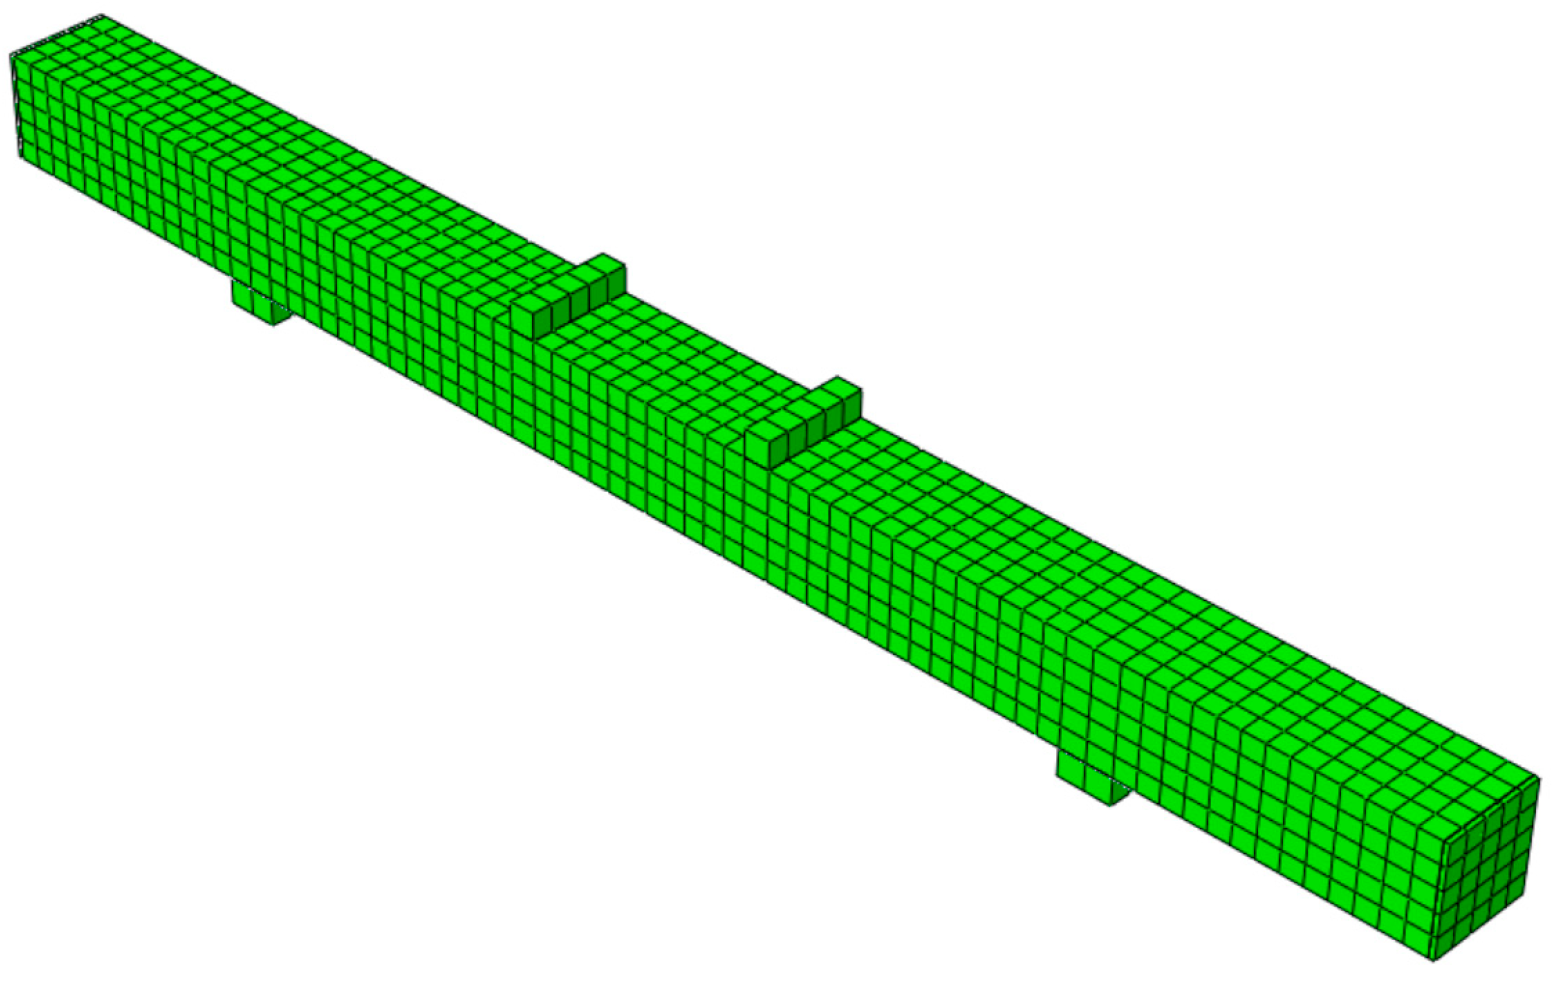
3.2. Finite Element Model

To confirm the accuracy of the results, ABAQUS finite element analysis software was used to numerically simulate the pile specimens. The shape, size, and material of the finite element model were all consistent with the test. In order to prevent the stress concentration phenomenon, rigid pads were used at each of the four loading points of the model to increase the area of the stress surface. All four pads were connected to the concrete specimen by binding. The model constrains the vertical displacement of the left pad and constrains the horizontal and vertical displacement of the right pad. The concrete, pads and end plates were modeled by the eight-node three-dimensional solid element with reduced integration (C3D8R), and the reinforcement is modeled by the two-node three-dimensional truss unit (T3D2). All reinforcement was embedded in the concrete specimen The reinforcement was in a complete bonded state with the concrete. The analysis steps were set up in three stages: applying prestress, applying self-weight load, and displacement loading. The prestress was applied to the overall model by lowering the strand temperature. The value of strand temperature reduction was calculated by the formula ΔT = σ/ E s − α. Two reference points coupled with concrete pads was established as loading points, which can avoid the numerical singularities caused by the non-linear material.
To ensure the accuracy of the results from the finite element model, the mesh division is not easy to be rough. At the same time, too much fine mesh division will cause waste and simulation failure. Therefore, after several finite element test simulation meshing, the final adopted meshing scheme was 5 equal divisions along the height and width of the specimen and 80 mm along the pile length. The results of this meshing scheme were close to the test. The final finite element model is shown in Figure 8.

4. Bending Load Capacity

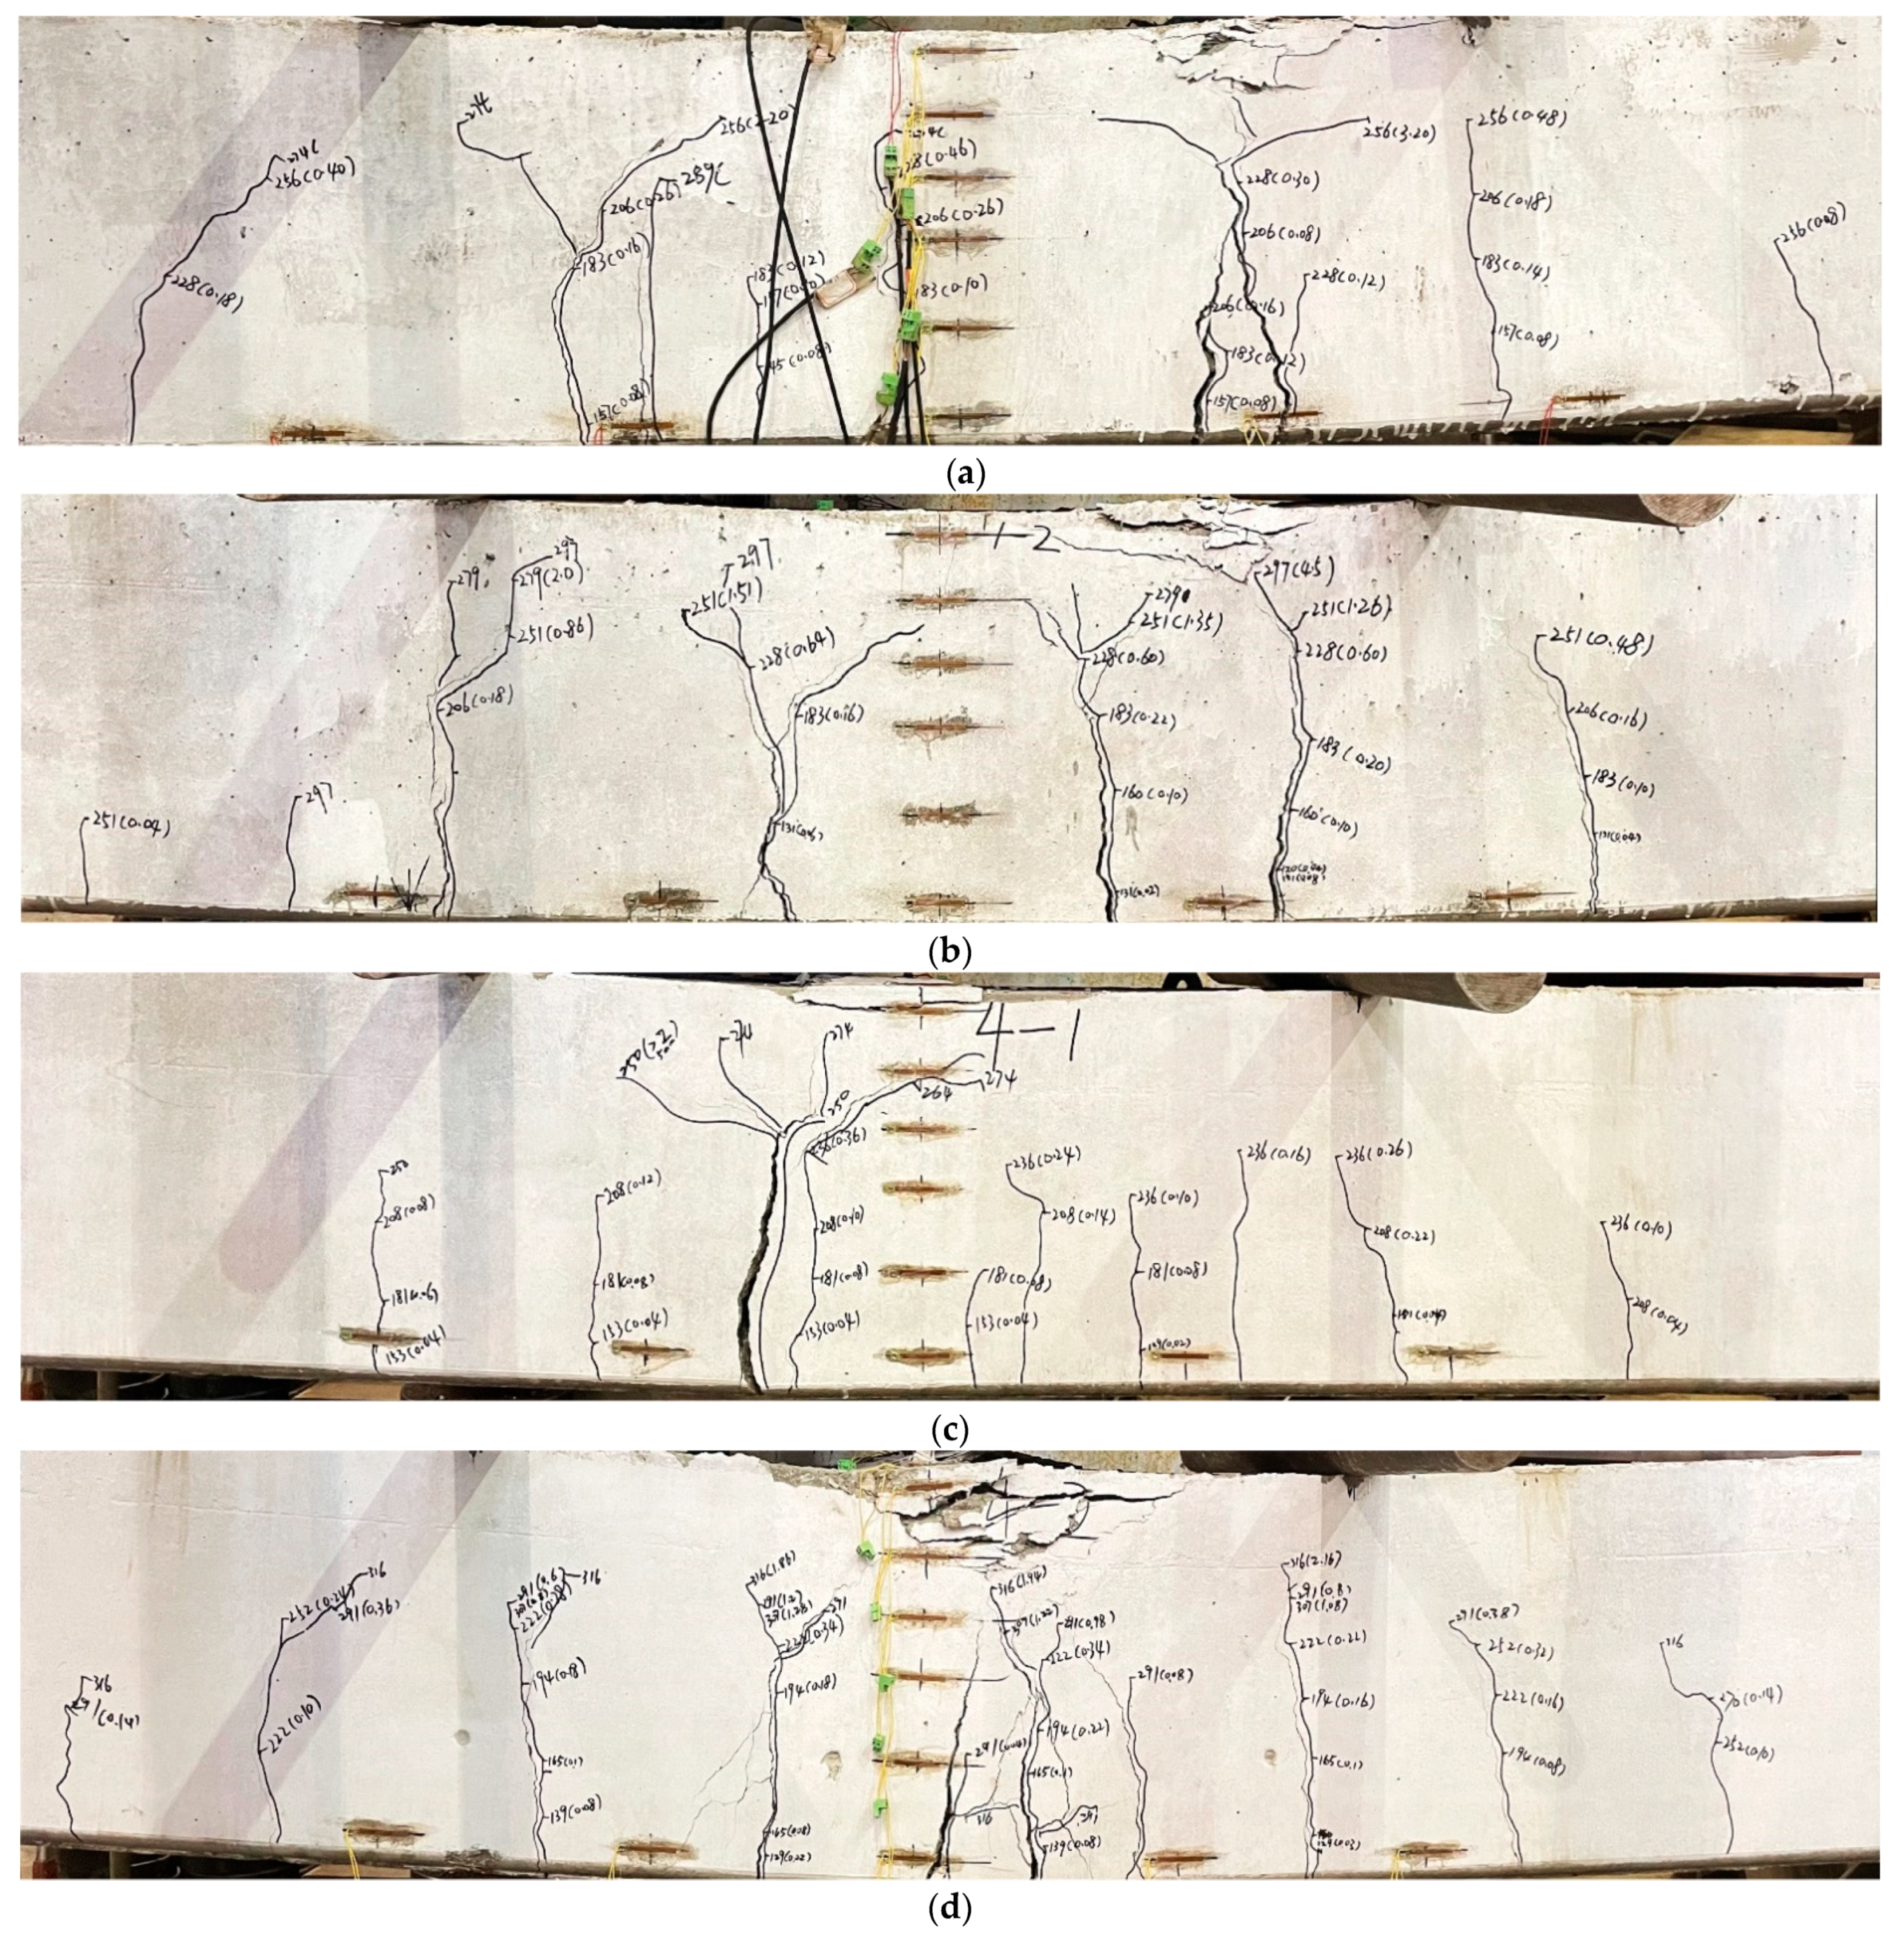
4.1. Crack Distribution

Figure 9 represents crack development in the specimens when the ultimate load is reached for each specimen.
Specimen PRS400A1 and specimen PRS400A2 cracked when the bending moment in the span reached 89.7 kN·m and 81.9 kN·m. 9 cracks were observed when the concrete was crushed in the compressed zone. The maximum width of the main cracks reached 3.5 mm and 3.2 mm. The maximum depth of development reached 33.8 cm and 32.9 cm. Cracks on both sides of specimen PRS400A1 and specimen PRS400A2 developed vertically, mostly concentrated in the pure bending section. Cracks were observed evenly on both sides of the span. At the end of loading, Cracks developed laterally with many branches. A few oblique cracks observed in the shear bending section. Specimen PRS400B1 cracked when the bending moment in the span reached 85.8 kN·m. A total of 10 cracks were observed when the non-prestressed reinforcement was pulled out. The main crack width was 2.0 mm and the maximum depth was 27.2 cm. The main crack developed rapidly before damage; the rest of the cracks developed to a small extent and unevenly. Specimen PRS400B2 cracked when the bending moment in the span reached 89.7 kN·m. 10 cracks were observed when the non-prestressed reinforcement was pulled out. The main crack width is 2.94 mm and the maximum depth is 28.9 cm. Cracks were mostly developed vertically and are distributed in both pure and shear bending sections. Cracks are symmetrically and uniformly distributed on both sides of the span.
The following conclusions can be drawn from the above experimental phenomena. The width and depth of cracks of specimen PRS400B1 and specimen PRS400B2 were smaller than those of specimen PRS400A1 and specimen PRS400A2. The cracks of specimen PRS400B1 and PRS400B2 developed vertically with less bifurcation, and the cracks were evenly distributed. This showed that specimen PRS400B1 and specimen PRS400B2 could control the development of cracks in a better way.

4.2. Strain Development

Figure 10 shows the stress-strain curves of each specimen, which mainly describe the strain variation and cracking of midspan of the specimen. To ensure that figures are plotted without distortion, only those in the strain range of −3.0 × 10⁻³ to 1.5 × 10⁻³ were plotted.
As can be observed from Figure 10, there is a small strain increase in the specimen before the external load reaches the cracking load. It is a linear relationship between the strain and the external load in the initial stage of loading. The specimen was in the linear elastic behavior stage, which was in compliance with the plane section assumption. After loading until the crack appeared, the strain growth accelerated. The strain gauges in the direction of crack development rapidly exceeded the range and failed. The strain gauges at other locations in the tensile zone showed a small change in strain. There was a slight decrease in the strain gauges readings as the concrete strain rebounded. The number of cracks increases as the load continues to increase to the ultimate load. Some strain gauges failed due to rapid increase in strain.
Specimen PRS400A1 was damaged with a maximum compressive strain of −2.6 × 10⁻³ and the concrete was crushed. Although the concrete was crushed when the specimen PRS400A2 was damaged, the compressive strain of the concrete was only −1.9 × 10⁻³. The compressive capability of the concrete was not fully developed. When the specimen PRS400B1 was loaded to 250 kN, the strain on the concrete in the compressed zone increased suddenly due to the rapid development of the main crack. The maximum compressive strain exceeded −3.0 × 10⁻³ when the concrete was crushed during the damage of specimen PRS400B2. The compressive capability of concrete was represented better on specimen PRS400B2.

4.3. Comparison and Analysis of Results

The load-displacement (P-S) curves of the specimen were plotted in Figure 11 based on the results of the finite element model analysis and the experimental analysis. In the elastic stage, the load-displacement curves basically grew linearly. The curves acquired by the finite element simulation almost coincide with the curves acquired by the test. In the yielding stage of the non-prestressed reinforcement, the flexural stiffness of the specimen decreased and the two curves still coincide well. In the damage stage, from the yielding of the non-prestressed reinforcement to the crushing of the concrete, the stiffness of the specimen decreased noticeably and the bearing capacity decreased rapidly. The concrete failed to perform well in compressive capacity when the specimen PRS400B1 was damaged. The reason might be that the concrete was not vibrated evenly during the pouring process, causing the main crack to develop along the defect.
Table 5 shows the cracking moments M c r , k , M c r , e , M c r , n , and ultimate moments M u , k , M u , e , and M u , n . It can be seen from the table that the difference among the cracking moments obtained from finite element simulation, experimental analysis and specification calculation was small. The cracking moments of the concrete specimen can be predicted based on the theoretical calculation and finite element simulation. The ultimate bending moment calculated by the specification has a difference with the experiment. The ultimate bending moment values of specimen PRS400A1 and PRS400A2 are 24.3% and 26.3% smaller than the experimental values, respectively. The ultimate bending moment values of specimen PRS400B1 and PRS400B2 are 1.5% and 24.1% smaller than the experimental values respectively. The difference between the finite element simulation results and the experimental results is within 10%. The finite element model can simulate the whole process of bending of the PRS well.

5. Parametric Analysis

Parametric study was carried out to further explore the flexural behaviors of the PRS. Based on the experimental study, finite element models were used to explore the effects of the prestressed steel strand ratio, the non-prestressed reinforcement ratio and tension control stress on the behaviors of the PRS.
The prestress degree is an important index for the study and design of prestressed structures. At present, there are three definitions of prestress degree internationally [24]. The definition of prestress degree based on flexural bearing capacity, based on reinforcement tension, and based on decompression bending moment. The second definition was used as λ, namely λ= A p f p y /( A p f p y + A s f y ) where A p f p y is the tensile force provided by prestressed reinforcement in the ultimate state; A s f y is the tensile force provided by non-prestressed reinforcement in the ultimate state. The non-prestressed reinforcement ratio and the prestressed steel strand ratio were used as variables to simulate 11 common types of PRS by ABAQUS. The specimen numbers and parameters are shown in Table 6.

5.1. Non-Prestressed Reinforcement Ratio

As shown in Figure 12, the finite element model took the non-prestressed reinforcement ratio as the variable. The model clearly showed three different stages of elastic stage, yielding stage, and damage stage. The elastic stage of each specimen basically overlapped. As the prestressed degree decreased (the non-prestressed ratio increased), the cracking moments of the specimens were 76.6 kN·m, 77.0 kN·m, 77.3 kN·m, 77.7 kN·m, and 78.1 kN·m for each level, as shown in Figure 13. The cracking moments increased slightly. It indicated that the non-prestressed reinforcement ratio had a small effect on the cracking moment of the PRS. As shown in Figure 14, the ultimate bending moments of the specimen models increased to 277.1 kN·m, 289.9 kN·m, 305.1 kN·m, 329.7 kN·m, and 349.3 kN·m, respectively. The ultimate bending moment increased by 4.62%, 5.24%, 8.06%, and 5.94% for each level. The specimen PRS-1-2 had the largest increase in an ultimate bending moment. The ductility of the PRS showed a small change.
The ultimate bending moment of the PRS increased continuously with the increase of the non-prestressed reinforcement ratio. Its increase shows a process of increasing and then decreasing with the increase of the non-prestressed reinforcement ratio. There is an optimal non-prestressed reinforcement ratio. For the PRS with the 0.27% prestressed steel strand, the prestressed degree is 0.61 at 0.64%, and a non-prestressed reinforcement ratio has the best performance. It means the model PRS-1-2 has the best bending resistance.

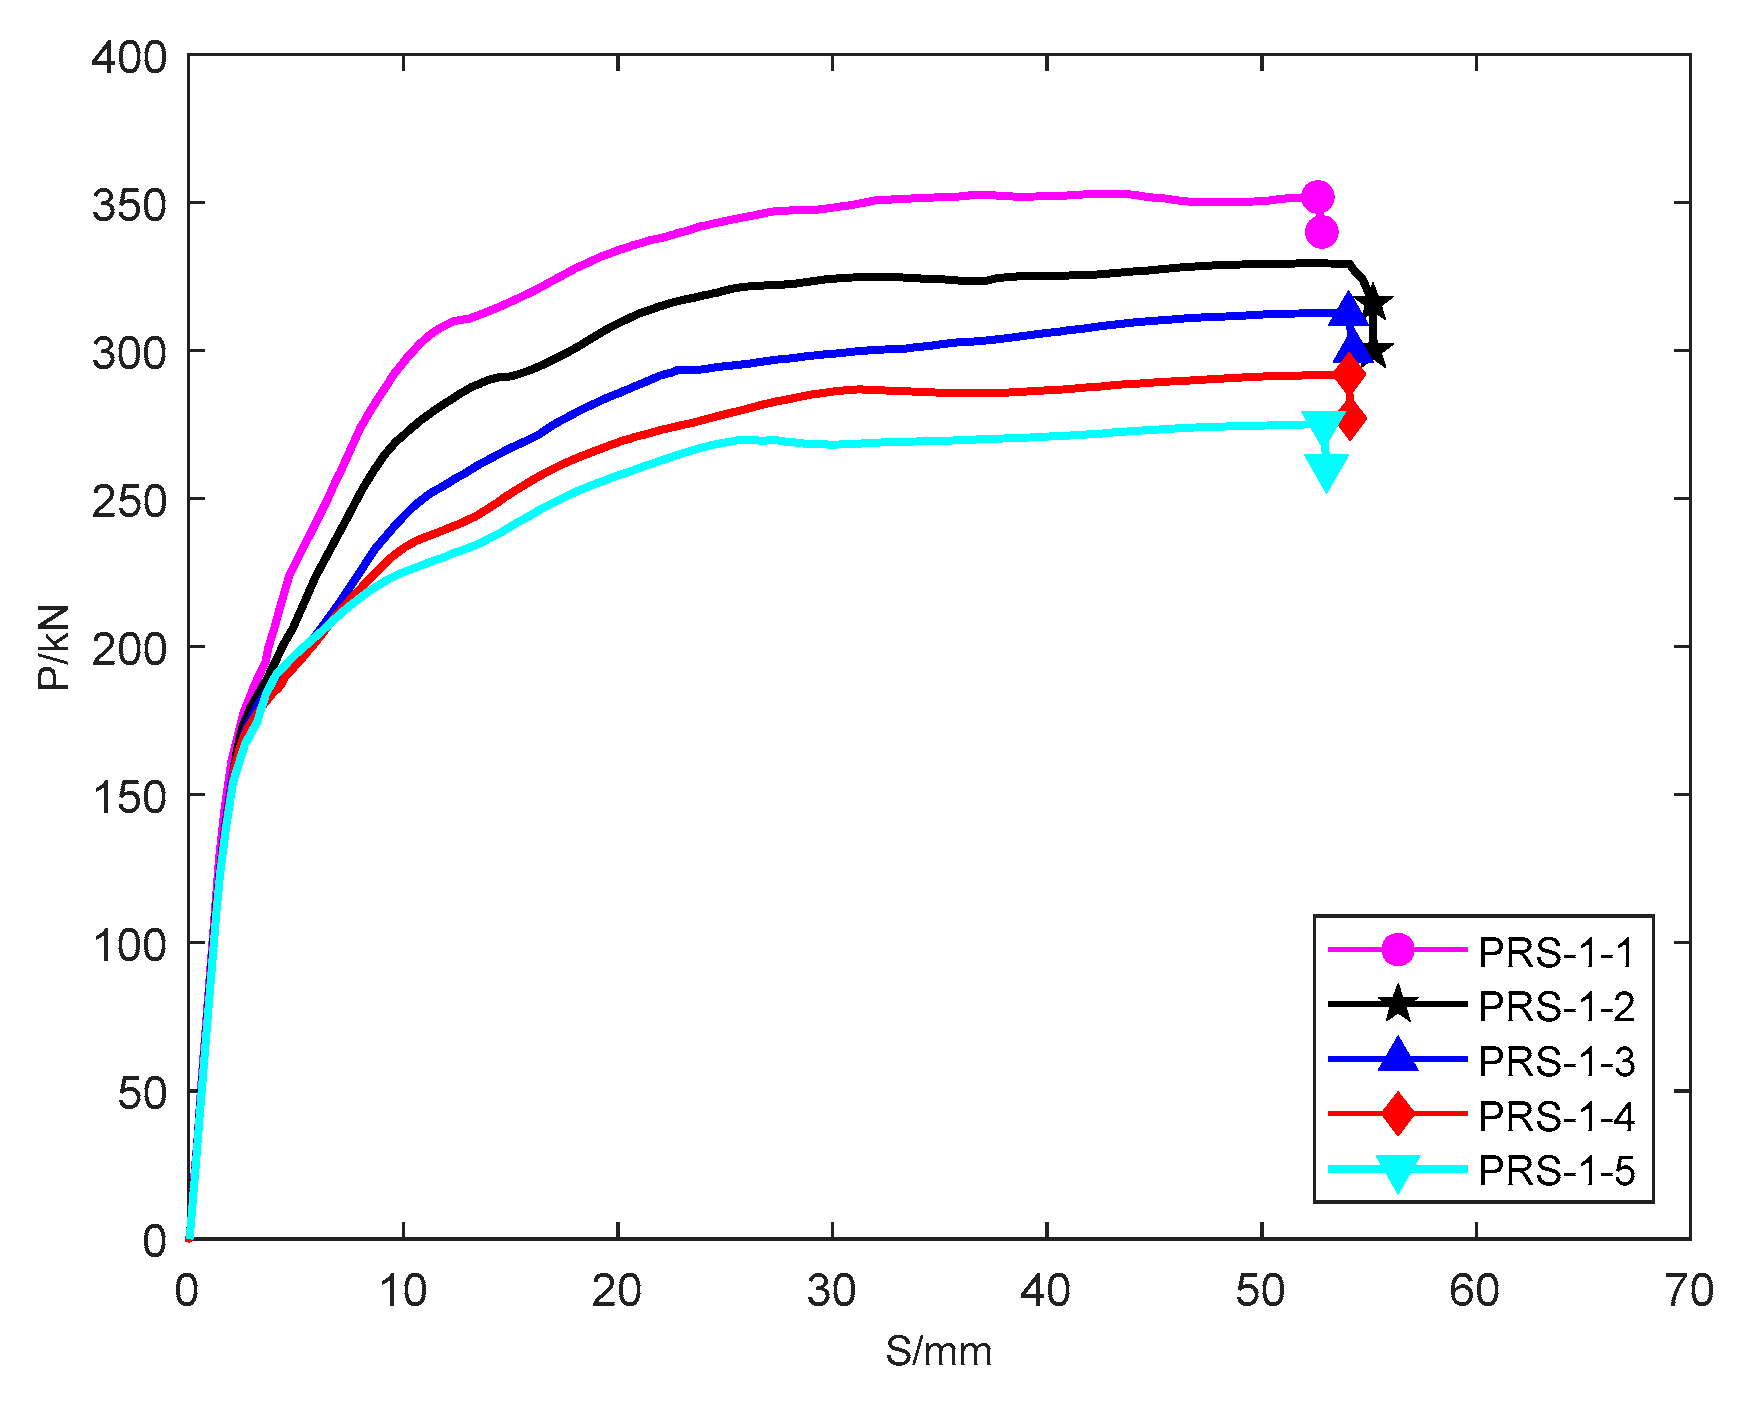
5.2. Prestressed Steel Strand Ratio

As shown in Figure 15, the finite element model took the prestressed steel strand ratio as the variable. The model still reflected the load state of the PRS well. As shown in Figure 16 and Figure 17, with the increase of prestressed degree (the increase of prestressed strand reinforcement ratio), the cracking moment of the specimen was 77.7 kN·m, 88.0 kN·m, 100.8 kN·m, and 121.9 kN·m, respectively. The cracking moment increased substantially. The ultimate bending moments of the models increased to 329.7 kN·m, 396.9 kN·m, 477.2 kN·m, and 566.7 kN·m, respectively. The ultimate bending moment increased by 20.38%, 20.23%, and 18.76% for each level. The reduction of ductility of the PRS was obvious. The deflection of the PRS at the damage of model PRS-2-4 is only 30.4 mm, which is 46.6% less than the deflection of model PRS-2-1 of 56.9 mm.
When the prestressed degree varies uniformly, the mechanical properties of the model are more affected due to the increase of the prestressed steel strand ratio. The effect on the increase of cracking moment and ultimate bending moment is much greater than the increase of non-prestressed reinforcement ratio. The increase of the prestressed steel strand ratio also makes the ductility of the PRS decrease significantly. The cracking moment and ultimate bending moment of the PRS continue to increase with the increase of the non-prestressed reinforcement ratio. However, the increase of ultimate bending moment shows a decreasing trend with the increase of the prestressed steel strand ratio. Considering the ductility and ultimate bearing capacity, for the PRS with 0.64% of non-prestressed reinforcement, the prestressed degree which is 0.74 at 0.37% of prestressed reinforcement has the best performance. It means the model PRS-2-3 has the best bending resistance.

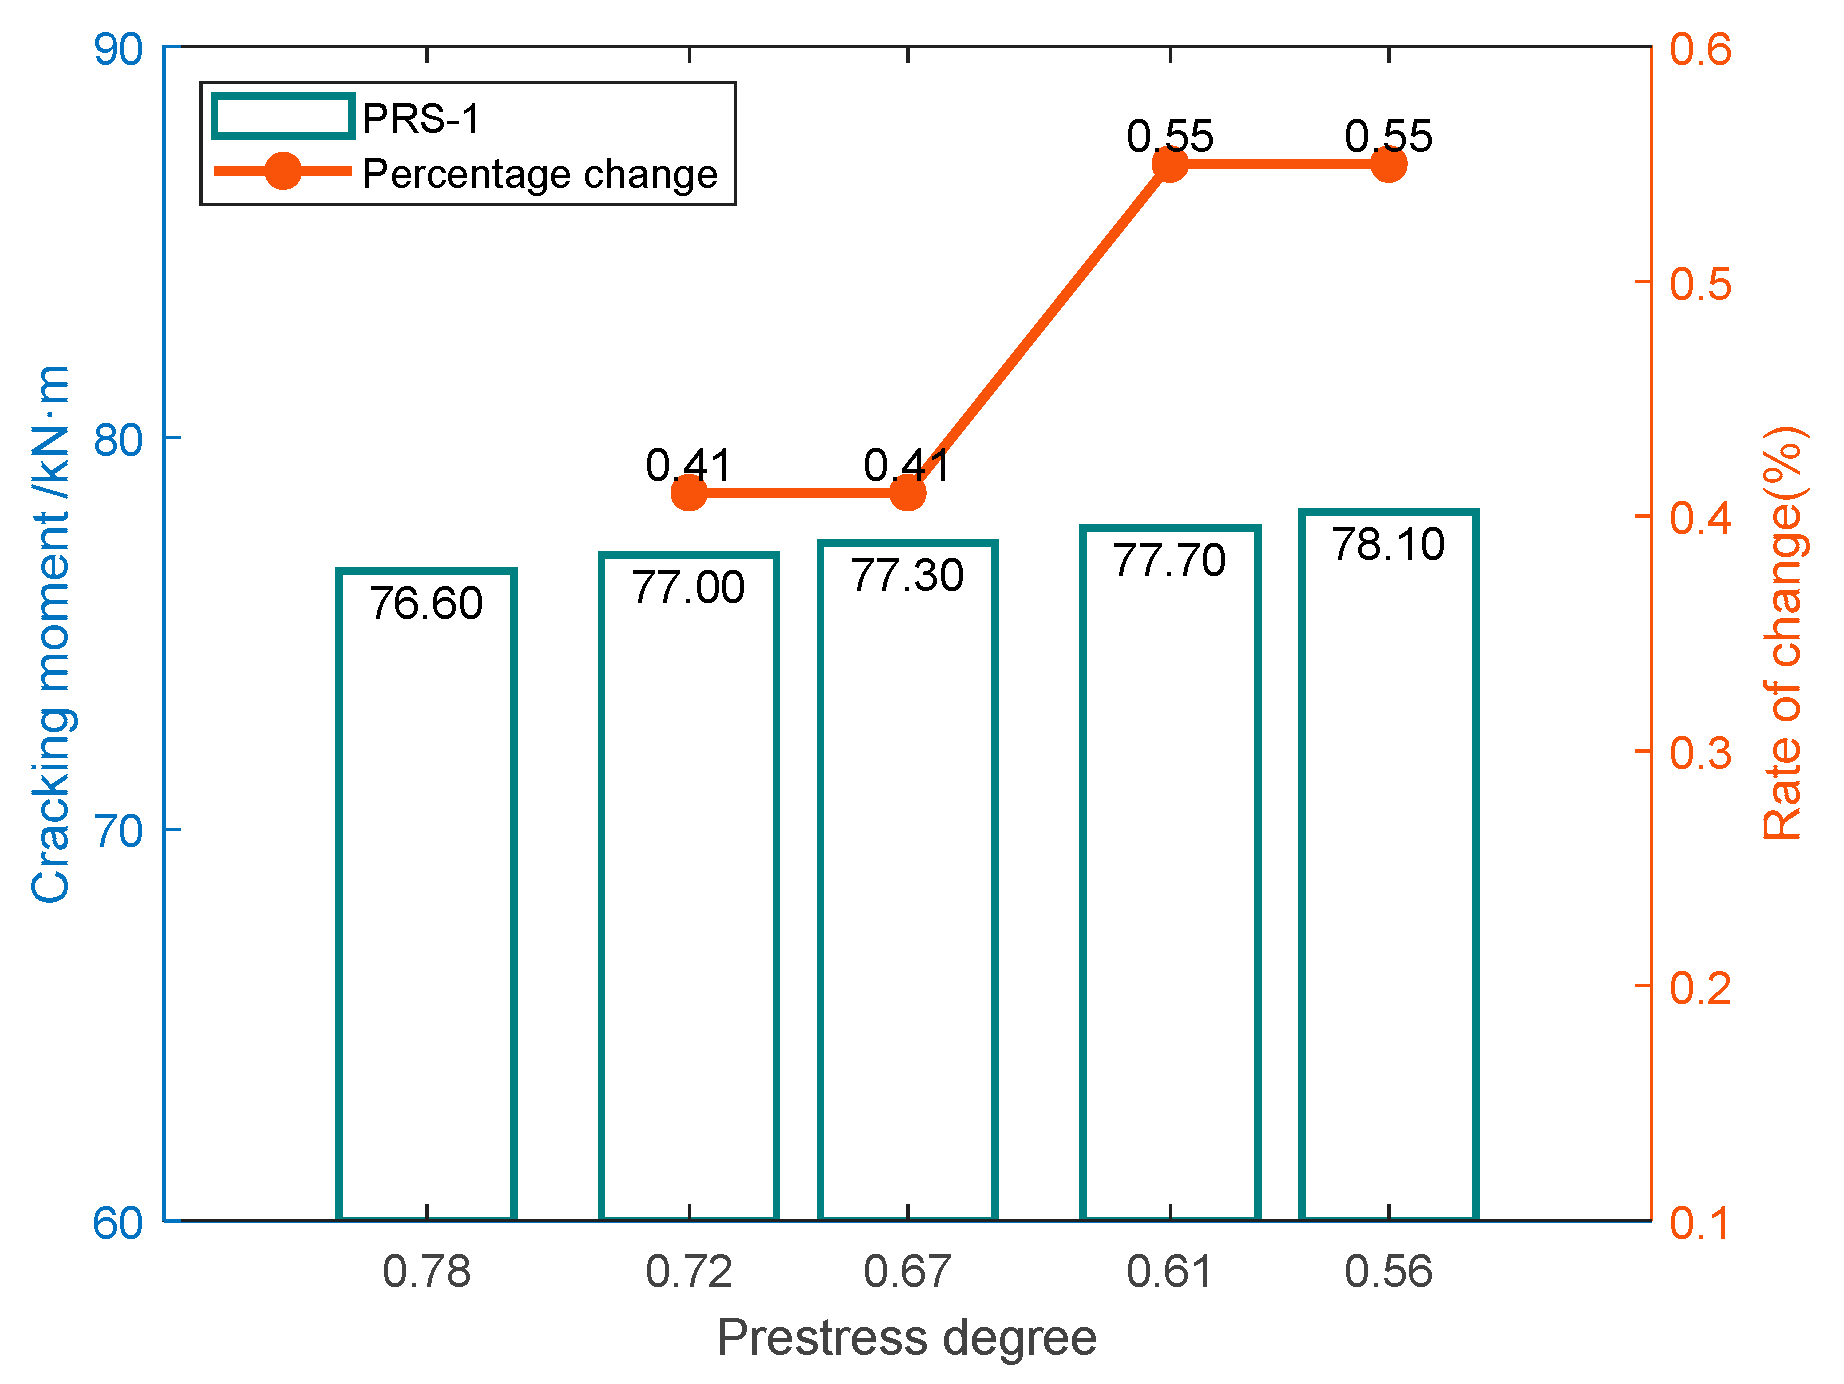
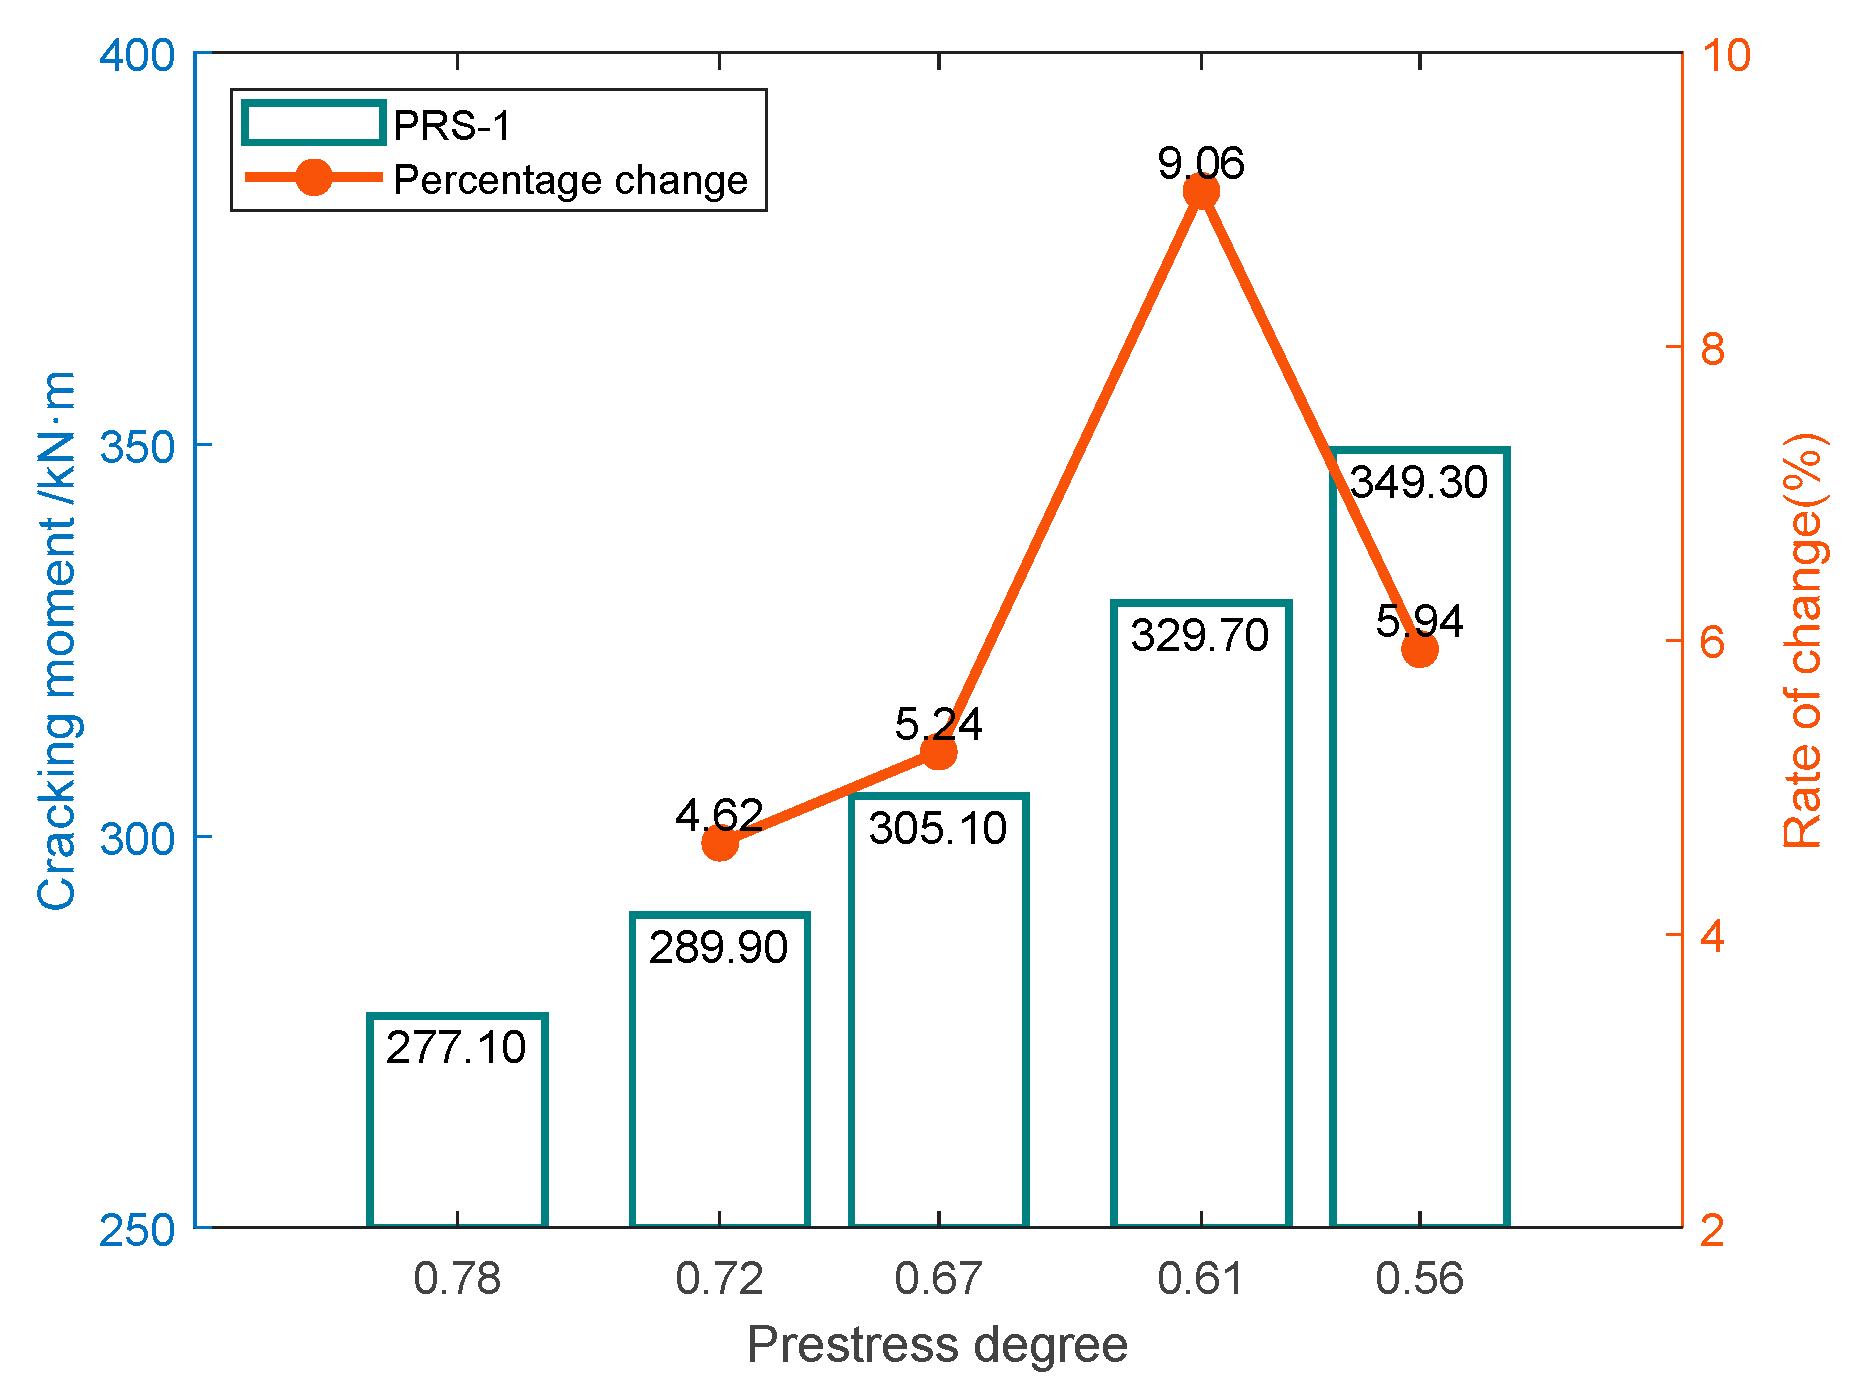
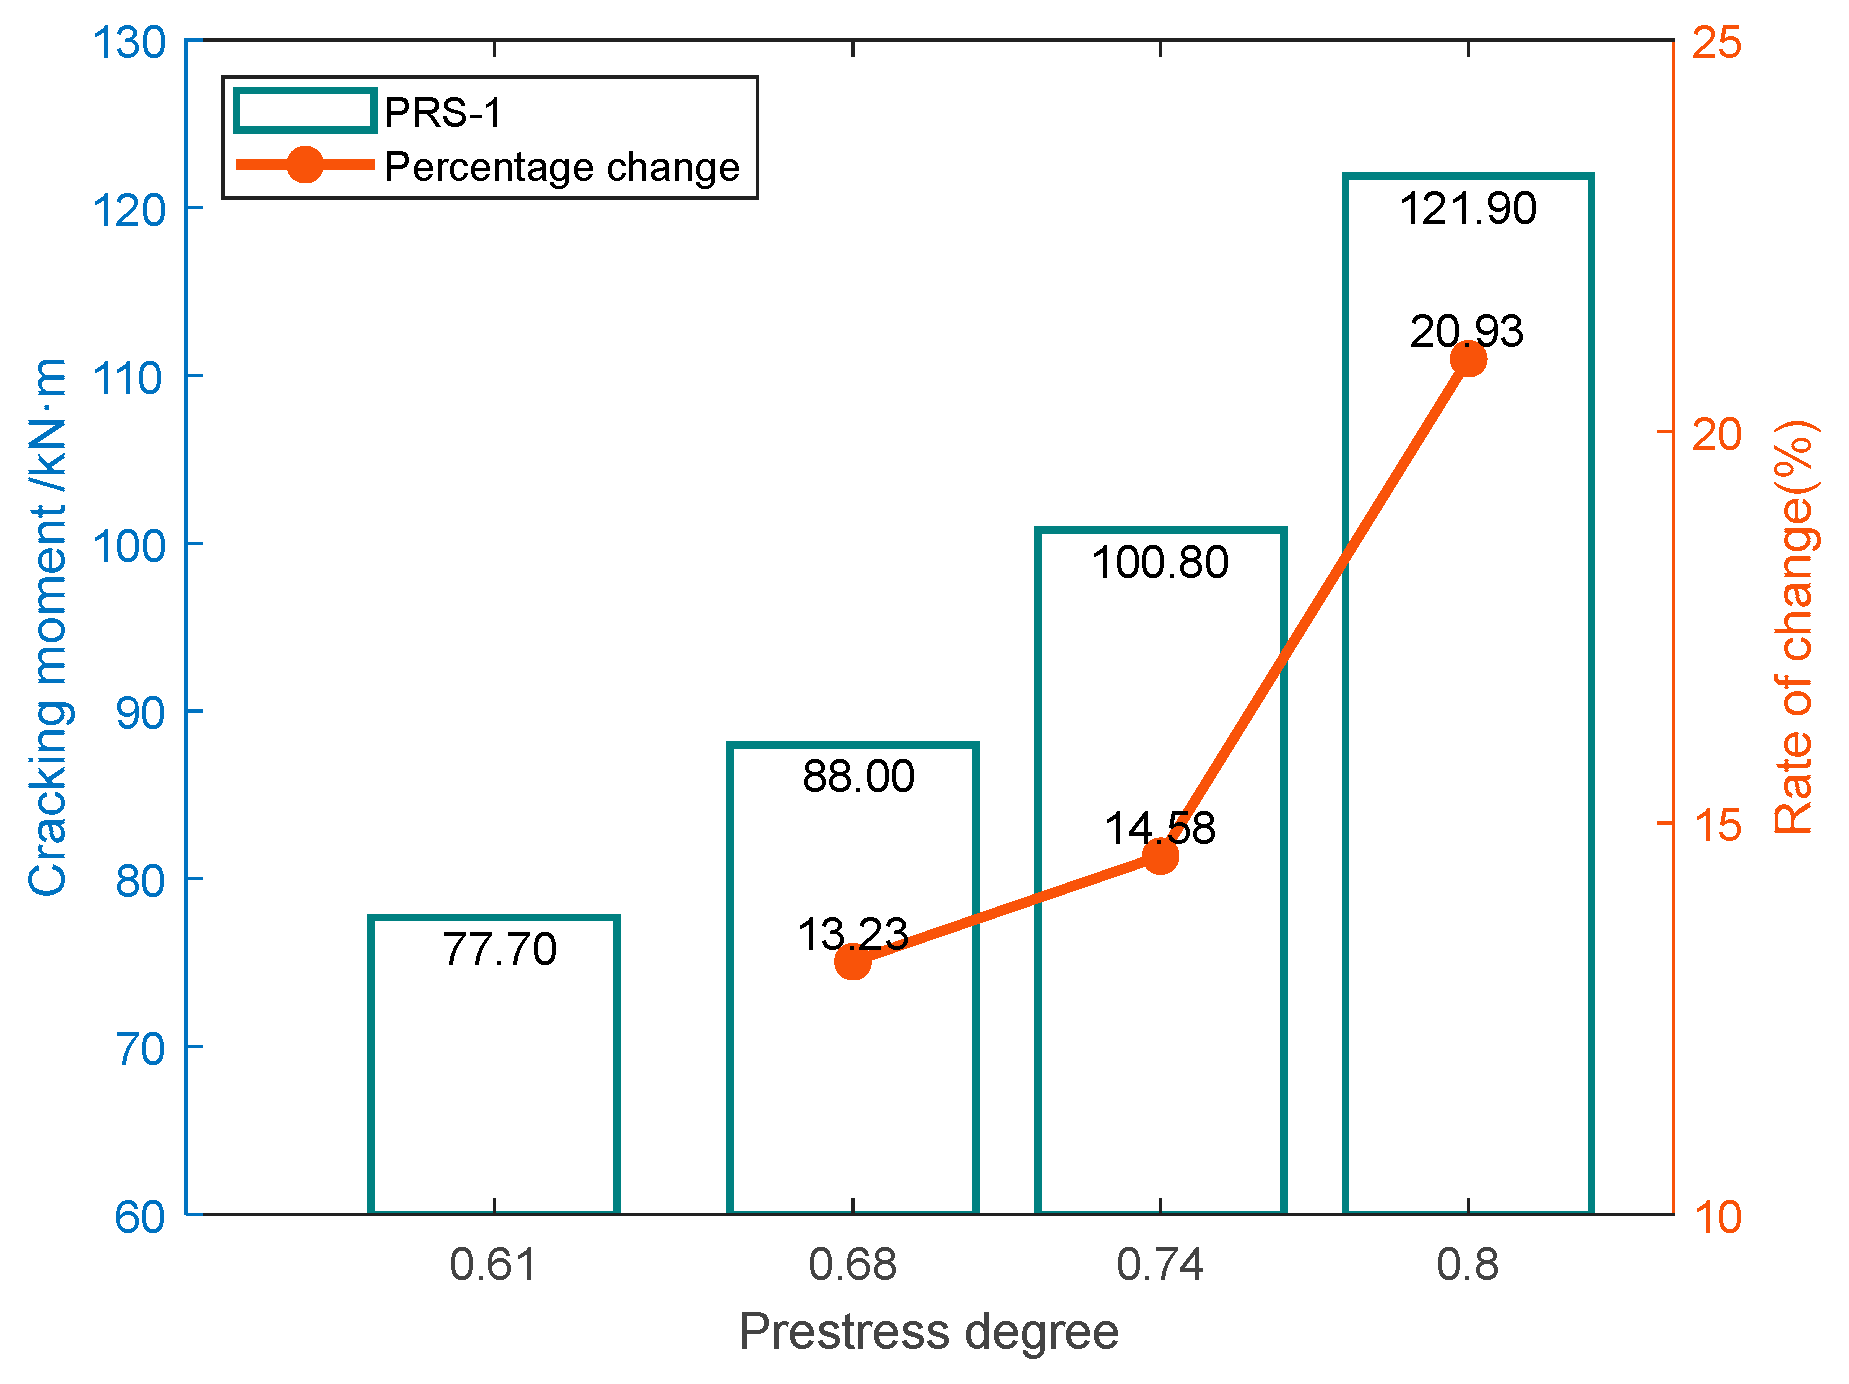
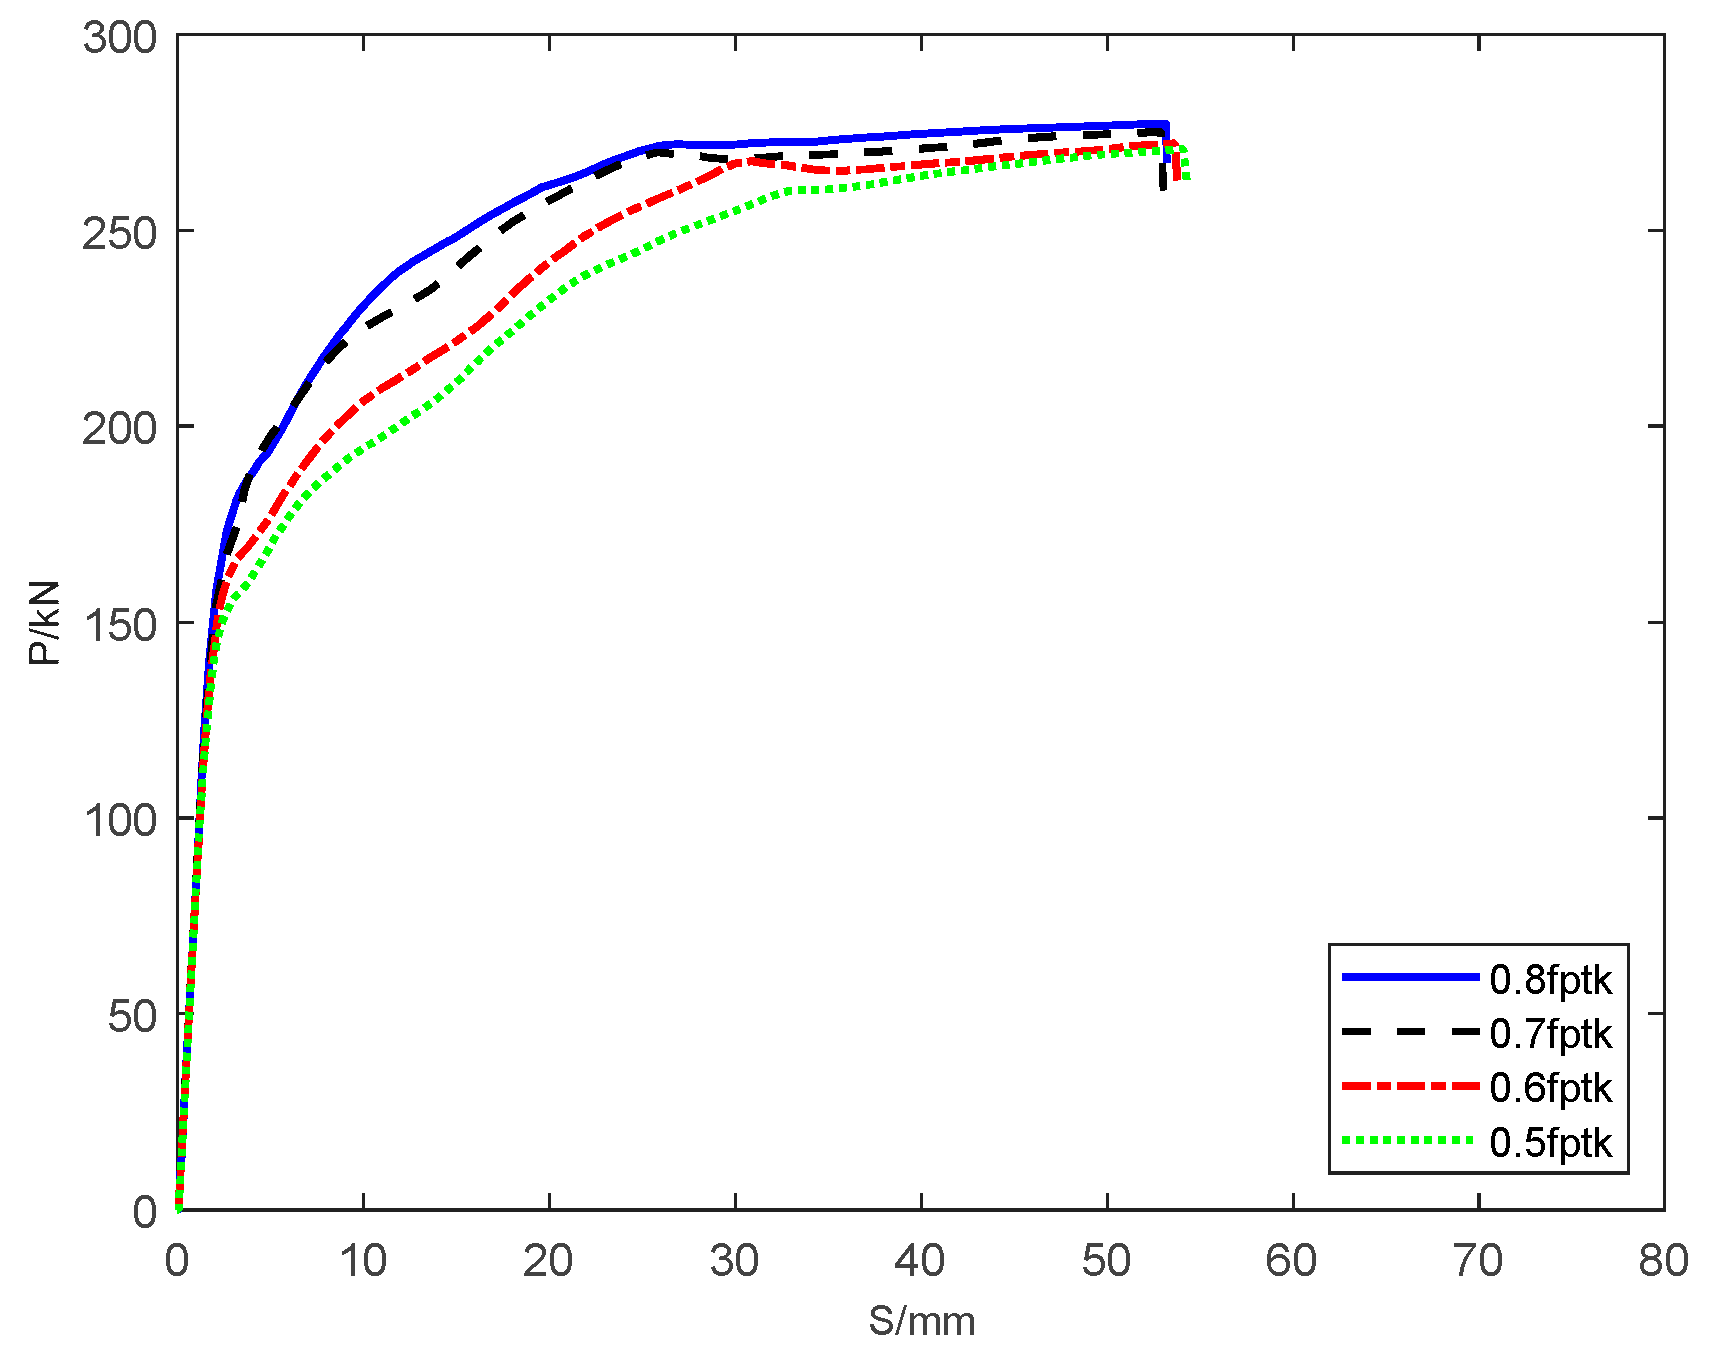
5.3. Tension Control Stress

The following Figure 18 shows the p-s curves when the tension control stress of the steel strand of specimen PRS-1-5 is 0.5 f p t k , 0.6 f p t k , 0.7 f p t k , and 0.8 f p t k . The slope of the elastic section of the four finite element models is basically the same, which indicates that the tension control stress has little influence on the stiffness of the elastic section of the curve. With the increase of tensile control stress, the cracking moment of the specimen increased to 65.6 kN·m, 71.1 kN·m, 76.6 kN·m, and 82.2 kN·m, with the increase of 8.38%, 7.74%, and 7.31% for each level. The specimen entered the elastic-plastic stage later but entered the damage stage earlier. The tension control stress has little effect on the damage stage of the models. The difference between the ultimate bending moment and mid-span deflection of the four models at the time of damage is quite slight.

6. Conclusions

This study carried out full-scale tests on a new type of precast pile, which uses steel strand as prestressed reinforcement and is equipped with hot-rolled reinforcement. The PRS has superior flexural load capacity to the traditional precast concrete solid square piles and better ductility than prestressed steel rod piles. An innovative concept of prestressed degree of composite reinforcement steel strand square pile is proposed. On this basis, the effects of prestressed steel strand ratio and non-prestressed reinforcement ratio on cracking moment, ultimate bending moment and ductility of steel strand square pile are studied. The following conclusions can be drawn:
  • The non-prestressed reinforcement ratio in the PRS has a great effect on its cracking and ultimate bearing capacity, yet it has a small effect on the cracking moment. Increasing the non-prestressed reinforcement ratio can make the concrete more compressive, better at controlling the development of cracks, and improve the ultimate bearing capacity.
  • The damage of specimen PRS400A1 and specimen PRS400A2 was in the form of crushing of concrete in the compressed zone. While the damage of specimen PRS400B1 and specimen PRS400B2 was in the form of non-prestressed reinforcement being pulled off. Non-prestressed reinforcement in specimen PRS400B2 work well together with the concrete. The specimen PRS400B2 can achieve its flexural loading capability well.
  • The results of the finite element model are in high agreement with the experimental results. The difference between the simulated and experimental values of cracking moment is within 5% and the ultimate bending moment is within 10%. The finite element model can describe the whole process of bending of the PRS well.
  • A certain amount of non-prestressed reinforcement can make full use of the stiffness of the strand square piles. The non-prestressed reinforcement allows the pile to continue to be loaded even when large deformations occur.
In future research, more parametric analysis will be performed to cover a wider range of pile types, and the parameters will be selected with reference to the experimental and finite element modeling results in the article. In addition, the shear and tensile properties of stranded square piles will be studied, and the seismic performance of stranded square piles will be studied on this basis.

Author Contributions

Conceptualization, G.G.; methodology, G.G. and H.W.; software, H.W.; validation, H.W. and K.C.; formal analysis, H.W. and K.C.; investigation, K.Z., K.C. and H.W.; resources, X.Y.; data curation, H.W.; writing—original draft preparation, H.W.; writing—review and editing, G.G.; visualization, H.W.; supervision, G.G.; project administration, G.G.; funding acquisition, G.G. All authors have read and agreed to the published version of the manuscript.

Funding

The authors are grateful for constructive comments from the editors and reviewers. The work was sponsored by Ministry of Housing and Urban-Rural Development Science and Technology Program Project (2021-K-030), and the Center for Balance Architecture of Zhejiang University (K-20203330C).

Institutional Review Board Statement

Not applicable.

Informed Consent Statement

Not applicable.

Data Availability Statement

The experiment data and finite element data used to support the findings of this study are included within the article. Previous reported experiment data and conclusions were used to support this study. These prior studies and datasets are cited at relevant places within the text as references [1,2,3,4,5,6,7,8,9,10,11,12,13,14,15,16,17,18,19,20,21,22,23,24]. Experiment data used to support the findings of this study are available from the corresponding author upon request.

Conflicts of Interest

The authors declare no conflict of interest.

Nomenclature

A 0 nominal area of reinforcing reinforcement ( mm 2 )
A g t total maximum force elongation of reinforcing reinforcement
A p total cross-section area of prestressed reinforcement ( mm 2 )
A s total cross-section area of non-prestressed reinforcement ( mm 2 )
B pile section side length (mm)
B s distance from the center of the non-prestressed reinforcement (mm)
d t tensile damage factors in the concrete plastic damage model
d c compressive damage factors in the concrete plastic damage model
E 0 initial elastic modulus of concrete
E s elastic modulus of reinforcing bar (GPa)
f c , r the representative value of uniaxial compressive strength of concrete
f c u , 10 compressive strength of 150 × 150 × 150 mm concrete cube (MPa)
f c u , 10 compressive strength of 100 × 100 × 100 mm concrete cube (MPa)
f c , k axial compressive strength of concrete (MPa)
f p t k standard value of prestressed reinforcement in tension (MPa)
f p y yield strength of prestressed reinforcement (MPa)
f t tensile strength of concrete (MPa)
f t , r the representative value of uniaxial tensile strength of concrete
f u ultimate strength of reinforcing reinforcement (MPa)
f y yield strength of reinforcing reinforcement (MPa)
k 1 hardening starting strain/yield strain
k 2 peak strain/yield strain
k 3 limiting strain/yield strain
k 4 peak stress/yield strength
L length of the specimen (mm)
M c r , k theoretical value of cracking bending moment (kN·m)
M c r , n numerical value of cracking bending moment (kN·m)
M c r , e experimental value of cracking bending moment (kN·m)
M u , k theoretical value of ultimate bending moment (kN·m)
M u , n numerical value of ultimate bending moment (kN·m)
M u , e experimental value of ultimate bending moment (kN·m)
t thickness of the end plate (mm)
T temperature
α coefficient of thermal expansion
α c parameter of falling section of uniaxial compressive stress-strain curve of concrete
α t parameter of falling section of uniaxial tensile stress-strain curve of concrete
λ prestress degree
ε strain
ε c compress strain of concrete
ε ˜ c i n compressive inelastic strain of concrete
ε ˜ c p l equivalent plastic strains of concrete in compression
ε c , r peak compressive strain of concrete corresponding to the uniaxial compressive strength
ε t tensile strain of concrete
ε ˜ t c k cracking strain of concrete
ε ˜ t p l equivalent plastic strains of concrete in tension
ε t , r peak compressive strain of concrete corresponding to the uniaxial tensile strength
σ stress
σ c o n tensile control stress
σ c compressive strength of concrete (MPa)
σ c e concrete effective compressive stress (MPa)
σ t tensile strength of concrete (MPa)

References

  1. Gan, G.; Zeng, K.; Yu, X.; Gong, S.; Xie, J. Construction and Experimental Verification of Pretensioned Centrifugal Concrete Pile Provided with Steel Strands. China Concr. Cem. Prod. 2019, 3, 35–39. [Google Scholar]
  2. Irawan, C.; Suprobo, P.; Putu Raka, I.G.; Djamaluddin, R. A Review of Prestressed Concrete Pile with Circular Hollow Section (Spun Pile). J. Teknol. 2015, 72, 115–123. [Google Scholar] [CrossRef] [Green Version]
  3. Kishida, S.; Horii, M.; Kuwabara, F.; Hayashi, S. Experimental study on shear strength of the PHC pile with large diameter. J. Struct. Const. Eng. 1998, 8, 123–130. [Google Scholar] [CrossRef] [Green Version]
  4. Thusoo, S.; Kono, S.; Hamada, J.; Asai, Y. Performance of Precast Hollow Steel-Encased High-Strength Concrete Piles. Eng. Struct. 2020, 204, 109995. [Google Scholar] [CrossRef]
  5. Irawan, C.; Djamaluddin, R.; Raka, I.G.P.; Faimun, F.; Suprobo, P.; Soeprapto, G. The Effect of The Presence of Infilling Concrete on Flexural Performance of Spun Pile—An Experimental Study. J. Teknol. 2020, 82, 85–95. [Google Scholar] [CrossRef] [Green Version]
  6. Shishegaran, A.; Ghasemi, M.R.; Varaee, H. Performance of a novel bent-up bars system not interacting with concrete. Front. Struct. Civ. Eng. 2019, 13, 1301–1315. [Google Scholar] [CrossRef]
  7. Bigdeli, A.; Shishegaran, A.; Naghsh, M.A.; Karami, B.; Shishegaran, A.; Alizadeh, G. Surrogate models for the prediction of damage in reinforced concrete tunnels under internal water pressure. J. Zhejiang Univ. Sci. A 2021, 22, 632–656. [Google Scholar] [CrossRef]
  8. Özkılıç, Y.O.; Aksoylu, C.; Arslan, M.H. Experimental and numerical investigations of steel fiber reinforced concrete dapped-end purlins. J. Build. Eng. 2021, 36, 102–119. [Google Scholar] [CrossRef]
  9. Yang, Z.; Li, G.; Wang, W.; Lv, Y. Study on the flexural performance of prestressed high strength concrete pile. KSCE J. Civ. Eng. 2018, 22, 4073–4082. [Google Scholar] [CrossRef]
  10. Yang, Z.; Li, G.; Wang, W. Experimental investigation and nonlinear finite element analysis on seismic performance of PHC piles. Struct. Eng. 2018, 28, 475–488. [Google Scholar] [CrossRef]
  11. Wu, P.; Guo, Y.; Zhu, D.; Jin, W.; Zhang, Z.; Liang, R. Flexural performances of prestressed high strength concrete piles reinforced with hybrid GFRP and steel bars. Mar. Georesources Geotechnol. 2020, 38, 518–526. [Google Scholar] [CrossRef]
  12. Aksoylu, C.; Özkılıç, Y.O.; Arslan, M.H. Damages on prefabricated concrete dapped-end purlins due to snow loads and a novel reinforcement detail. Eng. Struct. 2020, 225, 111–225. [Google Scholar] [CrossRef]
  13. Özkılıç, Y.O.; Yazman, Ş.; Aksoylu, C.; Arslan, M.H.; Gemi, L. Numerical investigation of the parameters influencing the behavior of dapped end prefabricated concrete purlins with and without CFRP strengthening. Constr. Build. Mater. 2021, 275, 122–173. [Google Scholar] [CrossRef]
  14. Muguruma, H. Improving the Flexural Ductility of Pretensioned High Strength Spun Concrete Piles by Lateral Confining of Concrete. In Proceedings of the Pacific Conference on Earthquake Engineering, Wairakei, New Zealand, 5–8 August 1987; Volume 1, pp. 385–396. [Google Scholar]
  15. Budek, A.M.; Benzoni, G.; Priestley, M.J.N. Experimental Investigation of Ductility of In-Ground Hinges in Solid and Hollow Prestressed Piles; Structural Systems Research Project: San Diego, CA, USA, 1997. [Google Scholar]
  16. Ministry of Housing and Urban-Rural Development of the People’s Republic of China. Standard for Test Methods of Mechanical Properties on Ordinary Concrete; China Construction Industry Press: Beijing, China, 2002; pp. 12–15.
  17. Ministry of Housing and Urban-Rural Development of the People’s Republic of China. Test Methods of Steel for Prestressed Concrete; China Standard Press: Beijing, China, 2019; pp. 51–55.
  18. Ministry of Housing and Urban-Rural Development of the People’s Republic of China. Standard for Test Method of Concrete Structures; China Construction Industry Press: Beijing, China, 2012; pp. 10–18.
  19. Ministry of Housing and Urban-Rural Development of the People’s Republic of China. Code for Design of Concrete Structures; China Architecture and Building Press: Beijing, China, 2010; pp. 207–212.
  20. Lubliner, J.; Oliver, J.; Oller, S.; Oñate, E. A plastic damage model for concrete. Int. J. Solids Struct. 1989, 25, 299–326. [Google Scholar] [CrossRef]
  21. Lee, J.; Fenves, G.L. Plastic-damage model for cyclic loading of concrete structures. J. Mech. Eng. 1998, 124, 892–900. [Google Scholar] [CrossRef]
  22. Xing, X.; Li, Y.; Lei, Z. Dynamic mechanical tensile properties and intrinsic structure relationship of prestressed steel strands. China Sci. Tech. Eng. 2018, 18, 228–233. [Google Scholar]
  23. Esmaeily, A.; Xiao, Y. Behavior of reinforced concrete columns under variable axial loads: Analysis. ACI Struct. J. 2005, 102, 736. [Google Scholar]
  24. Wang, J.; Liu, L.; Shang, S. Experimental study on the effect of prestressing degree on the creep curvature of prestressed concrete beams. China Civ. Eng. J. 2010, 43, 38–48. [Google Scholar]
Figure 1. Main dimensions and reinforcement diagram of the PRS.
Buildings 12 01801 g001
Figure 2. Strength test of the concrete block.
Buildings 12 01801 g002
Figure 3. Tensile strength test of steel strand.
Buildings 12 01801 g003
Figure 4. Specimen loaded by bending.
Buildings 12 01801 g004
Figure 5. Stress-strain relationship for concrete under uniaxial tension.
Buildings 12 01801 g005
Figure 6. Stress-strain relationship for concrete under uniaxial compression.
Buildings 12 01801 g006
Figure 7. Stress-strain curve of reinforcement in tension.
Buildings 12 01801 g007
Figure 8. Finite element model of the specimen.
Buildings 12 01801 g008
Figure 9. Distribution of cracks of specimens after failure. (a) Specimen PRS400A1. (b) Specimen PRS400A2. (c) Specimen PRS400B1. (d) Specimen PRS400B2.
Buildings 12 01801 g009
Figure 10. Strain development of concrete in specimens (a) Specimen PRS400A1. (b) Specimen PRS400A2. (c) Specimen PRS400B1. (d) Specimen PRS400B2.
Buildings 12 01801 g010aBuildings 12 01801 g010bBuildings 12 01801 g010c
Figure 11. Comparison of force-deflection curves of specimens (a) Specimen PRS400A1 and Specimen PRS400A2. (b) Specimen PRS400B1 and Specimen PRS400B2.
Buildings 12 01801 g011
Figure 12. Effect of non-prestressed reinforcement on mid span deflection.
Buildings 12 01801 g012
Figure 13. Effect of non-prestressed reinforcement on cracking moment.
Buildings 12 01801 g013
Figure 14. Effect of non-prestressed reinforcement on ultimate bending moment.
Buildings 12 01801 g014
Figure 15. Effect of prestressed steel strand on mid span deflection curve.
Buildings 12 01801 g015
Figure 16. Effect of prestressed steel strand on cracking moment.
Buildings 12 01801 g016
Figure 17. Effect of prestressed steel strand on ultimate bending moment.
Buildings 12 01801 g017
Figure 18. Effect of tension control stress on mid span deflection.
Buildings 12 01801 g018
Table 1. Design parameters of the PRS.
Specimen NumberL/mm B s / mm Main Reinforcement Configuration ρ s / % Hoop Configurationt/mm σ c e / MPa
PRS400A160002978/9.5 (steel strand) + 4/12 (HRB400)0.274 (steel strand) + 0.283 (HRB400) b 4@100182.56
PRS400A260002978/9.5 (steel strand) + 4/12 (HRB400)0.274 (steel strand) + 0.283 (HRB400) b 4@100182.56
PRS400B160002978/9.5 (steel strand) + 4/18 (HRB400)0.274 (steel strand) + 0.635 (HRB400) b 4@100182.29
PRS400B260002978/9.5 (steel strand) + 4/18 (HRB400)0.274 (steel strand) + 0.635 (HRB400) b 4@100182.29
Table 2. Reinforcement material parameters.
Specification E s / GPa f y / MPa f u / MPa A 0 / mm2 A g t / %
S 9.5200.71697.51914.354.87.3
12197.0533.3617.7113.09.3
18199.1400.8573.1254.317.7
b 6197.4535.2568.219.62.2
Table 3. Parameters of the concrete constitutive model.
Compressive Stress/MPaInelastic Strain ε c / × 10−3 Damage   Factor   d c Tensile Stress/MPa Cracking   Strain   ε t / × 10−3 Damage   Factor   d t
25.23003.1500
30.710.060.032.70.030.15
31.950.070.042.150.060.3
33.910.090.051.740.090.41
37.320.150.071.450.120.49
43.10.450.151.240.140.56
43.630.640.191.080.160.61
42.810.840.240.960.180.64
40.751.080.290.860.20.68
38.041.340.340.790.220.7
35.111.60.390.720.240.72
32.221.870.430.520.330.8
27.062.370.510.420.420.84
22.892.850.580.350.510.86
17.043.740.670.310.60.88
Table 4. Material parameters of reinforcement model.
Specificationfy/MPa ε k 1 k 2 k 3 k 4
Φs9.51697.50.01371.04.084.171.28
ΦD12533.30.00407.523.525.11.19
ΦD18415.80.00524.0640.942.31.37
Φb6505.20.00311.013.813.91.22
Table 5. Comparison of numerical simulation results, test results, and formula calculations of flexural properties of specimens.
Specimen NumberMcr,k
(kN·m)
Mcr,e
(kN·m)
Mcr,n
(kN·m)
Mcr,k:Mcr,e:Mcr,nMu,k
(kN·m)
Mu,e
(kN·m)
Mu,n
(kN·m)
Mu,k:Mu,e:Mu,n
PRS400A17485.878.61:1.16:1.06147.7195.1184.11:1.32:1.25
PRS400A27489.778.61:1.21:1.06147.7200.3184.11:1.35:1.25
PRS400B17689.780.21:1.18:1.06179.3182.1218.51:1.02:1.22
PRS400B27681.980.21:1.08:1.06179.3236.1218.51:1.32:1.22
Table 6. Numbers and parameters of specimens.
Specimen NumberSteel StrandNon-Prestressed ReinforcementPre-Stress DegreeReinforcement Rate
PRS-1-18 S 9.54 200.561.06%
PRS-1-28 S 9.54 180.610.91%
PRS-1-38 S 9.54 160.670.78%
PRS-1-48 S 9.54 140.720.66%
PRS-1-58 S 9.54 120.780.56%
PRS-2-18 S 9.54 180.610.91%
PRS-2-28 S 11.14 180.681.01%
PRS-2-38 S 12.74 180.741.13%
PRS-2-48 S 15.24 180.801.34%
Publisher’s Note: MDPI stays neutral with regard to jurisdictional claims in published maps and institutional affiliations.

