Article

Integrated Design and Assessment for Indoor Heating, Ventilation and Air-Conditioning in Hot Summer and Cold Winter Area: A Case Study in China

1
Department of Architecture, Shanghai Academy of Fine Arts, Shanghai University, 99 Shangda Road, Shanghai 200444, China
2
College of Architecture and Urban Planning, Tongji University, 1239 Siping Road, Shanghai 200092, China
*
Author to whom correspondence should be addressed.
Buildings 2022, 12(11), 1844; https://doi.org/10.3390/buildings12111844
Submission received: 15 September 2022 / Revised: 18 October 2022 / Accepted: 21 October 2022 / Published: 1 November 2022
(This article belongs to the Section Building Energy, Physics, Environment, and Systems)

Abstract

:
Integrated design of the heating, ventilation and air-conditioning (HVAC) is indispensable to green design because the increasing demand for HVAC systems has led to the diversification of indoor terminals for residential buildings, either focusing on energy efficiency or specializing in creating comfortable indoor environments, and they have different impacts on architectural and engineering design. The paper discussed the assessment-based integration design of the HVAC system, and by introducing case experiences, the whole process of the collaboration between architects and engineers was explored. Various methods were used in the research. The analytic hierarchy process (AHP) was employed to develop the assessment structure and calculate weightings; employing fuzzy comprehensive evaluation (FCE), the social performances of HVAC systems were subjectively evaluated; simulation technology was used to calculate the energy performances; the final results were ranked by the order of preference by similarity to ideal solution (TOPSIS). The research perspective of the collaboration between architects and engineers contributed to the existing literature. Besides, different indoor terminals were analyzed from the two disciplines; an assessment tool (ATI) was conducted and could be referred to; the current green building rating tools were analyzed, and suggestions were proposed to promote the integrated design.

1. Introduction

The green building design requires a multidisciplinary team [1]. For example, to achieve the green certification, Leadership in Energy and Environmental Design (LEED), it is a prerequisite to use cross-discipline design and decision making from the beginning of the program [2]. The team should comprise architects and engineers, and they work in an integrated way to achieve the goal of sustainability. The heating, ventilation, and air-conditioning (HVAC) system is an important part of a green building, which is responsible for creating indoor comfort, as well as a large part of building energy consumption. With the improvement in living standards, people have higher expectations for the indoor environment, and with the increase in household income, they can pay for it [3]. To be specific, besides heating and cooling, people gradually have more requirements for indoor environments such as air freshness, indoor silence, etc., which has led to people preferring improved HVAC systems [4,5], and correspondingly, there are different alternatives, from air systems to radiation systems, from centralized systems to decentralized systems. The indoor terminals become diversified, and their required systems have different impacts on architectural design, either on the layout or the section.
However, the design of indoor heating and cooling system is not completely integrated, yet still conventional, which is linear and fragmental. The architectural design and HVAC design are often separated, as shown in Figure 1. After several iterations, a possible acceptable solution can be achieved eventually, after fine tune during the calculation, the system could also work at its optimal state, but the whole process is incomprehensive and the best solution might be missed.
The HVAC system is an important part of green building design. There are studies about HVAC systems from the single perspective of system efficiency, focusing on the optimization design, either on the energy source [6], on the generators [7], or the system types [8], and there are studies from multi-perspective as well, in which the outdoor and indoor parts of the HVAC system are discussed together as one system. For example, combined with the building envelope, the cost-optimal system was analyzed by the multi-objective optimization method [9], and the study was carried out in new constructions and retrofit projects [10,11]. Besides, building information modeling (BIM) provides a platform for collaborative work [12]. Zhao et al. performed a BIM-based optimization of the building envelope and the HVAC systems for a laboratory building [13]. Guo et al. developed a green building evaluation system that included indicators for the HVAC, the envelope, lighting, ventilation, etc. [14].
In general, the research on the HVAC system is either carried out in terms of its environmental impact itself or as part of a larger system, and the evaluation and selection of the specific indoor terminal are little discussed, particularly from the perspective of collaborative work between architects and engineers.
To fill the research gap, we conducted a case study on a residential building in Shanghai, China, to present an integrated design process for indoor heating and cooling design, completed by architects and HVAC engineers, and a comprehensive assessment of identifying the optimal HVAC system was introduced. The comparison between the conventional design and the integrated design is shown in Figure 1.
By introducing an integrated design process co-operated by architects and HVAC engineers, the current work would be a supplement to the existing studies. Firstly, it conducted a new design framework for designs of the indoor HVAC system in residential buildings, secondly, a comprehensive comparison between various indoor terminals was made, and their impacts on architectural and engineering designs were summarized, and thirdly, it provided an effective reference for the update of GBRTs in the future.
The remainder of this paper is organized as follows. Section 2 and Section 3 review the HVAC technology, criteria in GBRTs, and the proposed research methodology. Section 4 summarizes the research results in terms of the case study. The collaboration of architects and engineers and their preferences are discussed in Section 5. Finally, Section 6 presents the conclusions and limitations.

2. Literature Review

2.1. Alternative HVAC Measures for Residential Buildings

The temperate climate zone in China, namely the hot summer and cold winter (HSCW) zone in Chinese building regulations, is nearly consistent with the Cfa zone of the Köppen map [15]. This climate zone warrants both heating and cooling along with humidity control [16].
Split air-conditioning (SAC) is a highly popular air-conditioning system in China [8,17]. Although the average number of SAC systems reached 115.6 per 100 households [18] by the end of 2019, the situation is gradually changing with several alternative HVAC systems available in the market, and central-type systems are becoming increasingly popular [19], with diversified types of indoor terminals, such as the fan coil unit in variable refrigerant volume (VRV) system [20], ceiling radiant (CER) systems [21], floor heating (FH) systems [22].
In addition, central-type systems, such as VRV systems, CER systems, and FH systems, are all available in the market. Nevertheless, fresh air is extremely essential in HSCW zones, and natural ventilation (NV) is the primary source of fresh air in residential buildings. People residing in HSCW zones are familiar with NV and open windows to obtain fresh air even during heating periods in cold winters, which increases the heating energy [23]. However, mechanical ventilation (MV) systems, which are more common in public buildings [24], have gradually been extended to households, especially after the breakout of the COVID-19 pandemic, MV systems become mandated to maintain the indoor air quality in several areas in China [25]. Hence, the combination of indoor terminals becomes more varied, which brings about the decision making (DM) problem.
Table 1and Table 2 present the potential HVAC measures for residential buildings.
(1) H1/C1: VRV systems can be regarded as larger versions of SAC systems with one outdoor condensing unit linked to several indoor terminals [26]. The recent market shares of VRV systems are soaring in China owing to their ease of control and maintenance [27]. Although this system can satisfy both heating and cooling demands, it cannot supply fresh air.
(2) H2/C2: CER systems use low-temperature heating and high-temperature cooling to potentially save energy [28]. In comparison with SAC and VRV systems, CER systems provide more comfortable room temperature, which aids in gaining more points in terms of WELL standards [29]. Two types of CER terminals, namely the pipes buried in the concrete floor and capillary mat, exist in buildings. In this study, we adopted the capillary mat [30], which is more adaptable in retrofitting projects.
(3) H3: Similar to CER systems, FH is a type of radiant system, wherein the heating source is placed underfloor and not embedded in the ceiling. In addition to exhibiting advantages similar to those of CER systems, FH systems are energy-efficient, space-saving, and quiet [31].
(4) V1: MV is considered more reliable, controllable, and comfortable than NV [32]. In recent years, MV is being increasingly accepted in residential buildings to block air pollution and ensure high comfort. Based on the position of the fresh air outlet, two variants, namely the upper air supply and displacement ventilation, exist in MV systems. In the case of upper air supply, the fresh air outlet can be combined with other systems. For instance, the VRV system with the combined outlet does not require additional space in terms of height while making a unified decoration expression.
(5) V2: In comparison with V1, displacement ventilation distributes air supply more efficiently [33]. However, displacement ventilation requires a higher number of pipes to lead air from the main duct in the ceiling to the plenum chamber underfloor in each room. Furthermore, this system requires additional space in terms of height to place the pipes and plenum chambers usually, which results in an obvious drawback.

2.2. Assessment-Based Integrated Design

Proper assessment is an important part of integrated design [1], and it is usually applied to aid the decision making (DM) during integrated design [34]. As the most popular assessment system for green building, GBRTs encourage integrated design and there are more or less relevant credits in various rating systems. However, the specific credits on HVAC systems are not always balanced and multi-sided, but usually one-sided, and the requirements of integrated design are not reflected.

2.2.1. Assessment of the HVAC System in GBRTs

Energy efficiency is a major factor in green building rating tools (GBRTs) [35], as well as that of HVAC systems. For instance, in terms of the Chinese evaluation tool Assessment Standard for Green Building (ASGB), when less energy is required in comparison with that required by the national codes, more points are rewarded [36], which is quite similar to other systems.
An investigation among the GBRTs was made to find the HVAC-related indicators. The four systems are ASGB, LEED [2], British Building Research Establishment Environmental Assessment Method (BREEAM) [37], and German Deutsche Gesellschaft für Nachhaltiges Bauen (DGNB) [38]. A summary of related criteria and maximum contributions is shown in Table 3.
As is shown in Table 3, ASGB has no criterion for economic factors, and it pays more attention to environmental factors than social factors, in which both the indicators and points available of the environmental factors are greater than the other two factors. LEED and BREEAM have credits on the economic quality of the HVAC system, but not much, and they are all covered in the life cycle analysis. In LEED, the criterion is a prerequisite, and in BREEAM, it has a small contribution. DGNB is more balanced, and the available points of the three factors are quite close.
The factor of environment was usually highlighted in GBRTs, while the other two were less weighted [39]. In general, the HVAC assessment reflects a similar situation, which is that the environmental factor plays the leading role. Although there are more criteria for social factors, more available points are distributed to environmental factors. The HVAC-related social criteria include thermal comfort, indoor air quality, noise, and user control; the LCC analysis represents the economic factor; the environmental performance is mainly about the energy consumption.

2.2.2. Evaluation with the Three Factors of Sustainability

GBRTs tend to support credits encouraging environmental sustainability, rather than the social quality, such as indoor comfort, and it has been found that there were no differences in thermal comfort and air-quality satisfaction in certificated and non-certificated buildings [40,41].
The overall objective of HVAC design is to provide a high level of building performance, which can be defined by the three factors: indoor comfort (social), cost efficiency (economic), and energy efficiency (environmental) [42]. Society, economy, and environment are the three important parts of sustainability, and they are the basic three dimensions [43], or the three pillars [44], and they should also be the vital factors for green building rating [45], as well as for the HVAC system design.
Therefore, a multi-criteria assessment of the three factors is required. In the integrated design process, all these factors must be considered to acquire the most sustainable system because a comprehensive evaluation is not possible through a single criterion alone.

2.2.3. Multi-Criteria Assessment

Typically, multi-criteria decision making (MCDM) methods are used to solve complicated problems through mathematical modeling and methodological approaches [46]. These techniques are particularly helpful when conflicting criteria are involved [47]. MCDM has been used in different studies and is gaining popularity in the field of sustainable energy owing to the multi-dimensionality of the sustainability assessment [48].
MCDM breaks complex problems into smaller problems [49] using several methods, such as analytic hierarchy process (AHP), technique for order of preference by similarity to ideal solution (TOPSIS) [50], and so on. MCDM can be adopted to aid the DM process in different green technologies. Ref. [51] developed an evaluation framework to select the most suitable HVAC system. They selected a factory retrofitting project as a case study, and 11 different HVAC systems, including air, water, and air–water systems, were compared based on 27 criteria, and the MCDM method was used to perform a comprehensive evaluation. Ref. [52] proposed a hybrid approach based on MCDM methods to evaluate the solar sites and the MCDM adopted best-worst method to determine the weight of criteria. Ref. [53] used the MCDM to determine the best retrofit measures, wherein two levels of assessments were adopted with one level combining energy, economic, and environmental factors, and the other referring to the social factor considering stakeholders’ preferences. Ref. [54] employed an MCDM method in a case study of a university building and selected green technologies for building retrofitting.

3. Research Methodology

3.1. DM of HVAC Systems

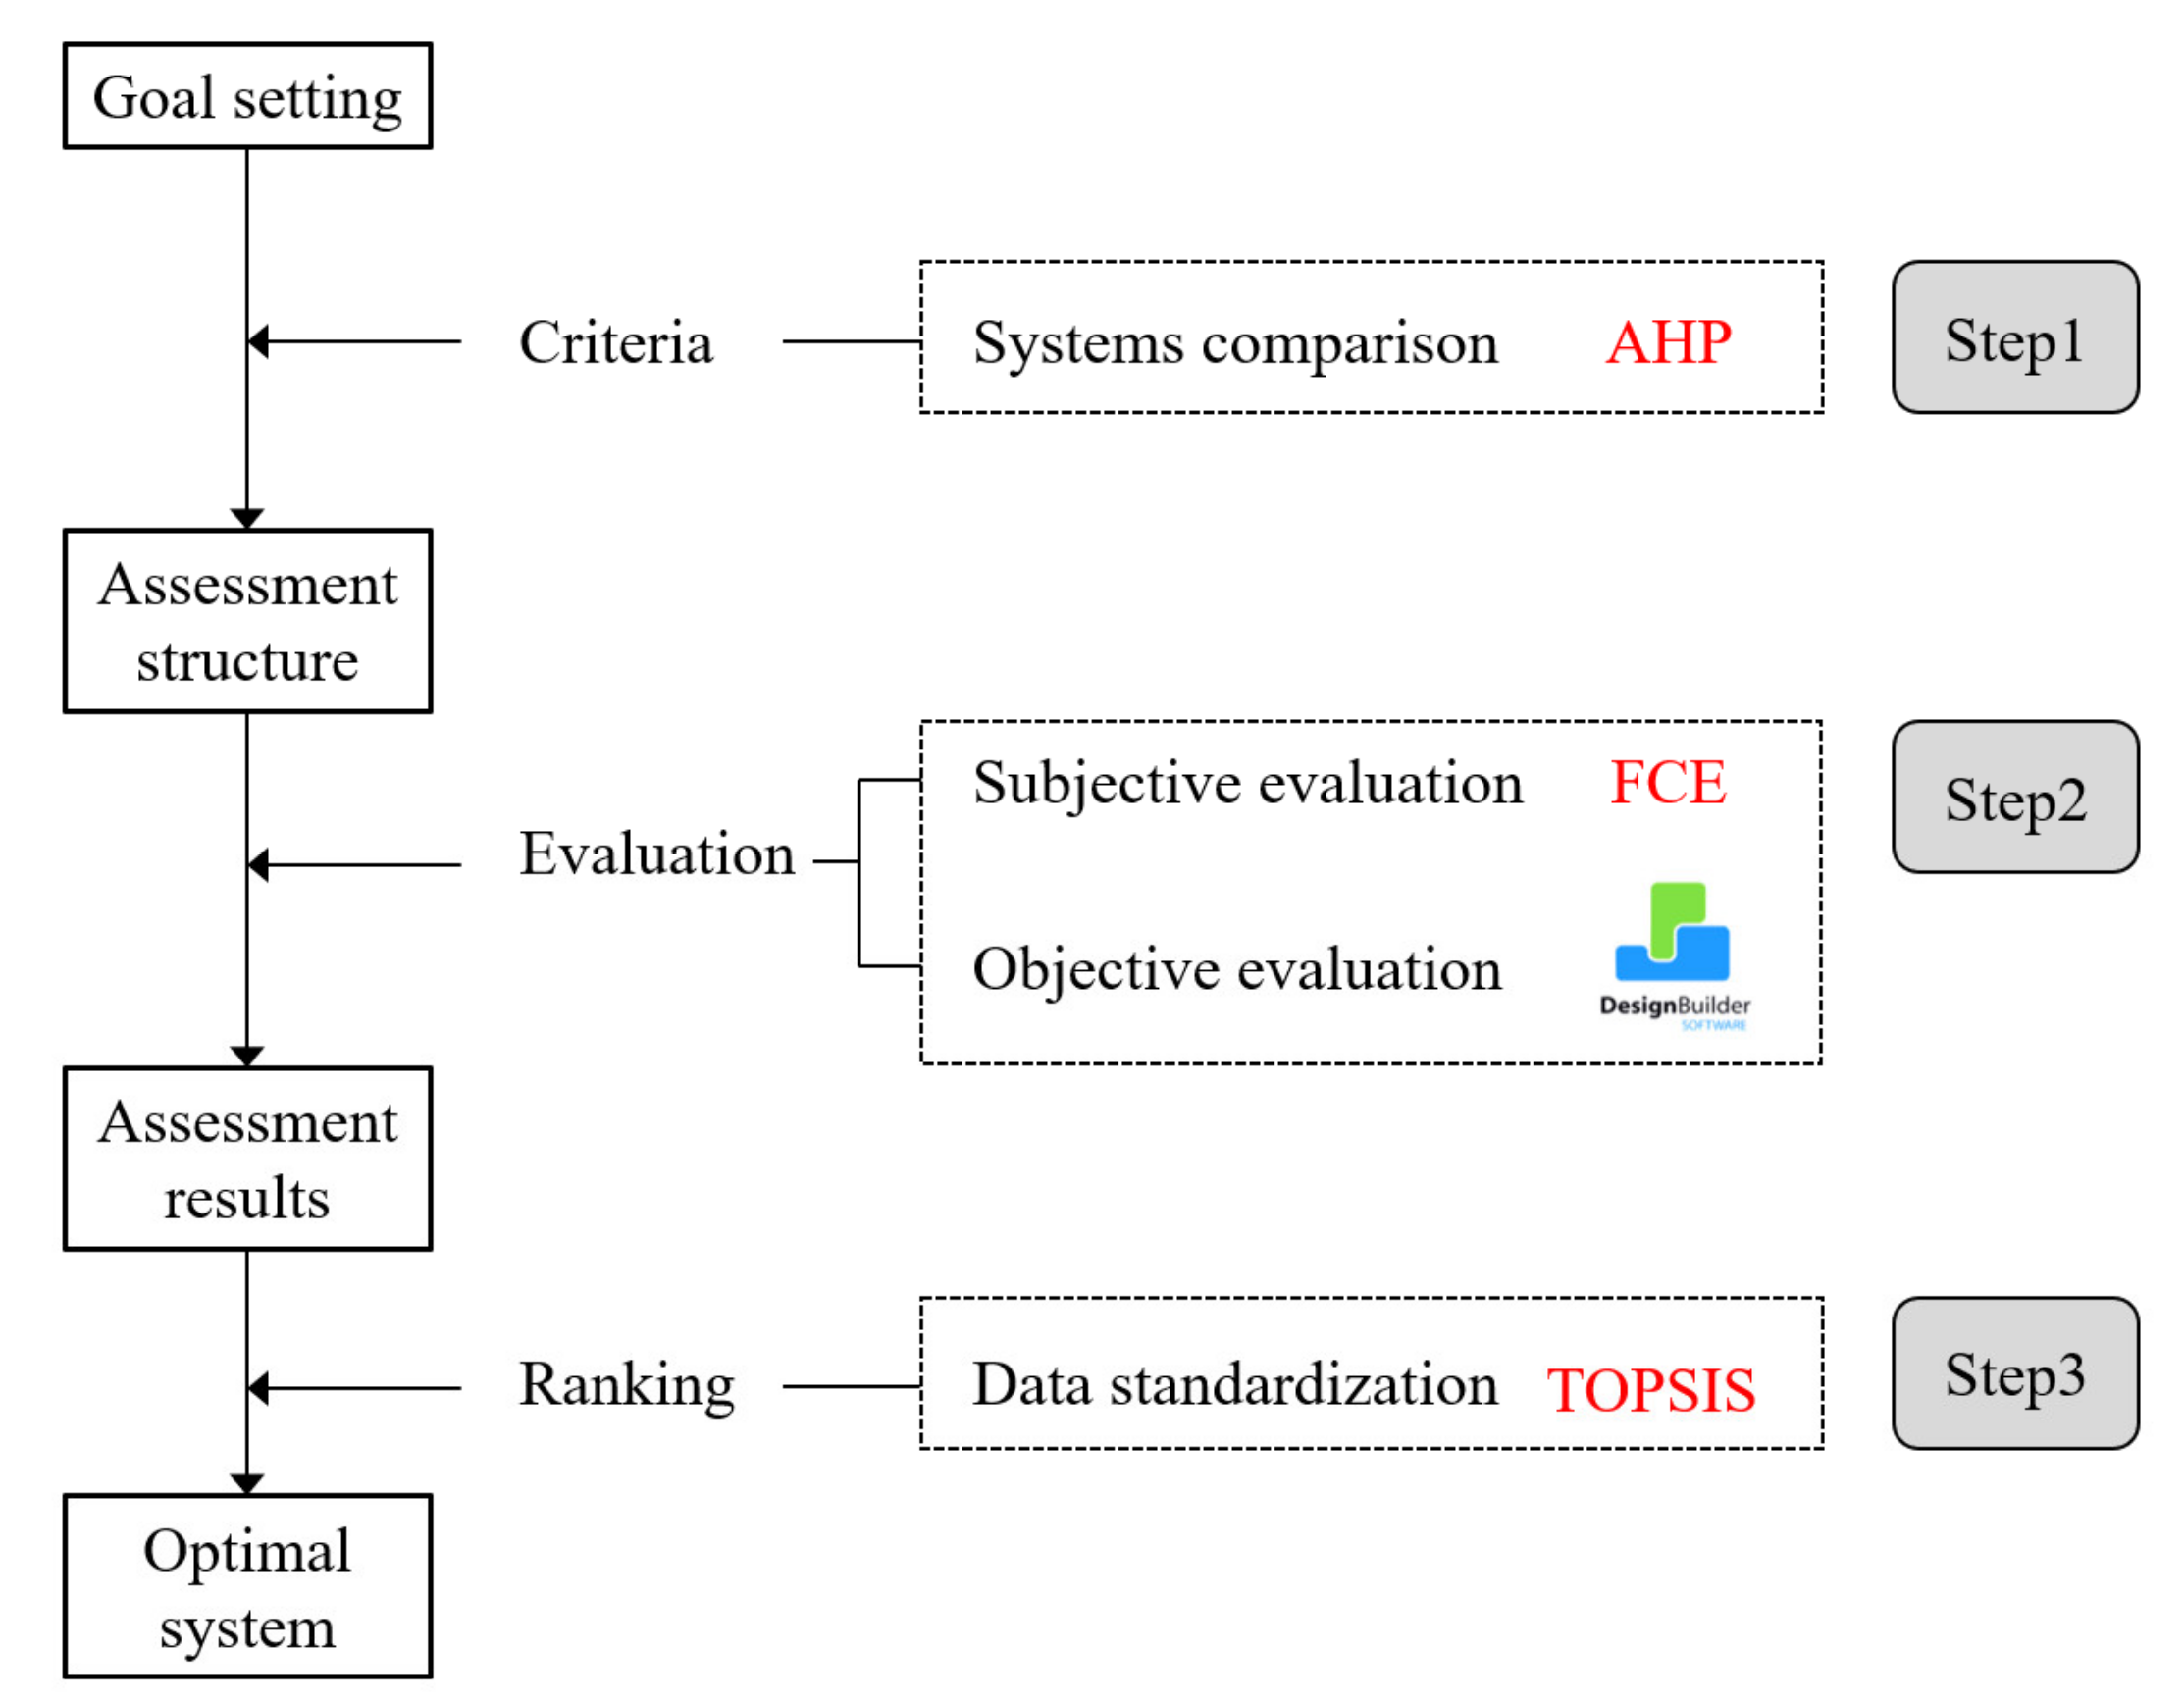
DM process is usually composed of two parts: weighting determination and ranking. As a result of the subjective assessment of indoor comfort, there are three steps in the study, as shown in Figure 2. Firstly, Analytic Hierarchy Process (AHP) was applied to set an assessment framework and calculate the weightings of criteria, and then, fuzzy comprehensive evaluation (FCE) was employed to evaluate different systems. The combination of AHP and FCE provides an effective method for DM, which can overcome the shortfall of AHP in subjective selection and prevent the drawback of FCE from ignoring the weightings [55]. Thirdly, the overall ranking was conducted by TOPSIS.

3.1.1. AHP

AHP was proposed by [56] and is widely used in MCDM. Using AHP to calculate the weighting, ref. [57] developed a GBRT for Jordan based on the three pillars of sustainability. Ref. [58] developed a rating system for green buildings in India, wherein they employed AHP to develop a hierarchical structure and calculate the weighting coefficients. Ref. [59] attempted to improve the adaptability of Chinese national standards in different climate zones by considering different weights, and they used AHP to develop the weight correction system. Ref. [60] evaluated the sustainability of the photovoltaic poverty alleviation project by using the MCDM method that integrated the AHP-TOPSIS method and identified 16 criteria based on the four elements: benefits, opportunities, costs, and risks.
In this study, the decision problem was divided into three categories, social, environmental, and economic criteria. By pairwise comparisons between the three criteria and their sub-criteria, the judgement matrix is conducted, which is presented by Equation (1).
A = a i j n × n = a 11 a 1 n a n 1 a n n
where A is the judgement matrix, a i j is the relative importance of criteria i to j, and a i j = 1/ a j i , when a i is more important than a j , and if a i j is set to 5, a j i is then set to 1/5.
The geometric mean method is applied to calculate the weightings of the criteria, which is presented by Equation (2).
w i = j = 1 n a i j 1 n i = 1 n j = 1 n a i j 1 n
AHP tolerates some inconsistency in experts’ judgement, and the consistency is verified by the consistency ratio (CR), and can be calculated by Equation (3). If CR < 0.1, the consistency is accepted, otherwise, the matrix must be reassessed.
CR = C I R I
C I = λ m a x n n 1
where RI is the mean random consistency index of a large sample of randomly generated reciprocal matrices, which can be referred to in Table 4. λ m a x is the largest eigenvalue of the judgment matrix, and it can be calculated by Equation (5).
λ m a x = 1 n j = 1 n j = 1 n a i j w j w i

3.1.2. FCE

A few of the criteria involved in HVAC systems, such as the energy performance and initial investment, can be calculated with exact values as outcomes; whereas, other criteria that are featured with vagueness and uncertainty cannot be evaluated directly using exact numerical values.
To address this problem, we used the fuzzy set theory introduced by [61]. For instance, the descriptions for temperature uniformity are qualitative, and people can use “excellent,” “good,” “fair,” “poor,” and “very poor” to express their opinions, and the fuzzy subset E can be expressed as:
E = e x c e l l e n t ,   g o o d ,   f a i r ,   p o o r ,   v e r y   p o o r
The fuzzy matrix R i of the evaluated system can be expressed by Equation (7).
R i = r i 1 , , r i m = r 11 r 1 m r j 1 r j m
r i j = p i / p
where, r i j is the fuzzy evaluation set, p i is the number of experts who gave this qualitative evaluation, p is the total number of experts, i is the evaluated system, j is the number of criteria.
And thus, combined with the weightings calculated in Section 3.1.1 by AHP, the final decision set of the system can be calculated by Equation (9).
B i = w i     R i = w 1 ,   ,   w j     r 11 r 1 m r j 1 r j m
where, B i is the final decision set of the system, and w i is the weighting set.
Finally, a scale of 1–0.2 is used to quantify the fuzzy evaluation, and the weighted mean method is used to calculate the final score of the system. The fuzzy subset E can be expressed as Equation (10).
E = e x c e l l e n t ,   g o o d ,   f a i r ,   p o o r ,   v e r y   p o o r = 1.0 ,   0.8 ,   0.6 ,   0.4 ,   0.2

3.1.3. Data Standardization

The indicators with objective values, such as energy consumption and initial investment, have different features, and the data need to be dimensionlessly processed to eliminate the differences between them while keeping the internal information as much as possible [62]. The linear dimensionless methods are usually adopted to deal with the problem of dimension mismatch between the different indicators [63], which do not change the distribution and variation characteristics of data [64]. The specific method of the maximum magnitude of 1 was used here, and there were two ways:
z i j = y j m i n y i j
z i j = y i j y j m a x
where z i j denotes the new data after standardization, y i j indicates the original data, y j m i n and y j m a x represent the minimum and maximum value of column j.
There is an important point for TOPSIS used in the next step that Equation (11) is used when lower values are preferred, and Equation (12) can be employed if higher values are better.

3.1.4. TOPSIS

TOPSIS was first introduced by Hwang & Yoon [65]. By distinguishing the remoteness of alternatives to the ideal solutions, the alternatives are ranked according to their closeness to the ideal solutions, and the best alternative is determined.
Firstly, the positive ideal solution and the negative ideal solution are to be defined.
z i j + = m a x j z i j
z i j = m i n j z i j
Secondly, the geometric distances between the alternatives and the positive ideal solution and the negative ideal solution are to be calculated:
d j + = i = 1 m z i j z i + 2 , j = 1 , 2 , , n
d j = i = 1 m z i j z i 2 , j = 1 , 2 , , n
where, d j + is the positive ideal solution, d j is the negative ideal solution.
Thirdly, the closeness coefficient to the perfect solution is calculated:
C j = d j d j + + d j , j = 1 , 2 , , n
The best alternative has the highest closeness coefficient.

3.2. Case Study

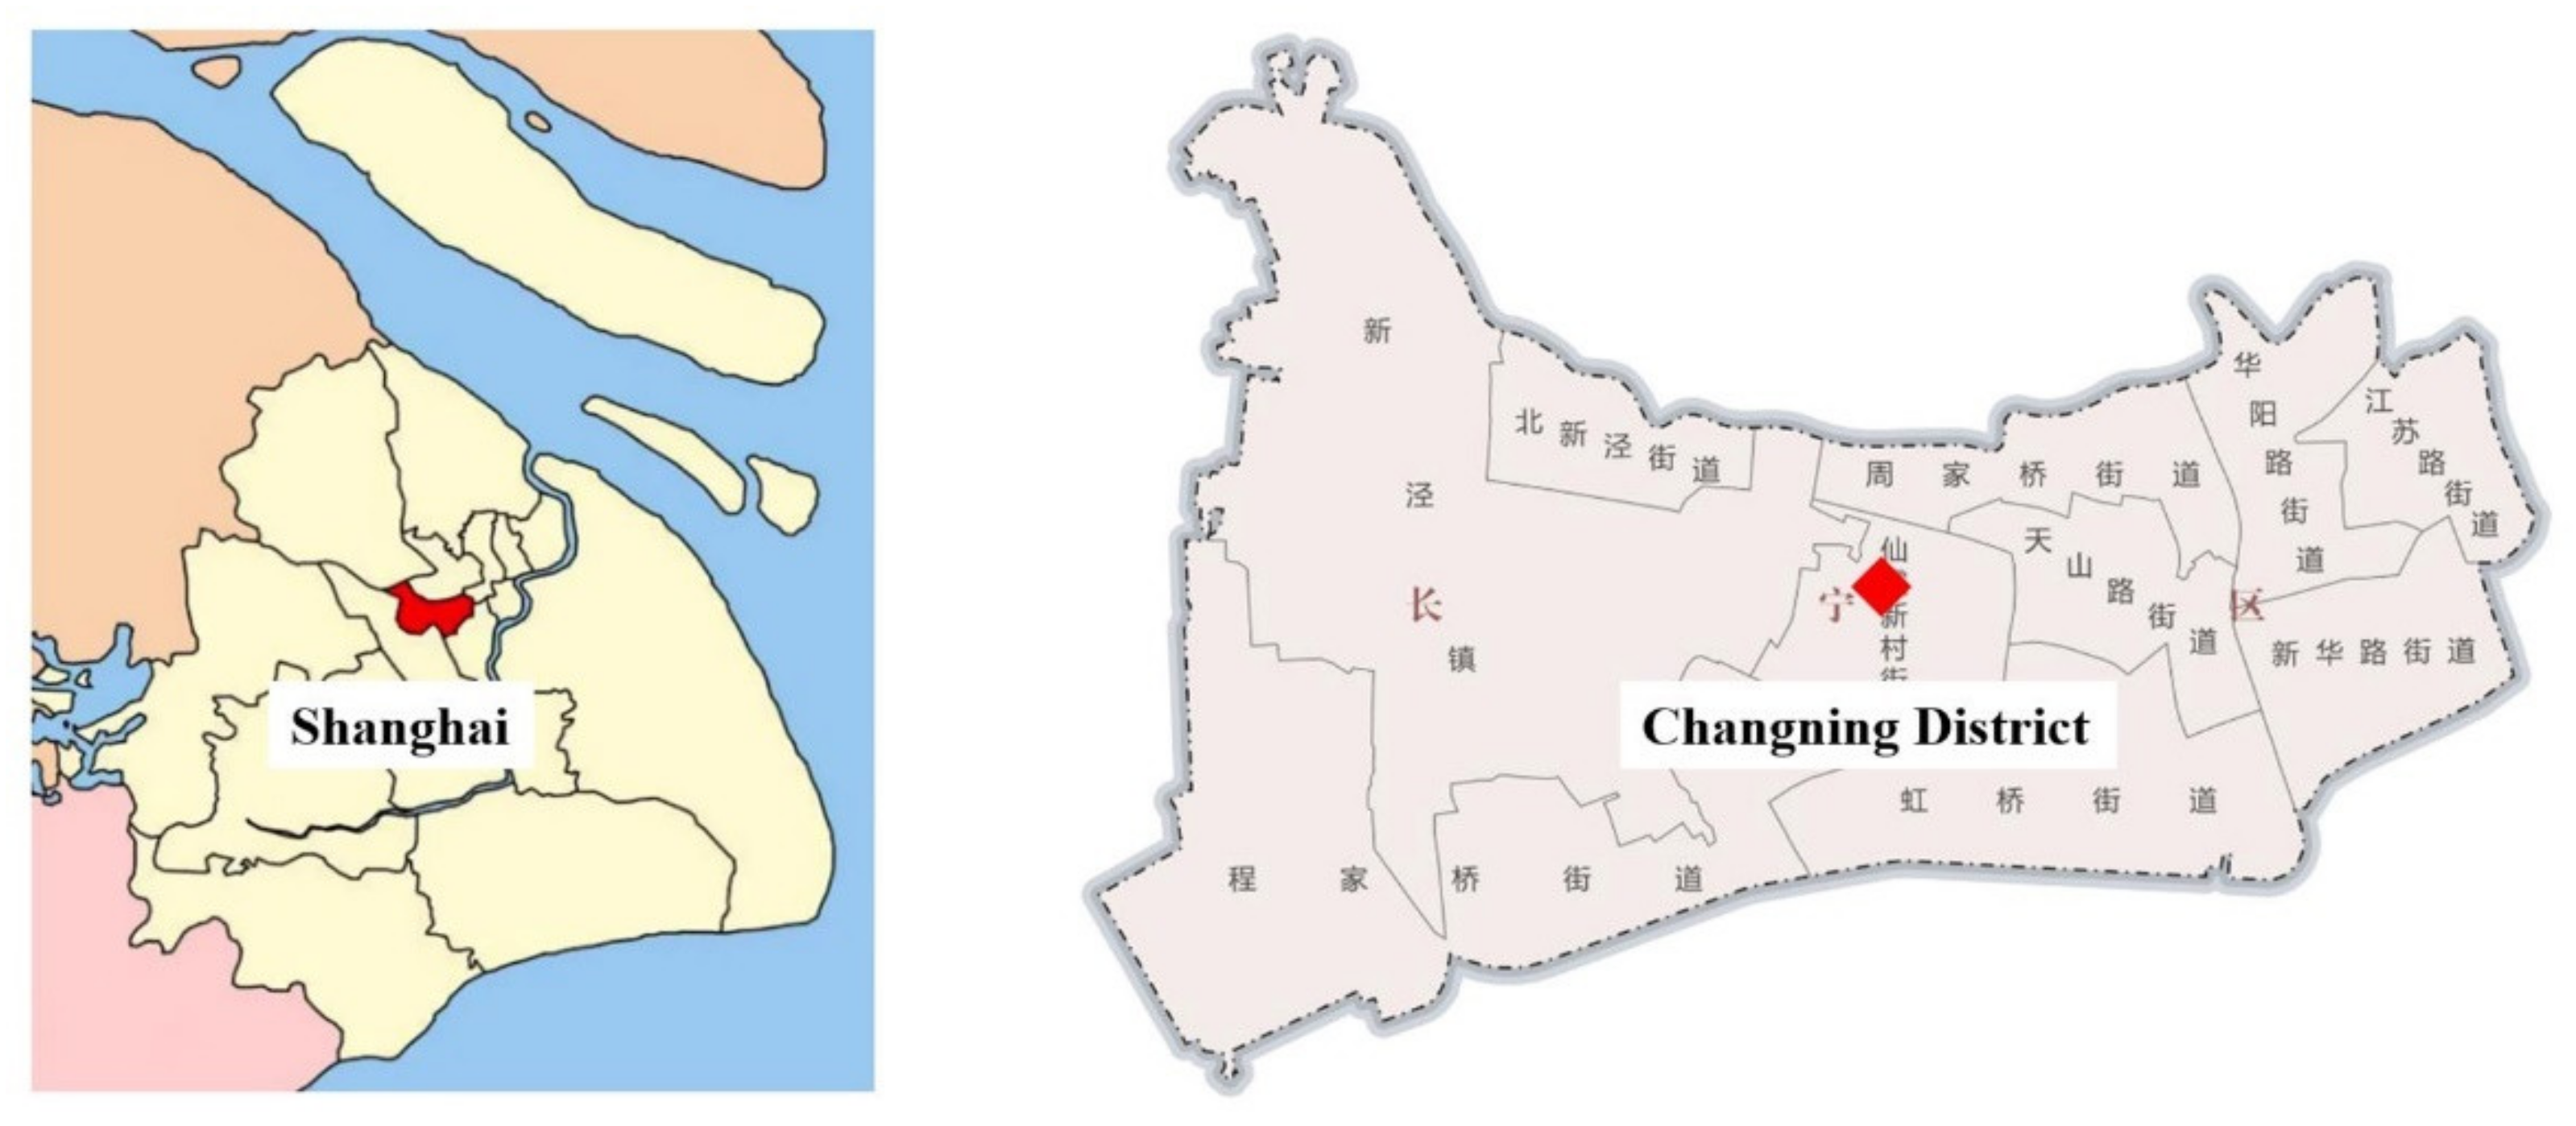
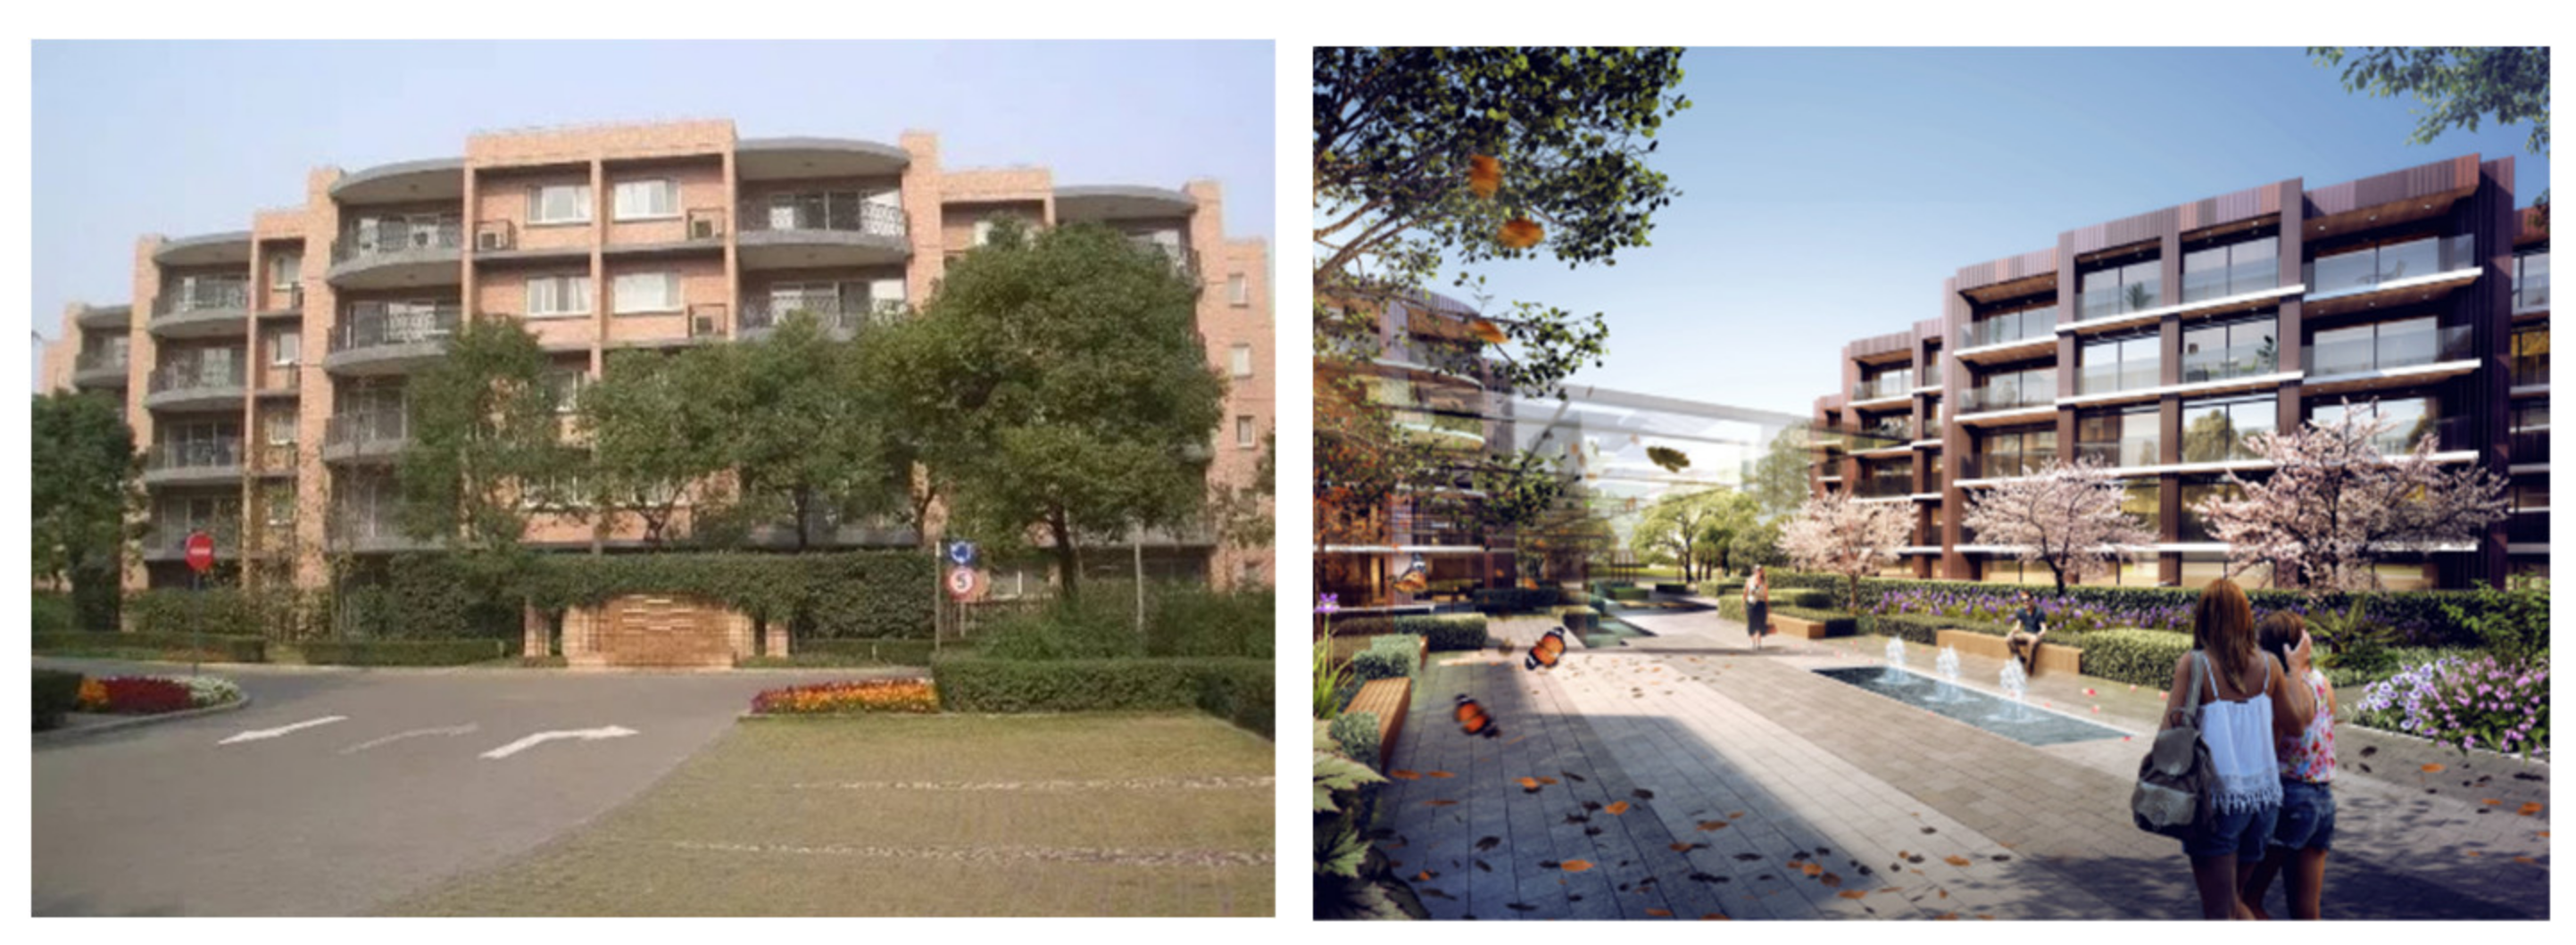
We considered a major renovation project of an existing building as the case study. The building located in Shanghai has been certificated by several labels for green buildings. Additionally, it received the Construction 21 reward in 2018 [66]. The project was located in Changning District, Shanghai, in the city center (Figure 3). The building had 5 floors, and each floor was composed of 5 units (Figure 4). A standard apartment was selected for the detailed comparison of HVAC systems, and an assessment tool was developed during the design.

3.2.1. Current Features and Retrofitting Measures

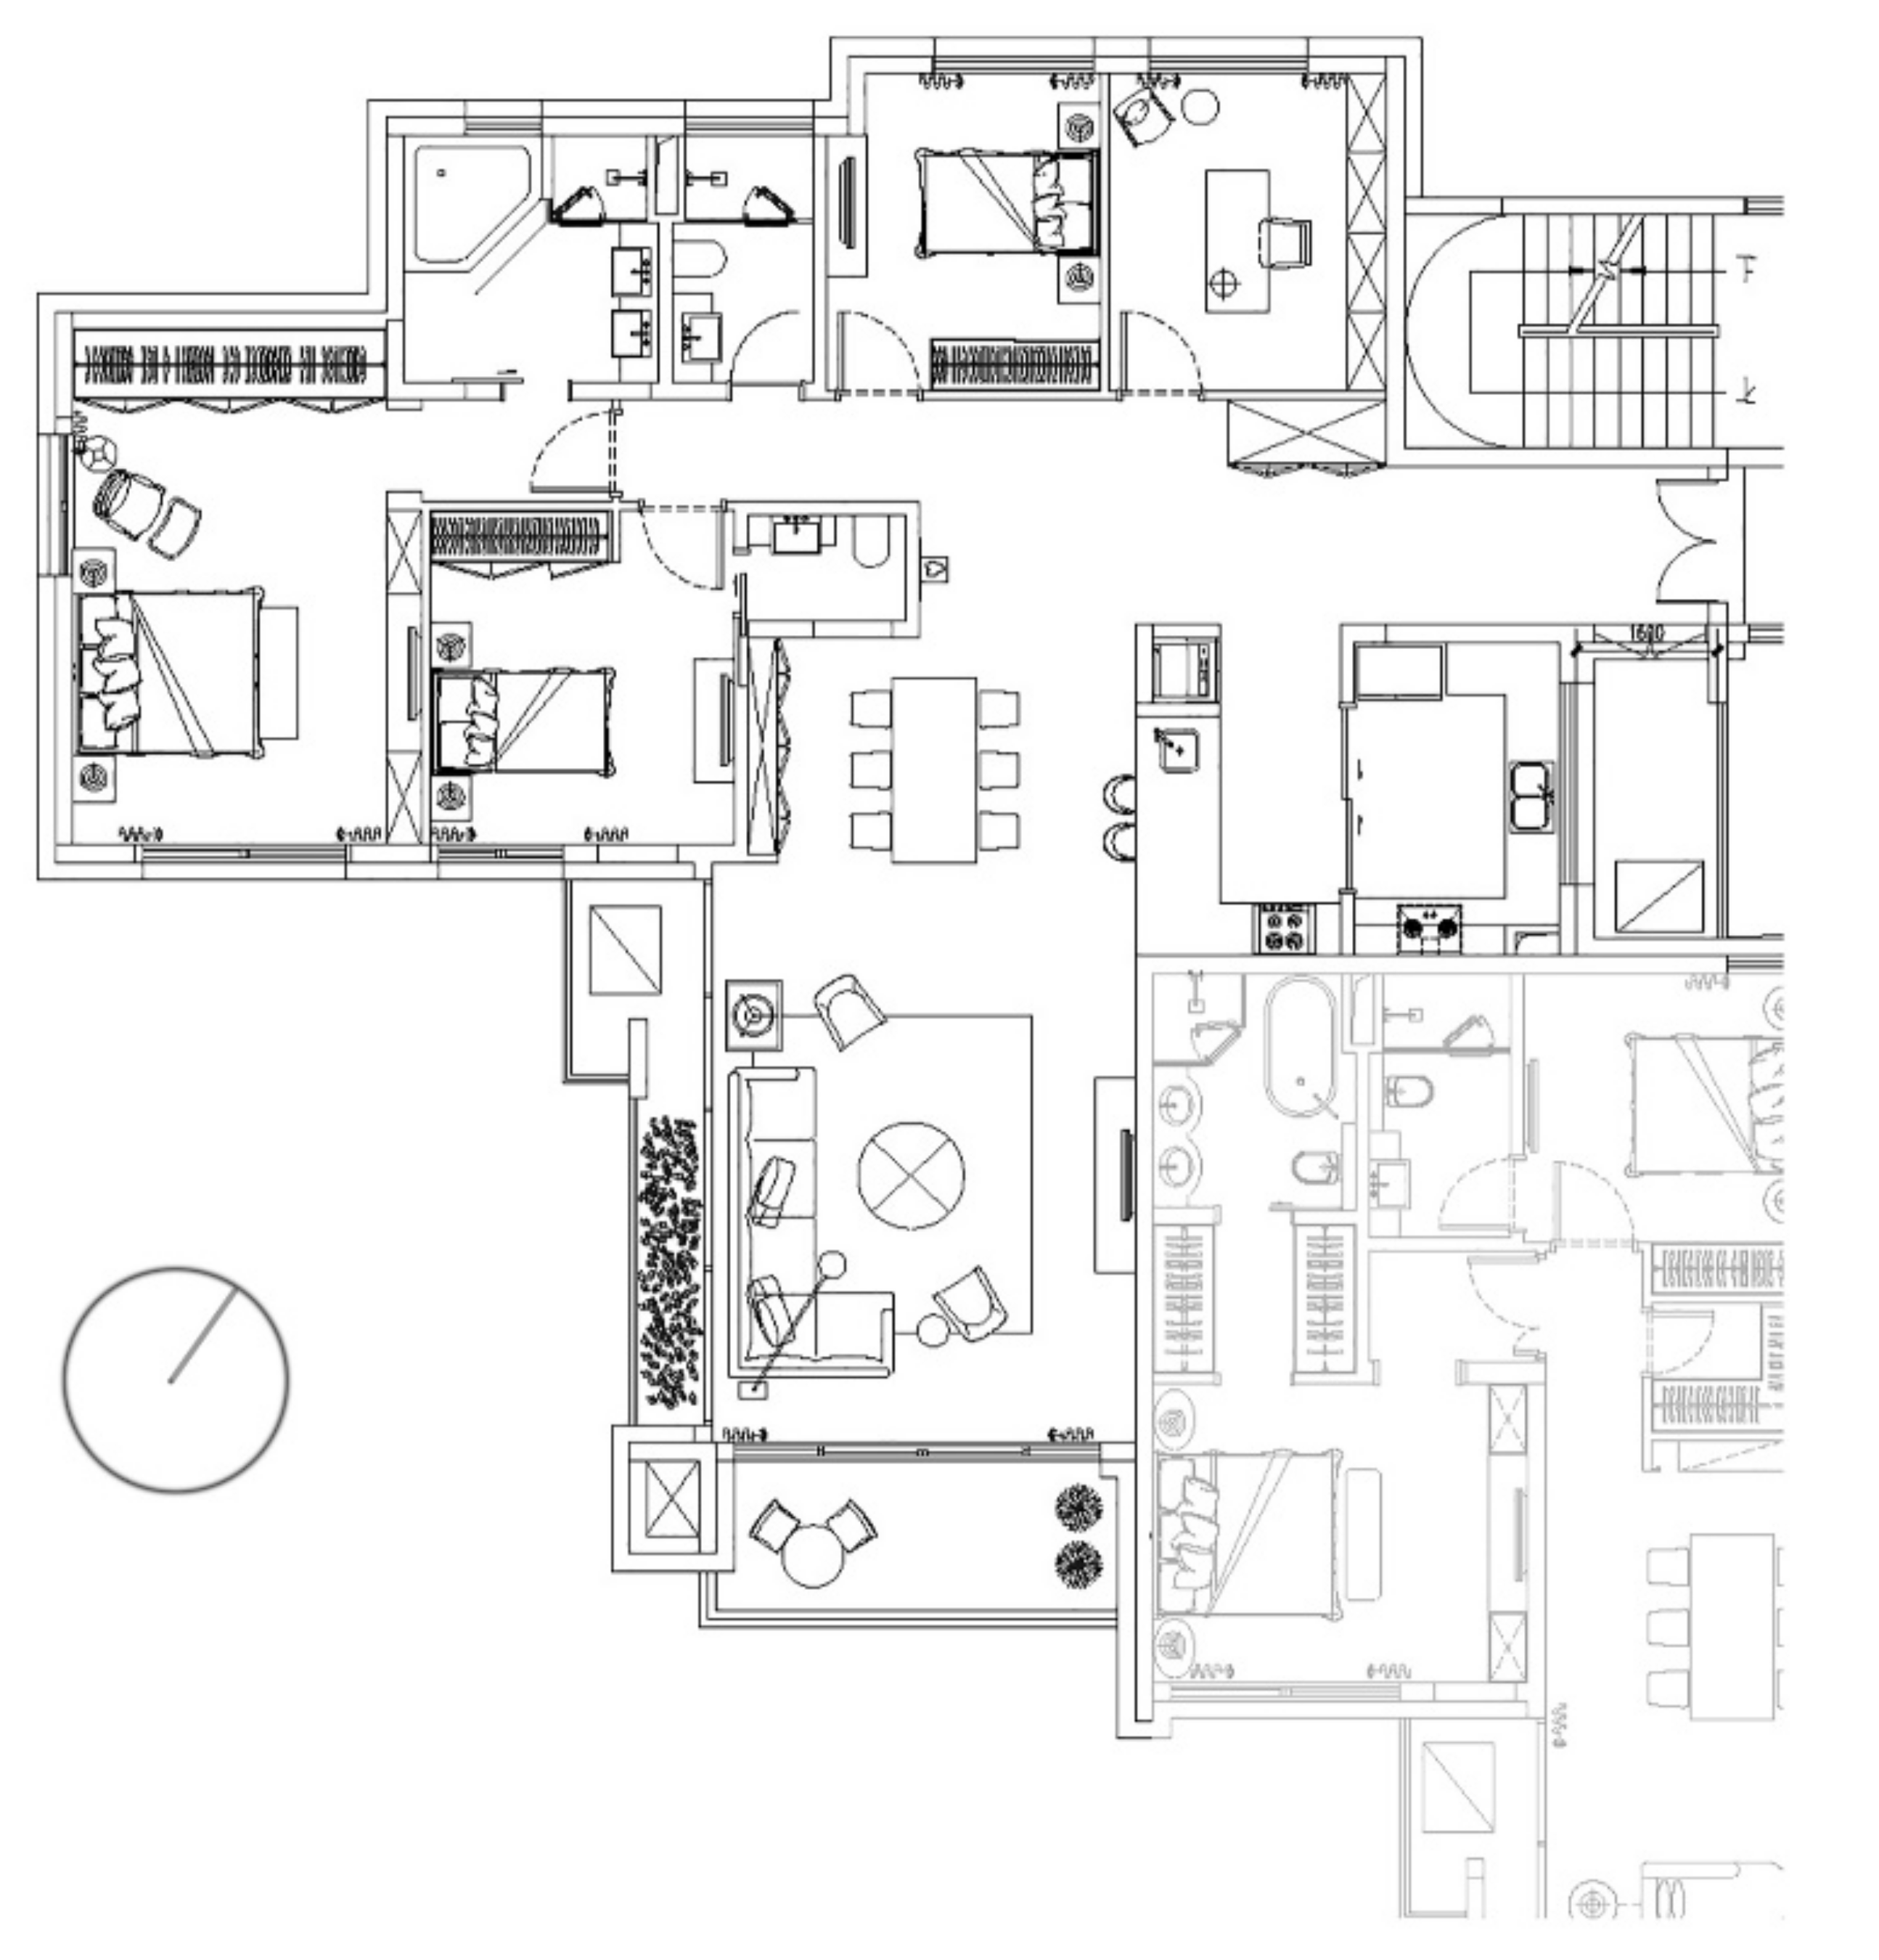
As one important part of retrofitting, HVAC systems were to be improved, and the central-types were supposed to replace the existing SAC systems to create a better indoor environment and a better façade appearance, as is shown in Figure 3. The layout of the standard housing unit is shown in Figure 5, and the indoor area is 191.3 m2, including one living room, four bedrooms, one study room, two bathrooms, and one kitchen. Besides, the floor height was 2.8 m, and the height from floor to ceiling was about 2.62 m, which might be further compressed after the indoor terminals were to be installed. Therefore, the space height might be a sensitive factor influencing the system design.

3.2.2. Architectural Design in Collaboration with HVAC Engineers

The architects and engineers worked together to determine suitable HVAC systems, and from different professional perspectives, the two groups discussed the features and impacts of the potential systems. The comparison was displayed in Table 5. The currently used SAC system was applied as a reference system (RS) to do the comparisons.
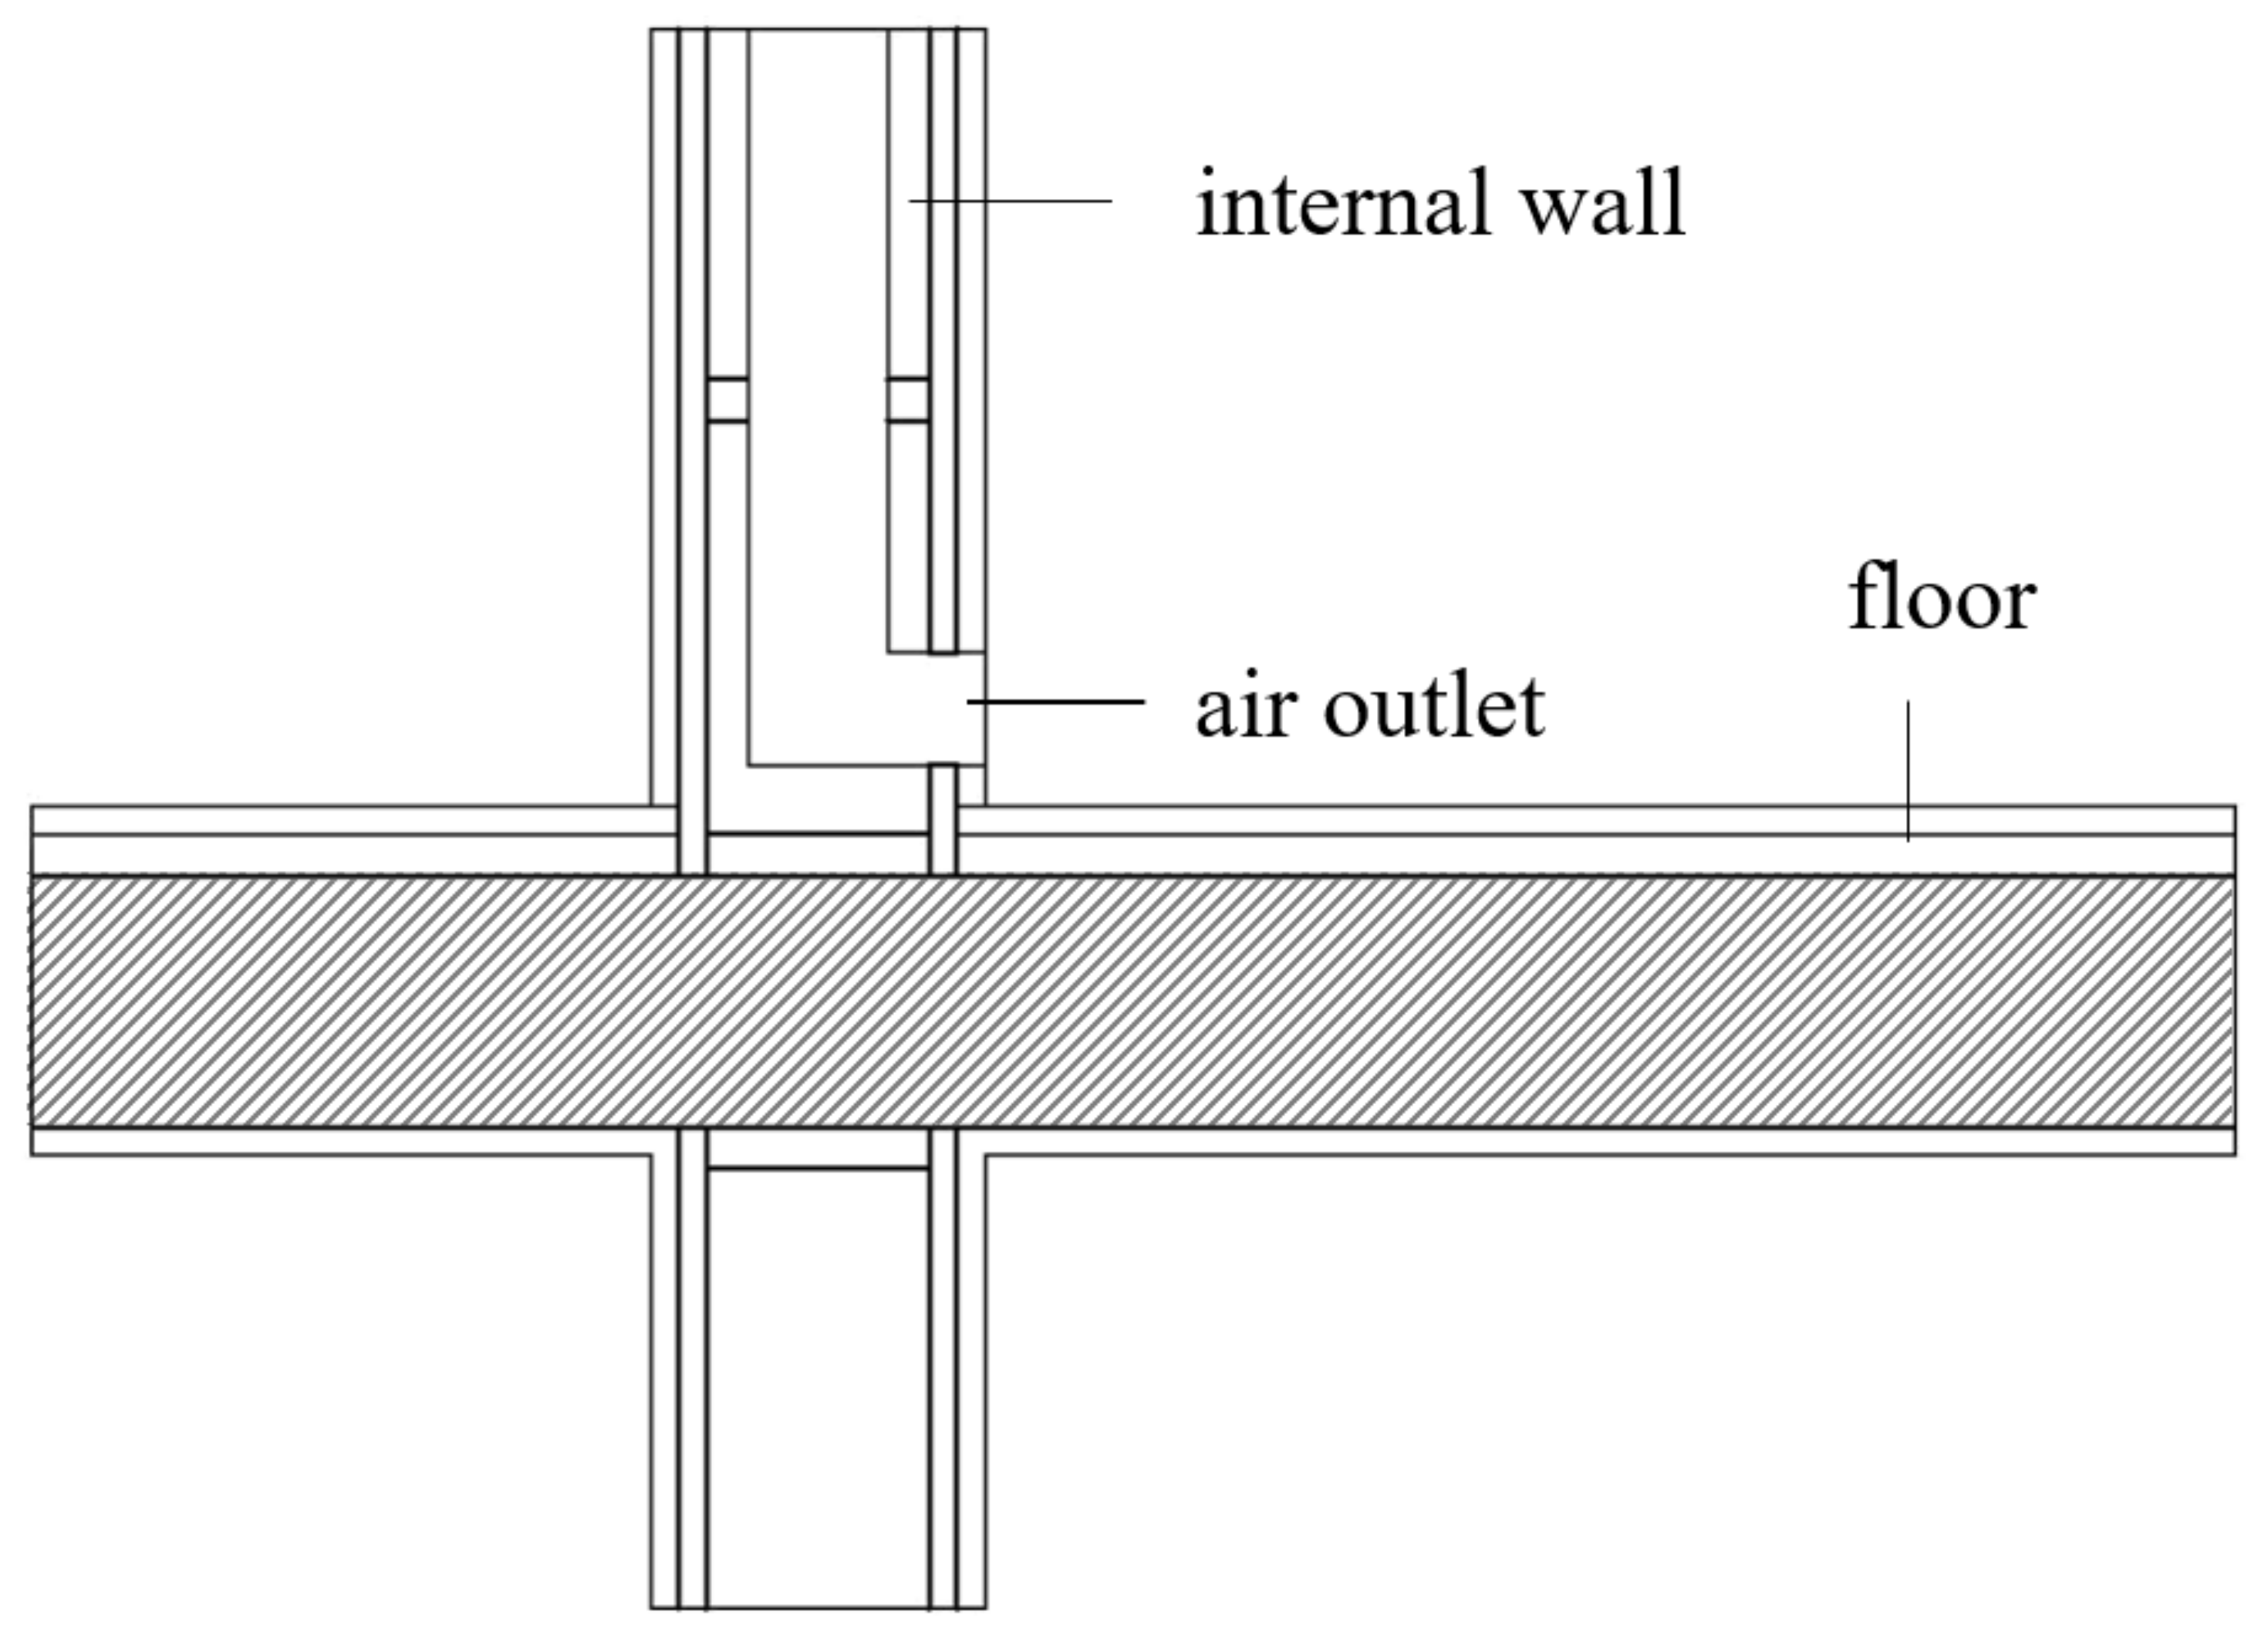
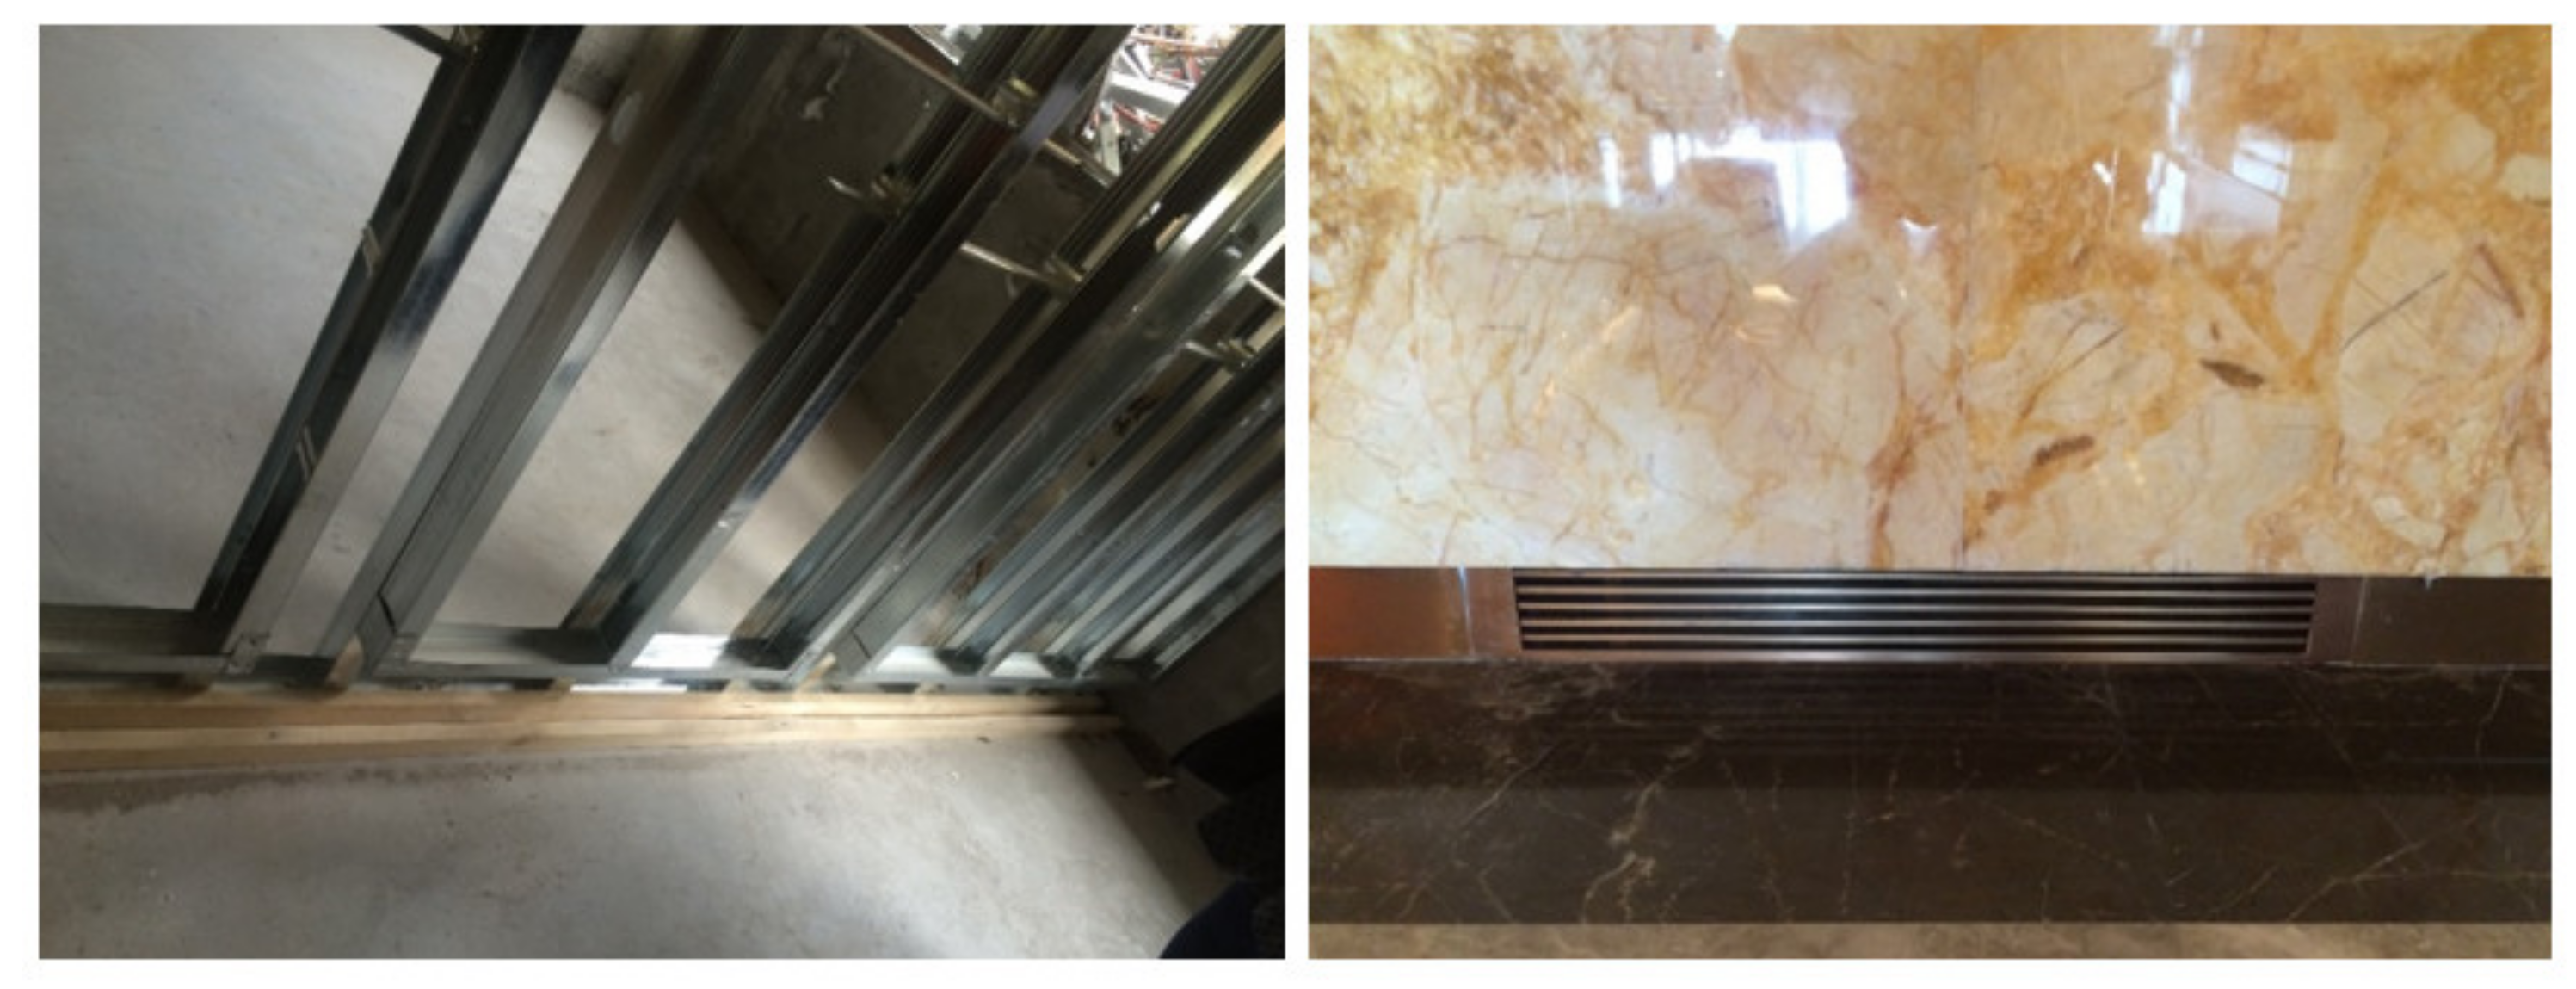
As is shown in Table 5, height occupation due to the displacement ventilation becomes one obvious drawback of S3, which was overcome by the collaboration of architects and engineers. One air system in which pipes go through internal walls was developed to minimize the negative impact [67], and the outlets were integrated at the height of the skirting line, which was shown in Figure 6. Accordingly, the layout of the apartment was adjusted by the architects to ensure the air outlets in the bedroom and living room, shown in Figure 7. Figure 8 shows the construction and the final results of the wall and the outlet.

3.2.3. The Assessment Criteria

Figure 9 illustrates the hierarchical structure of the assessment tool for the indoor terminal (ATI), which was proposed by the collaboration team. The structure has two levels. Most of the criteria in level II are derived from the impacts of HVAC systems presented in Table 5. They are further divided into three categories, namely social, economic, and environmental aspects.
Social aspects. In the investigated GBRTs shown in Table 3, there are three different criteria for social factors: thermal comfort, air quality, and user control. In this study, all the alternative systems are user-controllable, so the social component is predominantly composed of comfort factors and fresh air. The criteria include air temperature, relative humidity, and air freshness. Additionally, the space occupation was considered due to the current situation that the existing floor height was not abundant. Noise of the system was added because some experts mentioned that noise generated by indoor terminals had become one important comfort criterion after the external noise was well blocked by the good insulation [68].
Economic aspects. Considering the assessment tool is only about the HVAC system, the saving cost and the saving energy are sorts of the same thing, which can be evaluated in the environmental component. Therefore, only the criterion of the initial investment cost was used to indicate the economic component.
Environmental aspects. The energy performance of the systems represented the environmental component and the annual energy consumption was used to indicate the energy performance.
The questionnaire team was comprised of seventeen architects and five engineers and the survey was conducted in person in a workshop to provide consistent judgments. The team was asked to do the pairwise comparison, during which, a 5-point Likert scale method was to quantify the judgment matrix with 1, 2, 3, 4, and 5 representing “equal importance”, “importance”, “greater importance”, “demonstrably greater importance”, and “absolutely greater importance”, respectively. The comparison matrices based on the survey all passed the consistency checking, and then the criteria weightings were calculated.
The second round of the survey was made after the pairwise comparison. The participants answered another set of questionnaires for the FCE of the six HVAC systems based on the criteria of the social component. The five-grade scale mentioned in Section 3.1.2 was used for this survey. For example, in the assessment of air freshness, 0.2 and 1 represented “very poor” and “excellent,” respectively, and in the assessment of space height, 0.2 and 1 represented “highly depressed” and “quite broad,” respectively.

3.2.4. Energy Performance Simulation

The envelope was designed with very high performance, meeting the requirements of the standard of passive ultra-low energy green building [69]. The opaque and transparent segments of the design used 100-mm-thick insulation and triple glazing, respectively. Table 6 summarizes the simulation parameters used in this study. The envelope performance satisfied the technical guidelines implemented as a trial for passive ultra-low energy green buildings [69]. The building was simulated and annual operation energy (AOE) was calculated by DesignBuilder, and the model was created using interface version 6.0. The modeled apartment was simulated with the six HVAC systems listed in Table 5. The air systems S1, S2, and RS were operated intermittently, and the radiant systems S3, S4, and S5 were continuously operated during both cooling and heating seasons.

4. Results

4.1. Investment and the Operation Energy

Table 7 presents the initial investments of different systems and the corresponding annual energy required for their operation. The initial investment of the radiation system was substantially high, which implies that the cost of systems S5 and S3 were the highest and second-highest, respectively. In terms of energy performance, the five systems were very close, and the S3consumed the highest amount of energy, followed by S5, S1, S2, and S4.

4.2. The Weighting Determination

Table 8 presents the results of weighting calculations. In level I, the social component had the highest weighting factor, followed by economic and environmental components. Both social and economic components were determined to be more important than the environmental component, which implies that in addition to energy efficiency, these criteria require attention. In level II, noise and relative humidity were considered the most and least important factors, respectively, in the social component.
Architects and engineers exhibited varying interests and preferences because of their different professional backgrounds, and the two groups were compared to identify the differences. The three components in level I appeared in the same sequence for both groups, with social at the first, followed by economic and environmental components. Secondly, the two groups had different preferences in the sub-criteria of comfort. The architects focused on the criteria of basic perceptual level, such as the feelings on temperature, humidity, and space height. Conversely, engineers were more concerned about the indoor air quality and equipment performance that affect the health of end-users significantly.

4.3. The Fuzzy Matrices and M1 Scores

The fuzzy matrices of the five criteria for the social component for the five systems are shown in Table A1 in Appendix A. Taking S1 as an example, because there was no MV, r1 = [0.000, 0.000, 0.381, 0.238, 0.381], and its performance on space height (criterion N5) was good, so r5 = [0.048, 0.714, 0.143, 0.095, 0.000]; by comparison, S3 had better results of both criteria, r1 = [0.762, 0.238, 0.000, 0.000, 0.000], and r5 = [0.333, 0.619, 0.048, 0.000, 0.000].
Based on Table 8 and Table A1, by Equation (9), the scores of the social component were calculated. The results are shown in Table 9.

4.4. Rankings

Firstly, the data of the six systems in social, economic, and environmental performances were standardized by using Equations (11) and (12), afterward, the systems were ranked by TOPSIS. The results are shown in Table 10 and Table 11 RS was the reference system, so S3 and S5 were the optimal solutions for architects and engineers respectively, and the most suitable system overall was S3.

5. Discussion

5.1. The Collaborative and Respective Solutions by Architects and Engineers

5.1.1. The Collaborative Results

The proportions of available points for the HVAC systems in the ATI and investigated GBRTs are listed in Table 12. In a radical departure from the existing GBRTs, the ATI put the biggest points on the comfort-related social category. The reason partly lies in the studied project that was comfort focusing, and the results reflect the situation that with the development of the economy, the demand for a comfortable environment increases [70].
As for the final solution, it is noteworthy that, although the social component had the highest weighting, the SAC system, the RS in the study, was the most balanced in the HSCW area according to the final ranking, no matter the architect group, the engineering group, or the whole group. On one side, the SAC system was the best; on the other side, S3 was selected by the project, which confirmed the point that people would like to create a more comfortable indoor environment by improved HVAC measures [70], even if they would consume more energy and investment [5]. The tendency to sacrifice energy efficiency in the green design may put more pressure on energy saving, and it should be controlled.

5.1.2. The Advantages of the Integrated Design

Based on the multi-criteria assessment, the integrated design helped to select the suitable system, which was efficient and innovative. Firstly, the process of trial and error was avoided. If the conventional design was applied, engineers might propose S5 firstly to achieve extreme comfort, but it would be refused by the architects afterward, and then, the linear process from the engineers to the architects had to flow again, and would not stop until the best solution was tried.
Secondly, the collaborative work ensured the viability of the proposal. As mentioned, the S3 had originally the drawback in terms of space occupation, and it was solved by the design of air ducts integrated into the wall, which required the layout programming by architects collaborating with air-ducts planning by engineers.

5.2. Barriers to the Integrated Design

5.2.1. Requirement on Interdisciplinary

There is already a lot of interdisciplinary work in green building design. For example, simulation technology plays a vital role in green building design, particularly at the early design stage [71]. Architects have to know well about computer-aided technology if they would like to do the green practice. Similarly, the integrated design of HVAC systems is interdisciplinary as well, which raised higher requirements for architects and engineers.
Although building information model (BIM) technology can provide a collaborative platform for different groups [72], it is the prerequisite for the integrated design that the two expert groups have to be familiar with each other’s expertise, especially for architects. During the integrated design process, it was found that most architects were not fully acquainted with radiation systems and fresh air systems at first, and the problem was gradually solved with the whole process of integrated design.

5.2.2. Limitations of the Assessment Methods

MCDM method is not an easy way to handle with. For instance, AHP has its intrinsic limitations. In this process of integrated design, a special workshop was held to conduct the AHP survey, which was highly suggested [73]. However, there were still inconsistent results in the first place, and some participants did a second-round survey afterward. The final weighting results in this study could help relevant studies in the future, particularly for those projects focusing on improving comfort.

5.3. The Suggestions to GBRTs

GBRTs act as the green design guide that both architects and engineers refer to, and it is suggested to overcome barriers to the integrated design by improving GBRTs, which are developing toward a more balanced condition in the three pillars of sustainability [74]. Based on this study, there are the following suggestions for the development of HVAC-related criteria in GBRTs.
Firstly, the credit for the integrated design of HVAC systems can be added to the existing systems. For example, credits can be given either when the room space or construction material is saved, or some aesthetic appearance is achieved as a result of integrated design; additional bonuses can be given when some innovation is introduced, just like the air outlet design in the case. The credit can push forward architects to pay more attention to the equipment, and also, it can promote HVAC engineers to put more concerns into the space occupation and even the appearance of the system.
Secondly, systems with higher energy performance should be further encouraged. Energy consumption is rising due to the growing demand for comfort [75], and this study demonstrates that the technical group paid close attention to the criteria related to comfort. Particularly, under the pressure of COVID-19 recently, energy consumption is supposed to further increase due to the further demand for healthy and safe [76]. Therefore, it is still important to encourage the use of HVAC systems with high energy efficiency.
Thirdly, the criteria requirements on social factors can be more comprehensive, and sustainability cannot be achieved at the expense of indoor environment. For example, end-users are calling for better indoor comfort, particularly at the stage post-pandemic, so the criterion about the fresh air can be a prerequisite. Besides, among the comfort criteria, the noise criterion had the highest weighting factor, which implied that noise performance was becoming the key factor for DM. The noise generated from the indoor terminals, including the airborne sound and vibration, should be considered background noise, and the limited value of the criterion about indoor noise can be raised.

6. Conclusions and Limitations

By sharing a case of green design, the integrated process of the HVAC system was introduced comprehensively. Based on MCDM methods, an assessment tool, ATI, was developed to help the collaborative team to select a suitable indoor system: by AHP, the weighting system for the indoor terminal was surveyed and calculated, further, by TOPSIS, six systems were compared, and ranked.
There are limitations to this study. The study was conducted based on the HSCW area, where heating, cooling, and dehumidification were all necessary. Other climate zones have different conditions and requirements, and the adaptation there is supposed to be made in the future.

Author Contributions

Conceptualization, Y.Y. and Z.L.; Data curation, Y.Y. and Z.L.; Formal analysis, Y.Y.; Funding acquisition, Z.L.; Investigation, Y.Y.; Methodology, Y.Y. and Z.L.; Project administration, Z.L.; Resources, Y.Y.; Software, Y.Y.; Supervision, Z.L.; Validation, Z.L.; Visualization, Y.Y.; Writing—original draft, Y.Y.; Writing—review & editing, Z.L. All authors have read and agreed to the published version of the manuscript.

Funding

This research was funded by National Natural Science Foundation of China, grant number 51978468.

Data Availability Statement

The data presented in this study are available on request from the corresponding author.

Conflicts of Interest

The authors declare no conflict of interest.

Abbreviations

AHPanalytic hierarchy process
ASGBChinese evaluation tool Assessment Standard for Green Building
BREEAMBritish Building Research Establishment Environmental Assessment Method
CERceiling radiant
CRconsistency ratio
DGNBDeutsche Gesellschaft für Nachhaltiges Bauen
DMdecision making
GBRTgreen building rating tool
FCEfuzzy comprehensive evaluation
FHfloor heating
HVACheating, ventilation and air-conditioning
HSCWhot summer and cold winter
LEEDLeadership in Energy and Environmental Design
MCDMmulti-criteria decision making
MVmechanical ventilation
NVnatural ventilation
RSreference systems
SACsplit air-conditioning
TOPSISthe order of preference by similarity to ideal solution
VRVvariable refrigerant volume

Appendix A

Table A1. The fuzzy matrices of criteria for the six systems.
AllArchEng


S1
0.0000.0000.3810.2380.3810.0000.0000.4000.3330.2670.0000.0000.3330.0000.667
0.0000.0470.3810.4290.1430.0000.0670.4000.4000.1330.0000.0000.3330.5000.167
0.0000.2860.5710.0950.0480.0000.3330.6670.0000.00000.0000.1670.3330.3330.167
0.0000.2380.3810.3330.0480.0000.3330.3330.2670.0670.0000.0000.5000.5000.000
0.0480.7140.1430.0950.0000.0670.7330.2000.0000.0000.0000.6670.0000.3330.000


S2
0.1430.4290.3810.0480.0000.2000.4000.3330.0670.0000.0000.5000.5000.0000.000
0.0000.0950.7620.1430.0000.0000.1330.8000.0670.0000.0000.0000.6670.3330.000
0.0000.4760.5240.0000.0000.0000.4670.8000.0670.0000.0000.5000.5000.0000.000
0.0000.1430.4760.0000.0480.0000.2000.4670.2670.0670.0000.0000.5000.5000.000
0.0480.6190.1910.1430.0000.0670.7330.2000.0000.0000.0000.3330.1670.5000.000


S3
0.7620.2380.0000.0000.0000.6670.3330.0000.0000.0000.8330.1670.0000.0000.000
0.3810.6190.0000.0000.0000.3330.6670.0000.0000.0000.5000.5000.0000.0000.000
0.6670.3330.0000.0000.0000.8670.1330.0000.0000.0000.1670.8330.0000.0000.000
0.7140.2860.0000.0000.0000.6000.4000.0000.0000.0001.0000.0000.0000.0000.000
0.3330.6190.0480.0000.0000.4670.5330.0000.0000.0000.0001.0000.0000.0000.000


S4
0.1430.4760.3330.0480.0000.2000.4000.3330.0670.0000.0000.6670.3330.0000.000
0.0480.5710.3330.0480.0000.0670.6000.2670.0670.0000.0000.5000.5000.0000.000
0.1430.8100.0480.0000.0000.2000.7330.0670.0000.0000.0001.0000.0000.0000.000
0.0000.2860.6190.0950.0000.0000.3330.6670.0000.0000.0000.1670.5000.3330.000
0.0000.1430.2860.4290.1430.0000.1330.2670.4670.1330.0000.1670.3330.3330.167


S5
0.7620.2380.0000.0000.0000.7330.2670.0000.0000.0000.8330.1670.0000.0000.000
0.5710.4290.0000.0000.0000.4670.5330.0000.0000.0000.8330.1670.0000.0000.000
0.9520.0480.0000.0000.0000.9330.0670.0000.0000.0001.0000.0000.0000.0000.000
0.7620.2380.0000.0000.0000.6670.3330.0000.0000.0001.0000.0000.0000.0000.000
0.0000.2860.1430.4290.1430.0000.0670.1330.6000.2000.0000.8330.1670.0000.000


RS
0.0000.0000.3810.0480.0000.0000.0000.4000.0670.5330.0000.0000.3330.0000.667
0.0000.2860.6190.0950.0000.0000.3330.5330.1330.0000.0000.1670.8330.0000.000
0.0000.1430.2860.3330.2380.0000.2000.2670.2000.3330.0000.0000.3330.6670.000
0.0000.1430.3810.3330.1430.0000.2000.4000.2000.2000.0000.0000.3330.6670.000
0.3330.4760.0950.0480.0480.4000.3330.1330.0670.0670.0001.0000.0000.0000.000

References

  1. Ikudayisi, A.E.; Chan, A.P.; Darko, A.; Adegun, O.B. Integrated design process of green building projects: A review towards assessment metrics and conceptual framework. J. Build. Eng. 2022, 50, 104180. [Google Scholar] [CrossRef]
  2. U.S. Green Building Council (USGBC). LEED: Reference Guide for Building Design and Construction; U.S. Green Building Council: Washington, DC, USA, 2013. [Google Scholar]
  3. Huo, T.; Cai, W.; Zhang, W.; Wang, J.; Zhao, Y.; Zhu, X. How does income level impact residential-building heating energy consumption? Micro-level evidence from household surveys. Environ. Impact Assess. Rev. 2021, 91, 106659. [Google Scholar] [CrossRef]
  4. Sun, Z.; Wang, Q.; Meng, C.; Zhang, Y. New approach to determine the optimal control of fresh air systems in urban China residences. Build. Environ. 2022, 207, 108538. [Google Scholar] [CrossRef]
  5. Yang, Y. Housing Transformation in China’s Temperate Climate: The Reasonability of Passive House Standard in Shanghai; Logos Verlag Berlin GmbH: Berlin, Germany, 2015; ISBN 9783832540807. [Google Scholar]
  6. Paoletti, G.; Pascual Pascuas, R.; Pernetti, R.; Lollini, R. Nearly Zero Energy Buildings: An Overview of the Main Construction Features across Europe. Buildings 2017, 7, 43. [Google Scholar] [CrossRef]
  7. Gibbons, L.; Javed, S. A review of HVAC solution-sets and energy performace of nearly zero-energy multi-story apartment buildings in Nordic climates by statistical analysis of environmental performance certificates and literature review. Energy 2022, 238, 121709. [Google Scholar] [CrossRef]
  8. Zhou, X.; Yan, D.; Shi, X. Comparative research on different air conditioning systems for residential buildings. Front. Archit. Res. 2017, 6, 42–52. [Google Scholar] [CrossRef]
  9. Ascione, F.; Bianco, N.; de Stasio, C.; Mauro, G.M.; Vanoli, G.P. A new comprehensive approach for cost-optimal building design integrated with the multi-objective model predictive control of HVAC systems. Sustain. Cities Soc. 2017, 31, 136–150. [Google Scholar] [CrossRef]
  10. Delač, B.; Pavković, B.; Lenić, K.; Mađerić, D. Integrated optimization of the building envelope and the HVAC system in nZEB refurbishment. Appl. Therm. Eng. 2022, 211, 118442. [Google Scholar] [CrossRef]
  11. Aparicio Ruiz, P.; La Sánchez de Flor, F.J.; Molina Felix, J.L.; Salmerón Lissén, J.; Guadix Martín, J. Applying the HVAC systems in an integrated optimization method for residential building’s design. A case study in Spain. Energy Build. 2016, 119, 74–84. [Google Scholar] [CrossRef]
  12. Lu, Y.; Wu, Z.; Chang, R.; Li, Y. Building Information Modeling (BIM) for green buildings: A critical review and future directions. Autom. Constr. 2017, 83, 134–148. [Google Scholar] [CrossRef]
  13. Zhao, T.; Qu, Z.; Liu, C.; Li, K. BIM-based analysis of energy efficiency design of building thermal system and HVAC system based on GB50189-2015 in China. Int. J. Low-Carbon Technol. 2021, 16, 1277–1289. [Google Scholar] [CrossRef]
  14. Guo, K.; Li, Q.; Zhang, L.; Wu, X. BIM-based green building evaluation and optimization: A case study. J. Clean. Prod. 2021, 320, 128824. [Google Scholar] [CrossRef]
  15. Beck, H.E.; Zimmermann, N.E.; McVicar, T.R.; Vergopolan, N.; Berg, A.; Wood, E.F. Present and future Köppen-Geiger climate classification maps at 1-km resolution. Sci. Data 2018, 5, 180214. [Google Scholar] [CrossRef] [PubMed] [Green Version]
  16. JGJ 134-2010; Design Standard for Energy Efficiency of Residential Buildings in Hot Summer and Cold Winer Zone. Ministry of Housing and Urban-Rural Development, China Architecture & Building Press: Beijing, China, 2010.
  17. Xia, D.; Lou, S.; Huang, Y.; Zhao, Y.; Li, D.H.; Zhou, X. A study on occupant behaviour related to air-conditioning usage in residential buildings. Energy Build. 2019, 203, 109446. [Google Scholar] [CrossRef]
  18. Zhu, W.; Gao, R.; Zhou, L.; Liu, Y.; Jing, R.; Zhang, Z.; Li, A. Multi-objective Air Terminal of a Household Air Conditioner Based on the Principle of Central Projection. Energy Build. 2021, 111212. [Google Scholar] [CrossRef]
  19. Zhuang, C.; Yang, G.; Long, T.; Hu, D. Numerical comparison of removal and deposition for fully-distributed particles in central- and split-type air-conditioning rooms. Build. Environ. 2017, 112, 17–28. [Google Scholar] [CrossRef]
  20. Sekhar, S.C.; Lim, A.H. Indoor air quality and energy issues of refrigerant modulating air-conditioning systems in the tropics. Build. Environ. 2003, 38, 815–825. [Google Scholar] [CrossRef]
  21. Liu, J.; Lin, Z. Energy and Exergy Performances of Floor, Ceiling, Wall Radiator and Stratum Ventilation Heating Systems for Residential Buildings. Energy Build. 2020, 220, 110046. [Google Scholar] [CrossRef]
  22. Acikgoz, O.; Karakoyun, Y.; Yumurtacı, Z.; Dukhan, N.; Dalkılıç, A.S. Realistic experimental heat transfer characteristics of radiant floor heating using sidewalls as heat sinks. Energy Build. 2019, 183, 515–526. [Google Scholar] [CrossRef]
  23. Jiang, H.; Yao, R.; Han, S.; Du, C.; Yu, W.; Chen, S.; Li, B.; Yu, H.; Li, N.; Peng, J.; et al. How do urban residents use energy for winter heating at home? A large-scale survey in the hot summer and cold winter climate zone in the Yangtze River region. Energy Build. 2020, 223, 110131. [Google Scholar] [CrossRef]
  24. Xu, L.; Liu, J.; Pei, J.; Han, X. Building energy saving potential in Hot Summer and Cold Winter (HSCW) Zone, China—Influence of building energy efficiency standards and implications. Energy Policy 2013, 57, 253–262. [Google Scholar] [CrossRef]
  25. The People’s Government of Jiangsu Province, Today in Jiangsu Province, Issued a New Edition of “Residential Design Standards”. Available online: http://www.jiangsu.gov.cn/art/2021/1/8/art_60095_9634769.html?gqnahi=affiy2 (accessed on 9 June 2021).
  26. Zhou, Y.P.; Wu, J.Y.; Wang, R.Z.; Shiochi, S.; Li, Y.M. Simulation and experimental validation of the variable-refrigerant-volume (VRV) air-conditioning system in EnergyPlus. Energy Build. 2008, 40, 1041–1047. [Google Scholar] [CrossRef]
  27. Zhao, D.; Zhong, M.; Zhang, X.; Su, X. Energy consumption predicting model of VRV (Variable refrigerant volume) system in office buildings based on data mining. Energy 2016, 102, 660–668. [Google Scholar] [CrossRef]
  28. Karakoyun, Y.; Acikgoz, O.; Çebi, A.; Koca, A.; Çetin, G.; Dalkilic, A.S.; Wongwises, S. A comprehensive approach to analyze the discrepancies in heat transfer characteristics pertaining to radiant ceiling heating system. Appl. Therm. Eng. 2021, 187, 116517. [Google Scholar] [CrossRef]
  29. Standard | WELL V2. Available online: https://v2.wellcertified.com/wellv2/en/thermal%20comfort (accessed on 19 April 2021).
  30. Xin, Y.; Cui, W.; Zeng, J. Experimental study on thermal comfort in a confined sleeping environment heating with capillary radiation panel. Energy Build. 2019, 205, 109540. [Google Scholar] [CrossRef]
  31. Bean, R.; Olesen, B.; Kwang, W.; Kim, K.-W. Part 1. History of Radiant Heating & Cooling Systems. ASHRAE J. 2010, 52, 40. [Google Scholar]
  32. Lai, D.; Qi, Y.; Liu, J.; Dai, X.; Zhao, L.; Wei, S. Ventilation behavior in residential buildings with mechanical ventilation systems across different climate zones in China. Build. Environ. 2018, 143, 679–690. [Google Scholar] [CrossRef] [Green Version]
  33. Cao, G.; Awbi, H.; Yao, R.; Fan, Y.; Sirén, K.; Kosonen, R.; Zhang, J. A review of the performance of different ventilation and airflow distribution systems in buildings. Build. Environ. 2014, 73, 171–186. [Google Scholar] [CrossRef]
  34. Leoto, R.; Lizarralde, G. Challenges in evaluating strategies for reducing a building’s environmental impact through Integrated Design. Build. Environ. 2019, 155, 34–46. [Google Scholar] [CrossRef]
  35. Illankoon, I.C.S.; Tam, V.W.; Le, K.N.; Shen, L. Key credit criteria among international green building rating tools. J. Clean. Prod. 2017, 164, 209–220. [Google Scholar] [CrossRef]
  36. Ministry of Housing and Urban-Rural Development. Assessment Standard for Green Building; China Architecture & Building Press: Beijing, China, 2019. [Google Scholar]
  37. BRE Global Ltd. BREEAM UK New Construction 2018. Available online: https://www.babergh.gov.uk/assets/Strategic-Planning/JLPExamination/CoreDocLibrary/C-InternationalNationalDocs/C20-BREEAM-Non-domestic-buildings-technical-manual-July-2019.pdf (accessed on 31 March 2021).
  38. DGNB. DGNB System: Criteria Set-New Construction Building; German Sustainable Building Council: Stuttgart, Germany, 2018. [Google Scholar]
  39. Sinou, M.; Kyvelou, S. Present and future of building performance assessment tools. Manag. Env Qual. 2006, 17, 570–586. [Google Scholar] [CrossRef]
  40. Altomonte, S.; Schiavon, S.; Kent, M.G.; Brager, G. Indoor environmental quality and occupant satisfaction in green-certified buildings. Build. Res. Inf. 2019, 47, 255–274. [Google Scholar] [CrossRef] [Green Version]
  41. Altomonte, S.; Saadouni, S.; Kent, M.G.; Schiavon, S. Satisfaction with indoor environmental quality in BREEAM and non-BREEAM certified office buildings. Archit. Sci. Rev. 2017, 60, 343–355. [Google Scholar] [CrossRef]
  42. Omer, A.M. Energy, environment and sustainable development. Renew. Sustain. Energy Rev. 2008, 12, 2265–2300. [Google Scholar] [CrossRef]
  43. United Nations, Department of Economic and Social Affairs. Transforming Our World: The 2030 Agenda for Sustainable Development. Available online: https://sdgs.un.org/2030agenda (accessed on 9 August 2021).
  44. Adams, W. The Future of Sustainability: Re-Thinking Environment and Development in the Twenty-First Century; International Union for Conservation of Nature: Gland, Switzerland, 2006. [Google Scholar]
  45. Khoshnava, S.M.; Rostami, R.; Valipour, A.; Ismail, M.; Rahmat, A.R. Rank of green building material criteria based on the three pillars of sustainability using the hybrid multi criteria decision making method. J. Clean. Prod. 2018, 173, 82–99. [Google Scholar] [CrossRef]
  46. Yadegaridehkordi, E.; Hourmand, M.; Nilashi, M.; Alsolami, E.; Samad, S.; Mahmoud, M.; Alarood, A.A.; Zainol, A.; Majeed, H.D.; Shuib, L. Assessment of sustainability indicators for green building manufacturing using fuzzy multi-criteria decision making approach. J. Clean. Prod. 2020, 277, 122905. [Google Scholar] [CrossRef]
  47. Huang, J.P.; Poh, K.L.; Ang, B.W. Decision analysis in energy and environmental modeling. Energy 1995, 20, 843–855. [Google Scholar] [CrossRef]
  48. Wang, J.-J.; Jing, Y.-Y.; Zhang, C.-F.; Zhao, J.-H. Review on multi-criteria decision analysis aid in sustainable energy decision-making. Renew. Sustain. Energy Rev. 2009, 13, 2263–2278. [Google Scholar] [CrossRef]
  49. Loken, E. Use of multicriteria decision analysis methods for energy planning problems. Renew. Sustain. Energy Rev. 2007, 11, 1584–1595. [Google Scholar] [CrossRef]
  50. Pohekar, S.D.; Ramachandran, M. Application of multi-criteria decision making to sustainable energy planning—A review. Renew. Sustain. Energy Rev. 2004, 8, 365–381. [Google Scholar] [CrossRef]
  51. Bac, U.; Alaloosi, K.A.M.S.; Turhan, C. A comprehensive evaluation of the most suitable HVAC system for an industrial building by using a hybrid building energy simulation and multi criteria decision making framework. J. Build. Eng. 2021, 37, 102153. [Google Scholar] [CrossRef]
  52. Kannan, D.; Moazzeni, S.; Darmian, S.m.; Afrasiabi, A. A hybrid approach based on MCDM methods and Monte Carlo simulation for sustainable evaluation of potential solar sites in east of Iran. J. Clean. Prod. 2021, 279, 122368. [Google Scholar] [CrossRef]
  53. Chen, X.; Qu, K.; Calautit, J.; Ekambaram, A.; Lu, W.; Fox, C.; Gan, G.; Riffat, S. Multi-criteria assessment approach for a residential building retrofit in Norway. Energy Build. 2020, 215, 109668. [Google Scholar] [CrossRef]
  54. Si, J.; Marjanovic-Halburd, L.; Nasiri, F.; Bell, S. Assessment of building-integrated green technologies: A review and case study on applications of Multi-Criteria Decision Making (MCDM) method. Sustain. Cities Soc. 2016, 27, 106–115. [Google Scholar] [CrossRef]
  55. Zhang, X.; Yang, J.; Zhao, X. Optimal study of the rural house space heating systems employing the AHP and FCE methods. Energy 2018, 150, 631–641. [Google Scholar] [CrossRef]
  56. Saaty, T.L. Decision making with the analytic hierarchy process. Int. J. Serv. Sci. 2008, 1, 83. [Google Scholar] [CrossRef] [Green Version]
  57. Ali, H.H.; Al Nsairat, S.F. Developing a green building assessment tool for developing countries—Case of Jordan. Build. Environ. 2009, 44, 1053–1064. [Google Scholar] [CrossRef]
  58. Vyas, G.S.; Jha, K.N.; Patel, D.A. Development of Green Building Rating System Using AHP and Fuzzy Integrals: A Case of India. J. Archit. Eng. 2019, 25, 4019004. [Google Scholar] [CrossRef]
  59. Ma, G.; Liu, T.; Shang, S. Improving the climate adaptability of building green retrofitting in different regions: A weight correction system for Chinese national standard. Sustain. Cities Soc. 2021, 69, 102843. [Google Scholar] [CrossRef]
  60. Wei, Q. Sustainability evaluation of photovoltaic poverty alleviation projects using an integrated MCDM method: A case study in Guangxi, China. J. Clean. Prod. 2021, 302, 127040. [Google Scholar] [CrossRef]
  61. Zadeh, L.A. Fuzzy sets. Inf. Control 1965, 8, 338–353. [Google Scholar] [CrossRef]
  62. Zhao, T.; Zhang, C.; Xu, J.; Wu, Y.; Ma, L. Data-driven correlation model between human behavior and energy consumption for college teaching buildings in cold regions of China. J. Build. Eng. 2021, 38, 102093. [Google Scholar] [CrossRef]
  63. Guo, Y.; Yi, P. Character analysis of linear dimensionless methods. Stat. Res. 2008, 25, 93–100. [Google Scholar]
  64. Li, X.; Gao, X. Validity evaluation of dimensionless methods. Stat. Decis. 2021, 24–28. [Google Scholar]
  65. Hwang, C.-L.; Yoon, K. Lecture Notes in Economics and Mathematical Systems: Multiple Attribute Decision Making: Methods and Appllication; Springer: Berlin/Heidelberg, Germany, 1981; ISBN 978-3-540-10558-9. [Google Scholar]
  66. Landsea New Mansion Project. Available online: https://www.construction21.org/china/case-studies/h/landsea-new-mansion-project.html (accessed on 31 March 2021).
  67. Zhu, J.; Jiang, B.; Wang, H. An Air Supply System from the Skirting Line, 24 May 2017.
  68. Liu, B. Noise control reconstruction for an air conditioning system. Heat. Vent. Air Cond. 2015, 45, 90–92. [Google Scholar]
  69. Ministry of Housing and Urban-Rural Development. Technical Guidelines for Passive Ultra-Low Energy Green Building (Trial Version); Ministry of Housing and Urban-Rural Development: Beijing, China, 2015. [Google Scholar]
  70. Li, Q.; Zhang, L.; Zhang, L.; Wu, X. Optimizing energy efficiency and thermal comfort in building green retrofit. Energy 2021, 237, 121509. [Google Scholar] [CrossRef]
  71. Lin, C.-H.; Chih, Y.-Y.; Tsay, Y.-S. Determinants of the Adoption of Green Building Simulation Technologies in Architectural Design Practices in Taiwan. J. Constr. Eng. Manag. 2022, 148, 04021190. [Google Scholar] [CrossRef]
  72. Oh, M.; Lee, J.; Hong, S.W.; Jeong, Y. Integrated system for BIM-based collaborative design. Autom. Constr. 2015, 58, 196–206. [Google Scholar] [CrossRef]
  73. Si, J.; Marjanovic-Halburd, L. Criteria weighting for green technology selection as part of retrofit decision making process for existing non-domestic buildings. Sustain. Cities Soc. 2018, 41, 625–638. [Google Scholar] [CrossRef] [Green Version]
  74. Wen, B.; Musa, N.; Onn, C.C.; Ramesh, S.; Liang, L.; Wang, W. Evolution of sustainability in global green building rating tools. J. Clean. Prod. 2020, 259, 120912. [Google Scholar] [CrossRef]
  75. Yang, L.; Yan, H.; Lam, J.C. Thermal comfort and building energy consumption implications—A review. Appl. Energy 2014, 115, 164–173. [Google Scholar] [CrossRef]
  76. Zheng, W.; Hu, J.; Wang, Z.; Li, J.; Fu, Z.; Li, H.; Jurasz, J.; Chou, S.K.; Yan, J. COVID-19 Impact on Operation and Energy Consumption of Heating, Ventilation and Air-Conditioning (HVAC) Systems. Adv. Appl. Energy 2021, 3, 100040. [Google Scholar] [CrossRef]
Figure 1. The conventional design and the assessment-based integrated design.
Buildings 12 01844 g001
Figure 2. The assessment steps.
Buildings 12 01844 g002
Figure 3. The location of the project.
Buildings 12 01844 g003
Figure 4. Existing building (left) and the rendering of retrofitting design (right).
Buildings 12 01844 g004
Figure 5. The layout of the studied floorplan.
Buildings 12 01844 g005
Figure 6. The outlet integrated at the skirting line.
Buildings 12 01844 g006
Figure 7. The layout of the internal walls and the outlets.
Buildings 12 01844 g007
Figure 8. The construction and final result of the internal walls and the outlets.
Buildings 12 01844 g008
Figure 9. Assessment structure of ATI.
Buildings 12 01844 g009
Table 1. Alternative heating and cooling measures for residential buildings in Shanghai.
ConditionsCodeMeasureIndoor TerminalGeneratorEnergy
HeatingH1VRVIndoor deviceAir source heat pumpElectricity
H2CERCapillary radiation matAir source heat pumpElectricity
H3FHWater piping underfloorBoilerNatural gas
CoolingC1VRVIndoor deviceAir source heat pumpElectricity
C2CERCapillary radiation matAir source heat pumpElectricity
Table 2. Alternative ventilation measures for residential buildings in Shanghai.
CodeMeasureAir DistributionEnergy
VentilationV1UVUpper air supply ventilationElectricity
V2DVDisplacement ventilationElectricity
Table 3. HVAC-related indicators in GBRTs of the four countries.
GBRTs.Social CriteriaEconomic CriteriaEnvironmental Criteria
IndicatorsPoints AvailableIndicatorsPoints AvailableIndicatorsPoints Available
ASGB
(2019, China)
5.2.9: Good indoor thermal comfort0.8--7.2.5: Systems with better performance than requirements in national codes1.0
5.2.10: NV improving indoor comfort0.87.2.6: Reducing the energy use in distribution and terminals0.5
7.2.8: Less energy use than reference buildings1.0
LEED
(v4.1 BD+C, the USA)
EQ: Enhanced indoor air quality strategies2Integrative project planning and design. Life cycle cost analysisPrerequisiteEA: Enhanced commissioning6
EQ: Thermal comfort1 EA: Optimize energy performance20
EQ: Acoustic Performance: HVAC background noise1 EA: Enhanced refrigerant management1
BREEAM
(SD5078 v2, Britain)
Hea02: Indoor air quality. Ventilation provides fresh air0.64%Man02: Life cycle cost and service life planning
2.1%Ene01 Reduction of energy use and carbon emissions6.71%
Hea04: Thermal comfort2.55%Ene04 Low carbon design1.55%
DGNB
(v3, Germany)
SOC1.1: Thermal comfort5.3%ECO1.1: Life cycle cost 8.0%ENV1.1: Building life cycle assessment9.5%
SOC1.2: Indoor air quality3.3%ECO2.1: Flexibility and adaptability. 2.3%ENV1.2: Local environmental impact0.5%
SOC1.5: User control0.7%
Table 4. The mean random index of 500 samples.
n2345678910
RI00.580.901.121.241.321.411.451.49
Table 5. Potential air-conditioning systems in Shanghai.
System CodeCombination of Measures FeaturesArchitectural PerspectiveEngineer Perspective
S1H1 + C1Heating and cooling are provided by VRV.Some space is occupied by the indoor terminals in terms of height.Intermittently operated; The indoor terminal can be noisy.
S2H1 + C1 + V1Fresh air is supplied through MV. More air ducts than S1, but they can be placed in the ceiling, and integrated with the installation of VRV.MV system can also control indoor humidity; The indoor terminal can be noisy.
S3H2 + C2 + V2Both heating and cooling are performed using the radiation mat in the ceiling.Air ducts of displacement ventilation require further space underfloor.Displacement ventilation is more efficient than upper air supply; The system is quiet.
S4H3 + C1 + V1Unlike S3, cooling is supplied by VRV, whereas heating is handled by the radiation system.Underfloor space is required for waterpipes, and VRV indoor terminals occupy the ceiling space.The indoor terminal can be noisy during summers.
S5H3 + C2 + V1Heating occurs from the bottom and cooling is handled from the top; both use the radiation system.Underfloor space is required for waterpipes, and radiation mat and air ducts occupy the ceiling space.The most comfortable system
RSSAC currently usedHeating and cooling are provided by SAC.The indoor terminal may affect the interior design and can be regarded as furniture.Intermittently operated; The indoor terminal can be noisy.
Table 6. Envelope construction.
ConstructionFeaturesPerformance
External wall100 mm mineral woolU ≤ 0.35 W/(m2∙K)
Glazing5 + 12A + 5 + 12A + 5, triple glazingU ≤ 1.76 W/(m2∙K), g = 0.60
Window frameWood frameU ≤ 2.63 W/(m2∙K)
ShadingMovable rollers
Table 7. Initial investments and simulated annual energy performance of different HVAC systems.
SystemsInvestment AOE
Original Data (RMB)Original Data (kWh)
S157,3907241.76
S262,259.56837.30
S3124,3457668.68
S490,954.56686.82
S5148,344.57381.78
RS18,5005856.94
Table 8. Weighting coefficients of ATI provided by different groups.
Level IAll ArchitectEngineerLevel IIAllArchitectEngineer


M1


0.390


0.386


0.403
N10.0910.0830.120
N20.0840.0880.072
N30.0530.0550.044
N40.1010.0980.111
N50.0600.0620.055
M20.3170.3200.309N60.3170.3200.309
M30.2930.2950.288N70.2930.2950.288
Table 9. The social scores of the six systems.
SystemsM1 (Social Component)
All Arch Eng
S10.5510.5850.466
S20.6540.6720.608
S30.9210.9230.922
S40.6900.7000.664
S50.8880.8600.954
RS0.5410.5510.503
Table 10. The standardized scores.
SystemsM1
(Social)
M2
(Economic)
M3
(Environmental)
All Arch Eng
S10.5980.6340.4890.3220.191
S20.7100.7280.6370.2970.234
S31.0001.0000.9670.1490.366
S40.7490.7580.6960.2030.216
S50.9640.9321.0000.1250.341
RS0.5870.5970.5271.0000.640
Table 11. The resultant efficiencies and ranks by TOPSIS.
SystemAllArchEng
C j Ranking C j Ranking C j Ranking
S10.19160.58660.1736
S20.23440.62940.2425
S30.36620.65920.4153
S40.21650.61650.2514
S50.34130.63430.4272
RS0.64010.84510.5951
Table 12. The proportions of the three categories for HVAC systems.
SystemsSocialEconomicEnvironmental
ATI (all)39.0%31.7%29.3%
ASGB1.6%02.5%
LEED3.64%Prerequisite24.55%
BREEAM3.19%2.1%8.25%
DGNB9.3%10.3%10.0%
Publisher’s Note: MDPI stays neutral with regard to jurisdictional claims in published maps and institutional affiliations.