Abstract
Thermal comfort (TC) and CO2 concentration significantly influence the overall indoor comfort sensations of building occupants. However, few studies have focused on educational buildings regarding both TC and CO2 concentration in tropical regions, and they also lack guidelines for short-term evaluation, which is essential for university classrooms. In this study, a mechanically ventilated university classroom was selected to investigate the 5 min-averaged comfort ranges for indoor parameters and the impacts of TC and variation of CO2 on student overall comfort. The real-time indoor environmental parameters were monitored, including indoor air temperature (Ta), mean radiant temperature (Tm), relative humidity (RH) and CO2 and air velocity (va); the operative temperature (Top) was calculated. Moreover, an online-based questionnaire survey related to thermal sensation (TS) and CO2-related air sensation (AS) was carried out. Linear and nonlinear regression models of comfort sensation predictions were obtained based on the questionnaires and corresponding measured indoor environmental data. The 5 min-averaged comfort ranges for Top, CO2 and RH are 21.5–23.8 °C, <1095 ppm and 47–63.5%, respectively. The comfort range of the TS and AS are 2.3–3.1 and 1–1.55, respectively. The result shows that students prefer a relatively cold indoor environment, as this improves their ability to tolerate bad indoor air quality (IAQ) with high CO2. A regression analysis indicated that AS is the most critical aspect, with a weight of 0.32, followed by TS, with 0.18. Finally, it was also found that individual weighting coefficients were not equivalent and differed across geographical locations and building types. Thus, obtaining the prediction models for a particular building is necessary. The results can give meaningful suggestions to adopt the appropriate operations for HVAC and improve indoor environmental quality in university buildings in tropical regions.
1. Introduction
Indoor environmental quality (IEQ) has a strong relationship with the occupant wellbeing, affecting health, emotions, and productivity. IEQs are different for various types of buildings [1]. In detail, compared with residential, educational and commercial buildings, educational buildings have unique traits due to their 3–4 times higher population density than the other two types [2]. In addition, occupants in educational buildings are not static. The students change their positions frequently from one place to another, underlining the importance of short-term indoor conditions instead of the daily averaged conditions [3,4]. Moreover, learning processes can happen at any time and place [3,4]. Therefore, providing comfortable IEQ in classrooms and exploring the relationships between comfort sensations and various indoor parameters have attracted more attention from academics and governments [5,6,7].
IEQ, as a complex research aspect, is influenced by thermal comfort (TC), indoor air quality (IAQ), visual comfort (VC), and acoustic comfort (AC) [8,9]. Among these four aspects, TC and IAQ are commonly suggested for priority consideration to avoid health-related symptoms, absenteeism, and loss of concentration [10,11]. Thus, to guarantee the health and efficiency of occupants, a better indoor environment with suitable TC and IAQ is suggested [12], and many studies have focused on particular methods to achieve better IEQ, such as the use of windcatchers [13,14,15].
In mechanically ventilated classrooms, the performances of TC and IAQ are significantly related to the heating, ventilation and air conditioning (HVAC) system, which accounts for a large proportion of energy consumption (50% of the total energy consumption in a building) [16,17,18]. Using different control strategies for HVAC systems will result in varying levels of indoor air temperature (Ta), relative humidity (RH), and various pollutants [19]. Moreover, occupants’ thermal sensations (TS) interact mutually with their air sensations (AS), especially in HVAC system-dominated rooms [20]. Thus, discussing only one or the other is insufficient to provide accurate control strategies for the IEQ. Under this situation, it was suggested that TC and IAQ should be discussed together. However, though most studies investigated all IEQ aspects, they just discussed the relationship between overall comfort and individual aspect and didn’t elaborate on their interferences among different IEQ aspects [9,21,22]. Moreover, it has been found that most relevant studies considering the interactions among various IEQ aspects select only offices as research targets [23,24,25,26]. Few studies have been conducted on university classrooms with unique traits compared to other rooms [27].
In Hong Kong, almost all published papers also focused on commercial buildings [28,29,30], consultation rooms [31], and street canyons [32]. By contrast, it was found that only Yang et al. [33] performed relevant experiments on overall IEQ in university classrooms in Hong Kong. Evidently, almost no studies pay attention to the university in terms of TC and IAQ and no corresponding models were put forward to facilitate the indoor environment design and control.
Another limitation in other countries/regions on university classroom IEQ improvement is the lack of particular standards regarding short-time assessment (Within 1 h or shorter) [34,35,36,37,38]. According to Table 1, most countries utilize the guidelines with 8-h and 24-h averaged indoor values as indoor control references. However, these guidelines are unsuitable for university classrooms due to the shorter class time of not over 3 h in a particular classroom, compared with high, middle, and primary schools. Noticeably, university students’ density could summit suddenly in a short time. Thus, using 8 h-averaged guidelines cannot guarantee the indoor temperature, CO2, and RH stay in comfortable regions.

Table 1.
Standards and guidelines for temperature, CO2, and RH.
Although there are guidelines for short-term recommendations (15 min) [39,40,41,42,43,44], these guidelines mainly focus on CO2, neglecting temperature and RH. Besides, the acceptable range of CO2 defined by these 15 min-based guidelines is relatively huge, resulting in a low ventilation rate. Thus, short-term measurement and the proposed threshold concentrations by the guidelines or standards are insufficient. Accurately predicting the relationship between CO2 and comfort sensations is benefinicial to improving the IAQ, since CO2 is regarded as the indicator for ventilation rate. Moreover, as the densest city in the world, Hong Kong has the highest and most strict demands on the indoor environment, especially with the influence of the COVID-19 pandemic. Under this circumstance, min-based studies in university classrooms are becoming increasingly important.
This study investigates the short-term comfort ranges of Top, CO2, and RH for a typical university classroom with mechanical ventilation and explores the relationships between TS, AS, and overall comfort sensations. Thus, a questionnaire-assisted on-site experiment in a mechanically ventilated university classroom in Hong Kong was carried out. The objectives of this study include 1. To explore the AS, TS, and overall comfort sensations of students studying in the selected university classroom; 2. To figure out the min-based comfort levels of Top, CO2, and RH through the collected questionnaires and the recorded real-time indoor data; 3. Based on objectives 1 and 2, to evaluate the students’ relative significance of TS and AS; 4. Based on objective 3, to develop comfort regression models to facilitate indoor environment control for university classrooms. The results can give more accurate recommendations for short-term IEQ control to improve comfort sensations. This study provides meaningful advice on the min-based assessment regarding educational buildings. It can be treated as a case study for educational buildings located in tropical climates.
2. Methodology
2.1. Site Description
A typical classroom in Hong Kong Metropolitan University (HKMU) was selected as the target classroom. The campus of HKMU was built in 2003 in Hong Kong (latitude: 22.33° N and longitude: 114.19° E). Figure 1 shows the geographical location of HKMU. The campus is located in an urban area without major traffic roads surrounding the campus. Near HKMU, most of the buildings are residential buildings, and there are no industrial buildings that can produce enormous pollutants that affect the outdoor environment around the campus. Thus, the noise and pollutants near the campus keep at low levels, providing a comfortable learning environment for students. This building is certificated with a Gold level by the Building Environmental Assessment Method (BEAM) released by the Hong Kong Green Building Council (HKGBC), including the demolition, planning, design, construction and commissioning of a new building project.
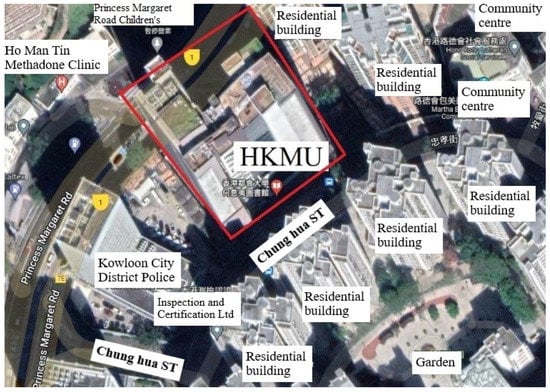
Figure 1.
The geographical location of HKMU.
Figure 2a shows the exterior appearance of the HKMU. There are many different types of rooms in HKMU, such as computer rooms, classrooms, and libraries. Compared with other types of rooms, university students spend most of their time in the classroom, which can accommodate more than 200 students. During the COVID-19 Pandemic, huge classrooms with mechanical ventilation systems instead of small classrooms were assigned to different classes to ensure a certain seating distance and better ventilation. Thus, a classical central mechanical ventilated classroom on the 3rd floor of HKMU was selected as the target classroom for monitoring in 2021. Figure 2b,c show this selected classroom’s interior view and sampling layouts. The classroom size is 254.69 m2, which can accommodate 246 students maximumly. The students can access the classroom through two doors lying on the two sides of the rostrum in the front.
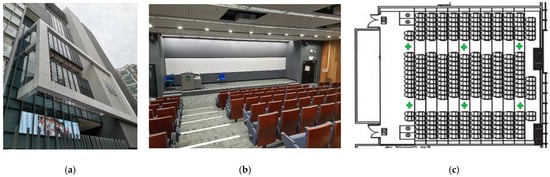
Figure 2.
Exterior and interior appearance of the HKMU and selected classroom (a) Exterior view; (b) Interior view; (c) layouts of seats and sampling positions.
2.2. Monitoring of Real-Time IAQ Parameters
Four measurable environment variables (Ta, RH, va and Tm) recommended by PMV–PPD thermal model [47] are measured in this study. The va and Tm aim to obtain the Top, which can comprehensively reflect the influences of heat convection and radiation on the comfort sensations [48]. The RH is the ratio of water vapour pressure to the maximal quantity of water vapour pressure embodied in the air at a given temperature [49], which is commonly expressed in percentage. It has been proved that RH can strongly affect TS and AS [50]. CO2 concentration is a crucial factor in the IAQ and can also be used as an indicator of ventilation rates [51]. It should be noted that IAQ is affected by many kinds of indoor parameters, such as CO, CO2, NOx, NH3, and O3. However, the target classroom in the study is mainly used for teaching. CO2, as the primary production by the students, is considered the crucial parameter for assessing the IAQ. Lower CO2 concentrations demonstrate that IAQ is acceptable, air exchange is suitable, and sufficient fresh air is being transferred from outdoor to indoor spaces sufficiently. Thus, indoor parameters monitored in this study include indoor air temperature Ta, relative humidity RH, CO2, air velocity va and mean radiant temperature Tm.
Seven on-site experiments were conducted from October to November 2021. It was a pandemic period, but the situation became controllable gradually, resulting in the possibility of the offline questionnaire survey. Ta, RH, and CO2 were measured at an interval of 5 min by an Awair sensor (Model No. AQM3001A) [52]. The va and Tm were also measured by the DELIXI sensor and SWEMA sensor with the same interval of 5 min, respectively. Detailed information on the sensors has been listed in Table 2, including the monitoring range, resolution, and accuracy.
Table 2.
Specifications of sensors for IAQ monitoring.
Awair sensors are authorized by RESET Air Standard released for built environment regarding the corresponding sensor-based and performance-driven data standard and certification program. Before performing the field experiment, the Awair sensors were calibrated in the laboratory by comparing the measured data with those of the validated sensors (SIRIUS datalogger ST-501 certificated by LEED) to guarantee the monitoring accuracy and operation stability, as well as the DELIXI sensor and SWEMA sensor.
For the sampling location, six measurement points away from the main airflows with a height of 0.6 m as recommended by ANSI/ASHRAE 55 for seating positions [53]. The layout of the sensors has been demonstrated in Figure 2c. All the sensors were placed in the classroom before the student’s arrival to prevent disturbing teaching and learning activities.
2.3. Questionnaire Survey
During the same period of monitoring the real-time indoor parameters, the corresponding online survey was carried out instead of the traditional paper-based survey to instantly obtain students’ sensation votes on TS and AS. Online questionnaires can record the time of filling out the questionnaire in time. It should be noted that before the questionnaire survey, the basic knowledge of IEQ was introduced to students to help them express their comfort sensations accurately. There were 60 students registered for this class including 31 males and 29 females, and over 95% of the students were between the ages of 20 and 24. Finally, a total of 655 valid responses were collected.
The questions are mainly about occupants’ AS, TS and overall comfort. In detail, a five-scale-based classification was used for TS and AS. The indoor TS was classified into five scales, including “Cold”, “Cool”, “Neutral”, “Warm”, and “Hot”. The AS was also classified into five levels, including “Very fresh”, “Fresh”, “Neutral”, “Stuff”, and “Very stuff”. Then, the occupants’ overall comfort sensations under each categorization were summarized according to the statistical methods introduced by Korsavi et al. [3]. Three-scale-based classification for overall comfort sensations was used, including “Comfort”, “Neutral”, and “Not comfort”. Detailed information about the questionnaires is listed in Appendix A.
2.4. Statistic Analysis
Firstly, the voting results of all questionnaires are discussed together. The total number of students voting for different TS, AS, and comfort sensations are counted. Then, the regressions to describe the relationships among comfort sensations, individual indoor parameters, and individual IEQ aspects are fitted. It should be noted that for each questionnaire survey, the real-time indoor parameters are recorded automatically by the sensors. However, the questionnaire results vary from student to student. To reflect the representative comfort sensations, the average of voting results is calculated for each questionnaire survey. Then the Statistical Package for the Social Sciences (SPSS) 20 (SPSS Inc., Chicago, IL, USA) is used for obtaining the Pearson correlation coefficient (p-value) and mathematical regressions.
In order to obtain the regression models for predicting the relationship between comfort sensation and various indoor parameters, linear regression, multiple linear and quadratic regression were applied. Utilizing linear regression can obtain a linear fitting equation with minimum RSS (residual sum of squares), indicating the correlation between the measured data and the predicted data. In contrast, multiple regressions describe the linear dependency between a single dependent variable and several predicted variables. This study used linear and multiple linear regression analyses to explore the relationships between indoor parameters and overall comfort sensations. Due to the nonlinear relationships between comfort sensations and TS, quadratic regression was applied.
3. Results Analysis
Based on this study’s objectives, this section discusses the influences of students’ activities on the variations in indoor parameters. Besides, the comfort sensations under various TS and AS, the mutual influences between TS and AS, and the relative significance of TS and AS are analyzed.
3.1. Indoor Environment Monitoring
During the measurements, the indoor Top for the classroom ranged from 20.1 to 27.2 °C, RH from 61.7 to 78.6%, CO2 from 575.9 to 1652.4 ppm, and va from 0 to 0.79 m/s. Students’ activities in the classroom affected the IAQ significantly, especially the CO2. To further demonstrate the hourly variations of the indoor parameters during the class period (with students and teachers as occupants), Figure 3 depicts indoor Top, CO2, and RH profiles for each indoor experiment.
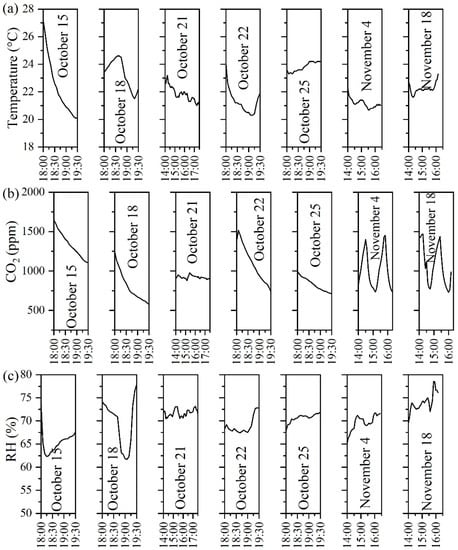
Figure 3.
The profiles of Top, RH, and CO2 during the class. (a) Top; (b) RH; (c) CO2.
Top, CO2, and RH vary dramatically during the class period. The case performed on November 4 was of representative significance due to the existence of discussion sections which is a common part before the final subject test or group presentations. It should be noted that this class started at 14:00 and ended at 16:30. The class had two group discussion sections (starting from 14:30 and 15:50, representatively). During the discussion period, students accessed the classroom frequently, and thus the doors were kept continually opening. At the beginning of the class, the HVAC system was turned on with closed doors. Therefore, the indoor Top decreased dramatically during the initial period, from 22 °C to 20.8 °C until the first group discussion. In contrast, due to the influences of the students’ metabolism, the RH and CO2 increased significantly, rising from 892.1 ppm to 1359.4 ppm and from 65.9% to 72.4%, respectively. At about 14:30, there was a group discussion. Due to the frequent access to the classroom, the two doors were kept opening. Thus, the accumulated CO2 could be released outdoors, but the indoor Top and RH were kept at high levels due to the influence of the out-classroom environment with relatively higher RH and outdoor temperatures. During the second discussion period, these three parameters had similar varying profiles. Relative high levels of CO2 can limit students studying and thinking efficiency, as well as their health. Thus, it is necessary to appropriately increase the proportion of break time to exchange fresh air with the external environment, especially for classrooms without newly introduced fresh air.
3.2. Voting Results of TS and AS
In total, 655 effective questionnaires were collected during the three-month questionnaire survey. Figure 4 and Figure 5 show the voting results for TS and AS, respectively. TS is a crucial factor that significantly determines occupants’ overall comfort sensations. As shown in Figure 4, the overall proportion of “Comfort”, “Neutral”, and “Not comfort” were 41.8, 44.3, and 13.9%, respectively. In general, the overall “Not comfort” proportion was less than 15.0%, indicating that the indoor thermal environment was acceptable for most students. However, the proportion of “Neutral” was greater than that of “Comfort”, indicating the indoor environment was not consistently staying at a comprehensively comfortable level.
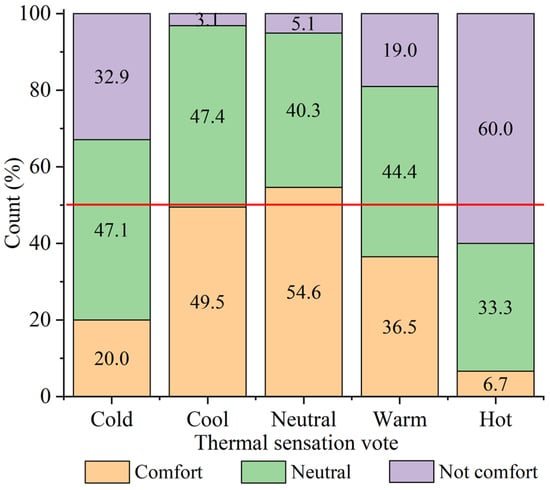
Figure 4.
Thermal sensation voting results.
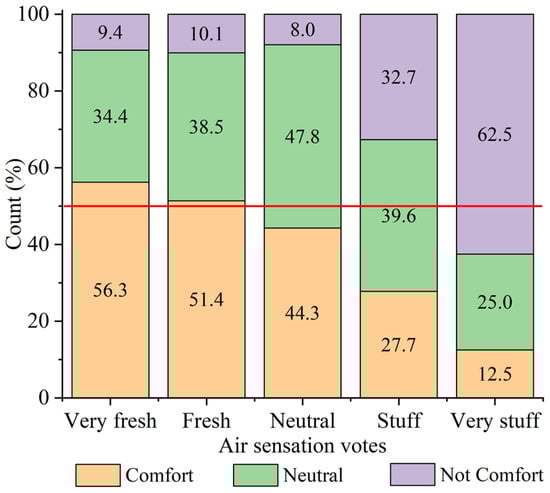
Figure 5.
Air sensation voting results.
The total number of students voting “Cold”, “Cool”, “Neutral”, “Warm”, and “Hot” were 155, 192, 216, 63, and 15, respectively. The corresponding proportions were 24.2%, 30.0%, 33.70%, 9.8%, and 2.3%, respectively. The total number of students voting “Cold” and “Cool” was over 50.0%. Only 30.0% of students voted “Neutral”. In general, it can be attributed that the indoor Top was relatively lower. The “Not comfort” proportions in TS scales “Cold”, “Cool”, “Neutral”, “Warm”, and “Hot” were 32.9%, 3.1%, 5.1%, 19.0%, and 60.0%, respectively. Excepting the extremely terrible conditions (“Cold” and “Hot”), with the TS getting hotter, the uncomfortable proportion increased correspondingly. Thus, it can be concluded that students prefer a relatively cold indoor environment.
The IAQ also influences the overall comfort sensations of the students. As shown in Figure 5, in total, the number of students voting “Very fresh”, “Fresh”, “Neutral”, “Stuff”, and “Very stuff” were 32, 179, 314, 101, and 16, respectively. The corresponding proportions were 5.0%, 27.9%, 48.9%, 15.7%, and 2.5%, respectively. The total proportions of “Stuff” and “Very stuff” were less than 20%, indicating that most students accepted the IAQ of the target classroom.
Any individual IEQ aspect cannot influence the overall indoor comfort significantly. However, it was found that the indoor comfort sensations tend to be worse if any individual IEQ aspect was extremely terrible. As shown in Figure 5, the TS scale “Hot” is an extremely terrible sensation, and the “Not comfort” proportion exceeded over 50%. Besides, in the classification of “Hot” and “Cold”, compared with voting results of “Cool”, “Neutral”, and “Warm”, the “Comfort” and “Not comfort” proportions were the lowest and highest, respectively. The “Very stuff” indicates that students think the IAQ was unacceptable, and the “Not comfort” proportion exceeded 50%. Overall, every indoor environmental quality aspect should be kept at acceptable levels and prevented from being extremely terrible to provide a comfortable indoor environment.
3.3. Analysis of the Relative Significance of IAQ and TC
Overall, the TS interacts significantly with AS due to the operation of the HVAC system. The relationships between TS and AS and their relative significance to students are investigated in this section. To better qualify the students’ priority perceptions of the TS and AS, the AS performances under each scale of TS are discussed. Figure 6a shows the AS under different TS. Figure 6b–f show the comfort proportions under different AS and TS.
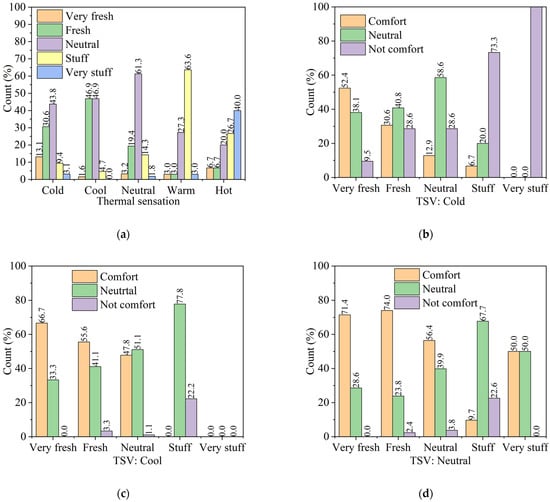
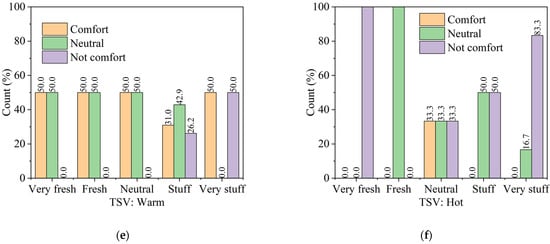
Figure 6.
Voting results for AS and TS. (a) Overall AS voting results; (b) Comfort proportions of AS under the TS “Cold”; (c) Comfort proportions of AS under the TS “Cool”; (d) Comfort proportions of AS under the TS “Neutral”; (e) Comfort proportions of AS under the TS “Warm”; (f) Comfort proportions of AS under the TS “Hot”.
The total proportions of “Very fresh”, “Fresh”, and “Neutral” are defined as acceptable AS proportions, while the rest scales are defined as unacceptable AS proportions. As shown in Figure 6a, when the TS was “Cold”, “Cool”, “Neutral”, “Warm”, and “Hot”, the corresponding acceptable AS proportions were 87.5%, 95.3%, 83.9%, 33.3%, and 33.3%, respectively. The acceptable AS proportions of “Cold” and “Cool” voted by students were huger than those of “Warm” and “Hot”. Thus, it can be concluded that a relatively cool environment can improve AS and the durability of terrible IAQ.
The summarized results generally suggested that a cold indoor environment improves AS for students. The proportions of AS scale “Neutral” under TS scales “Cold”, “Cool”, and “Neutral” were higher than those on scales “Warm” and “Hot”. On the TS scale “Cold”, 43.75% of students voted “Neutral” for AS, followed by “Fresh” (30.63%), “Very fresh” (13.13%), “Stuff” (9.38%), and “Very stuff” (3.13%). The unacceptable AS proportions were smaller than 25%. For students who voted for “Cool”, nearly half of them (46.88%) felt that the AS was “Neutral” and “Fresh”, followed by “Stuff” (4.69%), “Very fresh” (1.56%), and “Very stuff” (0.0%). The unacceptable AS proportions were smaller than 5%. In the TS scale “Neutral”, the proportion of AS scale “Neutral” peaked at the maximum. In contrast, the proportion of “Very fresh” and “Fresh” decreased, which can be attributed to the relatively hotter feeling of TS. As the indoor TS got hotter, the proportion of AS “Stuff” and “Very stuff” increased correspondingly.
In contrast, the proportion of AS scale “Stuff” in the TS scale “Warm” and the proportion of AS scale “Very stuff” in the TS scale “Hot” were huger than those in other TS scales. Noticeably, the proportion of AS scale “Very stuff”, as the extremely terrible perception, reached the maximum in the TS scale “Hot”. Specifically, in the TS scales “Warm” and “Hot”, the unacceptable AS proportions were both 66.67%, indicating that the indoor environment was unacceptable for most students.
When the TS was “Cold” as shown in Figure 6b, even though the AS was “Very fresh”, the students still felt “Not comfort” with a proportion of 9.0%. As the AS tended to be terrible, the proportions of “Not comfort” got higher correspondingly, increasing from 9.0% to 100.0%. While the proportions of “Comfort” decreased gradually, declining from 52.4% to 6.7%. In AS classification “Very stuff”, all the students voted “Not comfort”. In Figure 6c–e, when the TS was “Cool”, “Neutral”, and “Warm”, the proportions of “Not comfort” in each AS classification were kept at low levels. For students who voted “Hot” in Figure 6f, the “Not comfort” proportions in each classification were kept at relatively high levels, indicating that the terrible thermal conditions influence the AS significantly, causing the bad sense of the IAQ.
Due to the influences of the weather conditions, the configuration of the buildings, personal conditions, et al., the significance of TS and AS are different in different regions. Thus, the relative importance of TC and IAQ in Hong Kong is discussed. Two groups (“Y” and “N”) are applied for both TS and AS [3] to discuss the relative significances further. It should be noted that both the TS and AS are classified into five scales in the above sections. In each scale, it is grouped as “Y” if the corresponding comfort proportion is over 50%, and the rest scales are grouped as “N”. For instance, the proportion of TS “Neutral” exceeded 50%. Thus, it was defined as “Y”. While the “Cold”, “Cool”, “Warm”, and “Hot” were grouped and defined as “N”. For AS voting results, “Very fresh” and “Fresh” were grouped as “Y”, and the rest scales were grouped as “N”. Then, based on these “Y” and “N”-related categorizations, all the voting results were classified into four groups, as shown in Figure 7.
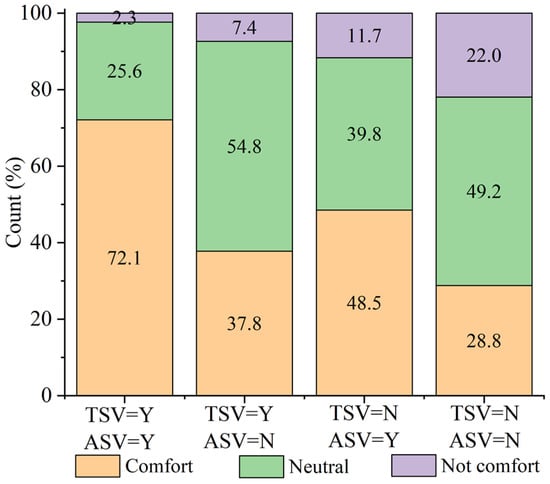
Figure 7.
Proportions of comfort sensations in four groups.
When the TS and AS were both “Y”, the comfort proportion reached 72.0%, and the “Neutral” and “Not comfort” proportions were 25.6% and 2.3%, respectively. Comfortable indoor thermal conditions with better IAQ can improve indoor comfort sensations. When the TS was “N” and AS was “Y”, the comfort proportion reached 48.5%. In contrast, When the TS was “Y” and AS was “N”, the comfort proportion was only 37.8%. It can be concluded that the students were more sensitive to the AS rather than the TS.
4. Comfort Model Establishment and Discussion
The TS and AS significantly interact with the various indoor parameters, and some indoor parameters can simultaneously influence the TS and AS. Deeply and qualitatively understanding the relationships between indoor comfort sensations and the various indoor parameters benefit in predicting the comfort sensations of the students accurately. Thus, based on the collected questionnaires and measured indoor real-time data, the comfortable indoor Top, CO2, and RH are investigated in this section. The relative significance of TS and AS is qualified, and comfort regression models to predict comfort sensations are also obtained.
To qualify the relationships between the comfort parameters and comfort sensations and obtain the regression models, each item is represented using different values, shown in Table 3.
Table 3.
The specifications of the score scaling.
4.1. Physical Variable-Based Models
Linear regression of comfort sensation and indoor Top, CO2, and RH is one of the useful methods for evaluating comfort levels for the target spaces. This section explores the relationship between comfort sensations as the dependent variable with individual aspects of IEQ as the independent variable. Regression equations, p-value, and R2 values for fitted regressions are demonstrated in Table 4. As illustrated in Table 4, operative temperature Top, CO2 and RH are correlated with overall comfort. Noticeably, The R2 value shows the deviation levels between the observed and calculated data. The p-value is the probability of obtaining a test result at least as extreme as the observed result.
Table 4.
Physical variable-based regression models.
In this study, it was found that the R2 of fitting results of PM2.5 and TVOC were smaller than 0.001, allowing us to exclude them from further discussion in this section. Based on the minimum and maximum values in this study, ranges of Top, CO2, and RH were chosen, i.e., 20.1 to 27.2 °C, 575.9 to 1652.4 ppm, and 61.7 to 78.6%, respectively.
For indoor parameters, changes in comfort sensations were mainly interpreted by Top and RH because of the higher R2 values. Top accounted for 50% of changes in overall comfort (R2 = 0.5), CO2 for 20% (R2 = 0.2), and RH for 19% (R2 = 0.19). It can be concluded that Top is the most significant individual indoor parameter influencing comfort sensation. According to the regression, the comfort temperature was determined by setting the thermal sensation to a value smaller than 1.5. Thus, the range of comfortable temperatures set at 21.5–23.8 °C, while the ranges of CO2 and RH were set at <1095 ppm and 47–63.5%, respectively.
Multilinear regression models were obtained to find relationships among multiple correlated variables and overall comfort, as listed in Equation (4) in Table 4.
The fitting result illustrates that when the variables had been integrated, their correlations and regressions changed correspondingly, which can be attributed to the fact that independent variables affect each other. The regression coefficient explains how an independent variable affects a dependent variable quantitatively. Using Equation (4), the relative significance of Top, CO2, and RH were evaluated. Obviously, Top (0.52) had a more evident impact on overall comfort sensations, followed by CO2 (0.28) and RH (0.18). The reason that Top had the highest weight can be attributed to the fact that the indoor temperature influences TS and AS.
4.2. Comfort Sensation-Based Models
Compared with the physical indoor parameters, TS or AS can reflect the general comfort sensations of an indoor environment. The relationship between comfort sensations, TS and AS is discussed in this section, and Figure 8 shows the result of our survey.
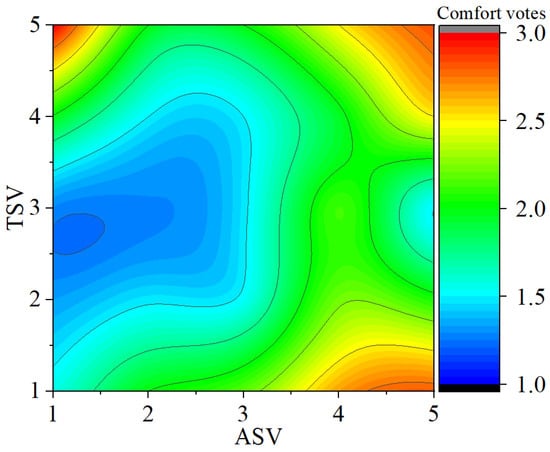
Figure 8.
Comfort voting results with TSV and ASV.
The results in Figure 8 show that students prefer a relatively cold indoor environment. According to the participating students, a TS of 2.5–2.9 and an AS of 1–1.5 are most comfortable. Moreover, it was also found that dissatisfaction with only TS or AS does not result in significant overall discomfort unless that value is extremely unacceptable. For instance, when the TS ranged from 1.5 to 4, even if the AS was 5, most students still voted 1.5 to 2.5 for indoor comfort sensation. However, when the TS was 5, even if the AS was identified as 1, students felt uncomfortable, with comfort sensation votes of 3. When the TS and AS were both unacceptable, e.g., a TS of 5 with AS of 5, students had a high probability of feeling uncomfortable.
Based on the voting results, it was found that AS has a linear relationship with comfort sensation, but TS does not. Thus, linear regression was applied for AS, and quadratic regression was used for TS. Moreover, a multiple nonlinear regression model considering the overall relationship between comfort sensations, TS, and AS was obtained. Table 5 lists the three regression models.
Table 5.
Comfort sensation-based models.
TS accounts for 82% of changes in overall comfort (R2 = 0.82), and AS accounts for 98% of comfort votes (R2 = 0.98). It can be concluded that AS is the parameter which most significantly influenced the students’ comfort sensations. Using these regressions, the comfort TS was determined by setting the comfort sensation to below 1.5. Thus, the comfort TS and AS ranges were 2.3–3.1 and 1–1.55, respectively. Equation (7) determined the relationship between comfort sensations, TS, and AS. The coefficient value was higher for AS (0.32) than TS (0.18), which suggests that AS significantly impacts overall comfort more than TS. Therefore, to guarantee comfort, control of AS should be given priority.
4.3. Discussion
The indoor parameters are significantly related to the types of building and local weather conditions. It was pointed out that it is impossible to compare the prediction equations directly. However, it is possible to compare acceptable ranges with those identified in different studies. Compared with the study for small classrooms conducted by Yang et al. [33] (comfort range: 23.3–27.8 °C, <654.3 ppm), the comfort temperature range was relatively lower (21.5–23.8 °C), and that of CO2 (<1095 ppm) was higher. It can be concluded that a cold indoor environment could improve occupants’ ability to tolerate bad IAQ. Moreover, it also can be concluded that the comfort levels are different across classrooms with different sizes. Compared with Hong Kong’s recommended indoor guidelines, listed in Table 1, the comfort ranges of indoor temperature, CO2, and RH were smaller but within the recommended ranges. For thermal comfort, overheating and overcooling should be avoided. For IAQ, over a short period (5 min), students did not feel comfortable with a CO2 value of over 1095 ppm, even though this is lower than the recommended value of 30,000 ppm (15 min averaged) and 2500 ppm (1 h averaged). Using the new recommended value can avoid insufficient ventilation and can also keep RH in the acceptable range.
As mentioned previously, indoor comfort sensation refers to different parameters influencing at least one IEQ aspect. It was pointed out that fitting multiple regressions can clarify the influences of each parameter and their interferences. Therefore, a deep understanding of the significant weights of the various aspects of IEQ can improve comfort. In this section, the models proposed in this study are compared with previously published models, which focused on educational, commercial and residential buildings. Table 6 shows the comparison results.
Table 6.
Regression models regarding TS and AS.
The weighting coefficients comprised objective ones, i.e., different sorts of buildings, ventilation types, climates, etc., and subjective ones, i.e., gender, age, clothing, activity level, etc. Thus, as shown in Table 6, the weights of TS and AS changed almost randomly for different buildings with various heating, AC, and ventilation systems. Specifically, it was found that there were evident differences between commercial and educational buildings in the same country (Serbia) regarding TS and AS weights (TS of 0.29 and AS of 0.35 for offices; TS of 0.31 and AS of 0.25 for university classrooms). By contrast, compared with Serbia, the weights for TS and AS for offices and educational buildings in Hong Kong showed the opposite trend. In detail, occupants in offices were found to be more sensitive to TS, while university students prefered better AS (TS of 0.31 and AS of 0.25 for offices; TS of 0.18 and AS of 0.32 for university classrooms). The deviations in the weights of TS and AS imply that occupants have different IEQ preferences depending on the type of building and the local meteorological conditions. Moreover, even within the same country, such as Italy, the weights differed among educational level (TS of 0.5 and AS of 0.32 for secondary school; TS of 0.02 and AS of 0.12 for University).
Given the soaring developments in computer science, it is now easier to get a prediction model for TC, AC, and overall comfort sensations. Thus, obtaining a daily-based IEQ model for a particular building is suggested, instead of using the currently published model.
5. Conclusions
This study investigated the overall comfort experienced by university students with different thermal conditions and CO2 concentrations in a mechanically ventilated classroom in a tropical region with low background noise and pollution levels. We monitored the indoor environment parameters in real time, including indoor air temperature, mean radiant temperature, relative humidity, CO2, and air velocity. At the same time, an online-based questionnaire survey regarding student comfort sensations was carried out. In total, 655 effective questionnaires were collected. The regression models to predict comfort sensations were obtained based on the questionnaires and measured indoor data. The main results are as follows:
(1) According to the analysis results of the questionnaires, the “Not comfort” proportion in TS scales “Cool”, “Neutral”, and “Warm” were 3.1%, 5.1%, and 19.0%, respectively, indicating that students prefered a relatively cold indoor environment. Moreover, cold indoor conditions could improve students’ ability to tolerate high CO2 concentrations.
(2) The most important parameters on overall comfort sensation were Top, followed by CO2 and RH. Top accounted for 50% of changes in overall comfort (R2 = 0.5), while CO2 only accounted for 20% (R2 = 0.2), and RH for 19% (R2 = 0.19). In the multiple regression, the corresponding weights were 0.52, 0.28, and 0.18. It can be concluded that the interference among the different factors cannot be ignored.
(3) Using the regressions, a comfortable temperature was determined by setting the overall comfort sensation to smaller than 1.5. Thus, the range of Top was 21.5–23.8 °C. Meanwhile, the comfort ranges of CO2 and RH were found to be <1095 ppm and 47–63.5%, respectively. These recommended values are smaller than the official values released by the Hong Kong government. Using more exact threshold values could further improve indoor comfort levels, especially for short-term assessments.
(4) IAQ and thermal environment should be considered together to avoid discomfort. Using these regressions, the comfort TS region was determined by setting the overall comfort sensation to be smaller than 1.5. Thus, the range of the comfort TS and AS were 2.3–3.1 and 1–1.55, respectively.
(5) Investigating the relevant importance of factors on occupant comfort provides designers with suggestions on which building management should be based. The coefficient value was higher for AS (0.32) than TS (0.18), which suggests that AS impacts overall comfort more than TS. It was also found that the relative significances of AS and TS differed from building to building. Thus, it is necessary to get prediction models for each building.
This study has some limitations due to the social distance policies implemented during the COVID-19 pandemic. In detail, the number of students that completed the questionnaire survey was relatively low. The survey was only conducted in a large classroom space. Thus, the obtained results are not representative of other kinds of rooms. The room selected in this study was mechanical-ventilated throughout the year. Therefore, the obtained results are not intended to serve as a reference for naturally ventilated rooms. Moreover, comfort sensations can also vary according to gender; however, this was not considered in our study due to the insufficient samples. In the future, we will apply the questionnaire survey in different kinds of rooms in university buildings.
Author Contributions
Writing—original draft preparation, Investigation, L.-R.J.; Formal Analysis—Q.-Y.L.; Writing—review & editing—X.C.; Supervision, Project administration—C.-C.L.; Supervision, Conceptualization, Methodology, Funding acquisition, Project administration—J.H. All authors have read and agreed to the published version of the manuscript.
Funding
This work was financially supported by the University Grants Council of the Hong Kong Special Administrative Region, China (UGC/FDS16/P01/20) and Hong Kong Metropolitan University Research Grant (No. 2020/1.3).
Institutional Review Board Statement
Not applicable.
Informed Consent Statement
Not applicable.
Conflicts of Interest
The authors declare no conflict of interest.
Abbreviation
| AC | Acoustic comfort |
| AS | Air sensation |
| ASV | Air sensation voting |
| HVAC | Heating, ventilation and air conditioning |
| IAQ | Indoor air quality |
| IEQ | Indoor environmental quality |
| MV | Mechanical ventilation |
| NV | Natural ventilation |
| RH | Relative humidity |
| TC | Thermal comfort |
| TS | Thermal sensation |
| TSV | Thermal sensation voting |
| VC | Visual comfort |
Appendix A
| Questionnaire Questions | ||||
| How do you feel about the thermal conditions? | ||||
| □ Cold | □ Cool | □ Neutral | □ Warm | □ Hot |
| How do you feel about indoor air quality? | ||||
| □ Very stuff | □ Stuff | □ Neutral | □ Fresh | □ Very fresh |
| How do you feel about the overall comfort? | ||||
| □ Comfort | □ Neutral | □ Not Comfort | ||
References
- Heinzerling, D.; Schiavon, S.; Webster, T.; Arens, E. Indoor environmental quality assessment models: A literature review and a proposed weighting and classification scheme. Build. Environ. 2013, 70, 210–222. [Google Scholar] [CrossRef]
- Chithra, V.; Nagendra, S.S. Indoor air quality investigations in a naturally ventilated school building located close to an urban roadway in Chennai, India. Build. Environ. 2012, 54, 159–167. [Google Scholar] [CrossRef]
- Korsavi, S.S.; Montazami, A.; Mumovic, D. The impact of indoor environment quality (IEQ) on school children’s overall comfort in the UK; a regression approach. Build. Environ. 2020, 185, 107309. [Google Scholar] [CrossRef]
- Kim, J.; Hong, T.; Jeong, J.; Lee, M.; Lee, M.; Jeong, K.; Koo, C.; Jeong, J. Establishment of an optimal occupant behavior considering the energy consumption and indoor environmental quality by region. Appl. Energy 2017, 204, 1431–1443. [Google Scholar] [CrossRef]
- Wang, C.; Zhang, F.; Wang, J.; Doyle, J.K.; Hancock, P.A.; Mak, C.M.; Liu, S. How indoor environmental quality affects occupants’ cognitive functions: A systematic review. Build. Environ. 2021, 193, 107647. [Google Scholar] [CrossRef]
- Fisk, W.J.; Singer, B.C.; Chan, W.R. Association of residential energy efficiency retrofits with indoor environmental quality, comfort, and health: A review of empirical data. Build. Environ. 2020, 180, 107067. [Google Scholar] [CrossRef]
- Geng, Y.; Ji, W.; Wang, Z.; Lin, B.; Zhu, Y. A review of operating performance in green buildings: Energy use, indoor environmental quality and occupant satisfaction. Energy Build. 2018, 183, 500–514. [Google Scholar] [CrossRef]
- Fransson, N.; Västfjäll, D.; Skoog, J. In search of the comfortable indoor environment: A comparison of the utility of objective and subjective indicators of indoor comfort. Build. Environ. 2007, 42, 1886–1890. [Google Scholar] [CrossRef]
- Almeida, R.M.S.F.; Freitas, V.P.D. Indoor environmental quality of classrooms in Southern European climate. Energy Build. 2014, 81, 127–140. [Google Scholar] [CrossRef]
- Astolifi, F.P.A. Subjective and objective assessment of acoustical and overall environmental quality in secondary school classrooms. J. Acoust. Soc. Am. 2008, 123, 163–173. [Google Scholar] [CrossRef]
- Pereira, P.F.D.C.; Broday, E.E. Determination of Thermal Comfort Zones through Comparative Analysis between Different Characterization Methods of Thermally Dissatisfied People. Buildings 2021, 11, 320. [Google Scholar] [CrossRef]
- Martínez-Comesaña, M.; Eguía-Oller, P.; Martínez-Torres, J.; Febrero-Garrido, L.; Granada-Álvarez, E. Optimisation of thermal comfort and indoor air quality estimations applied to in-use buildings combining NSGA-III and XGBoost. Sustain. Cities Soc. 2022, 80, 103723. [Google Scholar] [CrossRef]
- Carreto-Hernandez, L.; Moya, S.; Varela-Boydo, C.; Francisco-Hernandez, A. Studies of ventilation and thermal comfort in different wind tower-room configurations considering humidification for a warm climate of Mexico. J. Build. Eng. 2022, 46, 103675. [Google Scholar] [CrossRef]
- Alwetaishi, M. Use of Underground Constructions Enhanced with Evaporative Cooling to Improve Indoor Built Environment in Hot Climate. Buildings 2021, 11, 573. [Google Scholar] [CrossRef]
- Nejat, P.; Jomehzadeh, F.; Majid, M.Z.B.A.; Yusof, M.B.M.; Zeynali, I. Windcatcher as sustainable passive cooling solution for natural ventilation in hot humid climate of Malaysia. IOP Conf. Ser. Mater. Sci. Eng. 2019, 620, 012087. [Google Scholar] [CrossRef]
- Perez-Lombard, L.; Ortiz, C.P.J. A review on buildings energy consumption information. Energy Build. 2008, 40, 394–398. [Google Scholar] [CrossRef]
- Chua, K.; Chou, S.; Yang, W.; Yan, J. Achieving better energy-efficient air conditioning—A review of technologies and strategies. Appl. Energy 2013, 104, 87–104. [Google Scholar] [CrossRef]
- Che, W.; Tso, C.Y.; Sun, L.; Ip, D.Y.; Lee, H.; Chao, Y.H.C.; Lau, A.K. Energy consumption, indoor thermal comfort and air quality in a commercial office with retrofitted heat, ventilation and air conditioning (HVAC) system. Energy Build. 2019, 201, 202–215. [Google Scholar] [CrossRef]
- Zhang, F.; Haddad, S.; Nakisa, B.; Rastgoo, M.N.; Candido, C.; Tjondronegoro, D.; de Dear, R. The effects of higher temperature setpoints during summer on office workers’ cognitive load and thermal comfort. Build. Environ. 2017, 123, 176–188. [Google Scholar] [CrossRef]
- Frontczak, M.J.; Schiavon, S.; Goins, J.; Arens, E.; Zhang, H.; Wargocki, P. Quantitative relationships between occupant satisfaction and satisfaction aspects of indoor environmental quality and building design. Indoor Air 2012, 22, 119–131. [Google Scholar] [CrossRef]
- Shum, C.; Alipouri, Y.; Zhong, L. Examination of human interaction on indoor environmental quality variables: A case study of libraries at the University of Alberta. Build. Environ. 2022, 207, 108476. [Google Scholar] [CrossRef]
- Fadeyi, M.O.; Alkhaja, K.; Bin Sulayem, M.; Abu-Hijleh, B. Evaluation of indoor environmental quality conditions in elementary schools׳ classrooms in the United Arab Emirates. Front. Arch. Res. 2014, 3, 166–177. [Google Scholar] [CrossRef]
- Tang, H.; Liu, X.; Geng, Y.; Lin, B.; Ding, Y. Assessing the perception of overall indoor environmental quality: Model validation and interpretation. Energy Build. 2022, 259, 111870. [Google Scholar] [CrossRef]
- Reda, I.; AbdelMessih, R.N.; Steit, M.; Mina, E.M. Experimental assessment of thermal comfort and indoor air quality in worship places: The influence of occupancy level and period. Int. J. Therm. Sci. 2022, 179, 107686. [Google Scholar] [CrossRef]
- Heracleous, C.; Michael, A. Experimental assessment of the impact of natural ventilation on indoor air quality and thermal comfort conditions of educational buildings in the Eastern Mediterranean region during the heating period. J. Build. Eng. 2019, 26, 100917. [Google Scholar] [CrossRef]
- Yüksel, A.; Arıcı, M.; Krajčík, M.; Civan, M.; Karabay, H. Energy consumption, thermal comfort, and indoor air quality in mosques: Impact of COVID-19 measures. J. Clean. Prod. 2022, 354, 131726. [Google Scholar] [CrossRef]
- Jia, L.-R.; Han, J.; Chen, X.; Li, Q.-Y.; Lee, C.-C.; Fung, Y.-H. Interaction between Thermal Comfort, Indoor Air Quality and Ventilation Energy Consumption of Educational Buildings: A Comprehensive Review. Buildings 2021, 11, 591. [Google Scholar] [CrossRef]
- Kwok, H.H.; Cheng, J.C.; Li, A.T.; Tong, J.C.; Lau, A.K. Impact of shaft design to thermal comfort and indoor air quality of floors using BIM technology. J. Build. Eng. 2022, 51, 104326. [Google Scholar] [CrossRef]
- Cheng, J.C.; Kwok, H.H.; Li, A.T.; Tong, J.C.; Lau, A.K. BIM-supported sensor placement optimization based on genetic algorithm for multi-zone thermal comfort and IAQ monitoring. Build. Environ. 2022, 216, 108997. [Google Scholar] [CrossRef]
- Qin, C.; Lu, W.-Z. Effects of ceiling exhaust location on thermal comfort and age of air in room under impinging jet supply scheme. J. Build. Eng. 2021, 35, 101966. [Google Scholar] [CrossRef]
- Tian, X.; Cheng, Y.; Liu, J.; Lin, Z. Evaluation of sidewall air supply with the stratified indoor environment in a consultation room. Sustain. Cities Soc. 2021, 75, 103328. [Google Scholar] [CrossRef]
- Li, Z.; Zhang, H.; Juan, Y.-H.; Wen, C.-Y.; Yang, A.-S. Effects of building setback on thermal comfort and air quality in the street canyon. Build. Environ. 2022, 208, 108627. [Google Scholar] [CrossRef]
- Yang, D.; Mak, C.M. Relationships between indoor environmental quality and environmental factors in university class-rooms. Build. Environ. 2020, 186, 107331. [Google Scholar] [CrossRef]
- Standard No: GB/T 18883-2002; Ministry of Environmental Protection and Ministry of Health, Indoor Air Quality Standard. AQSIQ (Administration of Quality Supervision, Inspection and Quarantine): Beijing, China, 2002.
- Charles, K.E.; Magee, R.J.; Won, D.; Lusztyk, E. Indoor Air Quality Guidelines and Standards; NRC Institute for Research in Construction, National Research Council Canada: Ottawa, ON, Canada, 2005. [Google Scholar]
- Colbeck, I. Indoor Air Quality in Asian Countries. Agric. Food Secur. 2012, 28–29. Available online: https://www.researchgate.net/publication/268153922_Indoor_air_quality_in_Asian_Countries (accessed on 12 July 2014).
- ANSI/ASHRAE. Ventilation for Acceptable Indoor Air Quality; American Society of Heating, Refrigerating and Air–Conditioning Engineers, INC: Atlanta, GA, USA, 2004. [Google Scholar]
- FiSIAQ (Finnish Society of Indoor Air Quality and Climate). Classification of Indoor Climate 2000, Target Values Design Guidance and Product Requirements; FiSIAQ: Espoo, Finland, 2001. [Google Scholar]
- HKSAR (The Government of the Hong Kong Special Administrative Region). A Reference Note on Occupational Exposure Limits for Chemical Substances in the Work Environment Occupational Safety and Health Branch, The Labour Department; HKSAR: Hong Kong, China, 1998. [Google Scholar]
- Institute of Environmental Epidemiology. Guidelines for Good Indoor Air Quality in Office Premises; Ministry of the Environment, Singapore: Singapore, 1996. [Google Scholar]
- ACGIH (American Conference of Governmental Industrial Hygienists). Air Sampling Instruments for Evaluation of Atmospheric Contaminants; ACGIH: Washington, DC, USA, 1995. [Google Scholar]
- Close Air Duct Cleaners, 2013. Fact Sheet: Indoor Air Quality Standards. Available online: http://www.airductcleanersusa.com/indoor-air-quality-standards (accessed on 12 July 2014).
- OHSC (The National Ocupational Health and Safety Commission). Exposure Standards for Atmospheric Contaminants in the Occupational Environment; Worksafe Australia: Sydney, Australia, 1995. [Google Scholar]
- HSC (Health and Safety Commission). EH40/2005 Workplace Exposure Limits; The Control of Substances Hazardous to Health Regulations; TSO (The Stationery Office): Norwich, UK, 2011; Available online: https://www.sgul.ac.uk/about/our-professional-services/safety-health-and-environment/documents/eh40-workplace-exposure-limits.pdf (accessed on 12 September 2014).
- HKSAR (The Government of the Hong Kong Special Administrative Rgion). A Guide on Indoor Air Quality Certification Scheme for Offices and Public Places; Indoor Air Quality Management Group: Hong Kong, China, 2019. Available online: https://www.iaq.gov.hk/wp-content/uploads/2021/04/new-iaq-guide_eng.pdf (accessed on 12 July 2014).
- HKSAR (The Government of the Hong Kong Special Administrative Rgion). Guidance Notes for the Management of Indoor Air Quality in Offices and Public Places; Indoor Air Quality Management Group: Hong Kong, China, 2019. Available online: https://www.iaq.gov.hk/wp-content/uploads/2021/04/gn_officeandpublicplace_eng-2019.pdf (accessed on 12 April 2021).
- Fanger, P.O. Thermal Comfort: Analysis and Applications in Environmental Engineering; Danish Technical Press: Copenhagen, Denmark, 1970. [Google Scholar]
- International Organization for Standardization. ISO 7730, Ergonomics of the Thermal Environment—Analytical Determination and Interpretation of Thermal Comfort Using Calculation of the PMV and PPD Indices and Local Thermal Comfort Criteria Genève; ISO: Geneva, Switzerland, 2005. [Google Scholar]
- Singh, A.; Singh, H.; Singh, S.; Sawhney, R. Numerical calculation of psychrometric properties on a calculator. Build. Environ. 2002, 37, 415–419. [Google Scholar] [CrossRef]
- Wolkoff, P. Indoor air humidity, air quality, and health—An overview. Int. J. Hyg. Environ. Health 2018, 221, 376–390. [Google Scholar] [CrossRef] [PubMed]
- Fisk, W.J. The ventilation problem in schools: Literature review. Indoor Air 2017, 27, 1039–1051. [Google Scholar] [CrossRef]
- Demanega, I.; Mujan, I.; Singer, B.C.; Anđelković, A.S.; Babich, F.; Licina, D. Performance assessment of low-cost environmental monitors and single sensors under variable indoor air quality and thermal conditions. Build. Environ. 2021, 187, 107415. [Google Scholar] [CrossRef]
- Standard 55—2020 Thermal Environmental Conditions for Human Occupancy; ASHRAE: Atlanta, GA, USA, 2020.
- Chiang, C.-M.; Lai, C.-M. A study on the comprehensive indicator of indoor environment assessment for occupants’ health in Taiwan. Build. Environ. 2002, 37, 387–392. [Google Scholar] [CrossRef]
- Wong, L.; Mui, K.; Hui, P. A multivariate-logistic model for acceptance of indoor environmental quality (IEQ) in offices. Build. Environ. 2008, 43, 1–6. [Google Scholar] [CrossRef]
- Cao, B.; Ouyang, Q.; Zhu, Y.; Huang, L.; Hu, H.; Deng, G. Development of a multivariate regression model foroverall satisfaction in public buildings based on field studies in Beijing and Shanghai. Build. Environ. 2012, 47, 394–399. [Google Scholar] [CrossRef]
- Mujan, I.; Licina, D.; Kljajić, M.; Čulić, A.; Anđelković, A.S. Development of indoor environmental quality index using a low-cost monitoring platform. J. Clean. Prod. 2021, 312, 127846. [Google Scholar] [CrossRef]
- BREEAM. Building Research Establishment Environmental Assessment Method; BRE Group: Watford, UK, 2017. [Google Scholar]
- The U.S. Green Building Council. LEED Reference Guide for Building Design and Construction; U.S. Green Building Council: Washington, DC, USA, 2019. [Google Scholar]
- Wei, W.; Wargocki, P.; Zirngibl, J.; Bendžalová, J.; Mandin, C. Review of parameters used to assess the quality of the indoor environment in Green Building certification schemes for offices and hotels. Energy Build. 2020, 209, 109683. [Google Scholar] [CrossRef]
- Fassio, F.; Fanchiotti, A.; Vollaro, R.D.L. Linear, Non-Linear and Alternative Algorithms in the Correlation of IEQ Factors with Global Comfort: A Case Study. Sustainability 2014, 6, 8113–8127. [Google Scholar] [CrossRef]
- Yee, T.C. Indoor environmental quality (IEQ): A case study in taylor’s universitity, Malaysia. Int. J. Appl. Sci. Eng. 2014, 5, 1–11. [Google Scholar]
- Ghita, S.A.; Catalina, T. Energy efficiency versus indoor environmental quality in different Romanian countryside schools. Energy Build. 2015, 92, 140–154. [Google Scholar] [CrossRef]
- Mihai, T.; Iordache, V. Determining the Indoor Environment Quality for an Educational Building. Energy Procedia 2016, 85, 566–574. [Google Scholar] [CrossRef]


Publisher’s Note: MDPI stays neutral with regard to jurisdictional claims in published maps and institutional affiliations. |
© 2022 by the authors. Licensee MDPI, Basel, Switzerland. This article is an open access article distributed under the terms and conditions of the Creative Commons Attribution (CC BY) license (https://creativecommons.org/licenses/by/4.0/).