1. Introduction
1.1. Background
The falling weight deflectometer (FWD) is a non-destructive testing device used to evaluate the physical properties of pavements. During the FWD test, the pavement surface is subjected to a load pulse produced by dropping a large weight onto a buffered load plate, as shown in
Figure 1. The load level, load duration, and load area are adjusted to simulate the actual loading caused by a rolling vehicle wheel traveling on an in-service pavement. A series of deflection sensors are used to measure the pavement surface deformation in response to the load pulse. The sensors are installed at various distances from the load plate. Typically, the offsets of sensors are 0, 200, 300, 450, 600, 900, 1200, and 1500 mm from the load plate center, respectively. The acquired deflection data can be used to evaluate the compaction quality and uniformity of the subgrade, and estimate the pavement’s structural capacity. Currently, the inverse analysis or back-calculation process is widely used to calculate the pavement layer moduli and stiffnesses based on FWD measurements [
1,
2]. Mechanical models [
3], mechanistic–empirical methods [
4], computer programs such as EVERCALC, ELMOD, MODCOMP, MODULUS, MICHBACK, etc. [
5], among which EVERCALC and MODCOMP can be primarily used to back-calculate the LTPP pavement sections, and some novel approaches like Artificial Neural Network [
6,
7], and Recurrent Neural Network and Wide & Deep structure [
8] can be used to back-calculate pavement layer moduli. The results have been useful in evaluating the structural condition of in-service pavements, predicting the pavement performance, and determining treatment strategies.
1.2. Influencing Factors of Deflections
Since deflections have been extensively used in the assessment of pavement structural conditions, the data quality of FWD measurements may influence the back-calculation accuracy of pavement structural parameters. Many studies have shown the factors influencing deflection measurements. Mehta and Roque [
10] indicated that the pavement structural characteristics, including milling operations, damage layers, variation in layer thickness, and temperature, had a significant effect on the deflection data. Nobakht et al. [
11] developed a rehabilitation selection methodology based on a damage ratio calculated from FWD data and two rehabilitation categories including different overlay thicknesses were considered as alternatives for pavement sections with damage ratios between 0.3 and 0.7. Besides, the crack type and crack width affected the deflection basin. Ma et al. [
12] found that pavement cracks would make the deflection basin steeper. The drop load of FWD also affected the deflection measurements [
1,
13]. The effects of moisture content of subgrade soil and pavement temperature on the pavement structural response, and the effects of pavement surface temperature, air temperature, and precipitation on FWD measurements were analyzed and quantified [
14,
15]. The results showed that temperature had the most significant effect on the measured deflections. Wang et al. [
16] analyzed the influence of material property, layer thickness, loading magnitude, and pavement temperature on the pavement surface deflections through finite element simulations.
According to China’s code “Specifications for Design of Highway Asphalt Pavement” [
17], deflection is no longer a pavement design index, but it is still an important construction acceptance index. In the previous version of Specifications for Design of Highway Asphalt Pavement (JTG D50-2006), design deflection was determined on the basis of highway classification, cumulative Equivalent Single Axle Load (ESAL), layer type, and base type. The temperature correction of FWD deflection value for the construction acceptance of asphalt pavement depends on whether the asphalt layer thickness is greater than 5 cm or not. The temperature correction coefficient is related with the pavement surface temperature and asphalt layer thickness. The calculated deflection value is also associated with the temperature correction coefficient, seasonal influence coefficient, and moisture influence coefficient. Therefore, the influence of the above factors on the deflection should be analyzed and quantified.
1.3. Machine Learnings
With the rapid development and wide use of data science, an increasing number of machine learning methods are being used in the analysis of pavement engineering, including pavement performance evaluation, performance prediction, distress recognition, automatic driving, etc. Machine learning has exhibited powerful and excellent prediction capability. For the use of deflection data, ANNs can be established to predict the pavement layer moduli, interlayer condition, tensile strains at the bottom of asphalt layer, compressive strains on the top of subgrade, deviator stresses on the top of subgrade, Poisson’s ratio, and layer thickness [
7,
18,
19]. Wang et al. [
16] employed the data obtained from finite element simulations to establish and train an ANN model and found that the prediction accuracy was better than that of traditional methods regarding FWD field measurements. Li and Wang [
20] used the ANN combined with genetic algorithm (GA) optimization to verify the database of pavement surface deflections and strains of different pavement structures, material properties, loadings, and temperatures. ANN has also been used to predict the two deflection basin parameters based on the input of pavement structural and functional characteristics, environmental factors, and subgrade soil attributes [
21]. Han et al. [
8] proposed a hybrid neural network structure, combined with Residual Neural Network, Recurrent Neural Network, and Wide & Deep (ResRNN–W&D) structure to analyze the layer moduli, and the ResRNN–W&D structure presented a stronger generalization ability than ANNs. Rabbi and Mishra [
22] determined the Deflection Basin Parameters (DBPs), such as base layer index, middle layer index, and lower layer index, using the measured deflection data. Haridas et al. [
23] developed a Deep Neural Network (DNN)-based approach to predict the deflection parameters through the data of roughness, traffic, pavement age, temperature, and climatic factors. The prediction accuracy of the DNN approach was about 82% for the test dataset.
More machine learning methods can be used effectively in other aspects of pavement engineering [
24]. Dong et al. [
25] adopted the classification and regression tree (CART) to quantify the effects of weather, traffic, materials, and construction practice factors on the effectiveness of pavement treatments. Gujar and Vakharia [
26] used a Support Vector Machine (SVM) to predict and validate the composition of mineral filler in the micro surfacing mix design. Random Forest can be used to estimate pavement international roughness index (IRI) considering the factors including distress measurements, traffic, climate, structural parameters, and maintenance data [
27], and to evaluate the importance of aggregate gradation, mixture volumetric parameters, asphalt binder properties, physical properties of hot-mix asphalt (HMA), age, and pavement thickness on the pavement performance [
28]. Zhang et al. [
29] proposed a Random Forest to predict the Pavement Condition Index (PCI) using the performance indices, pavement structure, traffic parameters, and meteorological data. The gradient boosted tree can be used to predict the IRI and PCI [
30], and determine the key factors affecting asphalt overlay performance including IRI, rutting, fatigue cracking, transverse cracking, and longitudinal cracking [
31]. Compared with traditional methods, machine learning methods have been demonstrated to be more effective approaches offering better performance.
1.4. Long-Term Pavement Performance (LTPP) Program
The Long-Term Pavement Performance (LTPP) program was started as a part of the Strategic Highway Research Program (SHRP) in 1987, and has been managed by the Federal Highway Administration (FHWA) since 1992. It aims to study the pavement performance and understand how and why pavements perform as they do. The performance data of more than 2000 pavement sections throughout the United States and Canada are collected and stored in the LTPP database. Over the past thirty years, the LTPP data have been demonstrated to be valuable in advancing pavement engineering technology. LTPP data can be used for the back-calculation of layer modulus [
5,
8], prediction of structural number [
32], investigation on pavement performance [
28], effectiveness evaluation of pavement maintenance [
25], and optimization of preventive maintenance strategy [
33].
1.5. Objectives and Scope
The objective of the present study is to evaluate and predict the different deflection measurements of asphalt pavements applied rehabilitation strategies through three machine learning methods. Historical asphalt pavement rehabilitation projects were extracted from the LTPP InfoPave™ system. The rehabilitation types included Asphalt Concrete Overlay, Hot-Mix Recycled Asphalt Concrete Overlay, Surface Recycled Asphalt Concrete, Mill Off AC and Overlay with AC, and Mill Existing Pavement and Overlay with Cold-Mix Recycled AC. The importance of features including pavement rehabilitation, traffic level, climate, structural parameters, pavement temperature, as well as service age on deflections was analyzed. The important features of pavement deflection basin parameters were determined and analyzed. The analyses can provide theoretical evidence for the pavement layer strength evaluation through FWD data.
2. LTPP Data
2.1. FWD Measurements
The FWD data were extracted from the table MON_DEFL_DROP_DATA. Seven deflection measurements—PEAK_DEFL_1, PEAK_DEFL_2, PEAK_DEFL_3, PEAK_DEFL_4, PEAK_DEFL_5, PEAK_DEFL_6, and PEAK_DEFL_7—were recorded in the table. The corresponding sensor locations can be found in column CENTER_OFFSET of table MON_DEFL_DEV_SENSORS. As shown in
Table 1, the center offsets of the seven deflection measurements were 0, 203, 305, 457, 610, 914, and 1219 mm, respectively. To simplify the variable notations, the seven deflections are denoted as D
0, D
20, D
30, D
45, D
60, D
90, and D
120 in this study. The deflection basin is composed of the deflections measured at discrete locations along the pavement cross-section, as shown in
Figure 2. The deflection decreased with increasing center offset.
The study of Cong et al. [
34] showed that the subgrade modulus can be evaluated by the difference between the seventh and eighth deflections, and the difference between the third and fourth deflections can be used to evaluate the base layer structural condition. The relationships between other deflection parameters and the asphalt layer condition, base condition, and subbase condition were also investigated through the sensitivity analysis. The deflection parameters can be determined from the seven measured deflection data values. Therefore, D
0–D
20, D
0–D
30, D
0–D
45, D
20–D
60, D
30–D
60, D
30–D
90. D
60–D
90, D
60–D
120, D
90–D
120 were further calculated to analyze the relationships between the deflection basin parameters and influencing factors.
2.2. Influencing Factors
Data on the influencing factors, including rehabilitation level, climate factors, traffic volume, pavement structural parameters, FWD test conditions, and service age, were also collected. The rehabilitation types of Asphalt Concrete Overlay, Hot-Mix Recycled Asphalt Concrete Overlay, Surface Recycled Asphalt Concrete, Mill Off AC and Overlay with AC, and Mill Existing Pavement and Overlay with Cold-Mix Recycled AC, with IMP_TYPE = 19, 43, 45, 51, and 56, respectively, were extracted from the LTPP database. All the rehabilitation projects were in states/provinces in North America, as shown in
Figure 3.
The variable IMP_THICKNESS is a variable that can represent the rehabilitation level, and refers to the increase in pavement thickness due to the rehabilitation activity. The climate factors include precipitation AVG_ANN_PRECIP and freeze index AVG_FREEZE_INDEX. The traffic level was characterized by the variable ANNUAL_kESAL. The structural parameters of the pavement include the structural number SN_VALUE, the thickness of the asphalt layer LAYER_THICKNESS, the type of base BASE_TYPE (granular base and treated base), the thickness of the base BASE_THICKNESS, and the thickness of the subbase SUBBASE_THICKNESS. It was noted that the variable BASE_TYPE was a categorical variable, including granular base (GB) and treated base (TB). The data for the FWD test conditions included the variables DROP_LOAD, LAYER_TEMPERATURE_1, LAYER_TEMPERATURE_2, LAYER_ TEMPERATURE_3, and their corresponding measurement depth LAYER_TEMP_DEPTH_1, LAYER_TEMP_DEPTH_2, and LAYER_TEMP_DEPTH_3. The variable AGE, indicating the service age of the pavement, was extracted as well. A description of all of the variables is provided in
Table 2. All imperial units were converted into metric units. In this study, 11,075 samples consisting of 635 pavement rehabilitation projects were investigated.
2.3. Data Preprocessing
Previous research indicated that there was a linear relationship between the logarithm of deflection basin parameter and logarithm of layer modulus. The shape of the deflection basin of semi-rigid base asphalt pavement at a center offset of 30–120 cm was very close to the exponential curve. Therefore, logarithmic transformation was conducted for FWD measurements. It can be seen from
Figure 4 that the distribution of lg(D
0–D
20) is close to a normal distribution after the logarithmic transformation. We found that the prediction accuracy of the machine learning methods improved from 0.908 to 0.932 after performing the logarithmic transformation in this study. Feng et al. [
35] concluded that there was a linear relationship between the design deflection and ESAL in the double logarithmic coordinate. Thus, variable ANNUAL_kESAL was also transformed to lg(ANNUAL_kESAL) for further analysis.
3. Machine Learning Methods
Three machine learning methods—Classification and Regression Tree (CART), Random Forest (RF), and Gradient Boosting Decision Tree (GBDT)—were used to evaluate the feature importance on deflection parameters and evaluate the prediction accuracy.
3.1. Classification and Regression Tree (CART)
Classification and Regression Tree, known as CART, was proposed by Breiman et al. [
36]. CART is a supervised machine learning algorithm, composed of feature selection, tree generation, and pruning. The essence of CART is constructing a binary decision tree recursively. It can split nominal and continuous attributes. CART can be used for classification and regression. For the regression tree, the least-squared deviation criterion is used to split attributes. For the classification tree, the Gini index minimization criterion is used for feature selection to generate a binary tree. In this study, the target variable was pavement deflection parameter which was a continuous variable. Therefore, the regression tree was used.
For the regression tree, there are two critical problems to be solved: one is to select splitting points; the other is to determine the output value of nodes in the tree. The following procedure is used to establish the regression tree.
(1) Select
j variable and its value
s as the splitting variable and splitting point to split the input space. Traverse variable
j, find its corresponding splitting point
s, and select the optimal pair (
j,
s) that minimizes Equation (1).
where
R1 and
R2 are the split input spaces.
and
.
c1 and
c2 are corresponding output values of
R1 and
R2 space.
(2) Split the input space based on the optimal pair (
j,
s) and determine the output value using Equation (2).
(3) Continue to perform step 1 and 2 on the two subspaces until the stop condition is satisfied.
(4) The input space is split into
M subsets
and the output value of each subset is
. The decision tree is generated as shown in Equation (3).
Pre-pruning and post-pruning can be used to cut back the tree to avoid overfitting. The tree is pruned back to the point where the cross-validated error is minimized in our study.
3.2. Random Forest (RF)
Random Forest (RF) is an ensemble learning method based on the bagging algorithm developed by Breiman and Cutler [
37]. RF builds multiple decision trees during the training stage to improve accuracy. It can be used for both classification and regression. For classification, the output of RF is the majority outcome that most trees vote. For regression, the average prediction of the individual trees is taken as the final prediction. RF overcomes the decision tree’s habit of overfitting, and it generally outperforms decision trees.
To generate a Random Forest, the training algorithm known as bootstrap aggregating or bagging is employed whereby the training data for each tree making up the forest is selected randomly with replacement. Therefore, each tree will be trained using a different subset of training data. Given a training dataset consisting of n samples and p features, a decision tree in RF is grown and propagated by the following steps.
(1) Create a bootstrap sample of equivalent size n by randomly sampling with replacement from the pool of n samples.
(2) Select designated mtry (<<p) features, sampling without replacement from the available p feature pool for each tree, with one feature deciding the split at each node of a decision tree.
(3) Grow the tree to maximum depth without any pruning. For each tree in a forest, bootstrap samples and composition of mtry nodal features vary. The number of trees and the maximum number of features are two critical hyperparameters to be tuned to improve RF accuracy.
3.3. Gradient Boosting Decision Tree (GBDT)
Gradient Boosting Decision Tree (GBDT) is an ensemble learning method developed by Friedman [
38] that can also be used in classification and regression. Unlike bagging in RF, boosting does not involve bootstrap sampling.
Figure 5 shows the difference between bagging and boosting. Boosting algorithm is used to sequentially combine individual weak learners in a way that each new learner fits the residual from the previous step to achieve a strong learner. For GBDT, the weak learners are decision trees. Each tree attempts to minimize the residual of the previous tree. It uses a loss function to minimize the residuals and converge to a final output value. For instance, mean squared error can be used for regression, while logarithmic loss can be used for classification. The loss function is optimized using the gradient descent. It is worth noting that existing trees in the model do not change when a new tree is added. Every time a new tree is added, it fits on a modified version of the initial dataset. Generally, the accuracy of GBDT is higher than RF.
For a training set , a differentiable loss function , and number of iteration M, the steps as follows can be used to conduct a GBDT.
(1) Initialize the weak learner using Equation (4).
(2) For m = 1 to M, conduct the following steps (a) to (d).
(a) For sample
, compute the residual as shown in Equation (5).
(b) Take the residual obtained in the previous step as the new true value, and regard the dataset as the training dataset of next decision tree to obtain a new decision tree whose leaf node region is . J is the number of its leaves.
(c) For leaf region
, solve the following optimization problem as shown in Equation (6).
(d) Update the strong learner as shown in Equation (7).
(3) Output the final learner as shown in Equation (8).
Generally, the number of trees and learning rate are two key hyperparameters that affect the performance and accuracy of a GBDT model.
4. Discussions of Results
The three machine learning methods elaborated above were used to evaluate and predict the relationship between the influencing factors and deflection measurements lg(D0–D20), lg(D0–D30), lg(D0–D45), lg(D20–D60), lg(D30–D60), lg(D30–D90), lg(D60–D90), lg(D60–D120), and lg(D90–D120). The dataset was randomly divided into 70% training set and 30% validation set. For CART, R-square was used to determine the number of split. For RF, the number of trees and maximum number of features were set as 100 and 13, respectively. For GBDT, the number of trees and learning rate were set as 300 and 0.3, respectively.
4.1. Feature Importance
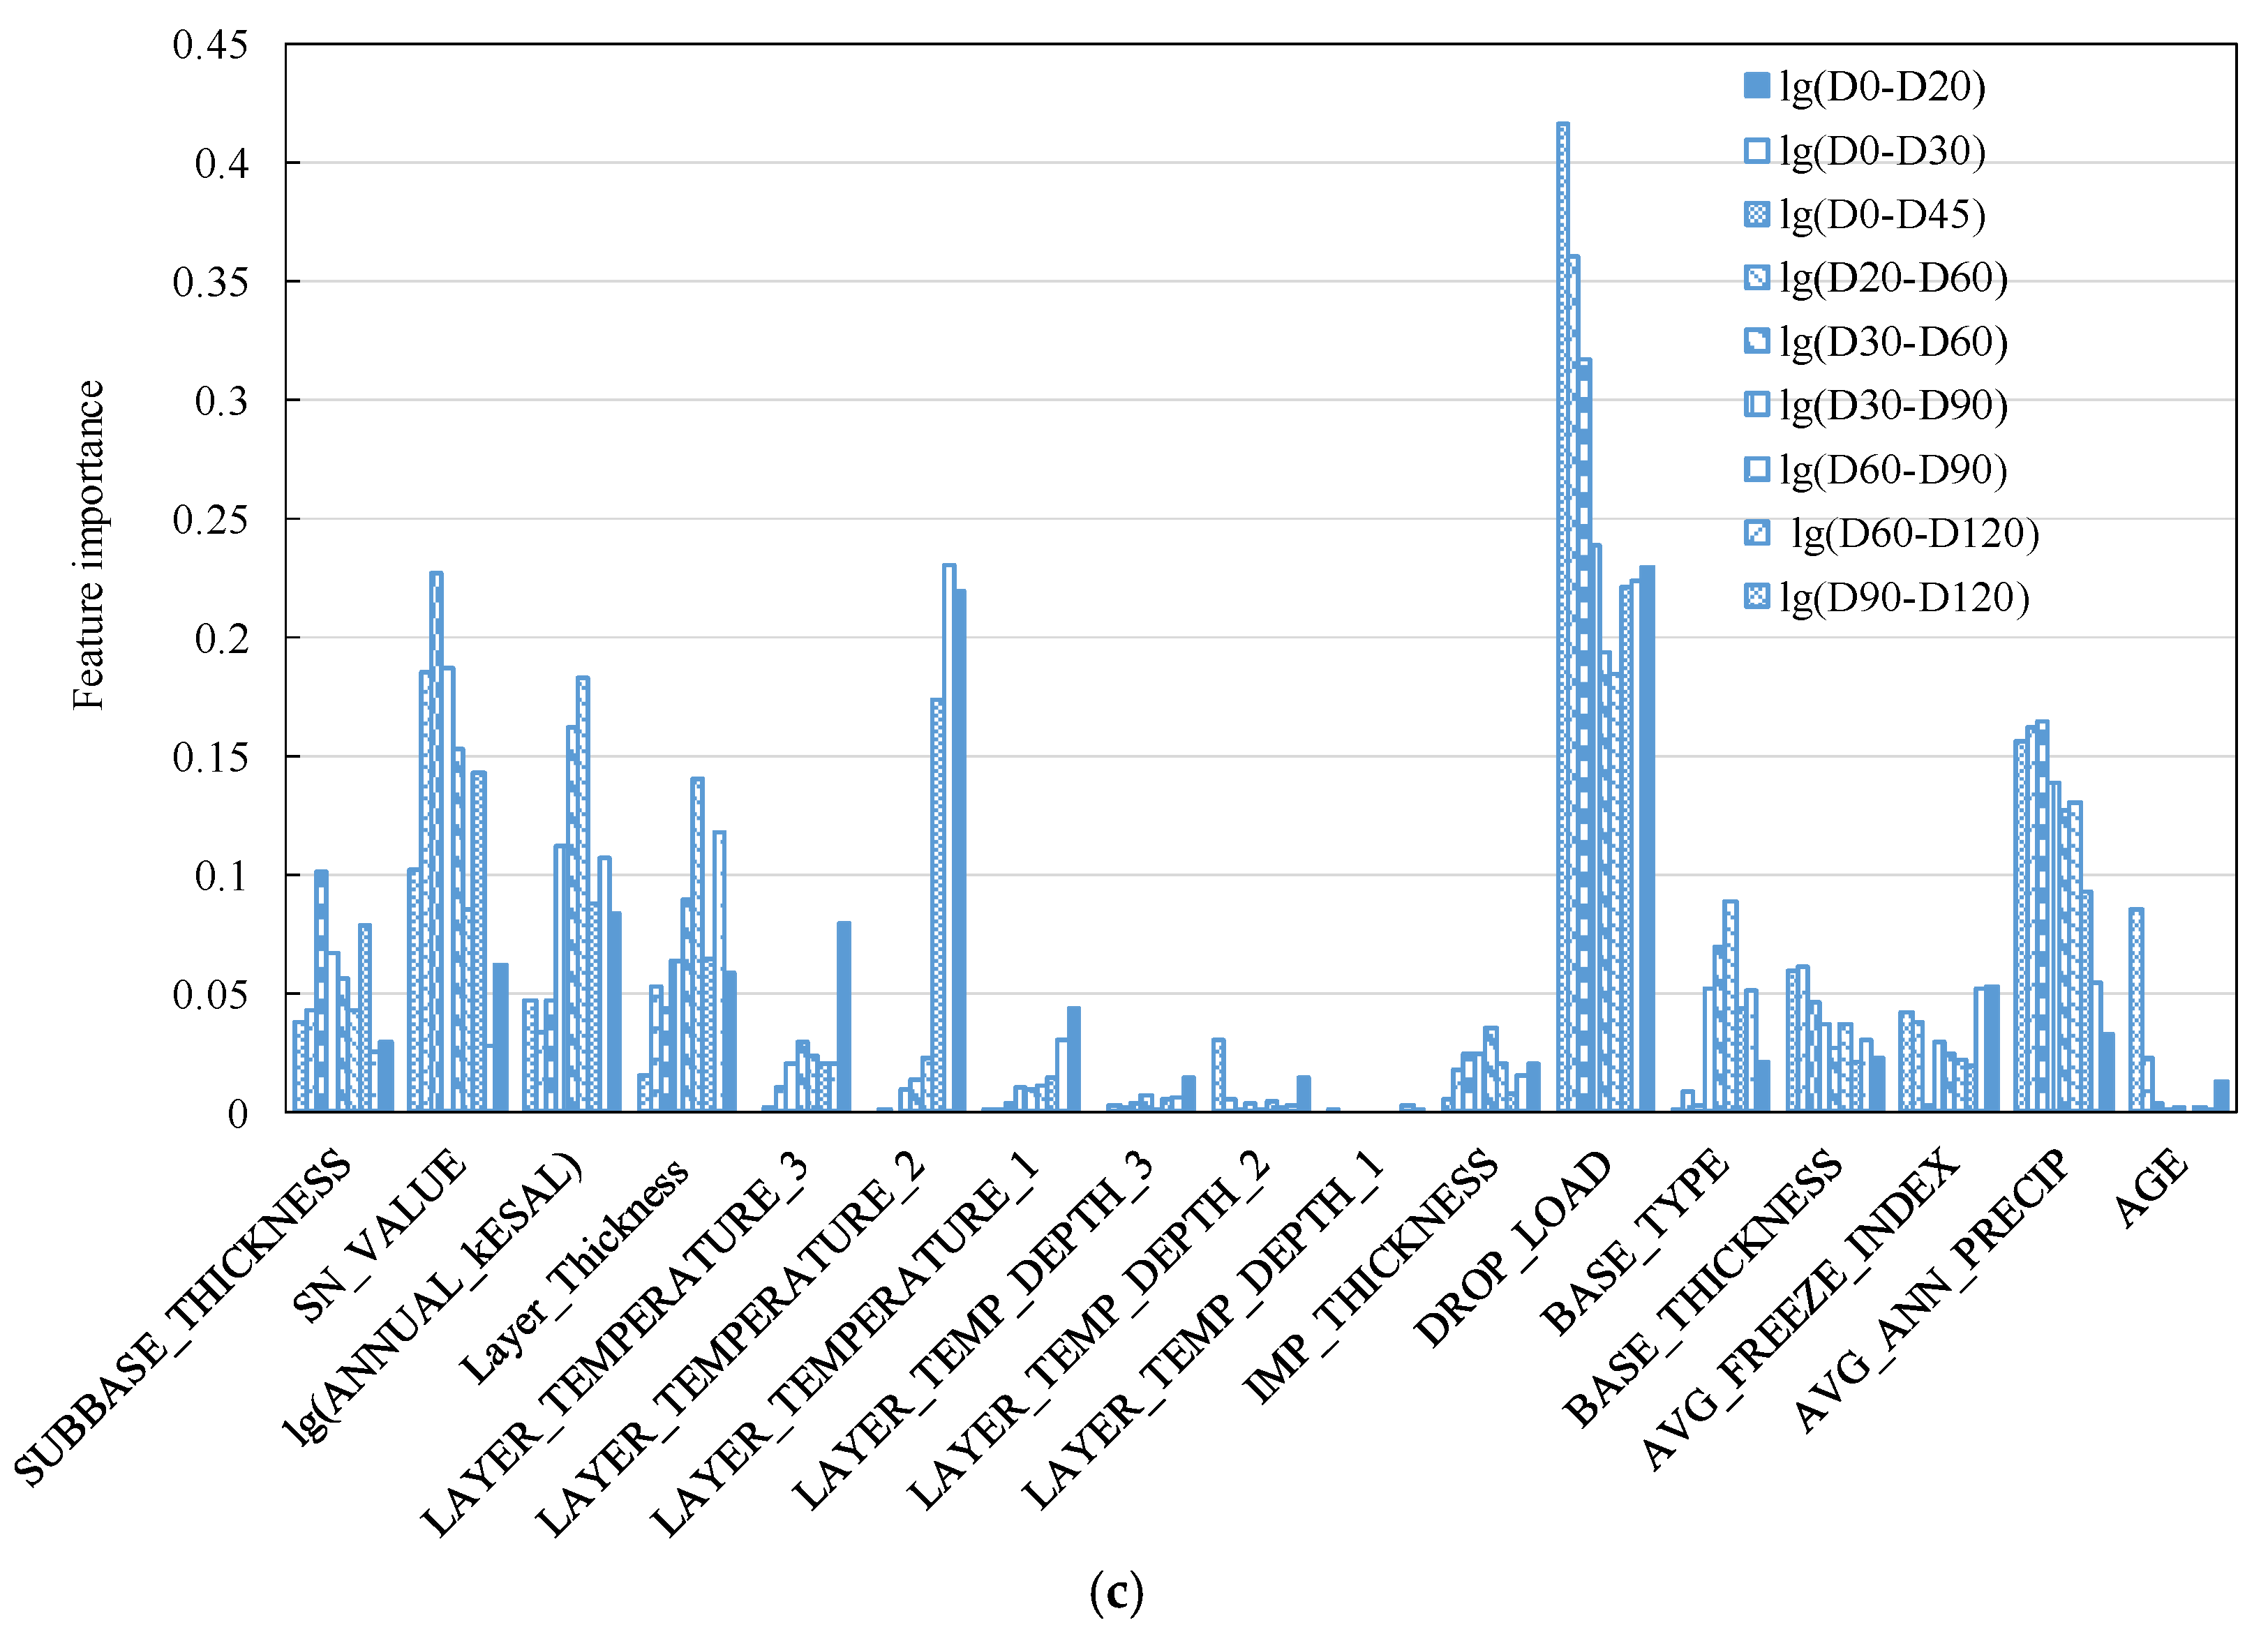
Figure 6 shows the feature importance of all the influencing factors on deflection parameters evaluated by GBDT, RF, and CART, respectively. The overall tendency of feature importance obtained by the three methods was similar except some minor differences. Among the variables of pavement structural parameters including SN_VALUE, LAYER_THICKNESS, BASE_TYPE, BASE_THICKNESS, and SUBBASE_THICKNESS, SN_VALUE was a very important feature of all FWD deflection parameters, which was consistent with the theoretical explanations. Feature importance of SN_VALUE on lg(D
0–D
20) and lg(D
0–D
30) was smaller than other FWD measurements, indicating that the effect of pavement structural number on the deflection near the basin center was smaller. The relative feature importance of asphalt layer, base, and subbase on lg(D
0–D
20) and lg(D
0–D
30) was asphalt layer > subbase > base; their relative importance on lg(D
20–D
60), lg(D
30–D
60), and lg(D
30-D
90) was asphalt layer > base > subbase; and their relative importance on lg(D
90–D
120) and lg(D
60–D
120) was base > subbase > asphalt layer. This indicates that when the center offset of the deflection sensor location was small, the correlation between FWD measurements and the thickness of asphalt layer was greater than the correlation with the thickness of base and subbase. With increasing center offset, the correlation between FWD measurements and thickness of base was greater than the correlation with the thickness of asphalt layer. For the importance of different base types, the deflection of TB was lower than GB.
Among the FWD test condition variables including DROP_LOAD, LAYER_TEMPERATURE_1, LAYER_TEMPERATURE_2, LAYER_ TEMPERATURE_3, LAYER_TEMP_DEPTH_1, LAYER_TEMP_DEPTH_2, and LAYER_TEMP_DEPTH_3, DROP_LOAD was the most significant factor influencing deflection measurements. LAYER_TEMPERATURE_2 was also important for lg(D0–D20), lg(D0–D30), and lg(D0–D45). This indicates that the second layer temperature, whose average depth was 9.4 mm, was correlated with the deflections near the basin center. The importance of other temperatures and temperature depths was small.
For the climate factors, the importance of AVG_ANN_PRECIP, was greater than AVG_FREEZE_INDEX. When the sensor locations were far away from the basin center, the importance of precipitation on deflections became greater. The traffic level ANNUAL_kESAL was an important feature for all the measured deflections. The importance of rehabilitation level IMP_THICKNESS on deflections was not great and the values of feature importance at various deflection sensor locations were similar. The importance of service age on lg(D90–D120) was greater than the importance on other deflection parameters.
4.2. Prediction Accuracy
Table 3 shows the R-squares of GBDT, RF, and CART used to predict the different deflection parameters. It can be seen that all three methods exhibit good prediction performance. Generally, GBDT outperformed RF, and RF outperformed CART when analyzing the same dataset. The prediction accuracy of GBDT was as high as 99%, indicating that GBDT was an effective machine learning method.
Figure 7 shows the plot of actual and predicted lg(D
0–D
20) using the three different methods. It also can be concluded that the prediction accuracy ranking is GBDT > RF > CART.
5. Conclusions
In this study, three machine learning methods—CART, RF, and GBDT—were used to evaluate and predict the FWD measurements of deflection basin based on LTPP data. The feature importance of influencing factors including FWD test conditions, pavement structural parameters, climatic factors, traffic level, rehabilitation level, etc. on deflections were analyzed. The main conclusions that can be drawn from this study are summarized below.
(1) Among the six variables of pavement structural parameters, structural number was an important feature for all FWD measurements, but its importance on lg(D0–D20) and lg(D0–D30) was smaller than other FWD measurements. The relative feature importance of asphalt layer, base, and subbase on lg(D0–D20) and lg(D0–D30) was asphalt layer > subbase > base; their relative importance on lg(D20–D60), lg(D30–D60), and lg(D30–D90) was asphalt layer > base > subbase; and their relative importance on lg(D90–D120) and lg(D60–D120) was base > subbase > asphalt layer.
(2) Among the FWD test condition variables, drop load was the most important factor influencing deflections. The second layer temperature was also important for lg(D0–D20), lg(D0–D30), and lg(D0–D45). The importance of temperature depths and other temperatures was small.
(3) The importance of precipitation on deflection was greater than freeze index. The traffic level was also an important feature for all measured deflection.
(4) All three methods—GBDT, RF, and CART—were demonstrated to be effective and efficient approaches analyzing the deflection. Additionally, the prediction accuracy of GBDT was as high as 99%. Generally, GBDT outperformed RF, and RF outperformed CART.
FWD deflection basin can comprehensively represent the pavement bearing capacity. The analyses between FWD deflection basin parameter and influencing factors especially the pavement structural characteristics can provide theoretical evidence for the pavement layer strength evaluation through FWD data. Moreover, deflection is widely used in the back-calculation of pavement layer modulus. Therefore, the precise prediction of deflection can improve the back-calculation accuracy. In our further study, the machine learning methods will be used to back-calculate the pavement layer modulus based on the FWD data.
Author Contributions
Conceptualization, X.C.; Data curation, X.C.; Funding acquisition, X.C., Q.D. and S.D.; Writing—original draft, X.C.; Writing—review and editing, Q.D. and S.D. All authors have read and agreed to the published version of the manuscript.
Funding
This research was funded by the Fundamental Research Funds for the Central Universities, CHD grant number 300102341508, the Natural Science Foundation of Jiangsu Province grant number BK20200468, the National Natural Science Foundation of China grant number 52208439 and 51978163.
Data Availability Statement
Some or all data, models, or code that support the findings of this study are available from the corresponding author upon reasonable request.
Conflicts of Interest
The authors declare no conflict of interest.
References
- Nega, A.; Nikraz, H.; Al-Qadi, I.L. Dynamic analysis of falling weight deflectometer. J. Traffic Transp. Eng. Engl. Ed. 2016, 3, 427–437. [Google Scholar] [CrossRef] [Green Version]
- Kargah-Ostadi, N.; Stoffels Shelley, M. Backcalculation of Flexible Pavement Structural Properties Using a Restart Covariance Matrix Adaptation Evolution Strategy. J. Comput. Civ. Eng. 2015, 29, 04014035. [Google Scholar] [CrossRef]
- Xu, B.; Ranjithan, S.R.; Kim, Y. New Condition Assessment Procedure for Asphalt Pavement Layers, Using Falling Weight Deflectometer Deflections. Transp. Res. Rec. 2002, 1806, 57–69. [Google Scholar] [CrossRef]
- Kim, Y.R.; Park, H.-G. Use of Falling Weight Deflectometer Multi-Load Data for Pavement Strength Estimation; North Carolina Department of Transportation: Raleigh, NC, USA, 2002.
- Quintus, H.L.V.; Rao, C.B.; Irwin, L.H. Long-Term Pavement Performance Program Determination of In-Place Elastic Layer Modulus: Backcalculation Methodology and Procedures; Research, Development, and Technology Turner-Fairbank Highway Research Center: McLean, VA, USA, 2015. [Google Scholar]
- Sharma, S.; Das, A. Backcalculation of pavement layer moduli from falling weight deflectometer data using an artificial neural network. Can. J. Civ. Eng. 2008, 35, 57–66. [Google Scholar] [CrossRef]
- Saltan, M.; Uz, V.E.; Aktas, B. Artificial neural networks–based backcalculation of the structural properties of a typical flexible pavement. Neural Comput. Appl. 2013, 23, 1703–1710. [Google Scholar] [CrossRef]
- Han, C.; Ma, T.; Chen, S.; Fan, J. Application of a hybrid neural network structure for FWD backcalculation based on LTPP database. Int. J. Pavement Eng. 2021, 23, 3099–3112. [Google Scholar] [CrossRef]
- Wang, M.L.; Birken, R. 15—Sensing solutions for assessing and monitoring roads. In Sensor Technologies for Civil Infrastructures; Wang, M.L., Lynch, J.P., Sohn, H., Eds.; Woodhead Publishing: Cambridge, UK, 2014; Volume 56, pp. 461–496. [Google Scholar]
- Mehta, Y.; Roque, R. Evaluation of FWD Data for Determination of Layer Moduli of Pavements. J. Mater. Civ. Eng. 2003, 15, 25–31. [Google Scholar] [CrossRef]
- Nobakht, M.; Sakhaeifar Maryam, S.; Newcomb, D. Development of Rehabilitation Strategies Based on Structural Capacity for Composite and Flexible Pavements. J. Transp. Eng. Part A Syst. 2017, 143, 04016016. [Google Scholar] [CrossRef]
- Ma, L.; Li, M.; Pang, J.; Huang, C. Evaluation of Transverse Cracks for Semi-Rigid Asphalt Pavements using Deflection Basin Parameters. Transp. Res. Rec. 2019, 2673, 358–367. [Google Scholar] [CrossRef]
- Park, H.M. Use of Falling Weight Deflectometer Multi-Load Level Data for Pavement Strength Estimation. Ph.D. Thesis, North Carolina State University, Raleigh, NC, USA, 2001. [Google Scholar]
- Hossain, M.; Long, B.; Kotdwala, S.J. Seasonal and Hourly Variation of Pavement Deflections Measured with the Falling Weight Deflectometer (FWD). In Proceedings of the Transportation Research Record, Washington, DC, USA, 1 January 1996. [Google Scholar]
- Shafiee, M.H.; Hashemian, L.; Bayat, A. Seasonal Analysis of Flexible Pavement Response to Falling Weight Deflectometer. Int. J. Pavement Res. Technol. 2015, 8, 346–352. [Google Scholar]
- Wang, H.; Xie, P.; Ji, R.; Gagnon, J. Prediction of airfield pavement responses from surface deflections: Comparison between the traditional backcalculation approach and the ANN model. Road Mater. Pavement Des. 2021, 22, 1930–1945. [Google Scholar] [CrossRef]
- Ministry of Transport of the People’s Republic of China. Specifications for Design of Highway Asphalt Pavement; Ministry of Transport of the People’s Republic of China: Beijing, China, 2017.
- Ceylan, H.; Gopalakrishnan, K.; Bayrak, M.B.; Guclu, A. Noise-tolerant inverse analysis models for nondestructive evaluation of transportation infrastructure systems using neural networks. Nondestruct. Test. Eval. 2013, 28, 233–251. [Google Scholar] [CrossRef] [Green Version]
- You, L.; Yan, K.; Liu, N. Assessing artificial neural network performance for predicting interlayer conditions and layer modulus of multi-layered flexible pavement. Front. Struct. Civ. Eng. 2020, 14, 487–500. [Google Scholar] [CrossRef]
- Li, M.; Wang, H. Prediction of Asphalt Pavement Responses from FWD Surface Deflections Using Soft Computing Methods. J. Transp. Eng. Part B Pavements 2018, 144, 04018014. [Google Scholar] [CrossRef]
- Vyas, V.; Singh, A.P.; Srivastava, A. Prediction of asphalt pavement condition using FWD deflection basin parameters and artificial neural networks. Road Mater. Pavement Des. 2020, 22, 2748–2766. [Google Scholar] [CrossRef]
- Rabbi, M.F.; Mishra, D. Using FWD deflection basin parameters for network-level assessment of flexible pavements. Int. J. Pavement Eng. 2021, 22, 147–161. [Google Scholar] [CrossRef]
- Haridas, A.; Peraka, N.S.P.; Biligiri, K.P. Structural Behavior Prediction Model for Asphalt Pavements: A Deep Neural Network Approach. J. Test. Eval. 2022, 51, 20210804. [Google Scholar] [CrossRef]
- Dong, Q.; Chen, X.; Dong, S.; Ni, F. Data Analysis in Pavement Engineering: An Overview. IEEE Trans. Intell. Transp. Syst. 2022, 23, 22020–22039. [Google Scholar] [CrossRef]
- Dong, Q.; Chen, X.; Huang, B.; Gu, X. Analysis of the Influence of Materials and Construction Practices on Slurry Seal Performance Using LTPP Data. J. Transp. Eng. Part B Pavements 2018, 144, 04018046. [Google Scholar] [CrossRef]
- Gujar, R.; Vakharia, V. Prediction and validation of alternative fillers used in micro surfacing mix-design using machine learning techniques. Constr. Build. Mater. 2019, 207, 519–527. [Google Scholar] [CrossRef]
- Gong, H.; Sun, Y.; Shu, X.; Huang, B. Use of random forests regression for predicting IRI of asphalt pavements. Constr. Build. Mater. 2018, 189, 890–897. [Google Scholar] [CrossRef]
- Gong, H.; Sun, Y.; Hu, W.; Polaczyk, P.A.; Huang, B. Investigating impacts of asphalt mixture properties on pavement performance using LTPP data through random forests. Constr. Build. Mater. 2019, 204, 203–212. [Google Scholar] [CrossRef]
- Zhang, J.; Guo, W.; Song, B.; Zhuo, Y.; Zhang, Y. Performance Prediction of Asphalt Pavement Based on Random Forest. J. Beijing Univ. Technol. 2021, 47, 1256–1263. [Google Scholar]
- Madeh Piryonesi, S.; El-Diraby Tamer, E. Using Machine Learning to Examine Impact of Type of Performance Indicator on Flexible Pavement Deterioration Modeling. J. Infrastruct. Syst. 2021, 27, 04021005. [Google Scholar] [CrossRef]
- Zhang, M.; Gong, H.; Jia, X.; Xiao, R.; Jiang, X.; Ma, Y.; Huang, B. Analysis of critical factors to asphalt overlay performance using gradient boosted models. Constr. Build. Mater. 2020, 262, 120083. [Google Scholar] [CrossRef]
- Abd El-Raof, H.S.; Abd El-Hakim, R.T.; El-Badawy, S.M.; Afify, H.A. Structural number prediction for flexible pavements using the long term pavement performance data. Int. J. Pavement Eng. 2020, 21, 841–855. [Google Scholar] [CrossRef]
- Chen, X.; Zhu, H.; Dong, Q.; Huang, B. Optimal Thresholds for Pavement Preventive Maintenance Treatments Using LTPP Data. J. Transp. Eng. Part A Syst. 2017, 143, 04017018. [Google Scholar] [CrossRef]
- Cong, L.; Lytton Robert, L.; Xie, Z. Sublayer Strength Evaluation with FWD in Semi-Rigid Base Asphalt Pavement Rehabilitation Project. In Proceedings of the GeoShanghai International Conference, Shanghai, China, 3–5 June 2010; pp. 392–397. [Google Scholar]
- Feng, Z.; Xue, P.; Wang, R.; Wang, Z. Calculating method of design deflection in asphalt pavement based on south China area. J. Chang. Univ. Nat. Sci. Ed. 2013, 33, 28–35. [Google Scholar]
- Breiman, L.; Friedman, J.H.; Olshen, R.A.; Stone, C.J. Classification And Regression Trees, 1st ed.; Routledge: Boca Raton, FL, USA, 1984. [Google Scholar]
- Breiman, L. Random Forests. Mach. Learn. 2001, 45, 5–32. [Google Scholar] [CrossRef] [Green Version]
- Friedman, J.H. Greedy function approximation: A gradient boosting machine. Ann. Stat. 2001, 29, 1189–1232. [Google Scholar] [CrossRef]
| Publisher’s Note: MDPI stays neutral with regard to jurisdictional claims in published maps and institutional affiliations. |
© 2022 by the authors. Licensee MDPI, Basel, Switzerland. This article is an open access article distributed under the terms and conditions of the Creative Commons Attribution (CC BY) license (https://creativecommons.org/licenses/by/4.0/).


