Abstract
The long-term deformation of a 17.5 m deep excavation constructed with the bottom-up technique in silty clay in Xi’an was monitored in this study. The retaining wall was built with one or two rows of contiguous bored concrete piles and tie-back prestressing tendons. The monitoring of settlement and lateral deflection at the top of the retaining structure, and the settlement of the ground surface and of the adjacent building lasted for more than 4 years. After the final depth was reached, the excavation was surveyed for more than 3.1 years. It was observed that the deformation of the excavation increased with the increase in the excavation depth, and a significant increase in displacement was recorded after the excavation reached the final depth. The averaged time-dependent rates of the deflection of the retaining wall, and the settlement of the ground surface and of the adjacent building when the excavation remained partially unfilled were around 0.23–0.25 mm/month in this study. The time-dependent behavior of the excavation could lead to excessive deformation and cause severe safety risks to the retaining system. The recorded data, together with a comparison with cases reported in the open literature, are presented in this paper.
1. Introduction
Sheet piles, bored piles and others have been used as retaining walls for deep excavations over the past decades. The ground movements caused by deep excavation in urban areas may induce severe risks to adjacent buildings and facilities and create huge safety concerns; therefore, the displacement of the retaining walls and the ground surface settlement of deep excavations have been intensively investigated worldwide [1,2]. Among many factors, the stiffness of the retaining structure is of great significance to the performance of a deep excavation, and different findings have been reported in the literature. Wang et al. [3] believed that increasing the stiffness can decrease the maximum lateral displacement of the retaining structure. Lee et al. [4] reported that double-row-pile retaining walls performed better with reduced displacement when compared with single-row piles; therefore, retaining walls with double-row piles could be an effective option when a greater stiffness of the retaining wall is required. However, Moormann [2] concluded that when the stiffness of the retaining wall is greater than a certain level, increasing the stiffness may not affect the displacement of the retaining wall at all. Leung and Ng [5] found that the retaining wall deflection and ground settlement are relatively independent of the system stiffness.
Based on a large number of cases, the relationship between horizontal displacement and excavation depth has been reported [1,4,6]. It has been found that generally the maximum horizontal displacement increases with the increase in the excavation depth, but the ratio of the maximum deflection to the excavation depth varies significantly according to the type of soil and the retaining system [3]. Generally, diaphragm walls develop typical deep-seated inward movements (bulging profiles) during excavation. Long [1] found that the maximum deflection is normally between 0.05% and 0.25% of the excavation depth for retaining walls in soft soils and up to 3.2% of the excavation depth in certain cases. Leung and Ng [5] reported that both the maximum lateral deflection and ground surface settlement range from 0.1% to 0.3% of the excavation depth in stiff soils (stiff clay, sand and residual soil). In general, the ground surface settlement increases with the increase in the depth of the excavation, but reports of vertical movements of the retaining wall are limited in the literature. Tan and Wei [7] studied the movements at the top of the retaining wall and observed heaves instead of settlement at the beginning of excavation. Liu et al. [8] investigated the vertical movement of the retaining wall of a deep excavation in clay and found heaves without any settlement. Aboelela et al. [9] studied the heave of the excavation bed and found that the modulus of the subgrade reaction decreased with the increase in the excavation depth. Cucuzza et al. [10] investigated pile lateral deformation and reported a parametrized solution for typical load conditions where a horizontal force and a bending moment are applied at the piles’ top.
Currently, the majority of the reported cases focus on the monitoring of an excavation during the construction period, and the investigation of the time-dependent performance of a deep excavation when the excavation depth remains unchanged is limited in the literature. It was reported that the consolidation and creep of soft clay could cause significant wall deflection and ground surface settlement as well as slope stability reduction [11]. Ou et al. [12] studied the performance of a 38 m deep excavation in soft clay constructed with the top-down method and observed a substantial increase in time-dependent deflection. As up to 36% of the total wall deflection and 44% of total ground surface settlement developed when the excavation depth remained unchanged, Ou et al. [12] concluded that the analysis of excavations in soft clay should consider the creep factor. Finno et al. [13] found that only about half of the movement developed during an excavation in Chicago soft clay and long-term movement due to creep could become a significant portion of the total movement, and Finno et al. [14] reported an increase in horizontal movement due to creep after excavation. Recently, He et al. [15] observed that the retaining wall in soft clay developed noticeable deflection after the excavation reached the designed depth and believed that the time-dependent post-excavation deflection was partly due to ground consolidation. As for bottom-up excavations, it was reported that pronounced time-dependent deformations were measured during both excavation and post-excavation in soft clay, and it was found that the post-excavation wall deflection rate was up to 2–3 times that which occurred during excavation and could cause unexpected excavation deformation [7,16,17]. However, Liu et al. [18] monitored the performance of a 15.5 m deep excavation in Shanghai soft clay up to 60 days and did not observe any increase in lateral wall deflection or ground surface settlement caused by the “creep” property of soft clay. Tan and Li [19] studied a 26 m deep top-down excavation in soft clay and did not find any significant long-term post-excavation wall movement, and most wall deflection and ground settlement were caused by stress relief incurred by soil removal instead of the consolidation and creep of the soft clays. For most excavations in the literature, the long-term performance was measured for a few months, with the longest being 548 days [17].
In this study, contiguous bored concrete piles with tie-back prestressing tendons were built as the retaining system of a 17.5 m deep excavation for a building complex. Since the groundwater table was above the final depth of the excavation, dewatering was implemented during excavation and the construction of the basement with the bottom-up technique. The settlement and deflection at the top of the retaining wall and the settlement of the ground surface together with that of an adjacent building were monitored from the start to the full backfilling of the excavation. Post-excavation deformation was recorded for more than 3.1 years.
2. Experiment
2.1. Subsoil Condition
The soil properties along the depth were characterized with a series of laboratory tests and in situ tests. The top layer was formed by fill with a thickness of 0.3–9.7 m. Under this, there was soft silty clay with high compressibility and a thickness of 1.20–7.60 m. The third layer was also soft silty clay with a thickness of 2.3–7.2 m. It was in a medium-to-high compressible state. Beneath this layer, there was a 3–5.1 m thick reddish-brown silty clay, with medium plasticity and compressibility. The fifth layer was a 0.7–4.4 m thick yellowish-brown silty clay, with medium plasticity and compressibility. The typical soil profiles and material properties are shown in Figure 1. The effective cohesion, c′, and friction angle, ϕ′, were obtained using a direct shear test. The coefficient of compressibility, , and constrained modulus, , were defined using oedometer tests. As indicated in Figure 1, based on the SPT blown counts, the 2nd and the 3rd layers could be classified as soft clays. Layer 4 was firm clay, and layer 5 was stiff-to-very-stiff clay.
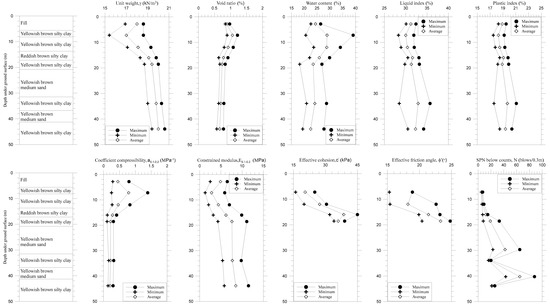
Figure 1.
Soil profiles and material properties.
2.2. Construction Sequence of Deep Excavation
The site of the excavation was located in Xi’an, China (Figure 2). As shown in Figure 3, the pit size in the plan of the excavation was about 15,000 m2. The retaining structure was made of cast-in-place bored piles, which were footed in sand and constructed before excavation. Sections of the retaining walls are shown in Figure 4 and Figure 5. On the north and east sides, the diameter and embedment length of the concrete piles were 800 mm and 10.6 m, respectively. The piles were spaced 1.5 m apart from center to center with ring beams at the top, which had a cross section of 1000 × 800 mm2. As shown in Figure 4, for each pile, totally, there were four prestressing tendons with a typical vertical spacing of 3.5 m (I-I in Figure 4). On the west side, as the excavation was close to an existing metro station, installation of anchors in certain area was not allowed. Therefore, the number of anchors was reduced to one or two per concrete pile along the depth of the excavation. In order to keep the displacement comparable to that of the north and east sides and meet the major deflection and settlement limits at the top of the retaining wall of 30 mm and 20 mm, respectively, as required by Chinese code [20], double-row bored piles were adopted on the west side of the excavation (II-II in Figure 4; III-III and IV-IV in Figure 5). The diameter of these piles was 700 mm/800 mm, and they were spaced 2.0 m/2.5 m apart from center to center between two rows, where the cross section of both ring beams and cap beams was 800 × 900 mm2. The south side of the excavation was another excavation pit with similar depth and retaining system, and no retaining walls were built in the middle of the two combined pits.
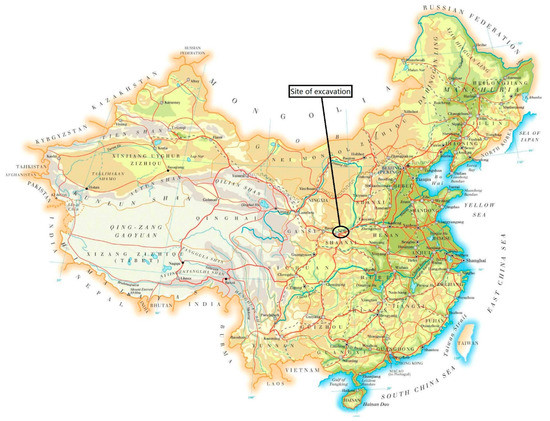
Figure 2.
Location of the excavation site.
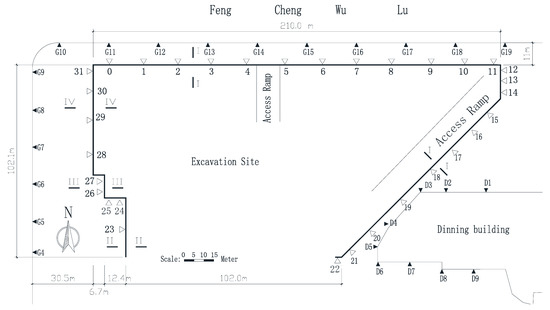
Figure 3.
Layout of settlement and deflection monitoring points of excavation and adjacent building.
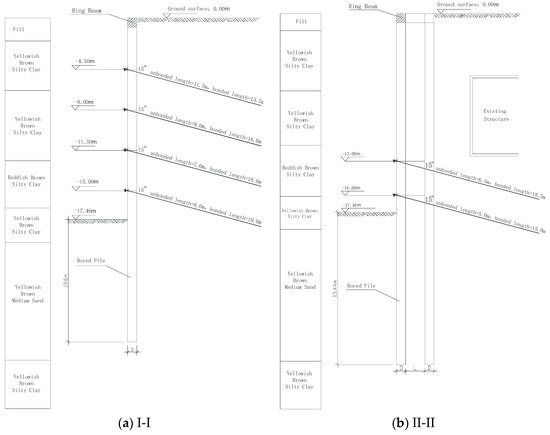
Figure 4.
Section of bored-pile wall.
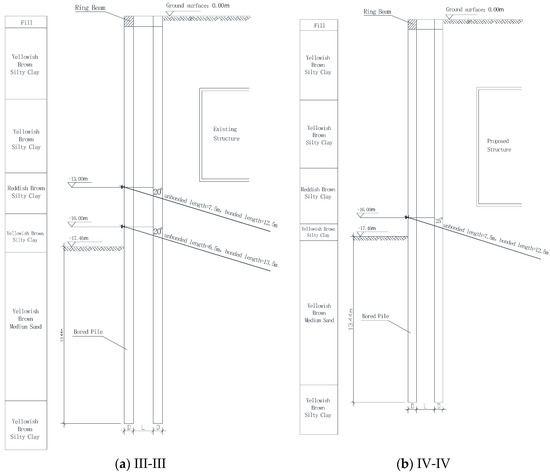
Figure 5.
Section of bored-pile wall.
All anchors were connected to piles through double C–section steel struts and were installed at a horizontal spacing of 1.5 m. During construction, holes with a nominal diameter of 150 mm were drilled through the concrete piles, and the tendons consisted of two 28 mm diameter steel strands set in each hole with cement grouting. The length of the tendons varied (Figure 4 and Figure 5). The prestressing force varied from 220 kN to 260 kN and was applied to the anchors after the grouting reached at least 70% of the designed strength.
Between the concrete piles, reinforced concrete with a thickness of 50 mm was constructed, where a steel wire with a diameter of 6 mm was first installed and then concrete was sprayed over the whole wire. The actual groundwater table was about 15 m below the ground surface. The dewatering system consisted of bored wells with electric submersible pumps, which were located near the base of each well. The majority of the wells were sited outside of the retaining wall. Dewatering started before the excavation reached a depth of about 13 m and was maintained till the construction of the underground structure was finished. The grades of longitudinal reinforcement and the concrete of the piles were HRB400 and C30, respectively. The grades of the steel wire and concrete of the covering layer between piles were HRB400 and C20, as per Chinese code [21], respectively. The grade of cement grouting for the prestressing tendons was M25, as per Chinese code [22].
Excavation began after the concrete of the bored piles reached full strength. During excavation, prestressing force was applied to the anchors to the desired level; then, the site was further excavated down to a greater depth. The initial ramp was located on the north side of the excavation, but it was demolished shortly after the excavation reached the final depth, and a new ramp was built on the east side (Figure 3). Due to non-technical reasons, after reaching the final depth of 17.5 m, the excavation pit unexpectedly stayed partially unbackfilled for about 3.14 years. The construction activity was organized into 10 stages (Table 1).

Table 1.
Construction sequence.
2.3. Instrumentation and Monitoring
One two-story masonry dining building lay on the east side of the excavation, and nine settlement-monitoring points were established along the exterior wall of the building and about 20 cm above the ground surface (Figure 6). In order to study the deformation of the retaining wall, 32 survey nodes were installed at the top of the ring beam, as shown in Figure 3. On the north and west sides of the excavation, in total, 16 points were located on the ground surface. The monitoring points of the retaining wall and ground were achieved by installing 7 cm long steel spikes into the ring beam and flexible pavement on the ground surface, respectively. The recording rate was once a week during excavation and once every two weeks after excavation reached the final depth; then, it decreased to once a month until full backfilling. Horizontal displacement was collected using Electronic Total Station (manufacturer, Leica Geosystems; model, TS06; accuracy, ±2″), and settlement was recorded using a digital level (manufacturer, Leica Geosystems; model, DNA 03; accuracy, 0.5 mm/1 kM).
Figure 6.
Monitoring point on the adjacent building.
3. Results
3.1. Settlement at the Top of Retaining Wall
Figure 7, Figure 8 and Figure 9 show that when the excavation reached the final depth, the immediate vertical settlement of the retaining wall recorded at the ring beam was around 6–8 mm. After that, settlement continuously increased at a slower rate. As depicted in Figure 8, there was an obvious platform of the settlement values after the excavation was finished (end of stage 5). The reason might have been that the access ramp in this area helped to restrain the settlement of the retaining wall, but the total settlement was not affected by the ramp after it was removed (see Figure 7 and Figure 8). It is indicated in Table 2 that when the excavation reached the final depth, the averaged settlement values were about 6.6 mm, 5.9 mm and 5.2 mm, and additional settlement values of 9.2 mm, 7.6 mm and 9.1 mm were achieved post-excavation, respectively.
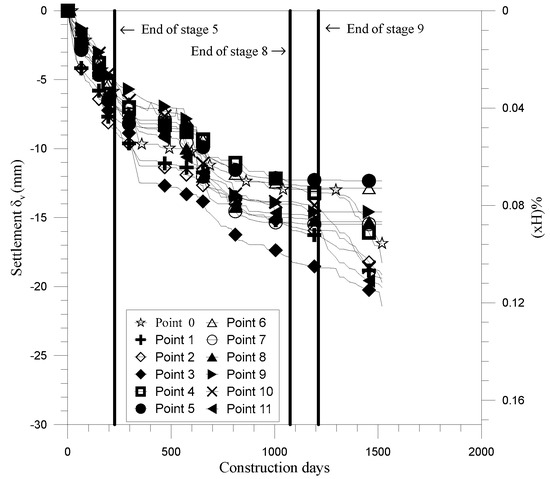
Figure 7.
Settlement of points 0–11 of wall.
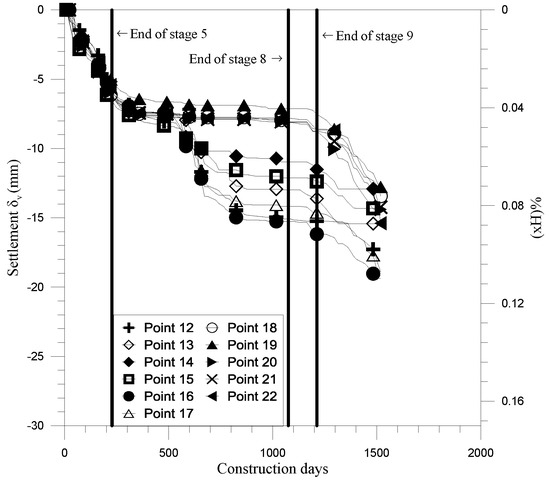
Figure 8.
Settlement of points 12–22 of wall.
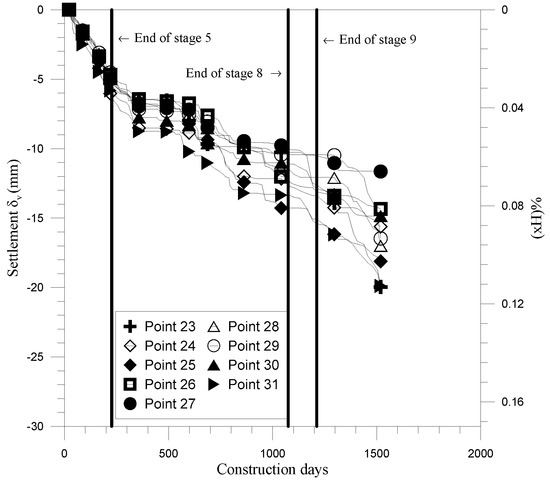
Figure 9.
Settlement of points 23–31 of wall.
Table 2.
Comparison of settlement of top of retaining wall at final excavation and backfilling.
Reports of the settlement of the retaining wall in deep excavations in soft soils are very limited. Tan and Li [19] studied the settlement of the diaphragm wall of a 26 m deep excavation constructed with the top-down technique in Shanghai and found serrated settlement patterns (the walls first moved up and then down). Tan and Wei [7] surveyed the displacement of the diaphragm wall of a 16–18 m deep excavation and found that the diaphragm wall experienced significant heaves up to 21 mm instead of settlement during excavation. Liu et al. [8] observed 22–28 mm heaves of the retaining wall of a 18.4 m deep braced excavation in soft clay. However, the upward movement was not observed in this study.
3.2. Settlement of Ground Surface
Figure 10 and Figure 11 show that the overall settlement of the ground surface on the north and west sides of the excavation was similar; the settlement increased almost linearly to 4–6 mm when the excavation reached the final depth, and roughly 10 mm was additionally recorded before backfilling. It is further indicated in Table 3 that the averaged ratio of the settlement recorded at full backfilling to that when the excavation reached the final depth was 3.06. Figure 7 and Figure 11 depict that there were no significant differences in the settlement values at the top of the retaining wall and the adjacent ground surface on the north side of the excavation.
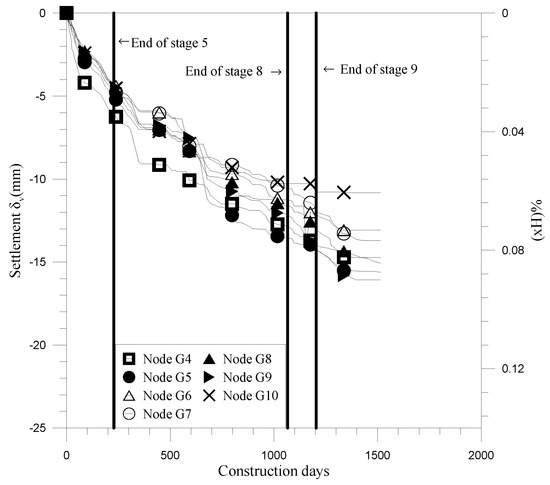
Figure 10.
Ground settlement of points 4–10.
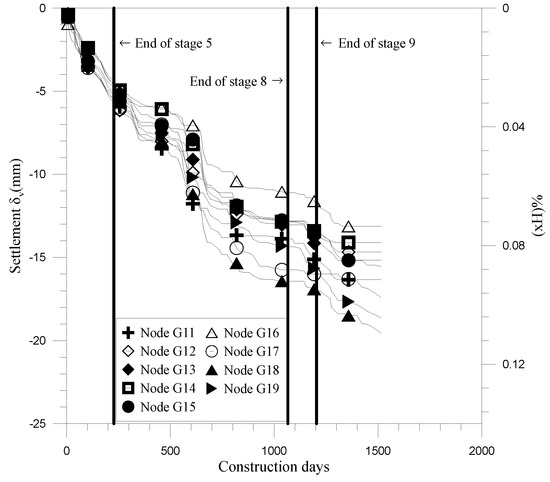
Figure 11.
Ground settlement of points 11–19.
Table 3.
Comparison of ground settlement at final excavation and backfilling.
When compared with ground surface settlement in soft soils in other reported cases, the settlement values in this study (Figure 10 and Figure 11) were comparable to 0.03–0.18% H of the deep excavation reported by Tan and Wei [7], but they were smaller than the suggested values of 0.1–0.8% H of the deep excavation reported by Wang et al. [3], as well as 0.9% H [15] and 0.1–10.1% H (with an average of 1.1% H), based on worldwide cases [2].
3.3. Settlement of Adjacent Dining Building
Figure 12 shows that the settlement of the dining building was around 5–6 mm when the excavation reached the final depth and increased continuously to an average of around 20 mm at backfilling. Figure 8 and Figure 12 indicate that the settlement of the dining building was very close to that at the top of the retaining wall, and this implied that the retaining wall was effective in protecting the adjacent building. Furthermore, no cracks were observed on the building during and after the excavation.
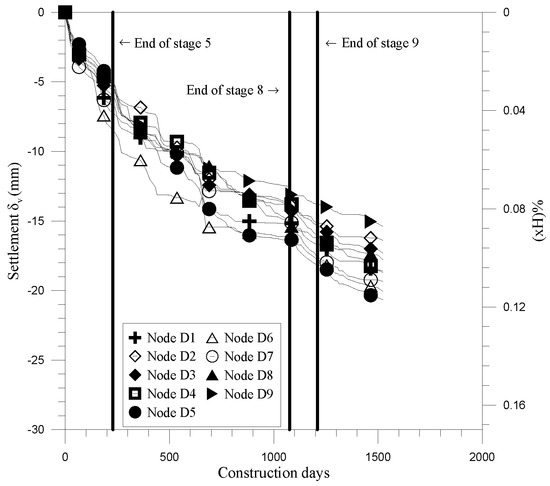
Figure 12.
Building settlement of points 1–9.
3.4. Lateral Deflection at the Top of Retaining Wall
Even though the geometry of the excavation varied at different locations, the lateral deflection values did not show a significant difference. Figure 13, Figure 14 and Figure 15 show that when the excavation reached the final depth, deflection was within the range of 5–20 mm, and at full backfilling (when the access ramp was removed), the averaged deflection in the east of the pit (points of 17–20) was much greater than that on the north and west sides. Figure 3 shows that the retaining wall on the east side was partially restrained by the access ramp before it was demolished. Finno et al. [14] presented that the access ramp could provide effective constraint and decrease the horizontal deflection of the retaining wall, but in this study, the access ramp on the east side did not seemly provide the same constraint. A large increase in lateral deflection was reported when the access ramp was removed from an excavation with a depth of 13.1–18 m [14]; however, no such jump was caught in this study.
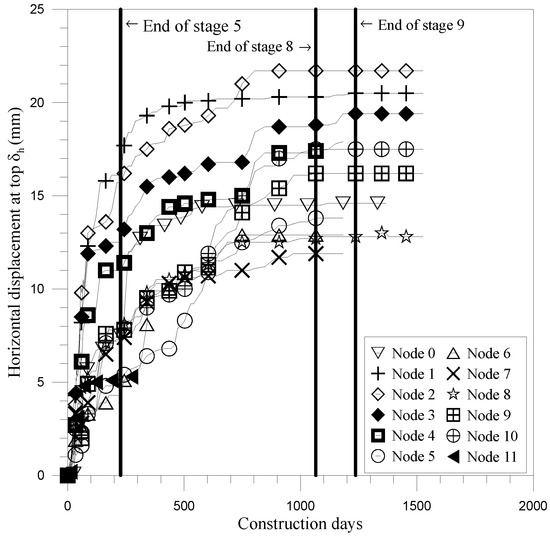
Figure 13.
Deflection of points 0–11.
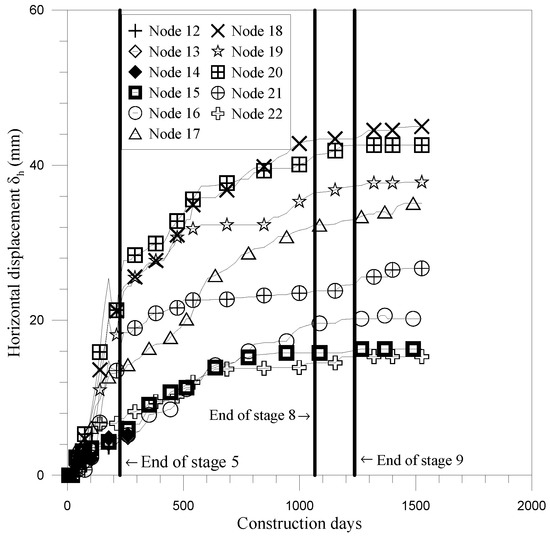
Figure 14.
Deflection of points 12–22.
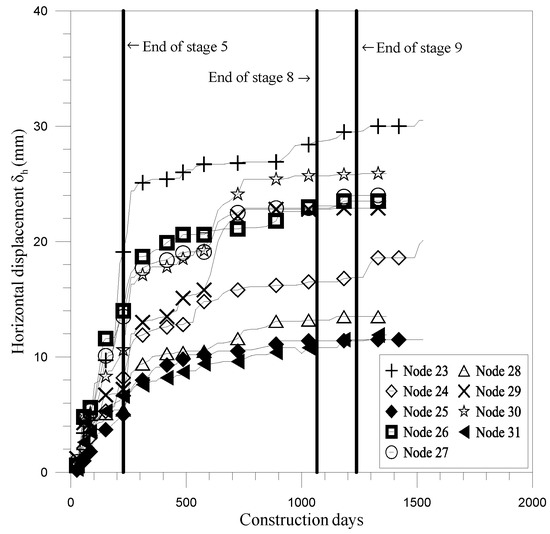
Figure 15.
Deflection of points 23–31.
It is widely reported that the maximum deflection of a retaining system generally occurs close to or around the bottom of the excavation [2,3,5,7]. Since the lateral deflection of the retaining wall along the depth of the excavation was not monitored, whether the maximum deflection of the wall occurred at the top of the retaining wall remains unknown in this study. Meanwhile, the deflection in the middle (nodes 5 and 6) was not greater than that on the edge (nodes 0, 1, 10 and 11) on the north side; therefore, the edge effect (where the lateral deflection of the retaining wall in the corner is normally smaller than at other locations) as reported by Tan and Wei [7], was not observed in this research study.
Figure 13, Figure 14 and Figure 15 depict that a significant amount of lateral deflection developed after the excavation reached the final depth, but most deflection nearly stabilized after a certain period of time. It is shown in Table 2 and Table 4 that the ratio of deflection at full backfilling to that at the final depth of the excavation was much smaller than that of settlement; however, the averaged increases in deflection and settlement per month at the top of the retaining wall were very close.
Table 4.
Comparison of deflection of top of retaining wall at final excavation and backfilling.
As shown in Figure 13, Figure 14 and Figure 15, different retaining systems featured different lateral displacement. The wall on the north side underwent the smallest average displacement, and the wall in the east experienced the greatest. The reason was that the properly arranged prestressing tendons in section I-I were very effective in controlling the lateral displacement, and the reduction in the layers of anchors resulted in greater lateral displacement on the west side of the pit. Meanwhile, surcharge from the existing building at east of the excavation caused the largest lateral displacement on the east side.
3.5. Relationship between Stiffness and Horizontal Deflection of Retaining Wall
In this study, the stiffness of the bored-pile wall was evaluated with the formula for retaining walls in soft-to-medium clay proposed by Clough et al. [23]:
where and are the elastic modulus of the retaining wall and the unit weight of water, respectively, and are the same for the whole retaining system; and are the second moment of inertia of the wall section and the average vertical spacing of a multipropped support system, respectively. Equation (1) was originally developed for braced retaining walls; however, generally, the maximum horizontal wall movement recorded from anchored walls is close to [24] or smaller than that of braced walls [25], and there are no discernable differences in the performance of propped and anchored walls [1]. Therefore, Equation (1) can be reasonably adopted to approximately evaluate the performance of the anchored walls in this study. Table 5 indicates that in this study, there was no clear relationship between the horizontal deflection of the top of the retaining wall and of the retaining system. This agrees with the finding that the maximum lateral deflection lacks dependency on in the literature [1,17]. It is reported that once the retaining wall has appropriate system stiffness, an additional increase in system stiffness does not result in smaller wall deflections [17,26]; therefore, the retaining system in this study had appropriate bending stiffness. In terms of lateral displacement at the top of the retaining wall, sections I-I and IV-IV had the most effective system stiffness (see Table 5). Furthermore, it seemed that the averaged vertical spacing of the anchors was independent of the horizontal displacement at the top of the wall, and this was similar to the finding that the maximum deflection of the retaining wall was not affected by the vertical support spacing for excavations in soft soils [2,3].
Table 5.
Relationship of stiffness and horizontal deflection at the top of the retaining wall.
3.6. Relationship between Ground Surface Settlement and Distance from Retaining Wall
Figure 16 indicates that with the current geometry, there was no obvious influence of the distance from the excavation on the settlement of the ground surface. Meanwhile, the maximum distance of the survey points from the excavation was about 3.0 H and lay beyond the range for settlement influence distance of 2.0 H in soft soils for worldwide cases [2] but fell within the influence zone of 1.5 H to 3.5 H for excavation in soft clays reported by Wang et al. [3].
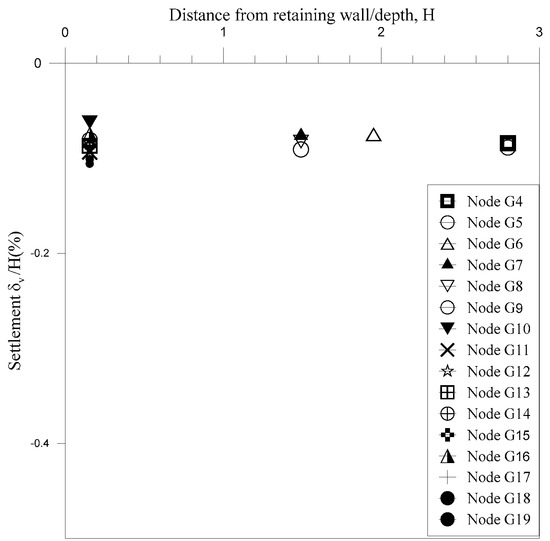
Figure 16.
Ground surface settlement versus distance from the retaining wall.
3.7. Relationship between Horizontal Deflection and Excavation Depth of Retaining Wall
The relationship between the horizontal deflection at the top of the retaining wall and the excavation depth is shown in Figure 17, Figure 18 and Figure 19, and these data were recorded until the excavation reached the final depth. Generally, the maximum horizontal deflection does not occur at the top of a braced or anchored retaining wall. The horizontal movement along the depth of the retaining wall was not recorded in this study; therefore, the relationship between the maximum horizontal movement and the depth of the excavation could not be determined in this study. The recorded deflection at the top of the retaining wall lay in 0.01–0.16% H in this excavation (Figure 17, Figure 18 and Figure 19), which was much smaller than the maximum deflection values in other excavations in soft soils: 0.1–1.0% H for deep excavations constructed with the bottom-up technique based on a large number of cases in Shanghai [3]; 3.2% H [1] and 0.1–10.1% H [2] for worldwide cases, but closer to 0.05–0.55% H based on 92 braced excavations in China [27]; and 0.1–0.55% H for most of 592 deep excavations built with the bottom-up technique in Shanghai soft clays [17]. Moreover, Tan et al. [17] reported that the central 50% of the maximum deflection of propped continuous bored-pile walls with the bottom-up technique in soft clays was 0.28–0.66% H, which was much greater than the observed lateral displacement at the top of the retaining wall in this study (see Figure 17, Figure 18 and Figure 19). It should be noted that the relationship shown in Figure 17, Figure 18 and Figure 19 might change when the long-term deformation of the retaining wall is included.
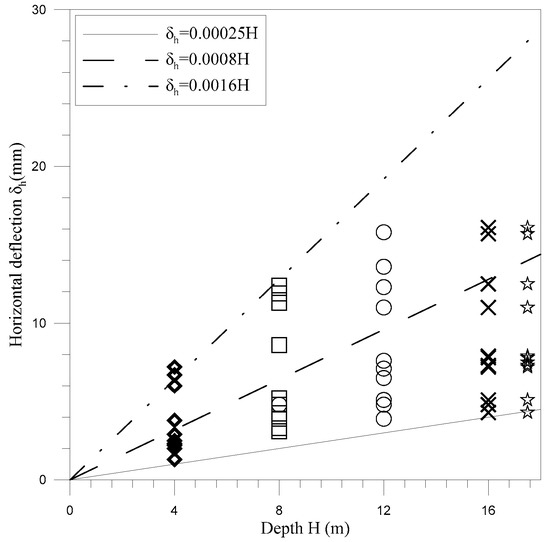
Figure 17.
Deflection of retaining wall versus excavation depth (nodes 0–11).
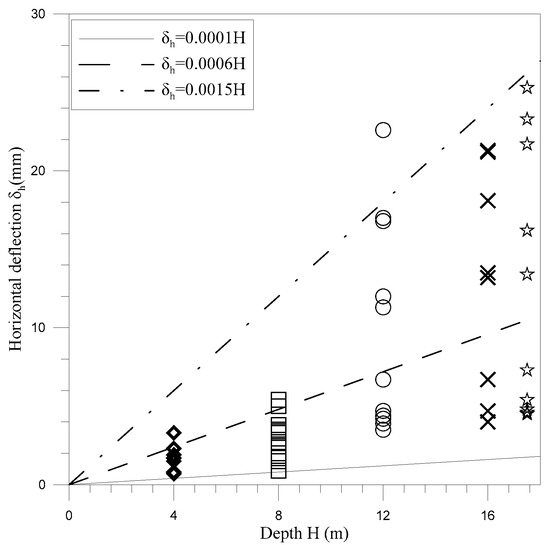
Figure 18.
Deflection of retaining wall versus excavation depth (nodes 12–22).
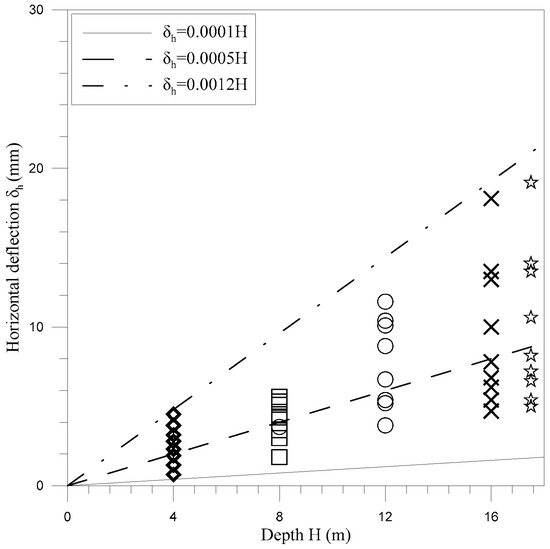
Figure 19.
Deflection of retaining wall versus excavation depth (nodes 23–31).
3.8. Relationship between Settlement and Horizontal Deflection at the Top of Retaining Wall
Figure 7, Figure 8, Figure 9, Figure 13, Figure 14 and Figure 15 indicate that generally the settlement at the top of the retaining wall was slightly smaller than the lateral deflection at the same location. It was also seen that in earlier phases of excavation, the horizontal deflection increased faster than the settlement and clearly stabilized before full backfilling, but the settlement increased more rapidly in later phases and almost kept increasing until backfilling.
Since the horizontal movement of the retaining wall along the depth was not monitored in this study, the ratio of settlement to the maximum horizontal deflection is not available in this study. Figure 20, Figure 21 and Figure 22 show that the minimum and maximum settlement-to-deflection ratios recorded at the top of the retaining wall were about 0.2 and 2.0, respectively. As far as the authors are aware, there is no relationship between the settlement and deflection at the top of the retaining wall available in the open literature; therefore, a direct comparison to other cases is not possible. For reference, for other deep excavations in soft soil, Xiao et al. [27] found that the ratio of the maximum ground surface settlement to the maximum movement of the retaining wall was in the range of 0.05–0.7 based on 92 cases, and Wang et al. [3] reported the range of 0.4–2.0 based on 300 cases in Shanghai, while Moormann [2] reported 0.5–2.0. However, Ou et al. [12] observed that the relationship was in the range of 0.56–0.78 for deep excavations.
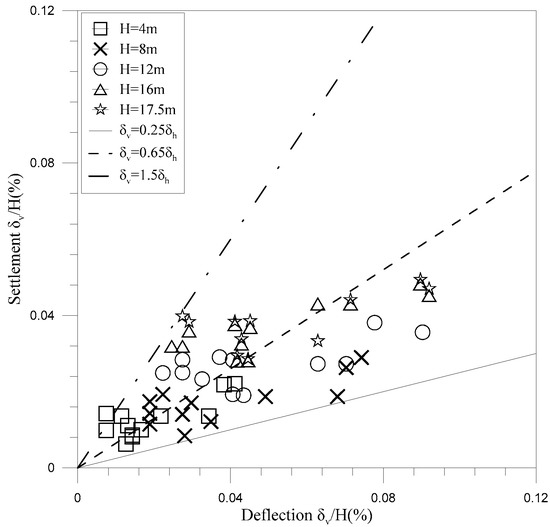
Figure 20.
Deflection and settlement of the retaining wall (nodes 0–11).
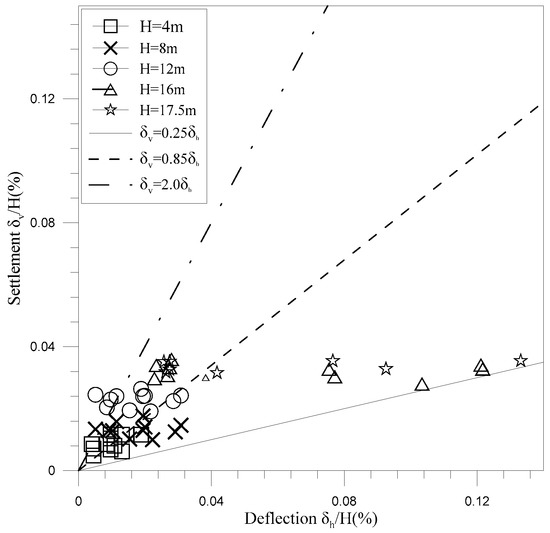
Figure 21.
Deflection and settlement of the retaining wall (nodes 12–22).
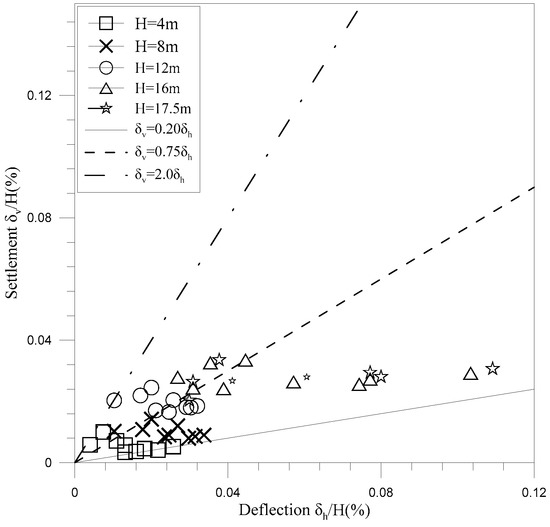
Figure 22.
Deflection and settlement of the retaining wall (nodes 23–31).
3.9. Time-Dependent Deformation of Retaining Wall after Excavation Reached Final Depth
As shown above, the settlement and deflection of the retaining wall continued to develop after the final depth was reached, and the recorded post-excavation settlement and deflection were much greater than those achieved during excavation. Table 2 and Table 4 indicate that the averaged ratio of deflection at full backfilling to deflection when the excavation reached the final depth was smaller than that of settlement at the top of the retaining wall. However, settlement and horizontal deflection at the top of the retaining wall developed at a rate of 0.23–0.25 mm/month, which was much smaller than the reported time-dependent deflection rates of retaining walls in soft soils of 0.1 to 0.6 mm/day [12] and 0.2–5.0 mm/day [16], and 3 mm/month for deep excavations in stiff clay and sand [14]. It is indicated in Table 3 that ground surface settlement developed at a rate of 0.25 mm/month after the excavation reached the final depth, which was much smaller than the 0.1 to 0.4 mm/day time-dependent rate reported by Ou et al. [12]. It seems that generally the time-dependent deflection of an excavation is greater in soft soils than in stiffer soils. Meanwhile, Ou et al. [12] reported that the time-dependent deflection was higher for the retaining wall with a greater ratio of the maximum lateral wall movement to the excavation depth, as accordingly, the stress level and creep behavior of the soil were greater. The ratio of the maximum horizontal deflection at the top of the wall to the excavation depth was relatively low (around 0.17% H) in this study, and this might explain why the time-dependent rate of ground surface settlement and lateral wall movement was lower than 0.1–0.4 mm/day, the rate of ground surface settlement and lateral wall movement reported by Ou et al. [12].
It is shown in Figure 7, Figure 8, Figure 9, Figure 10, Figure 11, Figure 12, Figure 13, Figure 14 and Figure 15 that after reaching the final depth, the displacement of the ground surface, retaining wall, and adjacent building kept increasing until full backfilling. Substantial increases should be studied since this time-dependent component may lead to an excessive deformation of the retaining wall and cause severe safety risks to the retaining system and adjacent constructions.
4. Conclusions
Based on the recorded data, the following conclusions could be drawn:
- For deep excavations with a retaining wall built with contiguous bored piles and tie-back anchors in clayey soil, when installation of enough prestressing tendons is not allowed, using double piles might be a practical choice, as comparable settlement and horizontal deflection of the retaining wall were achieved in this study.
- The measured settlement was generally smaller than the deflection recorded at the same location, the top of the retaining wall, in this excavation. The averaged settlement was around 57% (at the final depth)-74% (at full backfilling) of the deflection of the retaining wall in this study.
- The horizontal deflection and settlement of the retaining wall increased significantly after the excavation reached the final depth. For the deep excavation in this study, the recorded deflection and settlement at backfilling were about 1.9 and 2.5 times those at the final depth, respectively. Settlement and horizontal deflection at the top of the retaining wall developed at an average rate of 0.23–0.25 mm/month for a duration of 3.1 years. The deflection generally stabilized well before backfilling; however, the settlement of the retaining wall kept increasing until backfilling. As significant movement of the retaining wall was recorded after the excavation reached the final depth, it is essential to cast underground structures quickly following the completion of the excavation.
- Under the soil conditions and geometry in this study, the upward movement of the retaining concrete piles was not observed.
- After the excavation reached the final depth, the settlement of the ground surface and adjacent building continued to develop until the full backfilling of the excavation. The post-excavation settlement of the ground surface developed at a rate of 0.25 mm/month. The retaining system was effective in protecting the adjacent building during and after excavation.
Author Contributions
Conceptualization, P.Y. and Y.S.; methodology, Y.R.; formal analysis, P.Y. and Y.S.; investigation, P.Y.; data curation, P.Y.; writing—original draft preparation, P.Y.; writing—review and editing, Y.S. and Y.R.; supervision, Y.S.; project administration, Y.R. All authors have read and agreed to the published version of the manuscript.
Funding
This research received no external funding.
Institutional Review Board Statement
Not applicable.
Informed Consent Statement
Not applicable.
Data Availability Statement
The data are not publicly available due to restriction.
Conflicts of Interest
The authors declare no competing interest.
References
- Long, M. Database for retaining wall and ground movements due to deep excavations. J. Geotech. Geoenviron. Eng. 2001, 127, 203–224. [Google Scholar] [CrossRef]
- Moormann, C. Analysis of wall and ground movement due to deep excavations in soft soil based on a new worldwide database. Soil Found. 2004, 44, 87–98. [Google Scholar] [CrossRef]
- Wang, J.H.; Xu, Z.H.; Wang, W.D. Wall and ground movements due to deep excavations in Shanghai soft soils. J. Geotech. Geoenviron. Eng. 2010, 136, 985–994. [Google Scholar] [CrossRef]
- Lee, C.J.; Wei, Y.C.; Chen, H.T.; Chang, Y.Y.; Lin, Y.C.; Huang, W.S. Stability analysis of cantilever double soldier-piled walls in sandy soil. J. Chin. Inst. Eng. 2011, 34, 449–465. [Google Scholar] [CrossRef]
- Leung, E.H.Y.; Ng, C.W.W. Wall and ground movements associated with deep excavations supported by cast in situ wall in mixed ground conditions. J. Geotech. Geoenviron. Eng. 2007, 133, 129–143. [Google Scholar] [CrossRef]
- Zhang, H.B.; Chen, J.J.; Zhao, X.S.; Wang, J.H.; Hu, H. Displacement performance and simple prediction for deep excavations supported by contiguous bored pile walls in soft clay. J. Aerosp. Engr. 2015, 28, A4014008. [Google Scholar] [CrossRef]
- Tan, Y.; Wei, B. Observed behavior of a long and deep excavation constructed by cut-and-cover technique in Shanghai soft clay. J. Geotech. Geoenviron. Eng. 2012, 138, 69–88. [Google Scholar] [CrossRef]
- Liu, Y.; Xiang, B.H.; Fu, M.F. Observed performance of a large-scale deep triangular excavation in Shanghai soft clays. Geotecth. Geol. Eng. 2019, 37, 2791–2809. [Google Scholar] [CrossRef]
- Aboelela, A.E.; Ebid, A.M.; Fayed, A.L. Estimating the subgrade reaction at deep braced excavation bed in dry granular soil using genetic programming (GP). Results Eng. 2022, 13, 100328. [Google Scholar] [CrossRef]
- Cucuzza, R.; Devillanova, G.; Aloisio, A.; Rosso, M.M.; Marano, G.C. Analytical solutions for piles’ lateral deformations: The nonlinear stiffness case. Int. J. Mech. Sci. 2022, 229, 107505. [Google Scholar] [CrossRef]
- Kaczmarek, Ł.; Dobak, P.; Szczepański, T.; Kiełbasiński, K. Triaxial creep tests of glacitectonically disturbed stiff clay – structural, strength, and slope stability aspects. Open Geosci. 2021, 13, 1118–1138. [Google Scholar] [CrossRef]
- Ou, C.Y.; Liao, J.T.; Lin, H.D. Performance of diaphragm wall constructed using top-Down method. J. Geotech. Geoenviron. Eng. 1998, 124, 798–808. [Google Scholar] [CrossRef]
- Finno, R.J.; Bryson, S.; Calvello, M. Performance of a stiff support system in soft clay. J. Geotech. Geoenviron. Eng. 2002, 128, 660–671. [Google Scholar] [CrossRef]
- Finno, R.J.; Kim, S.; Lewis, J.; Winkle, N.V. Observed performance of a sheetpile-supported excavation in Chicago clays. J. Geotech. Geoenviron. Eng. 2019, 145, 05018005. [Google Scholar] [CrossRef]
- He, P.; Xu, Z.H.; Wang, W.D.; Li, Z.L. Observed performance of an ultra large deep excavation in Shanghai soft clay. In Proceedings of the GeoShanghai 2018 International Conference: Transportation Geotechnics and Pavements Engineering, Shanghai, China, 27–30 May 2018. [Google Scholar]
- Tan, Y.; Wei, B.; Zhou, X.; Diao, Y. Lessons learned from construction of Shanghai metro stations: Importance of quick excavation, prompt propping, timely casting and segmented construction. J. Perform. Constr. Facil. 2015, 29, 04014096. [Google Scholar] [CrossRef]
- Tan, Y.; Fan, D.D.; Lu, Y. Statistical analyses on a database of deep excavations in Shanghai soft clays in China from 1995–2018. Pract. Period. Struct. Des. Constr. 2022, 27, 04021067. [Google Scholar] [CrossRef]
- Liu, G.B.; Ng, C.W.W.; Wang, Z.W. Observed performance of a deep multistrutted excavation in Shanghai soft clays. J. Geotech. Geoenviron. Eng. 2005, 131, 1004–1013. [Google Scholar] [CrossRef]
- Tan, Y.; Li, M.W. Measured performance of one 26 meter deep top-down excavation in downtown Shanghai. Can. Geotech. J. 2011, 48, 704–719. [Google Scholar] [CrossRef]
- GB 50497-2009; Ministry of Housing and Urban-Rural Planning Development of the People’s Republic of China. Technical Code for Monitoring of Building Excavation Engineering. China Building Industry Press: Beijing, China, 2009.
- GB50010-2010; Ministry of Housing and Urban-Rural Planning Development of the People’s Republic of China. Code of Design of Concrete Structures. China Building Industry Press: Beijing, China, 2010.
- JGJ/T 220-2010; Ministry of Housing and Urban-Rural Planning Development of the People’s Republic of China. Technical Specification for Plasting Mortar. China Building Industry Press: Beijing, China, 2010.
- Clough, G.W.; Smith, E.M.; Sweeney, B.P. Movement control of excavation support systems by iterative design. In Proceedings of the ASCE Foundation Engineering: Current Principles and Practice, Evanston, IL, USA, 25–29 June 1989; ASCE: New York, NY, USA, 1989; Volume 2, pp. 869–884. [Google Scholar]
- Yoo, C. Behavior of braced and anchored walls in soils overlying rocks. J. Geotech. Geoenviron. Eng. 2001, 127, 225–233. [Google Scholar] [CrossRef]
- Wong, I.H.; Poh, T.Y.; Chuah, H.L. Performance of excavations for depressed expressway in Singapore. J. Geotech. Geoenviron. Eng. 1997, 123, 617–625. [Google Scholar] [CrossRef]
- Tan, Y.; Wang, D. Characteristics of a large-scale deep foundation pit excavated by the central-island technique in Shanghai soft clay. II: Top-down construction of the peripheral rectangular pit. J. Geotech. Geoenviron. Eng. 2013, 139, 1894–1910. [Google Scholar] [CrossRef]
- Xiao, H.J.; Zhou, S.H.; Sun, Y.Y. Wall deflection and ground surface settlement due to excavation width and foundation pit classification. KSCE J. Civ. Eng. 2019, 23, 1537–1547. [Google Scholar] [CrossRef]


Publisher’s Note: MDPI stays neutral with regard to jurisdictional claims in published maps and institutional affiliations. |
© 2022 by the authors. Licensee MDPI, Basel, Switzerland. This article is an open access article distributed under the terms and conditions of the Creative Commons Attribution (CC BY) license (https://creativecommons.org/licenses/by/4.0/).