Article

The Application of Two-Dimensional Continuous Wavelet Transform Based on Active Infrared Thermography for Subsurface Defect Detection in Concrete Structures

Sustainability and Reliability of Infrastructures Program, Energy and Building Research Center, Kuwait Institute for Scientific Research (KISR), P.O. Box 24885, Safat 13109, Kuwait
*
Author to whom correspondence should be addressed.
Buildings 2022, 12(11), 1967; https://doi.org/10.3390/buildings12111967
Submission received: 5 October 2022 / Revised: 29 October 2022 / Accepted: 4 November 2022 / Published: 13 November 2022
(This article belongs to the Section Building Structures)

Abstract

:
The early condition-based assessment of civil infrastructures plays an essential role in extending their service life, preventing undesirable sudden failures, and reducing maintenance and rehabilitation costs. One of the most commonly used and fastest nondestructive testing (NDT) techniques is infrared thermography (IRT), which has emerged as a powerful method for assessing general concrete quality and detecting subsurface damage in structural members. Nevertheless, the accurate detection and classification of localized defects is still a challenging task to achieve. The contribution made by enhancing defect detection using two-dimensional (2D) wavelet transformation (WT) as a post-processing method, however, has received little attention within the field of active IR thermography. In this study, we explored the use of continuous wavelet transform (CWT) to visualize how the wavelet function at different frequencies could enhance the damage features of thermal images. A concrete slab under an applied heat flux was tested experimentally by an IR camera with well-controlled excitation sources. The qualitative visualization of thermograms was translated into quantitative results by extracting, processing, and post-processing the values assigned to the pixels in the thermal images. With the assumption of there being no oriented damage features, an isotropic (non-directional) Mexican hat wavelet was utilized as the mother wavelet. The experimental results showed that the 2D-CWT method achieved strong detection performance in extracting discriminatory features (defective areas) from the acquired thermal images. Compared with raw thermograms, the resultant CWT-transformed images were less affected by the non-uniform heating effect, and the boundaries of the defects contrasted more strongly. The 2D-CWT method demonstrates good sensitivity when an appropriate wavelet type and scale factor are chosen. Due to the desire to detect localized defects, adjusting the scale factor of the wavelet is important to improve the efficiency of detection as lower scale factors provide the finer details of thermal images, whereas higher scale factors provide the general outline of internal defects. The findings of this study represent a further step toward improving thermographic data for more precise defect-detection imaging, and principally for large concrete structures, that can be verified easily using other NDT surveys.

Graphical Abstract

1. Introduction

Recent developments in the field of nondestructive evaluation (NDE) have led to extensive research on imaging concrete structures using infrared (IR) thermography. Nondestructive testing is used in the assessment of existing buildings, especially in cases where destructive testing techniques are impractical or may degrade the integrity of the structural members under investigation [1]. Since IR thermography images the surface conditions remotely within a reasonable period of time, several inspection and predictive maintenance programs have implemented regular thermographic surveys to ensure the proper serviceability of structures [2]. Based on the difference in the recorded temperatures at defective and non-defective zones, this technique is capable of capturing thermal images to detect cracks [3,4], subsurface defects [5,6], moisture damage [7,8], and corrosion [9,10]. Furthermore, previous studies have recognized the important role played by IR thermography in monitoring the condition of targeted infrastructures, such as water reservoirs (Figure 1) [11], bridges [12,13,14,15,16], sewer pipes [17], and roadways [18,19,20].
IR thermography (IRT) may be classified into its passive and active forms, based on the nature of the investigated object. In passive thermography, the radiation of the tested target is investigated without the use of any external heat source (stimulation). Conversely, the active approach measures the thermal response of the investigated body when its surface is heated using an external heat source [21]. These external sources may be flash lamps, halogen lamps, radiant heaters, thermal blankets, etc. [22,23]. For civil engineering applications, passive thermography is preferred by engineers for building diagnostics, monitoring the deformation under different loading conditions, and controlling the quality of weld seams. On the other hand, some applications (for example, the detection of defects) require significant temperature differences to be able to recognize the defect hot spots; hence, the active approach is implemented for such purposes [24].
Despite the safety and efficacy of IR thermal imagers [25] for the detection of subsurface damage conditions, there are several major limitations and practical constraints, which could lead to misleading interpretations of thermal data (or images). These include and are not limited to: (1) the sensitivity of the results to weather conditions (e.g., wind speed and solar radiation) [26] and to surface parameters (i.e., emissivity) [27]; (2) the absorption and scattering of some of the energy emitted from the surface of the tested object by atmospheric constituents; and (3) the distance between the camera and the tested object, which can affect the overall quality of the temperature measurements [28]. In addition, the manual analysis of thermographic data suffers from a high degree of uncertainty and its results are greatly subjective [29]. Therefore, the IRT is often used for qualitative rather than quantitative assessment, which is subject to the inspector’s personal judgement and professional experience [30].
To at least partially overcome the problems mentioned above, image processing is routinely applied to thermographic data to provide more reliable results and achieve better judgment, especially for cases demonstrating ambiguity [31]. Generally, image-processing techniques are classified into two types: (1) conventional, also known as traditional (e.g., absolute thermal contrast [32] and temperature distribution analysis [33]), and (2) advanced (e.g., principal component thermography (PCT) [34], partial least-squares (PLS) analysis [35,36], convolutional neural network (CNN) analysis [37], outlier analysis [38], and image segmentation [13,14]). Although conventional image-processing techniques are easily implemented, rapid, and straightforward, they might be inadequate for the damage detection process [39].
For dynamic thermography transform, wavelet-based image processing is more useful in applications where improving the signal power and reducing the noise are required [40]. This method has been successfully applied for several IRT-based condition-monitoring applications, such as an evaluation of damage to cylindrical shells [41], plate structures [42], concrete structures [43], composite materials [44,45], and bonded composites [46]. The wavelet transform (WT) technique has also been utilized for motor-related issues [47,48] and crack detection in metals [49], which are widely adopted in industrial diagnostic applications in practice.
A previously published study by Różański and Ziopaja [43] on concrete structures was devoted to applying 2D discrete wavelet transform (2D-DWT). Considering that continuous wavelet transform (CWT) has proven far more effective than DWT in reducing the noise that emerges in the discretizing process, it can be more reliable, especially for low-resolution images [50]. Furthermore, due to its continuous nature and flexible computational parameters, the CWT allows extracting more discriminatory features from images, compared to the DWT [51,52]. To the best of the authors’ knowledge, however, no attempt has been made to study the two-dimensional applicability of CWT as an image-processing technique for the thermographic inspection of concrete members. Therefore, the aim of the present paper is to evaluate the performance of the 2D-CWT as a local image-filtering technique for the detection of subsurface damage in concrete structures using active IRT. We also aimed to compare the performance of thermography-based temperature analysis against wavelet-based signal analysis and to highlight the limitations of each approach. In this study, the methodological approach that is taken is a mixed methodology that is based on a systematic literature review, experimental research, and data analysis and decomposition.
The remainder of the paper proceeds as follows: Section 2 discusses the specific methods by which previous IRT studies and analyses have been conducted; Section 3 gives a brief background to the application of continuous wavelet transform in image processing; Section 4 describes the experimental approach and instrumentation utilized in this study; Section 5 is concerned with the methodology for data processing and analysis; Section 6 presents the findings of this study and addresses each of the research questions in turn. The paper ends with our conclusions and recommendations in Section 7.

2. Literature Review

As previously mentioned, numerous investigations have been carried out using active/passive IRT, combined with various post-processing approaches for the non-destructive detection of internal defects. Among these investigations, Cotič et al. [53] quantitatively analyzed the IRT in concrete so as to detect two groups of defects (i.e., voids and delaminations) with different sizes and depths, based on thermal contrast and phase contrast techniques. The study demonstrated that the thermal contrast method was capable of detecting defects at a depth of up to ~0.9 multiplied by their size (D), while the phase contrast method was generally better in distinguishing defects located at deeper depths (of up to ~1.3D) beneath the concrete surface. Additionally, this laboratory test showed that the IRT detectability of voids and delaminations remained invariant in concrete specimens. The case study by Pedram et al. [54] demonstrated that the relation between the maximum thermal contrast of a defect and a certain depth was nonlinear under a convection heat exchange. The authors chose to model the thermal contrast (as a dependent variable) using a straightforward multivariate linear regression, based on the initial temperature of concrete and the depth of voids (as independent variables). This model would serve as a measure for studying the most favorable ambient conditions, in order to achieve a better detection performance. One study by Huh et al. [55] investigated the quantitative performance of the signal-to-noise ratio (SNR) in the detectability of embedded delaminations in a concrete slab undergoing continuous heating. The authors found that the SNR technique was reliable in detecting defects with depths of 1–7 cm, whereas a deeper 8-centimeter defect was not detected. Additionally, they stated that the existence of steel reinforcement above the delamination can greatly reduce its SNR, which will cause the detectability to be less effective. This view also accords with the earlier observations by Tran et al. [56], who reported that the steel rebars slightly reduced the absolute thermal contrast for delaminations that were located underneath the reinforcement, but this did not influence their detectability. During the test, it was difficult to recognize delaminations with a width-to-depth ratio (WTDR) of 1.25 at a depth of 8 cm, even with longer heating durations. In the same vein, Mac et al. [57] performed a similar series of IRT experiments on a concrete specimen strengthened with carbon fiber-reinforced polymer (CFRP) sheet employing thermal contrast, thermal signal reconstruction (TSR), and pulsed phase thermography (PPT) methods. The results indicated that installing CFRP sheets on the surface of concrete greatly enhanced the detectability of delaminations, in terms of absolute contrast. Furthermore, combining the results of the TSR and PPT algorithms yielded better results than the absolute thermal contrast method alone. Milovanović et al. [58] analyzed the thermographic data collected from concrete specimens (dimensions of 50 × 50 × 10 cm) under active conditions, using three post-processing techniques: PPT, PCT, and correlation operators. It was noticed by the authors that raw thermograms did not provide informative results regarding the location of the subsurface defects because of non-uniform heating and surface reflectance. On the other hand, by applying the correlation operators, it was possible to clearly observe defects with a radius–shortest dimension-to-depth (R/d) ratio of 1.25 at a depth of 4 cm beneath the surface. Defects with a lower R/d of 0.8 at a depth of 3 cm were confirmed with the PPT technique. In addition, PCT was more effective in identifying small defects, considering a sufficient number of empirical orthogonal functions (EOFs). Later, Cheng and Shen [59] compared time-series-based methods (that is, Fourier transform (FT)-based PPT, PCT, and high-order statistics (HOS)) to the traditional thermal contrast method for a single image. They found that time-series analysis, specifically, the phase image of PPT, PCT, and HOS, improved the detection performance of cavities in concrete and provided higher SNRs than when using a single-image approach. Furthermore, post-processing a sequence of images minimized the effects of surface reflectivity and non-uniform heat distribution. Another study by Milovanović et al. [60] focused on improving the IR detectability with a singular value decomposition (SVD)-based PCT method, which was applied to a sequence of thermal images for identifying circular defects in concrete. Despite the fact that SVD-based PCT has clearly enhanced the detectability of defects with different thicknesses ranging from 1 to 4 cm and with depths of up to 4 cm, the authors noticed that the quality of some PCT-EOF images was adversely impacted by the presence of uneven heat distribution from the halogen lamps and the concrete surface reflectivity. The test results showed that there was an inverse relationship between the number of detected defects and the distance from the halogen lamps to the concrete surface. Furthermore, it was shown that the higher the concrete compressive strength, the stronger the thermal contrasts and the better the SNRs. The numerical evaluation of the intensity of defects in a small-scale concrete beam was proposed as a damage index by Zhang et al. [61]. Prior to computation, the authors applied histogram equalization to the thermal images because of its lower error estimate and higher detectability rate, compared with other post-processing techniques (i.e., contrast adjustment and mean and Gaussian filters). The regression analysis revealed that the damage density index was strongly correlated ( r = 0.94) with the volume of subsurface defects, leading to a higher certainty regarding their surface area identification and monitoring.
The comparative study conducted by Mac et al. [62] described how the WTDR of subsurface defects, combined with the exposure time, can impact the simultaneous use of aerial and handheld thermal cameras. It has been demonstrated that delaminations that are located at 1–4 cm in depth, with WTDRs greater than or equal to 1.9, are detectable during the daytime, whereas thermographic inspection during the night-time required a larger WTDR of at least 2.5. Furthermore, even though the aerial thermography method lowered the inspection time compared with the conventional technique for passive conditions, it was found that handheld cameras provided slightly higher absolute thermal contrasts, compared with the aerial ones. Focusing on smaller WTDRs of 1.25 and more, Tran et al. [63] noted that defects as small as 5 cm × 5 cm with a depth of 4 cm could barely be detected when using a long-wave (LW) IR camera and an appropriate heating factor. The authors also concluded that an increase in the absolute thermal contrast of defects is associated with an increase in the WTDR and the amount of heat absorbed by the concrete surface. Huh et al. [64] assessed the use of the LWIR camera to investigate the detection of the minimum size and maximum depth of delaminations in a concrete block. It was noted that delaminations with surface areas of 100 cm2, 49 cm2, and 25 cm2, and with depths ranging from 1 to 2 cm were detected after 5 min of heat exposure. Smaller delaminations (i.e., 9 cm2) with a depth of 3 cm needed a longer heating time (>15 min) to detect but gave a clearer contrast after 12 min of cooling. The authors indicated that thermal images tended to overestimate (or underestimate) the observed (estimated) dimensions of damage, based on three main factors: the duration of heat exposure, the actual size of the defect, and its depth from the surface. In a different study, Różański and Ziopaja [65] compared the experimental implementation of two IR cameras with different thermal resolutions (or sensitivities), expressed as a noise-equivalent temperature difference (NETD), for the detection of voids in a small-scale RC slab. With the use of an IR camera at 0.05 K NETD, the closest defect to the surface (i.e., 1.5 cm) was detected after around 90 s but showed 80% of its original size after 9 min of heating. However, an IR camera with a lower NETD value of 0.025 K was found to be slightly more effective in approximating the actual size of the shallow defect, with a percentage of 90%.
In a recent study, Ishikawa et al. [66] assessed the detectability performance of an active IRT in five different concrete compositions (i.e., without aggregate, with normal 20-millimeter coarse aggregate and its half amount, with copper slag as an aggregate, and with fly ash as a part of the sand component). The authors also aimed to investigate whether the problem of surface discoloration had a direct effect on detectability, and, finally, to recommend ways to overcome this drawback (if any). Their analysis revealed that the thermal contrasts of artificial defects are almost constant in all concrete specimens. However, the concrete discoloration caused by efflorescence reduced the observed thermal contrast, which made the defects difficult to detect. In a different study, Farrag et al. [67] assessed similar damage in terms of size and depth, based on the application of IRT in different types of concrete mixtures (i.e., normal-weight and lightweight, high-strength, and self-consolidated mixtures). It has been noted that lightweight concrete provided the least estimate of defect detection probabilities in the study. Conversely, high-strength concrete had the highest detectability influence on the defects. This was mainly attributed to the higher density and thermal conductivity in the high-strength concrete than in other concrete mixes. In addition, for any concrete mix, it was recommended by the authors that defects with depths of up to 10 cm should have a lower threshold of 0.45 R/d ratio to be able to recognize them. According to Belattar et al. [68], the capability of IRT can vary depending on the types of defects. For instance, air voids were clearer and more visible than honeycomb areas because of their lower thermal conductivity.
Raja et al. [26] experimentally studied the effect of variable defect areas (with the same excitation power) on the absolute thermal contrast obtained from two concrete slabs. They revealed that a change in the size of a defect had a notable impact on its surface contrast. For example, at a 6.4-centimeter depth from the surface, the absolute thermal contrast for the delamination, with an area of 200 cm2, became three times larger than that for the 100 cm2 delamination. Increasing wind speed has been reported to have an adverse effect on the detectability performance, primarily for deeper delamination. Conversely, an increase in the total heat flux contributed to an increase in the recorded thermal contrast. Pozzer et al. [69] developed a set of local models that incorporate realistic environmental conditions and inspection parameters in the temperature determination of defective and sound concrete areas. The dataset contained 2376 images of cast-in-place specimens, from which 792 observations were utilized for statistical validation. From the regression analysis, it was found that the most important variables that emerged during the passive inspection included ambient temperature, time of inspection, and the amount of solar radiation, as well as atmospheric pressure. In terms of real ambient conditions, Hiasa et al. [70] concluded that the detection probability of deeper defects (at 5 and 8 cm of depth) might be largely inherited, for two main reasons: one regarding the effect of the surrounding environment, which is much stronger than the effect of deep delamination, and one involving the low temperature difference between the sound and defective zones, which is, respectively, smaller than and closer to the camera’s accuracy and temperature sensitivity. To examine the most effective time window for data collection, Hiasa et al. [71] performed a series of numerical simulations and field experiments. It was found that night-time was preferable for IRT inspection, in order to reduce the noise and the misleading information. However, the interchange period, which occurred between the daytime (heating cycle) and the night-time (cooling cycle), exhibited results that were below the detection limit and must be avoided in the analysis.
In a different study, Raja et al. [72] conducted similar experiments on concrete blocks to simulate a passive IRT inspection on bridge deck locations that had limited exposure to downward solar radiation. For areas with no solar radiation, the rise in surrounding air temperature became the dominant influence of thermal contrast (occurring within a relatively short period). The scenario with indirect radiation had a higher impact than the ambient temperature and provided a sufficient intensity (>600 W/m2) to achieve a recognizable contrast. In any case, the depth and the size of defects appeared to have a negligible influence on the temporal peaks of thermal contrast profiles. In a different study, Mac et al. [73] examined the effect of variable depths and inspection times on the detection of delamination areas that were located near the deck face and soffit face of a concrete bridge, under natural conditions. To mimic the conventional RC deck, the authors designed two reinforced concrete specimens and placed square pieces of polystyrene as artificial defects, with depths ranging from 4 cm to 19.5 cm. Deck and soffit defects at up to 19.5 cm in depth were indicated, without the use of any post-processing techniques. After utilizing the PCT technique, it was observed that the defect visibility and locations were further enhanced, especially in the case of deep deck defects. The recommended IRT inspection timing was during two periods: (i) from 7 h after sunlight exposure to 0.5 h after sunset, and (ii) at 1.5 to 3.5 h after sunset. In the case of there being no direct sunlight, Rocha et al. [74] evaluated the possibility of delamination detection by relying on the change in ambient temperature. The thermal gradient in concrete depended greatly on the ambient temperature difference estimated between day and night, where the lowest limit for detection was observed to be 5.4 °C. Raw thermograms recorded during the daytime, specifically at noon, exhibited better detection results and greater thermal contrast than were achieved during the night-time. The experiments showed that an increase in relative humidity, when associated with a decrease in ambient temperature, can slightly reduce the extent to which defects are correctly detected. A recent study by Coleman and Schindler [75] offered conflicting conclusions on the performance of the IRT test regarding their applicability in a large-scale concrete specimen (which simulates a typical bridge deck). The authors showed that passive IRT was almost totally ineffective in locating any defect, due to the prolonged cooling effect of water runoff. Furthermore, the localized staining on the concrete, recorded as hot spots, caused some ambiguity, which made it difficult to identify the existence of delaminations underneath the surface (if any). However, it has been generally noted that this can be somewhat remedied by proper planning in terms of testing time, environmental factors, and surface conditions.
Recently, there have been breakthroughs in terms of improving the IR detectability of deeper defects via continuous time-lapse thermography (TLT). Al Gharawi et al. [76] proposed an automated framework in which data decomposition using 1D-CWT, image reconstruction, and boundary extraction techniques were implemented. The time-frequency domain amounted to improving the robustness of the proposed method and retaining the analyzed points where the signal of temperature variation is significant. For deep defects located between 7.6 and 12.7 cm in depth, the automated TLT method clearly exhibited enhanced contrast (as estimated by SNR) and better noise reduction than with the application of traditional and lock-in thermography. In spite of the great achievements made in this area, the need for a very long time series constitutes an important limitation to its use in large-scale applications.

3. Theoretical Background of CWT

The use of Fourier transform (FT) is a well-established approach in signal processing [77,78]. It offers an effective way of computational power and allows for easy data analysis and interpretation [79]. When using the classical Fourier transform, however, the non-stationary signals tend to lose their time information. This can pose a problem when there is a need to extract certain features [80]. In particular, the damage feature exhibits a simultaneous impact on image pixels, in terms of their intensity and distribution in the spatial domain and frequency domain, respectively [50]. In order to consider this limitation, the continuous wavelet transform method can be implemented to better visualize the signal by preserving its time and frequency information [81].
The 2D-CWT is a time-scale representation of an image [82]. For all admissible wavelets, the 2D-CWT (i.e., at a given scale a > 0) acts as a band-pass filter, illustrating the details or the oscillating features in the images [83]. The mother wavelet function ψ ( x ) is considered to be admissible on a real plane, x 2 , if its Fourier transform ψ ^ satisfies the condition [84]:
ψ ^ ( 0 ) = 0 2 ψ ( x ) d 2 x = 0 .
Given a scale parameter ( a ), position vector ( b ), and angle ( θ ), the ψ ( x ) can be transformed under dilation, translation, and rotation, as in [85]:
ψ a , b , θ ( x ) = a 1 ψ r θ 1 ( x b a ) ,       a + ,   b 2
where r θ is the 2D rotation matrix of the rotating angle ( θ ) and is the set of real numbers. The r θ is given by [86]:
r θ = cos θ sin θ sin θ cos θ ,       θ 0 , 2 π
The resulting 2D-CWT can be expressed in the time domain as [87]:
W T f ( a , b , θ ) = 1 a + f ( x ) ψ * r θ 1 ( x b a ) d 2 x , f ( x ) L 2 ( 2 , d 2 x )
where W T f is the wavelet transform; the asterisk ( ) superscript indicates the complex conjugate function of the analyzing mother wavelet function, ψ . f ( x ) is the 2D signal function (input image) belonging to the Hilbert L 2 ( 2 , d 2 x ) space of measurable, square-integrable 2D functions on the plane. Here, 1 / a is the energy-normalized factor [88].
It is beyond the scope of this article to describe the CWT method, giving all the mathematical details. However, we refer the interested reader to Antoine et al. [89], Antoine [90], and Toufik and Mokhtar [91].

4. Experimental Program

4.1. Concrete Specimen

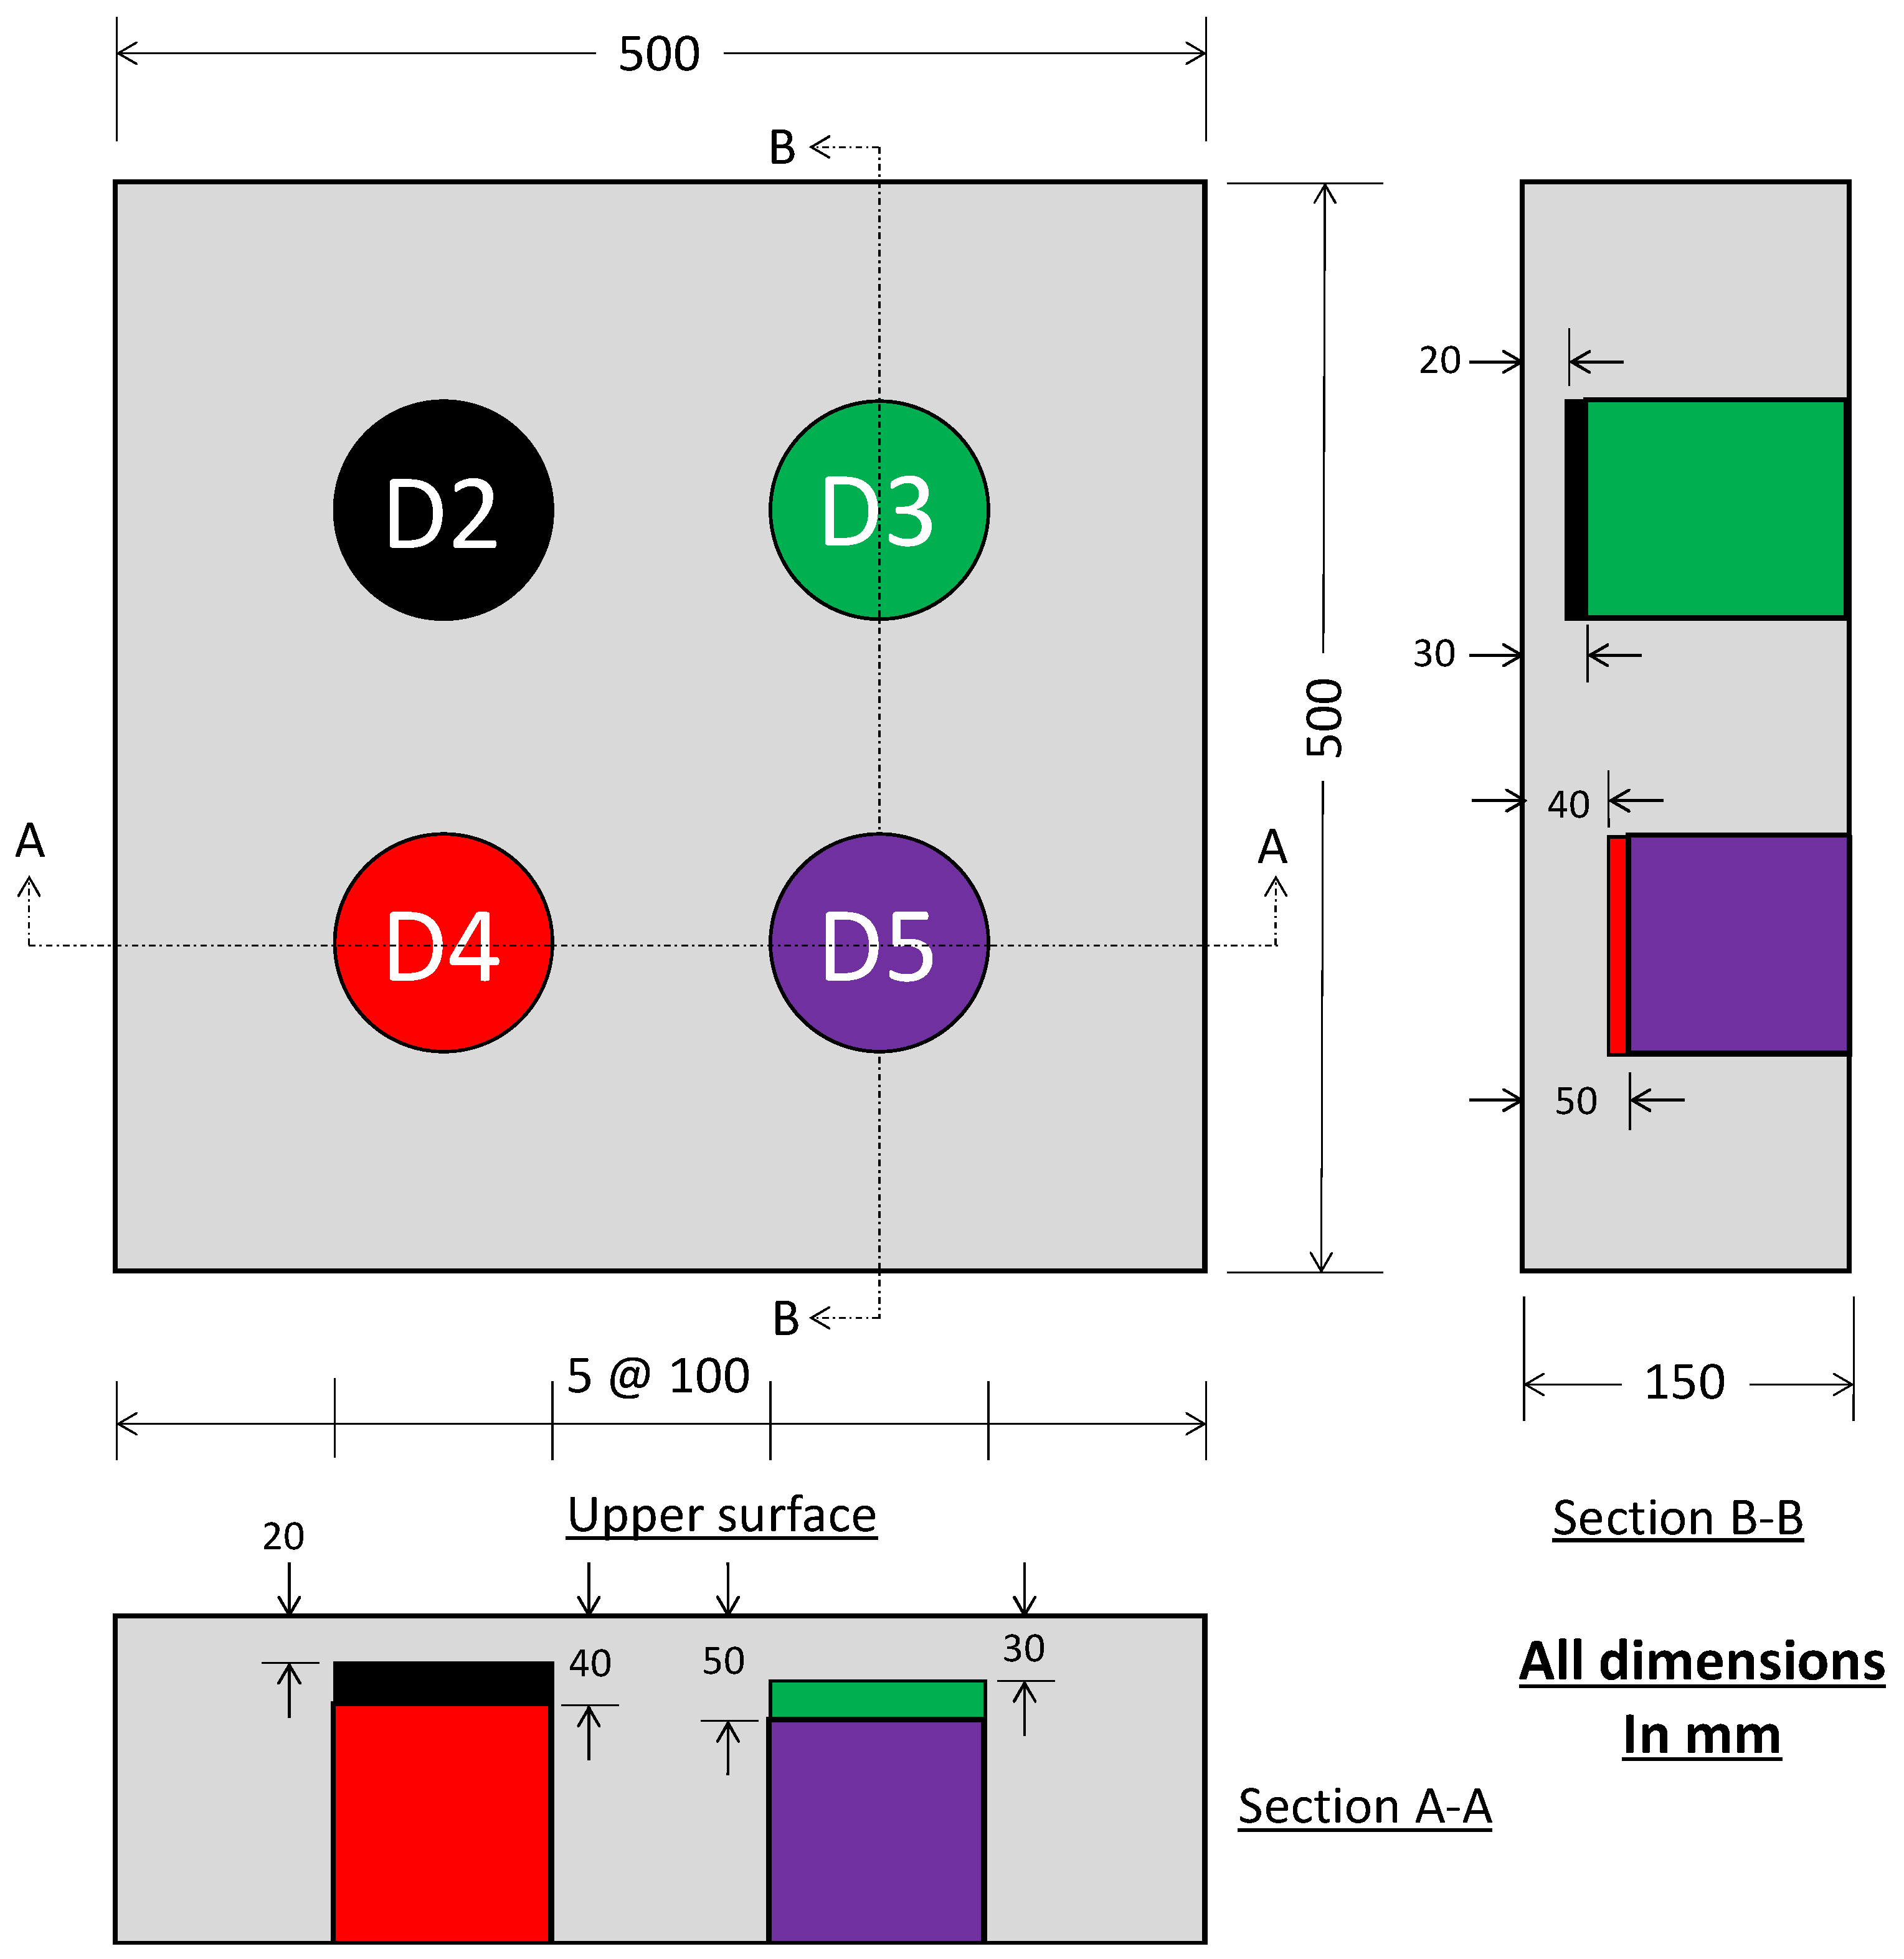
A small-scale concrete specimen (50 × 50 × 15 cm in dimensions) was constructed, with four cylindrical-shaped defects in different arrangements. Figure 2 shows the top and side views of the specimen, with the dimensions and the embedded voids/defects. All defects were 10 cm in diameter. However, their depths varied from 2 to 5 cm. For clarity, the corresponding defects are referred to herein as D n , where n denotes the depth of the defect below the concrete’s surface. To simulate the subsurface voids inside the concrete specimen, round Styrofoam pieces in well-known locations were used because the Styrofoam material has low thermal conductivity ( k S = 0.027 W/m°C), close to that of air itself ( k a i r = 0.024 W/m°C) [69]. The Styrofoam pieces were glued to the bottom surface of the mold (Figure 3a) to prevent any possible movement during the concrete pouring process.
The concrete mix was designed for a cube-compressive strength of 45 MPa, after 28 days of moist curing. A typical mix proportions of the concrete slab were calculated, as per the standard codes in the textbook by Kosmatka et al. [92], and are given in Table 1. The total volume of mixed concrete was 0.05 m3, to cast the slab and three 10-centimeter test cubes. Before casting the specimen, the plywood formwork was carefully cleaned and oiled with a form-release agent, to ensure easy formwork removal and to reduce the water’s absorption by the plywood [93].
For practical reasons, the concrete specimen was cast in layers that were compacted using a vibrating table. The cast slab and the cubes were covered with plastic film for 24 h. The effect of concrete mix shrinkage on the thickness of the concrete cover is minimal and is thus considered negligible, as in the study by Pedram et al. [54]. After demolding, the Styrofoam pieces (void-like defects) were left inside the concrete specimen. The concrete slab and the test cubes were soaked continuously inside water-curing tanks at room-ambient conditions (Figure 3b). The concrete cubes were tested for compressive strength, in accordance with BS EN 12390-3 [94], on the same day as conducting the IR thermographic test (Figure 3c). The 59-day compressive strength results and hardened concrete properties are shown in Table 2.

4.2. Active IRT Setup

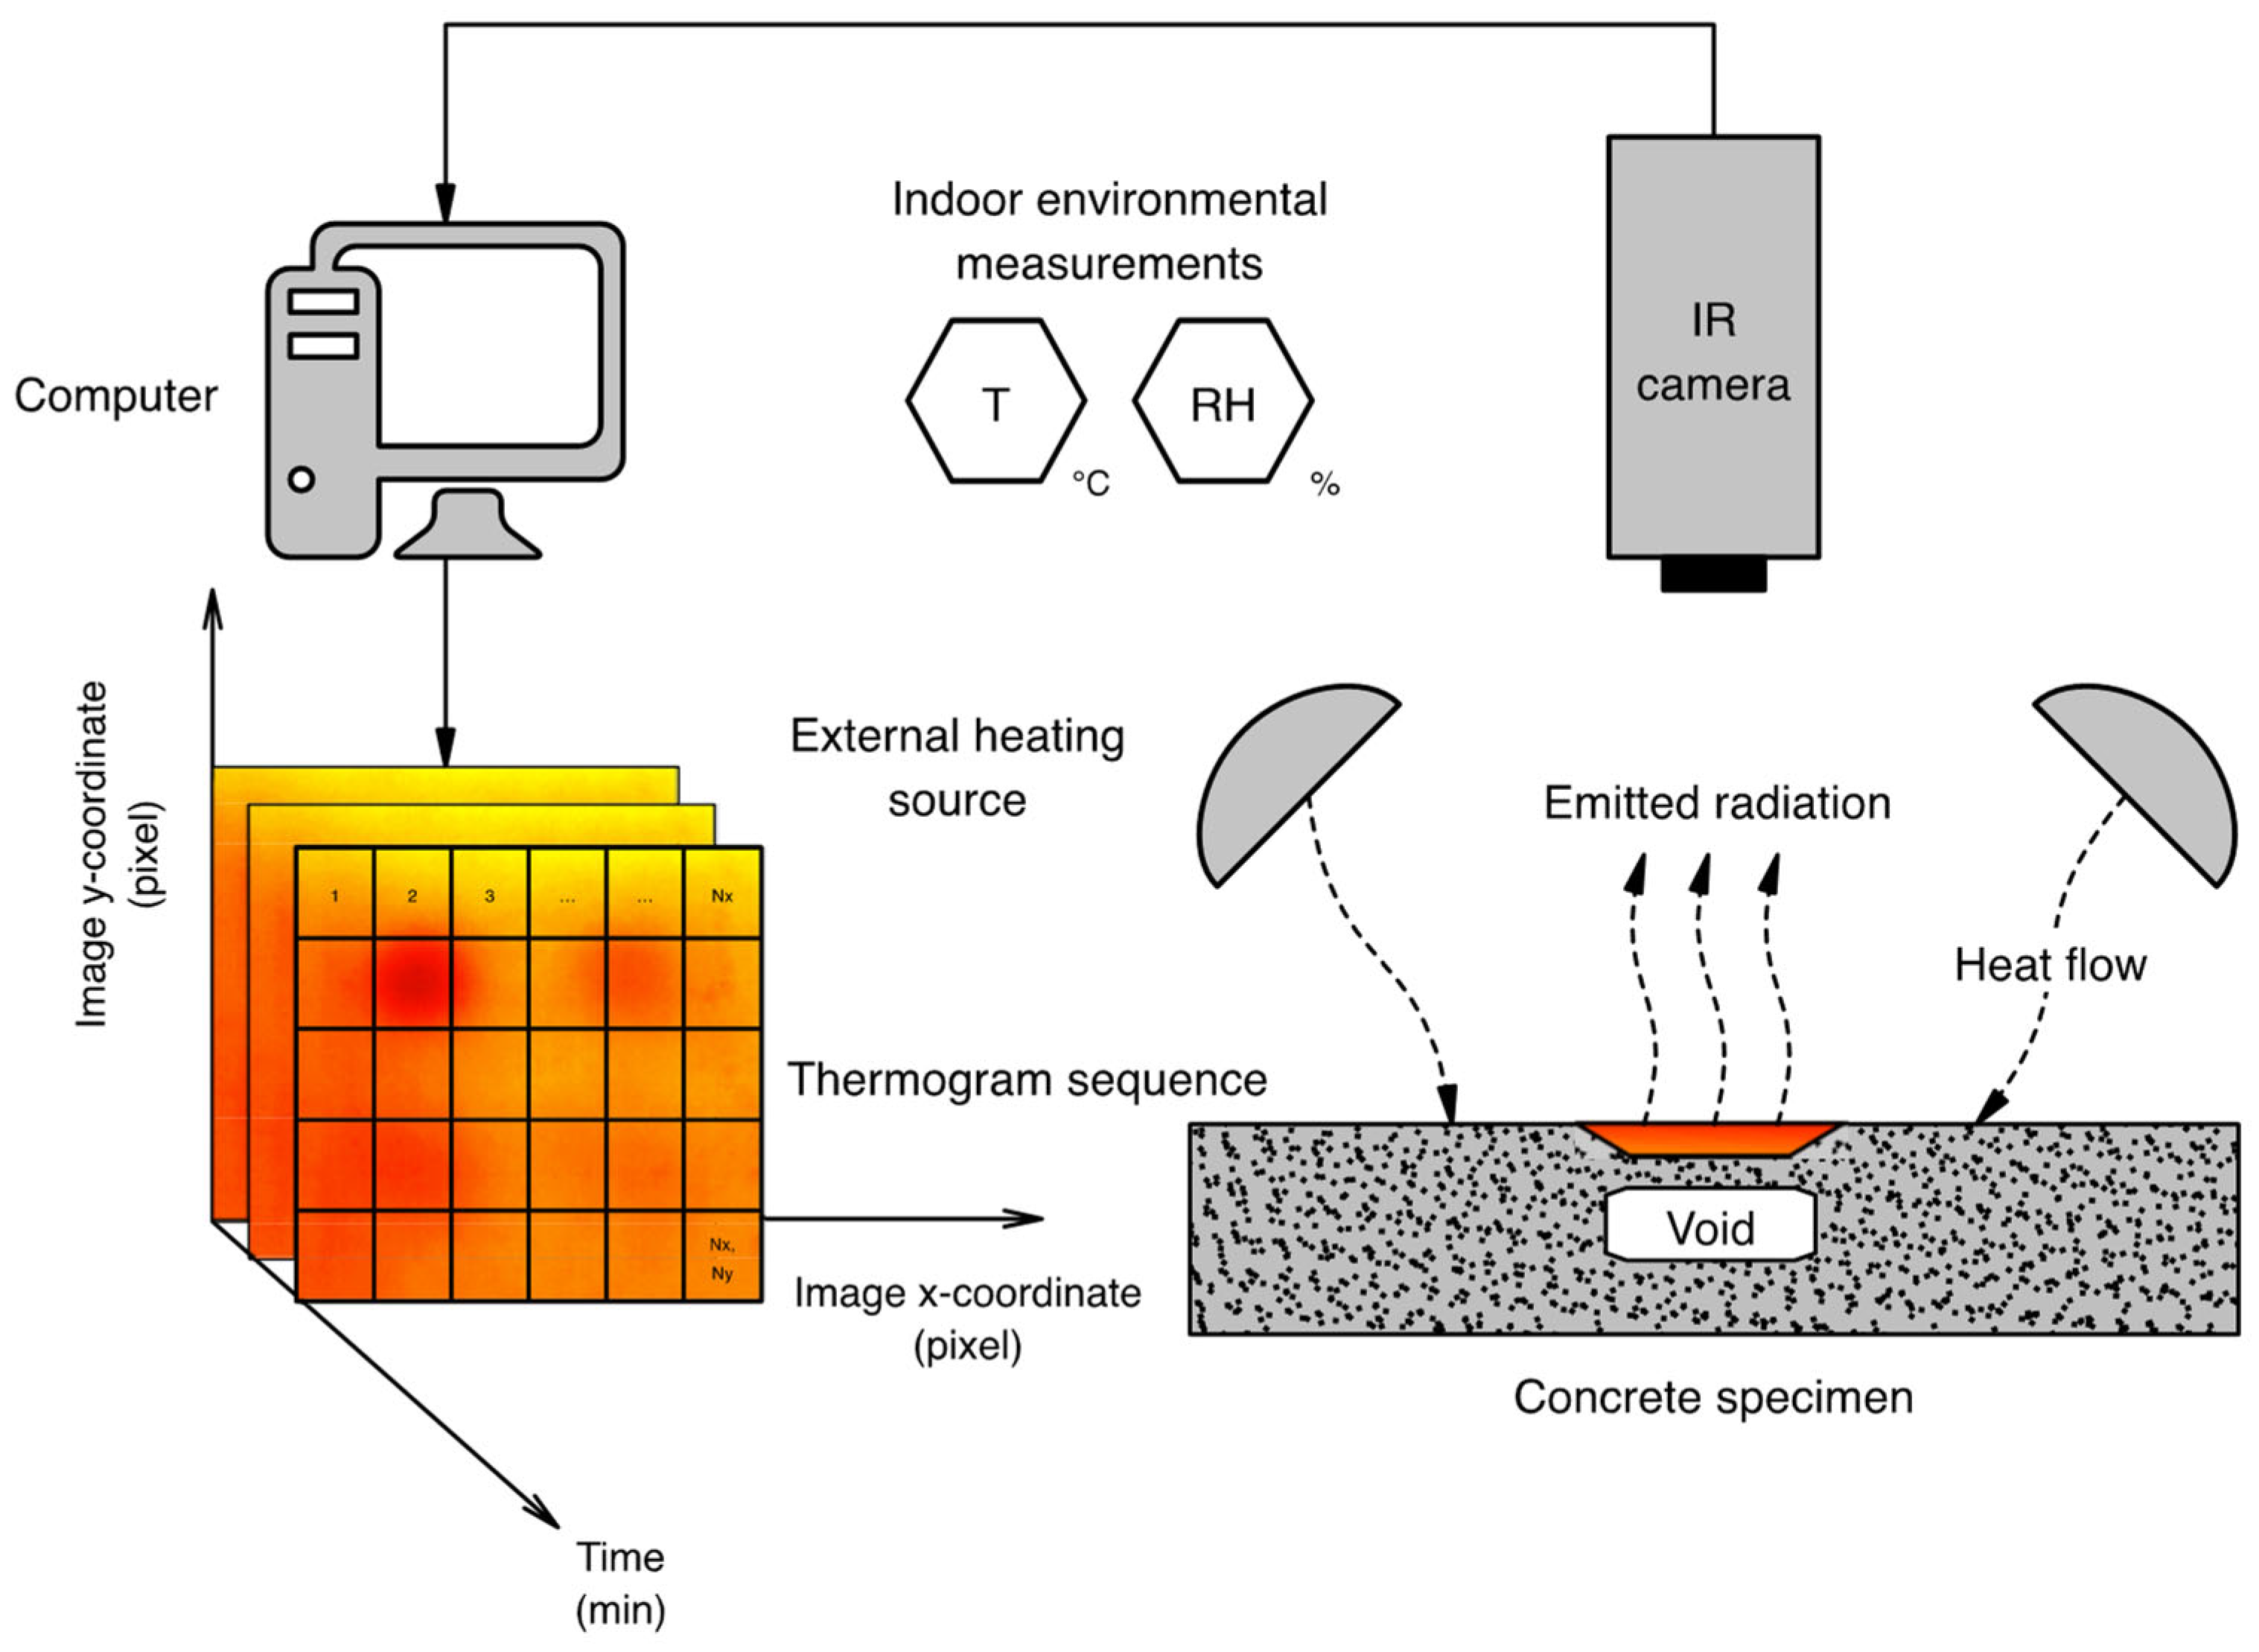
In the following subsections, we will describe the details of each step, referring to the experimental IRT setup, for which a simplified schematic layout is shown in Figure 4.

4.2.1. Temperature and Humidity Sensor

The ambient temperature (T) and relative humidity (RH) inside the laboratory were continuously monitored and recorded during the entirety of the testing period, using a digital thermometer. Overall, the temperature and relative humidity ranges were 19.3–21.6 °C and 39–43%, respectively.

4.2.2. Infrared Camera

An ICI IR 640P infrared camera was used for real-time thermal imaging at a 640 × 480-pixel resolution. The camera is equipped with an uncooled microbolometer detector, which offers a thermal sensitivity (or temperature resolution) of less than 50 mK (0.05 °C) and a measurement accuracy of ±1 °C (or ±1%). It operates at a spectral range of 7–14 μm. The frame rate of this IR camera is 30 Hz. The field of view (FOV) of the optics is 50 ° × 37.5 ° . The operating temperature range is between –40 °C and +80 °C. The camera system’s capture rate was 6 frames per minute during the heating and cooling phases. To improve efficiency, the IR camera system was connected to and operated from a computer; the thermographic test has been automated and remotely controlled. The IR camera was placed a few centimeters behind the excitation sources. Access to the study area was restricted with a warning tape, to avoid interruptions to the thermal radiation by individuals passing nearby.

4.2.3. Thermal Excitation Source

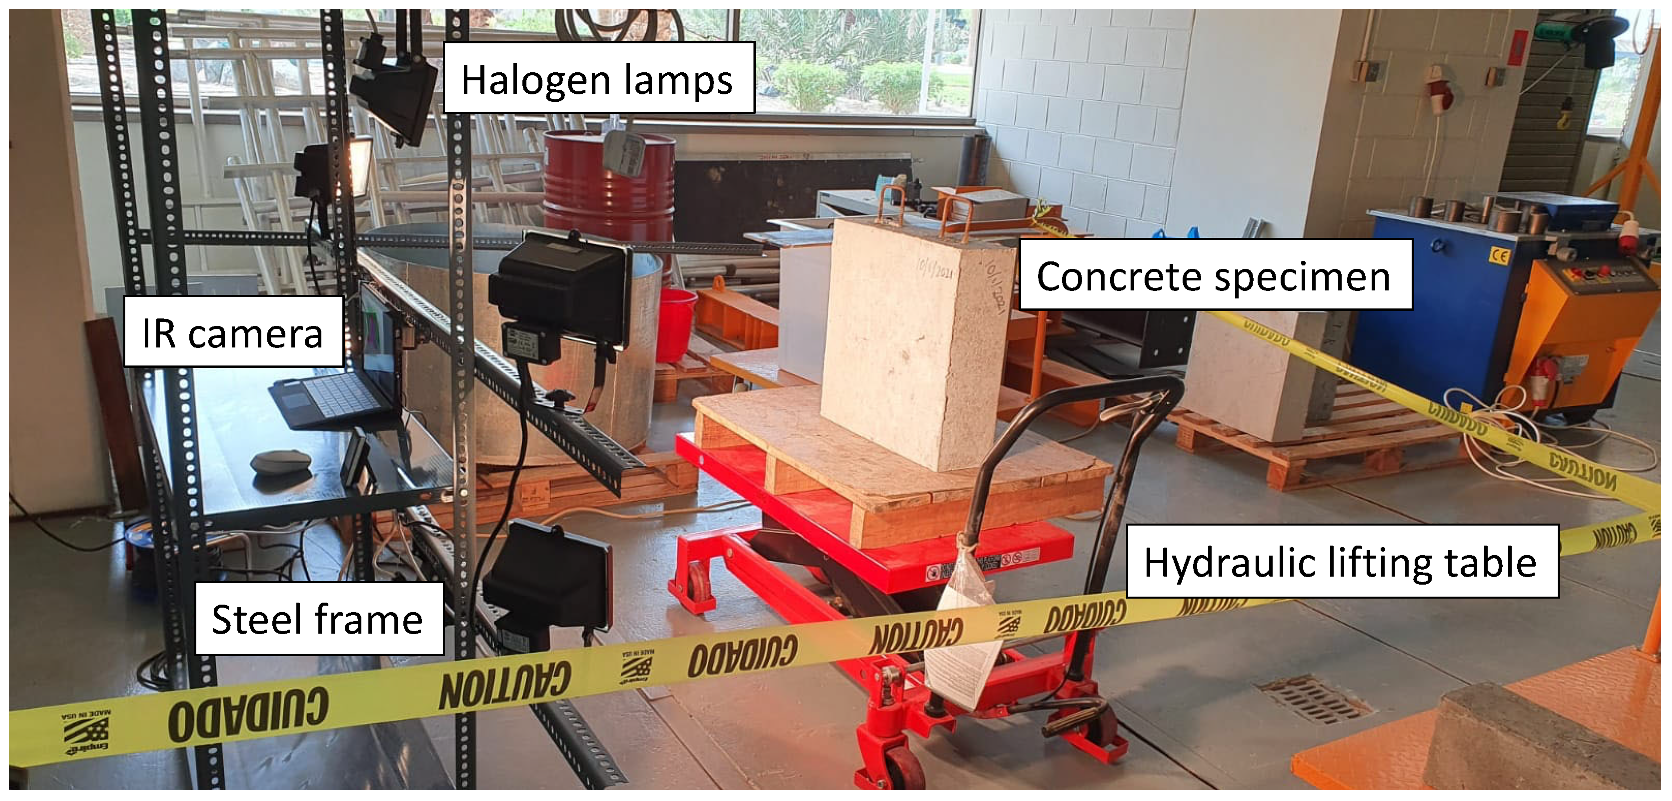
Four halogen lamps, each with 400 watts of power (supplying 1600 watts in total), were used as a thermal excitation source. The halogen lamps were mounted on a modular steel frame. They were located at a distance of ~1.17 m away from the tested concrete specimen and were tilted at a slight angle, to obtain reasonably uniform heat distribution on the surface (Figure 5). A hydraulic lifting table was used to support the concrete slab in the required position and allow its safe handling. Due to the low thermal diffusivity of concrete, compared to other materials [53] and, consequently, the slow rate of heat flow through its cross-section, the specimen was heated for 2 h. At the end of the heating stage, the halogen lamps were turned off and the concrete slab was allowed to gradually cool down at room temperature for 1 h. Figure 6 displays the complete view of the experimental setup that was employed in this study.

5. Data Acquisition and Processing

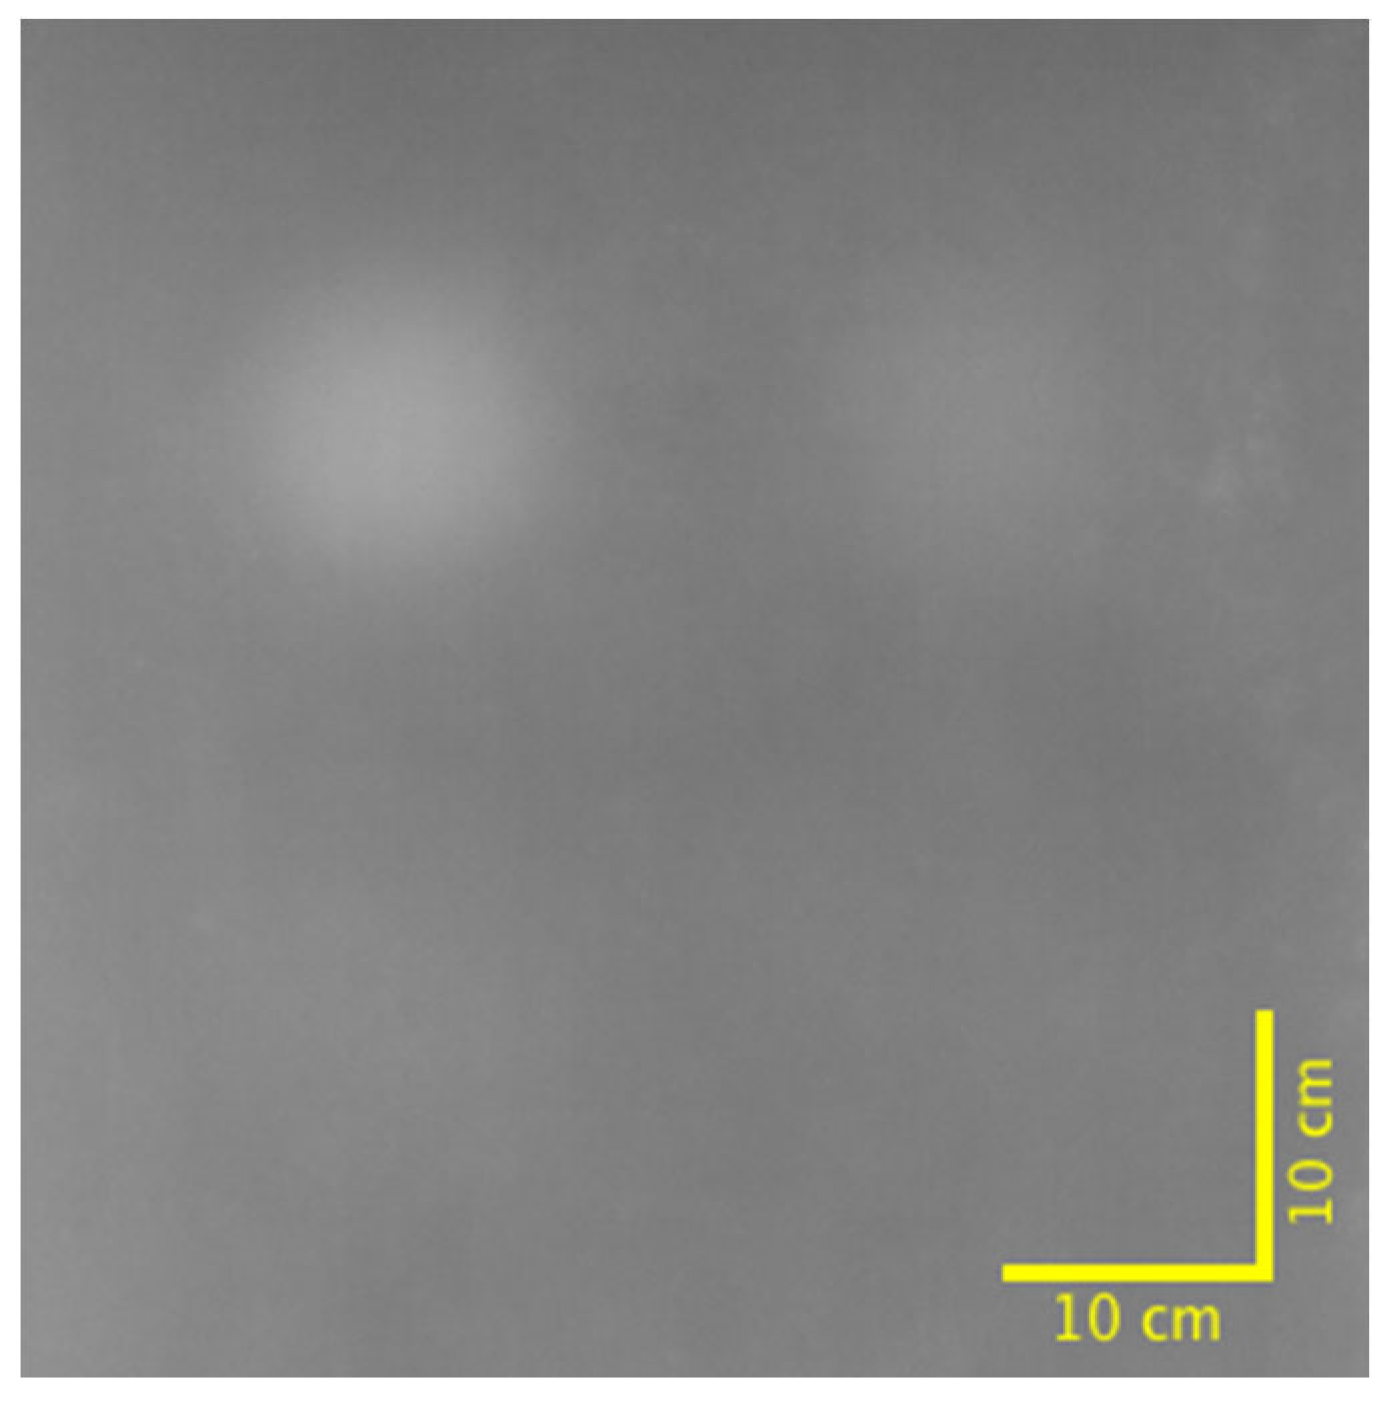
During the laboratory test, we used the built-in IR Flash© software (version 2) to handle and control all the basic operations of the IR camera. During the acquisition process, the temperature span of the camera was adjusted and maintained at a constant level (19–32 °C). The data acquisition for the sequence of IR thermal images was carried out using the system’s software. The acquired thermal images were displayed in a grayscale palette comprising 256 levels. The spatial resolution of the acquired images was 6.5 pixels per cm. As an illustration, Figure 7 shows the metric for a true scale of a 10-centimeter length (i.e., 65 pixels in each direction), over a snapshot of the block specimen.
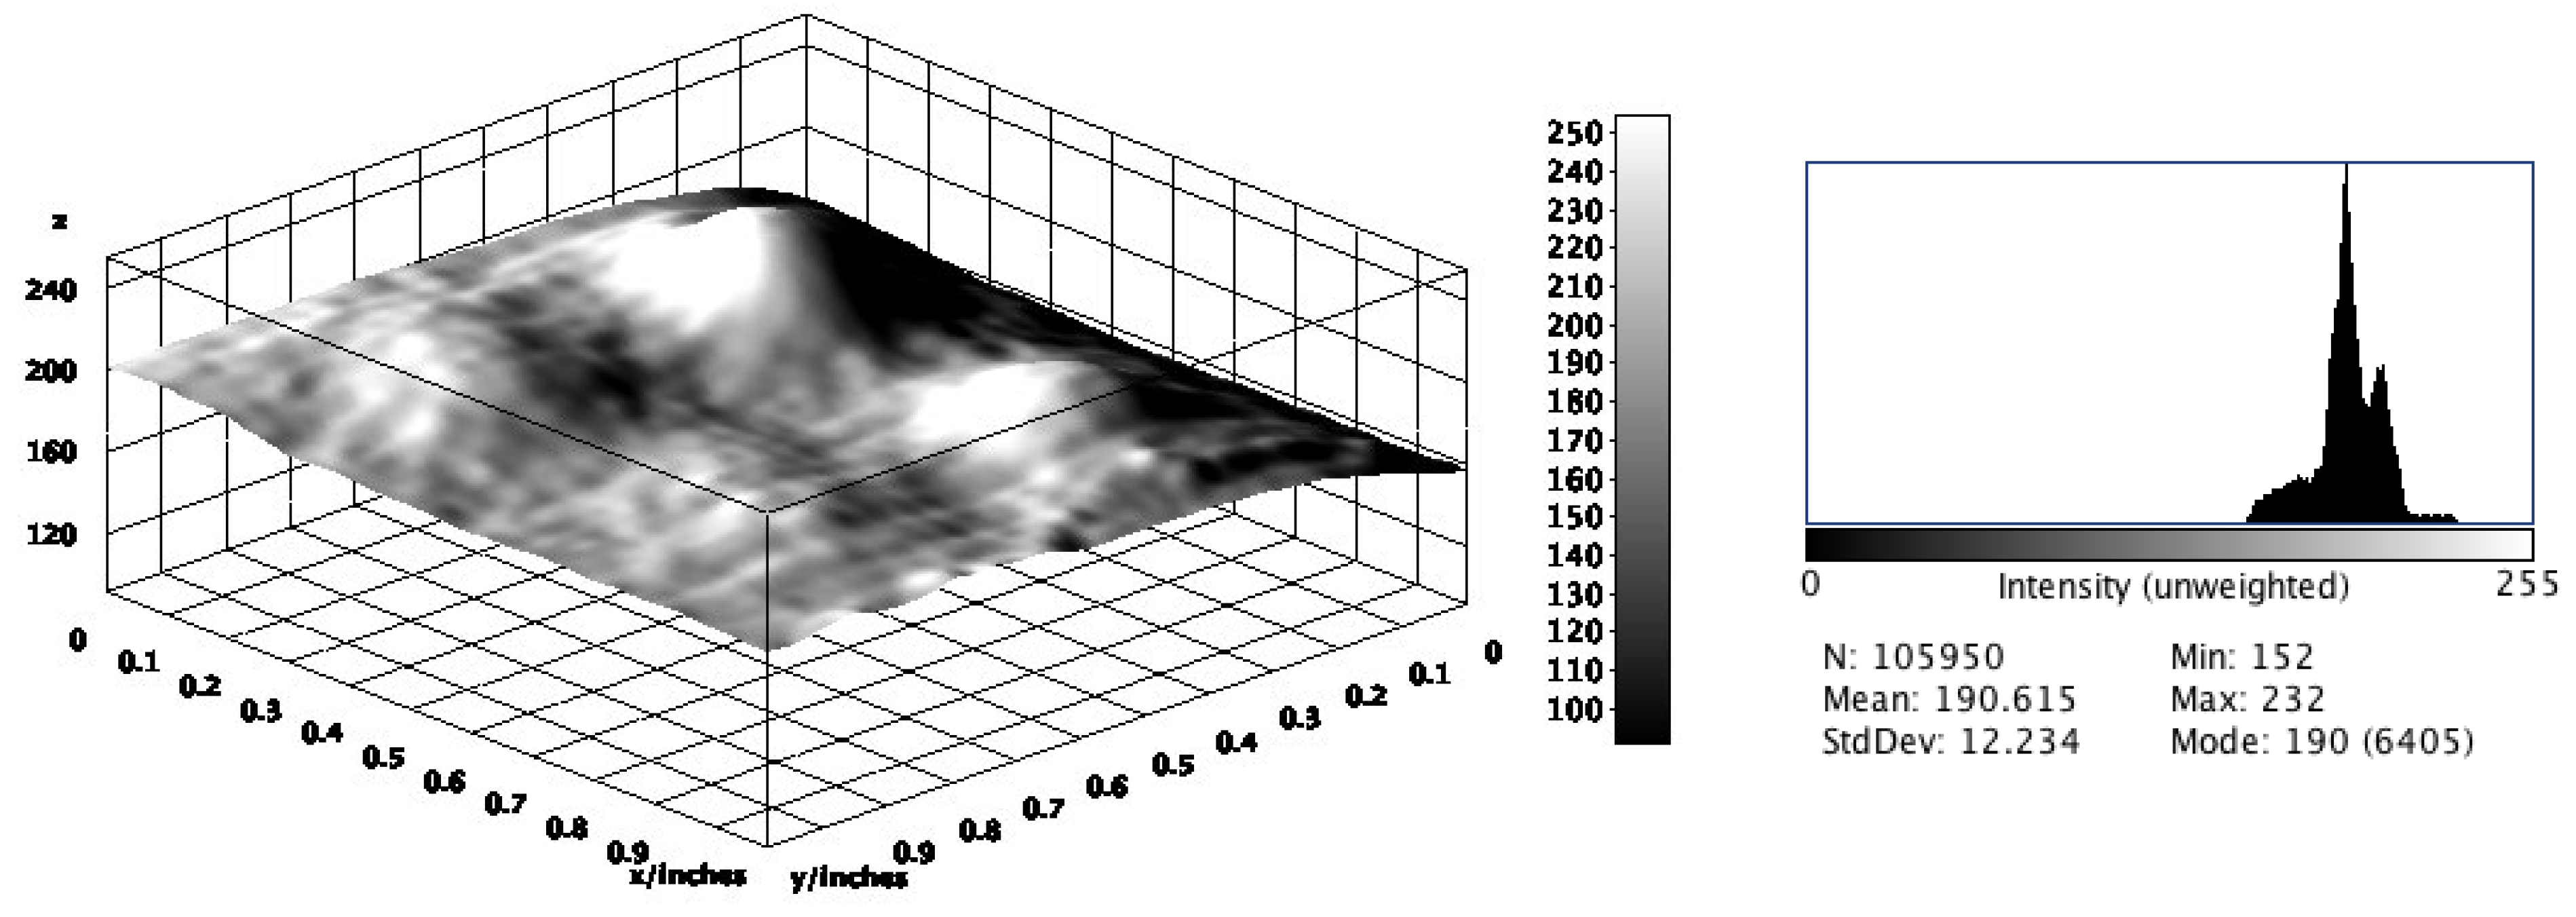
The region of interest (ROI) of the concrete specimen was manually masked and extracted using the ImageJ software (version 1.53r) [95]. Thereafter, the segmented ROIs, each of 325 × 326 pixels, were saved as an 8-bit TIF format, and the temperature values for all pixels (matrix of temperatures) were extracted and exported in a CSV format. An example of a grayscale thermal image, along with its histogram, is shown in Figure 8. These data were imported and processed using an internally developed MATLAB© code (version R2022a). The data were quantitatively analyzed using two methods: (a) a thermal contrast analysis of surface temperature measurements; (b) a wavelet-based analysis of the indexed (grayscale) images. These processing techniques are described in detail in the next sections.

5.1. Thermal Contrast Approach

It is assumed in this paper that the subtraction of the surface temperature of the sound area ( T S ) from the defective area ( T D d ) is the thermal contrast ( Δ T t ), which implies the existence of subsurface damage. That is:
Δ T t = T D d T S ,
where t and d represent the elapsed time of heating (or cooling) and the known depth of the defect, respectively. The T D d and T S data points were returned as the spatial temperature medians of all surface temperature values (i.e., 1D time-series data) within the defective and sound areas (as outlined in Figure 9). For each frame, the total number of pixels occupied by each circular zone was 132 pixels. Note that the reduction in the size of the selections (overlaid zones) was employed to discard any possible outlier (or noise) in the sample data.
In this study, the sound area over all the frames was selected on the basis of its limited dispersion, estimated from the coefficient of variation ( C O V ), using the formula:
C O V % = S D μ × 100 ,
where S D and μ represent the sample standard deviation and the arithmetic mean of temperatures, respectively. These were calculated for the sound area, according to:
S D = t T S t μ 2 N f 1 ,
μ = 1 N f t T S t ,
where N f is the total number of frames and T S t is the temperature of the sound concrete area at time t . Two areas were initially proposed by the investigators as being of sound concrete: namely, sound area 1 (at the top) and sound area 2 (at the center) of the specimen. In fact, sound area 1 was purposively selected, based on the priori knowledge that its C O V was the lowest (=7%), compared to that of sound area 2 (=8%).

5.2. Wavelet-Based Approach

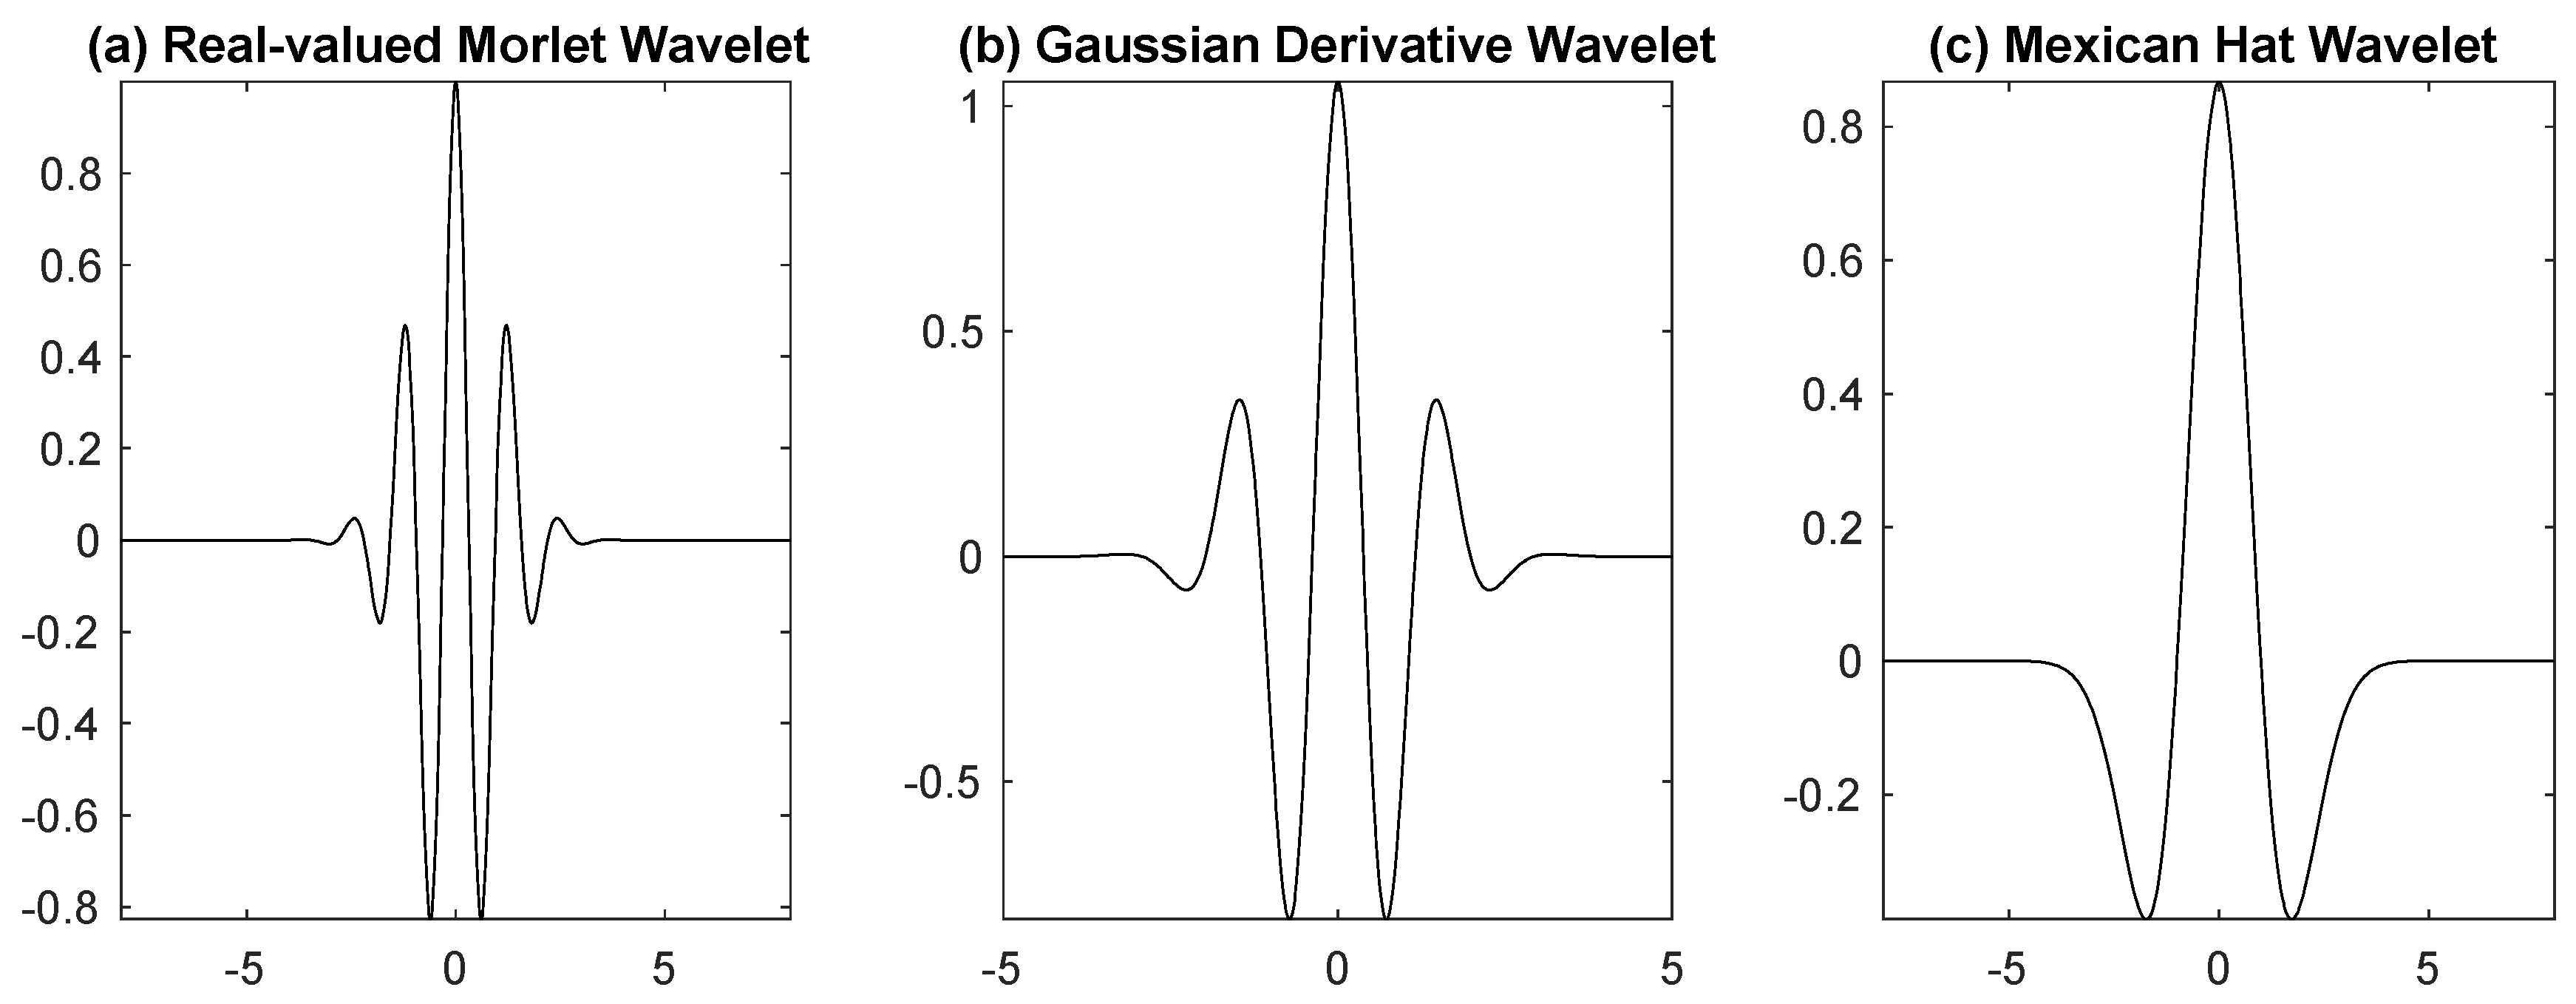
The choice of an appropriate mother wavelet in the CWT analysis is generally made based on the data (or image) characteristics and the intended application, but it is optimized by its ability to obtain meaningful results [79]. In applications concerning condition monitoring, different mother wavelets (with different time-frequency structures) can be implemented, such as the Haar, Meyer, Morlet, Gaussian, and Mexican hat wavelets. A graphical representation of selected wavelet functions can be seen in Figure 10. In our CWT analysis, a preliminary comparative assessment was performed to select the mother wavelet; until now, there has been no specific guideline regarding how to choose the most suitable base wavelet, the corresponding shape, or the scale factor for a particular application [96]. The reported outcome here is that the 2D-Mexican hat wavelet provided the best results and was chosen as the mother wavelet.
The Mexican hat wavelet (also known as the Marr wavelet) was introduced by Marr and Hildreth [97] as a differential–smooth operator [98]. This function is even and has a real value [99]. The isotropic (non-directional) version of the Mexican hat wavelet is more common than its anisotropic (directional) version, especially for the fine pointwise analysis of images [100]. To be precise, isotropic analysis is particularly useful in detecting non-linear and sharp changes in images [101]. Unlike the anisotropic wavelets (e.g., Morlet and Cauchy), the isotropic Mexican hat wavelet has no angle dependency in the analysis, meaning that it is not sensitive to the orientation of damage features [102]. This allows the effective detection of damage in all directions at the same time.
The two-dimensional Mexican hat wavelet can be written in the position domain, as follows [84]:
ψ ( x ) = ( 2 x 2 ) e ( 1 2 x 2 ) = 2 x 1 2 x 2 2 e 1 2 x 1 2 + x 2 2 ,
and its Fourier transform [102]:
ψ ^ ω x , ω y = 2 π ω x 2 + ω y 2 p / 2 e σ x ω x 2 + σ y ω y 2 2 , σ x ,   σ y ,   p > 0
where ω is a vector component and σ x and σ y are constant multiplicative factors in the x- and y-directions, respectively. To simplify the computations, we used the generic default parameters for the Mexican hat wavelet, as follows:
p = 2 σ x = σ y = 1
In our process, the raw grayscale images were post-processed one at a time. The image processing, using the Mexican hat wavelet function, was performed using MATLAB©, with the aid of the Wavelet Toolbox™ (version 6.1) [102]. Typically, the performance of the wavelet algorithm (and the computational complexity of data processing) increases with an increase in the scale factors to a certain limit [103]. It is noteworthy that adjusting the scale parameter will adjust both the spread spectrum and the bandwidth of the wavelet [104]. For visualization and analysis purposes, the scale vector and the angle were intuitively judged and were manually set to {1, 5, 10, 15, 20} and 0 rad, respectively. After applying the wavelet transformation on a number of selected thermal images, the CWT coefficients are decomposed into four different components, namely, the real part, the imaginary part, the modulus, and the angle.
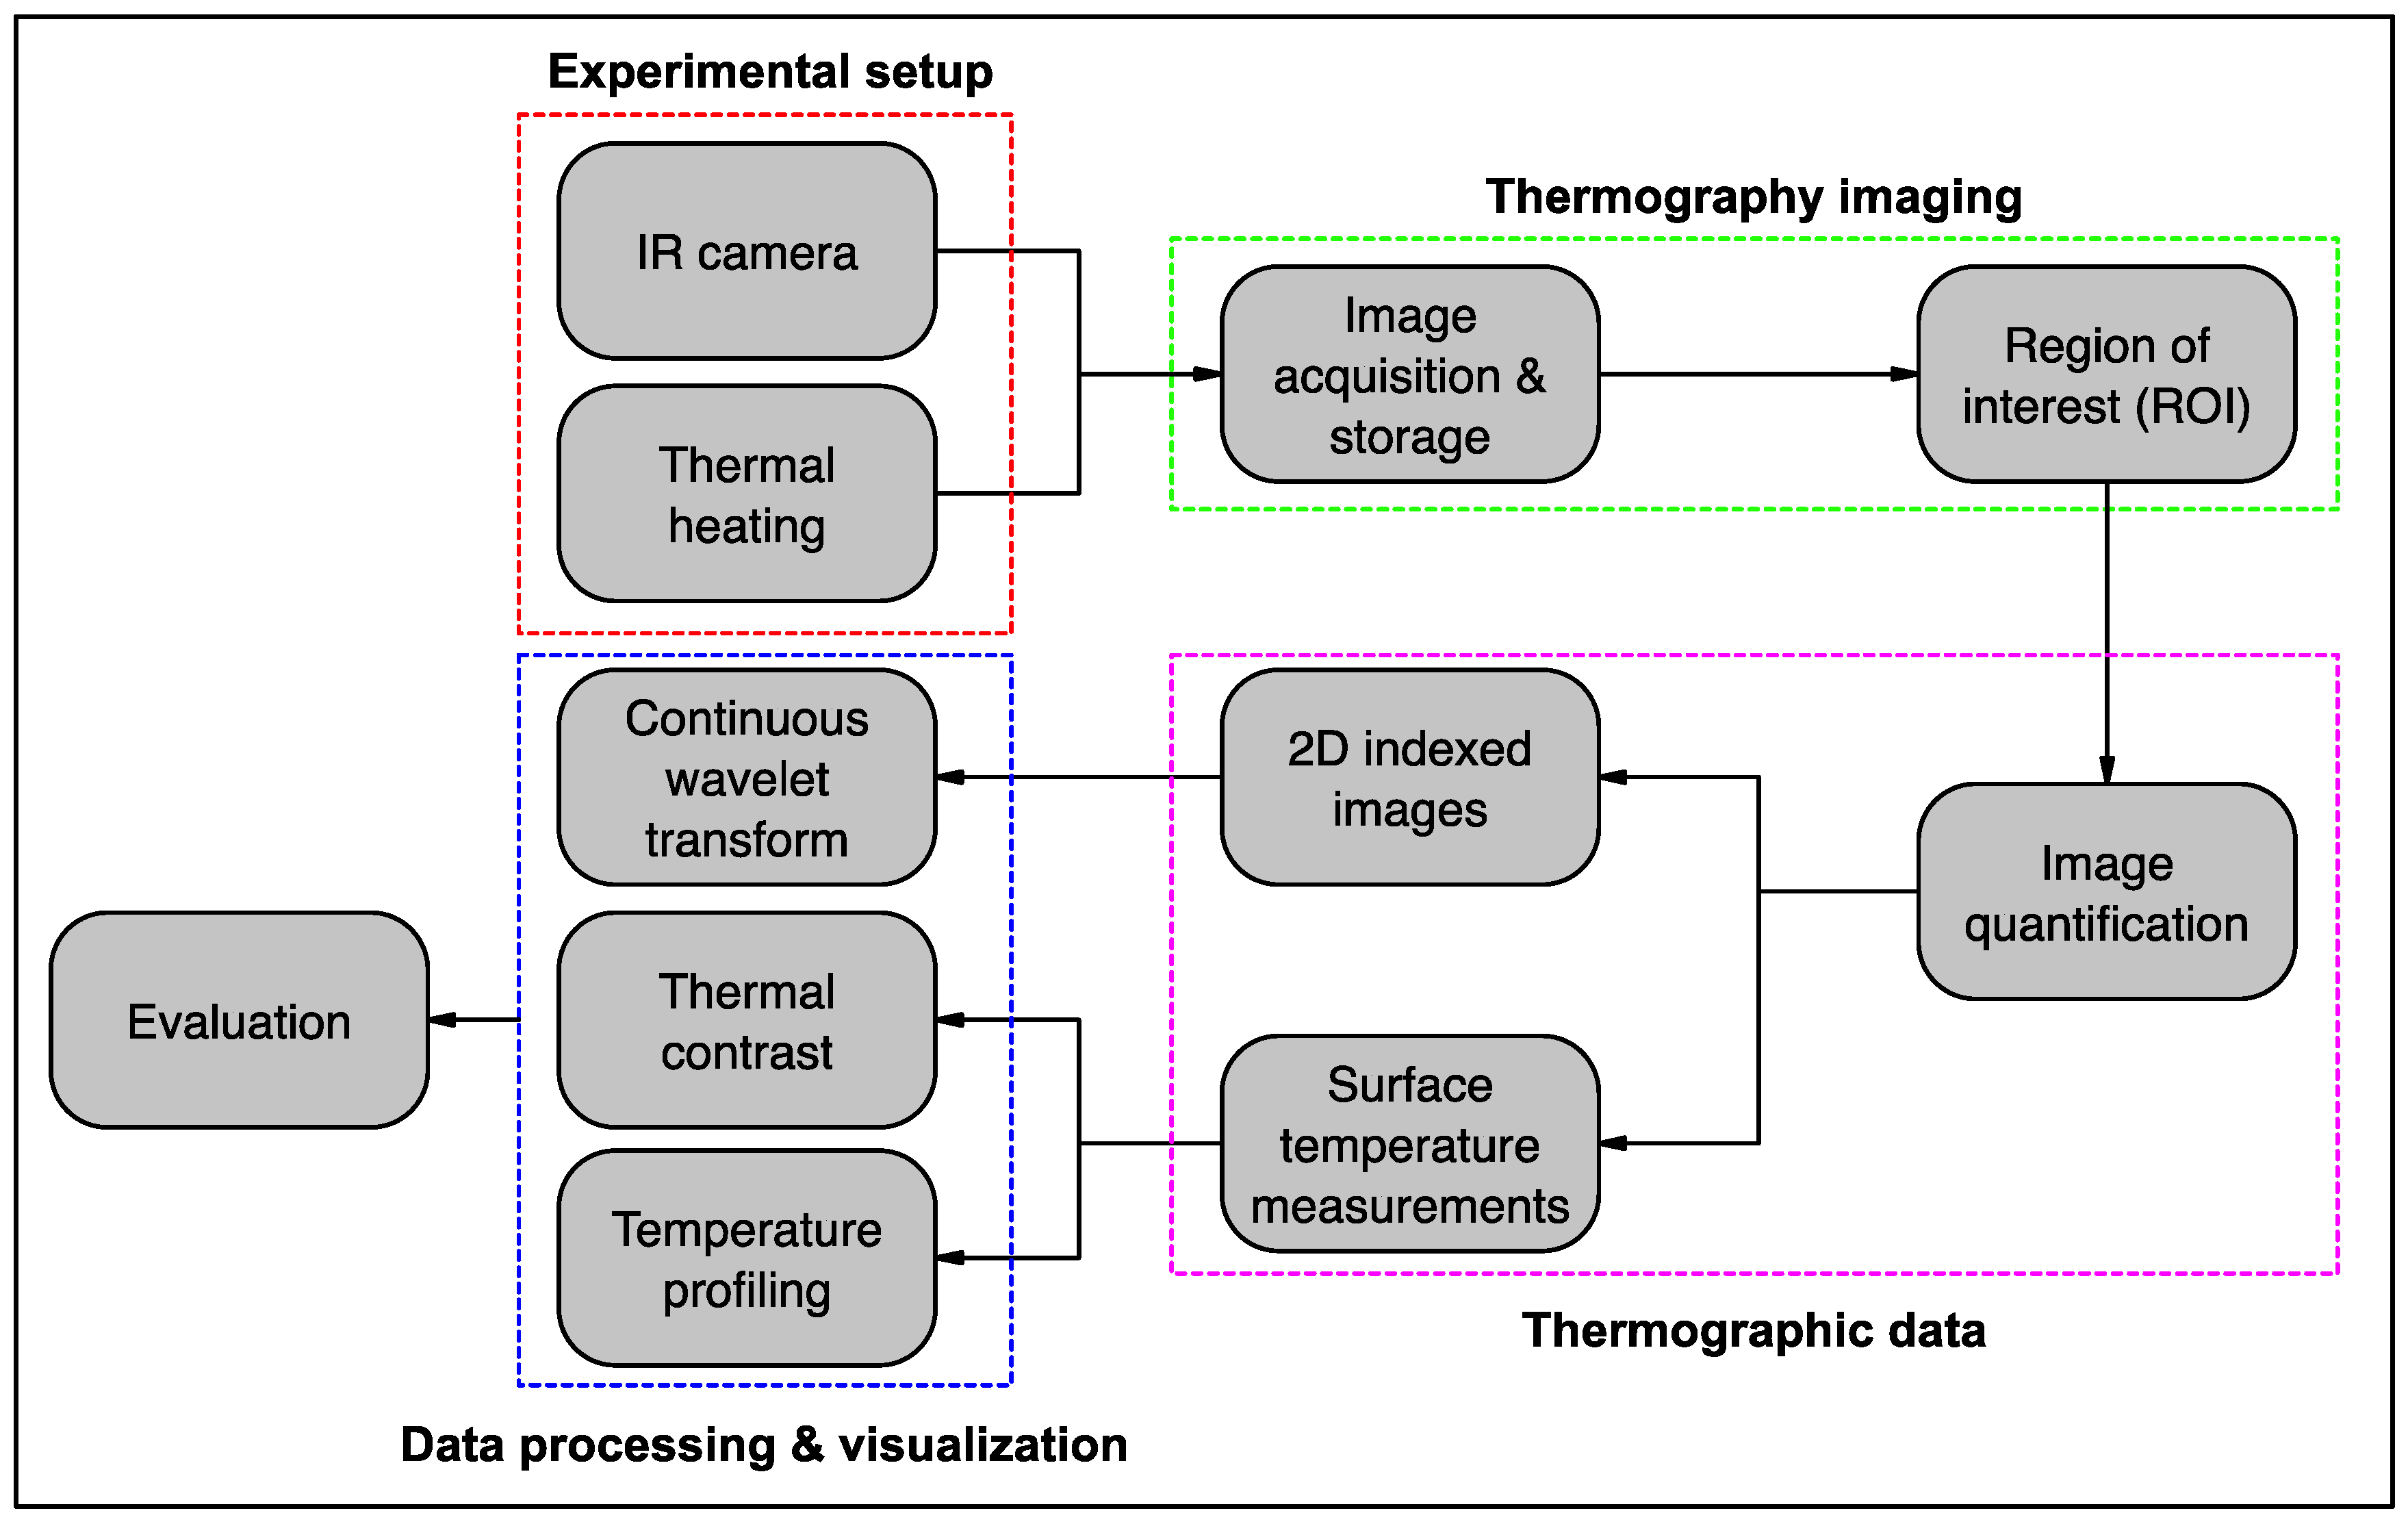
An overview workflow of the post-processing of the IR images using the two implemented techniques is presented in Figure 11.

6. Results and Discussion

6.1. Surface Temperature Profiles

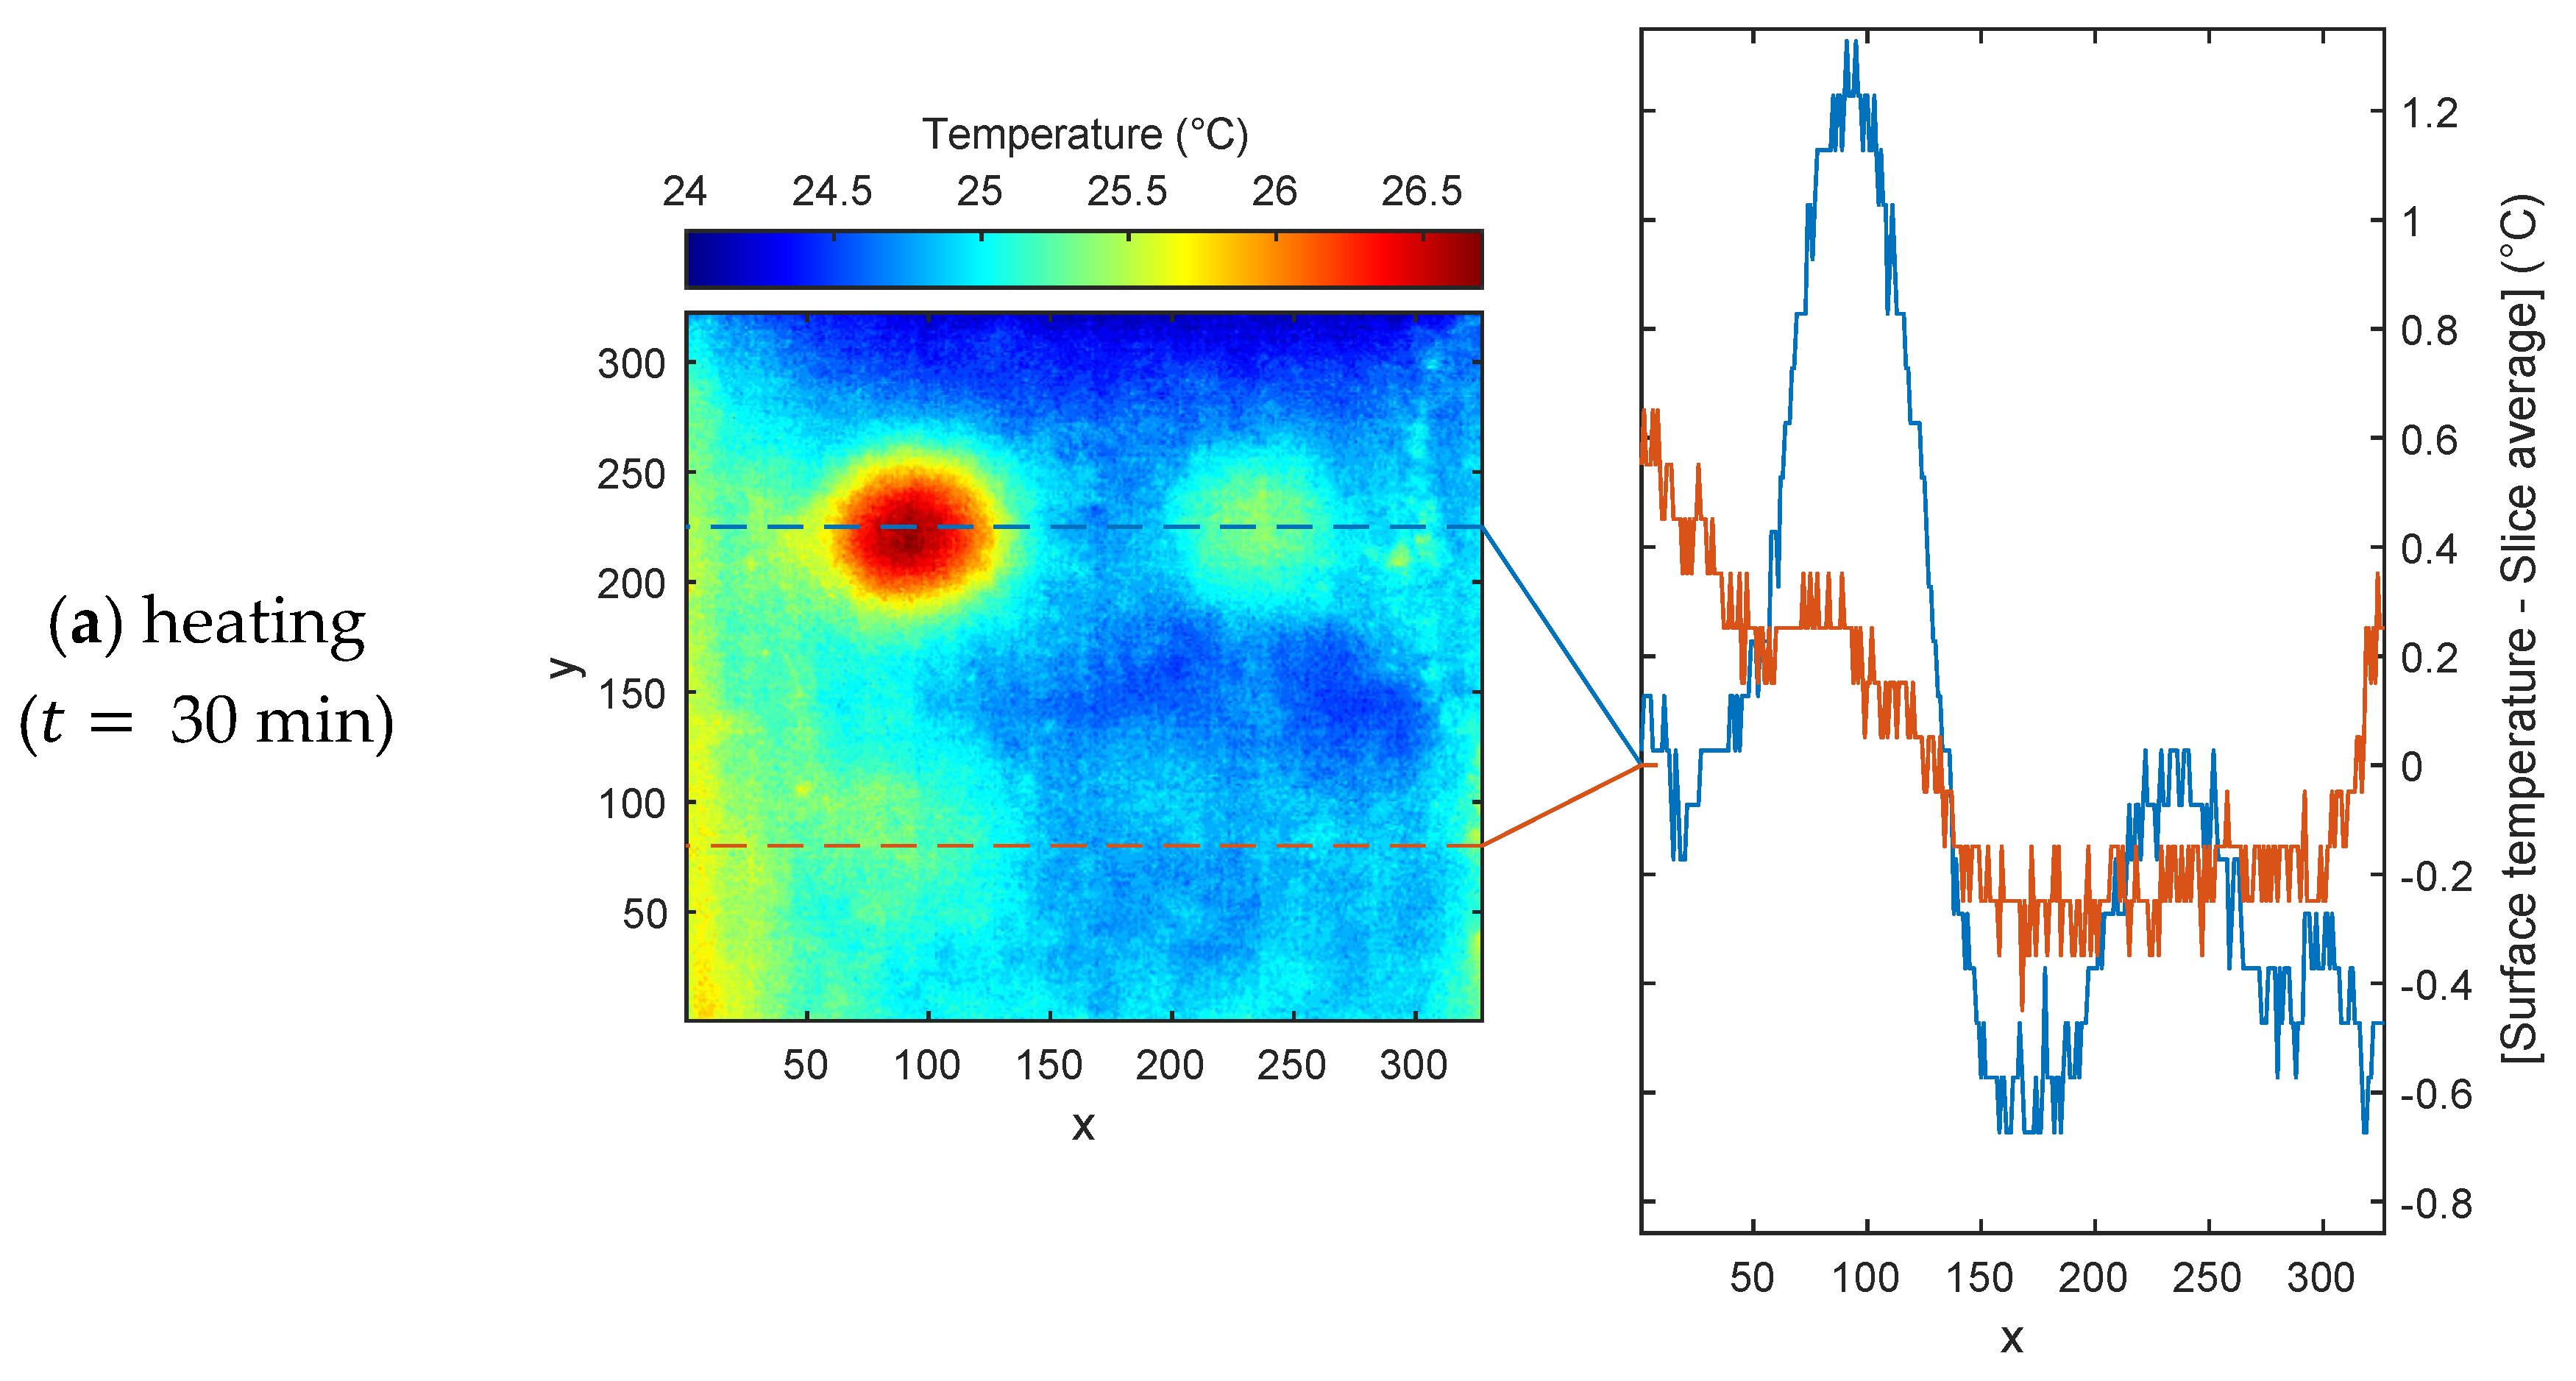
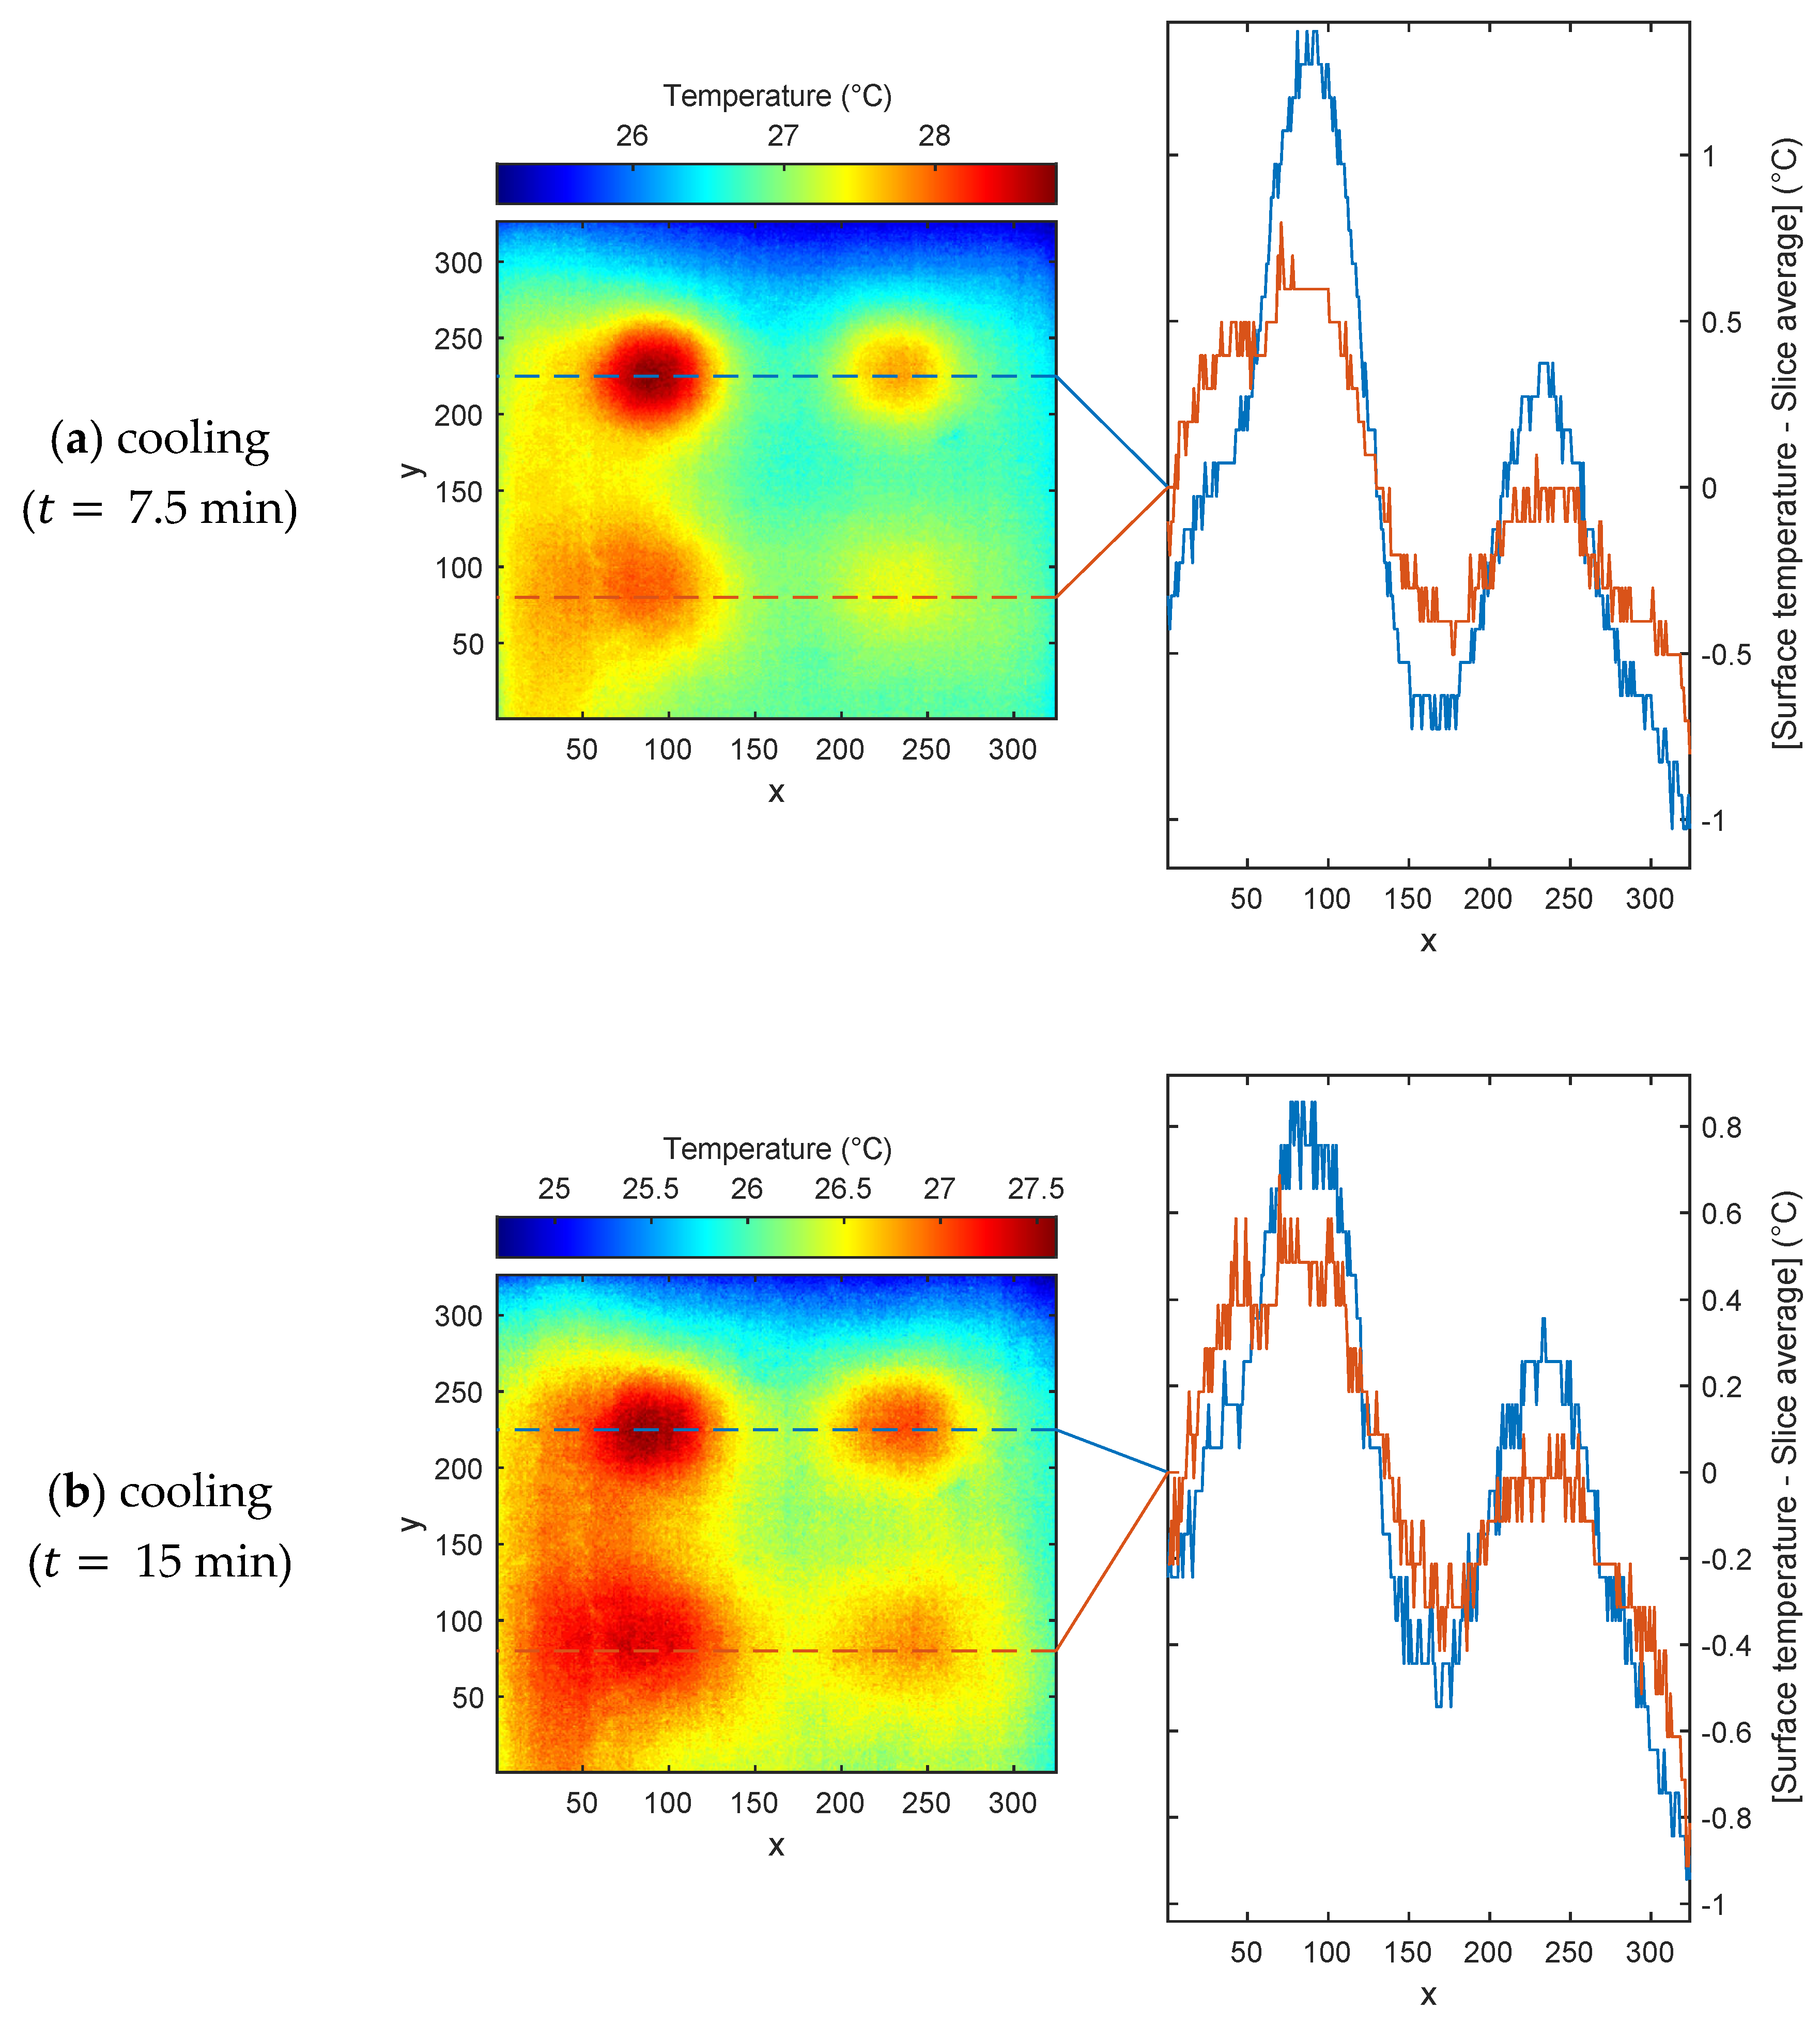
Figure 12 shows selected IR thermal images, along with their temperature profiles, for varying exposure times of the heating phase. For each thermal image, the two thermal profiles were calculated according to the difference between the surface temperature values and the average of the surface temperatures along the dashed lines (i.e., slices). Defects closest to the concrete surface, D2–D4, registered higher temperatures than the surrounding sound areas after about 30 min of heat exposure. Apparently, defects at depths of 2 and 3 cm have larger contrast and better-defined geometry than the defect at a depth of 4 cm. Even though the location of defect D5 was posing as a possible defect after a longer heating time (>60 min), it was hard to detect its size and shape. This factor is reflected in the shape of its temperature difference profile, which had a more flattened curve compared to the clear peaks seen with other defects. The air voids (embedded Styrofoam targets) act as insulators, due to their low thermal conductivity, reducing the heat transfer from the concrete to the voids and elevating the temperature in the areas above them. This results in a faster increase in the surface temperature of defective areas than in intact areas. Deeper voids tend to take a longer time to visualize, due to the lower amount of radiation that reaches them [74].
If we compare the thermal images of the two stages of heating and cooling, then we see that the cooling sequence (Figure 13) obtained better results, due to the more homogenous and uniform surface cooling [65]. Deeper defects, with depths of 4 and 5 cm, exhibited a significant temperature difference, along with the lowest rate of temperature change, compared with the shallower defects (see Section 6.2). This result may be explained by the fact that during the cooling process, the rate of heat loss in the thicker regions above the deeper defects was considerably lower than in the shallower ones [105]. This observation is in agreement with several other works, including Szymanik et al. [106] and Kee et al. [107], which debated the enhancement in the defect visibility for the cooling data that were acquired following the heating stage. However, as in the heating stage, the boundaries of those deeper defects still suffered from poor visibility, making it difficult to accurately estimate their size.

6.2. Thermal Contrast

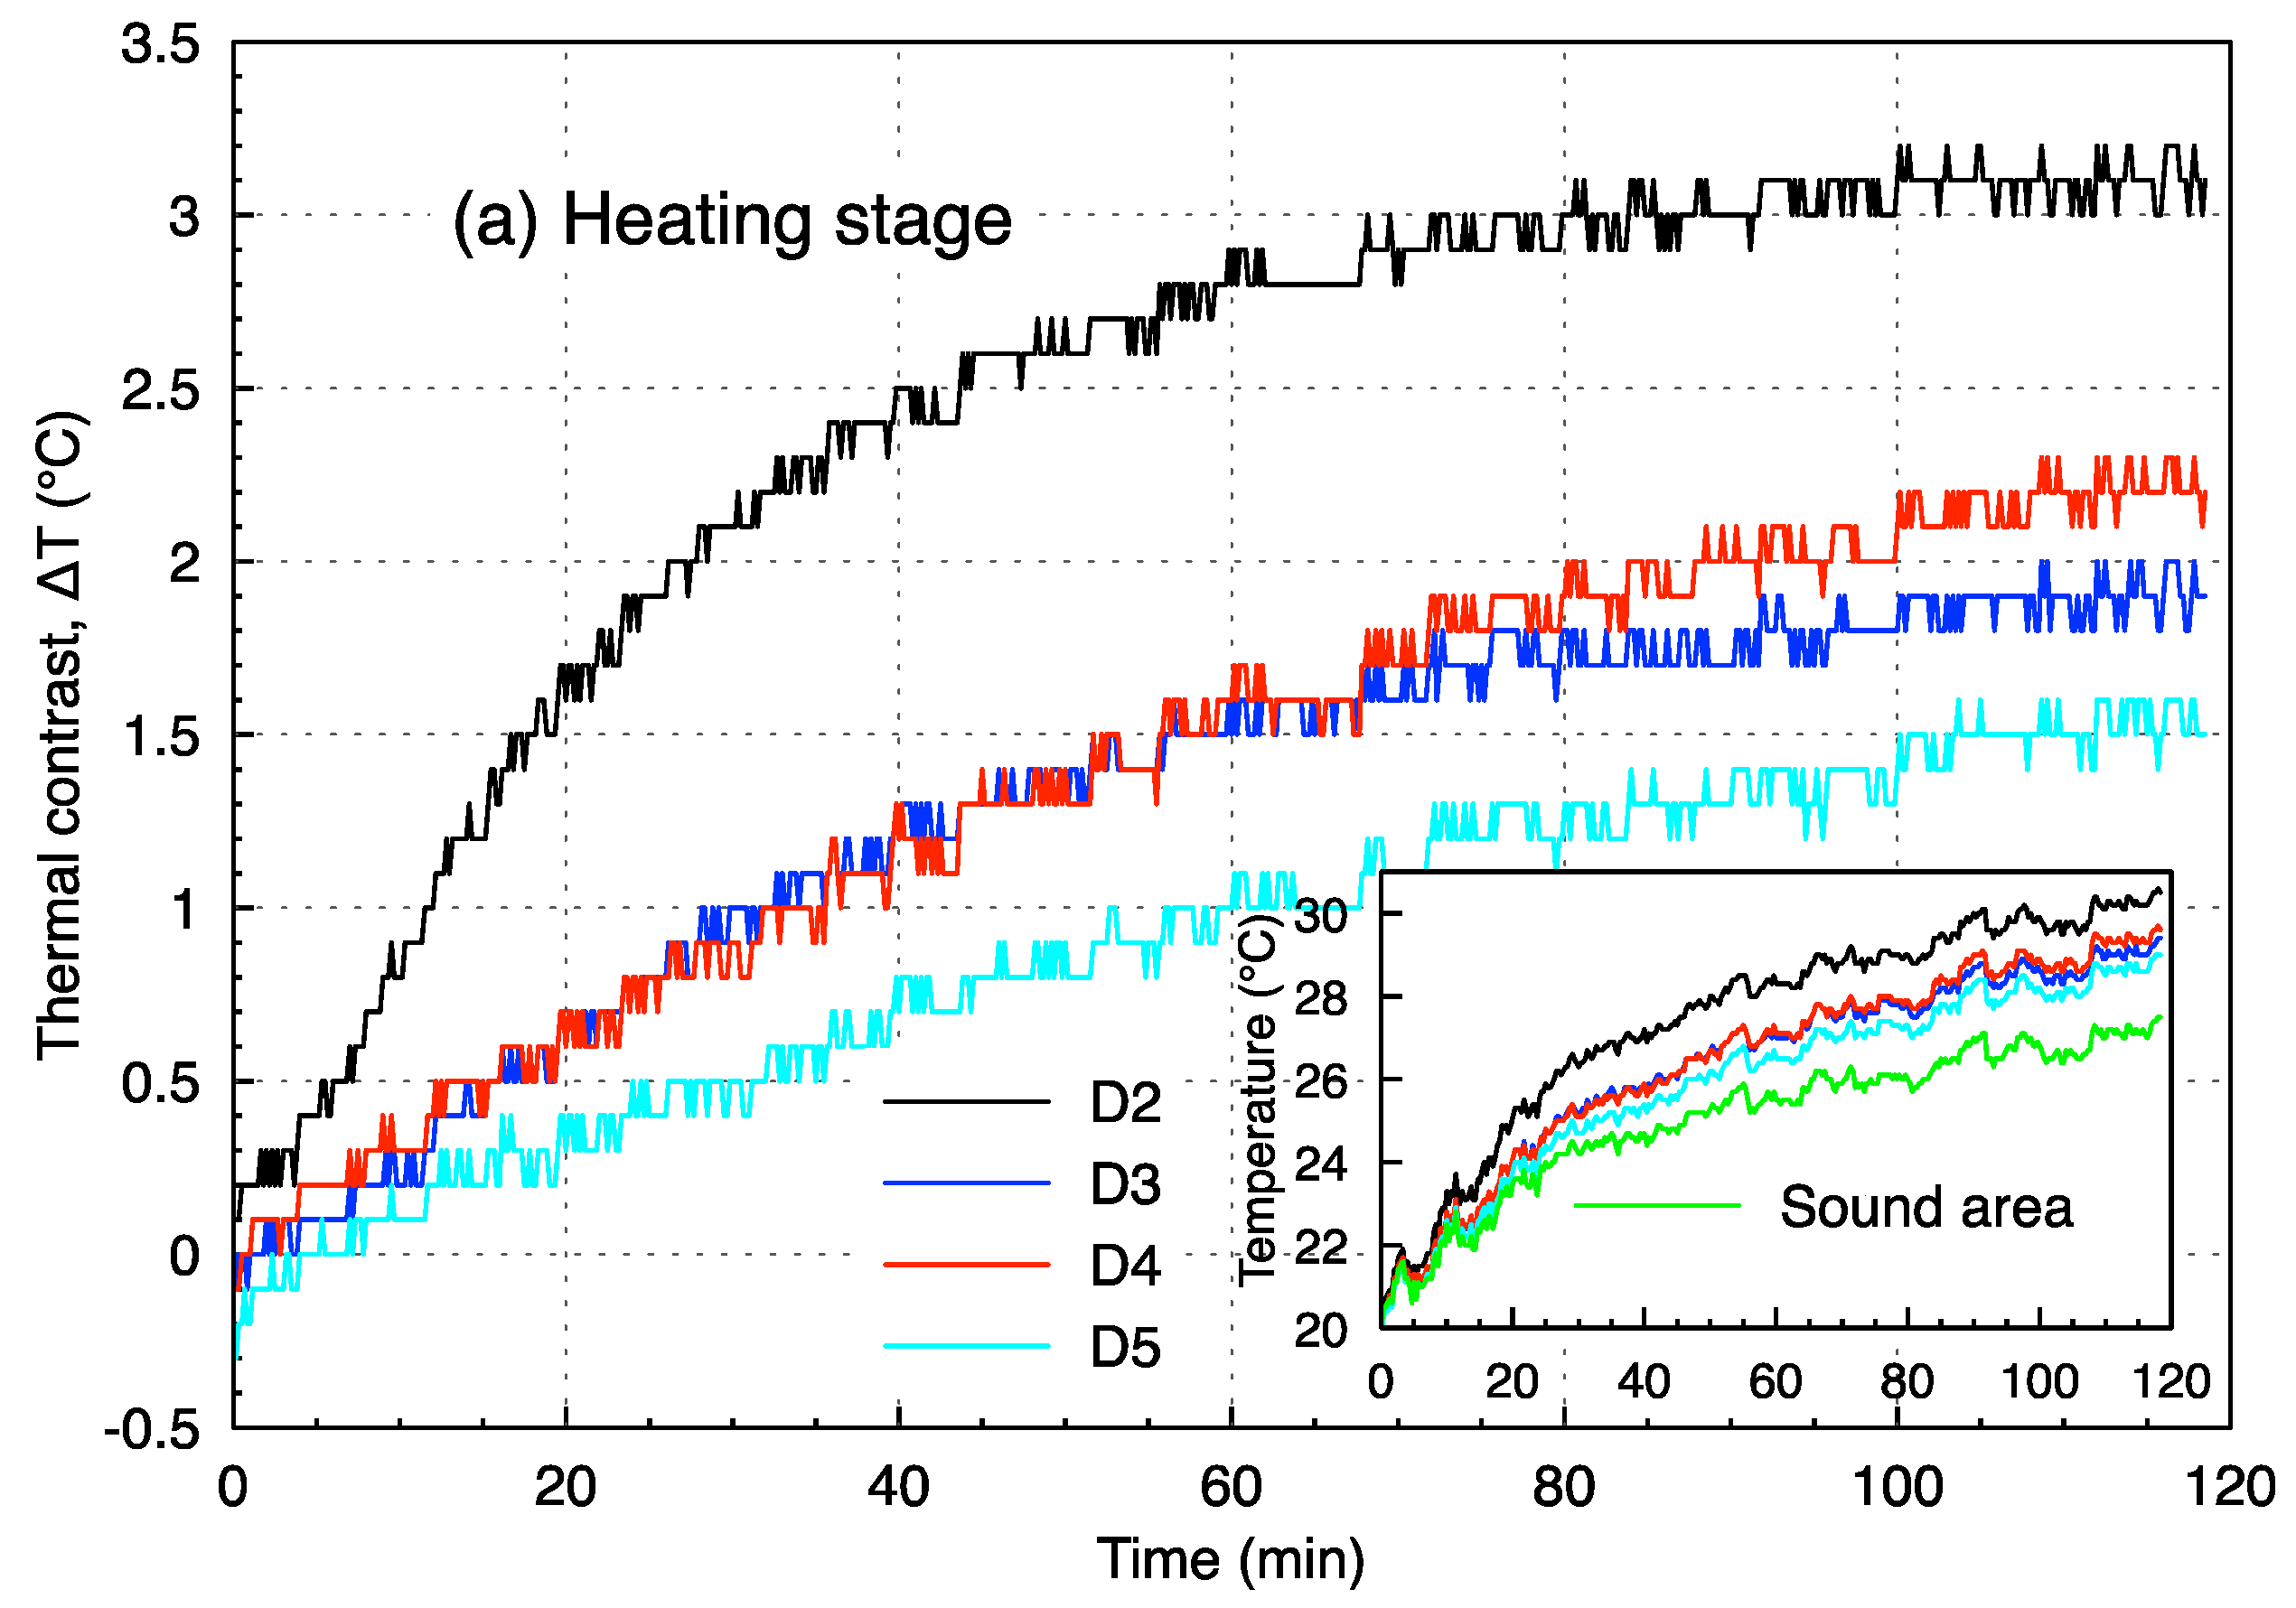
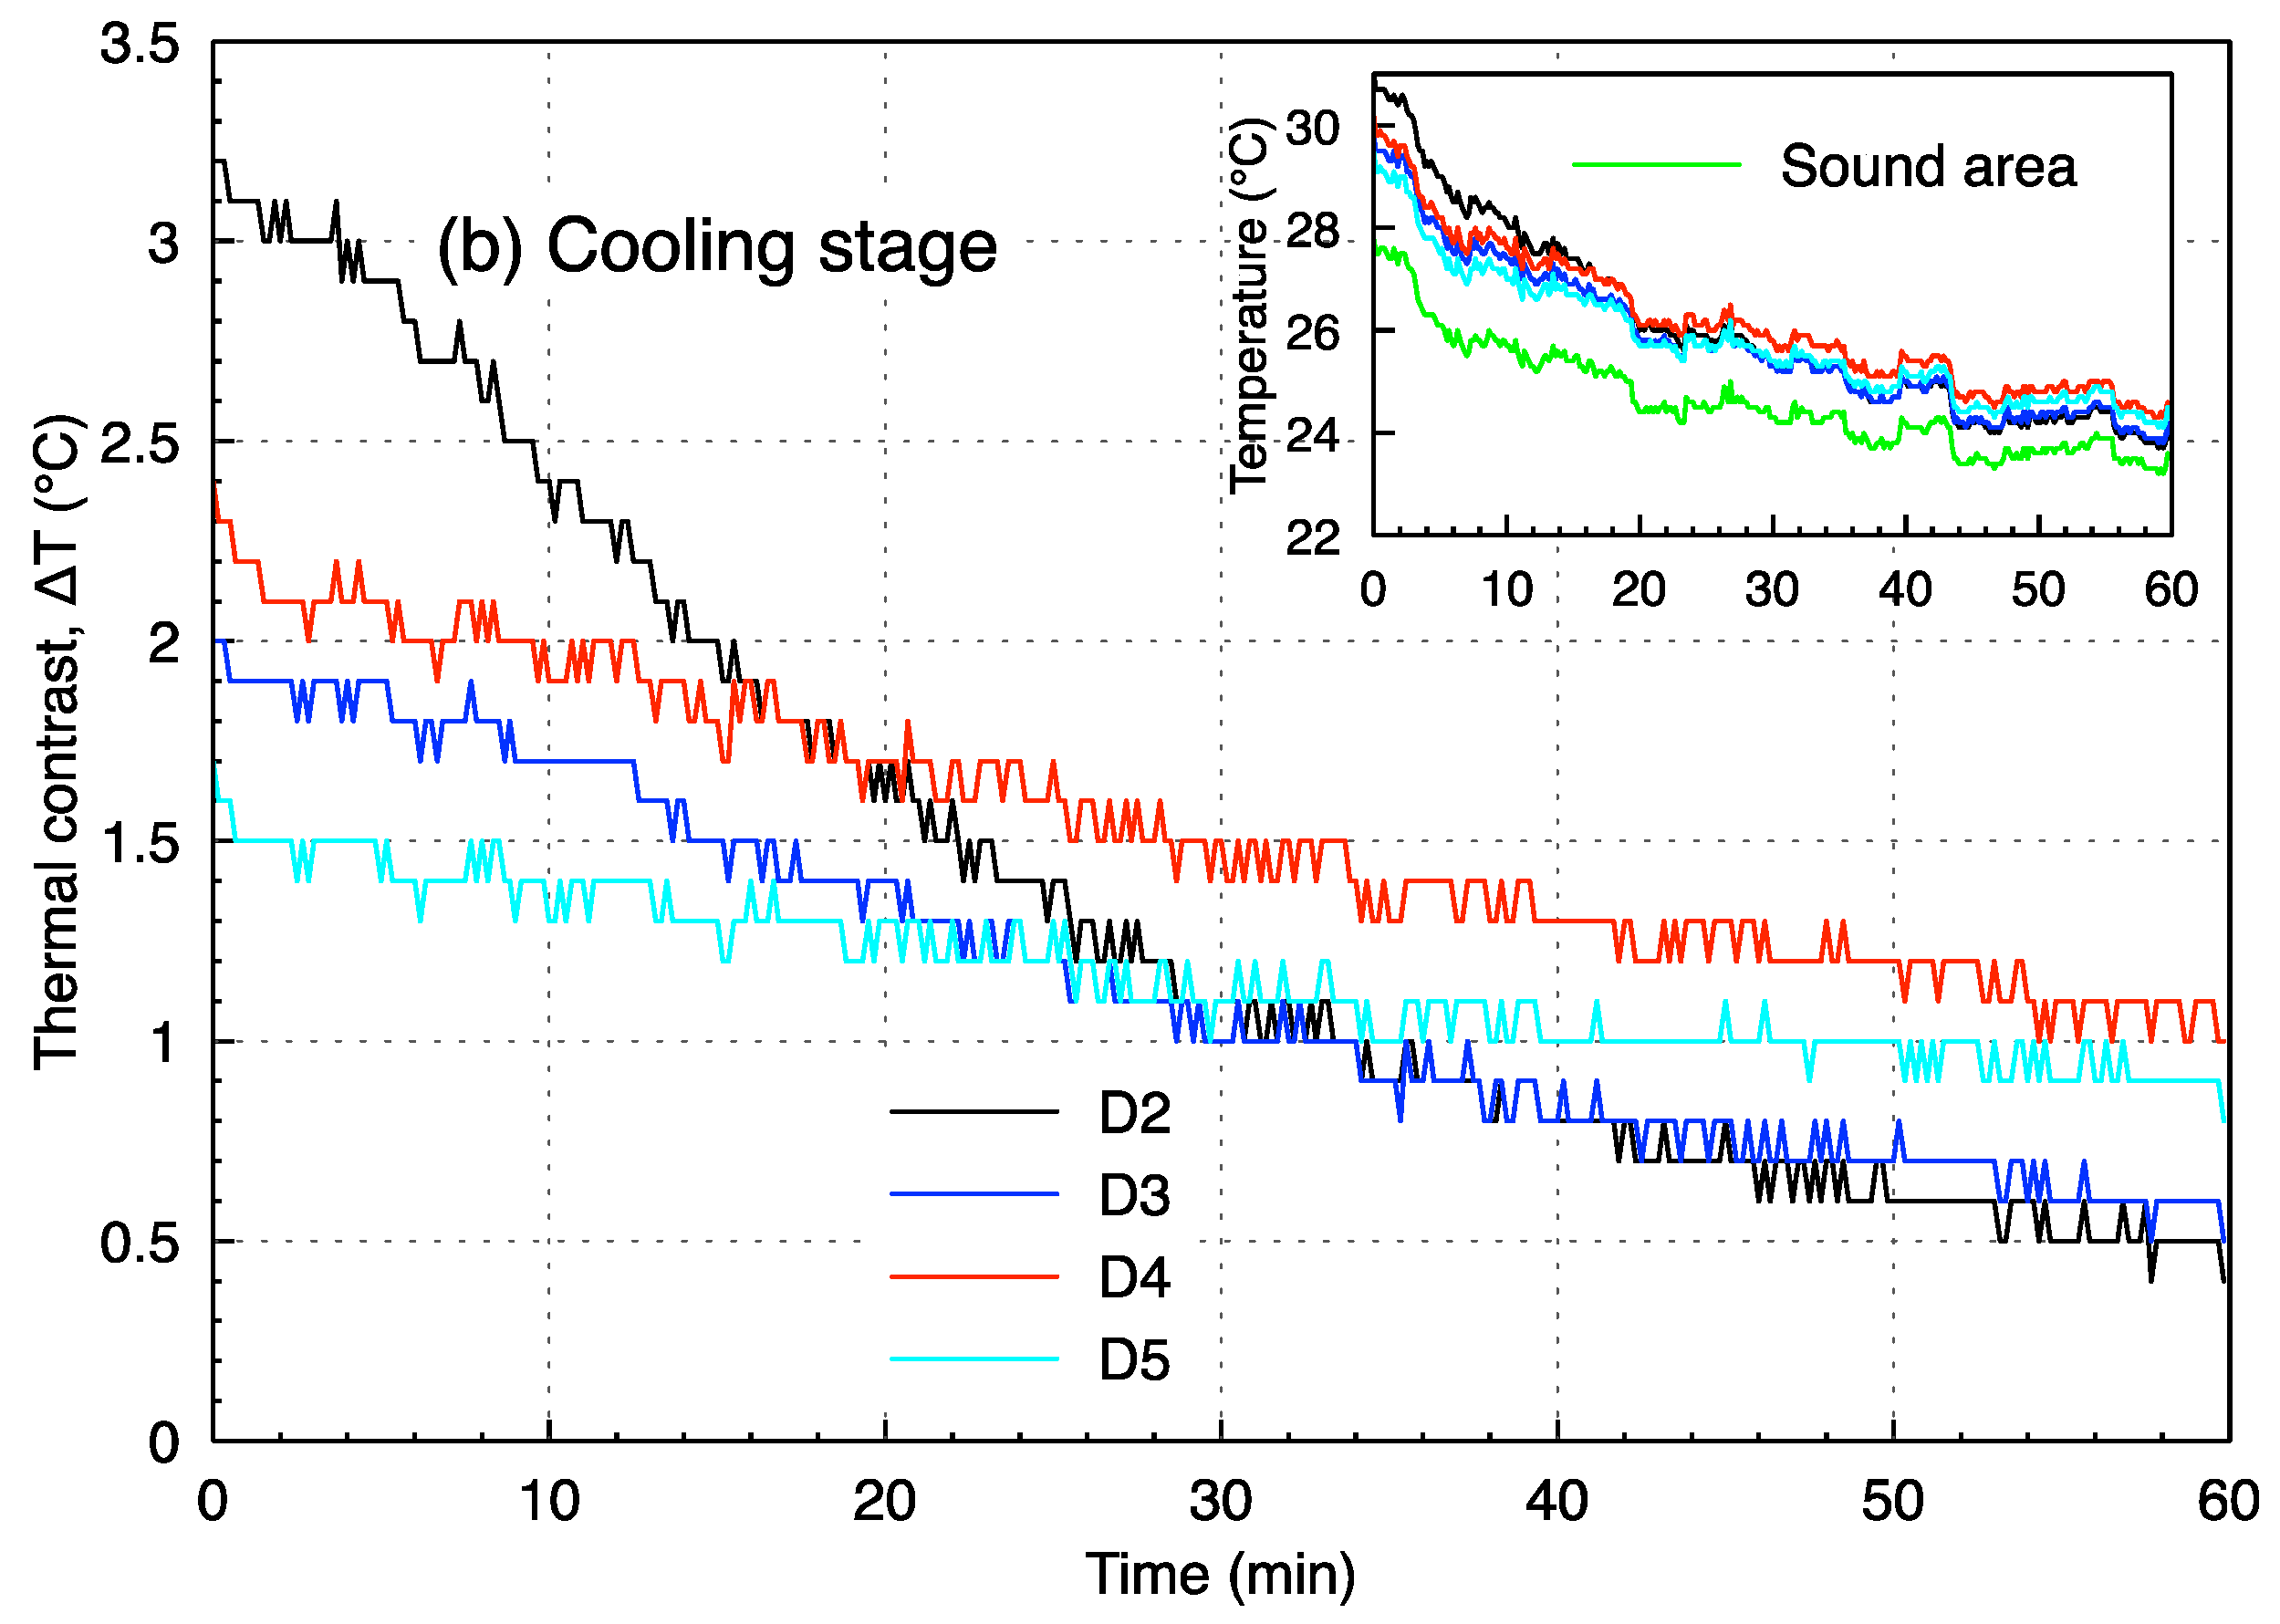
With a simple thermal contrast analysis of the raw thermographic data, we can show how the temperature content of the data changes through defects D2–D5, compared to the sound concrete over time. The results are shown in Figure 14. According to the ASTM D4788-03 [108], the temperature difference ( Δ T ) between any defective area and adjacent sound concrete at a given time must be greater than 0.5 °C, in order to be able to distinguish the defect. It was found that the shallowest defect, D2, can easily be detected in less than 10 min of active heating, as the temperature evolution is greater than 0.5 °C, while defects at depths of 3 and 4 cm show similar overall behavior and are not easily distinguishable, particularly within the first 1 h of continuous heating. Their thermal contrasts have slightly improved when at least 40 min of heat exposure is applied beyond that time interval, but, in general, a very long heating time is impractical. Contrary to expectations, after 2 h of heating, the surface temperature of D4 was higher than D3 ( T D 4 T D 3 = 0.4 °C). The reason for this is not clear, but it might be related to the improper concrete compaction of the subsurface layer in the lower left corner of the specimen. Another possible cause is likely related to the non-uniform heating effects due to the halogen lamps. In comparison with previous research, it was shown that a similar problem occurred in the development of higher surface temperatures above deeper defects, as a result of uneven heat distribution when an infrared heater was used [43]. During the 2-h sampling period, defect D5 consistently recorded the lowest temperature profile (with a weak thermal contrast) among the other defects.
As can be seen, by comparing Figure 14a with Figure 14b, the Δ T of the deeper defects D4 and D5 had the lowest rate of temperature loss during passive cooling, compared to D2 and D3. This observation enables us to state that while defect D4 was cooling down, its recorded temperature maintained a higher level than defect D3; this can exclude the aforementioned assumption of poorly compacted concrete in that area. Hence, this means that the cooling phase can be more effective in differentiating the deeper voids from the shallower ones. That having been said, a note of caution is due at this point, since the thermal contrast analysis of raw data is not only limited and cannot be easily automated but also requires a long time period to interpret the results with a high level of certainty.

6.3. Analysis of 2D-CWT Images

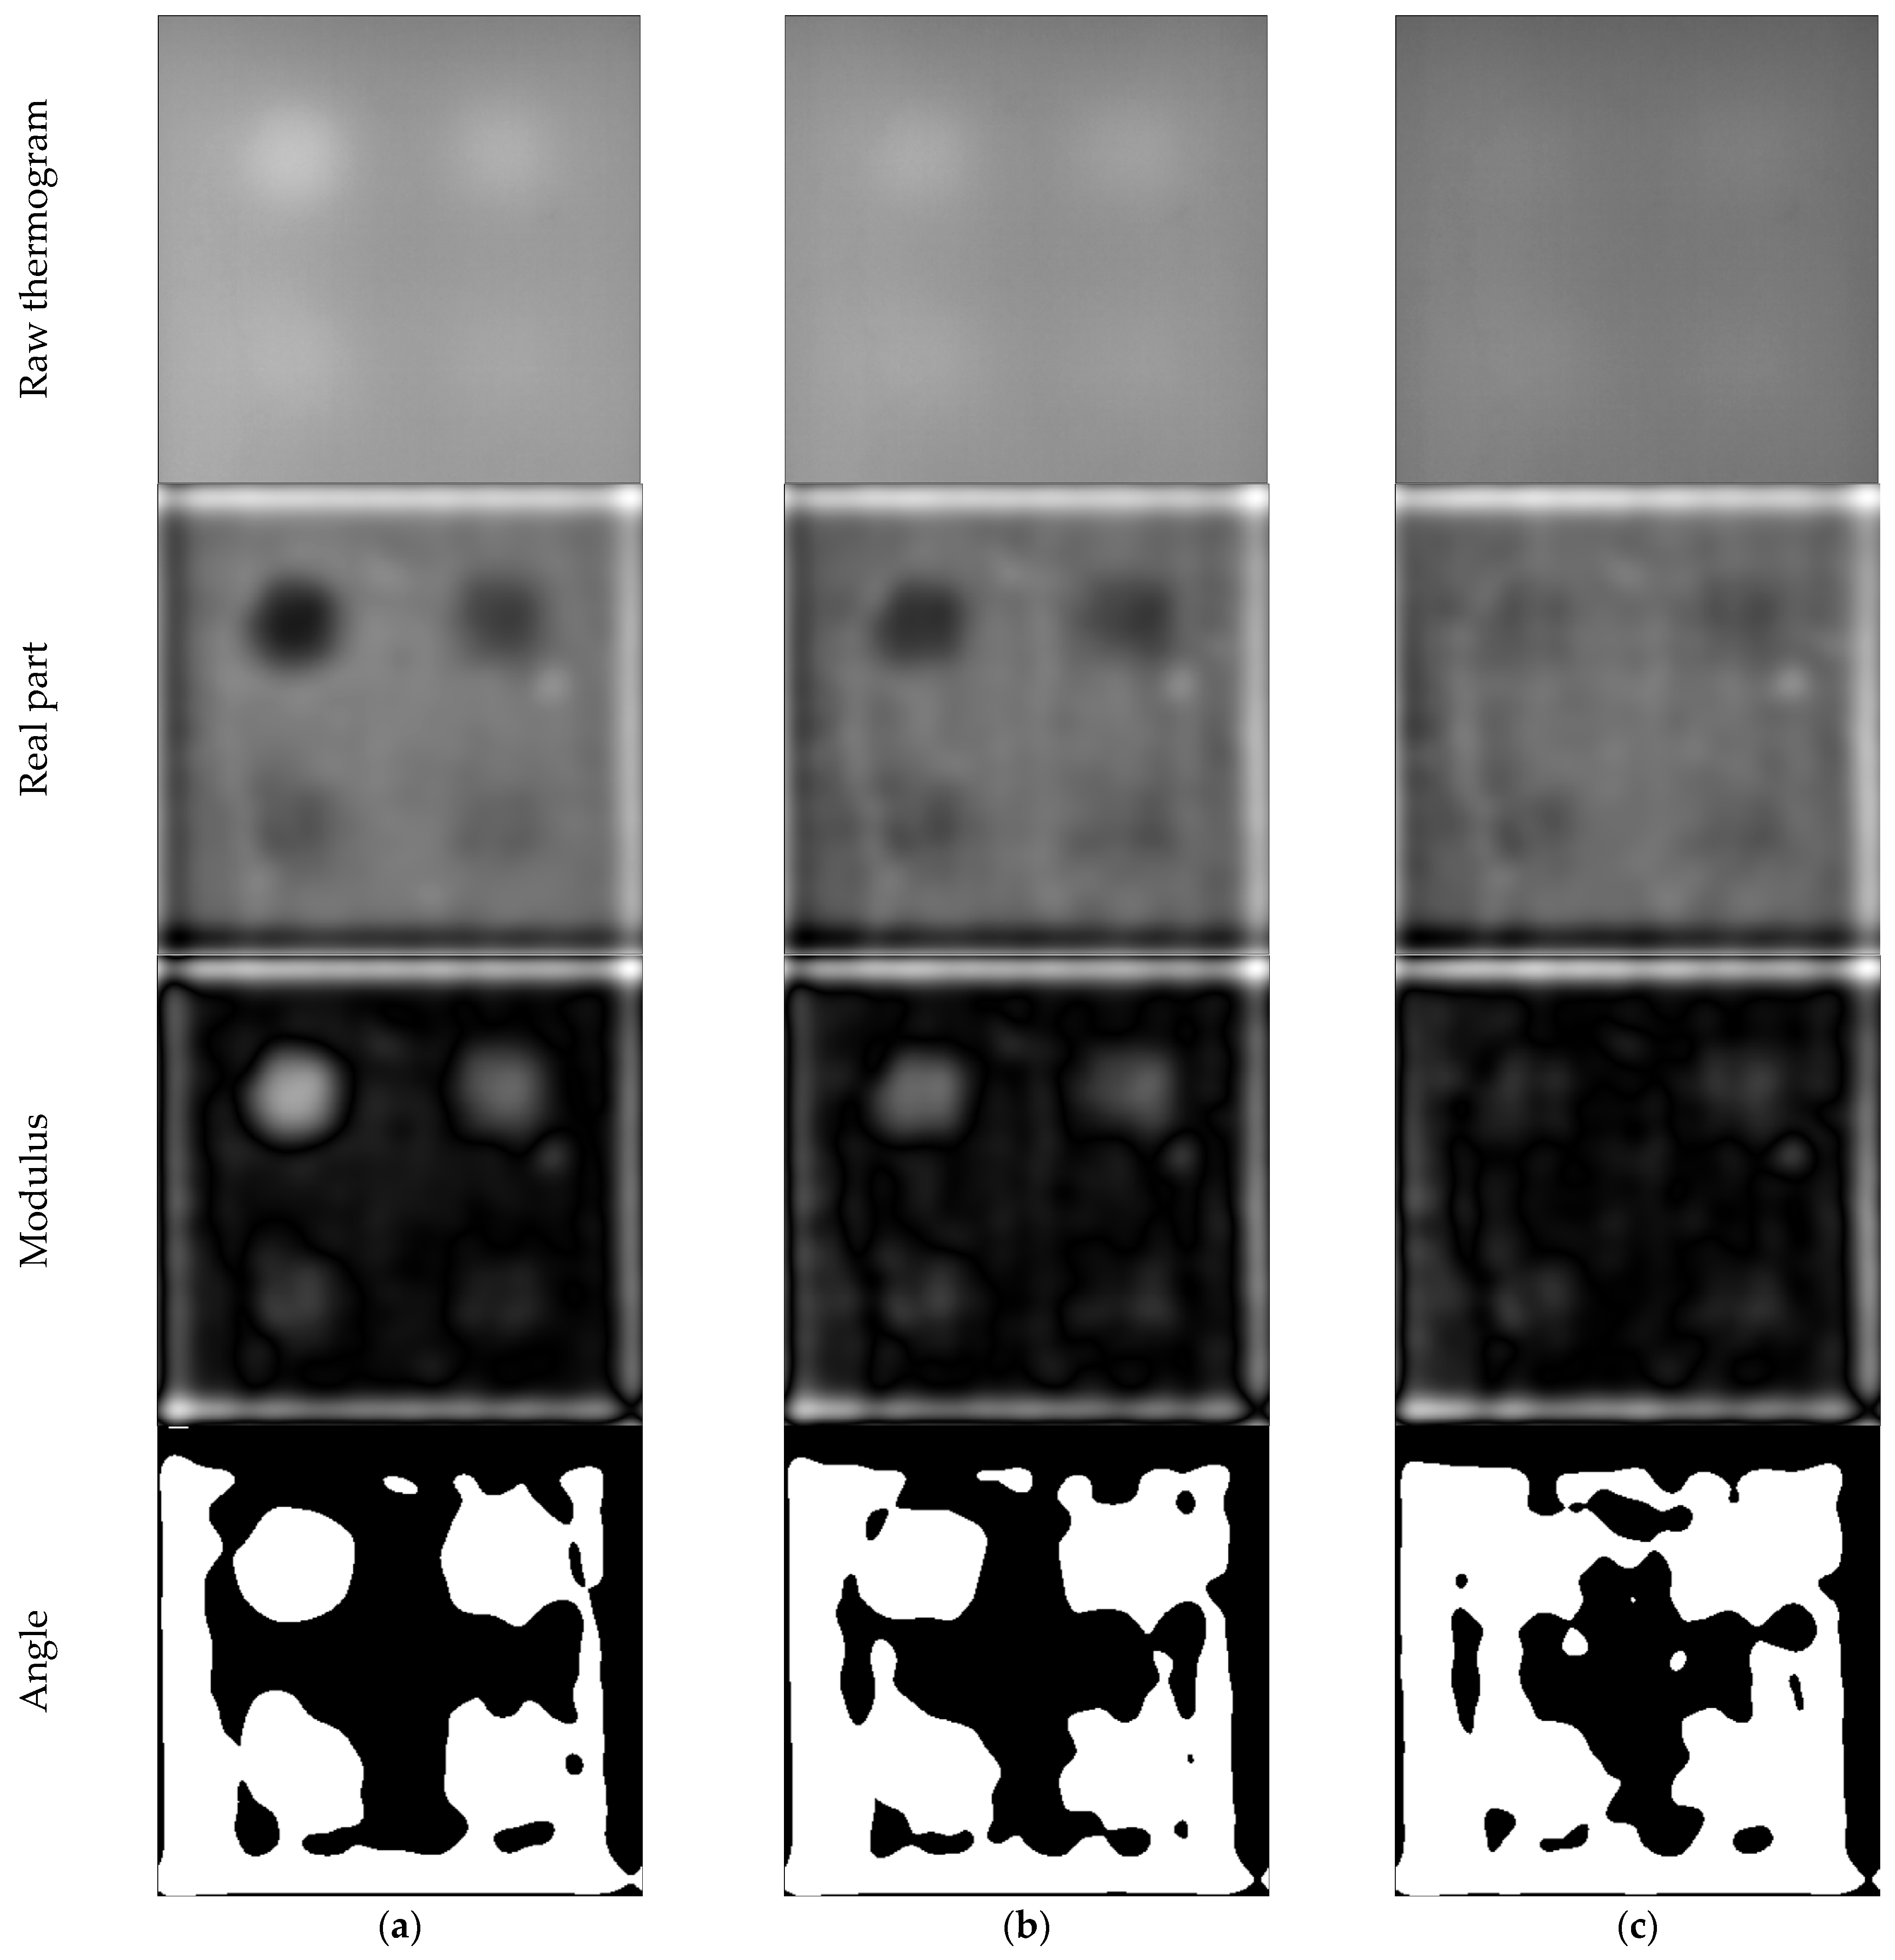
Figure 15 and Figure 16 show the performance of IR thermography in detecting subsurface damage in concrete before and after applying the continuous wavelet transformation, specifically when using the Mexican hat wavelet. The results that are presented are computed on a scale of a = 10. The first rows of Figure 15 and Figure 16 show the raw thermal images, while the second rows show the real part of the images produced by the CWT. The modulus and the angle of the wavelet transform are shown in the third and fourth rows, respectively. For all CWT coefficients, we used the convention that black denotes a small magnitude (i.e., points with lower similarity to the wavelet), and white denotes a large magnitude (i.e., points with higher similarity to the wavelet).
Overall, our CWT results in Figure 15 present similar visual features for the decomposed coefficients during the heating stage. On the basis of image filtering, the CWT-transformed images achieved better detection performance for the location (and the shape) of defects D2 and D3, which can be clearly observed from their sharp edges. As is well known, the Mexican hat function is very powerful in its recognition of the dissimilarity in signal [90]; that is, the level of gray color variation. After turning off the excitation source, the white spots are, in fact, greatly reduced from the real parts and the modulus images (Figure 16). While defects D4 and D5 were barely detectable during the heating stage, their detectability was further enhanced at the early cooling stage (i.e., t = 7.5 min), notably, in the modulus of the wavelet transform (white positive segments). In terms of an improvement in its visual characteristics, the findings of the current study differ from a previously published paper by Różański and Ziopaja [43], in which the 2D-DWT analysis induced no major enhancement in the detectability of concrete defects, in comparison with the raw thermal images recorded during the cooling time.
It is worth noting that the use of the complex wavelets (e.g., Paul and Morlet), unlike the real wavelets (e.g., the Mexican hat and the Gaussian derivative), failed to provide meaningful results here (see Figure A1 in Appendix A), even at different angles and scales. This can be explained by the fact that complex wavelets are useful for detecting oscillating features, while real-value wavelets are useful for isolating a discontinuity in the signal [109]. Based on the selected wavelet type, we have omitted the imaginary parts of the Mexican hat function in our analysis, in which the estimated CWT coefficients were always zero.
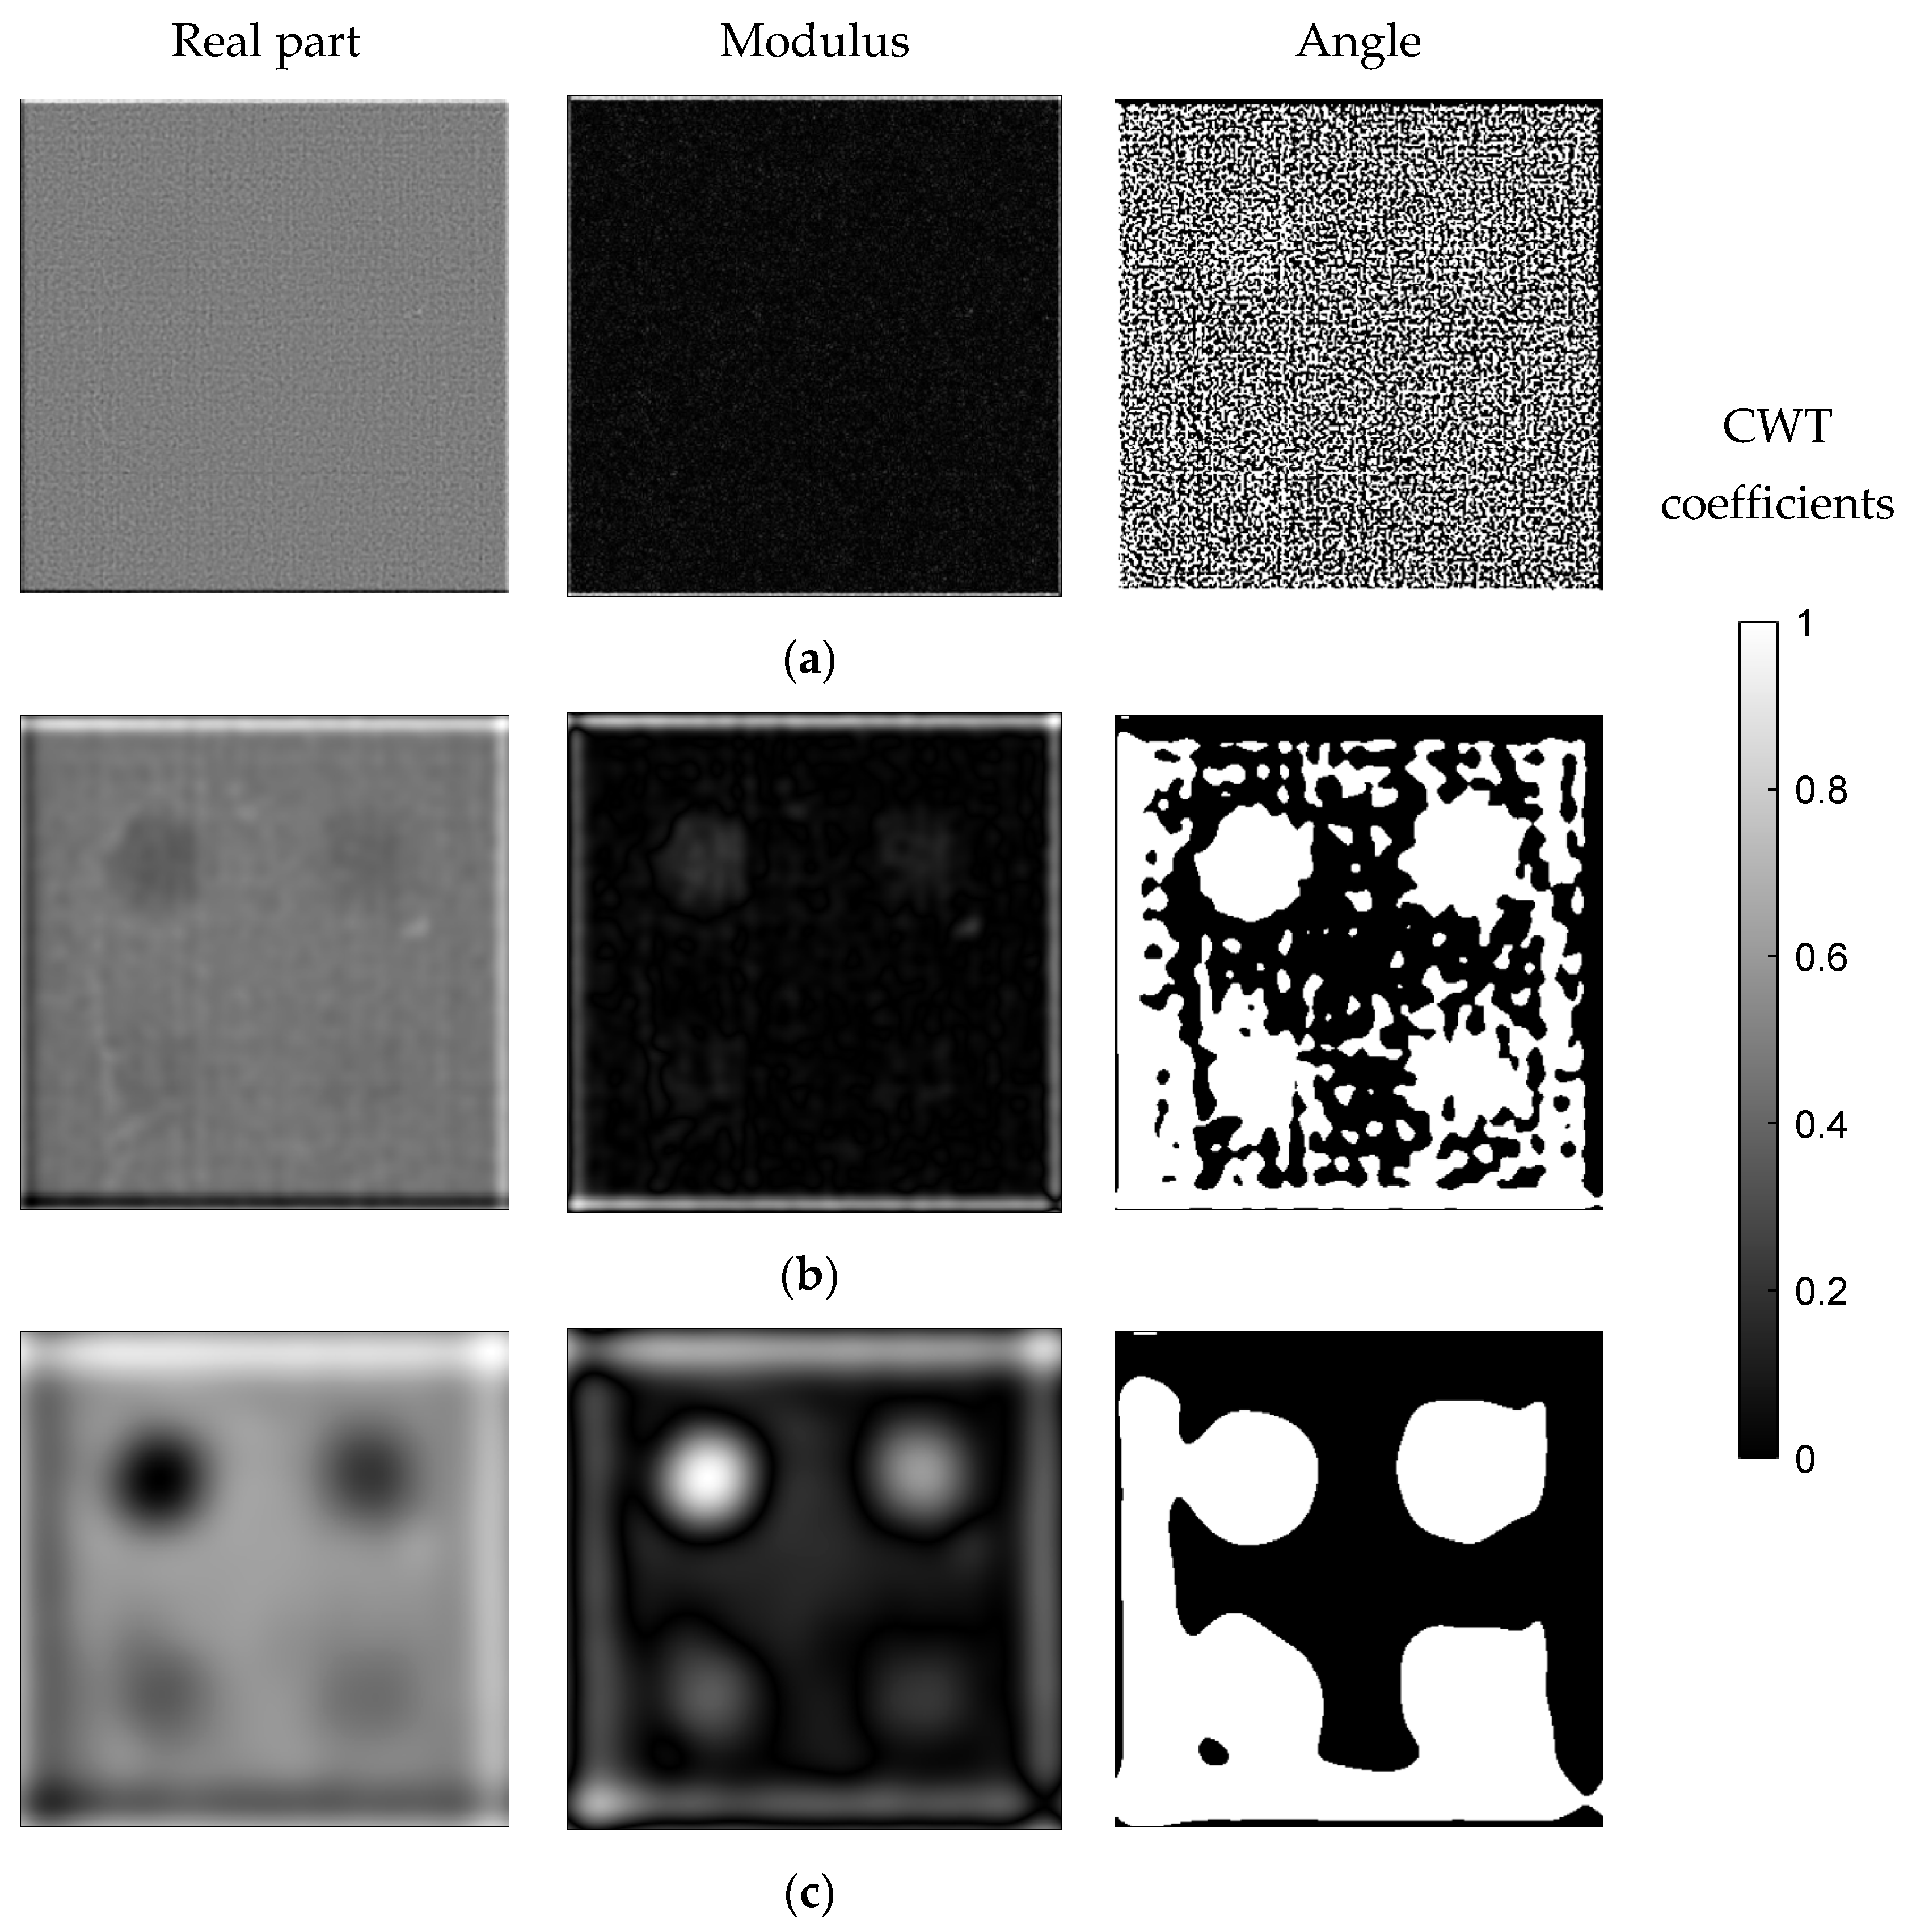
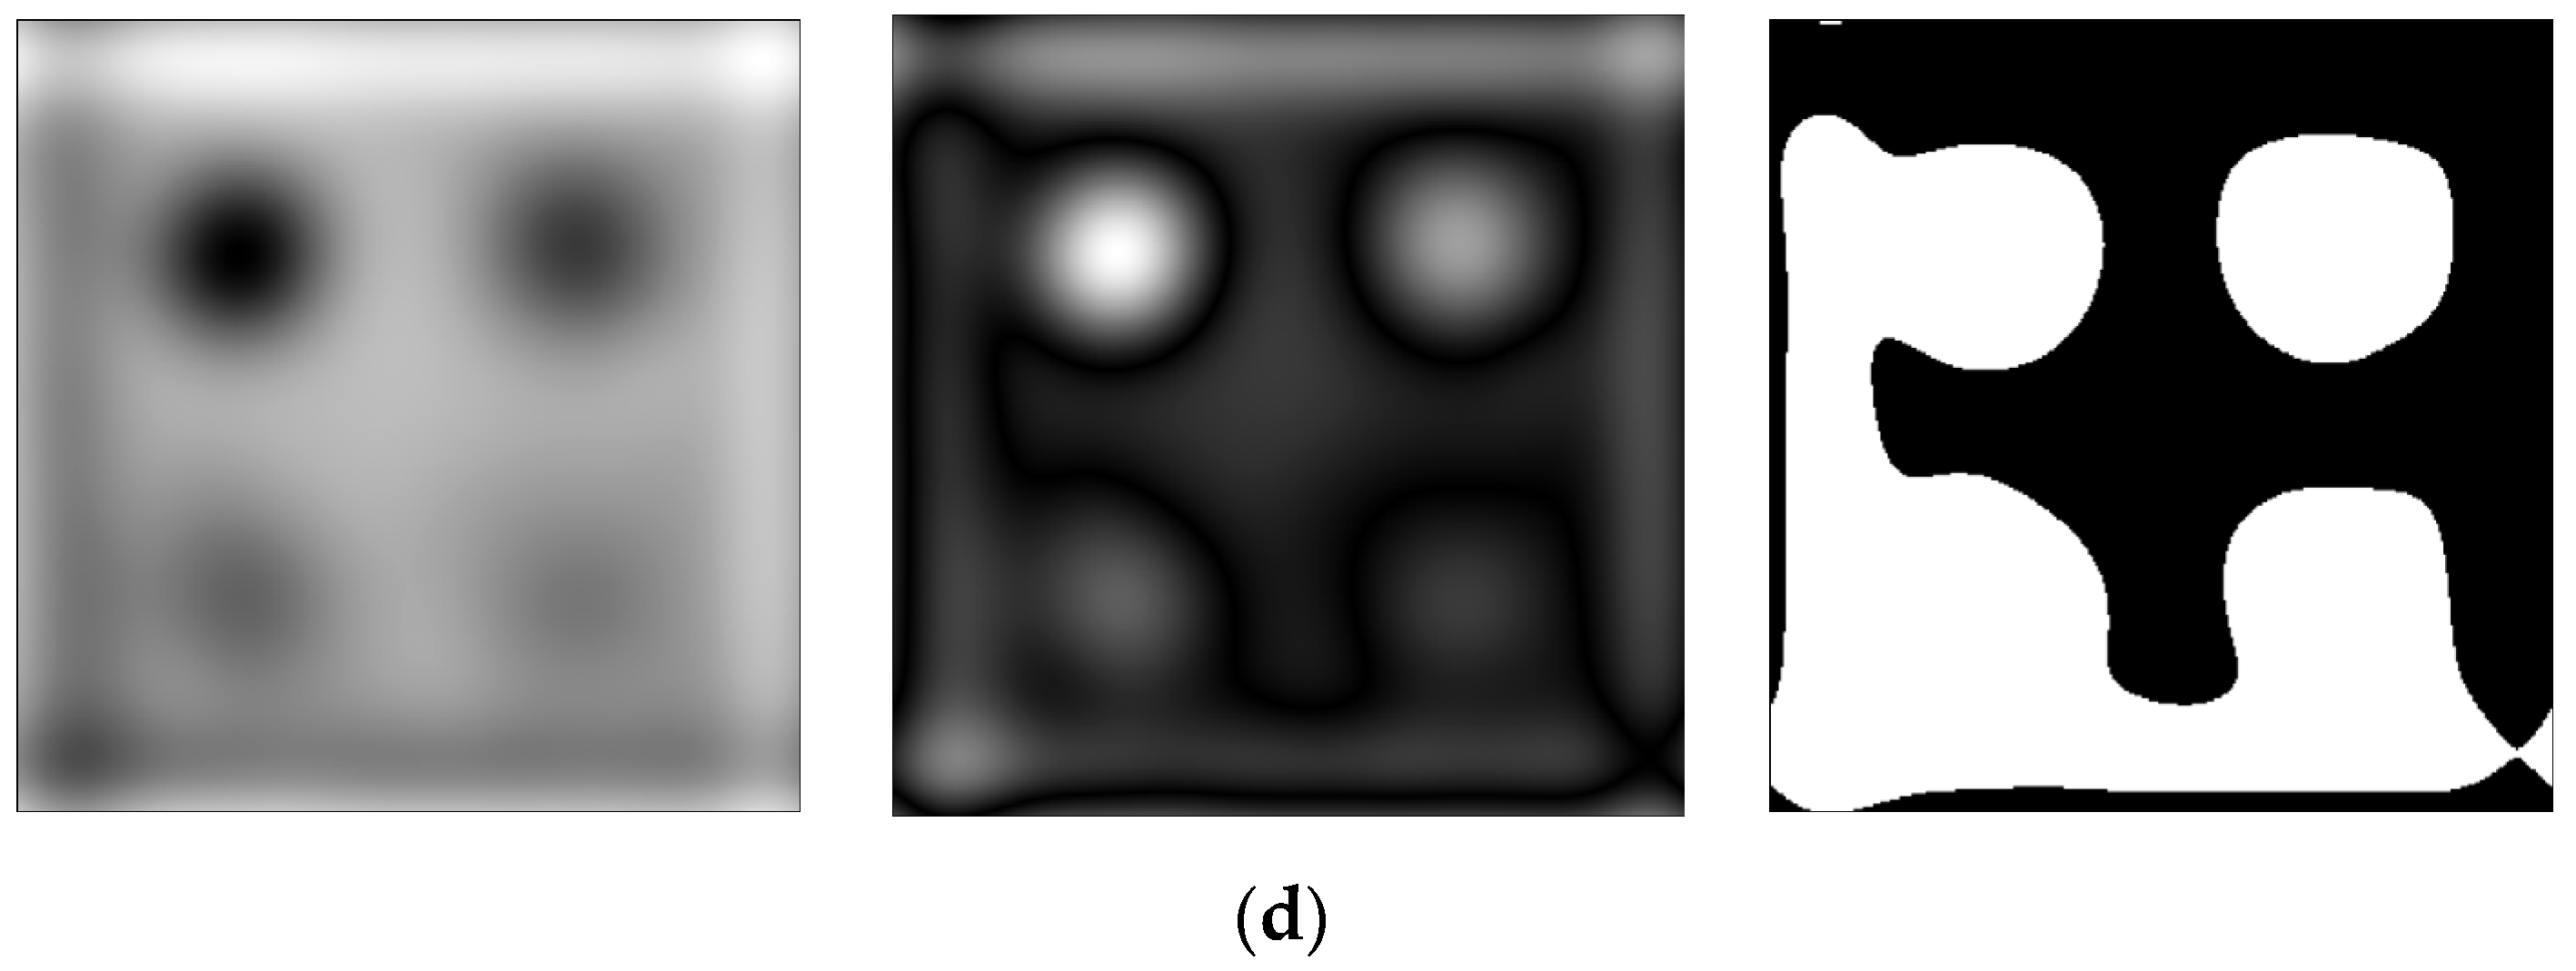
To illustrate and quantify the effect of scale factor a on the detectability of subsurface defects, the same CWT-processed thermal image and of a variable scale is studied (Figure 17). At the lowest scale (or highest frequency; a = 1), the resulting high noise in the processed images significantly diminished the detectability (i.e., all defects were no longer visible); this is common to high frequencies and, in turn, is usually discarded from the analysis [110]. Here, it is evident that there is a significant difference in the representation of the 2D-CWT over the scales of 5 and 10 (shown in the previous section), but not over longer scales. The smaller scale used here tends to extract the discriminatory features that only have sharp edges (or objects) from the original images [52]. This is, of course, not always the case for subsurface defects as they are not exactly focused. Furthermore, the deeper defects were poorly visible at a scale factor of a = 5. Despite the fact that the resulting images were not necessarily informative for the inspector, smaller-scale values gave finer details of the distinguished defects. At higher scales (and lower frequencies) of 15 and 20, the processed CWT images were quite promising. They did not contain unwanted disturbances and allowed the inspector to consider the coefficients that belong to all defects while smoothing the suspected regions [104]. Nonetheless, their shapes were slightly more diffused. In other words, while stretching the whole wavelet, the edges of the defects tended to blur and became less finite than at smaller scales [98]. As can be seen, the selection of the scale factor is greatly subjective and depends on having the requisite level of defect visibility that must be achieved. A set of quantitative measures associated with the different depths and the actual sizes of previous damage can generally provide better information for choosing the optimum scale factor. Such process details are beyond the scope of our research and are left for future explorations.

7. Conclusions

In this paper, we experimentally examined the use of the continuous wavelet transform technique for enhancing the detection of subsurface defects in thermographic images. Active thermography was performed over a plain concrete slab undergoing two phases of heating and cooling. The wavelet transform-based algorithm that we used adopted the isotropic (non-directional) Mexican hat function to examine the visual discriminatory features of CWT-processed images in all directions (orientations).
The temperature responses at selected time intervals showed the presence of the defects closest to the concrete surface in the two test phases, while the deeper ones were more detectable in the cooling phase. However, in practice, relying on the qualitative visualization of temperature data may lead to false positive or false negative results, especially under uncontrolled conditions. Accordingly, the researcher’s personal judgment might be considered doubtful and inaccurate. The experimental results presented herein are intended to emphasize the capabilities of CWT for quantitative analysis and the characterization of defects. With CWT analysis, the variations in the thermal signals are strongly enhanced, and the weak features are clearly reduced. In addition, the CWT method is more robust and sensitive in detecting the boundaries of subsurface damage, which is lacking in the conventional techniques. With such an approach, however, special care must be taken when choosing an appropriate scale factor, in particular regarding the type of wavelet used, which is justified by improving the defects’ visibility. For longer-scale factors (wavelet stretching), the CWT-processed images provided an overall recognition of defect distribution, while at lower scales (wavelet compressing), the defects in the CWT images tended to yield more accurate information regarding location and size. The rescaling process adjusts the band-pass filter characteristics of the Mexican hat function, thereby eliminating noise problems and achieving an improved thermal image. In general, therefore, the findings of this investigation have significant implications for improving applied image processing via the fully automated and more precise localization of defects in concrete structures. Finally, several limitations to this experimental study need to be considered. First, the analyzed thermal images were captured under controlled laboratory conditions and using artificial stimulation sources, lacking practical results in application for evaluation. Second, the influence of ambient temperature, solar radiation, relative humidity, and wind speed cannot be ruled out; more information is needed from field studies to fully assess the applicability of CWT. Further, it is crucial to consider the studied area of defects (= 78.5 cm2), which may be larger than other potential defects in real infrastructures.
In terms of the direction of future research, studies on developing the concept of modular wavelets within image-processing applications are suggested. In addition, the authors plan to extend IRT-based damage detection with the use of more sophisticated feature extraction and classification techniques.

Author Contributions

Conceptualization, A.K.S. and Z.S.; methodology, A.K.S., Z.S. and H.A.; software, A.K.S., Z.S. and H.A.; validation, A.K.S. and Z.S.; formal analysis, A.K.S. and Z.S.; investigation, A.K.S., Z.S. and H.A.; resources, A.K.S., Z.S. and H.A.; data curation, A.K.S. and Z.S.; writing—original draft preparation, A.K.S. and Z.S.; writing—review and editing, A.K.S., Z.S. and H.A.; visualization, A.K.S.; supervision, A.K.S. and Z.S.; project administration, Z.S.; funding acquisition, Z.S. All authors have read and agreed to the published version of the manuscript.

Funding

The presented work was funded by Kuwait Institute for Scientific Research (KISR) and the Soil & Engineering Material Testing Company (SEMATCO) within the project entitled “Assessment of Concrete Structures Using Infrared Thermography”.

Institutional Review Board Statement

Not applicable.

Informed Consent Statement

Not applicable.

Data Availability Statement

The data or codes that support the findings of this study are available from the corresponding author upon reasonable request.

Acknowledgments

The authors would like to express their gratitude to Shamim Ahmed and Hamdy Elsaman for providing technical assistance in the laboratory.

Conflicts of Interest

The authors declare no potential conflict of interest with respect to the research, authorship, and/or publication of this article.

Appendix A

To demonstrate the feasibility of using the complex wavelets and the performance in 2D-CWT for void detection, we processed a selected thermal image with the Paul function (Figure A1). The function is expressed as [102]:
ψ ^ ω x , ω y = 2 p p Γ 2 p 1 2 M p e M χ ω x > 0 ω x , ω y ,
M ω x , ω y = ω x 2 + ω y 2 2 ,
where p ( > 0 ) is the order of the Paul wavelet, ω is the angular frequency, Γ is the Gamma function, and χ is the Heaviside function [111]. The p parameter in the Paul wavelet was chosen as p = 4 for the analysis (for more discussion and examples of this wavelet function, please refer to Torrence and Compo [109]).
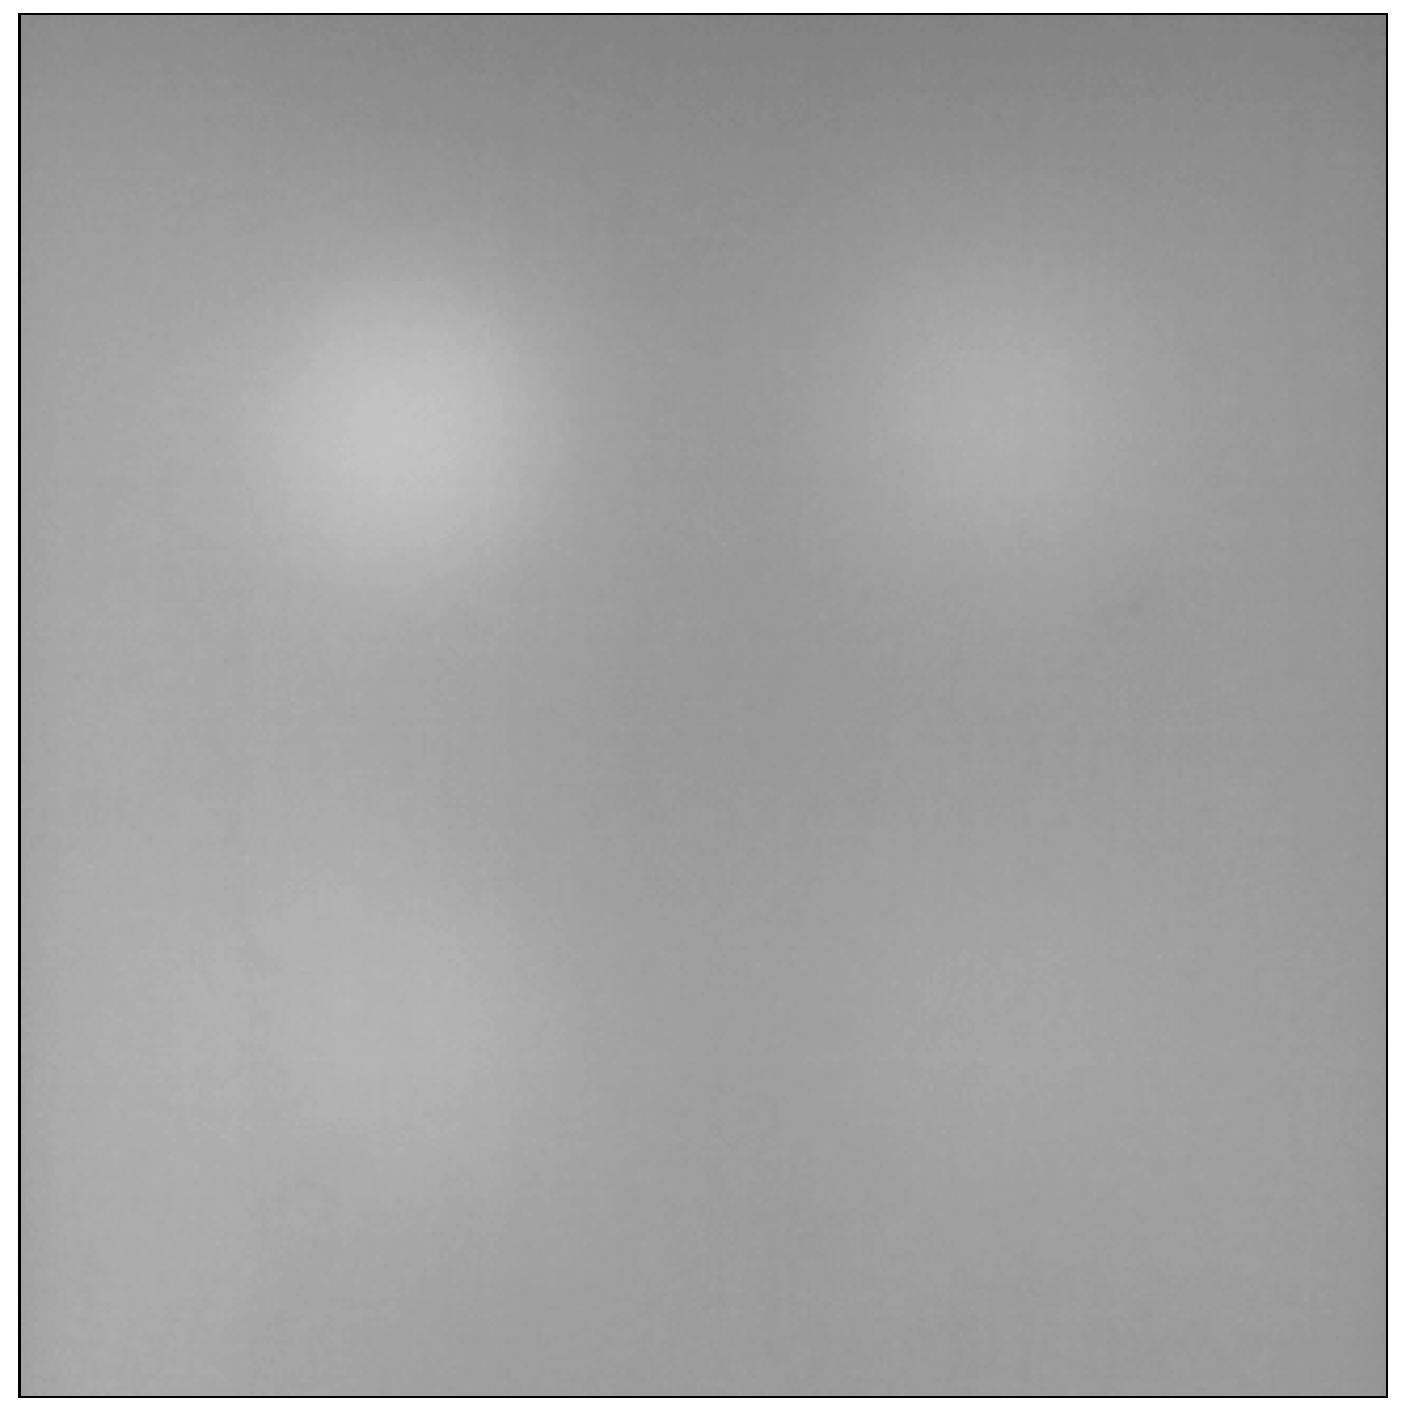
Figure A1. Thermal image, analyzed with the continuous wavelet transform (CWT) using the complex Paul function at a scale of a = 20.
Buildings 12 01967 g0a1aBuildings 12 01967 g0a1b

References

  1. Lerma, C.; Mas, Á.; Gil, E.; Vercher, J.; Peñalver, M.J. Pathology of Building Materials in Historic Buildings. Relationship between Laboratory Testing and Infrared Thermography. Mater. Constr. 2014, 64, e009. [Google Scholar] [CrossRef] [Green Version]
  2. Garrido, I.; Lagüela, S.; Otero, R.; Arias, P. Thermographic Methodologies Used in Infrastructure Inspection: A Review—Data Acquisition Procedures. Infrared Phys. Technol. 2020, 111, 103481. [Google Scholar] [CrossRef]
  3. Aggelis, D.G.; Kordatos, E.Z.; Soulioti, D.V.; Matikas, T.E. Combined Use of Thermography and Ultrasound for the Characterization of Subsurface Cracks in Concrete. Constr. Build. Mater. 2010, 24, 1888–1897. [Google Scholar] [CrossRef]
  4. Tavukçuoğlu, A.; Akevren, S.; Grinzato, E. In Situ Examination of Structural Cracks at Historic Masonry Structures by Quantitative Infrared Thermography and Ultrasonic Testing. J. Mod. Opt. 2010, 57, 1779–1789. [Google Scholar] [CrossRef]
  5. Yousefi, B.; Sfarra, S.; Sarasini, F.; Castanedo, C.I.; Maldague, X.P.V. Low-Rank Sparse Principal Component Thermography (Sparse-PCT): Comparative Assessment on Detection of Subsurface Defects. Infrared Phys. Technol. 2019, 98, 278–284. [Google Scholar] [CrossRef]
  6. Janků, M.; Cikrle, P.; Grošek, J.; Anton, O.; Stryk, J. Comparison of Infrared Thermography, Ground-Penetrating Radar and Ultrasonic Pulse Echo for Detecting Delaminations in Concrete Bridges. Constr. Build. Mater. 2019, 225, 1098–1111. [Google Scholar] [CrossRef]
  7. Barreira, E.; Almeida, R.M.S.F.; Delgado, J.M.P.Q. Infrared Thermography for Assessing Moisture Related Phenomena in Building Components. Constr. Build. Mater. 2016, 110, 251–269. [Google Scholar] [CrossRef]
  8. Barbosa, M.T.G.; Rosse, V.J.; Laurindo, N.G. Thermography Evaluation Strategy Proposal Due Moisture Damage on Building Facades. J. Build. Eng. 2021, 43, 102555. [Google Scholar] [CrossRef]
  9. Doshvarpassand, S.; Wu, C.; Wang, X. An Overview of Corrosion Defect Characterization Using Active Infrared Thermography. Infrared Phys. Technol. 2019, 96, 366–389. [Google Scholar] [CrossRef]
  10. Kobayashi, K.; Banthia, N. Corrosion Detection in Reinforced Concrete Using Induction Heating and Infrared Thermography. J. Civ. Struct. Health Monit. 2011, 1, 25–35. [Google Scholar] [CrossRef]
  11. Sakka, Z.; Taha, M.; Saleh, A.K.; Karam, H.; Qazweeni, J. Structural assessment of underground water reservoirs. In Structures Congress; Techno-Press: Incheon, Korea, 2018. [Google Scholar]
  12. Ahmed, H.; La, H.M.; Gucunski, N. Review of Non-Destructive Civil Infrastructure Evaluation for Bridges: State-of-the-Art Robotic Platforms, Sensors and Algorithms. Sensors 2020, 20, 3954. [Google Scholar] [CrossRef] [PubMed]
  13. Pozzer, S.; Azar, E.R.; Rosa, F.D.; Pravia, Z.M.C. Semantic Segmentation of Defects in Infrared Thermographic Images of Highly Damaged Concrete Structures. J. Perform. Constr. Facil. 2021, 35, 4020131. [Google Scholar] [CrossRef]
  14. Omar, T.; Nehdi, M.L. Remote Sensing of Concrete Bridge Decks Using Unmanned Aerial Vehicle Infrared Thermography. Autom. Constr. 2017, 83, 360–371. [Google Scholar] [CrossRef]
  15. Omar, T.; Nehdi, M.L.; Zayed, T. Infrared Thermography Model for Automated Detection of Delamination in RC Bridge Decks. Constr. Build. Mater. 2018, 168, 313–327. [Google Scholar] [CrossRef]
  16. Abu Dabous, S.; Yaghi, S.; Alkass, S.; Moselhi, O. Concrete Bridge Deck Condition Assessment Using IR Thermography and Ground Penetrating Radar Technologies. Autom. Constr. 2017, 81, 340–354. [Google Scholar] [CrossRef]
  17. Sham, J.F.C.; Lai, W.W.L.; Chan, W.; Koh, C.L. Imaging and Condition Diagnosis of Underground Sewer Liners via Active and Passive Infrared Thermography: A Case Study in Singapore. Tunn. Undergr. Space Technol. 2019, 84, 440–450. [Google Scholar] [CrossRef]
  18. Cheng, C.; Shen, Z. Semi Real-Time Detection of Subsurface Consolidation Defects during Concrete Curing Stage. Constr. Build. Mater. 2021, 270, 121489. [Google Scholar] [CrossRef]
  19. Kulkarni, N.N.; Dabetwar, S.; Benoit, J.; Yu, T.; Sabato, A. Comparative Analysis of Infrared Thermography Processing Techniques for Roadways’ Sub-Pavement Voids Detection. NDT Int. 2022, 129, 102652. [Google Scholar] [CrossRef]
  20. Janků, M.; Stryk, J. Application of Infrared Camera to Bituminous Concrete Pavements: Measuring Vehicle. IOP Conf. Ser. Mater. Sci. Eng. 2017, 236, 012104. [Google Scholar] [CrossRef]
  21. Wiecek, B. Review on thermal image processing for passive and active thermography. In Proceedings of the IEEE Engineering in Medicine and Biology 27th Annual Conference, IEEE, Shanghai, China, 17–18 January 2006; pp. 686–689. [Google Scholar]
  22. Milovanović, B.; Banjad Pečur, I. Review of Active IR Thermography for Detection and Characterization of Defects in Reinforced Concrete. J. Imaging 2016, 2, 11. [Google Scholar] [CrossRef]
  23. Usamentiaga, R.; Venegas, P.; Guerediaga, J.; Vega, L.; Molleda, J.; Bulnes, F. Infrared Thermography for Temperature Measurement and Non-Destructive Testing. Sensors 2014, 14, 12305–12348. [Google Scholar] [CrossRef] [PubMed] [Green Version]
  24. Bagavathiappan, S.; Lahiri, B.B.; Saravanan, T.; Philip, J.; Jayakumar, T. Infrared Thermography for Condition Monitoring-A Review. Infrared Phys. Technol. 2013, 60, 35–55. [Google Scholar] [CrossRef]
  25. Zheng, Y.; Wang, S.; Zhang, P.; Xu, T.; Zhuo, J. Application of Nondestructive Testing Technology in Quality Evaluation of Plain Concrete and RC Structures in Bridge Engineering: A Review. Buildings 2022, 12, 843. [Google Scholar] [CrossRef]
  26. Raja, B.N.K.; Miramini, S.; Duffield, C.; Sofi, M.; Mendis, P.; Zhang, L. The Influence of Ambient Environmental Conditions in Detecting Bridge Concrete Deck Delamination Using Infrared Thermography (IRT). Struct. Control Health Monit. 2020, 27, e2506. [Google Scholar] [CrossRef]
  27. Dudzik, S. Analysis of the Accuracy of a Neural Algorithm for Defect Depth Estimation Using PCA Processing from Active Thermography Data. Infrared Phys. Technol. 2013, 56, 1–7. [Google Scholar] [CrossRef]
  28. Kylili, A.; Fokaides, P.A.; Christou, P.; Kalogirou, S.A. Infrared Thermography (IRT) Applications for Building Diagnostics: A Review. Appl. Energy 2014, 134, 531–549. [Google Scholar] [CrossRef]
  29. Garrido, I.; Barreira, E.; Almeida, R.M.; Lagüela, S. Introduction of Active Thermography and Automatic Defect Segmentation in the Thermographic Inspection of Specimens of Ceramic Tiling for Building Façades. Infrared Phys. Technol. 2022, 121, 104012. [Google Scholar] [CrossRef]
  30. Lai, W.L.; Poon, C.S. Applications of Nondestructive Evaluation Techniques in Concrete Inspection. HKIE Trans. 2012, 19, 34–41. [Google Scholar] [CrossRef]
  31. Mohan, A.; Poobal, S. Crack Detection Using Image Processing: A Critical Review and Analysis. Alex. Eng. J. 2018, 57, 787–798. [Google Scholar] [CrossRef]
  32. Noszczyk, P.; Nowak, H. Inverse Contrast in Non-Destructive Materials Research by Using Active Thermography. Materials 2019, 12, 835. [Google Scholar] [CrossRef]
  33. Kurita, K.; Oyado, M.; Tanaka, H.; Tottori, S. Active Infrared Thermographic Inspection Technique for Elevated Concrete Structures Using Remote Heating System. Infrared Phys. Technol. 2009, 52, 208–213. [Google Scholar] [CrossRef]
  34. Gavrilov, D.; Maev, R. Extraction of Independent Structural Images for Principal Component Thermography. Appl. Sci. 2018, 8, 459. [Google Scholar] [CrossRef] [Green Version]
  35. Lopez, F.; Ibarra-Castanedo, C.; de Paulo Nicolau, V.; Maldague, X. Optimization of Pulsed Thermography Inspection by Partial Least-Squares Regression. NDT E Int. 2014, 66, 128–138. [Google Scholar] [CrossRef]
  36. Marchetti, M.; Boucher, V.; Dumoulin, J.; Colomb, M. Retrieving Visibility Distance in Fog Combining Infrared Thermography, Principal Components Analysis and Partial Least-Square Regression. Infrared Phys. Technol. 2015, 71, 289–297. [Google Scholar] [CrossRef]
  37. Fan, Z.; Bi, D.; Xiong, L.; Ma, S.; He, L.; Ding, W. Dim Infrared Image Enhancement Based on Convolutional Neural Network. Neurocomputing 2018, 272, 396–404. [Google Scholar] [CrossRef]
  38. Khan, F.; Bolhassani, M.; Kontsos, A.; Hamid, A.; Bartoli, I. Modeling and Experimental Implementation of Infrared Thermography on Concrete Masonry Structures. Infrared Phys. Technol. 2015, 69, 228–237. [Google Scholar] [CrossRef]
  39. Vega Díaz, J.J.; Vlaminck, M.; Lefkaditis, D.; Orjuela Vargas, S.A.; Luong, H. Solar Panel Detection within Complex Backgrounds Using Thermal Images Acquired by UAVs. Sensors 2020, 20, 6219. [Google Scholar] [CrossRef]
  40. Selim, H.; Piñal Moctezuma, F.; Delgado Prieto, M.; Francisco Trull, J.; Romeral Martínez, L.; Cojocaru, C. Wavelet transform applied to internal defect detection by means of laser ultrasound. In Wavelet Transform and Complexity; Baleanu, D., Ed.; IntechOpen: London, UK, 2019; pp. 95–109. [Google Scholar]
  41. Mahdian Parrany, A. Damage Detection in Circular Cylindrical Shells Using Active Thermography and 2-D Discrete Wavelet Analysis. Thin-Walled Struct. 2019, 136, 34–49. [Google Scholar] [CrossRef]
  42. Ziopaja, K.; Pozorski, Z.; Garstecki, A. Damage Detection Using Thermal Experiments and Wavelet Transformation. Inverse Probl. Sci. Eng. 2011, 19, 127–153. [Google Scholar] [CrossRef]
  43. Różański, L.; Ziopaja, K. Applicability Analysis of IR Thermography and Discrete Wavelet Transform for Technical Conditions Assessment of Bridge Elements. Quant. InfraRed Thermogr. J. 2019, 16, 87–110. [Google Scholar] [CrossRef]
  44. Chrysafi, A.P.; Athanasopoulos, N.; Siakavellas, N.J. Damage Detection on Composite Materials with Active Thermography and Digital Image Processing. Int. J. Therm. Sci. 2017, 116, 242–253. [Google Scholar] [CrossRef]
  45. Shrestha, R.; Chung, Y.; Kim, W. Wavelet Transform Applied to Lock-In Thermographic Data for Detection of Inclusions in Composite Structures: Simulation and Experimental Studies. Infrared Phys. Technol. 2019, 96, 98–112. [Google Scholar] [CrossRef]
  46. Moradi, M.; Safizadeh, M.S. Edge Disbond Detection of Carbon/Epoxy Repair Patch on Aluminum Using Thermography. Compos. Sci. Technol. 2019, 179, 41–53. [Google Scholar] [CrossRef]
  47. Mehta, A.; Goyal, D.; Choudhary, A.; Pabla, B.S.; Belghith, S. Machine Learning-Based Fault Diagnosis of Self-Aligning Bearings for Rotating Machinery Using Infrared Thermography. Math. Probl. Eng. 2021, 2021, 9947300. [Google Scholar] [CrossRef]
  48. Choudhary, A.; Goyal, D.; Letha, S.S. Infrared Thermography-Based Fault Diagnosis of Induction Motor Bearings Using Machine Learning. IEEE Sens. J. 2021, 21, 1727–1734. [Google Scholar] [CrossRef]
  49. Tong, Z.; Xie, S.; Chen, H.; Qiu, J.; Cai, W.; Pei, C.; Chen, Z.; Uchimoto, T.; Takagi, T. Quantitative Mapping of Depth Profile of Fatigue Cracks Using Eddy Current Pulsed Thermography Assisted by PCA and 2D Wavelet Transformation. Mech. Syst. Signal Process. 2022, 175, 109139. [Google Scholar] [CrossRef]
  50. Yadav, A.; Sengar, N.; Issac, A.; Dutta, M.K. Image Processing Based Acrylamide Detection from Fried Potato Chip Images Using Continuous Wavelet Transform. Comput. Electron. Agric. 2018, 145, 349–362. [Google Scholar] [CrossRef]
  51. Shiji, T.P.; Remya, S.; Lakshmanan, R.; Pratab, T.; Thomas, V. Evolutionary Intelligence for Breast Lesion Detection in Ultrasound Images: A Wavelet Modulus Maxima and SVM Based Approach. J. Intell. Fuzzy Syst. 2020, 38, 6279–6290. [Google Scholar] [CrossRef]
  52. Reddy, V.K.; Siramoju, K.K.; Sircar, P. Object detection by 2-D continuous wavelet transform. In Proceedings of the International Conference on Computational Science and Computational Intelligence, IEEE, Las Vegas, NV, USA, 10–13 March 2014; pp. 162–167. [Google Scholar]
  53. Cotič, P.; Kolarič, D.; Bosiljkov, V.B.; Bosiljkov, V.; Jagličić, Z. Determination of the Applicability and Limits of Void and Delamination Detection in Concrete Structures Using Infrared Thermography. NDT Int. 2015, 74, 87–93. [Google Scholar] [CrossRef]
  54. Pedram, M.; Taylor, S.; Robinson, D.; Hamill, G.; O’Brien, E.; Uddin, N. Experimental Investigation of Subsurface Defect Detection in Concretes by Infrared Thermography and Convection Heat Exchange. J. Civ. Struct. Health Monit. 2022. [Google Scholar] [CrossRef]
  55. Huh, J.; Mac, V.; Tran, Q.; Lee, K.-Y.; Lee, J.-I.; Kang, C. Detectability of Delamination in Concrete Structure Using Active Infrared Thermography in Terms of Signal-to-Noise Ratio. Appl. Sci. 2018, 8, 1986. [Google Scholar] [CrossRef] [Green Version]
  56. Tran, Q.H.; Huh, J.; Mac, V.H.; Kang, C.; Han, D. Effects of Rebars on the Detectability of Subsurface Defects in Concrete Bridges Using Square Pulse Thermography. NDT Int. 2018, 100, 92–100. [Google Scholar] [CrossRef]
  57. Mac, V.H.; Huh, J.; Doan, N.S.; Shin, G.; Lee, B.Y. Thermography-Based Deterioration Detection in Concrete Bridge Girders Strengthened with Carbon Fiber-Reinforced Polymer. Sensors 2020, 20, 3263. [Google Scholar] [CrossRef]
  58. Milovanović, B.; Banjad Pečur, I.; Štirmer, N. The Methodology for Defect Quantification in Concrete Using IR Thermography. J. Civ. Eng. Manag. 2017, 23, 573–582. [Google Scholar] [CrossRef] [Green Version]
  59. Cheng, C.; Shen, Z. Time-series based thermography on concrete block void detection. In Proceedings of the Construction Research Congress, New Orleans, LA, USA, 2–4 April 2018; American Society of Civil Engineers: Reston, VA, USA, 2018; pp. 732–742. [Google Scholar]
  60. Milovanović, B.; Gaši, M.; Gumbarević, S. Principal Component Thermography for Defect Detection in Concrete. Sensors 2020, 20, 3891. [Google Scholar] [CrossRef] [PubMed]
  61. Zhang, T.; Rahman, M.A.; Peterson, A.; Lu, Y. Novel Damage Index-Based Rapid Evaluation of Civil Infrastructure Subsurface Defects Using Thermography Analytics. Infrastructures 2022, 7, 55. [Google Scholar] [CrossRef]
  62. Mac, V.H.; Tran, Q.H.; Huh, J.; Doan, N.S.; Kang, C.; Han, D. Detection of Delamination with Various Width-to-Depth Ratios in Concrete Bridge Deck Using Passive IRT: Limits and Applicability. Materials 2019, 12, 3996. [Google Scholar] [CrossRef] [Green Version]
  63. Tran, Q.H.; Huh, J.; Kang, C.; Lee, B.Y.; Kim, I.-T.; Ahn, J.-H. Detectability of Subsurface Defects with Different Width-to-Depth Ratios in Concrete Structures Using Pulsed Thermography. J. Nondestruct. Eval. 2018, 37, 32. [Google Scholar] [CrossRef]
  64. Huh, J.; Tran, Q.H.; Lee, J.-H.; Han, D.; Ahn, J.-H.; Yim, S. Experimental Study on Detection of Deterioration in Concrete Using Infrared Thermography Technique. Adv. Mater. Sci. Eng. 2016, 2016, 1053856. [Google Scholar] [CrossRef] [Green Version]
  65. Różański, L.; Ziopaja, K. Detection of Material Defects in Reinforced Concrete Slab Using Active Thermography. Meas. Autom. Monit. 2017, 63, 82–85. [Google Scholar]
  66. Ishikawa, M.; Tsukagoshi, M.; Kasano, H.; Nishino, H. Influence of Composition and Surface Discoloration of Concrete on Active Thermographic Nondestructive Inspection. Measurement 2021, 168, 108395. [Google Scholar] [CrossRef]
  67. Farrag, S.; Yehia, S.; Qaddoumi, N. Investigation of Mix-Variation Effect on Defect-Detection Ability Using Infrared Thermography as a Nondestructive Evaluation Technique. J. Bridge Eng. 2016, 21, 04015055. [Google Scholar] [CrossRef]
  68. Belattar, S.; Rhazi, J.; Ballouti, A.E. Non-Destructive Testing by Infrared Thermography of the Void and Honeycomb Type Defect in the Concrete. Int. J. Microstruct. Mater. Prop. 2012, 7, 235–253. [Google Scholar] [CrossRef]
  69. Pozzer, S.; Pravia, Z.M.C.; Rezazadeh Azar, E.; Dalla Rosa, F. Statistical Analysis of Favorable Conditions for Thermographic Inspection of Concrete Slabs. J. Civ. Struct. Health Monit. 2020, 10, 609–626. [Google Scholar] [CrossRef]
  70. Hiasa, S.; Birgul, R.; Catbas, F.N. Investigation of Effective Utilization of Infrared Thermography (IRT) through Advanced Finite Element Modeling. Constr. Build. Mater. 2017, 150, 295–309. [Google Scholar] [CrossRef]
  71. Hiasa, S.; Birgul, R.; Matsumoto, M.; Necati Catbas, F. Experimental and Numerical Studies for Suitable Infrared Thermography Implementation on Concrete Bridge Decks. Measurement 2018, 121, 144–159. [Google Scholar] [CrossRef]
  72. Raja, B.N.K.; Miramini, S.; Duffield, C.; Sofi, M.; Zhang, L. Infrared Thermography Detection of Delamination in Bottom of Concrete Bridge Decks. Struct. Control Health Monit. 2022, 29, e2886. [Google Scholar] [CrossRef]
  73. Mac, V.H.; Huh, J.; Doan, N.S.; Lee, B.Y.; Haldar, A. A Comprehensive Study on Identification of Both Deck and Soffit Defects in Concrete Bridge Decks through Thermographic Investigation of Shaded Side under Natural Conditions. Constr. Build. Mater. 2021, 303, 124452. [Google Scholar] [CrossRef]
  74. Rocha, J.H.A.; Póvoas, Y.V.; Santos, C.F. Detection of Delaminations in Sunlight-Unexposed Concrete Elements of Bridges Using Infrared Thermography. J. Nondestruct. Eval. 2019, 38, 8. [Google Scholar] [CrossRef]
  75. Coleman, Z.W.; Schindler, A.K. Investigation of Ground-Penetrating Radar, Impact Echo, and Infrared Thermography Methods to Detect Defects in Concrete Bridge Decks. Transp. Res. Rec. J. Transp. Res. Board 2022. [Google Scholar] [CrossRef]
  76. Al Gharawi, M.; Adu-Gyamfi, Y.; Washer, G. A Framework for Automated Time-Lapse Thermography Data Processing. Constr. Build. Mater. 2019, 227, 116507. [Google Scholar] [CrossRef]
  77. Maldague, X.; Galmiche, F.; Ziadi, A. Advances in Pulsed Phase Thermography. Infrared Phys. Technol. 2002, 43, 175–181. [Google Scholar] [CrossRef] [Green Version]
  78. Liu, J.; Yang, W.; Dai, J. Research on Thermal Wave Processing of Lock-in Thermography Based on Analyzing Image Sequences for NDT. Infrared Phys. Technol. 2010, 53, 348–357. [Google Scholar] [CrossRef]
  79. Carreiras, C.; Lourenço, A.; Silva, H.; Fred, A. A unifying approach to ECG biometric recognition using the wavelet transform. In Image Analysis and Recognition. Lecture Notes in Computer Science; Kamel, M., Campilho, A., Eds.; Springer: Berlin/Heidelberg, Germany, 2013; Volume 7950, pp. 53–62. ISBN 978-3-642-39094-4. [Google Scholar]
  80. Peng, W.; Wang, F.; Meng, X.; Wang, Y.; Liu, J.; Xiao, P.; Wang, Y.; Dai, J. Dynamic Thermal Tomography Based on Continuous Wavelet Transform for Debonding Detection of the High Silicon Oxygen Phenolic Resin Cladding Layer. Infrared Phys. Technol. 2018, 92, 115–121. [Google Scholar] [CrossRef]
  81. Subirats, P.; Dumoulin, J.; Legeay, V.; Barba, D. Automation of pavement surface crack detection using the continuous wavelet transform. In Proceedings of the International Conference on Image Processing, Atlanta, GA, USA, 8–11 October 2006; pp. 3037–3040. [Google Scholar]
  82. Bultheel, A.; Huybrechs, D. Wavelets with Applications in Signal and Image. 2014. Available online: https://people.cs.kuleuven.be/~daan.huybrechs/teaching/wavelets2014.pdf (accessed on 3 November 2022).
  83. Romero, D.; Ruedin, A.; Seijas, L. Wavelet-based feature extraction for handwritten numerals. In Image Analysis and Processing. Lecture Notes in Computer Science; Foggia, P., Sansone, C., Vento, M., Eds.; Springer: Berlin/Heidelberg, Germany, 2009; Volume 5716, pp. 374–383. ISBN 978-3-642-04146-4. [Google Scholar]
  84. Fan, W.; Qiao, P. A 2-D Continuous Wavelet Transform of Mode Shape Data for Damage Detection of Plate Structures. Int. J. Solids Struct. 2009, 46, 4379–4395. [Google Scholar] [CrossRef] [Green Version]
  85. Rucka, M.; Wilde, K. Application of Continuous Wavelet Transform in Vibration Based Damage Detection Method for Beams and Plates. J. Sound Vib. 2006, 297, 536–550. [Google Scholar] [CrossRef]
  86. Babiker, O.M. 2D Wavelet Analysis of the Free Surface with Subsurface Turbulence. Master’s Thesis, Norwegian University of Science and Technology, Trondheim, Norway, 2021. [Google Scholar]
  87. Gholizad, A.; Safari, H. Two-Dimensional Continuous Wavelet Transform Method for Multidamage Detection of Space Structures. J. Perform. Constr. Facil. 2016, 30, 04016064. [Google Scholar] [CrossRef]
  88. Komorowski, D.; Pietraszek, S. The Use of Continuous Wavelet Transform Based on the Fast Fourier Transform in the Analysis of Multi-Channel Electrogastrography Recordings. J. Med. Syst. 2016, 40, 10. [Google Scholar] [CrossRef] [Green Version]
  89. Antoine, J.-P.; Carrette, P.; Murenzi, R.; Piette, B. Image Analysis with Two-Dimensional Continuous Wavelet Transform. Signal Process. 1993, 31, 241–272. [Google Scholar] [CrossRef]
  90. Antoine, J.-P. The Continuous Wavelet Transform in Image Processing. CWI Q. 1998, 11, 323–345. [Google Scholar]
  91. Toufik, B.; Mokhtar, N. The wavelet transform for image processing applications. In Advances in Wavelet Theory and Their Applications in Engineering, Physics and Technology; Baleanu, D., Ed.; InTech: London, UK, 2012; pp. 395–422. [Google Scholar]
  92. Kosmatka, S.H.; Kerkhoff, B.; Panarese, W.C. Design and Control of Concrete Mixtures, 14th ed.; Portland Cement Association (PCA): Skokie, IL, USA, 2003. [Google Scholar]
  93. Stalnaker, J.J.; Harris, E.C. Formwork for concrete. In Structural Design in Wood. VNR Structural Engineering Series; Springer: Boston, MA, USA, 1997; pp. 308–315. [Google Scholar]
  94. BS EN 12390-3; Testing Hardened Concrete-Part 3: Compressive Strength of Test Specimens. British Standards Institution: London, UK, 2019.
  95. Schneider, C.A.; Rasband, W.S.; Eliceiri, K.W. NIH Image to ImageJ: 25 Years of Image Analysis. Nat. Methods 2012, 9, 671–675. [Google Scholar] [CrossRef] [PubMed]
  96. Loutas, T.; Kostopoulos, V. Utilising the wavelet transform in condition-based maintenance: A review with applications. In Advances in Wavelet Theory and Their Applications in Engineering, Physics and Technology; Baleanu, D., Ed.; InTech: Rijeka, Croatia, 2012; pp. 273–312. ISBN 978-953-51-0494-0. [Google Scholar]
  97. Marr, D.; Hildreth, E. Theory of Edge Detection. Proc. R. Soc. Lond. Ser. B. Biol. Sci. 1980, 207, 187–217. [Google Scholar] [CrossRef]
  98. Wang, N.; Lu, C. Two-Dimensional Continuous Wavelet Analysis and Its Application to Meteorological Data. J. Atmos. Ocean. Technol. 2010, 27, 652–666. [Google Scholar] [CrossRef]
  99. Sheng, Y. Wavelet transform. In Transforms and Applications Handbook; Poularikas, A.D., Ed.; CRC Press: Boca Raton, FL, USA, 2010; ISBN 9781420066524. [Google Scholar]
  100. Antoine, J.-P.; Murenzi, R. Two-Dimensional Directional Wavelets and the Scale-Angle Representation. Signal Process. 1996, 52, 259–281. [Google Scholar] [CrossRef]
  101. Chen, Y.; Dass, S.C.; Jain, A.K. Localized iris image quality using 2-D wavelets. In Lecture Notes in Computer Science; Springer: Berlin/Heidelberg, Germany, 2005; Volume 3832, pp. 373–381. [Google Scholar]
  102. Misiti, M.; Misiti, Y.; Oppenheim, G.; Poggi, J.-M. Wavelet ToolboxTM User’s Guide; The MathWorks Inc.: Natick, MA, USA, 2022. [Google Scholar]
  103. Kosasih, K.; Abeyratne, U.R.; Swarnkar, V.; Triasih, R. Wavelet Augmented Cough Analysis for Rapid Childhood Pneumonia Diagnosis. IEEE Trans. Biomed. Eng. 2015, 62, 1185–1194. [Google Scholar] [CrossRef] [PubMed]
  104. Sarvaiya, J.N.; Patnaik, S. Automatic Image Registration Using Mexican Hat Wavelet, Invariant Moment, and Radon Transform. Int. J. Adv. Comput. Sci. Appl. Spec. Issue Image Process. Anal. 2011, 1, 75–84. [Google Scholar] [CrossRef] [Green Version]
  105. Sun, J.G. Analysis of Pulsed Thermography Methods for Defect Depth Prediction. J. Heat Transf. 2006, 128, 329–338. [Google Scholar] [CrossRef]
  106. Szymanik, B.; Chady, T.; Gorący, K. Numerical Modelling and Experimental Evaluation of the Composites Using Active Infrared Thermography with Forced Cooling. Quant. InfraRed Thermogr. J. 2020, 17, 107–129. [Google Scholar] [CrossRef]
  107. Kee, S.-H.; Oh, T.; Popovics, J.S.; Arndt, R.W.; Zhu, J. Nondestructive Bridge Deck Testing with Air-Coupled Impact-Echo and Infrared Thermography. J. Bridge Eng. 2012, 17, 928–939. [Google Scholar] [CrossRef]
  108. ASTM D4788-03; Standard Test Method for Detecting Delaminations in Bridge Decks Using Infrared Thermography. ASTM: West Conshohocken, PA, USA, 2022.
  109. Torrence, C.; Compo, G.P. A Practical Guide to Wavelet Analysis. Bull. Am. Meteorol. Soc. 1998, 79, 61–78. [Google Scholar] [CrossRef]
  110. Mager, D.E.; Kobrinsky, E.; Masoudieh, A.; Maltsev, A.; Abernethy, D.R.; Soldatov, N.M. Analysis of Functional Signaling Domains from Fluorescence Imaging and the Two-Dimensional Continuous Wavelet Transform. Biophys. J. 2007, 93, 2900–2910. [Google Scholar] [CrossRef] [PubMed] [Green Version]
  111. Coşkun, E.; Özder, S. Paul Wavelet Algorithm for the Determination of Birefringence Dispersion of a Liquid Crystal Cell. J. Opt. Soc. Am. B 2011, 28, 2974–2978. [Google Scholar] [CrossRef]
Figure 1. Images for the top surface of a water reservoir roof, showing the area with spalled concrete: (a) the infrared (IR) thermal image; (b) the corresponding visual image. The arrow indicates an area of concrete spalling caused by severe steel corrosion.
Buildings 12 01967 g001
Figure 2. Location, size, and depth of the embedded subsurface defects in the concrete specimen. The schematic drawing is to scale.
Buildings 12 01967 g002
Figure 3. (a) Close-up view of the artificially created defects inside the wooden mold before pouring the concrete, (b) when curing the sample inside the water tank, and (c) the hardened concrete slab. Note: the numbers in (a) are used to represent the defect order and do not represent their depth.
Buildings 12 01967 g003
Figure 4. The schematic diagram for the active infrared thermography (IRT) setup used in the present study.
Buildings 12 01967 g004
Figure 5. Schematic diagram of the thermographic setup.
Buildings 12 01967 g005
Figure 6. Experimental setup of the thermographic test in the process of heating the concrete specimen.
Buildings 12 01967 g006
Figure 7. Horizontal and vertical scale bars of 10 cm in length, applied to the specimen’s thermogram.
Buildings 12 01967 g007
Figure 8. Three-dimensional surface plot of the grayscale thermal image (8-bit) of the concrete specimen, monitored with an infrared camera after continuous heating for 2 h. The color bar on the right side of the surface plot depicts the grayscale level.
Buildings 12 01967 g008
Figure 9. Infrared (IR) image snapshot, showing the areas that were placed while calculating the spatial medians of temperature data over time for the four defective areas (D2, D3, D4, and D5) and the selected sound area (S).
Buildings 12 01967 g009
Figure 10. Graphs of the most common wavelets used for continuous analysis: (a) Morlet, (b) a Gaussian derivative, and (c) a Mexican hat.
Buildings 12 01967 g010
Figure 11. The sequence flow chart of the proposed image-processing methods for the analysis.
Buildings 12 01967 g011
Figure 12. Selected thermal images at the end of (a) 0.5 h of heating, (b) 1 h of heating, and (c) 2 h of heating, in which the blue and red dashed lines correspond to temperature profiles over the sound and defective areas.
Buildings 12 01967 g012aBuildings 12 01967 g012b
Figure 13. Selected thermal images at the end of (a) 7.5 min of cooling and (b) 15 min of cooling, in which the blue and red dashed lines correspond to temperature profiles over the sound and defective areas.
Buildings 12 01967 g013
Figure 14. The thermal contrast evolution of a thermal image sequence during the infrared thermography (IRT) test for the concrete specimen with defects D2–D5, during the (a) heating and (b) cooling stages. The insets show the surface temperatures of the defective and sound concrete zones. The same line colors were used in the insets as in the original legend.
Buildings 12 01967 g014aBuildings 12 01967 g014b
Figure 15. The continuous wavelet transformation results after processing the thermal (grayscale) images, at a scale factor of a = 10. The input images were captured during the heating stage at the end of (a) 30 min, (b) 60 min, and (c) 120 min.
Buildings 12 01967 g015
Figure 16. The continuous wavelet transformation results after processing the thermal (grayscale) images, at a scale factor of a = 10. The input images were captured during the cooling stage at the end of (a) 7.5 min, (b) 15 min, and (c) 30 min.
Buildings 12 01967 g016
Figure 17. Comparison of a 2D-CWT analysis with different scale factors of (a) a = 1 , (b) a = 5 , (c) a = 15 , and (d) a = 20, showing the influence of lowering the frequency. The input thermal image is at the early cooling stage ( t = 7.5 min).
Buildings 12 01967 g017aBuildings 12 01967 g017b
Table 1. The mix proportions of the concrete mixture.
MaterialAmount in 0.05 m3
Water8.84 L
Ordinary Portland cement18 kg
Coarse aggregate (max. 9.5 mm) (dry)38.4 kg
Fine aggregate (dry)60 kg
Superplasticizer (MasterGlenium SKY 504E) a350 mL
a Used to accelerate the strength development and to extend the workability of the concrete.
Table 2. The compressive strength and density test results for the specimen.
Cube No.L
(mm)
W
(mm)
H
(mm)
Maximum
Load
(kN)
Compressive
Strength (MPa)
Compressive
Strength (kg/cm2)
Weight
(g)
Density
(kg/m3)
1100.399.7102.4444.744.5453.62355.72300.5
2100.199.9101.9432.643.3441.32355.72311.8
399.9101.7101.9429.042.2430.72327.52248.2
Average 43.3441.92346.32286.8
Publisher’s Note: MDPI stays neutral with regard to jurisdictional claims in published maps and institutional affiliations.