Abstract
The prolonged service life of civil engineering structures, such as buildings and highway pavement, means that they deteriorate with time, requiring frequent repair work. Polyurethane (PU) materials can effectively maintain engineering structures such as road pavement, runways, and buildings. Thus, the mechanical properties and dynamic performance of these materials for repair are essential to guarantee the safe usage of the facilities. This study investigated the strain–stress behavior and impact strength of polyurethane-based polymer concrete (PUPC) mixtures. Moreover, the tensile stress–strain behavior of rigid PU grout (PUGC) materials was evaluated. The result indicated that the U-shaped PUPC with 20% PU by weight experienced a maximum failure strain of 0.9% and 4.2% under static and dynamic loads, respectively. The average impact energy of PUPC was 3825% higher than that of normal concrete. According to PUGC’s mixing ratios, the average elastic modulus revealed an increasing trend, whereas ultimate strength, yield strain, yield stress, and failure stress showed a decreasing trend. Weibull distribution results showed that the probabilistic distribution of the impact strength followed the two-parameter Weibull distribution.
1. Introduction
The service life of roads and runways pavement depends on the mechanical and rheological properties of the material adopted and environmental conditions such as repetitive impact load, thermal movement, moisture chemical attack, etc. These factors are responsible for crack growth in the materials, affecting the pavement’s load-carrying capacity [1]. Cement concrete is widely used as a construction material due to its desirable strength, durability, and cost-effectiveness. However, a longer curing time is regarded as one of its shortcomings, reducing its application to the initial construction of infrastructures. Early construction methods have been investigated to shorten the repair time [2,3]. In addition, early-strength cementitious materials have been used to repair rigid pavement [4]. However, a weak interface strength and inadequate penetration depth ability into minor cracks restrains cementitious composite as a repair material for pavement [5]. To overcome the shortcomings of cementitious-based materials and shorten the setting time, different polymer materials (such as polymer grouts and polymer concrete) have been developed to repair civil engineering structures. Polyurethane-based polymer concrete is a cementitious composite consisting of PU binder, aggregates, and occasionally mineral additives. It could be a suitable material for pavement repair due to its desirable properties such as fast setting time, resistance to an aggressive environment, and adequate bonding ability [6].
Due to the excellent performance of polyurethane, it has wide applications in engineering structures such as buildings, automobiles, and industrial facilities, and was recently found to be applicable in underground and marine structures as well [7]. Its excellent mechanical properties, such as energy-absorbing and protection, make it useful in military structures and infrastructures that need to mitigate blast and impact loads [8,9]. Along with these good performances in structures, energy absorption capacity, and dissipation ability, elastomeric composites showed high resistance against aggressive environments [7]. In addition to the application mentioned, PUPC and elastomeric materials have been used in several applications involving strengthening, repair, high strain rate (like a mechanical capacitor), wet-skid resistance of tire treads, and acoustic damping [7,10]. The advanced applications of PU have been noted in several fields, such as medical science, automobiles, coatings, adhesives, sealants, paints, textiles, marine industries, wood composites, and apparel [11]. Similarly, several studies have been conducted and have found that polyurethane coating has advantageous properties when it is used as strengthening and repair material for civil engineering structures, including masonry elements [12,13,14], reinforced concrete [7], composite materials [15,16,17], and bitumen modification [18]. In spite of the promising results of polyurethane, on the other hand, Nugaeva et al. [19] reported some shortcomings of developed polyurethane-modified adhesive composition under the influence of chemically aggressive environments such as alkaline sodium hydroxide (NaOH) of different concentrations, which deteriorate its main operational properties (such as its mechanical, diffusion, and sorption properties as well as a change in the mass of the adhesive polymer) and its appearance. The effect of elevated temperature over the range of 20 °C to 200 °C on the mechanical properties of polyurethane foam, with densities of 40 kg/m3 and 93 kg/m3, respectively, was evaluated by Mazzuca et al. [20]. The results indicated that the material’s compressive and shear strengths were significantly affected by elevated temperature. The polyurethane’s mechanical properties, deformation, and failure pattern under different loading types and conditions should be examined before being properly designed. Yi et al. [21] conducted a compression test on thermoplastic elastomer polyurethane and elastomeric thermoset polyurea under quasistatic conditions with high strain rates (10−3 to 104 s−1). The result showed a transition between glossy and rubbery behavior at high strain rates. A similar behavior of transition was also found by Sarva et al. [22] using a tension test. Farshad et al. [23] developed a test method to determine the shear modulus and Poisson’s ratio of polymer and foams such as polyethylene (PE-HD), unplasticized polyvinylchloride (PVC-U), polymethylmethacrylate (PMMA), and rigid polyurethane (PUR) foam using anticlastic plate bending. Zhai et al. [24] reported nonlinear and strain rate sensitivity in auxetic polyurethane under quasistatic, intermediate, and high strain rates. Miao et al. [25] performed a uniaxial tension experiment on thermoplastic polyurethane under different strain rate loadings, ranging from 10−4 to 1 s−1, to investigate its mechanical properties and other potential behavior. Stress–strain curves under these loading conditions show similar mechanical behavior; a distinct rate dependence and rate dependence also exist. Moreover, the mechanical resistance of elastomers subjected to quasistatic loads could be studied using several standard practices. However, typical test methods to examine dynamic performance are limited due to the difficulty of uniform strain at a greater strain rate. Several devices, including a universal testing machine, have been utilized to assess the dynamic properties of polyurethane composite [26], such as a drop hammer testing system [27], dynamic mechanical, thermal analysis [28], servohydraulic testing systems [29], and a Hopkinson bar testing system [21,30]. Recently, numerous researchers have also evaluated the mechanical and dynamic response of PUPC, as it appeared more beneficial in the rapid repair of runways and road pavements. For instance, Fazle et al. [31] developed a high-density polyurethane grout as a repair material to minimize differential heave in road pavement sections built on expensive soil. Shao et al. [32] studied the influence of crumb rubber in epoxy concrete. The deformation parameter was introduced to measure the strains for specimen evaluation. They reported that crumb rubber improves epoxy concrete’s deformability performance and interfacial strength. Mostafa et al. [16] studied the performance of closed-cell semirigid PU foam/glass fiber composite sandwich panels with a density of 62 kg/m3 subjected to flexural loading. The author reported a change in behavior from an initial linear elastic to a nonlinear elastic state. Can et al. [33] studied the fatigue performance of PU grouting materials with different densities ranging from 1.5 g/cm3 to 5.5 g/cm3 poured underneath concrete slabs for base improvement under cyclic compression load. The essential factors (such as grout thickness, density, and void shape, and their effects on the stress–strain relationship) were investigated. Three strain responses of composite material were obtained under cyclic loading. On the other hand, different impact strength tests have been used to evaluate the impact strength of cementitious materials [34,35,36]. The tests are broadly categorized into different types based on the impacting mechanism and parameters examined during impact [37]. The tests include the following: the drop-weight test, the weighted pendulum Charpy-type impact test, the constant strain-rate test, the projectile impact test, the split-Hopkinson bar test, the explosive test, and the instrumented pendulum impact test. However, none of the aforementioned tests have been designated as the standard test. In addition, ACI 544.2R-89 [37] is the most widely used impact test technique for evaluating concrete impact resistance because it is simple to carry out [38]. However, a high coefficient of variation of the test result has been obtained, as in the previous studies [36,39]. The factors responsible for these variations are as follows: (i) During the test, cracks can occur anywhere and in any direction on the cylinder specimen adopted in this impact testing procedure; and (ii) Any failure modes are considered in the test, contributing to the dispersed result. For this reason, the current study adopted a U-shaped specimen, as found in the literature [40,41,42,43] to minimize the drop-weight impact test result variations by restraining the crack formation, which is expected to occur in a predetermined position. Many studies have been conducted to study the potential uses of polyurethane for strengthening and retrofitting to improve structures’ impact resistance [28,31,33]. Therefore, the main aim of this study is to evaluate the engineering properties and impact resistance of PUPC. The application of PUPC as a pavement and runway repair material was explored through static and dynamic loads. In order to reduce the variation of drop-weight impact test results proposed in the ACI-544 committee testing procedure, a U-shaped specimen was adopted in this study to control the crack formation. The design impact strength of PUPC was determined using reliability analysis. Moreover, the tension properties of the rigid PU grouting material used for retrofitting the pavement base layer of new construction work were evaluated. This investigation can help to understand the basic performance of PU-based polymer concrete (most importantly, the impact resistance properties), as the materials are often subjected to repeated impact loads.
2. Materials and Methods
2.1. PU Binder
Polyurethane is formed from a polymerization reaction between isocyanate and polyols [42,44]. The bio-based PU has hydroxyl (-OH) and diisocyanate groups in polyaryl polymethylene isocyanate (PAPI), which is a component of the PU (-NCO), characterized with viscosities of 35,000 and 250 CPS, respectively. To enhance the properties of the PU binder, an alkylene carbonate that functioned as a solvent was added to the PU binder. The chemical formula below presents the polymerization reaction between isocyanate and polyol.

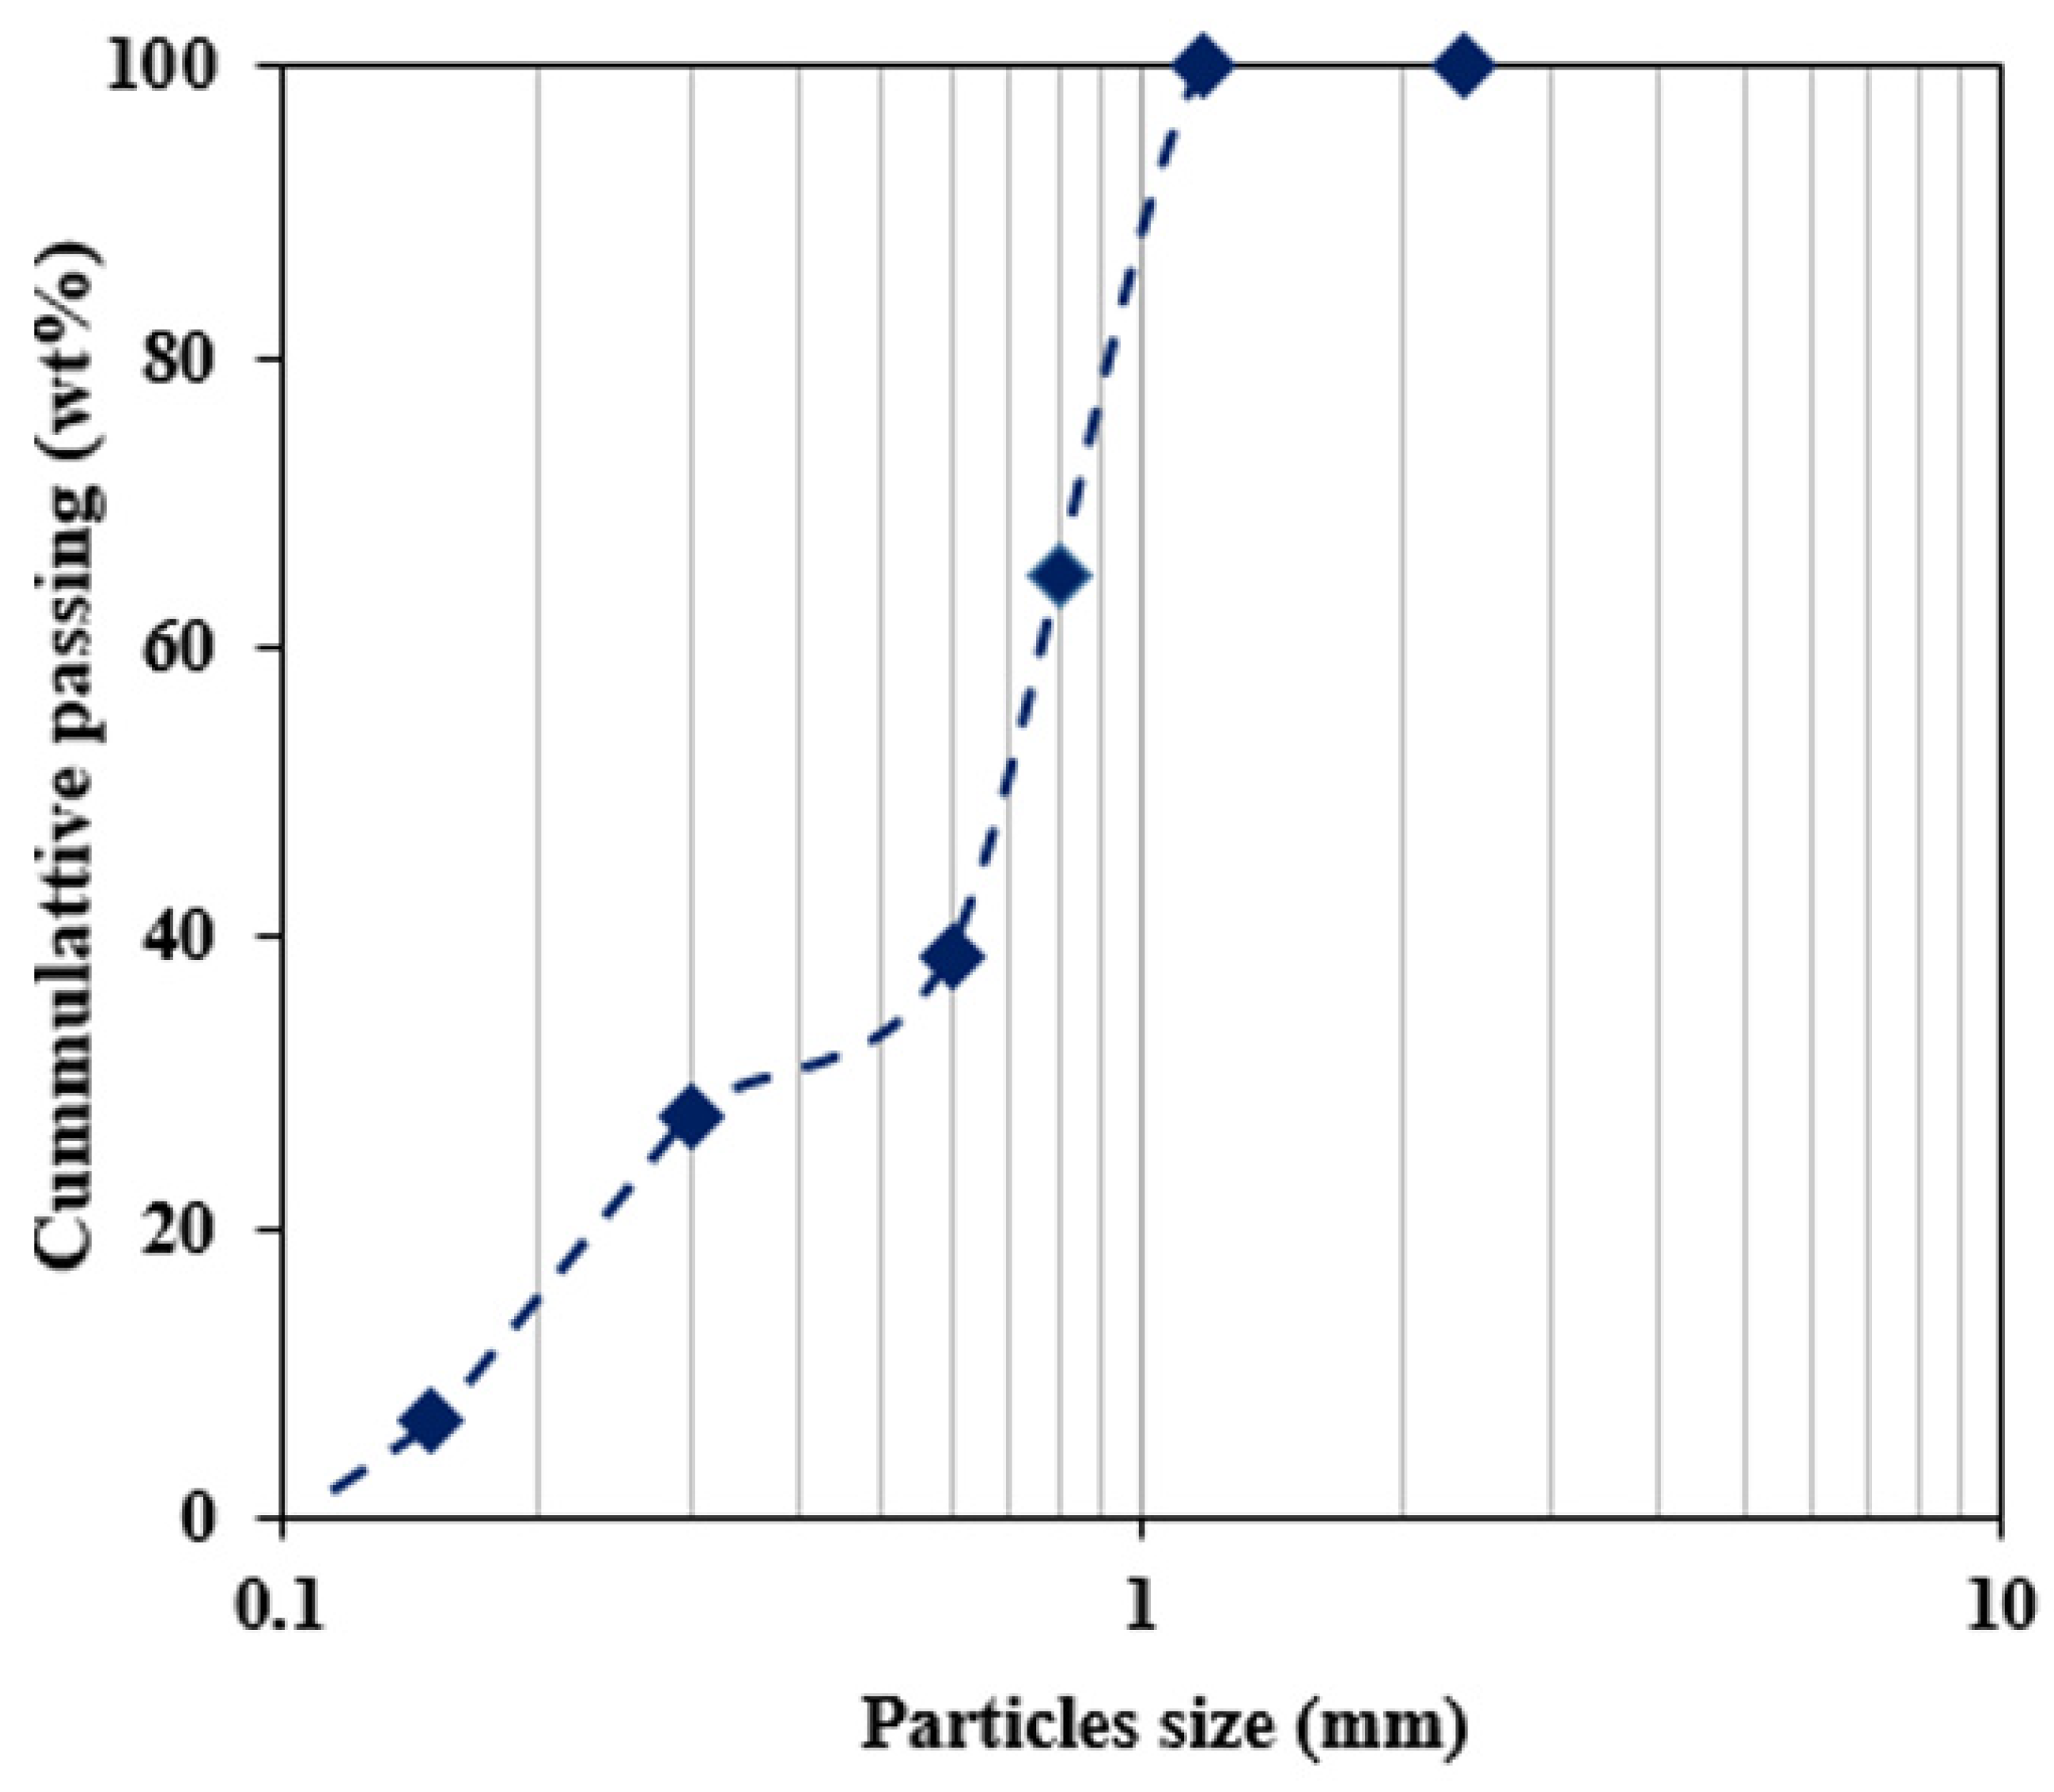
The river sand particles were used as fine aggregates in this study, with a fineness modulus of 2.03 and an apparent density of 2670 kg/m3. The aggregate’s particle size ranged from 0.3 mm to 2.26 mm. The PU binder and aggregates were blended manually in accordance with ASTM C192 [45]. The particle size distribution curve of the aggregate used in this study is shown in Figure 1.
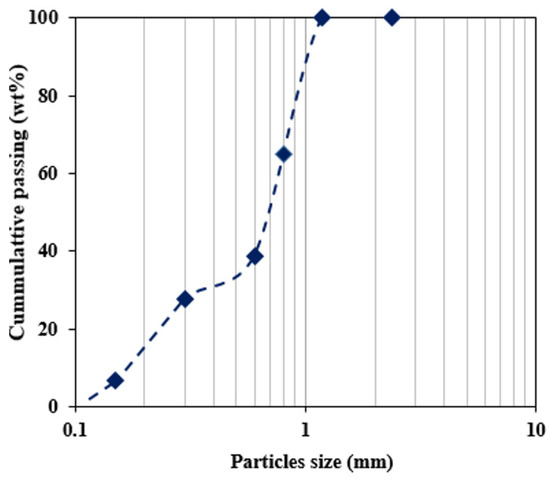
Figure 1.
Gradation curve of aggregates.
2.2. Preparation of Polyurethane Composites
2.2.1. PUPC
The two polyurethane components, diisocyanate, and PAPI, were combined in a weight ratio of 6:1 with alkylene carbonate acting as a solvent and carefully mixed with a stirrer to obtain a PU binder for the production of PUPC and PUGC composites. Moreover, the CG-431 (defoamer) was integrated with the PU binder to improve its performance.
The PUPC specimens were cast for flexural and drop-weight impact tests, using three mixing conditions between aggregate-to-PU binder ratios of 80:20, 85:15, and 90:10 by weight. These aggregate-to-binder ratios were selected following the previous research of Jung et al. [46], Roh et al. [47], and Haruna et al. [42]. The prepared PUPC mixture was poured into the prismatic beam and the U-shaped mold for flexural and drop-weight impact tests. Each U-shaped sample was cast in three layers and tamped adequately to obtain sufficient compaction level following ASTM C138/138M-01a [48]. Then, the PUPC specimens were demolded after 6 h and cured at room temperature for three days. Table 1 shows the formulation of PUPC employed for this study.

Table 1.
Formulation of the PU composites.
2.2.2. PUGC
To study the tensile behavior of the PUGC material, a rigid PU grouting material modified with fine sand with a particle size of 0.3 to 0.6 mm was cast using dog bone specimens. For the uniaxial tension test, three types of rigid PU grout specimens were prepared by mixing the PU matrix with fine sand using a mixing ratio of 1:0.5, 1:0.75, and 1:1 by weight.
2.3. Testing Procedure
2.3.1. Flexural and Compression Test of PUPC
The mechanical properties of PUPC were evaluated following DL/T5126-2001 [49]. A universal testing machine (UTM) with a 30-ton capacity was used for the flexural and compressive strength tests. For the flexural and compression tests, the machine was regulated at speeds of 50 N/s and 2.4 kN/s, respectively. Three prismatic samples with dimensions of 40 mm × 40 mm × 160 mm were utilized for the flexural test. After the flexural strength test, the samples were divided into two pieces and used for the compressive strength test.
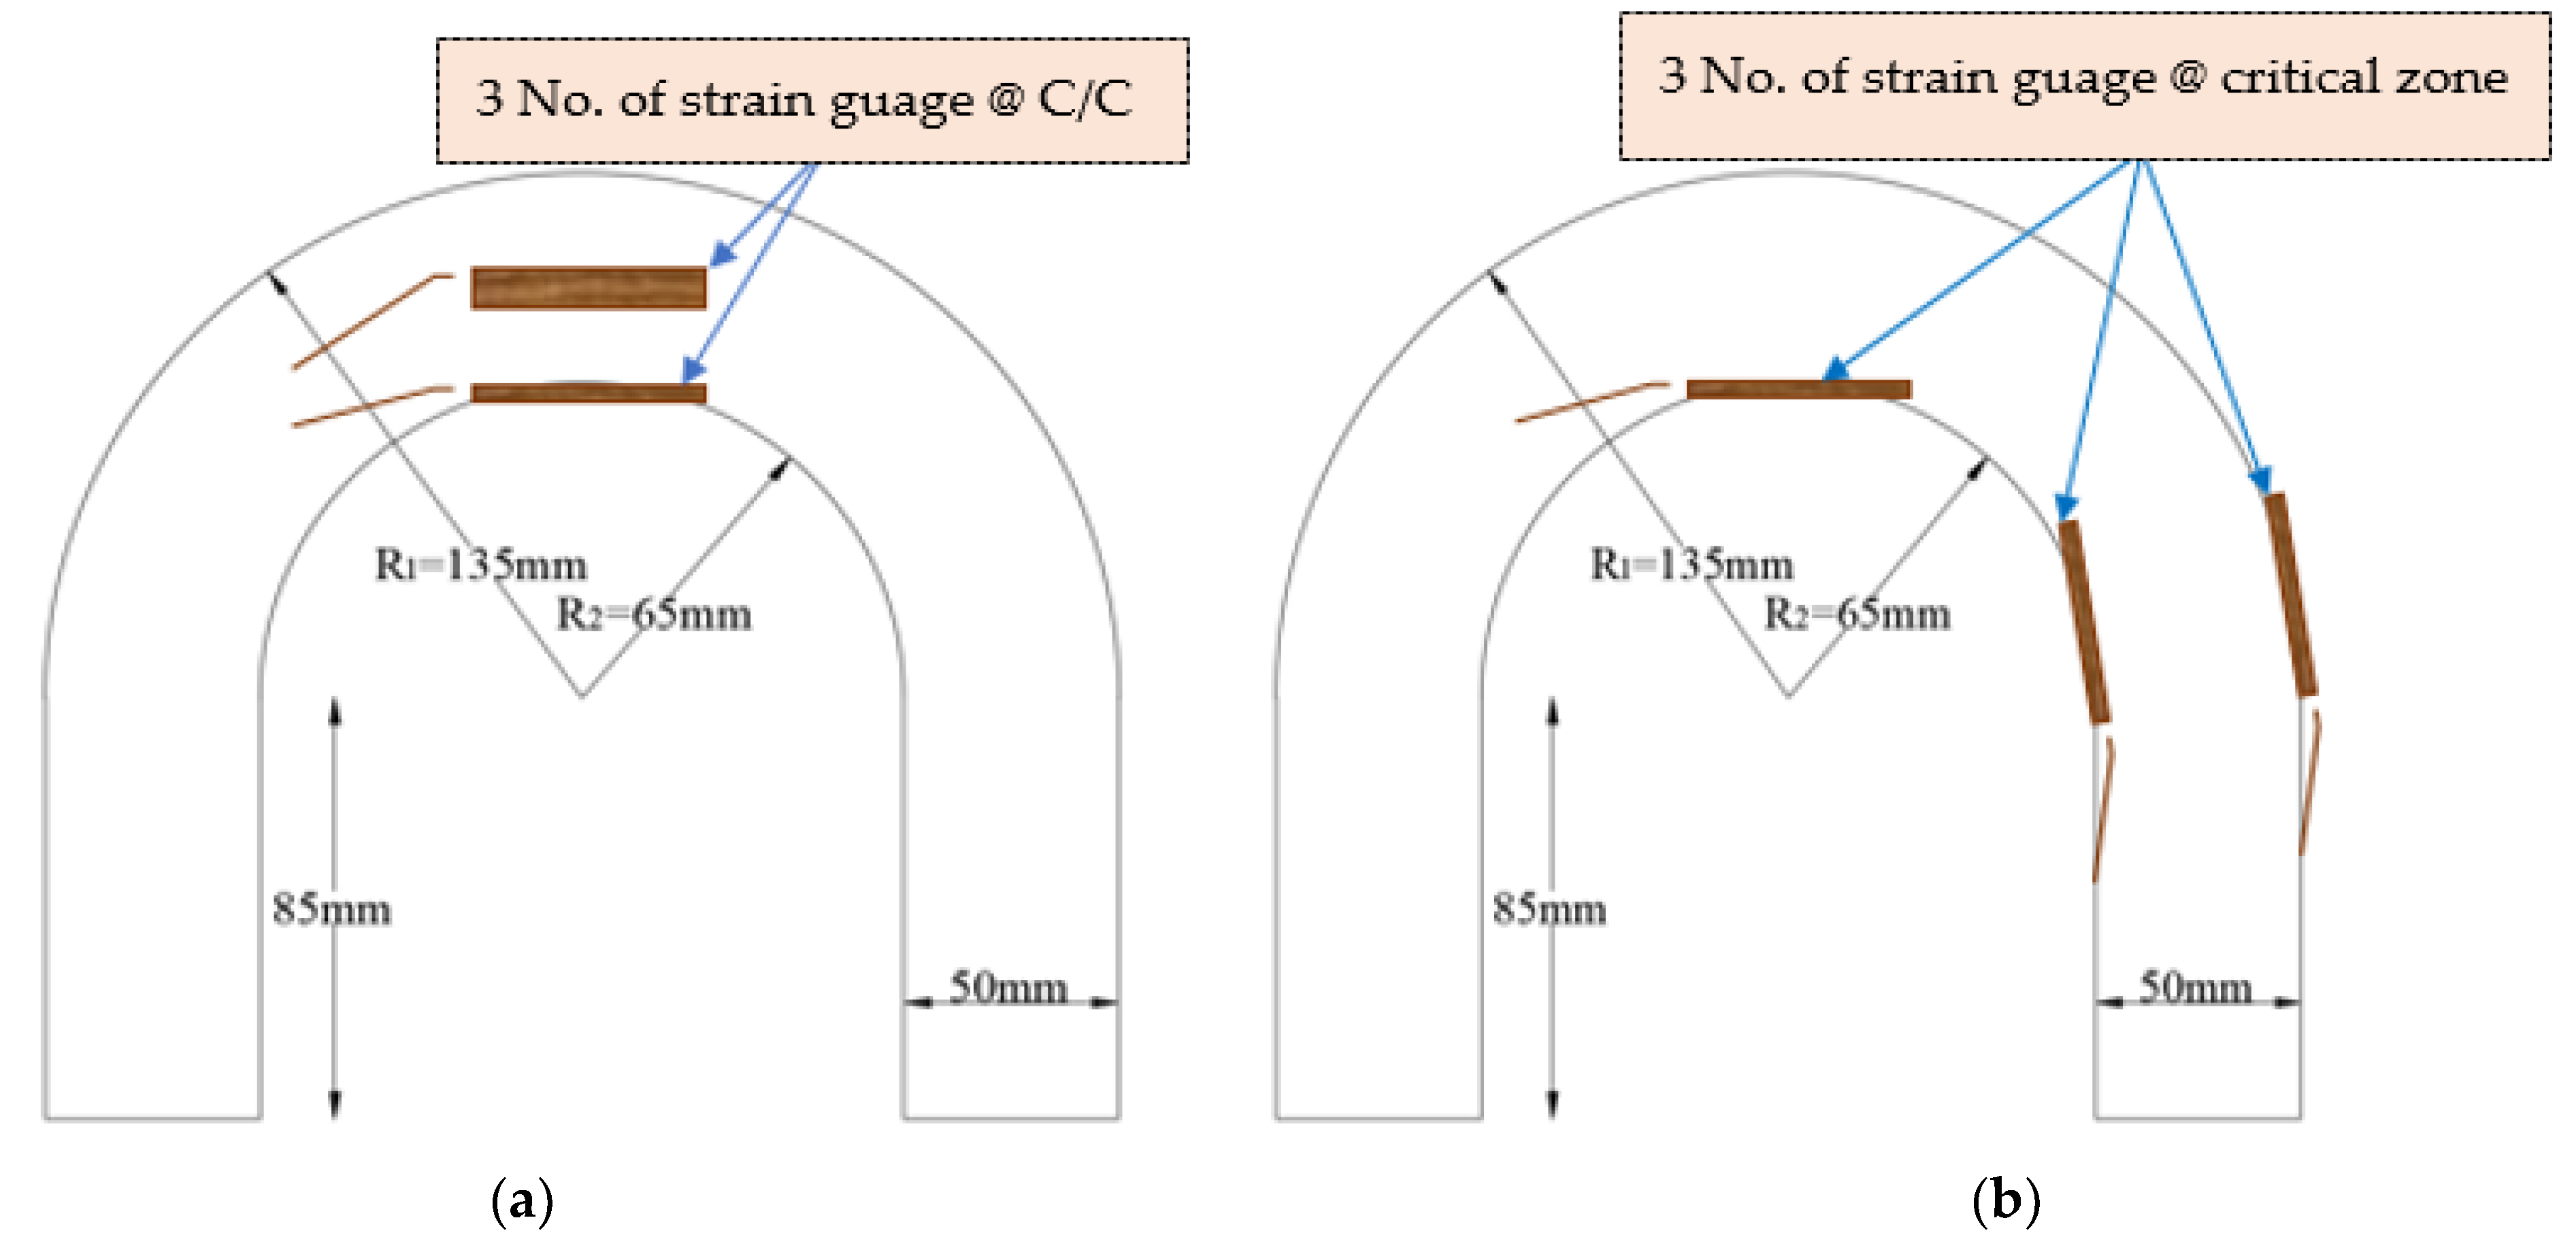
In addition, the strain–stress behavior of PUPC was evaluated using U-shaped specimens, as depicted in Figure 2a. Therefore, a 45 kg steel base support was attached to a universal testing machine to support the specimen. A displacement meter and three strain gauges were fixed on the U-shaped PUPC to monitor the axial deformation and strain–stress behavior under static loading conditions. Firstly, a strain gauge was positioned and cemented at the midspan of a circular arc and the other two strain gauges were attached at opposite arc sections of the U-shaped PUPC, which turned into the essential sections of the U-shaped specimen. A static data acquisition instrument collected the data sets in terms of displacement, strain, and load simultaneously.
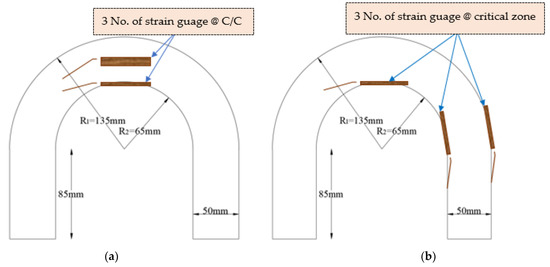
Figure 2.
Dimension and instrumentation of the U-shaped specimen: (a) dynamic test and (b) static test.
2.3.2. Installation of the Strain Gauge for U-Shaped Specimen
The 20 mm length strain gauges, specified with 119.2 ± 0.2 Ω resistance with a gauge factor of 1.18.0 ± 1%, were pasted on the U-shaped specimen for both static and impact tests, as depicted in Figure 2. Three strain gauges were used to monitor the induced strain due to the applied loads for each testing condition. Moreover, it also detected first cracking strength under repeated drop-weight impact tests. One strain gauge each was pasted at the midcircular arc at the bottom of the specimen of the U-shaped specimen under both static and impact tests, shown in Figure 2a,b. In addition, strain gauges were pasted at the front and back sides of the U-shaped specimen, located at the midpoint of the circular portion of the test specimen’s closed impact point. On the other hand, for the static test specimens, the strain gauges were pasted at the two opposite bend sections (interior and exterior) of the U-shaped specimen, as it appeared to be a critical section of the specimen apart from the midcircular section. The static and impact loads on the test specimen are concentrated more in the above-mentioned regions, which can pass through the symmetrical axis. The strain gauges and displacement meters were connected to the data acquisition system to obtain the responses. The falling weight was continuously dropped at 5 s time intervals.
2.3.3. Drop-Weight Impact Test of PUPC
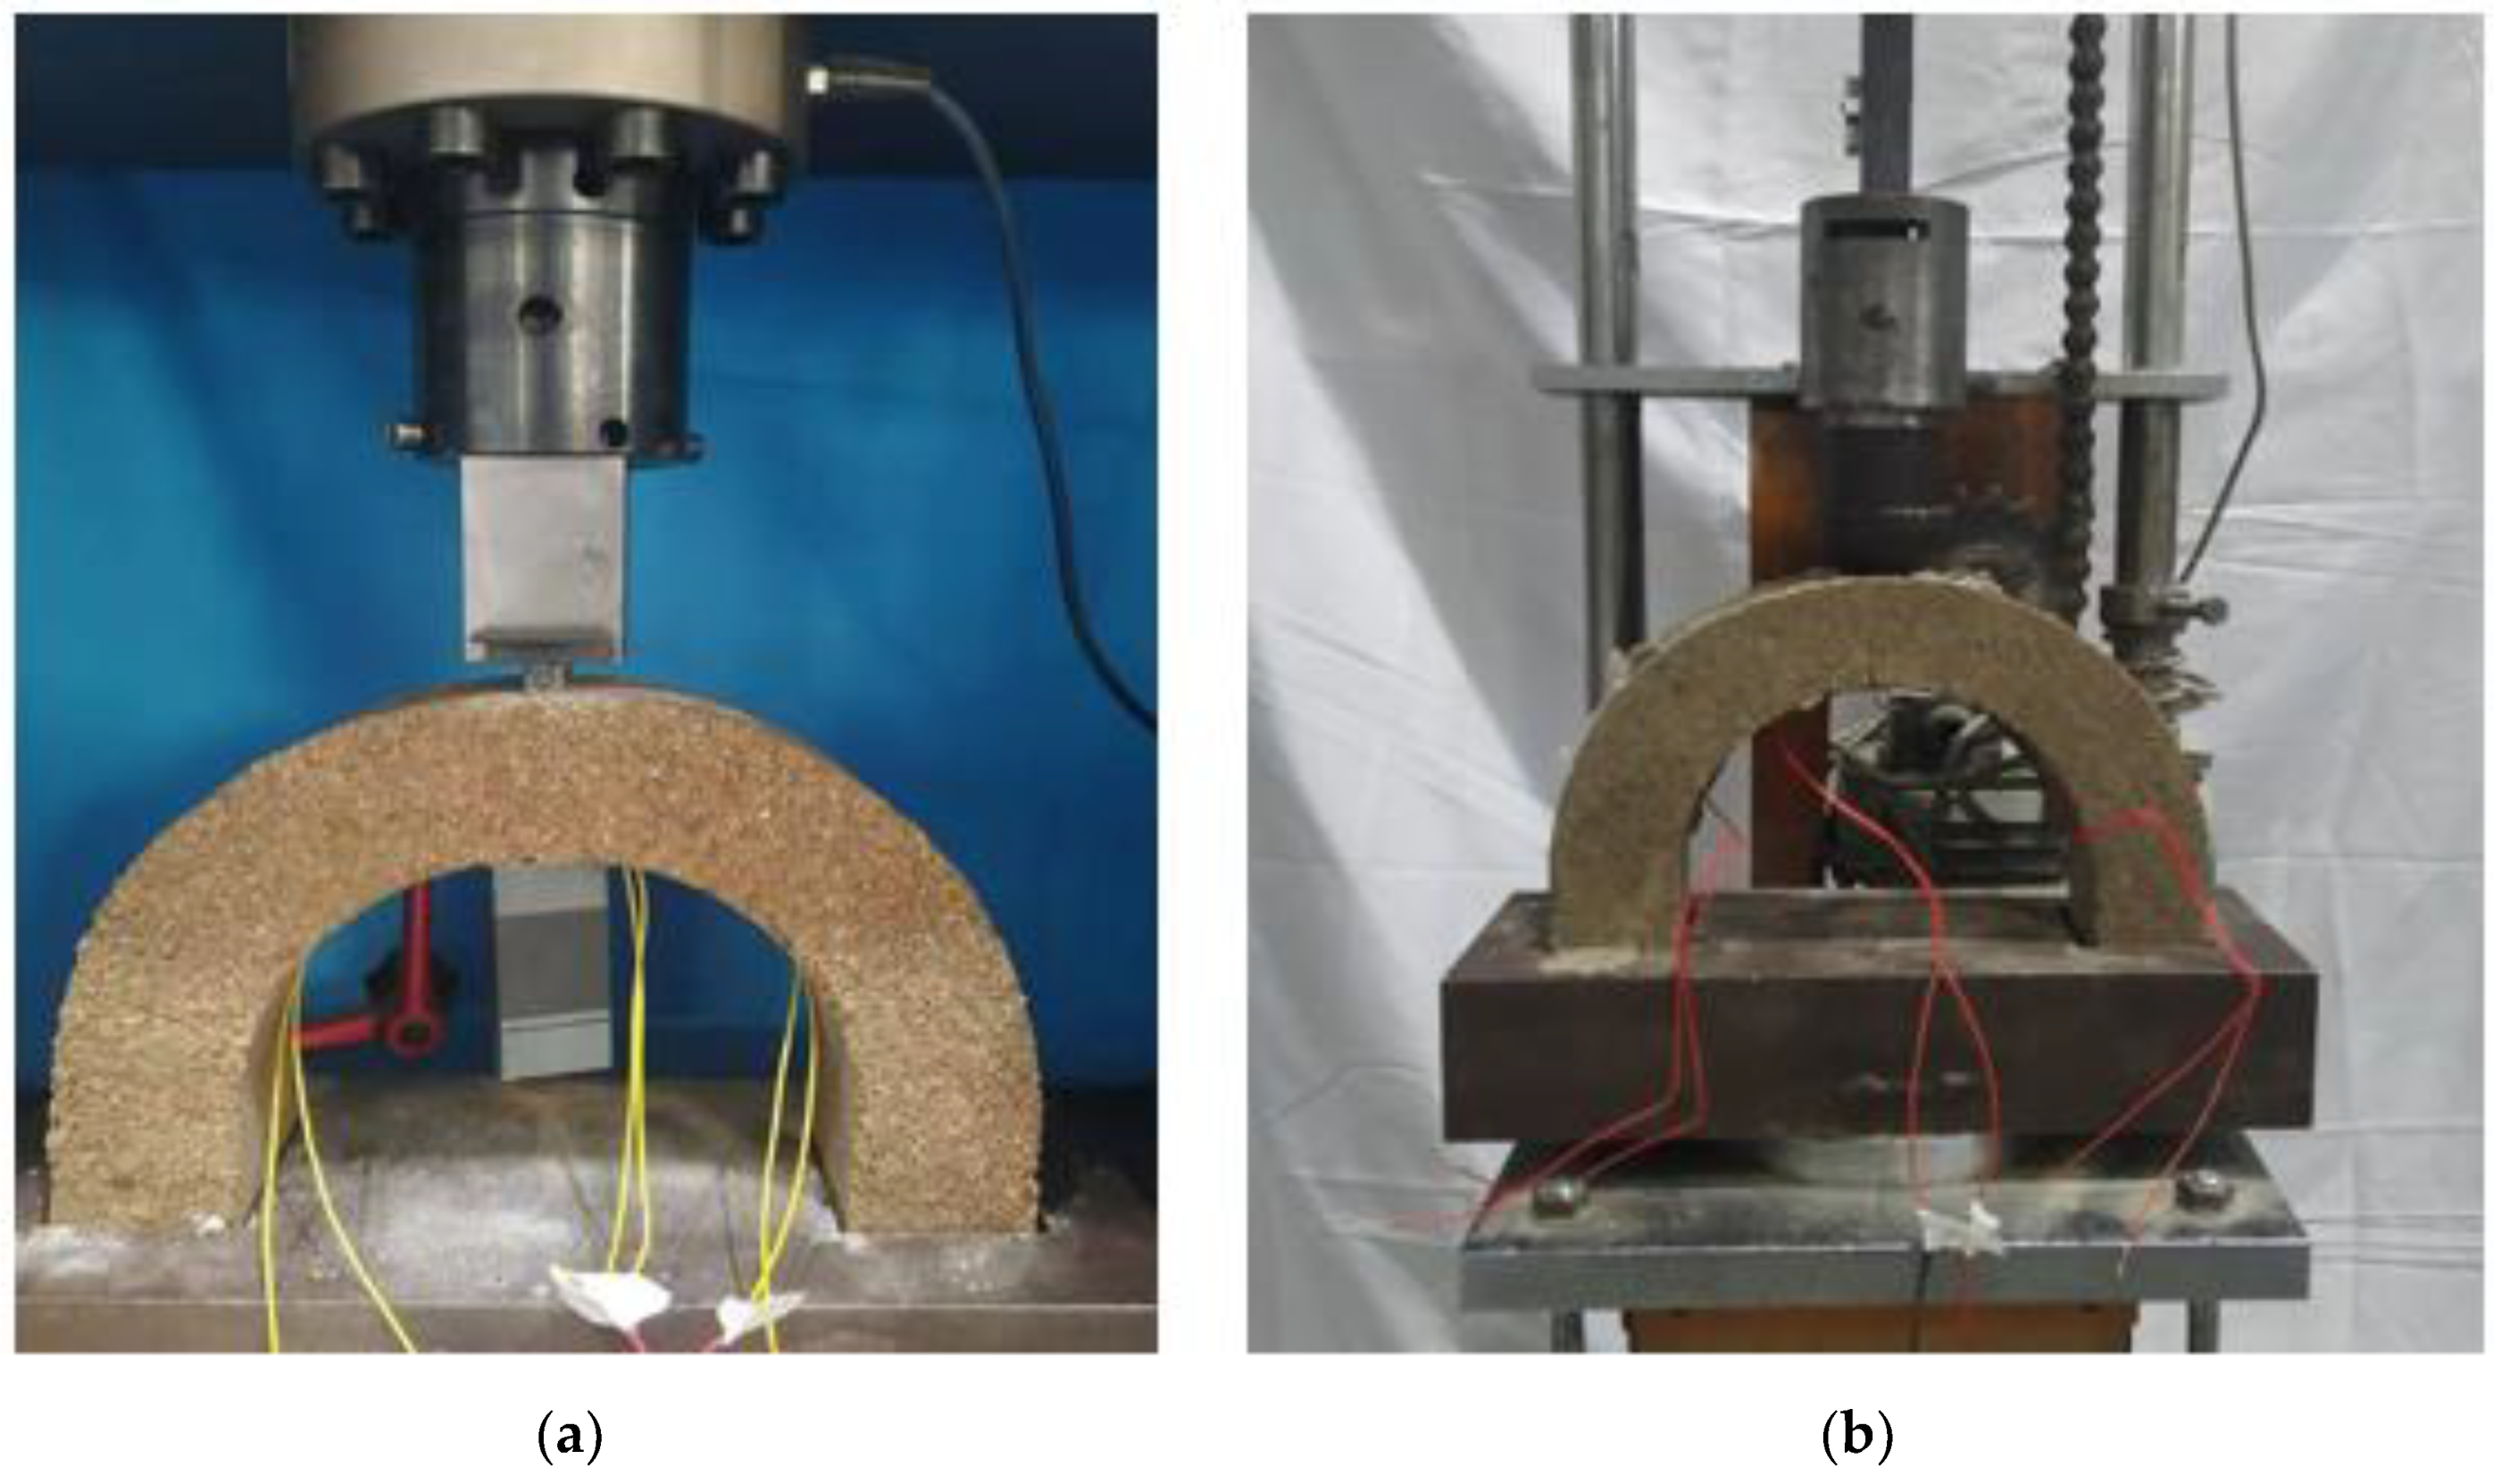
The repeated impact test was conducted according to the modified guiding principle stated in ACI 544-2R [37]. The impact resistance of PUPC was determined through a repeated drop weight hammer test executed on newly formed impact test equipment, as shown in Figure 3b, obtained from the modification made on a Marshall Compaction Machine. Some components, including the steel base (consisting of two grooves (70 mm × 60 mm × 50 mm), a falling weight, and a steel rail), were installed into the main component of the machine. The falling weight (W1) = 2.10 kg and (W2) = 0.875 kg were employed to simulate the impact loads of dropping from a height of 450 mm onto a steel pounding head fixed at the end of slide rail, resting on the midsection of the U-shaped specimen. This specimen can serve as a medium of load transfer between the falling weight specimen and the test specimen. Before testing, all of the specimens were fixed in position with no movement allowed. Thus, first crack strength (N) was recorded when the initial crack occurred, which signalled strain gauge failure. The number of impacting blows at the failure stage was recorded as the ultimate strength (NU). During drop-weight impact testing, the U-shaped specimen’s impact energy was determined from the potential energy of the falling weight [43,50]. The energy absorption capacities of the test specimens for the number of blows (N) and falling hammer (m) released from the fixed height (h) corresponding to the specified cracking strengths were evaluated using Equation (1)
where g is the acceleration due to gravity = 9.81 m/s2, and v is the velocity of the falling weight.
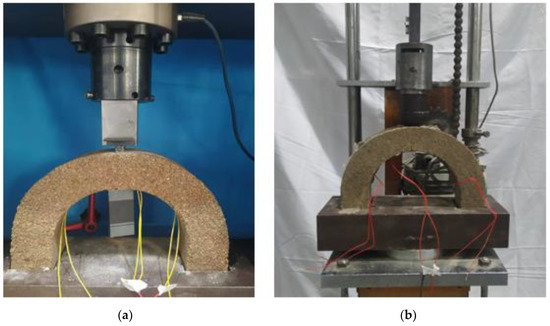
Figure 3.
Test setup for U-shaped specimen under (a) static and (b) drop-weight impact test.
The testing system was configured to comply with the following conditions to achieve a more reliable impact resistance test result: (i) the supporting base rigidity was higher than that of the U-shaped specimen; and (ii) the specimen was designed to be in a semi rigid state in order to absorb most of the impact energy.
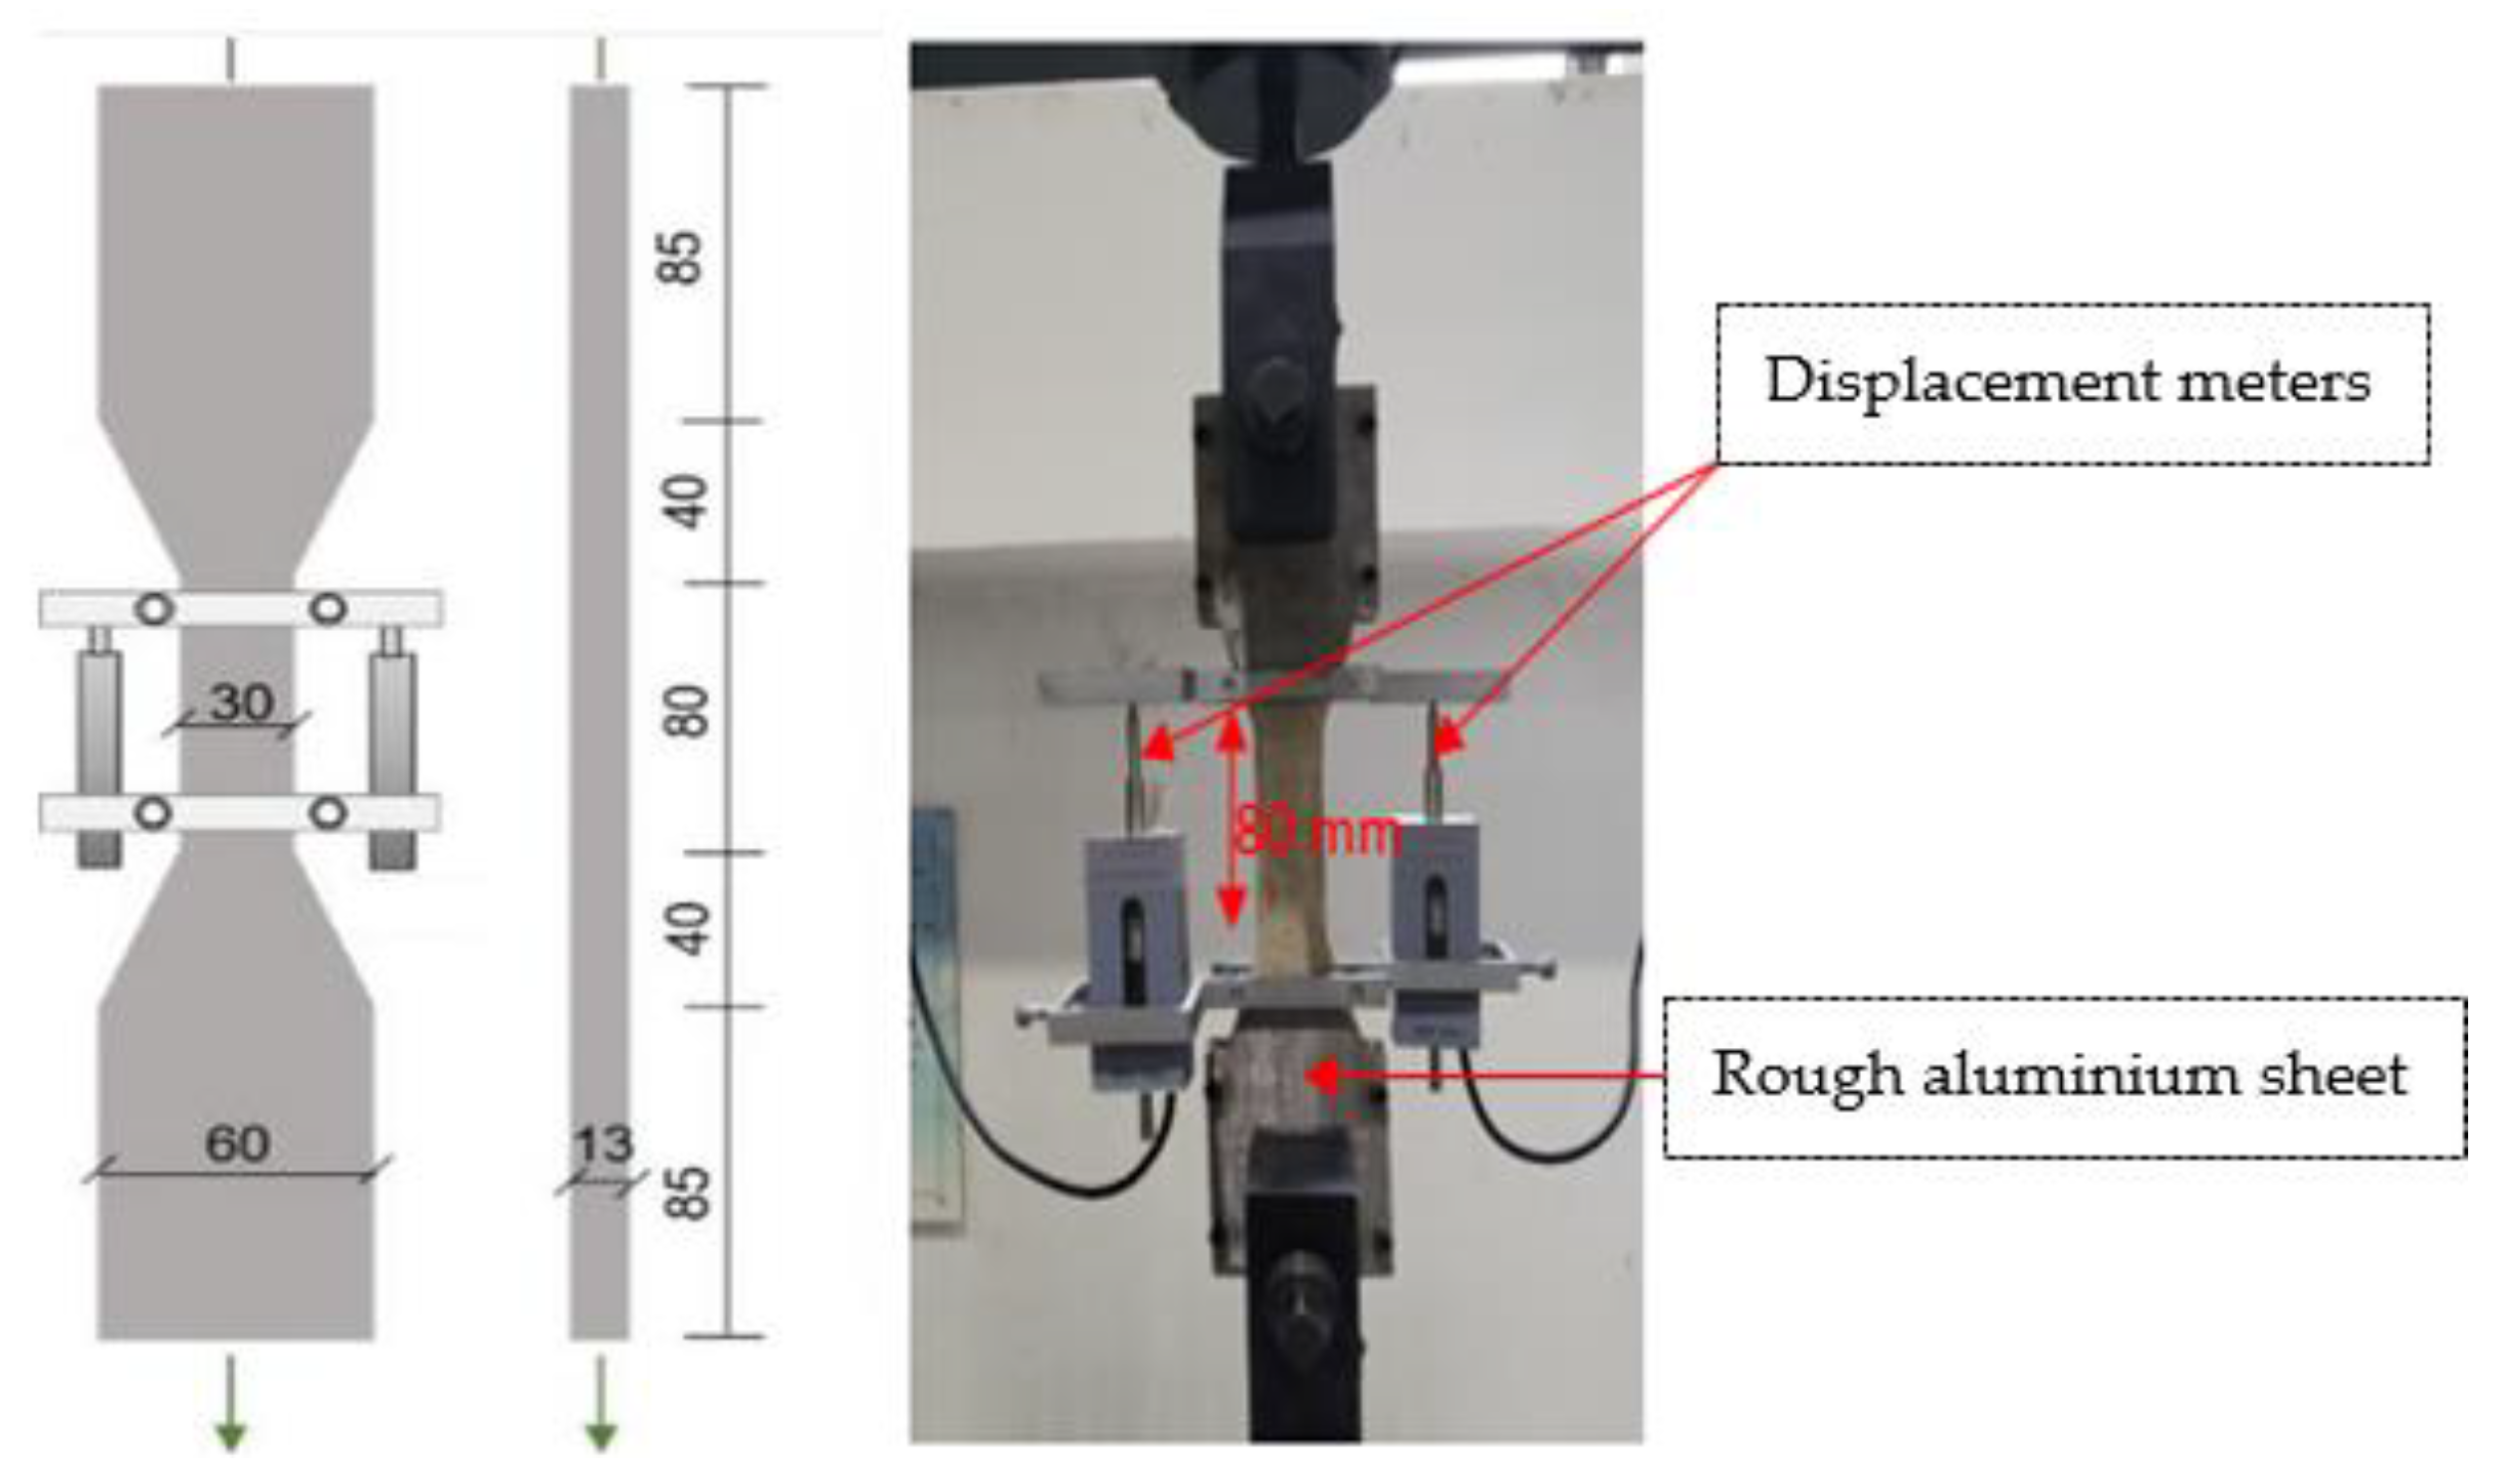
2.3.4. Tension Test of PUGC
The experimental test setup for the tension is depicted in Figure 4. The universal testing machine (WDW 200E) with a 20-ton weight capacity was used for the tension test, which was performed following Chinese specifications DL/T 5139 2004 [51]. During testing, the necessary precautions and steps were observed to achieve results with high accuracy. Aluminum sheets with rough surfaces were placed between the clamp and specimens, since the elastomeric materials are susceptible to clamping pressure. This reduced the stress concentration at the specimens’ ends and prevented the specimens from slipping out of the clamp. The tensile force applied to each specimen was measured by a consistent strain rate of 0.0003 s−1. The experimental data, including load, deformation, and time, were collected using a testing acquisition system at room temperature. The two displacement meters, mounted on each side of the frame and firmly secured on the specimen, were used to record the average deformation along the 80 mm mid gauge length. Consequently, the engineering strain was calculated. In addition, the tensile stress was calculated using the applied load and the specimen gauge length.
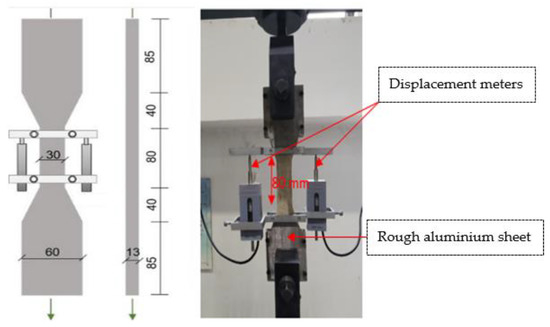
Figure 4.
Experimental setup for the tension test (Unit: mm).
3. Result and Discussion
3.1. Static Response of U-Shaped PUPC Specimens
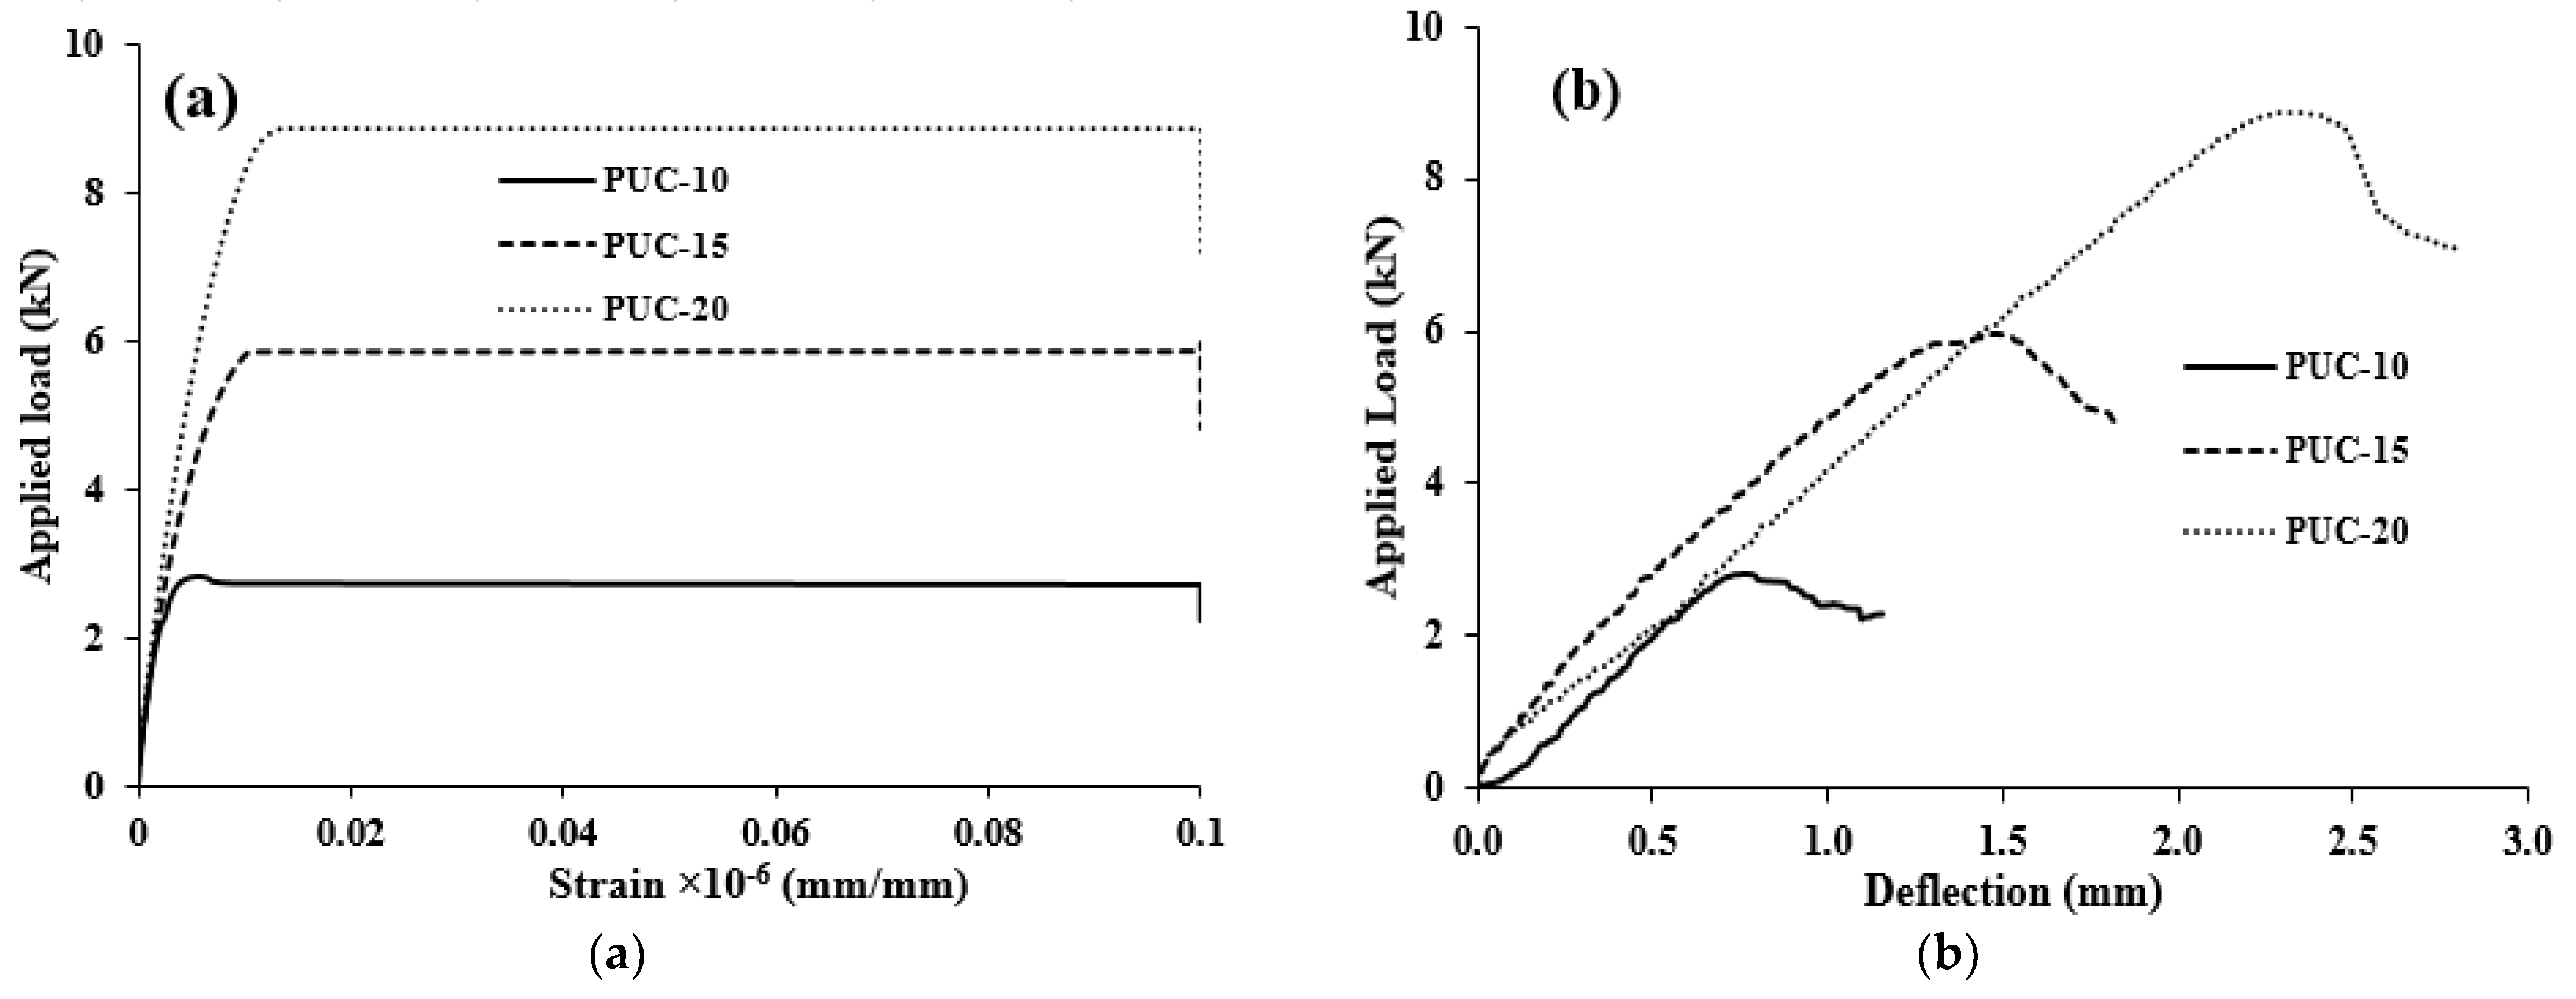
The plot of applied load vs. strain pronounced at the midpoint of the circular arc of the U-shaped PUPC specimen according to three mixing ratios is shown in Figure 5a. This plot represents those of other PUPC specimens. As expected, all PUPC specimens exhibited the behavior of viscoelastic materials in their engineering stress vs. strain response. The stress–strain plots show a linear elastic response at the initial loading stage, similar to the finding in the literature [25,52,53]. Two linear deformation regions were observed. In (i) the initial linear response region, it displayed a steeper slope associated with the initial compaction of PU substrate due to applied load. The gradual change in gradient is the same for all PUPC specimens, with strain values ranging from 0 to 0.2%. Beyond this response, the curves entered the second linear deformation region (ii), which displayed substantial applied load and strain, possessing a gentle slope more pronounced in the PUPC-20 specimen than in other specimens. Therefore, the specimens were compressed more before the yield point under loading conditions, resulting in significant strain. The strain value range 0.2–0.9% was observed for the PUPC-20 specimen, while strain value ranges of 0.2–0.6%, and 0.11–0.16% for were observed for the PUPC-15 and PUPC-10 specimens, respectively. Moreover, upon the continuous loading, the specimens entered a strain mutation phase. The load caused considerable strain improvement until the strain gauge pasted on the specimen broke, leaving residual strain, which caused all the specimens to fail in fracture. The mechanical properties of PUPC indicated that the average compressive strengths of the PUPC-20, PUPC-15, and PUPC-10 specimens were 31.07 ± 1.2 MPa, 22.09 ± 0.68 MPa, and 15.65 ± 1.13 MPa, respectively. The flexural strength of the PUC-20 specimen was 10.47 ± 0.50 MPa, which is 57.68% and 116.77% higher than that of the PUC-15 and PUC-10 specimens, respectively.
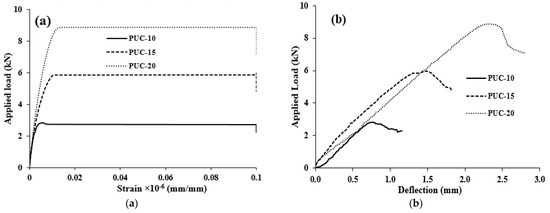
Figure 5.
(a) The load–strain curves and (b) load–deflection curves of PUPC.
The applied load-deflection relationship for U-shaped PUPC specimens under static loading conditions is shown in Figure 5b. The quantity of the PU binder played a vital role in the PUPC in providing required performance such as energy absorption and resistance to impact loads. The percentage composition of PU binder in the mixtures must be limited because it exhibits significant expansion, leading to the creation of high voids and a reduction of strength, as reported in [46]. As shown in Figure 5b, the PUPC-20 specimen demonstrates a high flexural load of 8.88 kN with a corresponding midsection deflection of 2.82 mm before the flexural failure of the specimen. The maximum loads of 5.97 kN and 2.83 kN were observed for the PUPC-15 and PUPC-10 specimens, respectively, with corresponding midarc section deflection of 1.82 mm and 1.16 mm, respectively. A systematic increase in maximum applied load among the test specimens was noted. The addition of 5% PU increased the maximum applied load by 105%, as revealed in the PUPC-15 specimen. Similarly, a 204% increment was obtained when the PU content was increased by 10%, as shown in the PUPC-20 specimen. Therefore, constant increases in PU content led to a continuous increase in maximum applied load, leading to specimen failure. Based on the result obtained under this testing condition and the specimen’s geometry, it can be deduced that an almost linear relationship exists between the PU content and maximum applied load.
3.2. Strain Development at Critical Sections of U-Shaped PUPC Specimens
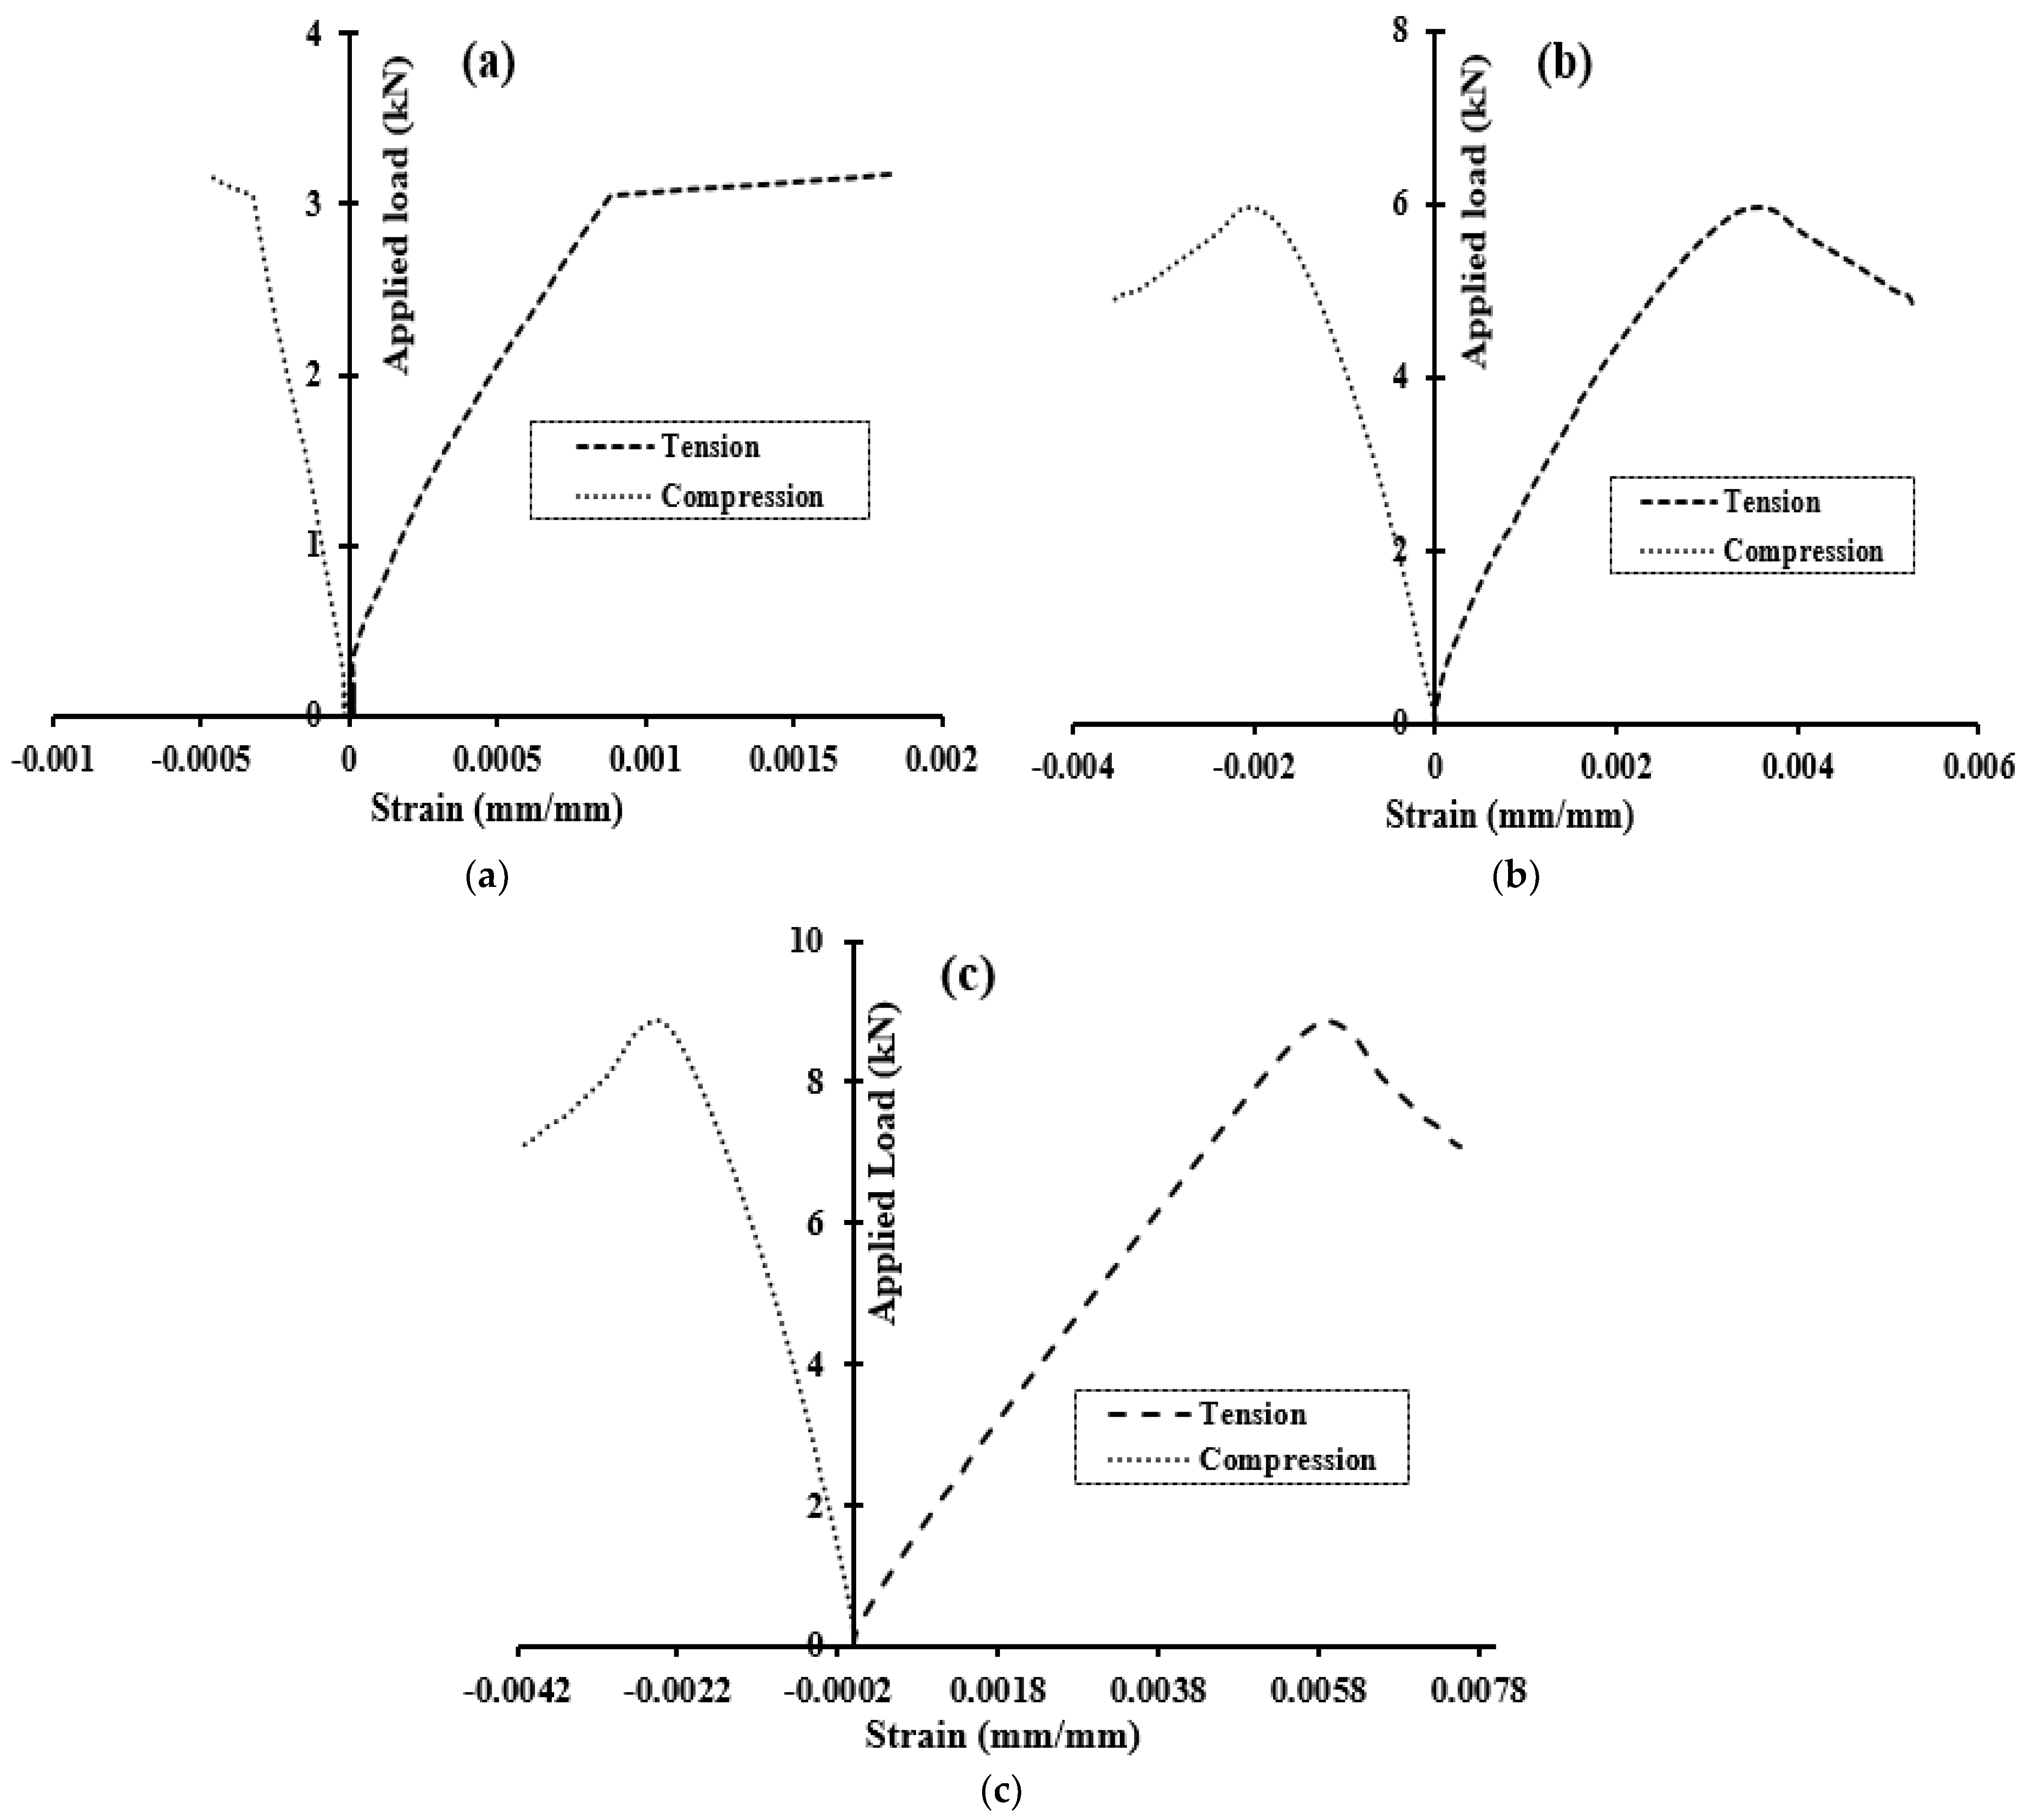
In addition to the plot of applied load vs. strain given in Figure 6, the two opposite bend sections of the specimen also appeared to be critical regions on the U-shaped specimen, where the stress is intensified during loading due to the nature of the U-shaped specimen. Hence, these specimens’ sections are further evaluated, as shown in Figure 6a–c. As can be seen, two linear deformation stages were also noticed in these sections of the U-shaped specimen. In the initial linear relationship (i), high steeper slopes with insignificant strain response at both the tension and compression zone were obtained for three representative specimens. The induced strain at this stage was in the range of 0–0.0002% for all the specimens. Beyond this response, the curves entered the second linear deformation region (ii), which displayed a high strain response with a gradual slope that grew more pronounced at all specimens’ tension zones. The magnitude of induced strain and load-carrying capacity solely depends on the amount of PU binder used to prepare the PUPC mixture. For instance, the PUPC-10 specimens recorded a peak strain of 0.00119% and 0.00039% at the tension and compression zone; the specimen showed very low ductility due to the limited PU content. Meanwhile, the PUPC-15 and PUPC-20 specimens, which have a high PU matrix content stand at 15 and 20% of the total mixes, respectively, experienced a high induced strain of 0.0036% and 0.0059% at the tension zone, with corresponding strain values of 0.002% and 0.0025% at the compression zone, respectively, showing high ductility compared to the PUPC-10 specimen. A study by Jiang et al. [54] to investigate the durability of PUPC at low temperatures reported a strong low-temperature toughness and confirmed that PUC had excellent durability in alkaline solutions. Thus, the author suggested that PUC is a promising material for bridge deck pavement.
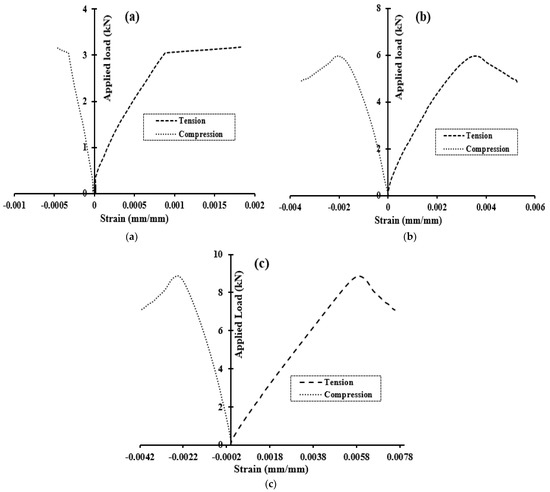
Figure 6.
Tension and compression behavior for (a) PUPC–10, (b) PUPC–15, and (c) PUPC–20.
3.3. Dynamic Response of U-Shaped PUPC Specimens
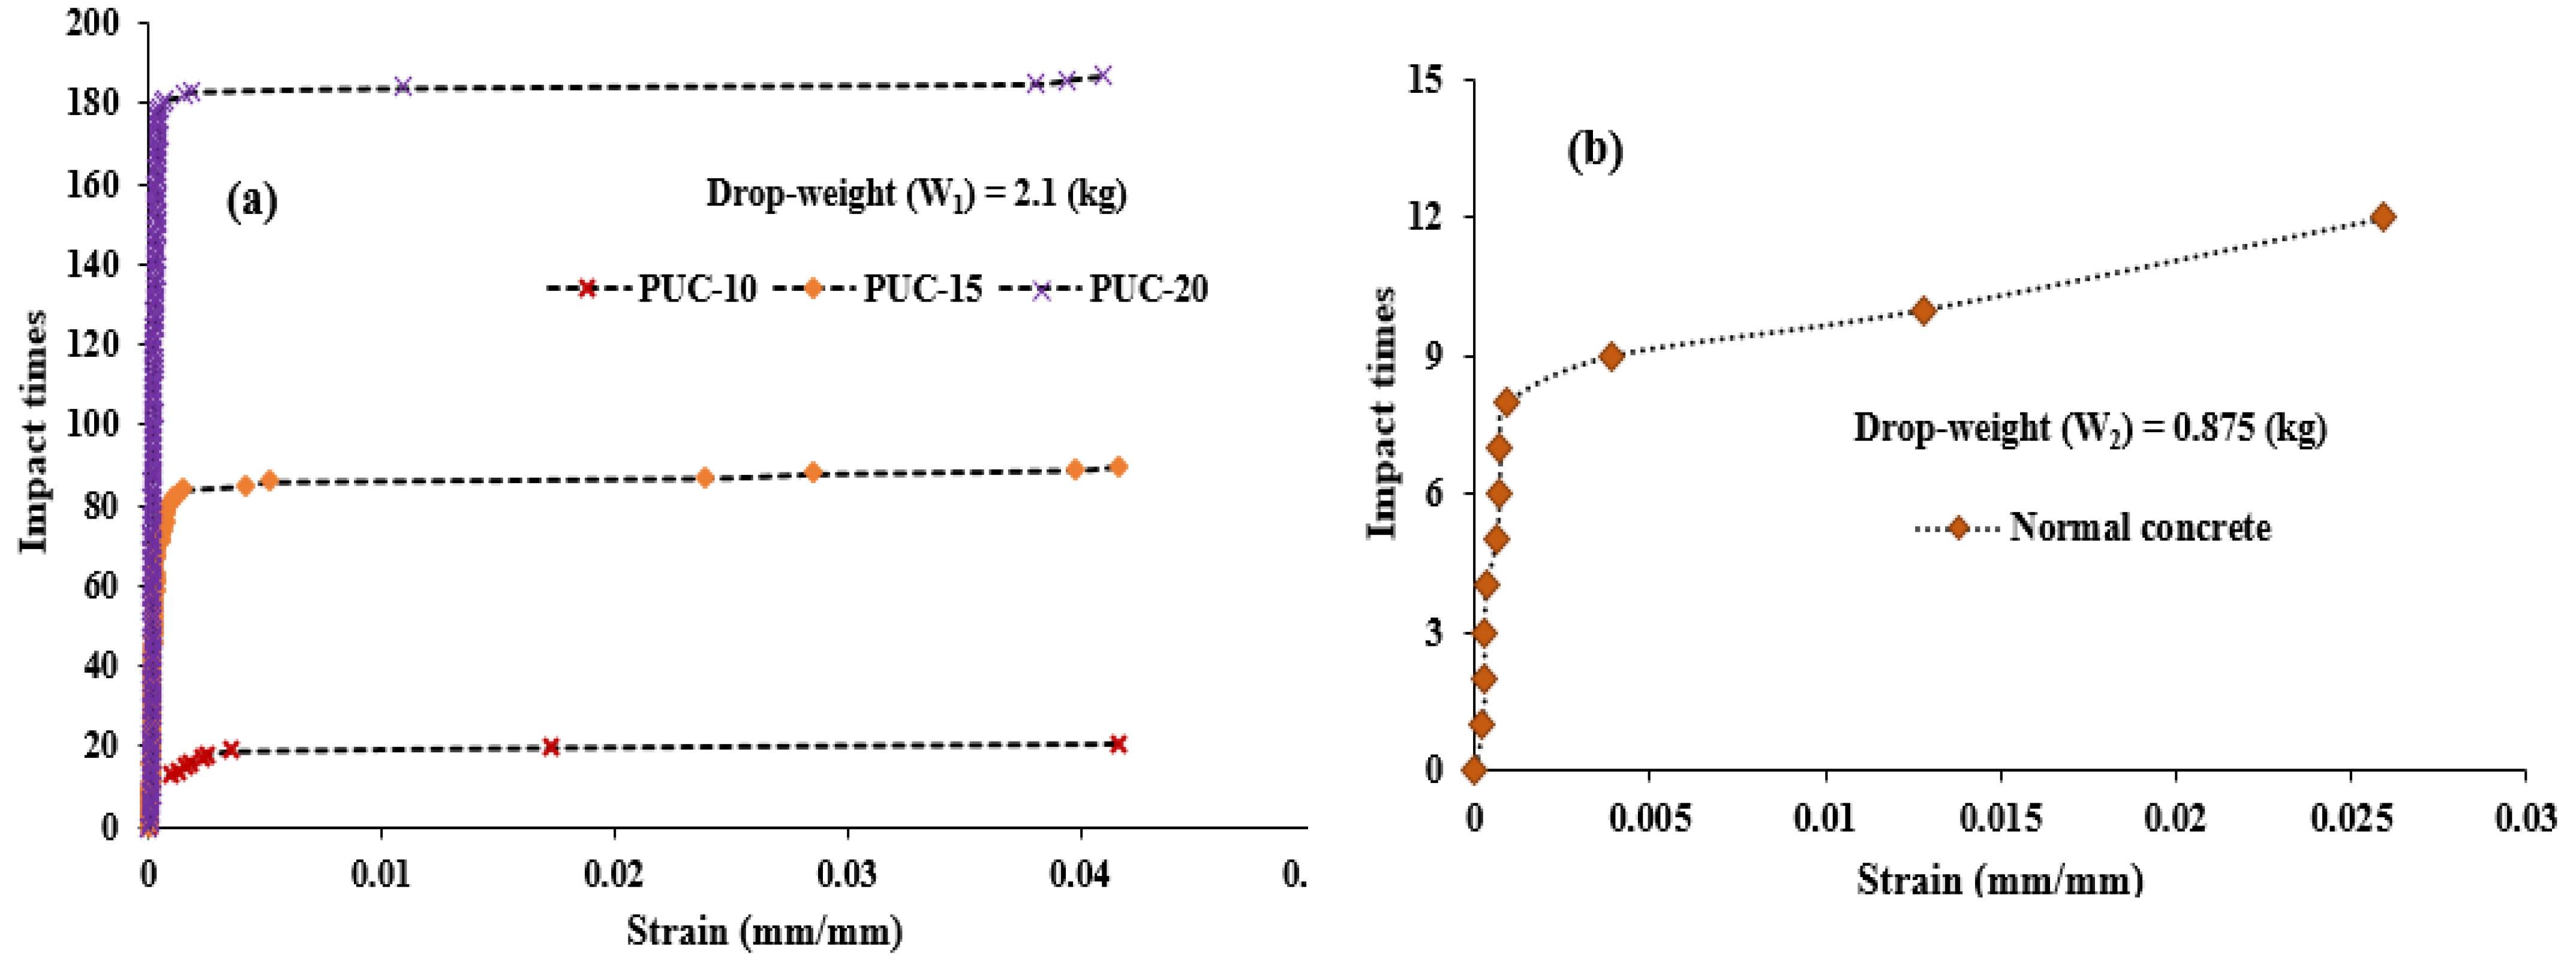
Figure 7 shows the impact strength of U-shaped PUPC according to the mixing ratios and normal concrete specimens. The initial crack of each U-shaped specimen was examined using a strain gauge, with the breakage of the strain gauge reflecting the first crack strength of the specimen. The representative test specimen from three mixing conditions was shown in Figure 7a to demonstrate the response of the PUPC specimen under dynamic loading. Three deformation regions evolved before complete failure strength [42]. The first stage is characterized by high resistance to impact loading. The second initial approximate elastic deformation region is defined by a noticeable elastic deformation in this region before the initial crack. The induced strain in the midpoint increases linearly, increasing the number of blows with a steep slope. The strain values range of 0.04–0.07% was observed in the PUPC-20 specimen against the strain of 0.015–0.13% in the PUPC-15 section. The resistance to impact load was reduced in the polymer concrete specimen containing 10% PU binder; this specimen experienced strain from 0.01–0.35%. The significant change in the strain at this stage may be attributed to the compression of the PUPC substrate. Then, the specimen entered the third region associated with a strain mutation; a significant change in strain occurred due to weight dropped continuously until the specimen ultimately failed. The large induced strain values were measured in each specimen. The strain ranges of 0.07–4.1%, 0.13–4.16%, and 0.4–4.16% were recorded for the PUPC specimens mixed with 20%, 15%, and 10% PU binder content, respectively. The breakage of the resistance strain gauge reflected the first crack strength due to the drop-weight impact load; after that, the drop-falling weight was continued until the test specimen ultimately failed. The number of impacting blows was recorded as the failure strength of the test specimen. A related study by Jiang et al. [55], which evaluated the freezing and thawing process of PU-based polymer mortar containing crumb rubber, indicated that there was no cracking at the specimens’ surface and edges after 200 freeze-thaw cycles and reported a negative mass loss of PU-based polymer mortar at different freezing and thaw cycles.
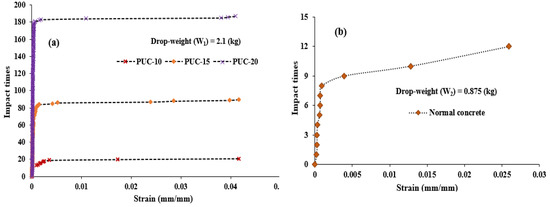
Figure 7.
Impact times-strain curves: (a) PUPC and (b) normal concrete specimens.
The average first crack strength (N) and failure strength (NU) and their corresponding energy absorption capacity for polymer concrete from the three mixing conditions and that normal concrete are shown in Table 2. Compared to ordinary concrete, polymer concrete demonstrates high-impact energy absorption and greater elastic deformation capacities. This phenomenon is attributed to the viscoelastic behavior of polymer materials. The average first crack impact energy at a 95% confidential interval for the polymer concrete was found to be 0.25 ± 0.02, 1.31 ± 0.04, and 2.97 ± 0.22 kJ for the PUPC-10, PUPC-15, and PUPC-20 specimens, respectively, which are much higher than the average first crack impact energy of normal concrete (which has a value of 0.048 ± 0.002 kJ). These results demonstrate the increased capability of polymer concrete to resist impact loading, making it suitable for repairing pavement. In addition to this excellent behavior, after the appearance of the first crack, the PUPC continues to withstand the impact loading by absorbing more energy before the specimens fail completely. The highest average absorbed impact energy of 4.71 ± 0.76 kJ at the failure stage was observed for the PUPC-20 samples, against the average impact energy of 0.12 ± 0.014 kJ for normal concrete.

Table 2.
Impact resistance of the U-shaped polymer and normal concrete specimens.
3.4. Dynamic Response of Normal Concrete Specimens
The result of the impact strength of U-shaped normal concrete subjected to drop-weight impact load was summarized in Table 2 To compare the impact time-strain relationship in the PUPC and normal concrete, a suitable drop weight (W2) = 0.875 kg was employed to simulate the dynamic response of normal concrete specimens as adopted in the literature [40,41,52,53]. The drop-weight (W1) is inappropriate to be used to evaluate the impact strength of normal concrete adopted in this study. This is because the specimen’s failure can occur when subjected to only one to two impact blows, which cannot be represented on the impact times vs. strain curve. Therefore, 0.875 kg can provide a reasonable number of impact blows at the first crack strength and failure strength stages, which are then converted to the corresponding impact energy absorption. A substantial increase in strain development was observed in normal concrete specimen right from the beginning of the impact blows and continues to be generated until the strain gauge enters strain mutation, as depicted in Figure 7b. This plot is also representative of those of other normal concrete specimens. The first crack strength occurred when the number of impact blows reached 12, with a corresponding peak strain value of 2.5%. Similar findings have been reported in the past study [40].
3.5. Impact Resistance Analysis Using Weibull Distribution
The Weibull distribution is a statistical tool widely used to solve engineering problems. It was originally developed by Wallodi Weibull. This statistical technique is related to the shape and scale parameters suitable for reliability analysis. The past studies revealed that the two-parameter Weibull distribution appeared to be more fitting and established distribution functions for determining concrete’s dynamic and fatigue properties [56,57]. Similarly, a strong technique namely response surface methodology have been used to evaluate the concrete performance [58,59,60], such as statistical analysis, prediction, and optimization. Therefore, the Weibull distribution function demonstrates an ascending or descending hazard function that reflects the actual concrete structure’s performance [61]. The fatigue test and repeated impact tests exhibit a common instrument that contains repetitive loads; for this reason, the two-parameter Weibull distribution function was applied to determine the variability of the impact strength data of the U-shaped PUPC.
The Weibull distribution probability function for the determination of impact strength data is given in Equation (2) [56,57].
The random variable distribution function can be obtained by integrating Equation (2).
where x is the specific value of the random variable X, τ is the shape parameter, z is defined as the scale factor, and is the location parameter: , τ > 0, and .
Consider is the minimum PUPC’s life under the impact test. Equation (4) expressed the survival probability function
Take the natural logarithm of Equation (4) two times and rearrange it as follows:
Therefore, Equation (5) was employed to check whether the impact strength data of PUPC follow the two-parameter Weibull distribution function. Thus, solving Equation (5) as a linear relationship and comparing it with a straight line equation (y = bx + c) yields τ, τLn(z), and R2. The survival function is expressed by Equation (6).
where Q is the cracking blows arranged in ascending order and K is the total number of PUPC specimens in each group
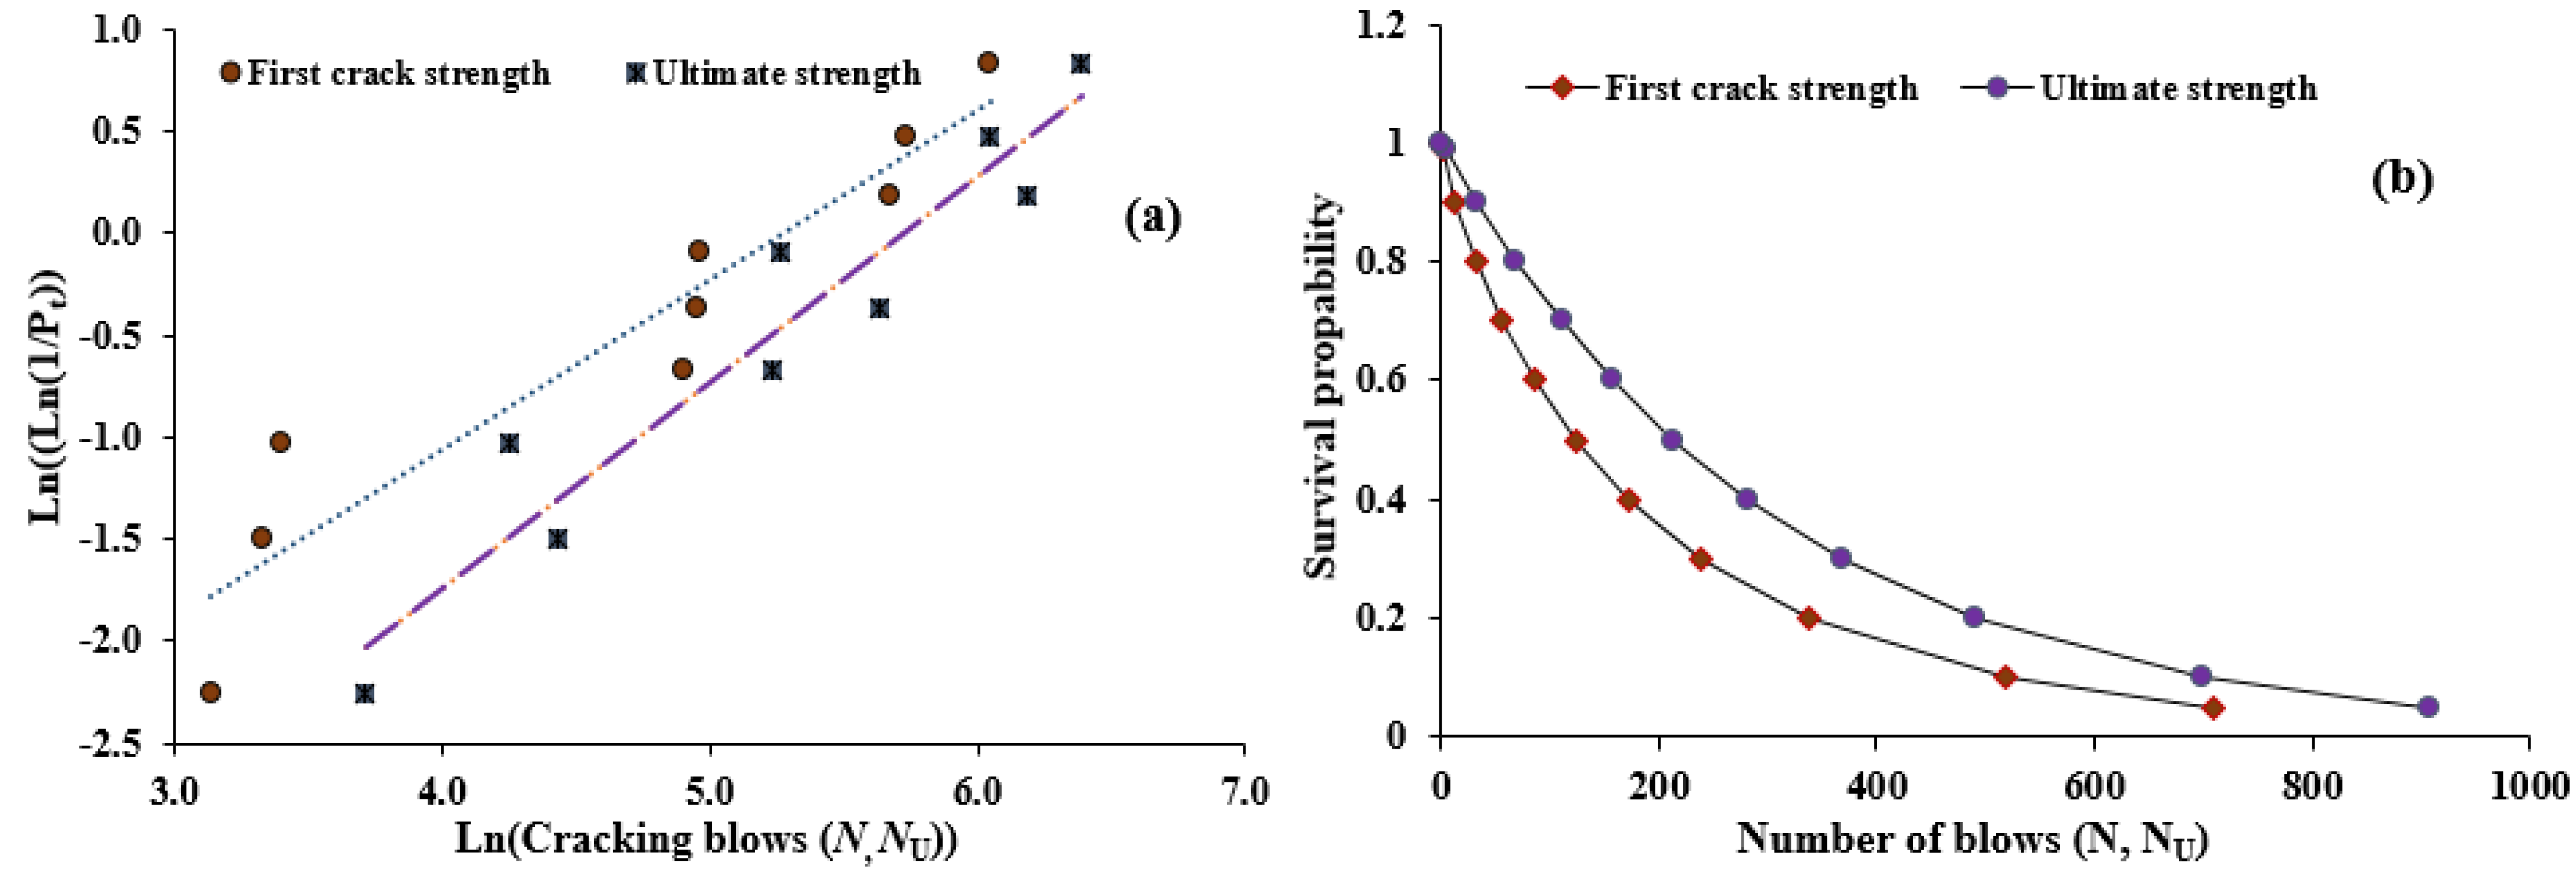
The impact strength data are considered to follow the two-parameter Weibull probability distribution when a linear relationship between Ln(Ln(1/Pj) and Ln(x) is obtained [56,57]. Therefore, according to this finding, the two-parameter Weibull distribution can be employed to evaluate the U-shaped PUPC impact resistance data. Table 3 provides a summary of the two-parameter Weibull distribution. The Weibull distribution plots of the impact strength data are shown in Figure 8a.

Table 3.
Weibull distribution analysis for PUPC.
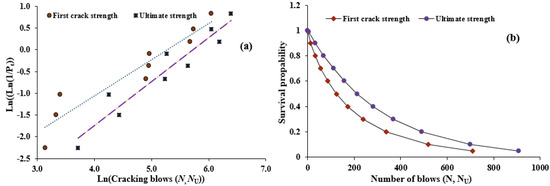
Figure 8.
(a) Weibull distribution plots and (b) reliability probabilities for impact resistance.
3.6. Reliability Analysis
Therefore, based on the finding in Section 3.6, the Weibull distribution can be used to determine the number of blows at the various probabilities of survival, referred to as “reliability analysis.” Equation (7) was used to calculate failure probability (P′) for the number of blows of the PUPC [61]
where N expresses the number of cracking blows, P′ represents the probability of failure, and z and τ are the scale shape factors, respectively. The design survival probability (Ʋ) can be calculated using Equation (8).
The two-parameter values and R2 for (N) and (NU) are summarized in Table 4. As can be seen, the R2-values obtained from the linear relationship between the Ln(Ln(1/Pj) and Ln(Ni) at both the first crack and the failure strength of the PUPC specimens are greater than 0.9.

Table 4.
The Weibull distribution analysis result.
Table 5 summarizes the design number of cracking blows of PUPC for a particular survival probability and the plotted figures in Figure 8b. Therefore, the design life impact resistance of U-shaped PUPC specimens should be chosen for only a small probability that cracks failure would happen. As shown in Figure 8b, the N and NU decrease as the survival probability increases. For example, a 60% survival probability corresponds to a 40% failure probability, the design impact times at first crack strength is 86 blows, and the ultimate strength is 157 blows, revealing that about 60% of the PUPC specimens can withstand these cracking blows without failure.

Table 5.
Impact resistance of PUPC under different survival probabilities.
4. Tension Test Result
4.1. Tensile Characteristic of PUGC
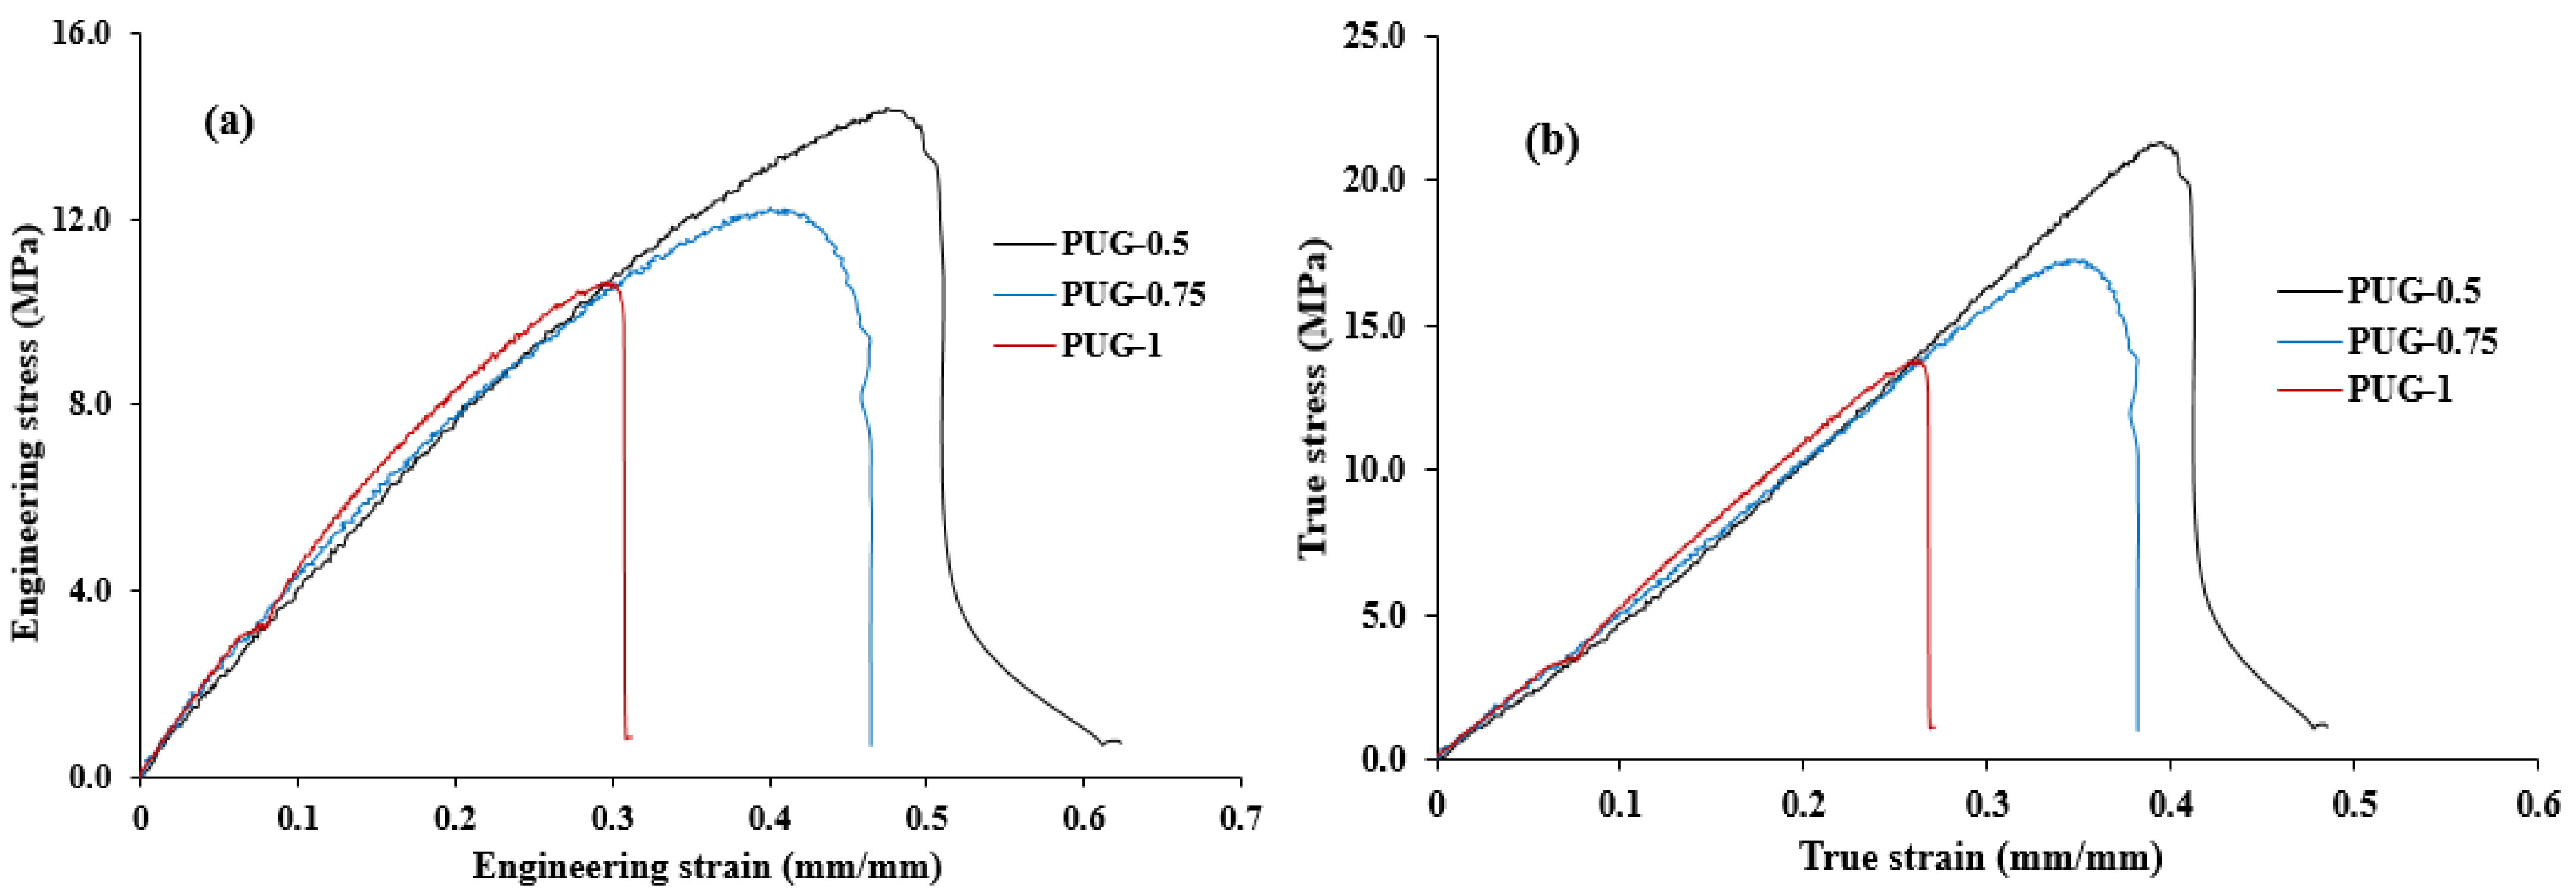
Figure 9a,b show the engineering stress–strain and true stress–strain plots of PUGC under tensile load regulated by a constant strain rate. These figures represent those of other PUGC samples from each mixing ratio. At the first stage, all samples showed a linear stress vs. strain response to the yielding stress, after which they underwent continual strain hardening deformation. Their engineering stress–strain responses demonstrated the behavior of viscoelastic materials. The elasticity of the PU composite diminished with the amount of sand in the grouting material. The decrease in elasticity due to the addition of sand content agreed with the findings in the previous study [62]. However, the average modulus of elasticity at a 95% significance level of the PU composite from the three mixing ratios was in the range of 36.67 ± 0.53 MPa to 44.55 ± 1.7 MPa, indicating that the stiffness of the PU composite increased with increased sand quantity. As a result, all other mechanical properties tended to decrease, as shown in Table 6. However, a modest decrease in these values was noticed. For instance, the rigid grout prepared with equal PU resin and sand by weight ratio (PUGC-1 samples) showed a 35.79% decrease in average failure stress compared to the average failure stress of PUGC-0.5 samples. At the same time, the ultimate strength was remarkably reduced according to mixing ratios. The average ultimate strength of the PUGC-0.5 samples is 14.29 ± 1.19 MP was 34.3% higher than the average ultimate strength of the PUGC-1 samples. Generally, the engineering properties of the samples from all cases showed common trends in increasing or decreasing order, as each case may have minor differences in magnitude. However, the elastic behavior of the polyurethane composite, according to the mixing ratio, was more pronounced in the PUGC-0.5 samples, resulting in significant strain deformation, as shown in Figure 9a. The PUGC-0.5 samples experienced a high failure strain value compared to the other samples. Therefore, a failure strain of 0.62 was obtained for this sample, while a failure strain of 0.43 and 0.31 were recorded for the PUGC-0.75 and PUGC-1 samples, respectively. These findings suggest that failure strain is the most critical factor in designing rigid PU grouting materials. The key parameters of failure stress and failure strain characterize the ductility of the materials and make them appropriate for repair, which entails strengthening and retrofitting structural applications exposed to severe stress and impact loading.
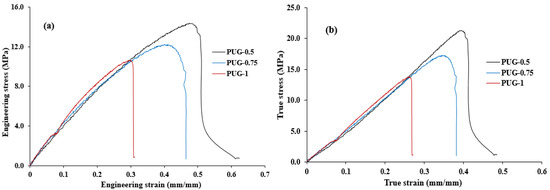
Figure 9.
Stress–strain curves of PUGC: (a) Engineering and (b) True.

Table 6.
The engineering properties of the PUGC materials.
4.2. Repair of Road Pavement
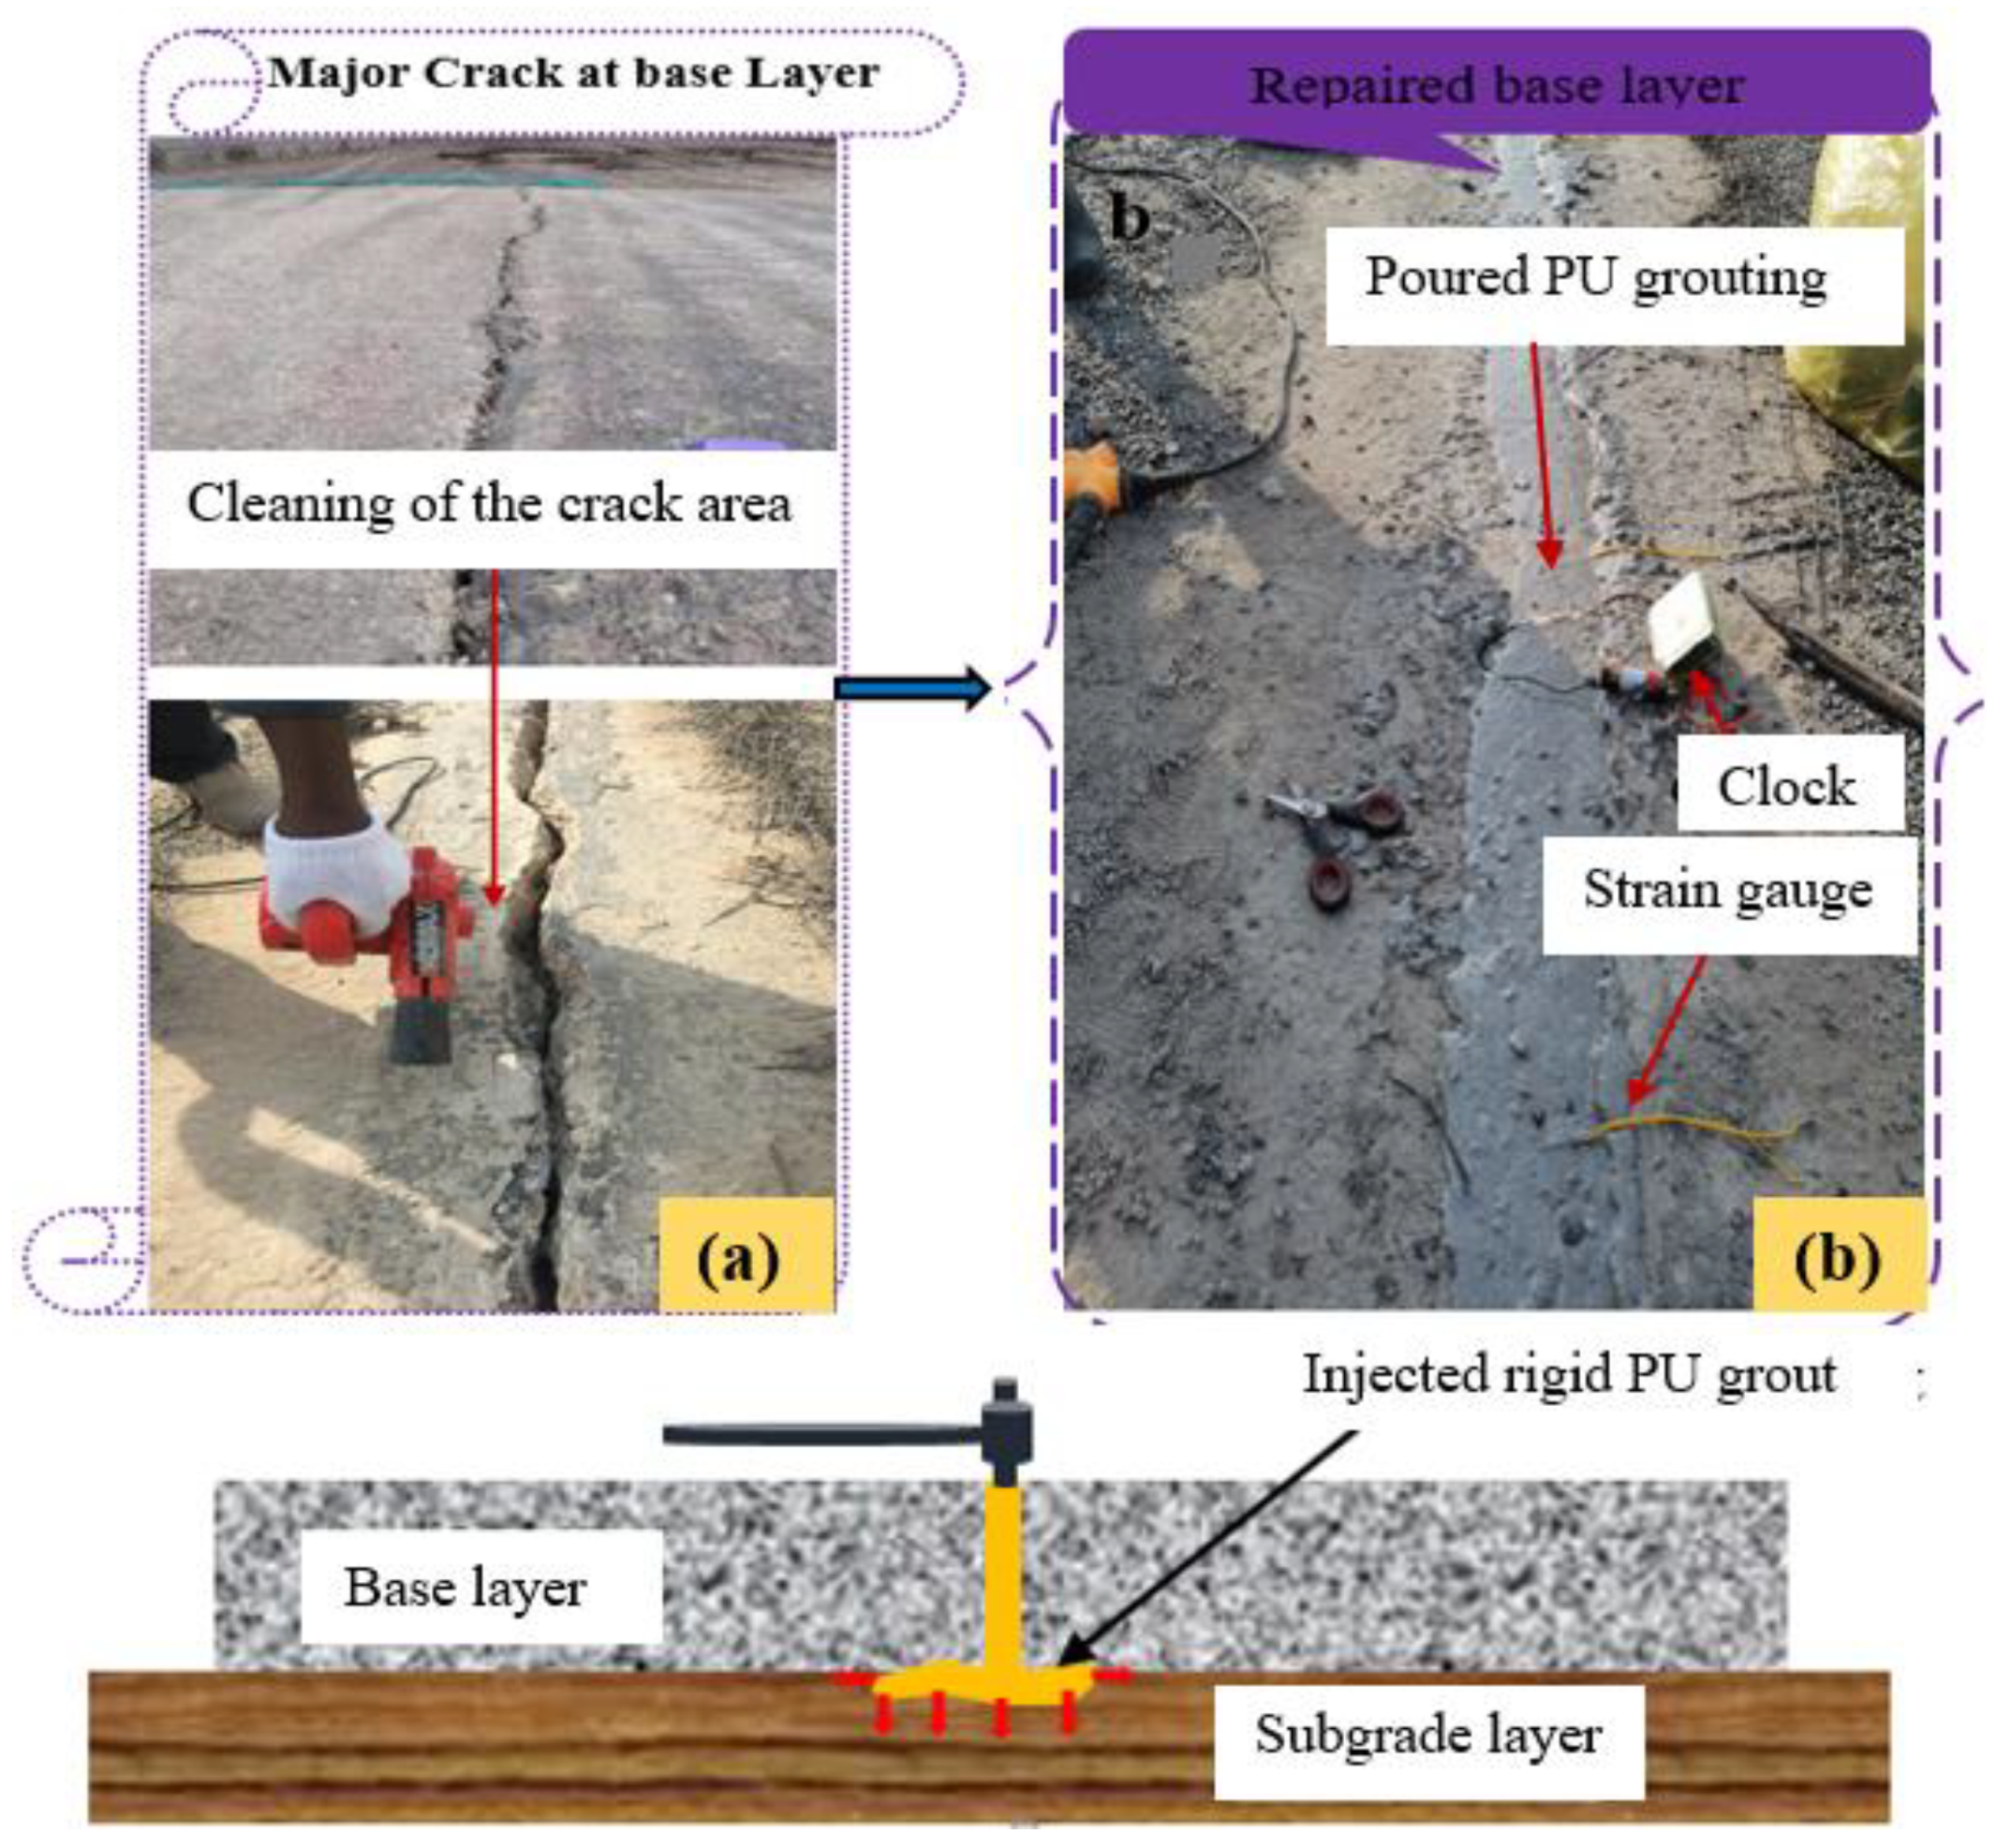
The new highway facility (Haibin road) is located in the Binhai District, Tianjin, China. The road is currently under construction; at some sections, the road experienced defects by forming major cracks in the cement concrete-based pavement layer, as shown in Figure 10a. Preparing this PU grout material is necessary to maintain the material’s initial structure and satisfy the need for engineering applications. For this reason, the rigid PUGC material is mainly applied through pouring and vibration to ensure proper bonding between the material and base layer and bear a tension load, as shown in Figure 10b.
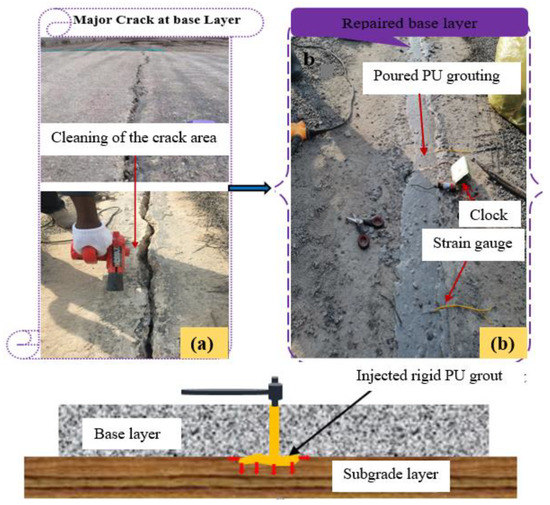
Figure 10.
Schematic illustration of highway pavement at base layer repair: (a) cleaning the crack portion; (b) repairing pavement.
Ductile composites are commonly used for maintenance purposes to strengthen or retrofit infrastructures for dynamic loading because of their energy absorption and their capability to mitigate blast and impact loads. Another interesting behavior of ductile materials is that it often shows a sign of deformation before failure in an overloading condition. When a polymer material is subjected to high loading conditions, the material’s microstructure induces a high concentration of local stress, thereby weakening the regions (microstructural defects) that start to appear with the formation of microscale cracks and voids inside the microstructure. Because of the nature of polymers, these minor ridges produce a linear distortion portion with different voids. As a result, these voids enlarge, forming a web between the individual voids. The microvoids grow further after propagating in the above stages, and the joining between the microvoids develops larger voids. Consequently, these large void become critical and cause a crack, which thus causes the failure of the composite specimens [30].
5. Conclusions
The static and impact resistance properties of polyurethane composite materials were experimentally investigated. U-shaped PUPC specimens were prepared with three mixing ratios. The stress–strain relationship, failure mode, and impact times-strain relationship were evaluated. Moreover, Weibull distribution was employed to analyze the impact resistance data. The major conclusions are stated below.
- (1)
- The PUPC specimens exhibit elastic behavior under compression and dynamic loads. The result indicates that PUPC-20 specimens developed higher limit strain deformation than those prepared with 15% and 10% PU binder. The average failure impact energy of PUPC-20 was 127.5%, 670%, and 3825% higher than that of PUPC-15, PUPC-10, and normal concrete specimens, respectively. PUPC demonstrates excellent dynamic performance compared to ordinary concrete due to the viscoelastic behavior of polymer composites.
- (2)
- The U-shaped PUPC specimens show elastic behavior under static and impact tests, with two deformation states before complete failure. The maximum failure strain values of 0.9% and 4.2% were observed for the PUPC-20 specimen under static loading and dynamic loading, respectively.
- (3)
- The number of blows N and NU of the test specimens follow the two-parameter Weibull distribution probability function. The reliability result revealed that about 60 percent of the PUPC samples could endure 86 blows at the first crack stage and 157 blows at the failure strength stage.
- (4)
- The average ultimate strength, failure stress, and yield strain of PUGC-0.5 was 34.3%, 35.8%, and 63.7% higher than that of the PUGC-1 specimen, respectively. The finding indicates that rigid PU grout materials are effective for retrofitting and strengthening structural systems. Therefore, using polyurethane composite as a ductile material provides a promising result.
- (5)
- The adoption of U-shaped specimens in this study significantly reduces the variation of drop-weight impact test results proposed in the ACI-544 committee testing procedure by controlling the formation of the cracks. However, the impact resistance data could be affected if the test specimen becomes fixed on the steel base groove.
Author Contributions
H.Z. and Y.E.I.: Conceptualization, investigation, supervision, resources, project administration, funding acquisition and formal analysis. S.I.H. and J.S.: Conceptualization, methodology, investigation, data curation, writing—original draft, writing—review & editing, visualization. M.A. and A.I.B.F.: Data curation, writing—original draft, writing—review & editing. All authors have read and agreed to the published version of the manuscript.
Funding
This research was funded by Natural Science Foundation of China, Grant Number No. 51708314 and the APC was funded by Structures and Materials Laboratory (S&M Lab) of The College of Engineering, Prince Sultan University, Riyadh, Saudi Arabia.
Data Availability Statement
Not applicable.
Acknowledgments
The authors greatly acknowledge the financial support for publication fees by the structures and materials laboratory (S&M Lab) of the College of Engineering, Prince Sultan University, Riyadh, Saudi Arabia.
Conflicts of Interest
The authors declare no conflict of interest.
References
- Giussani, F.; Mola, F. Durable concrete pavements: The reconstruction of runway head 36R of Milano Linate International Airport. Constr. Build. Mater. 2012, 34, 352–361. [Google Scholar] [CrossRef]
- Bull, J.W.; Woodford, C.H. Design of precast concrete pavement units for rapid maintenance of runways. Comput. Struct. 1997, 64, 857–864. [Google Scholar] [CrossRef]
- Sharareh, S.; Marwa, H.; Mohammad, L.N. Rheological and Mechanical Evaluation of Polyurethane Prepolymer-Modified Asphalt Mixture with Self-Healing Abilities. J. Mater. Civ. Eng. 2020, 32, 4020231. [Google Scholar] [CrossRef]
- Zhang, J.; Li, G.; Yang, X.; Ren, S.; Song, Z. Study on a high strength ternary blend containing calcium sulfoaluminate cement/calcium aluminate cement/ordinary Portland cement. Constr. Build. Mater. 2018, 191, 544–553. [Google Scholar] [CrossRef]
- Sánchez, M.; Faria, P.; Ferrara, L.; Horszczaruk, E.; Jonkers, H.M.; Kwiecień, A.; Mosa, J.; Peled, A.; Pereira, A.S.; Snoeck, D.; et al. External treatments for the preventive repair of existing constructions: A review. Constr. Build. Mater. 2018, 193, 435–452. [Google Scholar] [CrossRef]
- Hussain, H.K.; Liu, G.W.; Yong, Y.W. Experimental study to investigate mechanical properties of new material polyurethane–cement composite (PUC). Constr. Build. Mater. 2014, 50, 200–208. [Google Scholar] [CrossRef]
- Chattopadhyay, D.K.; Raju, K.V.S.N. Structural engineering of polyurethane coatings for high performance applications. Prog. Polym. Sci. 2007, 32, 352–418. [Google Scholar] [CrossRef]
- Ha, J.-H.; Yi, N.-H.; Choi, J.-K.; Kim, J.-H.J. Experimental study on hybrid CFRP-PU strengthening effect on RC panels under blast loading. Compos. Struct. 2011, 93, 2070–2082. [Google Scholar] [CrossRef]
- Ju, B.; Yuan, X.; Tang, R.; Zhang, D.; Zhang, L.; Liu, J.; Yang, B.; Liao, C.; Zhang, L. Dynamic Mechanical Properties of Magnetorheological Elastomers Based on Polyurethane Matrix. Polym. Compos. 2016, 37, 1587–1895. [Google Scholar] [CrossRef]
- Choi, J.; Moon, D.S.; Jang, J.U.; Yin, W.B.; Lee, B.; Lee, K.J. Synthesis of highly functionalized thermoplastic polyurethanes and their potential applications. Polymer 2017, 116, 287–294. [Google Scholar] [CrossRef]
- Das, A.; Mahanwar, P. A brief discussion on advances in polyurethane applications. Adv. Ind. Eng. Polym. Res. 2020, 3, 93–101. [Google Scholar] [CrossRef]
- Zhang, K.; Sun, Q. The use of Wire Mesh-Polyurethane Cement (WM-PUC) composite to strengthen RC T-beams under flexure. J. Build. Eng. 2018, 15, 122–136. [Google Scholar] [CrossRef]
- Kwiecień, A. Shear bond of composites-to-brick applied with highly deformable, in relation to resin epoxy, interface materials. Mater. Struct. 2014, 47, 2005–2020. [Google Scholar] [CrossRef]
- Kwiecień, A.; de Felice, G.; Oliveira, D.V.; Zając, B.; Bellini, A.; De Santis, S.; Ghiassi, B.; Lignola, G.P.; Lourenço, P.B.; Mazzotti, C.; et al. Repair of composite-to-masonry bond using flexible matrix. Mater. Struct. 2016, 49, 2563–2580. [Google Scholar] [CrossRef]
- Grujicic, M.; Pandurangan, B.; He, T.; Cheeseman, B.A.; Yen, C.-F.; Randow, C.L. Computational investigation of impact energy absorption capability of polyurea coatings via deformation-induced glass transition. Mater. Sci. Eng. A 2010, 527, 7741–7751. [Google Scholar] [CrossRef]
- Mostafa, A.; Shankar, K.; Morozov, E. V Behaviour of PU-foam/glass-fibre composite sandwich panels under flexural static load. Mater. Struct. 2015, 48, 1545–1559. [Google Scholar] [CrossRef]
- Jiang, W.; Zhu, H.; Haruna, S.I.; Zhao, B.; Shao, J.; Yu, Y. Effect of crumb rubber powder on mechanical properties and pore structure of polyurethane-based polymer mortar for repair. Constr. Build. Mater. 2021, 309, 125169. [Google Scholar] [CrossRef]
- Carrera, V.; Cuadri, A.A.; García-Morales, M.; Partal, P. The development of polyurethane modified bitumen emulsions for cold mix applications. Mater. Struct. 2015, 48, 3407–3414. [Google Scholar] [CrossRef]
- Nugaeva, V.O.; Rodionov, Y. V The study of polyurethane adhesive composition in aggressive environments. IOP Conf. Ser. Earth Environ. Sci. 2019, 315, 52075. [Google Scholar] [CrossRef]
- Mazzuca, P.; Firmo, J.P.; Correia, J.R.; Garrido, M. Mechanical behaviour in shear and compression of polyurethane foam at elevated temperature. J. Sandw. Struct. Mater. 2021, 24, 1429–1448. [Google Scholar] [CrossRef]
- Yi, J.; Boyce, M.C.; Lee, G.F.; Balizer, E. Large deformation rate-dependent stress–strain behavior of polyurea and polyurethanes. Polymer 2006, 47, 319–329. [Google Scholar] [CrossRef]
- Sarva, S.S.; Deschanel, S.; Boyce, M.C.; Chen, W. Stress–strain behavior of a polyurea and a polyurethane from low to high strain rates. Polymer 2007, 48, 2208–2213. [Google Scholar] [CrossRef]
- Farshad, M.; Wildenberg, M.W.; Flüeler, P. Determination of shear modulus and Poisson’s ratio of polymers and foams by the anticlastic plate-bending method. Mater. Struct. 1997, 30, 377–382. [Google Scholar] [CrossRef]
- Zhai, X.; Gao, J.; Liao, H.; Kirk, C.D.; Balogun, Y.A.; Chen, W.W. Mechanical behaviors of auxetic polyurethane foam at quasi-static, intermediate and high strain rates. Int. J. Impact Eng. 2019, 129, 112–118. [Google Scholar] [CrossRef]
- Miao, Y.; He, H.; Li, Z. Strain hardening behaviors and mechanisms of polyurethane under various strain rate loading. Polym. Eng. Sci. 2020, 60, 1083–1092. [Google Scholar] [CrossRef]
- Choi, H.J.; Kim, J.H. Static and dynamic comfort properties of polyurethane foams including a flexible amine crosslinker. J. Ind. Eng. Chem. 2020, 90, 260–265. [Google Scholar] [CrossRef]
- Sarasini, F.; Tirillò, J.; Ferrante, L.; Valente, M.; Valente, T.; Lampani, L.; Gaudenzi, P.; Cioffi, S.; Iannace, S.; Sorrentino, L. Drop-weight impact behaviour of woven hybrid basalt–carbon/epoxy composites. Compos. Part B Eng. 2014, 59, 204–220. [Google Scholar] [CrossRef]
- Li, J.; Zhang, J.; Chen, S. Study on dynamic viscoelastic properties and constitutive model of non-water reacted polyurethane grouting materials. Measurement 2021, 176, 109115. [Google Scholar] [CrossRef]
- Raman, S.N.; Ngo, T.; Lu, J.; Mendis, P. Experimental investigation on the tensile behavior of polyurea at high strain rates. Mater. Des. 2013, 50, 124–129. [Google Scholar] [CrossRef]
- Fan, J.T.; Weerheijm, J.; Sluys, L.J. Glass interface effect on high-strain-rate tensile response of a soft polyurethane elastomeric polymer material. Compos. Sci. Technol. 2015, 118, 55–62. [Google Scholar] [CrossRef]
- Fazle, R.M.; Boudreau, R.L.; Chittoori, B.C.S.; Matthew, S.; Debakanta, M. Polyurethane Grout Injection as Remedial Measure to Reduce Differential Heave in Pavement Sections Constructed over Expansive Soils. J. Transp. Eng. Part B Pavements 2020, 146, 4020068. [Google Scholar] [CrossRef]
- Shao, J.; Zhu, H.; Zuo, X.; Lei, W.; Mirgan, S.; Liang, J.; Duan, F. Effect of waste rubber particles on the mechanical performance and deformation properties of epoxy concrete for repair. Constr. Build. Mater. 2020, 241, 118008. [Google Scholar] [CrossRef]
- Can, C.; Chengchao, G.; Qing, L.; Fuming, W.; Hongyuan, F. Fatigue Performance of Concrete–Polyurethane Composite Materials under Compression. J. Transp. Eng. Part B Pavements 2021, 147, 4021030. [Google Scholar] [CrossRef]
- Gopalaratnam, V.S.; Shah, S.P.; John, R. A modified instrumented charpy test for cement-based composites. Exp. Mech. 1984, 24, 102–111. [Google Scholar] [CrossRef]
- Ross, C.A.; Tedesco, J.W.; Thompson N, P.Y. Split-Hopkinson Pressure-Bar tests on Concrete and Mortar in Tension and Compression. ACI Mater. J. 1989, 86, 475–481. [Google Scholar] [CrossRef]
- Barr, B.; Baghli, A. A repeated drop-weight impact testing apparatus for concrete. Mag. Concr. Res. 1988, 40, 167–176. [Google Scholar] [CrossRef]
- ACI. 544.2R-89. Measurement of Properties of Fiber Reinforced Concrete; American Concrete Institute: Indianapolis, IN, USA, 1989; pp. 433–439.
- Rahmani, T.; Kiani, B.; Shekarchi, M.; Safari, A. Statistical and experimental analysis on the behavior of fiber reinforced concretes subjected to drop weight test. Constr. Build. Mater. 2012, 37, 360–369. [Google Scholar] [CrossRef]
- Rai, B.; Singh, N.K. Statistical and experimental study to evaluate the variability and reliability of impact strength of steel-polypropylene hybrid fiber reinforced concrete. J. Build. Eng. 2021, 44, 102937. [Google Scholar] [CrossRef]
- Zhu, X.C.; Zhu, H.; Li, H.R. Drop-weight impact test on U-shape concrete specimens with statistical and regression analyses. Materials 2015, 8, 5877–5890. [Google Scholar] [CrossRef]
- Zhang, Y. The Study on the Properties of Crumb Rubber Concrete with U-Shape Impact Test. Master’s Thesis, Tianjin University, Tianjin, China, 2011. [Google Scholar]
- Ibrahim Haruna, S.; Zhu, H.; Jiang, W.; Shao, J. Evaluation of impact resistance properties of polyurethane-based polymer concrete for the repair of runway subjected to repeated drop-weight impact test. Constr. Build. Mater. 2021, 309, 125152. [Google Scholar] [CrossRef]
- Haruna, S.I.; Zhu, H.; Shao, J. Experimental study, modeling, and reliability analysis of impact resistance of micro steel fiber-reinforced concrete modified with nano silica. Struct. Concr. 2022, 23, 1659–1674. [Google Scholar] [CrossRef]
- Demir, M.M.; Yilgor, I.; Yilgor, E.; Erman, B. Electrospinning of polyurethane fibers. Polymer. 2002, 43, 3303–3309. [Google Scholar] [CrossRef]
- ASTM C192. Standard Practice for Making and Curing Concrete Test Specimens in the Laboratory; ASTM: West Conshohocken, PA, USA, 2015.
- Jung, K.-C.; Roh, I.-T.; Chang, S.-H. Evaluation of mechanical properties of polymer concretes for the rapid repair of runways. Compos. Part B Eng. 2014, 58, 352–360. [Google Scholar] [CrossRef]
- Roh, I.-T.; Jung, K.-C.; Chang, S.-H.; Cho, Y.-H. Characterization of compliant polymer concretes for rapid repair of runways. Constr. Build. Mater. 2015, 78, 77–84. [Google Scholar] [CrossRef]
- ASTM C138/C138M. Standard Test Method for Density (Unit Weight), Yield, and Air Content (Gravimetric) of Concrete; American Society for Testing and Materials: West Conshohocken, PA, USA, 2017.
- DL/T5126-2001. Test Code on Polymer-Modified Cement Martor. National Standard of China; National Development and Reform Commission: Beijing, China, 2001.
- Musa, A.; Mohammed, B.S.; Shahir, L.M.; Salah, A.W. Evaluating the impact resistance of roller compacted concrete containing crumb rubber and nanosilica using response surface methodology and Weibull distribution. World J. Eng. 2019, 16, 33–43. [Google Scholar] [CrossRef]
- DL/T5139-2004. Test Code on Expoxy Resin Martor. National Standard of China; National Development and Reform Commission: Beijing, China, 2004.
- Nantasetphong, W.; Jia, Z.; Amirkhizi, A.V.; Nemat-nasser, S. Mechanics of Materials Dynamic properties of polyurea-milled glass composites Part I: Experimental characterization. Mech. Mater. 2016, 98, 142–153. [Google Scholar] [CrossRef]
- Somarathna, H.M.C.C.; Raman, S.N.; Mohotti, D.; Mutalib, A.A.; Badri, K.H. Rate dependent tensile behavior of polyurethane under varying strain rates. Constr. Build. Mater. 2020, 254, 119203. [Google Scholar] [CrossRef]
- Jiang, Z.; Tang, C.; Yang, J.; You, Y.; Lv, Z. A lab study to develop polyurethane concrete for bridge deck pavement. Int. J. Pavement Eng. 2022, 23, 1404–1412. [Google Scholar] [CrossRef]
- Jiang, W.; Zhu, H.; Ibrahim Haruna, S.; Shao, J.; Yu, Y.; Wu, K. Mechanical properties and freeze–thaw resistance of polyurethane-based polymer mortar with crumb rubber powder. Constr. Build. Mater. 2022, 352, 129040. [Google Scholar] [CrossRef]
- Murali, G.; Asrani, N.P.; Ramkumar, V.R.; Siva, A.; Haridharan, M.K. Impact Resistance and Strength Reliability of Novel Two-Stage Fibre-Reinforced Concrete. Arab. J. Sci. Eng. 2019, 44, 4477–4490. [Google Scholar] [CrossRef]
- Ganesan, N.; Bharati Raj, J.; Shashikala, A.P. Flexural fatigue behavior of self compacting rubberized concrete. Constr. Build. Mater. 2013, 44, 7–14. [Google Scholar] [CrossRef]
- Adamu, M.; Ayeni, K.O.; Haruna, S.I.; Ibrahim Mansour, Y.E.-H.; Haruna, S. Durability performance of pervious concrete containing rice husk ash and calcium carbide: A response surface methodology approach. Case Stud. Constr. Mater. 2021, 14, e00547. [Google Scholar] [CrossRef]
- Adamu, M.; Haruna, S.I.; Ibrahim, Y.E.; Alanazi, H. Evaluation of the mechanical performance of concrete containing calcium carbide residue and nano silica using response surface methodology. Environ. Sci. Pollut. Res. 2022, 29, 67076–67102. [Google Scholar] [CrossRef]
- Adamu, M.; Haruna, S.I.; Ibrahim, Y.E.; Alanazi, H. Investigating the properties of roller-compacted rubberized concrete modified with nanosilica using response surface methodology. Innov. Infrastruct. Solut. 2022, 7, 119. [Google Scholar] [CrossRef]
- Liu, F.; Meng, L.; Ning, G.-F.; Li, L.-J. Fatigue performance of rubber-modified recycled aggregate concrete (RRAC) for pavement. Constr. Build. Mater. 2015, 95, 207–217. [Google Scholar] [CrossRef]
- Al-kahtani, M.S.M.; Zhu, H.; Haruna, S.I.; Shao, J. Evaluation of Mechanical Properties of Polyurethane-Based Polymer Rubber Concrete Modified Ground Glass Fiber Using Response Surface Methodology. Arab. J. Sci. Eng. 2022, 1–16. [Google Scholar] [CrossRef]
Publisher’s Note: MDPI stays neutral with regard to jurisdictional claims in published maps and institutional affiliations. |
© 2022 by the authors. Licensee MDPI, Basel, Switzerland. This article is an open access article distributed under the terms and conditions of the Creative Commons Attribution (CC BY) license (https://creativecommons.org/licenses/by/4.0/).

