
Dynamics, Risk and Management Performance of Urban Real Estate Inventory in Yangtze River Delta


1
College of Civil Engineering and Architecture, Jiaxing University, Jiaxing 314001, China
2
College of Urban and Environmental Sciences, Northwest University, Xi’an 710127, China
3
School of Civil Engineering and Architecture, Guangxi University, Nanning 530004, China
4
School of Architecture, Southeast University, Nanjing 210096, China
5
Urban-Rural Construction College, Guangxi Vocational University of Agriculture, Nanning 530007, China
*
Authors to whom correspondence should be addressed.
Buildings 2022, 12(12), 2140; https://doi.org/10.3390/buildings12122140
Submission received: 15 November 2022
/
Revised: 1 December 2022
/
Accepted: 2 December 2022
/
Published: 5 December 2022
(This article belongs to the Special Issue Computational Approach Applications in Housing and Real Estate)
Abstract
:(1) Background: Inventory management is a key point in the achievement of the virtuous cycle and sustainable development of the real estate industry. In response to the practical needs of city-based policies, this paper constructs a new research approach of “evolution dynamics—risk analysis—performance evaluation—policy design” of real estate inventory, and conducts a case study on the Yangtze River Delta. (2) Methods: This paper studies the change characteristics, trends and spatial patterns of real estate inventory changes in the Yangtze River Delta based on Geographic Information System software, and quantitatively evaluates the risk level and management performance of real estate inventory by introducing the Boston Consulting Group Matrix for corporate management and the Super- Data Envelopment Analysis Model for operations research, providing a basis for policy design. (3) Results: First, the “destocking” policy has gained results to some extent and diversified the inventory evolution, thus alleviating or curbing the negative trend in most cities. Second, the real estate inventory in the Yangtze River Delta is divided into high, low, potential and zero pressure zones by risk levels, and the proportion of cities with increased, decreased and unchanged risk levels is essentially the same. Third, the average real estate inventory management performance index has been steadily improving, but overall, it is still unsatisfactory, with cities in an effective state accounting for 40% and below for a long time. Fourth, real estate inventory and its management performance both show significant spatial effects, with cold and hot spot cities characterized by a “center-periphery” spatial pattern in geographical distribution, and the cities in the study area are classified into four types: super-efficiency, efficiency, inefficiency, and super-inefficiency. Fifth, the real estate inventory in most cities is continuing to grow positively, and a small number of cities have been in the high-risk zone for a long time or become new members of the high-risk zone, making the government and enterprises still faced up with great pressure and challenges in inventory management with the risk level further increased but management performance growing slowly. (4) Conclusions: The study area is divided into four types of policy areas, that is, red key area, yellow important area, green auxiliary area, and path-dependent area, and suggestions for optimization are made from the perspectives of risk control, performance improvement, benchmarking recommendation, and redundancy governance, providing a basis for the government’s real estate inventory management policy design and the enterprise’s high-quality development decision.
1. Introduction
1.1. Background
Real estate is a leading or pillar industry in many countries and plays a key role in the process of sustainable economic and social development. Since the global financial crisis in 2008, the study of real estate risks, bubbles and booms has received a lot of attention, which is of great significance to the government, enterprises and individuals [1,2]. Real estate inventory management is a key point of sustainable business operations and governmental industry management, and either a high or low inventory level has a negative impact on sustainable development [3,4]. Real estate inventory refers to the housing that has been built but not sold or put into actual use, and moderate inventory complies with the rules of business, industry, and market development. Low inventory may disenable real estate companies to respond to market demand in a timely manner, thus compromising its sales volume, market share, operating income and profits, and social reputation, while high inventory may lead to a large amount of capital and resources being tied up in real estate companies and transmitted through related industries to pose a huge risk to financial security and high-quality economic development. The global economic slowdown in recent years has led to a general depression in the real estate industry, making high inventories a universal phenomenon [5,6]. Therefore, it is of great theoretical value and practical significance to analyze the dynamics of real estate inventory evolution, quantitatively identify risk levels, scientifically evaluate inventory management performance, and formulate and implement timely response policies.
In response to the threat of high inventories to healthy economic development and social harmony and stability, China has conducted a large-scale policy experiment on real estate inventory management, which is typically representative of the world [7]. After the birth of the commercial housing market in China in 1980, the central government implemented special real estate destocking policies in 1995, 2008 and 2015 according to the development status of the real estate industry. Notably, real estate “destocking” was included in the key tasks of economic development and supply-side reform of the central and local governments at the end of 2015, in particular, Jiangsu Province, Zhejiang Province, Anhui Province, Shaanxi Province, Qinghai Province, Shanghai Municipality, Chongqing Municipality, and Guangzhou City introduced special policies for “destocking”. The destocking pressure is very uneven among different types of real estate across cities and municipalities, making destocking an arduous and complicated task. As the destocking policy has been implemented for five years, the government is eager to know the latest real estate inventory status, risks, and performance to provide a basis for a new round of development policy formulation for the real estate industry. Therefore, analyzing the dynamics of real estate inventory evolution, risks, performance, and their change characteristics in China will inform decisions on inventory management policy design for Chinese and other governments around the world.
1.2. Literature Review
The history of real estate development and academic research shows that real estate inventory research originated from housing vacancy analysis. In the early studies scholars, with a focus on the fundamental theory of real estate vacancy, constructed the Vacancy Chain Model [8,9,10], and proposed the concept of natural vacancy rates [11]. Later on, the study of the interaction between natural vacancy rate and related factors became a hot topic. Miceli [12], Vandell [13], Shen [14], Gabriel [15], Wang [16], Tse [17], Whitaker [18], Boessen [19], Jones [20], and Chen [21] analyzed the effects of efficiency wages, taxes, land supply, rents, house prices, habitat, and especially neighborhood crime (robbery and burglary, etc.) on natural vacancy rates, respectively, and found that the coexistence of high rents, high house prices, and high vacancy is a widespread phenomenon [22,23]. Along with advances in big data and research methods, scholars have conducted real estate vacancy identification analysis based on multi-source data and cross-cutting methods, and focused on its impact on urban development in response to urban development trends and the need for real estate management. Wang [24] and Pan [25] spatially identified housing vacancy in China based on remote sensing data, Li [26] estimated the rural housing vacancy rate in China using electricity consumption data, and Deilmann [27] predicted the housing vacancy scenario in Germany in 2050. Wang [28] and Deng [29] analyzed the multi-scale correlation between housing vacancy and urban growth and decay in the United States, and Radzimski [30] explained the relationship between housing vacancy and urban contraction policies in Germany.
Real estate management policies and statistical systems vary significantly from country to country and evolve with the stage of development. To meet the needs of development and the changes in the statistical system, the focus of research is now shifting from commercial housing vacancy to real estate inventory management, and has grown into an emerging research hotspot. Geman was the first scholar to introduce the concept of inventory management into real estate research, and has conducted exploratory and creative research in empirical research in the United Kingdom [31]. Caplin [32] analyzed the relationship among inventory, price and sales of real estate, and established a joint model. Kwoun [33] introduced system dynamics to analyze real estate inventories and developed Causal Loop Diagrams (CLD) and Stock-Flow Diagrams (SFD) for quantitative simulations. Morales [34], Jiang [35], Muczynski [36], Olaya [37], and Immergluck [38] empirically analyzed the change and geographical distribution characteristics, evolution trend and correlation of real estate inventories in Brazil, China, Poland, and the United States. Wen [39] constructed an inventory governance approach in the context of uncertain demand and dynamic prices based on Chinese real estate inventory management practices. Pham [40], Yoo [41], and Nam [42] revealed the relationship between real estate inventories and factors such as sales growth, installment payments, and financing policies through case studies of Vietnam and South Korea.
Real estate management performance is an important indicator to measure the virtuous cycle and sustainable development of the real estate market and economy. A higher value indicates a rational allocation of resources in the industry, which gives a boost to the healthy development of the urban economy; on the contrary, it indicates an irrational allocation of industry resources, which goes against the efficient development of the market due to wasted or insufficient resources [43]. In terms of research scale, real estate management performance research covers both macro and micro levels. The macro-scale study is based on government management performance evaluation and focuses on city and regional comparative analysis. Liu [44] quantitatively evaluated the development performance of the real estate industry in 35 cities in China by meta-frontier data envelopment analysis with a slacks-based measure, and made management recommendations at multiple levels of national and local governments and real estate companies. Chen [45] measured the efficiency of the real estate market in 70 Chinese cities by the Complexity-Entropy Binary Causal Plane Method. Chen [46] measured provincial-level real estate investment and energy efficiency in China from 2004 to 2012 by means of the Two-way Fixed Effect model. Most of the papers focus on micro-scale studies, which are grounded in the sustainability evaluation of real estate enterprises. Yang [47] and Zheng [48] conducted a quantitative evaluation of the static and dynamic efficiency of real estate firm development using DEA and TOBIT Models based on a sample of 15 and 94 representative firms in China, respectively. Nguyen [49] and Wang [50] developed a method for evaluating the efficiency of business operations by combining grey methodology and DEA, using a sample of Vietnamese real estate companies. Luo [51] analyzed the efficiency of corporate investment using Stochastic Frontier Analysis with a sample of 179 real estate companies in Canada. Atta Mills [52] analyzed the operating efficiency of real estate companies and their influencing factors using a sample of 110 listed companies and a combination of DEA-SBM and ordinary least square methods.
It should be noted that real estate development performance evaluation methods are increasing day by day, and non-parametric DEA methods are becoming more popular. Rahman [53] and Fauth [54] guided the concept of sustainable development to develop the performance of real estate enterprises; Marona [55] introduced the public management approach to real estate management practices in a Dutch metropolitan area; Ahmad [56] proposed an approach to real estate performance management using blockchain technology and platform; Guarini [57] analyzed the application of Multi-Criteria Decision Analysis Methods in the process of real estate market management. The stochastic frontier methodology [58] and vector autoregressive [59] methods have also been applied to real estate investment performance analysis. Data envelopment analysis (DEA) is a non-parametric statistical method for operations research and the study of economic production frontiers, characterized by the advantages of being free from the influence of magnitudes, weights, and human factors to produce more objective and credible results. In recent years, more and more scholars have studied real estate development performance by DEA, including a variety of models such as CCR-DEA, BCC-DEA, SBM-DEA, and Super-DEA. For example, Ferrera [60] conducted a case study of Spain by Data Envelopment Analysis and Malmquist.
In summary, how to evaluate real estate inventory dynamics, risks and performance is a widespread concern among scholars, and also a priority in the design of strategies and policies for the development of a virtuous cycle in the real estate industry [61,62]. The existing studies have achieved rich research results, however, there are some shortcomings. First, most of the papers focus on micro-scale enterprise analysis, but not enough attention is paid to the city and provincial macro-scale, not well matched with the government’s “destocking” policy design, implementation, and evaluation needs. The implementation of the “destocking” policy has led to the diversification of inter-city and inter-provincial real estate inventory evolution trends, and a prominent imbalance between demand, supply and inventory of real estate in different cities. Finding out the spatio-temporal evolution of inventory to evaluate the risk level scientifically is the premise of making management policies. However, there are still blind spots in the knowledge of scholars and governments in this area. Second, research and practice on real estate development performance assessment are on the ascendant, and scholars have discussed the performance of online real estate marketing [63], agency brokerage [64], investment trust [65,66], and futures trading [67]. Although the “destocking” policy has been implemented for many years, the inventory management performance evaluation has not received sufficient attention. For example, Wang [68] analyzed the development performance of the real estate industry in 35 large and medium-sized cities in China using a super-efficiency model, but did not include inventories (non-desired output) in the analysis framework, which compromised the accuracy and credibility of the evaluation results. Third, against the background of the rampant COVID-19 epidemic and the increasing downward economic development, the real estate industry is in recession with an increasing real estate inventory quantity and risk level, requiring an urgent need for a scientific basis for the evaluation and improvement of real estate inventory management policies in the new period.
1.3. Aim and Question
There is significant spatial heterogeneity in the level of real estate market and economic development in different cities, and there are also large differences in inventory size, type, risk level, and management performance. Therefore, rigorous scientific analysis is needed to master the inter-city similarity, heterogeneity and correlation characteristics to provide a basis for the government to formulate differentiated response policies. This research aims to solve the following three questions: (1) What are the characteristics of the dynamics of real estate inventory evolution in the Yangtze River Delta, including time series trends, geographic distribution structure, spatial clustering patterns and association characteristics? (2) How to measure the risk level of real estate inventory in the Yangtze River Delta and its changing characteristics? (3) How to evaluate the performance of real estate inventory management in the Yangtze River Delta? By exploring and analyzing the three questions, we apply the findings and conclusions to the practice of real estate inventory management in the Yangtze River Delta to provide a scientific basis for policy design, implementation, evaluation, and improvement.
2. Materials and Methods
2.1. Study Area: Yangtze River Delta (YRD)
The study area is the Yangtze River Delta, located in the lower reaches of the Yangtze River in China, bordering the Yellow Sea and the East China Sea, and at the confluence of the river and seas. The study area includes Shanghai Municipality and all administrative regions of Jiangsu, Zhejiang, and Anhui provinces, a total of 41 prefecture-level cities (Figure 1). To avoid the duplication of the English names of cities, Taizhou in Zhejiang province is abbreviated as Taizhou-ZJ, Taizhou in Jiangsu province is Taizhou-JS; Suzhou in Jiangsu province is Suzhou-JS, and Suzhou in Anhui province is Suzhou-AH to avoid confusion in this paper. The Yangtze River Delta is the intersection of the “Belt and Road” and the Yangtze River Economic Belt, and is also the most developed region in China, with a more mature real estate industry and real estate market development. The national real estate industry is currently in the stage of overcapacity, and the development of the real estate market in the Yangtze River Delta is also facing the arduous task of destocking.
Local governments in the Yangtze River Delta have included real estate “destocking” as a key task of supply-side structural reform, and have promulgated and implemented special “destocking” policies, such as Opinions of Jiangsu Provincial Government on Destocking Implementation by Supply-Side Structural Reform, Action Plan of Zhejiang Provincial Government on Real Estate Supply-Side Structural Reform, and Opinions of Anhui Provincial Government on Implementation of Destocking to Promote Stable Development of Real Estate Market. And to implement national and provincial real estate destocking strategies, over 70% of Yangtze River Delta city governments have successively formulated and implemented special policies for real estate inventory control (according to statistical analysis of policies released on the official websites of city governments as of 10 October 2022).
These policies combine the supply and demand sides, using a combination of fiscal and tax incentives, financial support tools, changes in the supply of subsidized and public rental housing, and reforms to the household registration system. On the supply side, the government should gradually include eligible immigrants in the supply of public rental housing with shantytown transformation, housing security system construction and real estate de-stocking organically bound; devote greater effort to shantytown renovation, change the traditional method of building new housing for relocation in different places, take measures to improve the monetized resettlement incentives, assist the public to purchase resettlement housing, adjust and optimize the expropriation and demolition compensation policy, and guide shantytown residents to give priority to monetized resettlement; gradually reduce or suspend the construction of new public rental housing, encourage the acquisition or long-term leasing of commercial housing in inventory or unused social housing, and accelerate the monetization of public rental housing security; give great impetus to shantytowns transformation and resettlement, gradually digest the stock of commercial housing through group purchase of commercial housing, and by building public platforms to help shantytown residents buy their own homes, or directly granting monetary compensation. On the demand side, the government should take positive countermeasures to support the agricultural migrant population to buy houses in the city, and encourage the development enterprises to give appropriate discounts on commercial housing in inventory. For agricultural migrants to buy their first house in the city, commercial banks should provide discounts and convenience in income recognition, down payment ratio, loan interest rate and repayment terms under the premise of conforming to the national policies.
With these “destocking” policies having been implemented for many years, the development dynamics of the real estate industry in different cities in the Yangtze River Delta are now changing as a result of the trade war between the US and China, national strategies and economic transformation, and the outbreak of the COVID-19 epidemic. Some cities have suspended the implementation of real estate inventory management policies; however, many cities continue to increase their “destocking” policies to meet the new challenges of a virtuous cycle and healthy development of the real estate industry.
2.2. Research Methods: Decoupling Model
2.2.1. Hotspot Analysis Tool of Geographic Information System (GIS)
The hotspot analysis tool of GIS can be used to explore the degree of integration of geographic elements and the microscopic distribution pattern of spatial aggregation, which is widely used in spatial structure research. In the specific analysis, the Getis-Ord index is calculated to classify the study area into four types: hot, sub-hot, cold, and sub-cold, thus revealing the spatial agglomeration and heterogeneity patterns of geographical phenomena. A larger absolute value of indicates a greater statistical significance as well as a lower probability of random distribution. A hotspot is a high attribute value clustering area (Z > 2.58), a coldspot is a low attribute value clustering area (Z < −2.58), and sub-hot and sub-cold spots are the relatively high and low attribute value clustering areas (1.96 < Z < 2.58 for the former, −1.96 < Z < 1.96 for the latter), respectively.
where, is the value of the real estate inventory management-related attributes indicator for each city in the Yangtze River Delta. It is the inventory of real estate in Section 3.1 and the result calculated by DEA in Section 3.3. is the spatial weight, is the number of cities in the study area, and the statistical significance of is tested by the standardized parameter [69]. test is a method for measuring the mean difference of large samples (i.e., sample size greater than 30, 41 in this paper, meeting the conditions), and it infers the probability of the difference based on the standard normal distribution theory and thus compares the two means for significant differences [70].
2.2.2. Boston Consulting Group Matrix: BCG
Real estate inventories are two-sided, and too high or too low a level is unfavorable. In the context of “destocking”, oversupply of real estate is rife. Therefore, the focus of real estate inventory management during the study period is on controlling the volume and growth rate, which is a negative phenomenon. In the analysis of enterprise management and economic development, BCG is the most commonly used research method. According to the position of different businesses in the development of the company and their growth, the business is classified into four types: star, cow, question, and dog [71]. In this paper, the BCG matrix is used to evaluate the real estate inventory risk, and the 41 cities are classified into four types of high-pressure zone, low-pressure zone, potential pressure zone, and zero-pressure zone by two indicators of relative share () and growth rate (), coupled with the average value of the Yangtze River Delta region [72]. and are calculated as:
where, represents the area of real estate inventory in city , represents the maximum area of real estate inventory among 41 cities, and represent the area of real estate inventory in city at the base and end periods, respectively, and is the study period. Based on Equations (4) and (5), the level or type of risk faced by real estate inventory management in each city of the Yangtze River Delta can be calculated and judged by using the average value of and as the threshold. There are subjective and objective methods for determining the threshold value. In general, the former includes expert consultation and recommendation by competent authorities, which directly specify a certain value (e.g., 10%) based on the actual conditions of the region; the latter includes means and medians, which are non-parametric methods driven by attribute data. There are few studies available on real estate inventory risk evaluation and management, which, coupled with limited knowledge of it in experts and government departments, makes it hard to provide an appropriate figure. To eliminate the influence of human factors, the objective method is adopted in this paper. Compared to the median, the mean can be related to each figure and reflect more adequate, reliable and stable information, so it is taken as the threshold value in this paper [73].
2.2.3. Data Envelopment Analysis Model: Super-DEA
Data Envelopment Analysis (DEA) is a linear programming model to measure the input-output efficiency of decision-making units (DMUs), which can better calculate the efficiency values of DMUs with multiple inputs and outputs. The earliest mathematical models of DEA were BCC and CCR, which were proposed based on radial and angular dispersion with no consideration of input and output slacks, which may lead to an overestimation of DMU efficiency values. K. Tone [74] proposed a non-radial and non-angular SBM (Slcks-based Measure) model in 2001 that takes slacks into account. In addition, the classical DEA model takes values in the range of , which makes it difficult to rank multiple effective DMUs (with an efficiency value of 1). To address this problem, Anderson and Petersen [75] proposed the Super-DEA model in 1993, and K. Tone [76] proposed the corresponding Super-SBM model in 2002. It should be noted that the Super-SBM model only calculates the efficiency of effective DMUs, and non-effective DMUs are still calculated using the standard SBM model based on the idea to gradually exclude effective from the DMU set while calculating the DMU efficiency. Suppose there are n decision units (41 cities in the Yangtze River Delta in this paper), labeled as (), and j represents the DMU that participates in the evaluation after eliminating the effective , labeled as (j), with a possible productive set mathematically expressed as:
where, min represents the super-efficiency value of the j-th DMU of the input-oriented, represents the i-th input () of the j-th DMU, represents the r-th output () of the j-th DMU, represents the projection value of the input and output, i.e., the input-output optimal solution, and is the constraint of the VRS (variable returns to scale) model, which is the CRS (constant returns to scale) model without that condition. In this paper, the Super-DEA model is applied to the real estate inventory management performance evaluation study to analyze the efficiency of the development and market operation of the real estate industry in the Yangtze River Delta. When min ≥ 1, the DMU is in effective or efficient state, and a larger value means indicates a higher performance level; when 1 > min ≥ 0, the DMU is in ineffective or inefficient state, and a smaller value indicates a lower performance level. In this paper, the data are processed using MAXDEA software (V8.22) developed by Beijing Ruiwo Maidi Software Co., Ltd. in China. The software output includes Technical Efficiency, Pure Technical Efficiency, Scale Efficiency, Scale Effect and Slack Variables. If the calculation has no solution, Pure Technical Efficiency is set to 1.
2.3. Research Steps and Data Sources
This study consists of four steps. In the first step, time series and spatial analysis methods are used to disclose the spatiotemporal evolution feature and dynamics of real estate inventories in the Yangtze River Delta. After the central government made real estate “destocking” a key task in December 2015, most of the local governments in the Yangtze River Delta (at both provincial and municipal levels) implemented special real estate inventory management policies in 2016. To compare and analyze the changes before and after the implementation of the policy, this paper sets the study period as 2011–2020 according to China’s “five-year” development plan, and divides it into two periods 2011–2015 and 2016–2020. The evolution of the time series of real estate inventory in the Yangtze River Delta from 2011 to 2020 is analyzed to reveal the trend of change. The cold and hotspot analysis of the geographical distribution of real estate inventory in the Yangtze River Delta in 2011, 2015, 2016 and 2020 reveals the spatial pattern. In the second step, the Boston Consulting Group Matrix is applied to identify the types of real estate inventory risks and their changes in the Yangtze River Delta from 2011 to 2015 and from 2016 to 2020, respectively. In the third step, Super-DEA and Hotspot Analysis Tool-GIS are used to measure the real estate inventory management performance of the Yangtze River Delta in 2011, 2015, 2016, and 2020, and analyze the spatial clustering pattern and association characteristics. In the fourth step, to meet the practical needs of city-specific policies, the research results of the first three steps are overlaid and analyzed to develop the Yangtze River Delta real estate inventory management policy areas, and targeted and adaptive optimization suggestions are made for each zoning to provide a basis for future government and enterprise decisions (Figure 2).
The data in this paper are mainly from the statistical yearbooks of Shanghai, Jiangsu, Zhejiang, and Anhui provinces, and some of the missing data are from the city statistical yearbooks and economic census yearbooks. Input indicators are selected mainly to consider the human, material and financial resources in the development of the real estate industry, characterized by the number of employees in real estate enterprises, construction area and investment amount, respectively [77,78]; output indicators are mainly reflected in the economic benefits created by the real estate industry, real estate market sales and inventory, characterized by the added value of the real estate industry, sales area and area for sale, respectively [79]. It is of note that in the context of “destocking”, “area for sale” is an undesired output (Table 1). There are two prerequisites for the selection of DMUs in the DEA model [80]: (1) DMUs must be with the same attributes and characteristics, i.e., they are comparable. DMUs in this paper are 41 prefecture-level cities in the Yangtze River Delta, and they are eligible for comparability. (2) The number of DMUs should not be less than the input indicator multiplied by the output indicator, and not less than 3 times the product of input and output indicators, that is, . There are 3 input and output indicators, respectively, and , in this paper, meeting the requirements.
3. Results
3.1. Evolution Dynamics
3.1.1. Change Trend
The change trends are classified into five types: growing, stable, inverted U-shaped, S-shaped, and N-shaped according to the time series analysis of real estate inventory quantity in the Yangtze River Delta, where more than 70% of the cities show an inverted U-shaped trend, including Nanjing, Wuxi, Changzhou, Suzhou-JS, Nantong, Lianyungang, Huai’an, Yancheng, Taizhou-JS, Suqian, Hangzhou, Ningbo, Wenzhou, Jiaxing, Huzhou, Shaoxing, Zhoushan, Taizhou-ZJ, Wuhu, and Bengbu. Real estate inventories in Shanghai and Xuzhou continue to grow rapidly, while real estate inventories in Quzhou and Lishui remain stable. Real estate inventories in Tongling and Fuyang change in an S-shaped trend, showing a rapid growth in the early stage and remaining stable in the later stage. Real estate inventories in Yangzhou, Zhenjiang, Jinhua, Hefei, Bozhou and Chizhou changed in an N-shaped trend, showing a rapid growth in the early stage, rapid decline in the middle stage due to the implementation of “destocking” policies, and rapid rise again in the later stage due to the outbreak of COVID-19 epidemic and economic development (Figure 3).
Real estate inventories in most Yangtze River Delta cities remained rapid positive-growth from 2011 to 2020, with all cities in a state of high positive-growth from 2011 to 2015 and most cities in a state of negative growth from 2016 to 2020. The average real estate inventory growth rate in the Yangtze River Delta from 2011 to 2015 was 42.53%, with 34.15% of cities above the average, including Bozhou, Yancheng, Tongling, Zhoushan, Suqian, Lu’an, Chuzhou, Nantong, Taizhou-JS, Anqing, Changzhou, Xuancheng, Ningbo, Suzhou-AH, especially Bozhou, Yancheng, Tongling with growth rates close to or above 100%. Most cities saw a negative growth from 2016 to 2020 due to the “destocking” policy and the outbreak of the COVID-19 epidemic, while only Hefei, Shanghai, Xuzhou, Zhenjiang and Yancheng maintained low positive-growth. The average growth rate for 2016–2020 was −10.66%, with 41.46% of cities exceeding the average, including Hefei, Shanghai, Xuzhou, Zhenjiang, Yancheng, Tongling, Suzhou-JS, Lishui, Chizhou, Wuhu, Jinhua, Changzhou, Quzhou, Bozhou, Huangshan, Yangzhou, and Wuxi. The average growth rate from 2011 to 2020 was 27.25%, and 39.02% of cities exceeded the average, including Bozhou, Tongling, Yancheng, Zhoushan, Suqian, Anqing, Changzhou, Lu’an, Taizhou-JS, Chizhou, Zhenjiang, Wuhu, Nantong, Taizhou-ZJ, Lishui, and Fuyang (Table 2).
A growth of 23,800 m2 was seen from 2011 to 2015 on average, with Nantong, Shanghai, Hangzhou, Ningbo, Changzhou, Suzhou-JS, Yancheng, Shaoxing, Wuxi, Taizhou-JS, Jiaxing, Zhenjiang, Huzhou, Nanjing, Suqian, and Chuzhou exceeding the average, and Nantong having the largest increase of 3.5 times the average. The average reduction from 2016 to 2020 was 0.98 m2, with Suzhou-JS, Yangzhou, Wenzhou, Maanshan, Changzhou, Suqian, Chuzhou, Taizhou-ZJ, Nanjing, Taizhou-JS, Huzhou, Jiaxing, Wuxi, Ningbo, Hangzhou, Shaoxing, and Nantong exceeding the average, and Nantong having the largest decrease of 5.4 times the average. The average change in real estate inventory in the Yangtze River Delta from 2011 to 2020 was 12.5 million m2, with Shanghai, Nantong, Yancheng, Changzhou, Suzhou-JS, Ningbo, Zhenjiang, Wuxi, Taizhou-JS, Tongling, Suqian Yangzhou, Hangzhou, and Jinhua above the average, and Shanghai having the largest change of 9.5 times the average.
3.1.2. Spatial Pattern
The Gini indexes of real estate inventories in the Yangtze River Delta in 2011, 2015, 2016, and 2020 were 0.45, 0.57, 0.63, and 0.67, respectively, all greater than 0.4 and on the rise, indicating significant spatial heterogeneity [81]. The Moran’s indexes of real estate inventory in the Yangtze River Delta in 2011, 2015, 2016, and 2020 were 0.26 (Z = 3.41, p < 0.01), 0.47 (Z = 4.69, p < 0.01), 0.49 (Z = 4.82, p < 0.01), and 0.23 (Z = 3.57, p < 0.01), respectively, with a significant positive spatial autocorrelation, and the spatial correlations first increased and then decreased [82]. The hotspot concentration of real estate inventory in the Yangtze River Delta has long been stable in the Shanghai metropolitan area, including Shanghai, Nantong, Suzhou and Jiaxing. Sub-hotspots are distributed in their periphery, but the spatial extent and geographical distribution vary considerably in different years. In 2010, they were mainly found in Hangzhou, Huzhou, Jinhua and Shaoxing in northern Zhejiang and Wuxi, Changzhou and Zhenjiang in southern Jiangsu. Coverage shrank significantly in 2015 to only Huzhou and Shaoxing in Zhejiang and expanded northward to Taizhou in Jiangsu. Coverage expanded significantly in Zhejiang in 2016 but remained unchanged in Jiangsu. It still remained unchanged in Jiangsu in 2020, and shrank rapidly to Huzhou in Zhejiang. The coldspot cities are mainly located in the inland region, mostly clustered in Anhui and western Zhejiang. In 2010, the coldspot cities were mainly clustered in Huaihai Economic Zone and extended along the central part to the southern part of Anhui. In 2015, 2016 and 2020, the coldspot cities were largely the same in spatial pattern, basically covering all of Anhui and extending to northern Jiangsu and the western edge of Zhejiang. Most of the sub-coldspot cities were clustered in Jiangsu and Zhejiang, which were the transition areas of cold and hot spots (Figure 4). In general, the real estate inventory in the Yangtze River Delta has meaningful spatial differentiation, agglomeration and correlation, cold and hot spot cities characterized by a “center-periphery” spatial pattern in geographical distribution.
3.2. Risk Evaluation
3.2.1. Risk Pattern in 2011–2015
The average relative share in 2015 was 0.18 and the average growth rate from 2011 to 2015 was 42.53%, which were used as thresholds for real estate inventory risk zoning and evaluation. For the mean threshold method, two options of the study area mean, and the national mean of China are feasible. The former is more beneficial to analyzing the geographical characteristics of the Yangtze River Delta and the latter is more beneficial to nationwide comparisons. Since the objective of the analysis in this section is to provide a basis for inventory management in the Yangtze River Delta and to improve the precision of the policy design, the study area mean is used in this paper. Along with the accumulation of research information and knowledge, the national mean, expert consultation value, and government recommendation value can be considered as thresholds in future analysis to facilitate comparative analysis across regions. Changzhou, Nantong, Yancheng, Taizhou-JS, and Ningbo were high-pressure zone, mostly concentrated in the coastal area of Jiangsu. Shanghai, Nanjing, Wuxi, Suzhou-JS, Zhenjiang, Hangzhou, Jiaxing, Huzhou, and Shaoxing were low-pressure zones, mainly concentrated in the junction area of southern Jiangsu and northern Zhejiang. Suqian, Zhoushan, Tongling, Anqing, Chuzhou, Suzhou-AH, Lu’an, Bozhou, and Xuancheng were potential pressure zones, scattered in Anhui. Xuzhou, Lianyungang, Huai’an, Yangzhou, Wenzhou, Jinhua, Quzhou, Taizhou-ZJ, Lishui, Hefei, Wuhu, Bengbu, Huainan, Maanshan, Huaibei, Huangshan, Fuyang, and Chizhou were zero pressure zones, distributed in bands in Anhui and Jiangsu and clustered in southwestern Zhejiang (Figure 5).
3.2.2. Risk Pattern in 2016–2020
The average relative share in 2020 was 0.10 and the average growth rate from 2016 to 2020 was −10.66%, which were used as thresholds for real estate inventory risk zoning and evaluation. Shanghai, Wuxi, Changzhou, Suzhou-JS, Yancheng, Zhenjiang, and Hefei were high-pressure zones and clustered in the south Jiangsu region in a band. Nantong, Hangzhou, Ningbo and Shaoxing were low-pressure zones and clustered in the central part of Zhejiang in a band. Xuzhou, Yangzhou, Jinhua, Quzhou, Lishui, Wuhu, Tongling, Huangshan, Bozhou, and Chizhou were potential pressure zones, and they formed two relative agglomerations in southern Anhui and western Zhejiang. Nanjing, Lianyungang, Huai’an, Taizhou-JS, Suqian, Wenzhou, Jiaxing, Huzhou, Zhoushan, Taizhou-ZJ, Bengbu, Huainan, Maanshan, Huaibei, Anqing, Chuzhou, Fuyang, Suzhou-AH, Lu’an, and Xuancheng were zero pressure zones, clustered in a finger-like contiguous distribution in the Yangtze River Delta (Figure 5).
3.2.3. Risk Level Change
By the risk type change, the proportion of cities with higher, lower or unchanged risk levels is largely the same. Shanghai, Wuxi, Xuzhou, Suzhou-JS, Yangzhou, Zhenjiang, Jinhua, Quzhou, Lishui, Hefei, Wuhu, Huangshan, and Chizhou saw an increase in the risk level. In particular, Shanghai, Wuxi, Suzhou-JS, Zhenjiang, and Hefei changed from low-risk to high-risk areas, requiring government policy intervention for inventory management. The risk levels of Changzhou, Lianyungang, Huai’an, Yancheng, Hangzhou, Wenzhou, Shaoxing, Taizhou-ZJ, Bengbu, Huainan, Maanshan, Huaibei, Tongling, Fuyang, and Bozhou remained unchanged. In particular, Changzhou and Yancheng have long been high-risk zones and effective countermeasures must be taken; Hangzhou and Shaoxing have long been low-risk zones, and appropriate measures should also be taken. Nanjing, Nantong, Taizhou-JS, Suqian, Ningbo, Jiaxing, Huzhou, Zhoushan, Anqing, Chuzhou, Suzhou-AH, Lu’an, and Xuancheng experienced a decreasing risk level, and although Nantong and Ningbo have changed from high-risk to low-risk zones, city governments still have to continue “destocking” in the future.
3.3. Management Performance
3.3.1. Technical Efficiency
The hotspot cities are concentrated in Anhui and northern Jiangsu, mostly in Jiangsu although the agglomeration areas are moving southward. In 2011, the coldspot cities were clustered in the junction area of Anhui, Jiangsu and Zhejiang provinces, while in 2015, most of the coldspot cities were distributed in the south of Anhui and central Zhejiang in a band, forming a small cluster in the north of Anhui. The distribution pattern of coldspot cities in 2016 and 2020 was similar to that in 2015, with a geographical scope shrinking to southern Anhui eventually. Sub-hotspot cities were clustered in western Anhui in 2011, while distributed in the periphery of the hotspot cities as well as southern Zhejiang in 2015, 2016 and 2020. As transition areas, sub-hotspot cities have long been relatively clustered and distributed in Anhui and Zhejiang (Figure 6).
The maximum values of technical efficiency indexes in 2011, 2015, 2016 and 2020 were 2.32 (Bozhou, with no solution, and pure technical efficiency set to 1), 1.17 (Chuzhou), 1.16 (Hefei) and 1.15 (Chuzhou), respectively, decreasing progressively. The minimum values were 0.23 (Wenzhou), 0.32 (Suzhou-AH), 0.31 (Tongling), and 0.42 (Zhoushan), showing a steady rise. The cities in effective status reached 24.39%, 43.90%, 34.15%, and 36.59%, respectively, and the average effective city technical efficiency indexes were 1.26, 1.05, 1.07, and 1.06, respectively, while the average ineffective city indexes were 0.45, 0.57, 0.63, and 0.67, respectively (Table 3). Using them as thresholds, the study area is classified into four types of super-efficiency, efficiency, inefficiency, and super-inefficiency (subsequently, pure technical efficiency and scale efficiency are also handled in the same way). There were a small number of super-efficiency cities and they were geographically scattered in distribution, with relative clustering only in the central border areas of Jiangsu and Anhui in 2015 and 2020. Efficiency cities were located in the periphery of super-efficiency cities, mostly in Jiangsu. Inefficiency cities were scattered in distribution in 2011 and 2015, mostly located in the marginal regions or border areas of provincial administrative regions; they were relatively clustered in Jiangsu in 2016 and most were concentrated in Zhejiang in 2020. There were a large number of super-inefficiency cities, and they were clustered at the junction of Anhui, Jiangsu and Shanghai in 2011, expanding northward along central Anhui. Two independent agglomerations took shape in 2015 and 2016 in the north and south ends of Anhui and central Zhejiang, and the two agglomerations were mutually extended and connected as one in 2020 (Figure 7).
3.3.2. Pure Technical Efficiency
There was a great number of hotspot cities in 2011, mostly concentrated in northern Jiangsu; hotspot cities decreased rapidly in 2015, 2016, and 2020, and were subsequently geographically dispersed, except for 2015 when they were relatively clustered in southwestern Zhejiang. Coldspot cities in 2011 and 2015 were steadily clustered in northern Zhejiang, including Hangzhou, Huzhou, Shaoxing and Ningbo. In 2016, the coldspot cities rapidly shrank to only Hangzhou, Shaoxing and Bengbu, but they experienced rapid expansion in 2020, and were clustered along central Zhejiang and Anhui in a band. As transition areas, sub-cold and sub-hotspot cities were distributed on the periphery of the cold and hot spot cities respectively, forming a “center-periphery” spatial structure (Figure 8).
The maximum values of pure technical efficiency indexes in 2011, 2015, 2016, and 2020 were 1.59 (Suqian), 2.54 (Lishui), 1.41 (Lishui), and 1.71 (Chuzhou), respectively, with an N-shaped variation. The minimum values were 0.29 (Jiaxing), 0.34 (Suzhou-AH), 0.51 (Shaoxing), and 0.55 (Huzhou), showing a rising trend. The cities in effective status reached 51.22%, 58.54%, 58.54%, and 56.10%, respectively, and the average technical efficiency indexes of effective cities were 1.16, 1.16, 1.11, and 1.14, respectively, while the average ineffective city indexes were 0.56, 0.61, 0.70, and 0.72, respectively (Table 4). There were a small number of super-efficiency cities, relatively dispersed for a long time in geographical distribution. The efficiency cities were distributed in a band, mostly clustered in Anhui in 2011 and expanding along the central region of the province toward Jiangsu. Most cities gather in Jiangsu in 2015 and expanded along the central part towards Anhui. In 2016, they were clustered in western Anhui, the coastal zone of Jiangsu, and the Nanjing metropolitan area, largely balanced in Jiangsu and Anhui. Most cities gather in Jiangsu in 2020 and extended to the Hefei metropolitan area in Anhui. In 2011, the inefficiency cities were clustered in central Zhejiang, Anhui and central Jiangsu in a belt-like pattern, clustered in southern Jiangsu and Hangzhou Bay region in clusters in 2015, and dispersed in 2016 and 2020. The super-inefficiency cities were clustered along the borderline of Anhui, Zhejiang, and Jiangsu provinces in 2011 in a band, scattered in 2015 and 2016, and clustered in Zhejiang and northern Anhui provinces in 2020 (Figure 9).
3.3.3. Scale Efficiency and Scale Effect
The hotspot cities were gathered in northern Anhui and northern Jiangsu in 2011 in a band, and distributed in Jiangsu in 2015, 2016 and 2020 in clusters. The sub-hotspot cities were distributed in the periphery of the hotspot cities, extending to Zhejiang in a finger shape in 2015 and 2016, and expanding to Anhui and central Zhejiang in a cluster shape in 2020. The coldspot cities grew into three clusters in the Shanghai metropolitan area, eastern Anhui in 2011, showed a banded cluster in Anhui and southwestern Zhejiang in 2015, and gradually shrank to a small cluster in southwestern Anhui in 2016 and 2020. Most of the sub-hotspot cities in 2011 and 2015 were clustered in Anhui, forming a large agglomeration in Anhui and a small agglomeration in southwestern Zhejiang in 2016, and two cluster-like small agglomerations in northwestern Anhui and southwestern Zhejiang in 2020 (Figure 10).
The maximum values of scale efficiency indexes in 2011, 2015, 2016 and 2020 were 2.32 (Bozhou), 0.99896 (Wuhu), 0.99999 (Yangzhou) and 0.99643 (Changzhou), respectively, with very few or no effective cities. The minimum values were 0.22 (Wenzhou), 0.33 (Chizhou), 0.32 (Huaibei), and 0.35 (Chizhou), showing a steady rise. And the average ineffective city indexes were 0.72, 0.87, 0.84, and 0.87, respectively (Table 4). In 2011, all cities were ineffective for all years except Bozhou, which was a super-efficiency city. Most of the inefficient cities were clustered in Jiangsu and Anhui in 2011, and extended to central Zhejiang. They fully covered Jiangsu and most of Zhejiang in 2015 and expanded to eastern Anhui. In 2016 and 2020 inefficient cities were clustered in Jiangsu and Anhui and extended to Zhejiang. In 2011, super-inefficient cities were distributed in a zonal cluster along the Shanghai-Hefei development axis and in the west of Zhejiang. Most of the super-inefficient cities in 2015 were clustered in western and southwestern Anhui and extended to the western fringe of Zhejiang. They were gathered in the border area of Anhui and Zhejiang in 2016 and 2020, but their geographical area coverage was shrinking (Figure 11).
According to the scale effect and its change characteristics in 2011, 2015, 2016 and 2020, the scale effect of real estate inventory in YRD is classified as long-term—increasing returns to scale, increasing returns to scale, return to scale from increasing to decreasing, decreasing returns to scale, and long term—decreasing returns to scale. Shanghai, Nanjing, Wuxi, Suzhou-JS, Hangzhou, Ningbo, Shaoxing, and Hefei were areas with long-term—increasing returns to scale. Xuzhou, Changzhou, Nantong, Yancheng, Wenzhou, and Jiaxing were areas with increasing returns to scale; Huai’an and Yangzhou were areas with a return to scale from increasing to decreasing; Lianyungang, Zhenjiang, Taizhou-JS, Taizhou-ZJ, Wuhu, Anqing, Chuzhou, and Fuyang were areas with decreasing returns to scale; Suqian, Huzhou, Suzhou-AH, Lu’an and Xuancheng were areas with long term—decreasing returns to scale (Table 5).
4. Discussion
The findings of this paper are similar to those of some scholars, but some of the conclusions are not fully consistent or even contrary. Using a sample of 35 typical cities in China, Zhao [83] concluded that urban real estate inventories are huge, with significant spatial heterogeneity and diverse trends of change. Chen [84] further pointed out that the Chinese government’s destocking policies have been less effective than expected, and the efficiency of destocking and total factor productivity varies greatly across cities, making it impossible to use a uniform policy to effectively address the high real estate inventory problem. Li [85] further demonstrated that China’s real estate inventory management performance is unsatisfactory with no improvement despite strong policy interventions by the central and local governments by analyzing the performance of real estate inventory management in provincial administrative regions in China. Fan [86] and Chen [87] found that urban real estate is inefficient, spatially correlated and clustered, and significantly characterized by geographically distributed clubs based on a case study of the Yangtze River Economic Belt and Jilin Province, which is consistent in nature with the positive spatial autocorrelation in this paper.
Meanwhile, papers that analyze real estate efficiency by DEA mainly focus on the provincial scale, and they present similar findings despite differences with the city scale in this paper. For example, Liu [88] and Fang [89] concluded that the development efficiency of China’s provincial real estate industry is low, which is largely consistent with the findings of this paper. Unfortunately, they did not include inventories in the research framework and since their studies were conducted early, they mainly discussed the situation before 2015, with a weak correlation to the latest round of real estate “destocking” policies. Notably, Li [90] argued that the redundancy rate of provincial real estate land inventories in China exceeds 60% and that land inventories can be considered as a type of potential real estate inventory, thus, it reflects to some extent, the impact of inventory management.
Besides, some of the findings in this paper are not entirely consistent with or even contrary to some scholars. For example, Zeng [91] concluded that provincial real estate development in China is efficient, which does not agree with the findings of this paper—more than half of the cities fail to reach an ideal state in real estate inventory management performance. The inconsistency may be due to differences in the study scale (province vs. city) or may be influenced by differences in the choice of input and output indicators. Zeng used completed area and land in inventory instead of sales area and housing inventory in this paper, where completed area represents supply rather than demand, and land in inventory represents potential inventory, so the indicators in this paper are more consistent with the reality of real estate inventory management with higher accuracy.
In summary, the geographical distribution of real estate inventory in the Yangtze River Delta is characterized by a significant spatial effect, and the adverse development trend of real estate inventory in the Yangtze River Delta has been curbed to a certain extent since the implementation of the “destocking” policy. However, high inventories are still a huge risk to the economic development of many cities, and the trend of real estate inventory changes, risk levels, and management performance in different cities are increasingly divergent. Therefore, these cities should adopt city-specific policies in the future to actively control the risk of real estate inventory, progressively improve inventory management performance, and actively cope with the impact of the COVID-19 epidemic and economic downturn, to achieve a virtuous cycle and sustainable development of the real estate industry and enterprises. Overlaying the results of risk and performance evaluation in 2016–2020 and 2020 with the characteristics of real estate inventory evolution dynamics, this paper divides the real estate inventory management in the Yangtze River Delta into four types of policy areas: red key area, yellow important area, green auxiliary area, and path-dependent area.
Wuxi and Zhenjiang were in the red key area with their real estate inventories in a high-pressure zone and their inventory management performance in an inefficient or super-inefficient state, so they should reduce risk while improving efficiency in the future policy design. Shanghai, Changzhou, Suzhou-JS, Yancheng, Hangzhou, Ningbo, Shaoxing, Jinhua, Quzhou, Lishui, Hefei, Wuhu, Tongling, Huangshan, Bozhou, and Chizhou were in a yellow important area, accounting for about 40%. Cities in such policy areas should selectively introduce risk control or performance enhancement strategies in the future based on their own inventory characteristics. (1) When real estate inventories are in the high-pressure zone, the inventory management performance is in the efficiency or super-efficiency state, and the focus of future policy design should be on risk reduction. (2) When real estate inventories are in the low or potential pressure zone with inventory management performance in inefficiency or super-inefficiency, the focus of the future policy design should be on improving efficiency. Xuzhou, Nantong, Lianyungang, Yangzhou, Suqian, Jiaxing, Huzhou, Zhoushan, Taizhou-ZJ, Huainan, Maanshan, Huaibei, Anqing, Suzhou-AH, Lu’an, and Xuancheng were in green auxiliary area, accounting for about 40%. The focus of urban inventory management in this policy area should be placed on good risk warning and performance optimization, which can be further divided into two subcategories: (1) when real estate inventory is in a low or potential pressure zone, and the inventory management performance is in efficiency or super-efficiency, the focus of the future policy design should be on further control or timely warning of risk. (2) When real estate inventories are in the zero-pressure zone, with inventory management performance in inefficiency or super-inefficiency, the focus of future policy design is to learn from benchmarks to further improve inventory management performance and industrial development efficiency. Nanjing, Huai’an, Taizhou-JS, Wenzhou, Bengbu, Chuzhou, and Fuyang were in path-dependent areas. Their real estate inventories were in the zero-pressure zone and their inventory management performance was in efficiency or super-efficiency. For them, the focus of the future policy design should be placed on maintaining the status quo and encouraging inventories to play a healthy role in the virtuous cycle and sustainable development of the real estate industry (Figure 12).
In the process of risk control and performance improvement, all cities involved should adopt a combination of goal-oriented and problem-oriented approaches. In real estate inventory management risk control: firstly, cities with high inventory risk should improve public service facilities and supports in a targeted manner, especially accelerate their completion in the fields of public transportation, education, medical, commercial and other public services in the area with concentrative stock, make transportation more accessible and life more convenient, and promote the sale of commercial housing in inventory. Secondly, the government should give full play to the key role of land “gates” to regulate the real estate market and reasonably control the pace of land supply; It should carry out a systematic survey on the quantity, type and distribution of real estate inventory, and in areas with large inventory quantities and long depletion cycles, reasonably determine the scale and structure of land supply for real estate development according to the market supply and demand, as well as regulatory requirements, to promote a balanced total supply and demand and structural optimization of real estate. It should reasonably determine the annual scale of residential land supply according to housing construction planning and annual implementation plans, taking into account the area of housing available for sale, the number of residential sites not yet under construction and the completion of the task of de-stocking, and should reduce or suspend the land supply for cities with high long-term inventory risk. Thirdly, the government should, according to market conditions and in compliance with the overall plan, study the conversion program for the use of approved but undeveloped real estate land, and guide the transformation and utilization of the land by adjusting land use and planning conditions to form an effective supply. In performance improvement of real estate inventory management: First, they need to choose advanced cities as the “benchmark” and use higher quality as the “standard” to define their future development goals (Table 6). Second, for cities with obvious shortcomings, a precise adjustment strategy should be developed in relation to the problem and its causes (Table 7). For example, Wuxi should reasonably control employees (reducing by 0.05 million employees) and investment amount (reducing by 550,000 yuan) based on the benchmark of Nantong (0.42), Yangzhou (0.26), Suzhou-JS (0.18), and Taizhou-JS (0.14); and Zhenjiang should fully control employees (reducing by 0.28 million employees), construction area (reducing by 6.25 million m2), investment amount (reducing by 450,000 yuan) based on the benchmark of Taizhou-JS (0.50), Chizhou (0.26), and Huai’an (0.24).
5. Conclusions
Based on the GIS tool coupled with BCG and Super-DEA models, this paper quantitatively analyzes the evolution dynamics, risk types and performance levels of real estate inventories in 41 cities of the Yangtze River Delta in the context of “destocking” from 2011 to 2020, and reaches the following conclusions:
- (1)
- The geographical distribution of real estate inventories in the Yangtze River Delta shows significant spatial effects, with hotspot cities clustered in the coastal Shanghai metropolitan area and coldspot cities in the inland region. From the analysis of real estate inventory trend, speed, quantity and spatial pattern, the policy of “destocking” has achieved some results, and the real estate inventory trajectory of most cities in the Yangtze River Delta are in an “inverted U-shape”, changing from the early positive growth at a high speed to the recent negative growth. It should be noted that real estate inventories in the Yangtze River Delta have long remained positive, with Bozhou and Tongling growing even by more than 100% and only Nanjing and Maanshan seeing slight negative growth, therefore, city governments and real estate companies are still facing greater pressure and challenges in inventory management.
- (2)
- The inter-city differentiation and spatial agglomeration of real estate inventory risks are becoming more significant, and the proportion of cities with higher, lower or unchanged risk levels is basically the same. There is a small number of cities in the high-pressure zone, which were early clustered in the coastal region of Jiangsu in a band, but they are currently clustered in Shanghai and southern Jiangsu. Cities in the low-pressure zone are clustered in the Hangzhou Bay region, and the geographical coverage has shrunk significantly. The potential pressure zone covers an increasing area, with the geographical distribution changing from zonal agglomeration to finger-like agglomeration. There are few cities in the zero-pressure zone, and they are scattered in distribution. It is of note that Changzhou and Yancheng have been in the high-risk zone for a long time, while Shanghai, Wuxi, Suzhou-JS, Zhenjiang, and Hefei have changed from low-risk to high-risk areas, requiring the government to optimize the “destocking” policy and continue to promote the management of the high real estate inventory.
- (3)
- The performance of real estate inventory management is unsatisfactory, and the cities in an effective state have remained stable at 30–40% despite a steady rise in the average efficiency index. For technical efficiency, pure technical efficiency, and scale efficiency, the geographical distribution of cold and hot cities shows a “center-periphery” spatial pattern. The 41 cities in the study area can be divided into four types of super-efficiency, efficiency, inefficiency, and super-inefficiency, and scale effects appear as long-term—increasing returns to scale, increasing re-turns to scale, return to scale from increasing to decreasing, decreasing returns to scale, and long-term—decreasing returns to scale.
- (4)
- Overlaying the results of real estate inventory dynamics, risk and performance evaluation, this paper divides the real estate inventory management in the Yangtze River Delta into four types of policy areas, and about 80% of cities are in red key and yellow important areas. Wuxi and Zhenjiang are in the red key area, and they should reduce risk while improving efficiency in the future policy design. Forty percent of the cities are in a yellow important area, and in the future, they should selectively design and implement policies to reduce risks or improve efficiency in accordance with their actual conditions. Forty percent of the cities are in green auxiliary areas, and they should focus on preventing increased risk and reduced efficiency in the future policy design. The rest of the cities are in path-dependent areas, and they should focus on maintaining the status quo in the future policy design. All cities should adhere to goal-oriented real estate inventory management and take advanced cities as a benchmark for development in the future. In particular, cities in a red key area and the yellow important area should control the redundancy of factors to further reduce risks and improve performance.
The biggest innovation of this paper is that it integrates the four points of real estate inventory “evolution dynamics—risk analysis—performance evaluation—policy design”, and builds a new approach to real estate inventory management research and practice in the new era. In past research, the four points were often separated, leading to frequent problems in the translation of theoretical findings to practical applications. Based on the analysis of real estate inventory change trends and spatial patterns in different cities, this paper quantitatively evaluates the real estate inventory risk and management performance, clarifies the pressure, potential, capacity, as well as the focus and difficulty of real estate destocking in different cities, and significantly improves the accuracy, adaptability and efficiency of real estate destocking policies of the government and enterprises. In addition, applying BCG in the field of business management to real estate inventory risk evaluation and applying super-DEA in operations research to real estate inventory management performance evaluation are also the innovations of this paper, which are complementary and patchy micro-innovations to the deficiencies of published papers.
There are also some limitations in the study of this paper. First, real estate inventories are highly complex, and they are not the same in structure across cities. Real estate includes a variety of types such as residential, office, commercial, industrial, agricultural, special-purpose and mixed-use housings. The type of excess real estate is not the same in each city due to the stage of urban development and market supply and demand. This paper takes them as a whole with no separate analysis, which may affect the practical application of the study results. Second, the driving mechanisms of real estate inventory changes vary widely across cities, and the factors affecting inventory risk levels and management performance are inconsistent, yet they are not analyzed in depth in this paper. In our future research, we will focus on addressing the aforementioned issues and analyzing the dynamic characteristics of different types of real estate inventories and their driving mechanisms.
Author Contributions
Conceptualization, W.L. and P.Z.; methodology, W.L. and S.Z.; software, K.Z. and P.Z.; validation, W.L., S.Z. and P.Z.; formal analysis, H.C. and S.Z.; investigation, W.L., P.Z. and S.Z.; resources, S.Z., K.Z. and H.C.; data curation, K.Z., W.L. and H.C.; writing—original draft preparation, P.Z., S.Z. and H.C.; writing—review and editing, W.L. and S.Z.; visualization, S.Z. and K.Z.; supervision, W.L. and H.C.; project administration, P.Z. and H.C.; funding acquisition, P.Z. and H.C. All authors have read and agreed to the published version of the manuscript.
Funding
This research was funded by “Zhejiang Provincial Philosophy and Social Sciences Planning Project (22JCXK13YB)”.
Data Availability Statement
Most of the data can be obtained by visiting the following links: https://tjj.sh.gov.cn/tjnj/index.html (accessed on 13 August 2022), http://tj.jiangsu.gov.cn/col/col83749/index.html (accessed on 21 August 2022), http://tjj.zj.gov.cn/col/col1525563/index.html (accessed on 7 September 2022), and http://tjj.ah.gov.cn/ssah/qwfbjd/tjnj/index.html (accessed on 15 September 2022).
Acknowledgments
We thank the reviewers for their valuable and constructive suggestions, as well as the selfless help of Zheng Yanan and Tian Fengyu in the process of inviting and submitting paper.
Conflicts of Interest
The authors declare no conflict of interest.
References
- Jakimowicz, A.; Kulesza, S. The Mechanism of Transformation of Global Business Cycles into Dynamics of Regional Real Estate Markets. Acta Phys. Pol. A 2018, 133, 1351–1361. [Google Scholar] [CrossRef]
- Zhao, S.; Zhao, K.; Zhang, P. Spatial Inequality in China’s Housing Market and the Driving Mechanism. Land 2021, 10, 841. [Google Scholar] [CrossRef]
- Song, J.S.; van Houtum, G.J.; Van Mieghem, J.A. Capacity and Inventory Management: Review, Trends, and Projections. MSOM-Manuf. Serv. Oper. Manag. 2020, 22, 36–46. [Google Scholar] [CrossRef]
- Gutierrez, V.; Vidal, C.J. Inventory management models in supply chains: A literature review. Rev. Fac. Ing.-Univ. Antioq. 2008, 43, 134–149. [Google Scholar]
- Seg, M. The impact of taxing vacancy on housing markets: Evidence from France. J. Public Econ. 2020, 185, 104079. [Google Scholar] [CrossRef]
- Monkkonen, P. Empty houses across North America: Housing finance and Mexico’s vacancy crisis. Urban Stud. 2019, 56, 2075–2091. [Google Scholar] [CrossRef]
- Jang, H.; Song, Y.; Sohn, S.; Ahn, K. Real Estate Soars and Financial Crises: Recent Stories. Sustainability 2018, 10, 4559. [Google Scholar] [CrossRef] [Green Version]
- Emmi, P.C.; Magnusson, L. The Predictive Accuracy of Residential Vacancy Chain Models. Urban Stud. 1994, 31, 1117–1131. [Google Scholar] [CrossRef]
- Emmi, P.C.; Magnusson, L. Further Evidence on the Accuracy of Residential Vacancy Chain Models. Urban Stud. 1995, 32, 1361–1367. [Google Scholar] [CrossRef]
- Ben-Shahar, D.; Sulganik, E. Vacancy chains and the degree of mobility in the housing market. Ann. Reg. Sci. 2011, 47, 569–583. [Google Scholar] [CrossRef]
- Ferrari, E. Conceptualising Social Housing within the Wider Housing Market: A Vacancy Chain Model. Hous. Stud. 2011, 26, 95–116. [Google Scholar] [CrossRef]
- Miceli, T.J.; Sirmans, C.F. Efficiency rents: A new theory of the natural vacancy rate for rental housing. J. Hous. Econ. 2013, 22, 20–24. [Google Scholar] [CrossRef] [Green Version]
- Vandell, K.D. Tax structure and natural vacancy rates in the commercial real estate market. Real Estate Econ. 2003, 31, 245–267. [Google Scholar] [CrossRef]
- Shen, X.Y.; Huang, X.J.; Li, H.; Li, Y.; Zhao, X.F. Exploring the relationship between urban land supply and housing stock: Evidence from 35 cities in China. Habitat Int. 2018, 78, 80–89. [Google Scholar] [CrossRef]
- Gabriel, S.A.; Nothaft, F.E. Rental housing markets, the incidence and duration of vacancy, and the natural vacancy rate. J. Urban Econ. 2001, 49, 121–149. [Google Scholar] [CrossRef] [Green Version]
- Wang, H.Y. Stickiness of rental rate and housing vacancy rate. Econ. Lett. 2020, 195, 109487. [Google Scholar] [CrossRef]
- Tse, R.Y.C.; MacGregor, B.D. Housing vacancy and rental adjustment: Evidence from Hong Kong. Urban Stud. 1999, 36, 1769–1782. [Google Scholar] [CrossRef]
- Whitaker, S.; Fitzpatrick, T.J. Deconstructing distressed-property spillovers: The effects of vacant, tax-delinquent, and foreclosed properties in housing submarkets. J. Hous. Econ. 2013, 22, 79–91. [Google Scholar] [CrossRef]
- Boessen, A.; Chamberlain, A.W. Neighborhood crime, the housing crisis, and geographic space: Disentangling the consequences of foreclosure and vacancy. J. Urban Aff. 2017, 39, 1122–1137. [Google Scholar] [CrossRef]
- Jones, R.W.; Pridemore, W.A. A Longitudinal Study of the Impact of Home Vacancy on Robbery and Burglary Rates During the US Housing Crisis, 2005–2009. Crime Delinq. 2016, 62, 1159–1179. [Google Scholar] [CrossRef]
- Chen, X.J.; Rafail, P. Do Housing Vacancies Induce More Crime? A Spatiotemporal Regression Analysis. Crime Delinq. 2020, 66, 1579–1605. [Google Scholar] [CrossRef]
- McClure, K. The allocation of rental assistance resources: The paradox of high housing costs and high vacancy rates. Int. J. Hous. Policy 2019, 19, 69–94. [Google Scholar] [CrossRef]
- Vakili-Zad, C.; Hoekstra, J. High dwelling vacancy rate and high prices of housing in Malta a mediterranean phenomenon. J. Hous. Built Environ. 2011, 26, 441–455. [Google Scholar] [CrossRef] [Green Version]
- Wang, L.Y.; Fan, H.; Wang, Y.K. An estimation of housing vacancy rate using NPP-VIIRS night-time light data and OpenStreetMap data. Int. J. Remote Sens. 2019, 40, 8566–8588. [Google Scholar] [CrossRef]
- Pan, J.H.; Dong, L.L. Spatial Identification of Housing Vacancy in China. Chin. Geogr. Sci. 2021, 31, 359–375. [Google Scholar] [CrossRef]
- Li, J.; Guo, M.; Lo, K. Estimating Housing Vacancy Rates in Rural China Using Power Consumption Data. Sustainability 2019, 11, 5722. [Google Scholar] [CrossRef] [Green Version]
- Deilmann, C.; Effenberger, K.H.; Banse, J. Housing stock shrinkage: Vacancy and demolition trends in Germany. Build. Res. Inf. 2009, 37, 660–668. [Google Scholar] [CrossRef]
- Wang, K.; Immergluck, D. Housing vacancy and urban growth: Explaining changes in long-term vacancy after the US foreclosure crisis. J. Hous. Built Environ. 2019, 34, 511–532. [Google Scholar] [CrossRef]
- Deng, C.B.; Ma, J.J. Viewing urban decay from the sky: A multi-scale analysis of residential vacancy in a shrinking US city. Landsc. Urban Plan. 2015, 141, 88–99. [Google Scholar] [CrossRef]
- Radzimski, A. View Web of Science ResearcherID and ORCID (provided by Clarivate). Cities 2016, 50, 197–205. [Google Scholar] [CrossRef]
- Geman, H.; Tunaru, R. Commercial Real-Estate Inventory and Theory of Storage. J. Futures Mark. 2013, 33, 675–694. [Google Scholar] [CrossRef]
- Caplin, A.; Leahy, J. Trading Frictions and House Price Dynamics. J. Money Credit. Bank. 2011, 43, 283–303. [Google Scholar] [CrossRef] [Green Version]
- Kwoun, M.J.; Lee, S.H.; Kim, J.H. Dynamic cycles of unsold new housing stocks, investment in housing, and housing supply-demand. Math. Comput. Model. 2013, 57, 2094–2105. [Google Scholar] [CrossRef]
- Morales, M.; Moraga, G.; Kirchheim, A.P.; Passuello, A. Regionalized inventory data in LCA of public housing: A comparison between two conventional typologies in southern Brazil. J. Clean. Prod. 2019, 238, 117869. [Google Scholar] [CrossRef]
- Jiang, Y.X.; Zheng, L.Y.; Wang, J.Z. Research on external financial risk measurement of China real estate. Int. J. Financ. Econ. 2020, 26, 5472–5484. [Google Scholar] [CrossRef]
- Muczynski, A. Financial flow models in municipal housing stock management in Poland. Land Use Policy 2020, 91, 104429. [Google Scholar] [CrossRef]
- Olaya, Y.; Vasquez, F.; Muller, D.B. Dwelling stock dynamics for addressing housing deficit. Resour. Conserv. Recycl. 2017, 123, 187–199. [Google Scholar] [CrossRef]
- Immergluck, D. Examining Changes in Long-Term Neighborhood Housing Vacancy During the 2011 to 2014 US National Recovery. J. Urban Aff. 2016, 38, 607–622. [Google Scholar] [CrossRef]
- Wen, X.Q.; Xu, C.; Hu, Q.Y. Dynamic capacity management with uncertain demand and dynamic price. Int. J. Prod. Econ. 2016, 175, 121–131. [Google Scholar] [CrossRef]
- Pham, T.H.V.; Nguyen, M.H.V. Impact of Inventory Size, Staging, and Financing Policies on Sales Growth of Real Estate Companies in Vietnam. Journal of Global Economy. Bus. Financ. 2021, 3. [Google Scholar] [CrossRef]
- Yoo, H.; Yoon, H. The Effect of Green Characteristics in Reducing the Inventory of Unsold Housing in New Residential Developments-A Case of Gyeonggi Province, in South Korea. Land 2021, 10, 377. [Google Scholar] [CrossRef]
- Nam, J.; Han, J.; Lee, C. Factors Contributing to Residential Vacancy and Some Approaches to Management in Gyeonggi Province, Korea. Sustainability 2016, 8, 367. [Google Scholar] [CrossRef] [Green Version]
- Lins, M.P.E.; Novaes, L.F.D.; Legey, L.F.L. Real estate appraisal: A double perspective data envelopment analysis approach. Ann. Oper. Res. 2005, 138, 79–96. [Google Scholar] [CrossRef]
- Liu, X.X.; Song, Y.Y.; Liu, H.H.; Yang, G.L. Regional efficiency of the real estate industry in 35 large and medium-sized cities in China: A meta-frontier SBM approach. Post-Communist Econ. 2021, 34, 376–408. [Google Scholar] [CrossRef]
- Chen, Y.; Cai, Y.; Zheng, C.L. Efficiency of Chinese Real Estate Market Based on Complexity-Entropy Binary Causal Plane Method. Complexity 2020, 2020, 2791352. [Google Scholar] [CrossRef] [Green Version]
- Chen, Q.S.; Kamran, S.M.; Fan, H.Z. Real estate investment and energy efficiency: Evidence from China’s policy experiment. J. Clean. Prod. 2019, 217, 440–447. [Google Scholar] [CrossRef]
- Yang, Z.; Fang, H. Research on Green Productivity of Chinese Real Estate Companies-Based on SBM-DEA and TOBIT Models. Sustainability 2020, 12, 3122. [Google Scholar] [CrossRef] [Green Version]
- Zheng, X.; Chau, K.W.; Hui, E.C.M. Efficiency Assessment of Listed Real Estate Companies: An Empirical Study of China. Int. J. Strateg. Prop. Manag. 2011, 15, 91–104. [Google Scholar] [CrossRef] [Green Version]
- Nguyen, N.T.; Le, V.A.B.; Tran, T.T. Vietnamese real estate corporations’ performance using the hybrid model of data envelopment analysis and grey system theory. Neural Comput. Appl. 2021, 33, 17209–17222. [Google Scholar] [CrossRef]
- Wang, C.N.; Hsu, H.P.; Wang, J.W.; Kao, Y.C.; Nguyen, T.P. Strategic Alliance for Vietnam Domestic Real Estate Companies Using a Hybrid Approach Combining GM (1,1) with Super SBM DEA. Sustainability 2020, 12, 1891. [Google Scholar] [CrossRef] [Green Version]
- Luo, H.; Islam, A.M.; Wang, R. Financing Constraints and Investment Efficiency in Canadian Real Estate and Construction Firms: A Stochastic Frontier Analysis. Sage Open 2021, 11, 21582440211031502. [Google Scholar] [CrossRef]
- Atta Mills, E.F.E.; Baafi, M.A.; Liu, F.B.; Zeng, K.L. Dynamic operating efficiency and its determining factors of listed real-estate companies in China: A hierarchical slack-based DEA-OLS approach. Int. J. Financ. Econ. 2020, 26, 3352–3376. [Google Scholar] [CrossRef]
- Rahman, H.U.; Zahid, M.; Muhammad, A. Connecting integrated management system with corporate sustainability and firm performance: From the Malaysian real estate and construction industry perspective. Environ. Dev. Sustain. 2021, 24, 2387–2411. [Google Scholar] [CrossRef]
- Fauth, R.; Schwarz, J.; Bullesbach, J. Development of a procedure to assess the sustainability of existing buildings—Sustainability in real estate asset management and property management. Bautechnik 2016, 93, 366–370. [Google Scholar] [CrossRef]
- Marona, B.; van den Beemt-Tjeerdsma, A. Impact of Public Management Approaches on Municipal Real Estate Management in Poland and The Netherlands. Sustainability 2018, 10, 4291. [Google Scholar] [CrossRef] [Green Version]
- Ahmad, I.; Alqarni, M.A.; Almazroi, A.A.; Alam, L. Real Estate Management via a Decentralized Blockchain Platform. CMC-Comput. Mater. Contin. 2021, 66, 1813–1822. [Google Scholar] [CrossRef]
- Guarini, M.R.; Battisti, F.; Chiovitti, A. A Methodology for the Selection of Multi-Criteria Decision Analysis Methods in Real Estate and Land Management Processes. Sustainability 2018, 10, 507. [Google Scholar] [CrossRef] [Green Version]
- Lewis, D.; Springer, T.M.; Anderson, R.I. The cost efficiency of real estate investment trusts: An analysis with a Bayesian stochastic frontier model. J. Real Estate Financ. Econ. 2003, 26, 65–80. [Google Scholar] [CrossRef]
- Darrat, A.F.; Glascock, J.L. On the Real-Estate Market-Efficiency. J. Real Estate Financ. Econ. 1993, 7, 55–72. [Google Scholar] [CrossRef]
- Ferrera, J.M.C.; Chaparro, F.P.; Jimenez, J.S. Efficiency assessment of real estate cadastral offices using DEA. Int. Rev. Adm. Sci. 2012, 77, 802–824. [Google Scholar] [CrossRef]
- Klumbyte, E.; Apanaviciene, R. Real Estate Strategic Management Model for Lithuanian Municipalities. Int. J. Strateg. Prop. Manag. 2014, 18, 279–291. [Google Scholar] [CrossRef]
- Liow, K.H.; Song, J.; Lau, J.C.J. Investment Dynamics of Singapore Stock and Real Estate Markets. Singap. Econ. Rev. 2022, 2022, 1–30. [Google Scholar] [CrossRef]
- Wu, Z.H.; Chen, H.J. The Influence of E-Marketing on Performance of Real Estate Enterprises: Based on Super-Efficiency DEA and Grey Entropy Methods. Math. Probl. Eng. 2021, 2021, 7502676. [Google Scholar] [CrossRef]
- Lewis, D.; Anderson, R. Residential real estate brokerage efficiency and the implications of franchising: A Bayesian approach. Real Estate Econ. 1999, 27, 543–560. [Google Scholar] [CrossRef]
- Yilmaz, M.K.; Kusakci, A.O.; Tatoglu, E.; Icten, O.; Yetgin, F. Performance Evaluation of Real Estate Investment Trusts using a Hybridized Interval Type-2 Fuzzy AHP-DEA Approach: The Case of Borsa Istanbul. Int. J. Inf. Technol. Decis. Mak. 2019, 18, 1785–1820. [Google Scholar] [CrossRef]
- Almudhaf, F.; Hansz, A.J. Random Walks and Market Efficiency: Evidence from Real Estate Investment Trusts (Reit) Subsectors. Int. J. Strateg. Prop. Manag. 2018, 22, 81–92. [Google Scholar] [CrossRef] [Green Version]
- Lee, C.L.; Stevenson, S.; Cho, H.Y.B. Listed real estate futures trading, market efficiency, and direct real estate linkages: International evidence. J. Int. Money Financ. 2022, 127, 102693. [Google Scholar] [CrossRef]
- Wang, L.Y.; Hu, H.Q.; Wang, X.Z.; Zhang, X.C.; Wu, Y.B. Synergistic evolution of resilience and efficiency in the real estate industry: Evidence from 35 large and medium-sized cities in China. Appl. Econ. Lett. 2022, 2022, 1–9. [Google Scholar] [CrossRef]
- Zhao, S.; Zhao, K.; Yan, Y.; Zhu, K.; Guan, C. Spatio-Temporal Evolution Characteristics and Influencing Factors of Urban Service-Industry Land in China. Land 2022, 11, 13. [Google Scholar] [CrossRef]
- Wang, B.; Zhao, J.; Hu, X.F. Analysison trade-offs and synergistic relationships among multiple ecosystem services in the Shiyang River Basin. Acta Ecol. Sin. 2018, 38, 7582–7595. [Google Scholar] [CrossRef]
- Zhao, S.; Zhang, P.; Li, W. A Study on Evaluation of Influencing Factors for Sustainable Development of Smart Construction Enterprises: Case Study from China. Buildings 2021, 11, 221. [Google Scholar] [CrossRef]
- Chen, H.; Zhao, S.; Zhang, P.; Zhou, Y.; Li, K. Dynamics, and Driving Mechanism of Real Estate in China’s Small Cities: A Case Study of Gansu Province. Buildings 2022, 12, 1512. [Google Scholar] [CrossRef]
- Zhou, Y.; Zhao, K.; Han, J.; Zhao, S.; Cao, J. Geographical Pattern Evolution of Health Resources in China: Spatio-Temporal Dynamics and Spatial Mismatch. Trop. Med. Infect. Dis. 2022, 7, 292. [Google Scholar] [CrossRef] [PubMed]
- Tone, K. A slacks-based measure of efficiency in data envelopment analysis. Eur. J. Oper. Res. 2001, 130, 498–509. [Google Scholar] [CrossRef] [Green Version]
- Andersen, P.; Petersen, N.C. A procedure for ranking efficient units in data envelopment analysis. Manag. Sci. 1993, 39, 1261–1264. [Google Scholar] [CrossRef]
- Tone, K. A slacks-based measure of super-efficiency in data envelopment analysis. Eur. J. Oper. Res. 2002, 143, 32–41. [Google Scholar] [CrossRef] [Green Version]
- Wang, C.N.; Nguyen, T.L.; Dang, T.T. Analyzing Operational Efficiency in Real Estate Companies: An Application of GM (1,1) and DEA Malmquist Model. Mathematics 2021, 9, 202. [Google Scholar] [CrossRef]
- Liu, X.X.; Liu, H.H.; Yang, G.L.; Pan, J.F. Productivity assessment of the real estate industry in China: A DEA-Malmquist index. Eng. Constr. Archit. Manag. 2021. [Google Scholar] [CrossRef]
- Yang, G.L.; Fukuyama, H.; Chen, K. Investigating the regional sustainable performance of the Chinese real estate industry: A slack-based DEA approach. Omega-Int. J. Manag. Sci. 2019, 84, 141–159. [Google Scholar] [CrossRef]
- Zhang, Q.; Hong, K.R.; Luo, J.H. Comparative Analysis of Regional Real Estate Input-Output Efficiency Based on Super-Efficiency DEA Model—Taking Hunan as an example. Econ. Geogr. 2016, 36, 120–125. [Google Scholar] [CrossRef]
- Zhang, P.; Li, W.; Zhao, K.; Zhao, S. Spatial Pattern and Driving Mechanism of Urban–Rural Income Gap in Gansu Province of China. Land 2021, 10, 1002. [Google Scholar] [CrossRef]
- Li, W.; Zhang, P.; Zhao, K.; Zhao, S. The Geographical Distribution and Influencing Factors of COVID-19 in China. Trop. Med. Infect. Dis. 2022, 7, 45. [Google Scholar] [CrossRef]
- Zhao, S.D.; Li, W.W.; Zhao, K.X.; Zhang, P. Change Characteristics and Multilevel Influencing Factors of Real Estate Inventory-Case Studies from 35 Key Cities in China. Land 2021, 10, 928. [Google Scholar] [CrossRef]
- Chen, K.; Song, Y.Y.; Pan, J.F.; Yang, G.L. Measuring destocking performance of the Chinese real estate industry: A DEA-Malmquist approach. Socio-Econ. Plan. Sci. 2020, 69, 100691. [Google Scholar] [CrossRef]
- Li, W.; Weng, L.; Zhao, K.; Zhao, S.; Zhang, P. Research on the Evaluation of Real Estate Inventory Management in China. Land 2021, 10, 1283. [Google Scholar] [CrossRef]
- Fan, Z.G.; Deng, Z.K.; Qi, Y.W.; Pan, J.S. Spatial-Temporal pattern and evolutionary trend of eco-efficiency of real estate development in the Yangtze River economic belt. Front. Environ. Sci. 2022, 10, 996152. [Google Scholar] [CrossRef]
- Chen, J.Y.; Yang, Q.S.; Zhang, P.; Liu, H.H. Research on the Economic Efficiency of the Real Estate in Jilin Province. J. Northeast. Norm. Univ. (Nat. Sci. Ed.) 2016, 48, 151–157. [Google Scholar]
- Liu, R. Empirical Study on the Efficiency of the Real Estate Industry in China’s Provinces and Municipalities. Spec. Econ. Zone 2010, 6, 259–260. [Google Scholar]
- Fang, J.J. Efficiency Analysis of China’s Real Estate Industry: Empirical Research Based on Provincial Data. Mod. Manag. Sci. 2014, 11, 78–80. [Google Scholar]
- Li, K.; Ma, Z.L.; Zhang, G.Z. Evaluation of the Supply-Side Efficiency of China’s Real Estate Market: A Data Envelopment Analysis. Sustainability 2019, 11, 288. [Google Scholar] [CrossRef] [Green Version]
- Zeng, Z.F.; Hu, J.W. Research on China’s Provincial Real Estate Development Efficiency and Its Influencing Factors. Stat. Decis. Mak. 2013, 13, 98–101. [Google Scholar] [CrossRef]
Figure 1.
Study Area.
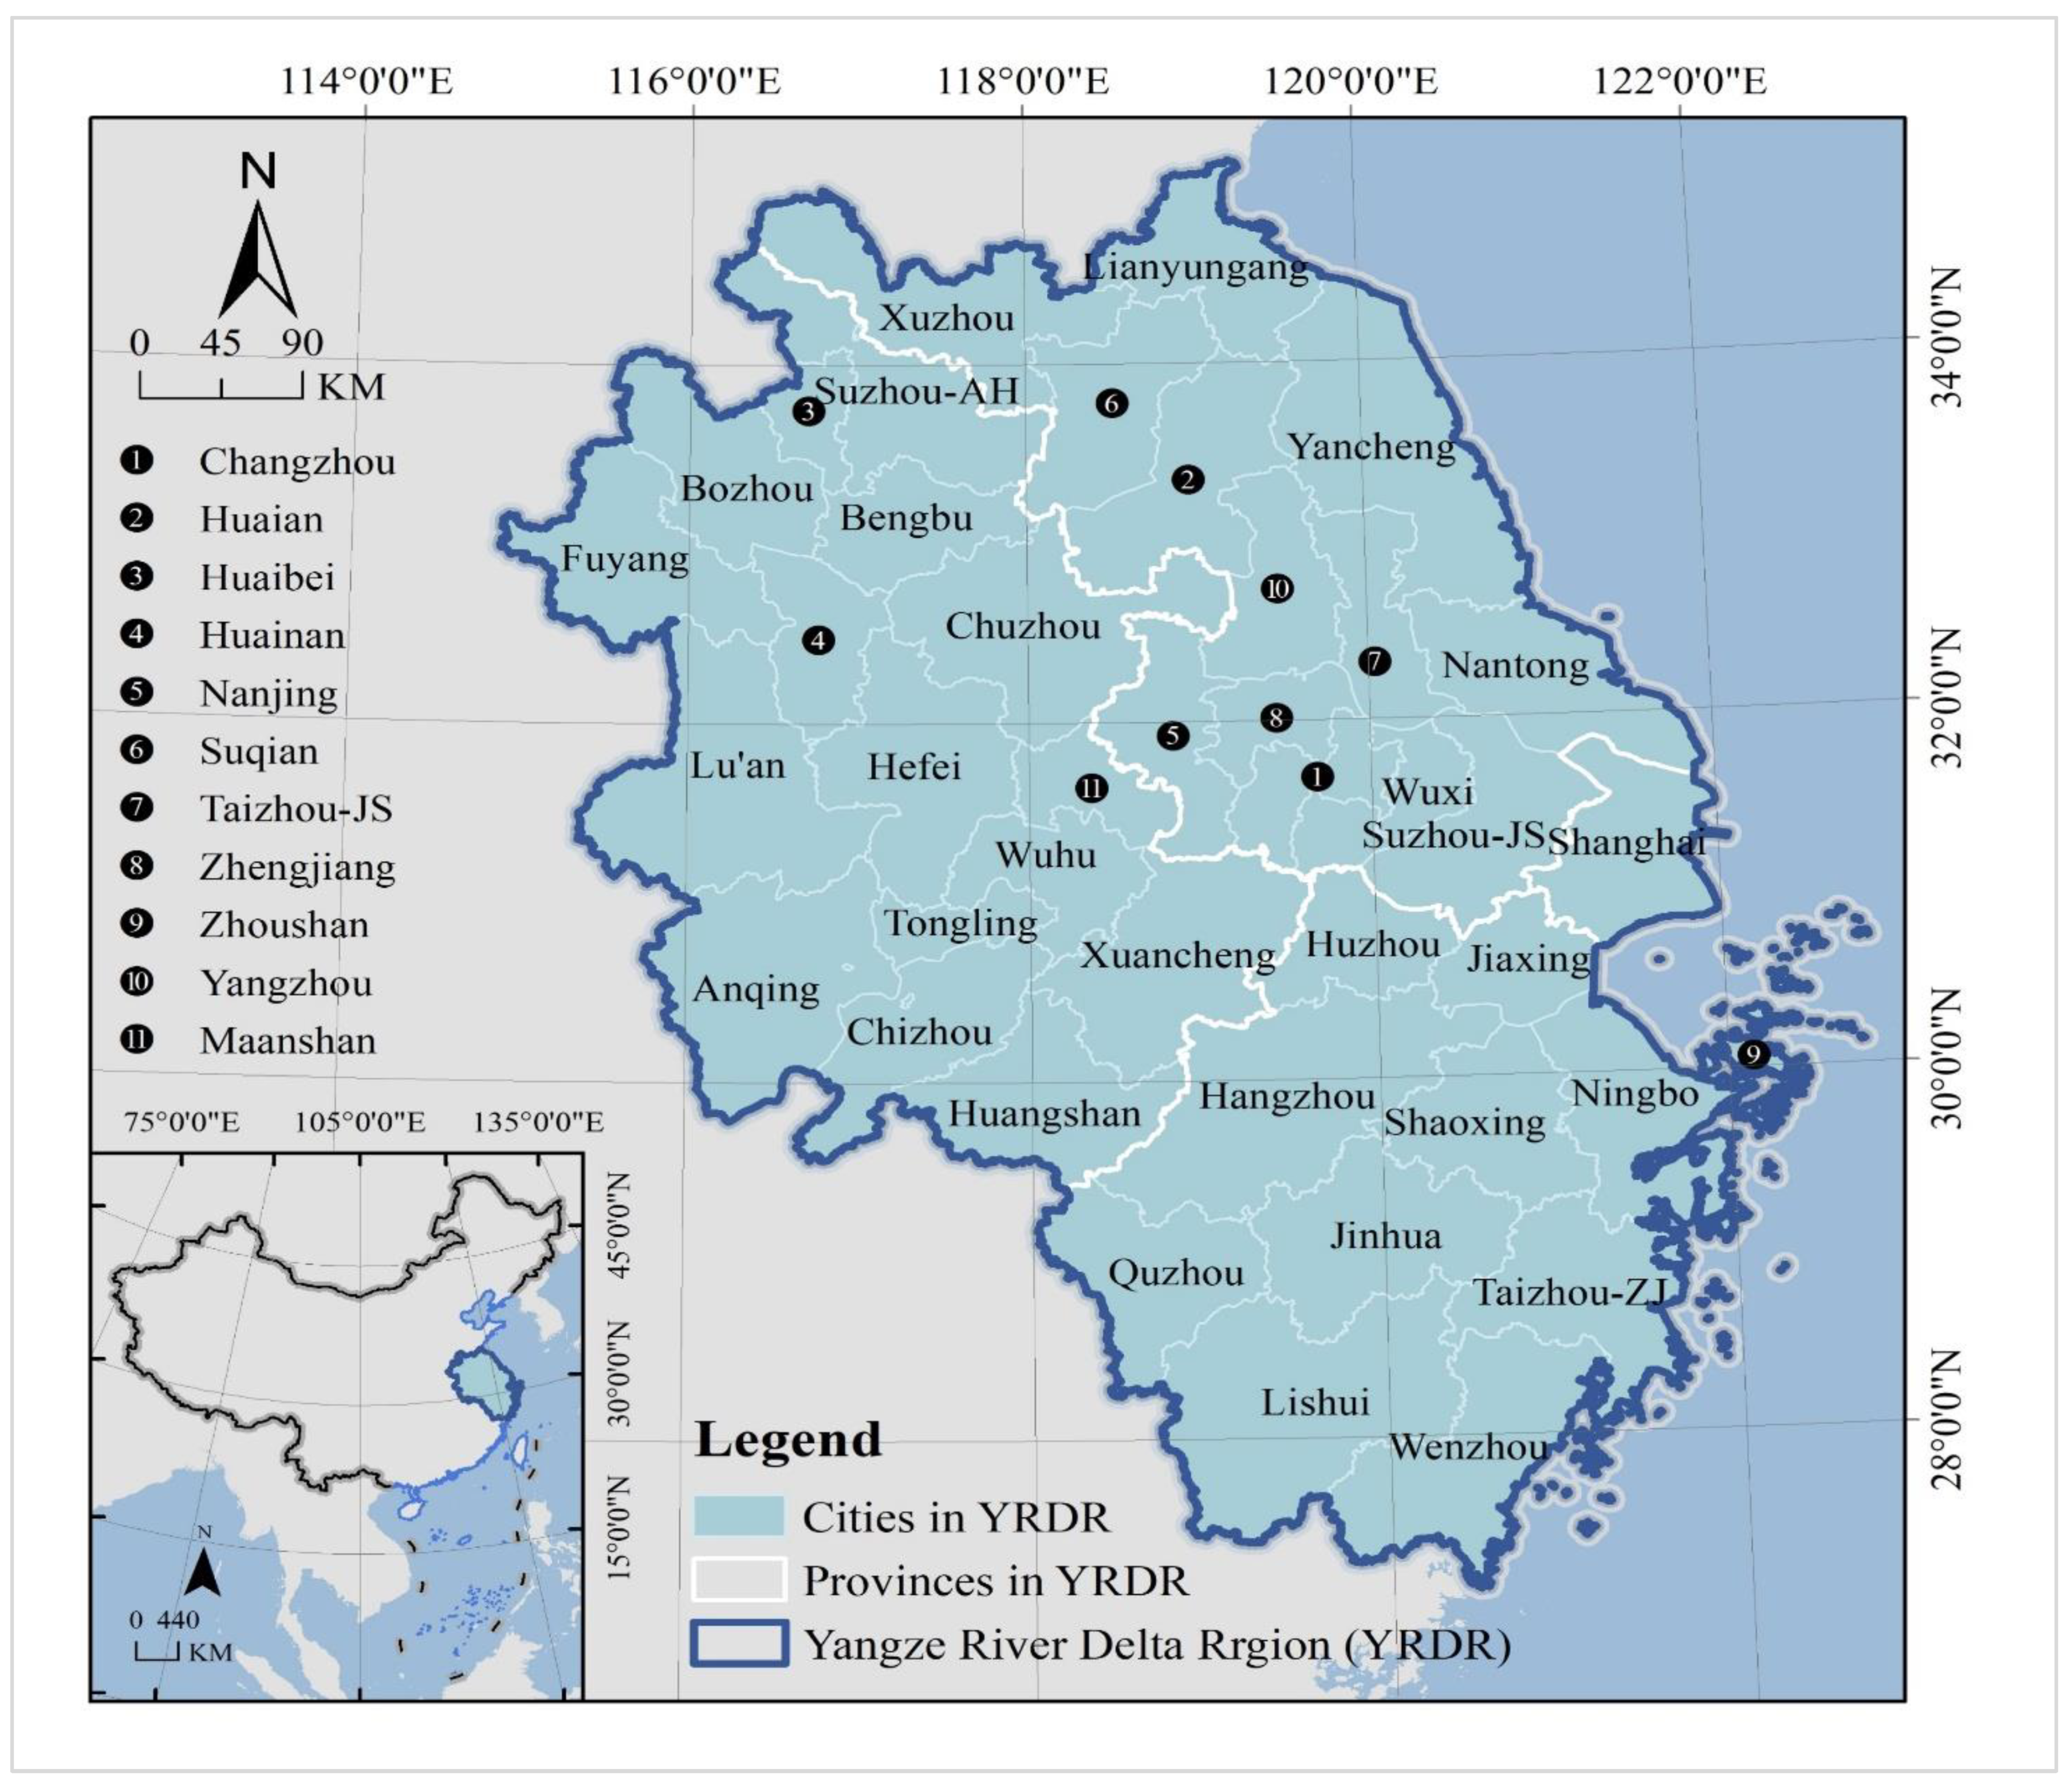
Figure 2.
Research steps.
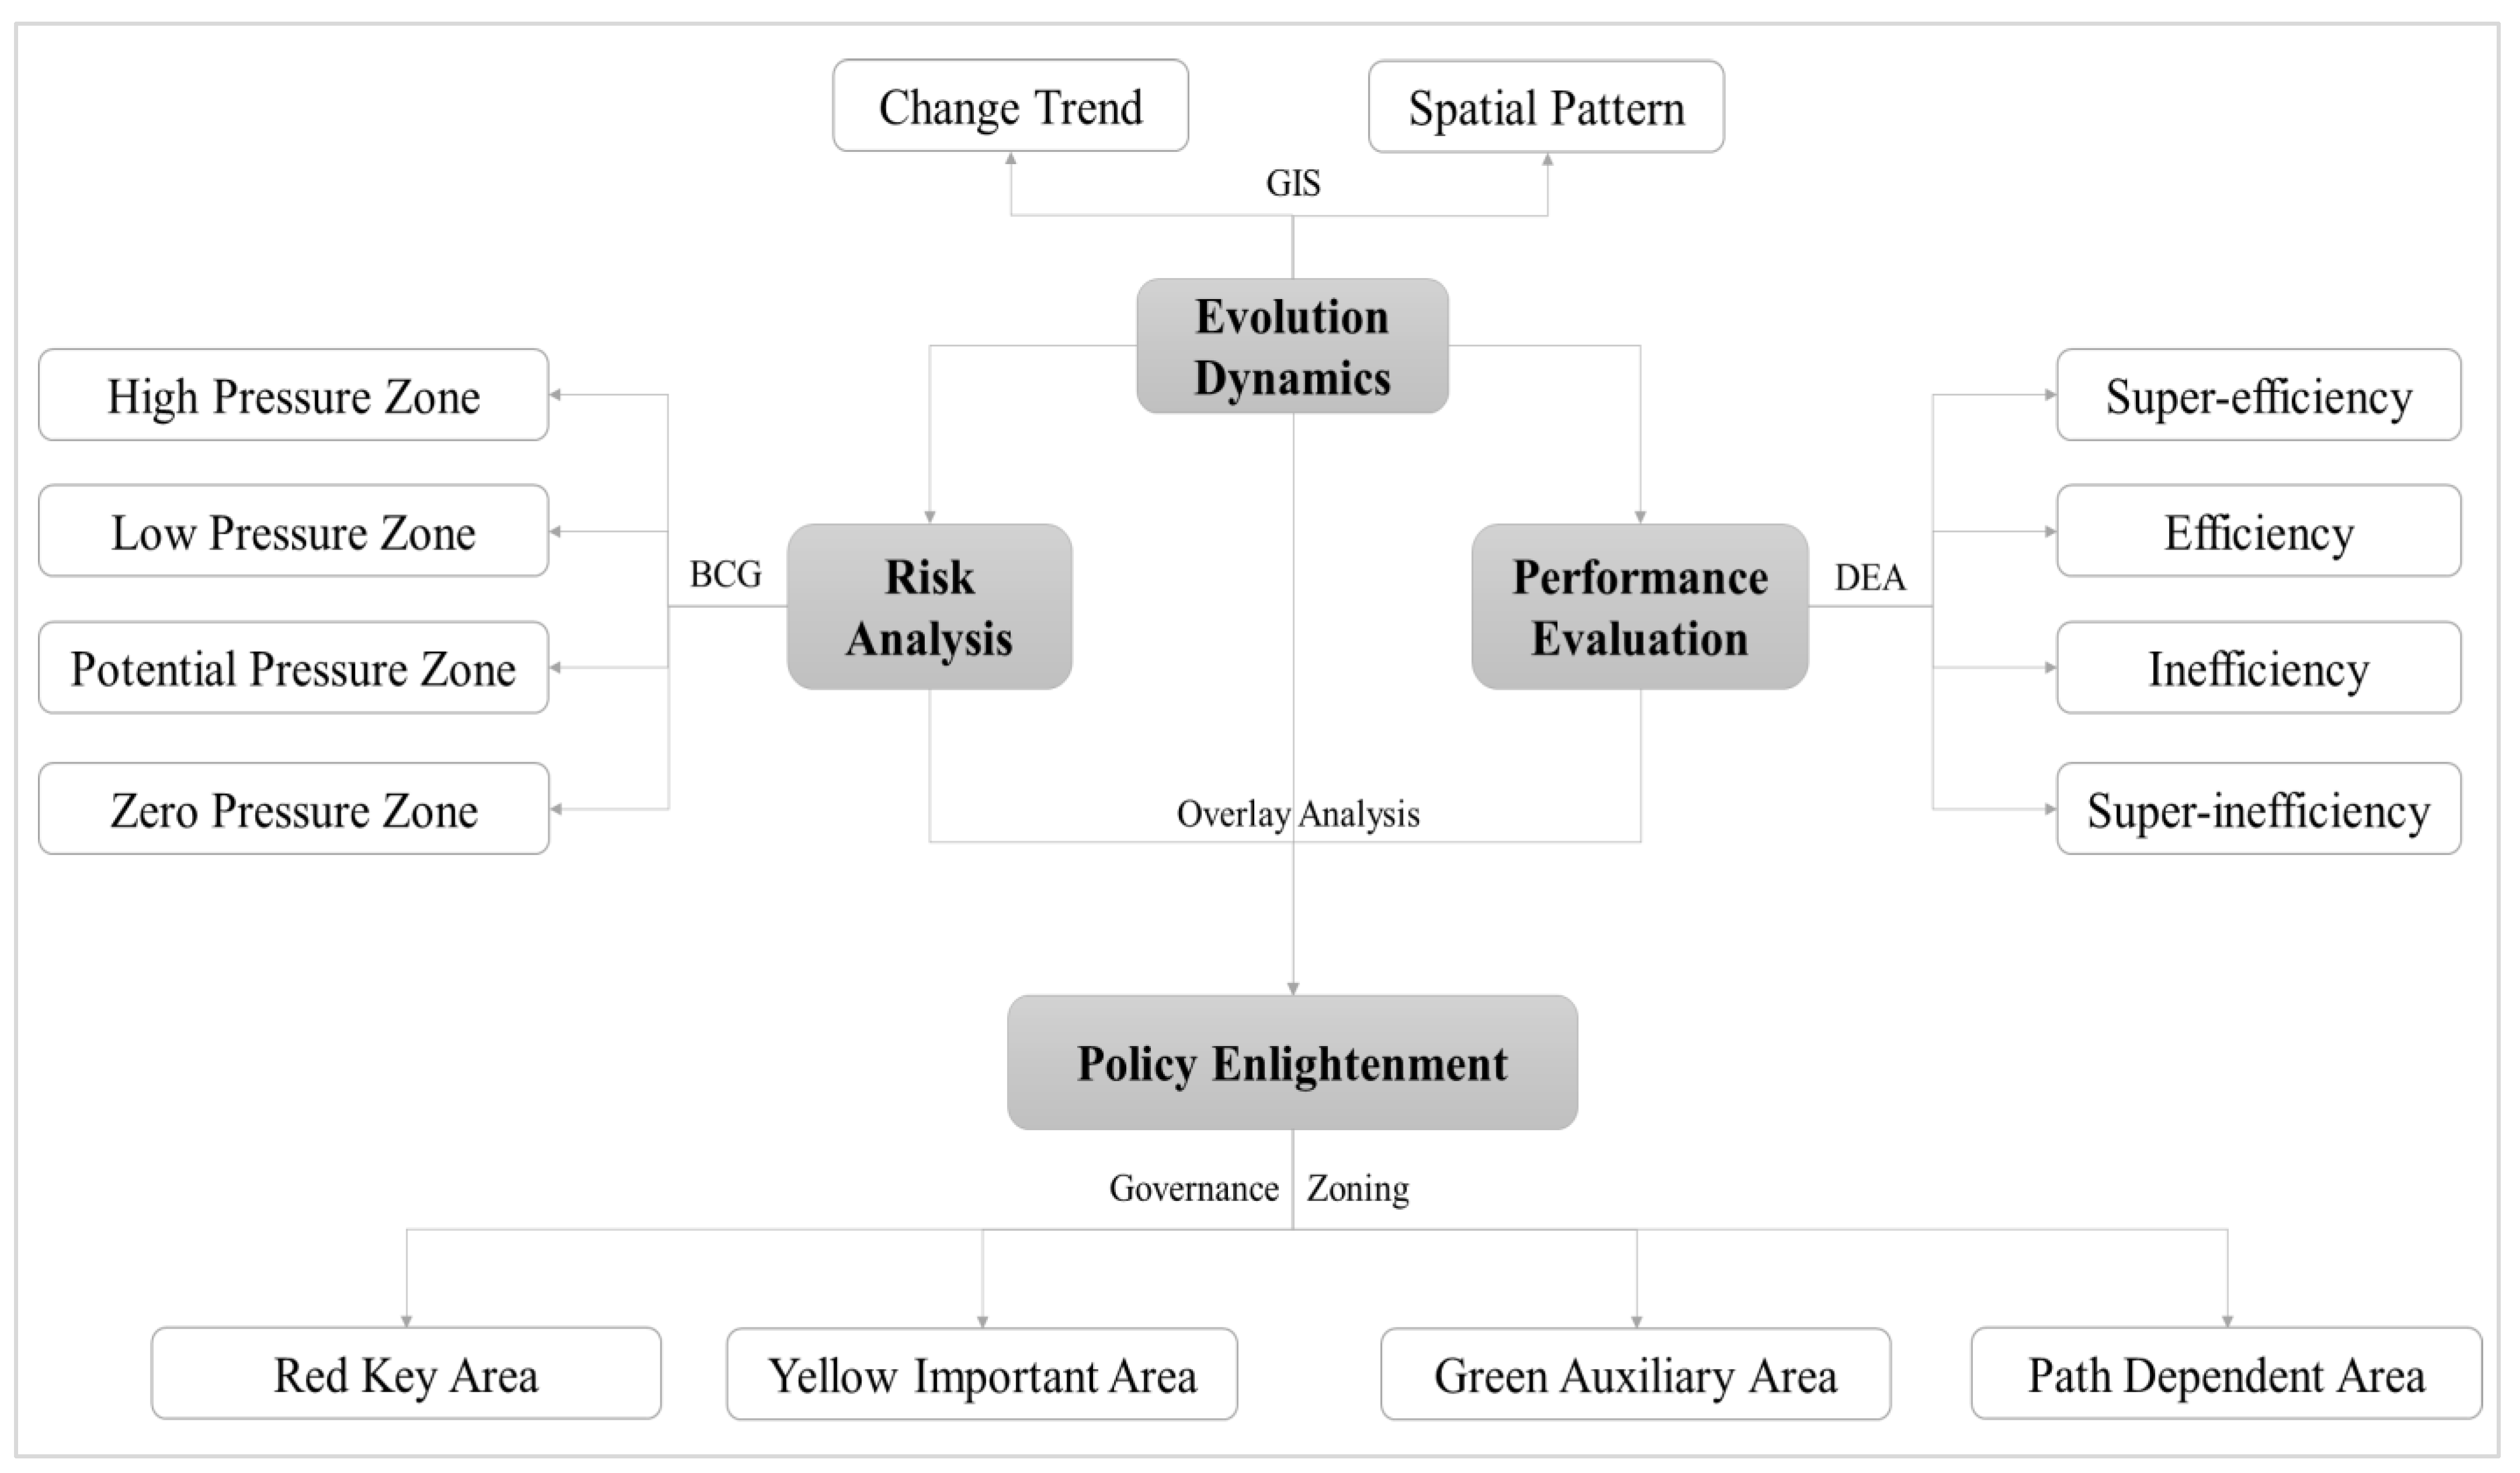
Figure 3.
Analysis on the change of real estate inventory in the Yangtze River Delta.
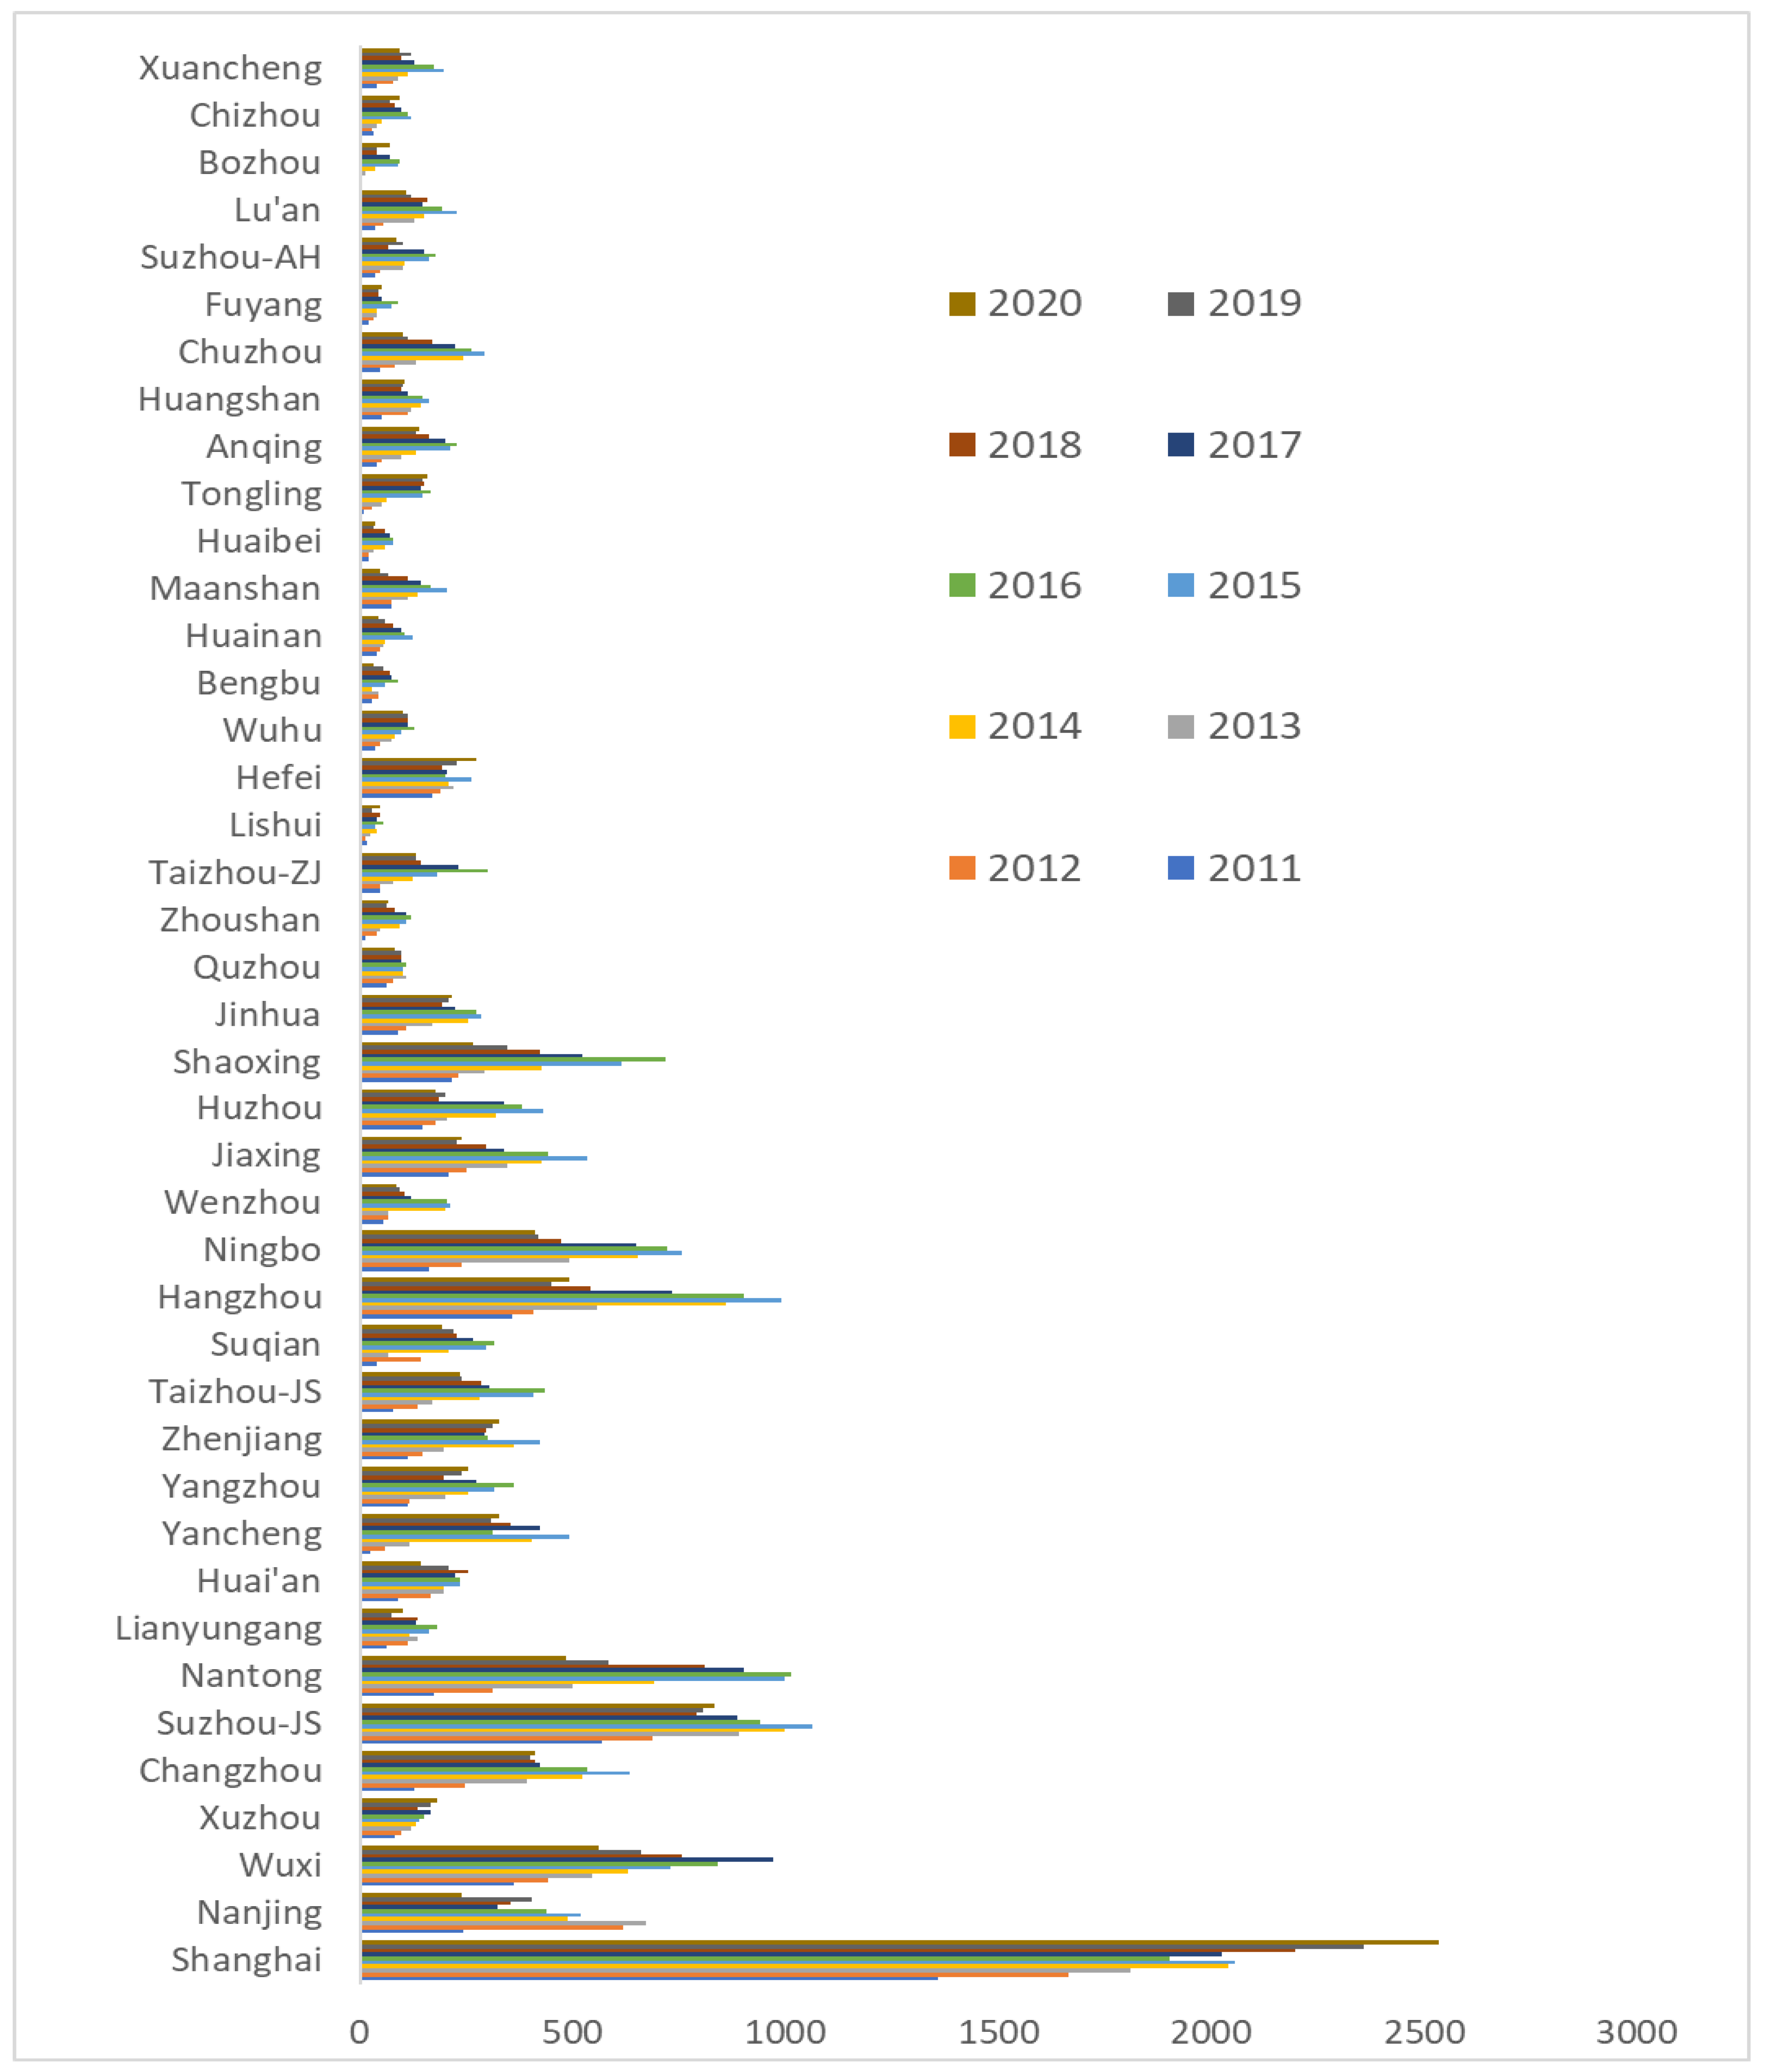
Figure 4.
Analysis on the hot and cold area of real estate inventory in Yangtze River Delta.
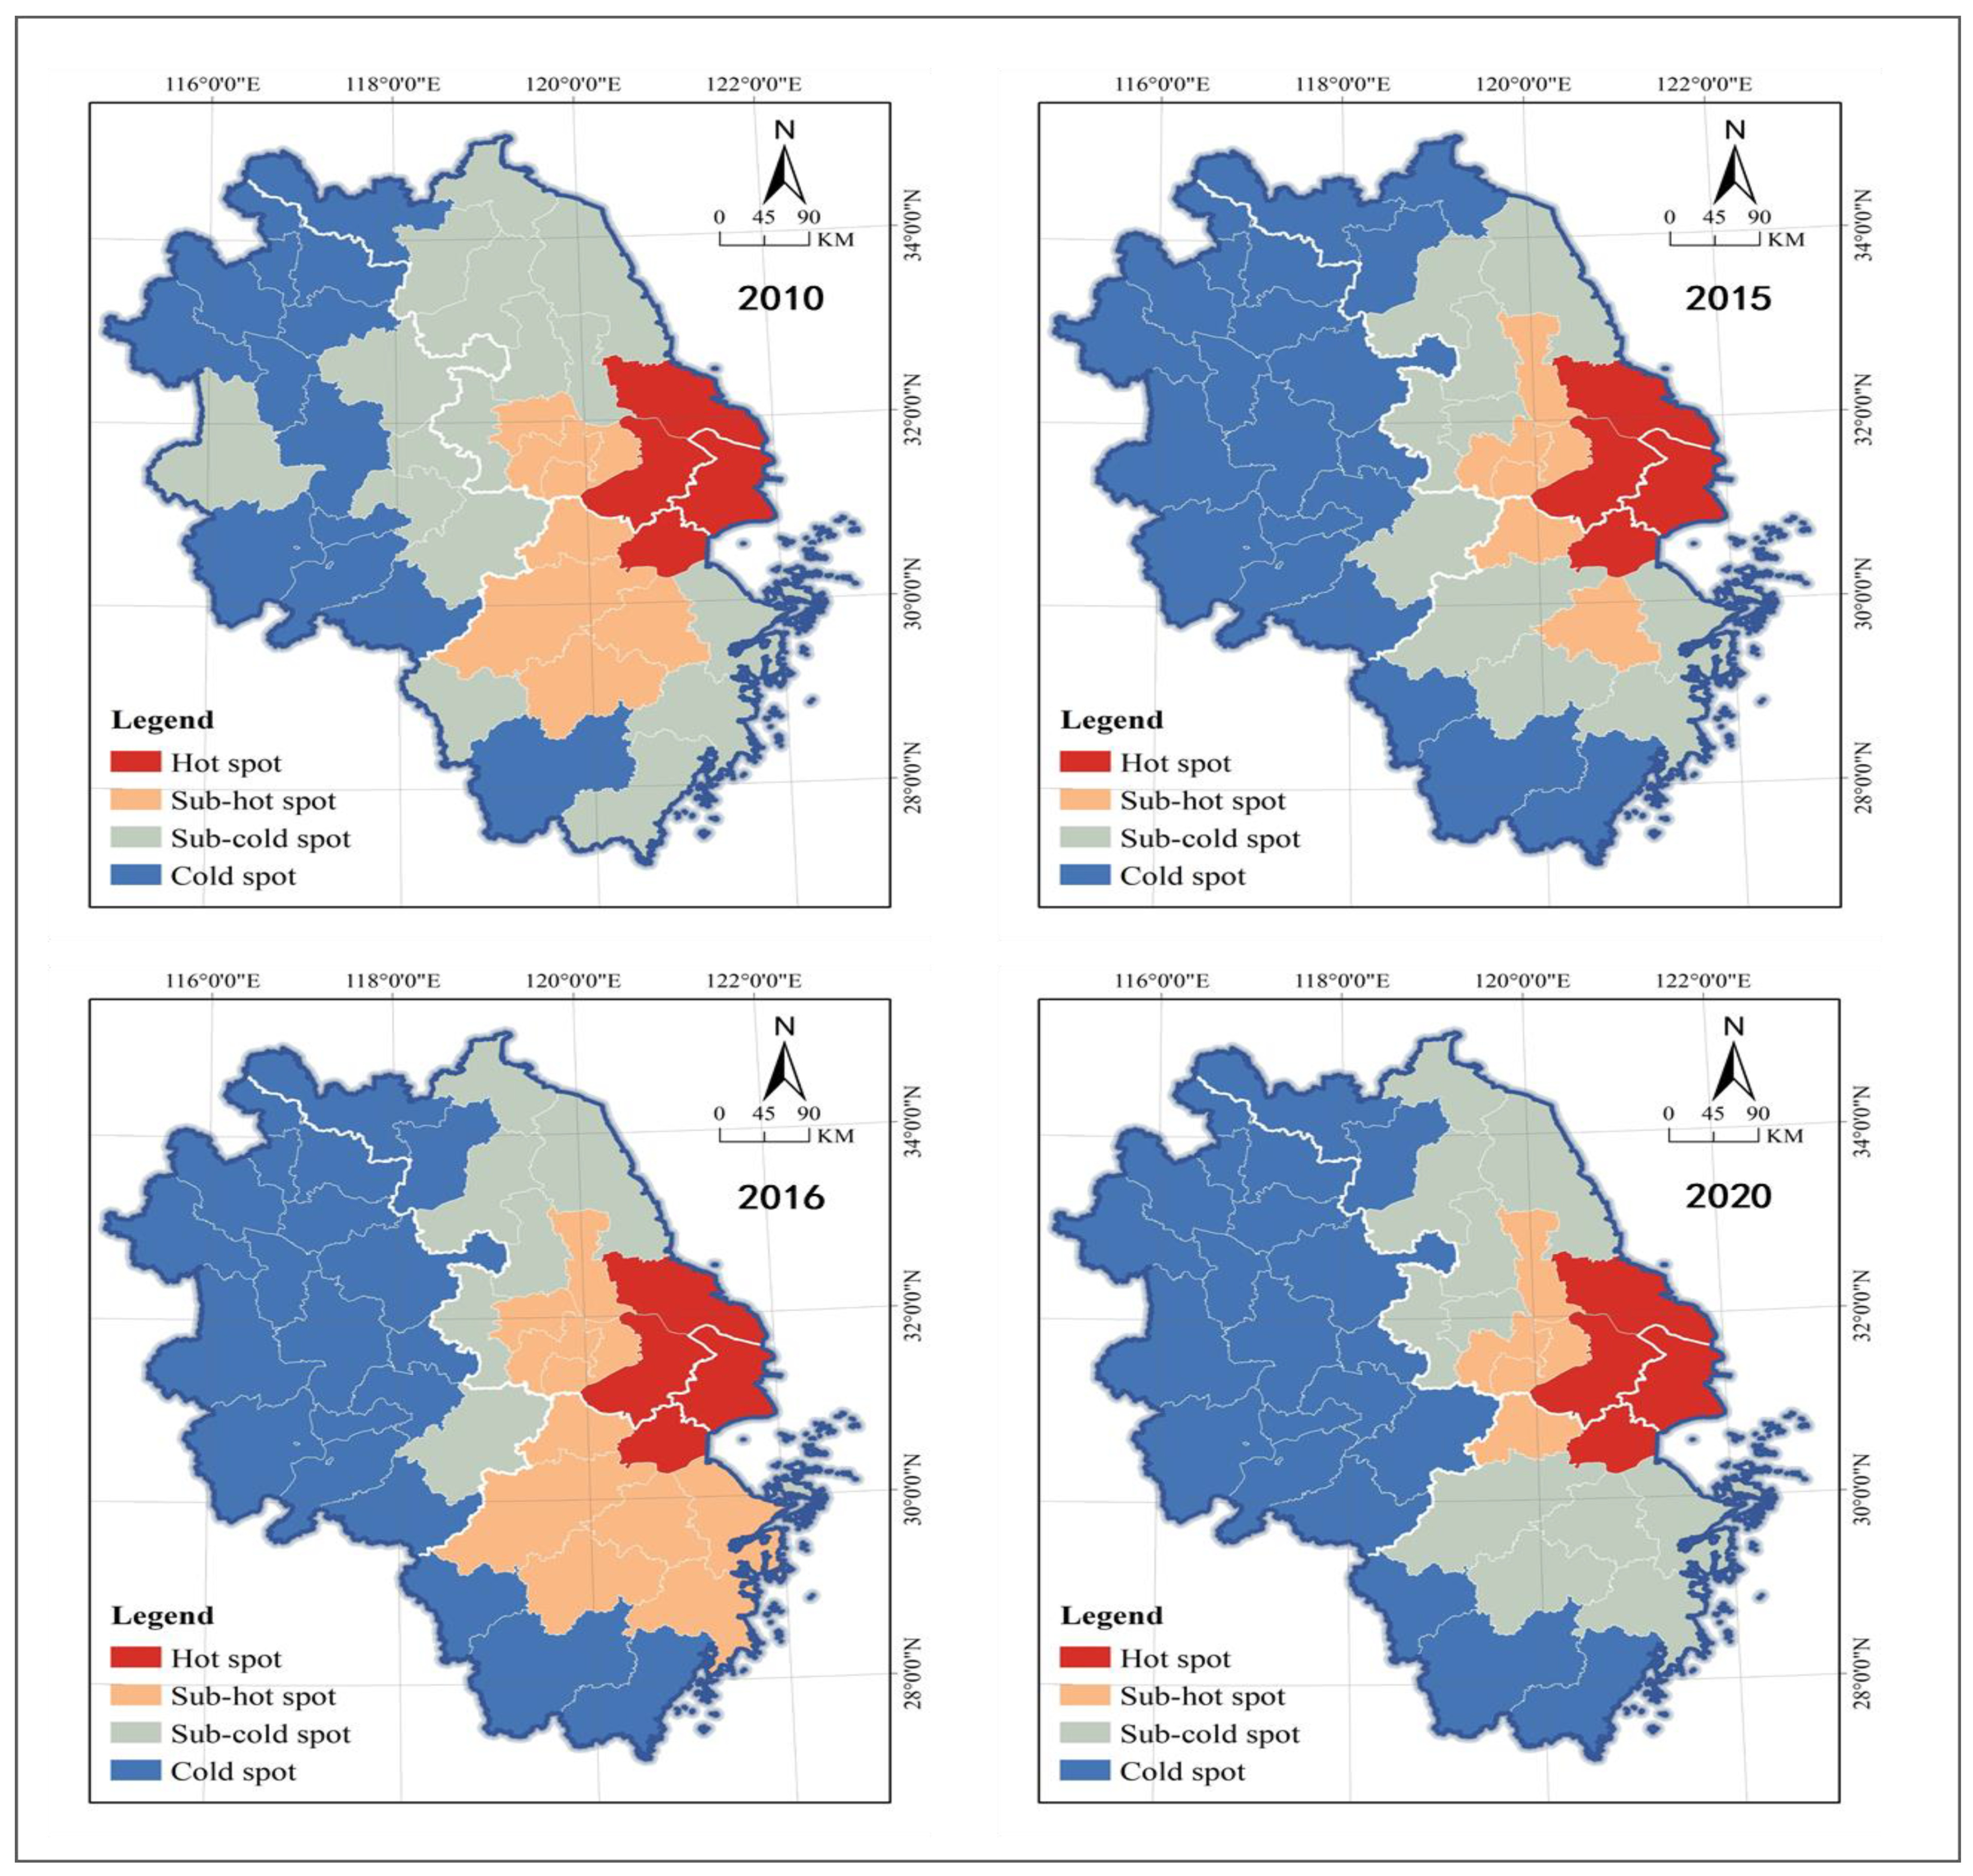
Figure 5.
Analysis on the risk zoning of real estate inventory in Yangtze River Delta.

Figure 6.
Analysis on the hot and cold area of technical efficiency in Yangtze River Delta.
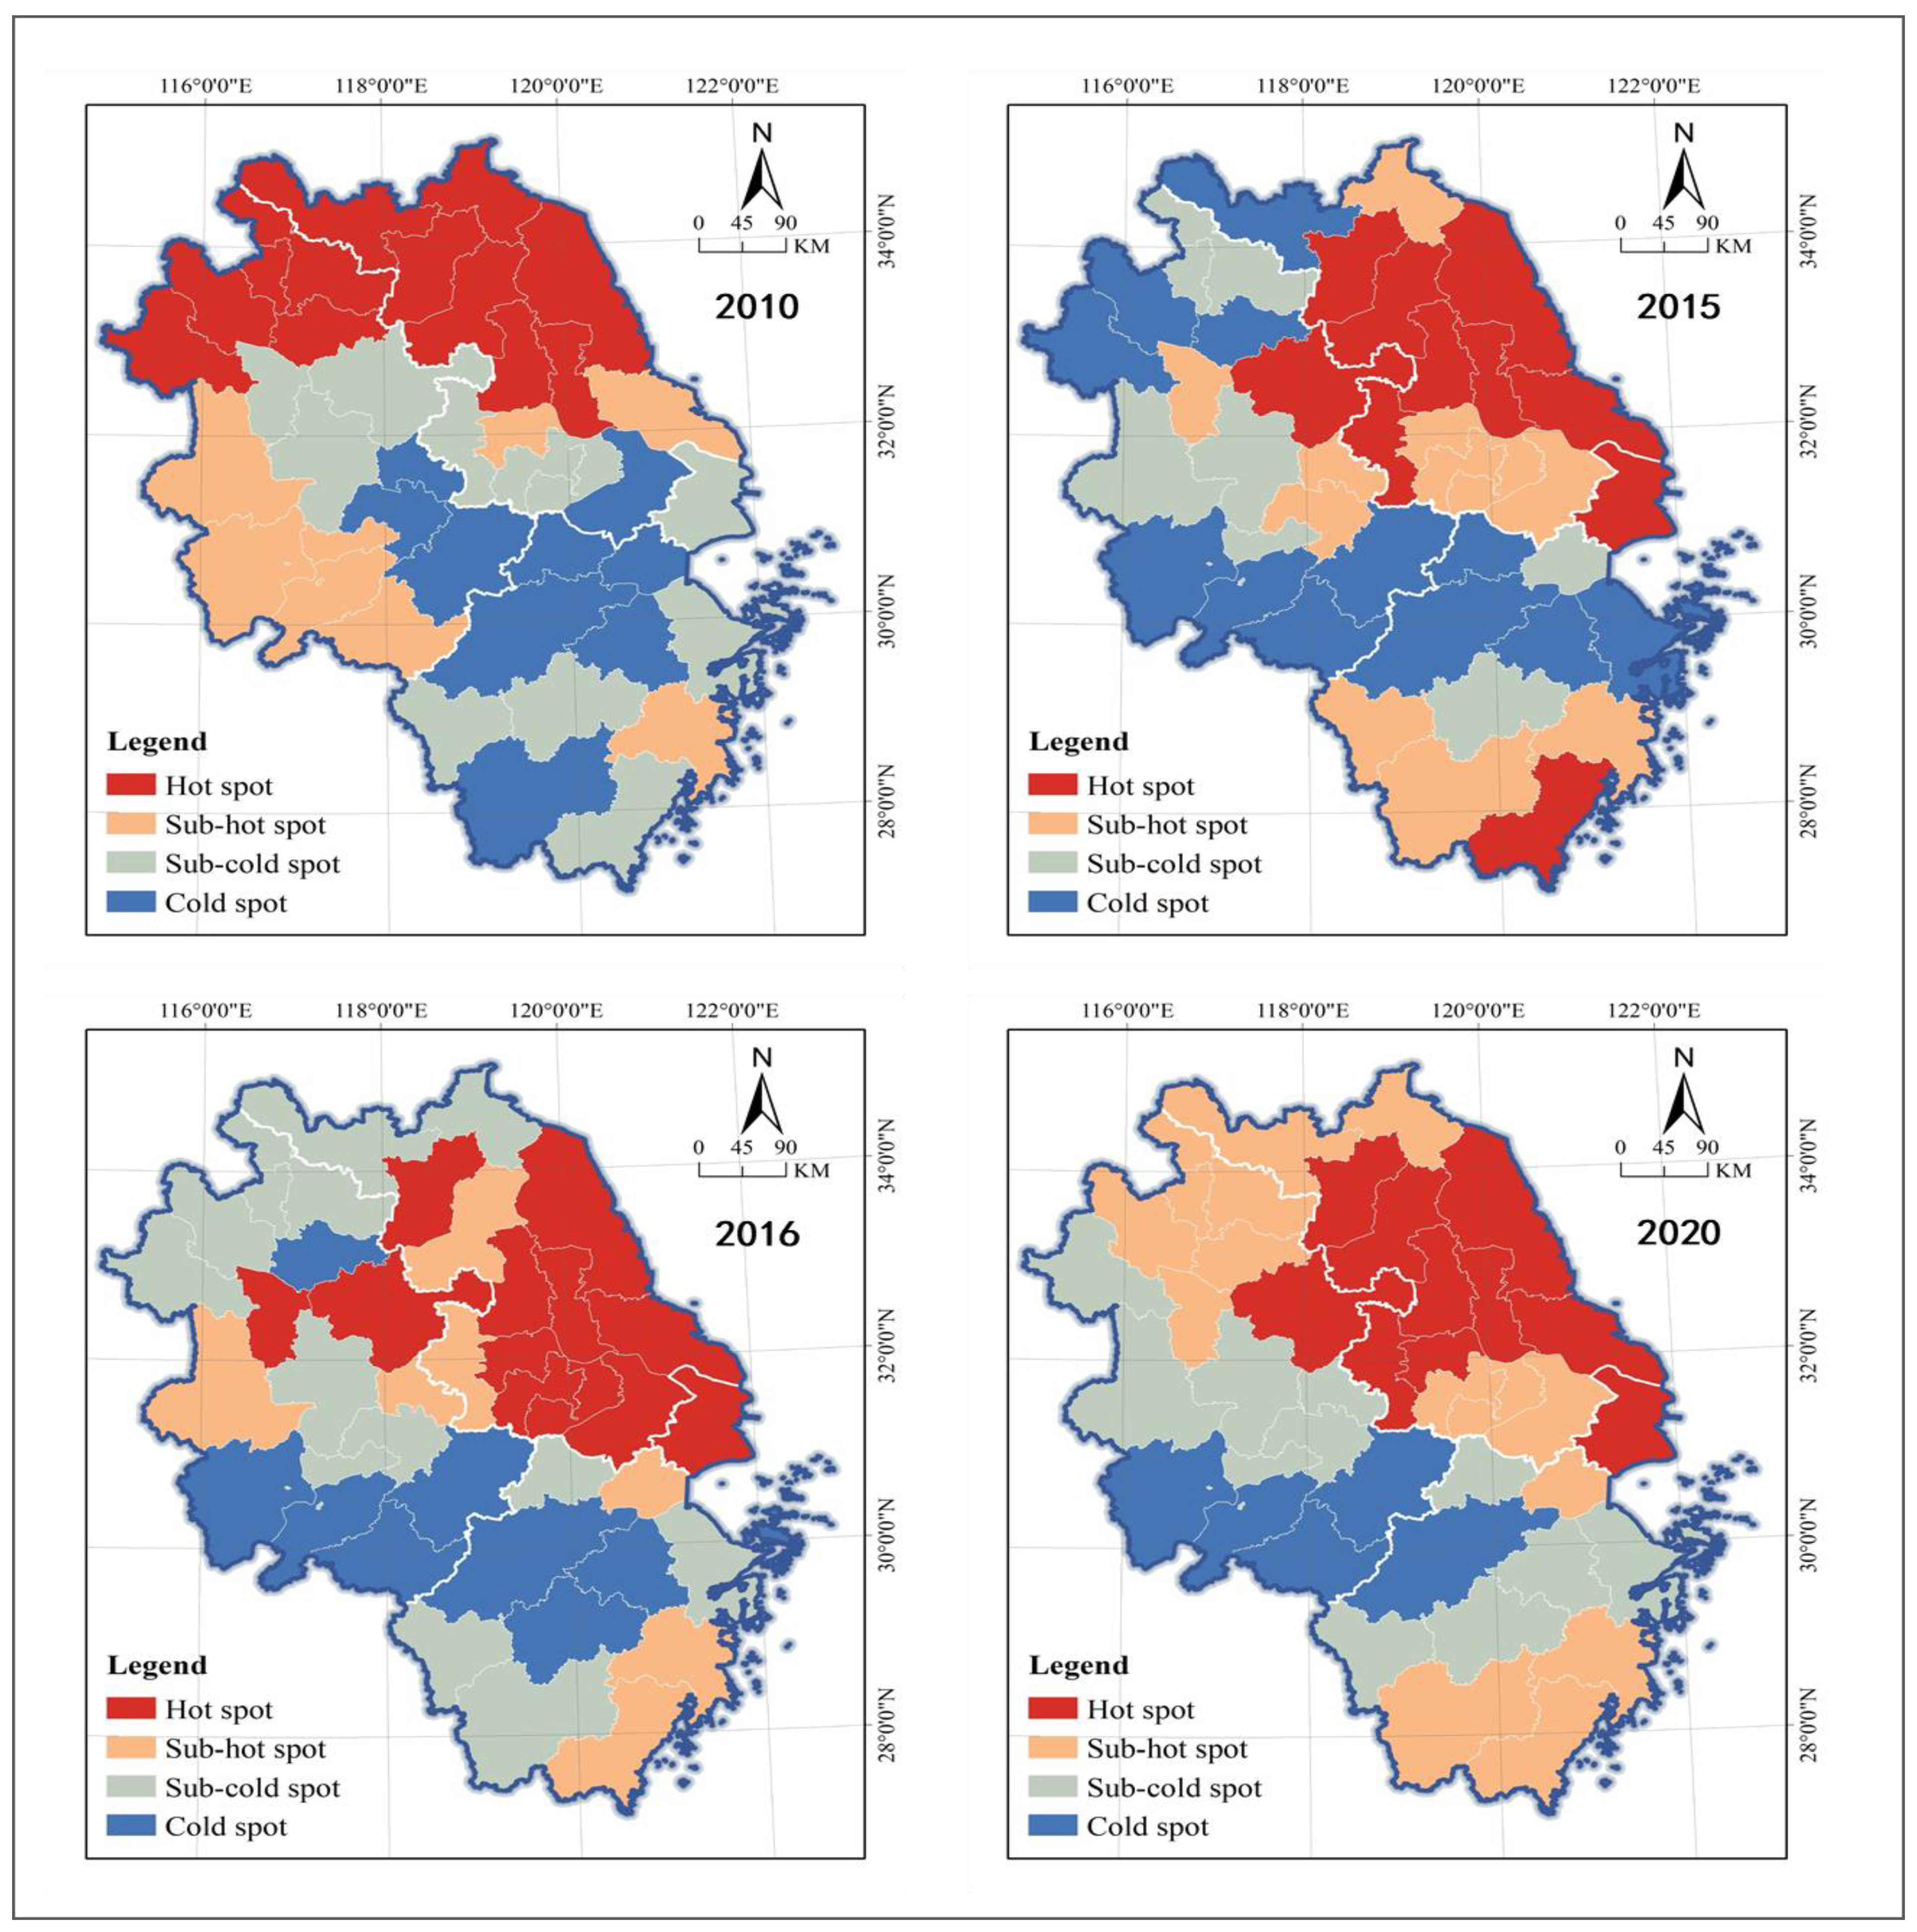
Figure 7.
Analysis on the technical efficiency of real estate inventory in Yangtze River Delta.
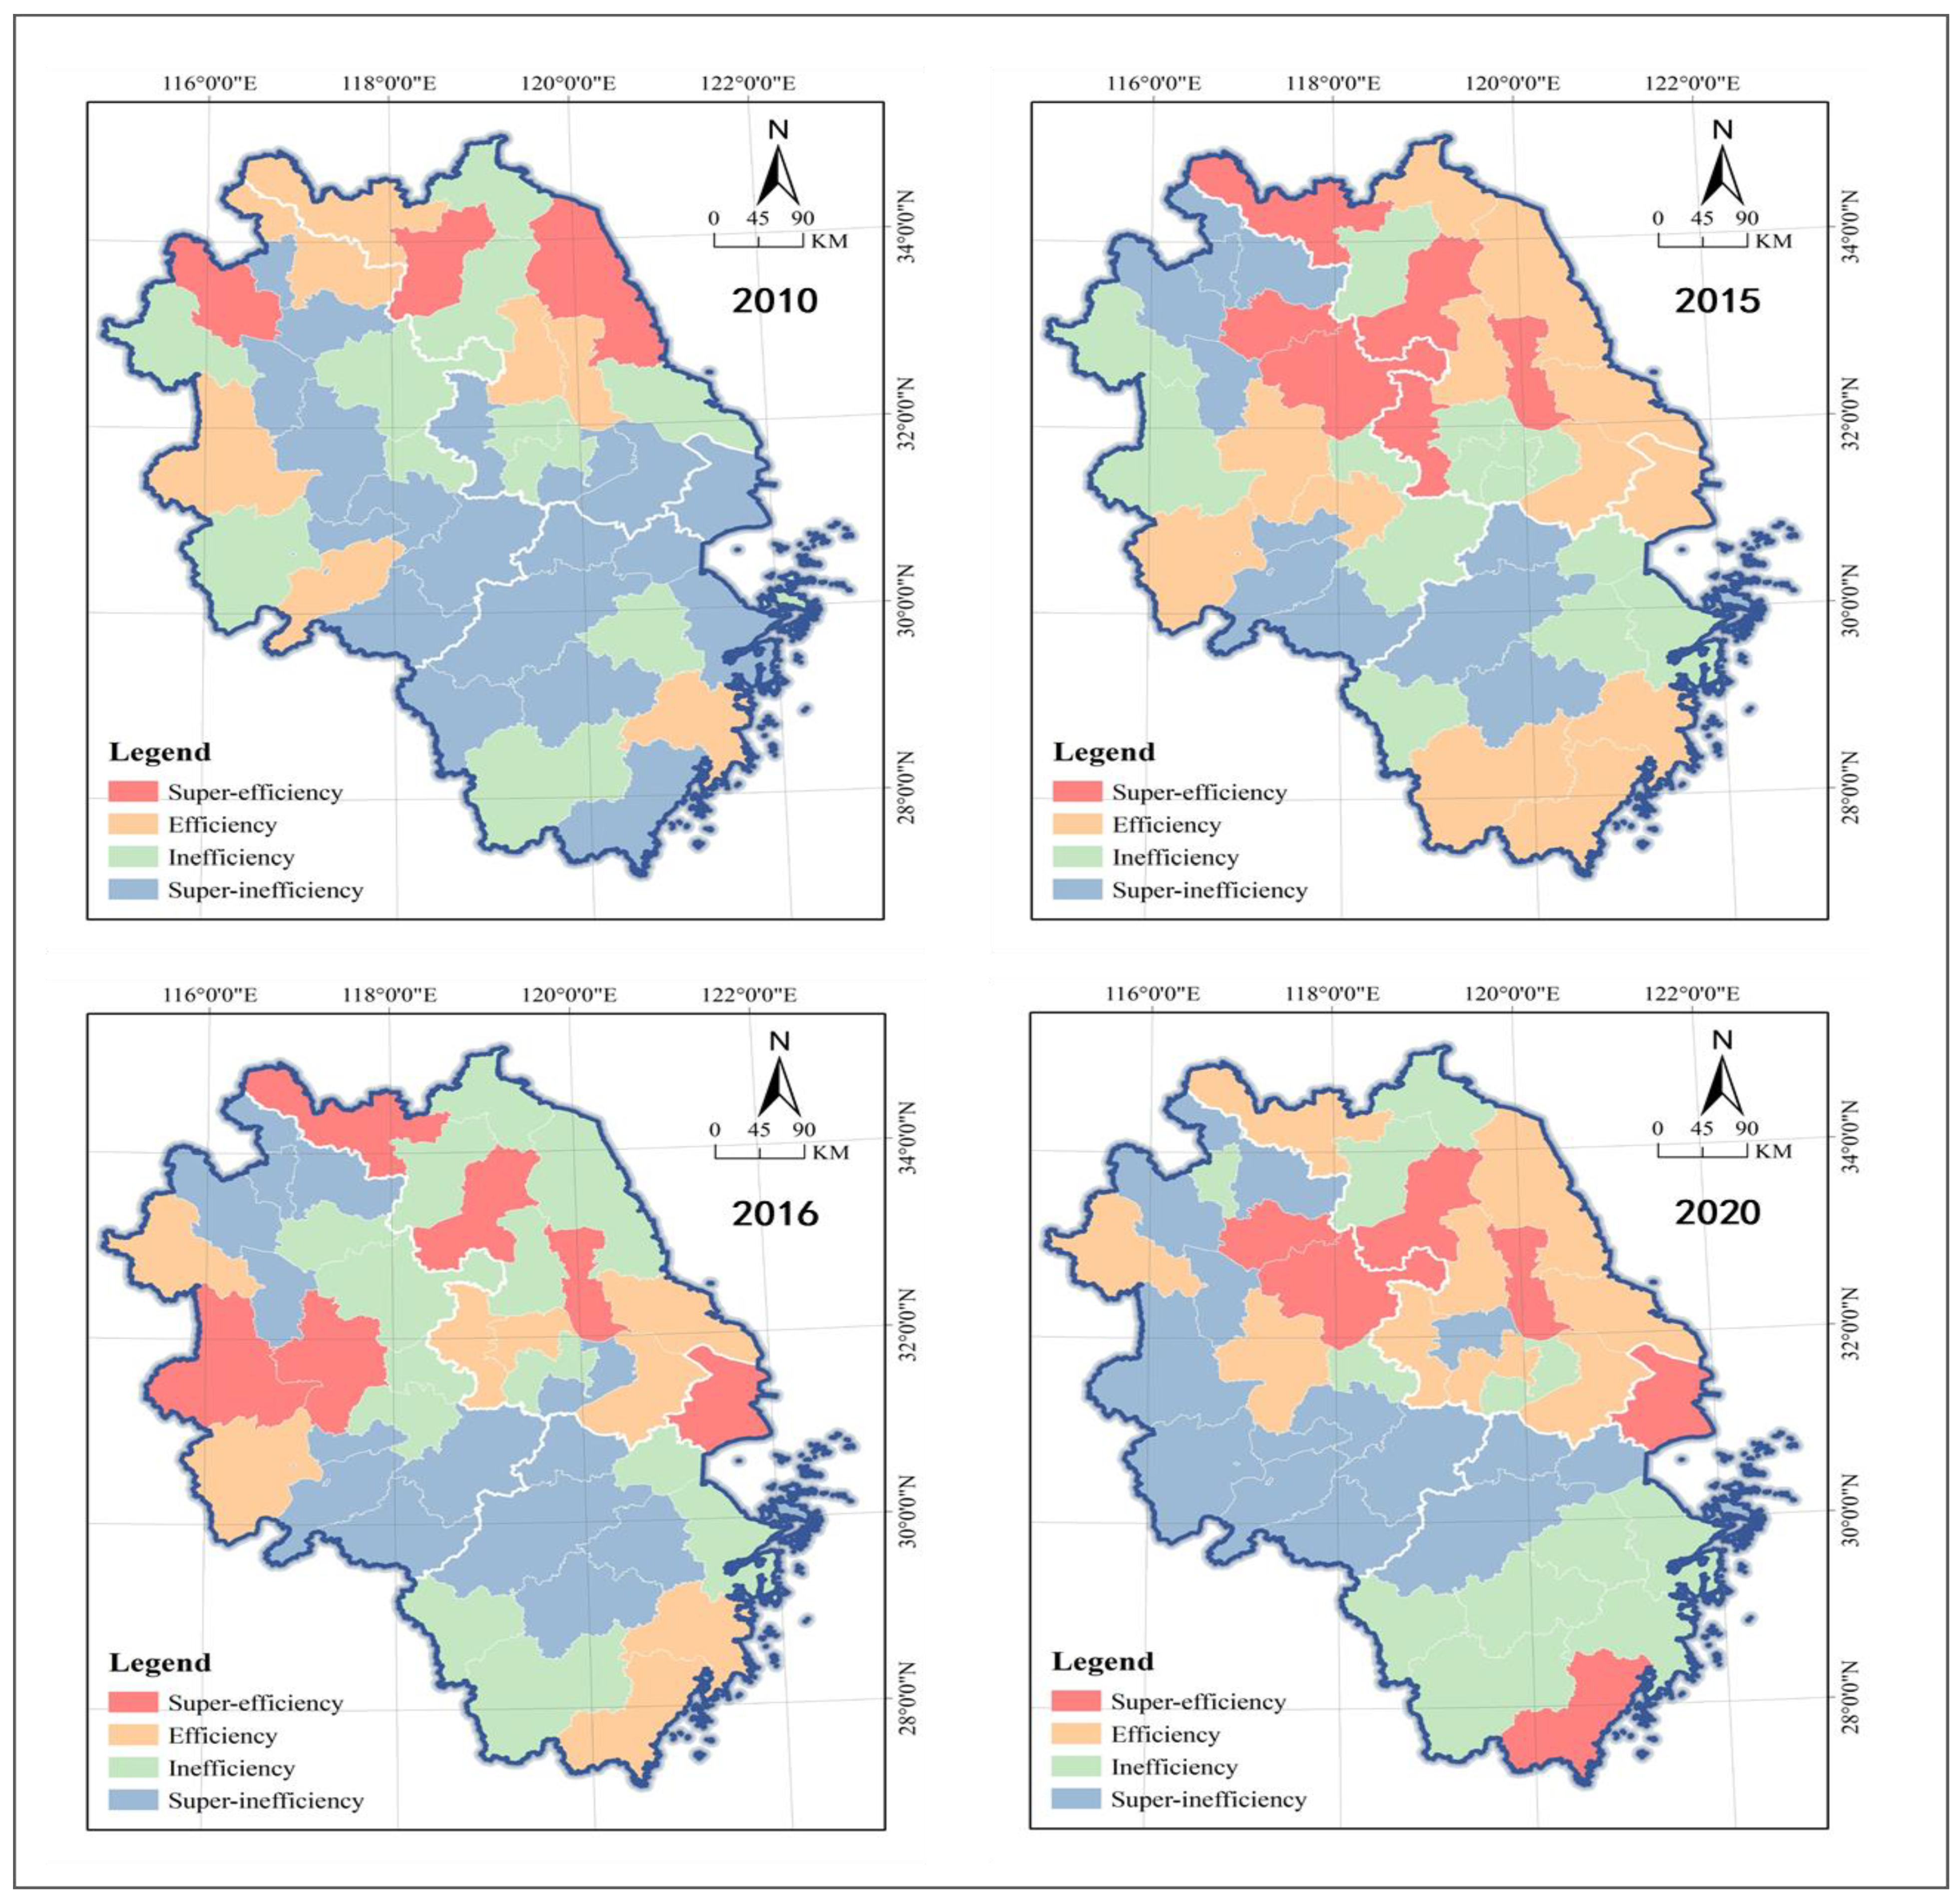
Figure 8.
Analysis on the hot and cold area of pure technical efficiency in Yangtze River Delta.

Figure 9.
Analysis on the pure technical efficiency of real estate inventory in Yangtze River Delta.
Figure 9.
Analysis on the pure technical efficiency of real estate inventory in Yangtze River Delta.
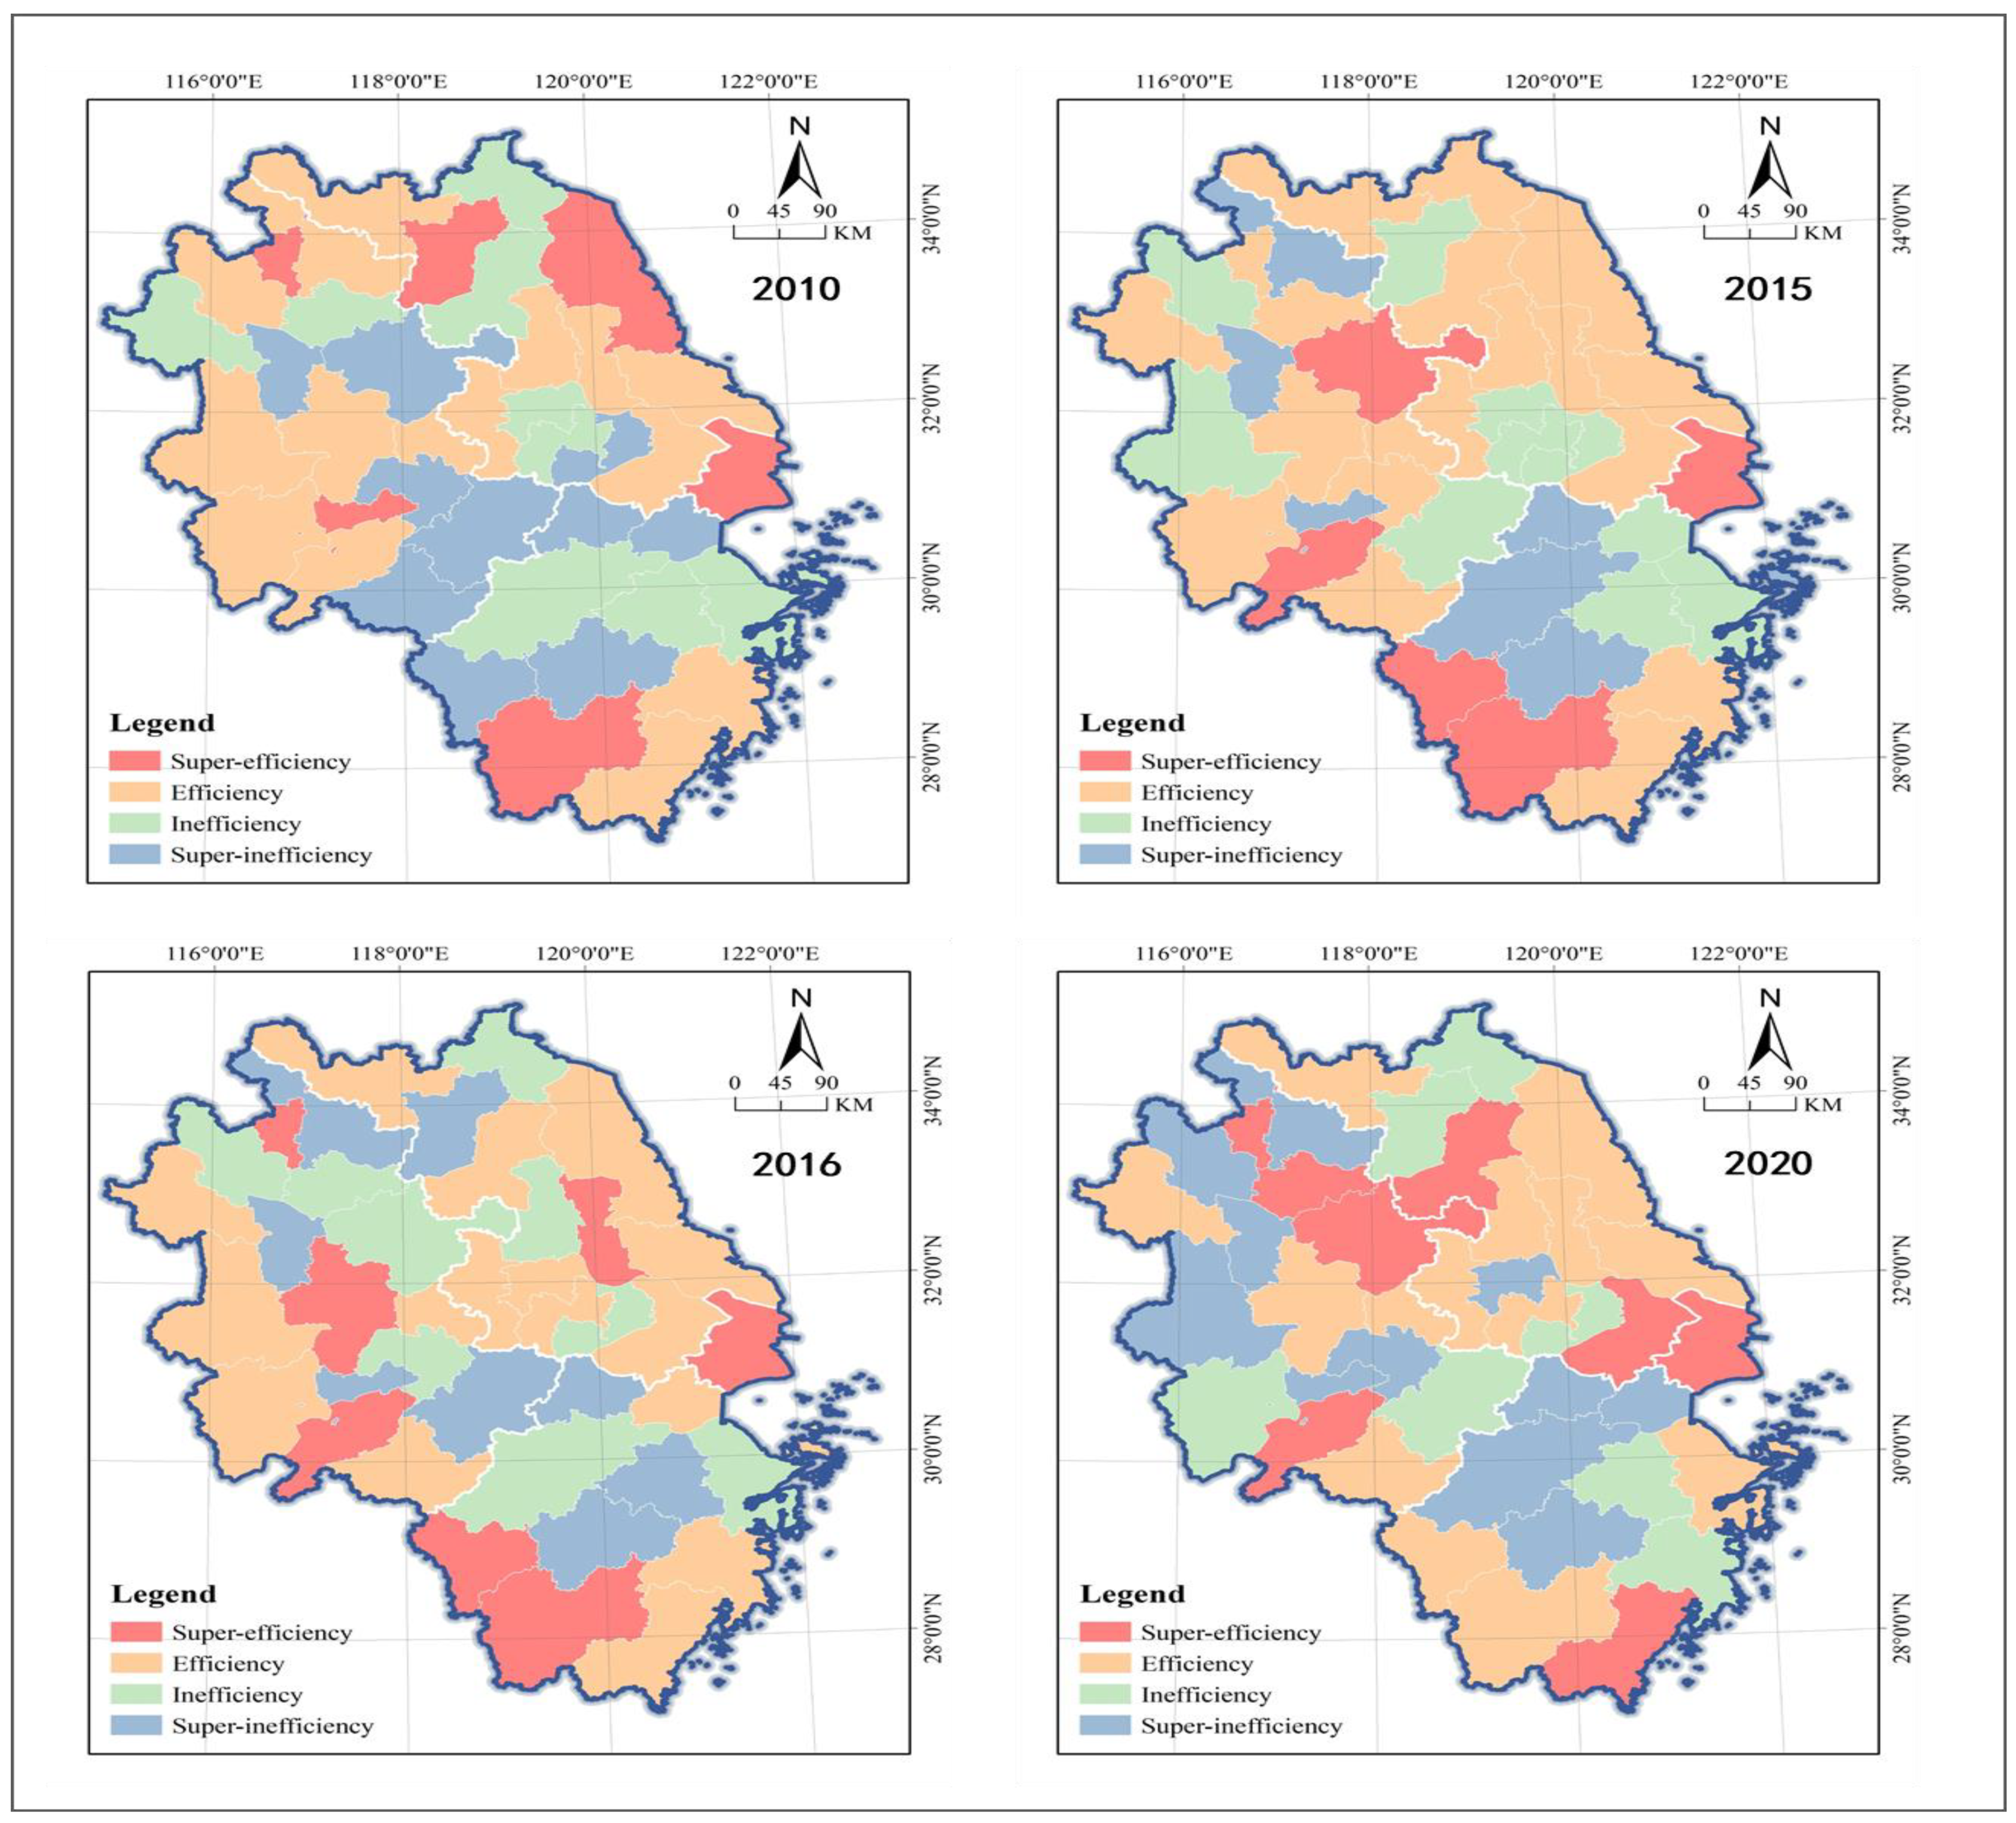
Figure 10.
Analysis on the hot and cold area of scale efficiency in Yangtze River Delta.
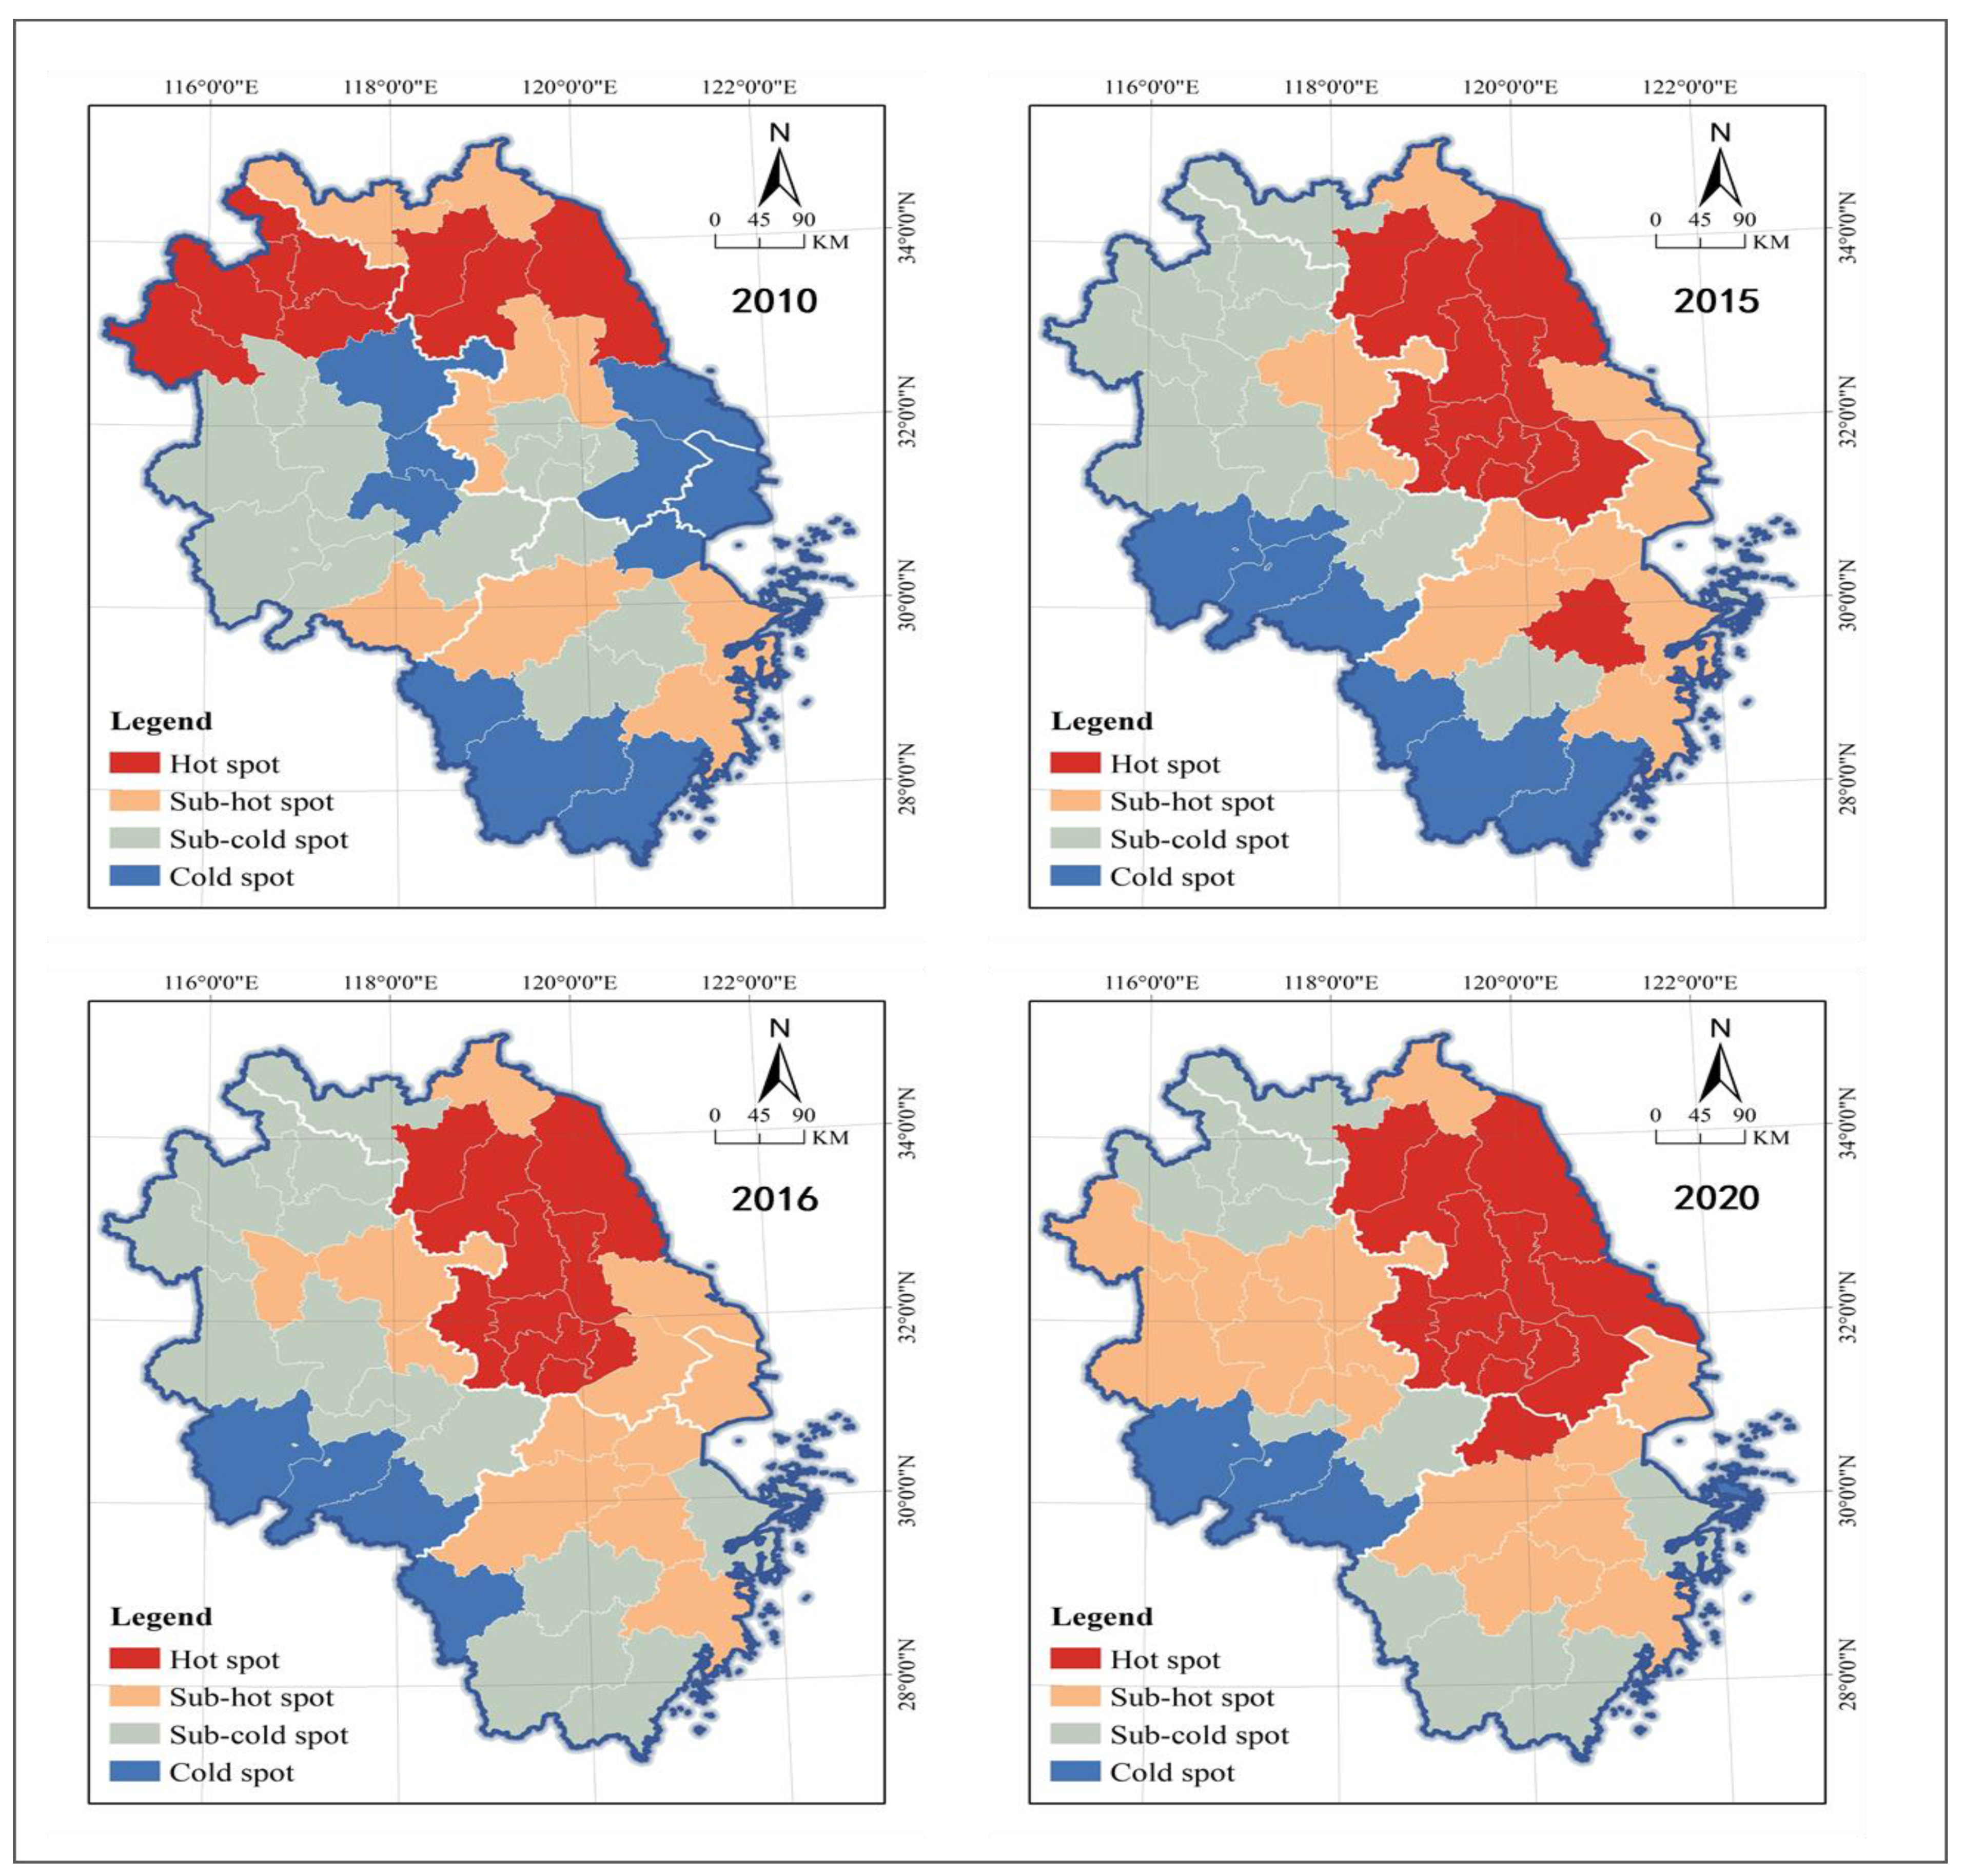
Figure 11.
Analysis on the scale efficiency of real estate inventory in Yangtze River Delta.
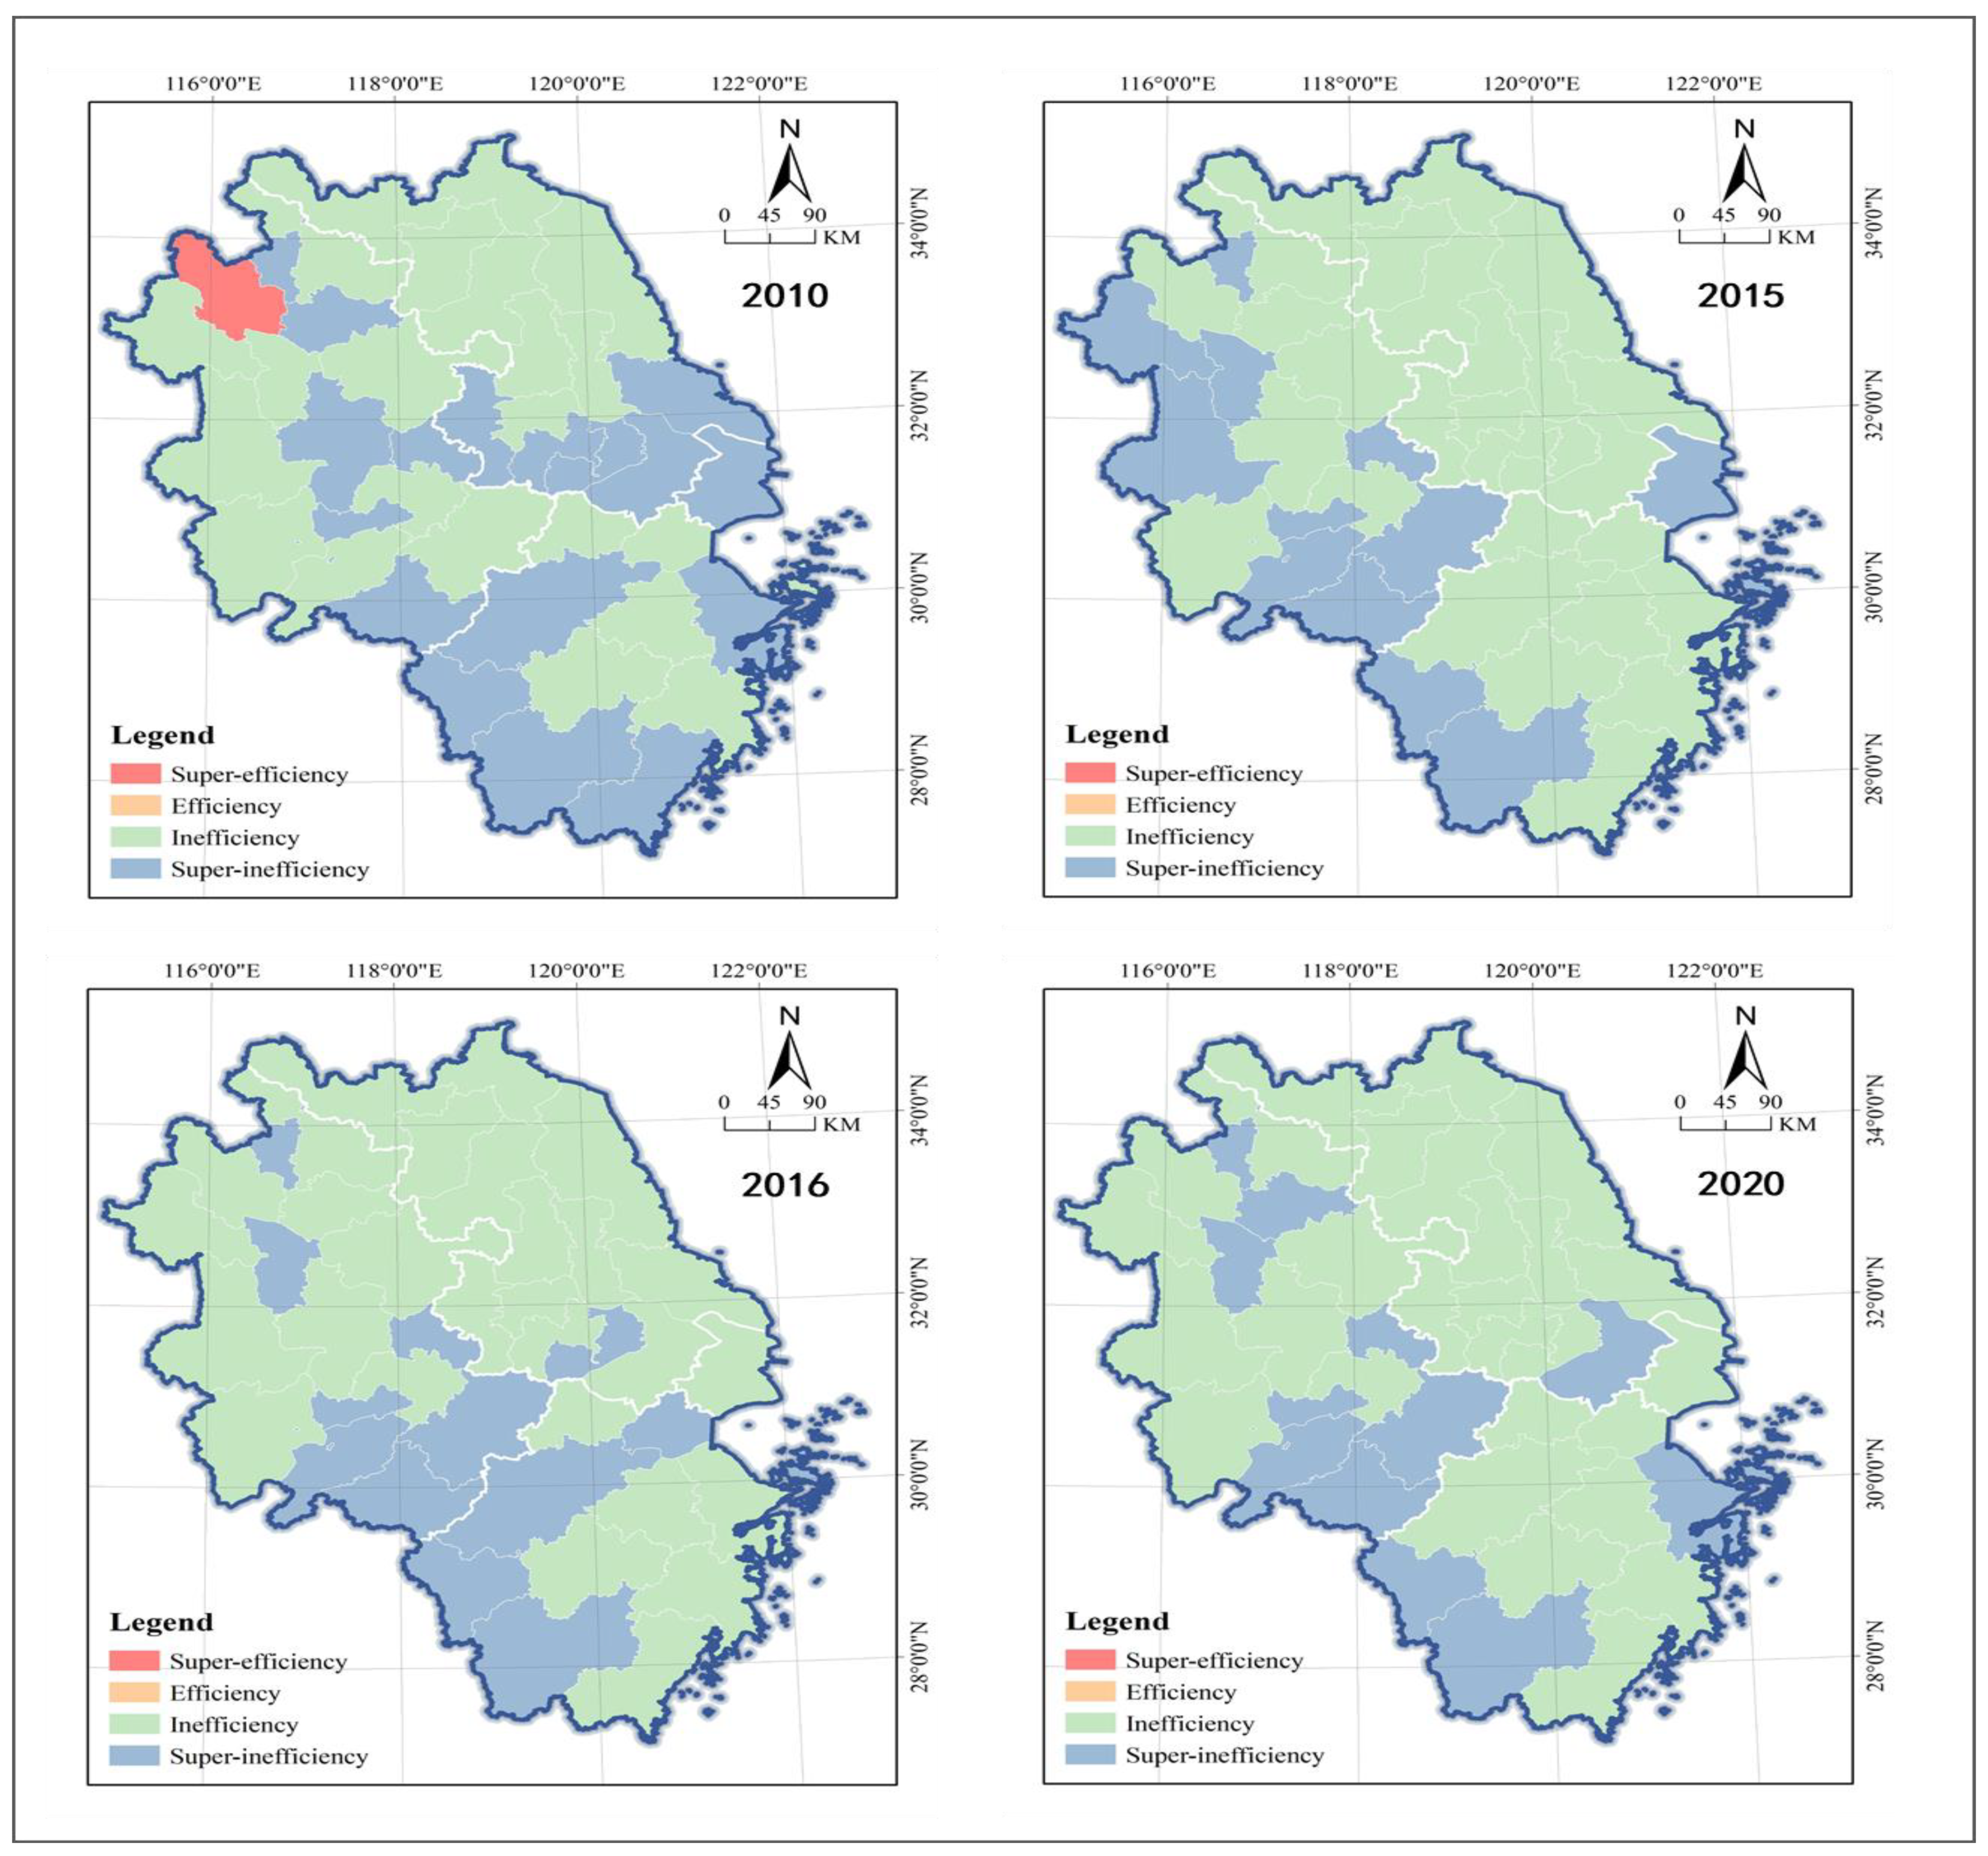
Figure 12.
The policy zoning of real estate inventory management in Yangtze River Delta.


Table 1.
Variable composition analysis.
| Type | Code | Indicator | Meaning |
|---|---|---|---|
| Input | Employee | Number of staff employed by real estate companies, representing human resource input | |
| Construction area | The floor area of all houses constructed in the year, the sum of the building area of each floor of multi-story buildings, representing the material resources input | ||
| Investment amount | Capital investment of real estate enterprises, applied to housing construction, construction of supporting services, land development and acquisition funds, representing financial capital investment | ||
| Output | Industrial added value | The value of output in excess of intermediate inputs in the production and operation of real estate enterprises, including the sum of labor compensation, net production tax, depreciation of fixed assets and operating surplus, according to the relevant regulations of the National Bureau of Statistics of China, representing the macroeconomic efficiency | |
| Sales area | The total contracted area of the houses sold during the year, i.e., the floor area indicated in the official transaction contract signed by the buyer and seller, including both the existing house and the term house sales area, representing the market demand | ||
| Area for sale | The floor area of commercial properties completed and qualified for sale or lease during the year that have not yet been sold or leased, representing the degree of oversupply. Here it refers to the total inventory of real estate, including the total area of residential, office, commercial and other types of commercial housing (the total floor area calculated by floor). |
Table 2.
The change speed and amount of real estate inventory in the Yangtze River Delta.
| Speed (%) | Amount (Million Square Meters) | |||||
|---|---|---|---|---|---|---|
| 2011–2015 | 2016–2020 | 2011–2020 | 2011–2015 | 2016–2020 | 2011–2020 | |
| Shanghai | 10.89 | 7.47 | 16.88 | 6.96 | 6.35 | 11.77 |
| Nanjing | 20.86 | −14.15 | −0.60 | 2.75 | −1.99 | −0.06 |
| Wuxi | 19.24 | −9.58 | 11.79 | 3.68 | −2.79 | 2.02 |
| Xuzhou | 15.02 | 4.64 | 22.69 | 0.60 | 0.30 | 1.02 |
| Changzhou | 49.61 | −6.28 | 34.48 | 5.06 | −1.22 | 2.87 |
| Suzhou-JS | 16.99 | −3.01 | 10.03 | 4.96 | −1.08 | 2.64 |
| Nantong | 55.07 | −16.78 | 29.43 | 8.27 | −5.26 | 3.12 |
| Lianyungang | 25.83 | −13.96 | 11.69 | 0.97 | −0.82 | 0.36 |
| Huai’an | 27.81 | −11.37 | 13.12 | 1.47 | −0.89 | 0.56 |
| Yancheng | 114.19 | 1.16 | 93.17 | 4.68 | 0.15 | 3.02 |
| Yangzhou | 29.66 | −8.53 | 23.00 | 2.03 | −1.09 | 1.43 |
| Zhenjiang | 39.59 | 2.16 | 30.81 | 3.10 | 0.27 | 2.14 |
| Taizhou-JS | 51.88 | −14.38 | 32.37 | 3.29 | −2.01 | 1.58 |
| Suqian | 64.26 | −11.78 | 47.35 | 2.54 | −1.24 | 1.50 |
| Hangzhou | 29.07 | −14.08 | 8.33 | 6.33 | −4.10 | 1.35 |
| Ningbo | 47.33 | −13.18 | 26.44 | 5.95 | −3.12 | 2.50 |
| Wenzhou | 40.84 | −19.71 | 12.05 | 1.58 | −1.20 | 0.31 |
| Jiaxing | 26.58 | −14.25 | 3.61 | 3.25 | −2.03 | 0.32 |
| Huzhou | 30.56 | −17.21 | 4.87 | 2.82 | −2.02 | 0.31 |
| Shaoxing | 30.20 | −22.00 | 5.60 | 4.01 | −4.53 | 0.52 |
| Jinhua | 33.63 | −5.70 | 24.55 | 1.96 | −0.57 | 1.26 |
| Quzhou | 13.23 | −6.81 | 7.63 | 0.40 | −0.27 | 0.21 |
| Zhoushan | 76.09 | −14.09 | 55.35 | 0.96 | −0.54 | 0.54 |
| Taizhou-ZJ | 39.41 | −18.35 | 29.03 | 1.33 | −1.66 | 0.85 |
| Lishui | 18.47 | −3.05 | 29.02 | 0.17 | −0.06 | 0.31 |
| Hefei | 11.01 | 8.22 | 12.49 | 0.89 | 0.74 | 1.03 |
| Wuhu | 29.11 | −5.35 | 29.92 | 0.63 | −0.25 | 0.66 |
| Bengbu | 21.70 | −22.89 | 4.65 | 0.32 | −0.59 | 0.05 |
| Huainan | 32.17 | −19.34 | 2.65 | 0.83 | −0.61 | 0.04 |
| Maanshan | 29.34 | −27.52 | −11.08 | 1.32 | −1.21 | −0.28 |
| Huaibei | 39.12 | −17.15 | 14.41 | 0.58 | −0.40 | 0.15 |
| Tongling | 98.26 | −0.90 | 102.87 | 1.37 | −0.06 | 1.51 |
| Anqing | 50.24 | −11.55 | 35.46 | 1.69 | −0.88 | 0.98 |
| Huangshan | 34.07 | −8.28 | 19.80 | 1.13 | −0.43 | 0.54 |
| Chuzhou | 56.91 | −20.86 | 20.45 | 2.45 | −1.58 | 0.54 |
| Fuyang | 42.11 | −13.08 | 28.20 | 0.57 | −0.38 | 0.31 |
| Suzhou-AH | 45.88 | −16.46 | 24.31 | 1.27 | −0.91 | 0.50 |
| Lu’an | 59.59 | −13.07 | 33.18 | 1.92 | −0.83 | 0.75 |
| Bozhou | 180.02 | −7.44 | 162.38 | 0.88 | −0.25 | 0.68 |
| Chizhou | 40.06 | −4.37 | 31.80 | 0.89 | −0.18 | 0.63 |
| Xuancheng | 47.76 | −14.11 | 22.92 | 1.55 | −0.79 | 0.53 |
Table 3.
The technical efficiency index of real estate inventory in the Yangtze River Delta.
| 2011 | 2015 | 2016 | 2020 | |
|---|---|---|---|---|
| Max-Index | 2.32 | 1.17 | 1.16 | 1.15 |
| Min-Index | 0.23 | 0.32 | 0.31 | 0.42 |
| Index average of effective cities | 1.26 | 1.05 | 1.07 | 1.06 |
| Index average of ineffective cities | 0.45 | 0.57 | 0.63 | 0.67 |
| Proportion of effective cities | 24.39 | 43.90 | 34.15 | 36.59 |
Table 4.
The pure technical efficiency index of real estate inventory in the Yangtze River Delta.
| 2011 | 2015 | 2016 | 2020 | |
|---|---|---|---|---|
| Max-Index | 1.59 | 2.54 | 1.41 | 1.71 |
| Min-Index | 0.29 | 0.34 | 0.51 | 0.55 |
| Index average of effective cities | 1.16 | 1.16 | 1.11 | 1.14 |
| Index average of ineffective cities | 0.56 | 0.61 | 0.70 | 0.72 |
| Proportion of effective cities | 51.22 | 58.54 | 58.54 | 56.10 |
Table 5.
The scale effect of real estate inventory in the Yangtze River Delta.
| 2011 | 2015 | 2016 | 2020 | Overall | |
|---|---|---|---|---|---|
| Shanghai | 1 | 1 | 1 | 1 | Long term—increasing returns to scale |
| Nanjing | 1 | 1 | 1 | 1 | Long term—increasing returns to scale |
| Wuxi | 1 | 1 | 1 | 1 | Long term—increasing returns to scale |
| Xuzhou | 1 | 1 | −1 | 1 | Increasing returns to scale |
| Changzhou | 1 | 1 | 1 | −1 | Increasing returns to scale |
| Suzhou-JS | 1 | 1 | 1 | 1 | Long term—increasing returns to scale |
| Nantong | 1 | −1 | 1 | 1 | Increasing returns to scale |
| Lianyungang | 1 | −1 | −1 | −1 | Decreasing returns to scale |
| Huai’an | 1 | 1 | −1 | −1 | Return to scale from increasing to decreasing |
| Yancheng | 1 | 1 | 1 | 1 | Increasing returns to scale |
| Yangzhou | 1 | −1 | 1 | −1 | Return to scale from increasing to decreasing |
| Zhenjiang | −1 | −1 | 1 | −1 | Decreasing returns to scale |
| Taizhou-JS | 1 | −1 | −1 | −1 | Decreasing returns to scale |
| Suqian | −1 | −1 | −1 | −1 | Long term—decreasing returns to scale |
| Hangzhou | 1 | 1 | 1 | 1 | Long term—increasing returns to scale |
| Ningbo | 1 | 1 | 1 | 1 | Long term—increasing returns to scale |
| Wenzhou | 1 | 1 | −1 | 1 | Increasing returns to scale |
| Jiaxing | −1 | 1 | 1 | 1 | Increasing returns to scale |
| Huzhou | −1 | −1 | −1 | −1 | Long term—decreasing returns to scale |
| Shaoxing | 1 | 1 | 1 | 1 | Long term—increasing returns to scale |
| Jinhua | −1 | −1 | −1 | −1 | Long term—decreasing returns to scale |
| Quzhou | −1 | −1 | −1 | −1 | Long term—decreasing returns to scale |
| Zhoushan | −1 | −1 | −1 | −1 | Long term—decreasing returns to scale |
| Taizhou-ZJ | 1 | −1 | −1 | −1 | Decreasing returns to scale |
| Lishui | −1 | −1 | −1 | −1 | Long term—decreasing returns to scale |
| Hefei | 1 | 1 | 1 | 1 | Long term—increasing returns to scale |
| Wuhu | −1 | 1 | −1 | −1 | Decreasing returns to scale |
| Bengbu | −1 | −1 | −1 | −1 | Long term—decreasing returns to scale |
| Huainan | −1 | −1 | −1 | −1 | Long term—decreasing returns to scale |
| Maanshan | −1 | −1 | −1 | −1 | Long term—decreasing returns to scale |
| Huaibei | −1 | −1 | −1 | −1 | Long term—decreasing returns to scale |
| Tongling | −1 | −1 | −1 | −1 | Long term—decreasing returns to scale |
| Anqing | 1 | −1 | −1 | −1 | Decreasing returns to scale |
| Huangshan | −1 | −1 | −1 | −1 | Long term—decreasing returns to scale |
| Chuzhou | −1 | 1 | −1 | −1 | Decreasing returns to scale |
| Fuyang | −1 | −1 | −1 | 1 | Decreasing returns to scale |
| Suzhou-AH | −1 | −1 | −1 | −1 | Long term—decreasing returns to scale |
| Lu’an | −1 | −1 | −1 | −1 | Long term—decreasing returns to scale |
| Bozhou | −1 | −1 | −1 | −1 | Long term—decreasing returns to scale |
| Chizhou | −1 | −1 | −1 | −1 | Long term—decreasing returns to scale |
| Xuancheng | −1 | −1 | −1 | −1 | Long term—decreasing returns to scale |
Note: “1” represents increasing returns to scale, and “−1” represents decreasing returns to scale.
Table 6.
The benchmark suggestions of real estate inventory in the Yangtze River Delta.
| City | Benchmark |
|---|---|
| Wuxi | Nantong (0.42); Suzhou-JS (0.18); Taizhou-JS (0.14); Yangzhou (0.26) |
| Zhenjiang | Chizhou (0.26); Huai’an (0.24); Taizhou-JS (0.50) |
| Shanghai | Suzhou-JS (1.00) |
| Suzhou-JS | Ningbo (0.80); Shanghai (0.20) |
| Yancheng | Huai’an (0.69); Nantong (0.14); Taizhou-JS (0.16) |
| Ningbo | Chuzhou (0.38); Suzhou-JS (0.40); Xuzhou (0.22) |
| Lishui | Huaibei (0.79); Maanshan (0.14); Wenzhou (0.03); Yangzhou (0.04) |
| Hefei | Nanjing (0.01); Suzhou-JS (0.24); Wenzhou (0.65); Xuzhou (0.10) |
| Changzhou | Chuzhou (0.1); Nantong (0.19); Taizhou-JS (0.26); Yangzhou (0.48) |
| Huangshan | Chizhou (0.70); Quzhou (0.27); Taizhou-JS (0.02) |
| Quzhou | Chizhou (0.60); Huaibei (0.34); Yangzhou (0.06) |
| Chizhou | Quzhou (1.00) |
| Tongling | Chizhou (0.85); Huai’an (0.03); Taizhou-JS (0.12) |
| Hangzhou | Chuzhou (0.36); Nantong (0.03); Suzhou-JS (0.52); Wenzhou (0.10) |
| Shaoxing | Chuzhou (0.46); Nantong (0.26); Yangzhou (0.28) |
| Jinhua | Chuzhou (0.25); Huaibei (0.40); Yangzhou (0.35) |
| Wuhu | Huai’an (0.39); Huaibei (0.54); Yangzhou (0.07) |
| Bozhou | Bengbu (0.05); Chuzhou (0.50); Huaibei (0.45) |
| Xuzhou | Hefei (0.02); Huai’an (0.43); Nantong (0.17); Wenzhou (0.38) |
| Nantong | Chuzhou (0.00); Ningbo (0.04); Wuxi (0.73); Xuzhou (0.23) |
| Yangzhou | Chuzhou (0.14); Huaibei (0.03); Quzhou (0.41); Suzhou-JS (0.18); Taizhou-JS (0.25) |
| Maanshan | Hefei (0.02); Huai’an (0.05); Huaibei (0.93); Yangzhou (0.00) |
| Zhoushan | Huaibei (0.57); Huangshan (0.43) |
| Huaibei | Chizhou (0.31); Lishui (0.69); Zhoushan (0.00) |
| Anqing | Chizhou (0.21); Huai’an (0.46); Huaibei (0.12); Quzhou (0.21) |
| Suqian | Chizhou (0.14); Chuzhou (0.28); Huai’an (0.58) |
| Xuancheng | Chizhou (0.12); Chuzhou (0.21); Huaibei (0.67) |
| Lianyungang | Chuzhou (0.02); Huai’an (0.42); Huaibei (0.47); Wenzhou (0.01); Yangzhou (0.08) |
| Jiaxing | Chuzhou (0.62); Nantong (0.17); Yangzhou (0.21) |
| Huzhou | Chuzhou (0.77); Huaibei (0.23) |
| Taizhou-ZJ | Chuzhou (0.13); Huaibei (0.21); Wenzhou (0.33); Yangzhou (0.33) |
| Huainan | Chuzhou (0.06); Huaibei (0.94) |
| Suzhou-AH | Chuzhou (0.66); Huaibei (0.34) |
| Lu’an | Chuzhou (0.48); Huaibei (0.52) |
| Nanjing | Hefei (0.14); Suzhou-JS (0.17); Wenzhou (0.69) |
| Wenzhou | Bengbu (0.21); Fuyang (0.58); Nanjing (0.21) |
| Chuzhou | Fuyang (0.08); Huaibei (0.73); Nantong (0.12); Xuzhou (0.07) |
| Fuyang | Bengbu (0.79); Chuzhou (0.16); Xuzhou (0.05) |
| Bengbu | Fuyang (0.33); Huaibei (0.59); Wenzhou (0.08) |
| Taizhou-JS | Chizhou (0.50); Nantong (0.20); Yancheng (0.13); Yangzhou (0.17) |
| Huai’an | Chuzhou (0.35); Lianyungang (0.41); Xuzhou (0.07); Yancheng (0.17) |
Table 7.
The input management suggestions of real estate inventory in the Yangtze River Delta.
| City | Employee | Construction Area | Investment Amount |
|---|---|---|---|
| Wuxi | −0.05 | 0 | −55 |
| Zhenjiang | −0.28 | −625 | −45 |
| Tongling | −0.35 | 0 | −31 |
| Hangzhou | −1.12 | −4819 | −1849 |
| Shaoxing | −0.18 | −248 | −110 |
| Jinhua | −0.22 | −596 | −60 |
| Wuhu | −0.75 | −422 | −170 |
| Bozhou | −0.46 | −747 | −68 |
| Anqing | −0.33 | 0 | 0 |
| Suqian | −0.09 | −82 | 0 |
| Xuancheng | −0.11 | −217 | 0 |
| Lianyungang | 0 | −318 | −24 |
| Jiaxing | −0.23 | −1523 | −400 |
| Huzhou | −0.41 | −1211 | −190 |
| Taizhou-ZJ | −0.13 | −1143 | −113 |
| Huainan | −0.55 | −159 | −57 |
| Suzhou-AH | −0.58 | −559 | −45 |
| Lu’an | −0.16 | −1309 | −59 |
Note: The redundancy rate of inputs in other cities is under control, and focus should be placed on improving management and production technology in the future development; factor inputs are not the core of management.
Publisher’s Note: MDPI stays neutral with regard to jurisdictional claims in published maps and institutional affiliations. |
© 2022 by the authors. Licensee MDPI, Basel, Switzerland. This article is an open access article distributed under the terms and conditions of the Creative Commons Attribution (CC BY) license (https://creativecommons.org/licenses/by/4.0/).
Share and Cite
MDPI and ACS Style
Zhang, P.; Chen, H.; Zhao, K.; Zhao, S.; Li, W. Dynamics, Risk and Management Performance of Urban Real Estate Inventory in Yangtze River Delta. Buildings 2022, 12, 2140. https://doi.org/10.3390/buildings12122140
AMA Style
Zhang P, Chen H, Zhao K, Zhao S, Li W. Dynamics, Risk and Management Performance of Urban Real Estate Inventory in Yangtze River Delta. Buildings. 2022; 12(12):2140. https://doi.org/10.3390/buildings12122140
Chicago/Turabian StyleZhang, Ping, Hua Chen, Kaixu Zhao, Sidong Zhao, and Weiwei Li. 2022. "Dynamics, Risk and Management Performance of Urban Real Estate Inventory in Yangtze River Delta" Buildings 12, no. 12: 2140. https://doi.org/10.3390/buildings12122140
Note that from the first issue of 2016, this journal uses article numbers instead of page numbers. See further details here.