Abstract
This research developed a framework for electronic planning and management of facility services utilizing blockchain technology. In this framework, an electronic Facility Service Record (eFSR) in blockchain form was developed to manage and control service orders received by its main service center from university facilities via an electronic system. Mathematical models were formulated to determine the optimal schedule and sequence of facility services under probabilistic service order arrivals and stochastic service durations. Each task of a facility service is treated as a block. The scheduling model then assigned blocks (service tasks) to skilled technicians on each scheduling period at a minimal total cost of delay, undertime, and overtime costs, while the sequencing model determined the start and finish times of each block during the planning period. The optimal information of blocks was then confirmed and shared through an electronic network among all relevant facilities and the service center. The developed framework was implemented in university facilities to plan and manage 47 service orders for a total of 140 tasks over a period of twelve days. The results showed that the proposed eFSR is effective in managing optimal service tasks and efficient in improving the utilization and performance of the service center resources. In conclusion, the proposed eFSR with the optimal facility service planning provides real-time assistance and decentralized technology to facilities managers when planning service tasks over multiple periods. These advantages will result in the effective management of facilities and a considerable savings in maintenance resources.
1. Introduction
Facilities management is a revolutionary profession that adds value to the built environment and is recognized as an activity that can achieve effective management of buildings, services, and associated workforce, in support of the long-term goals of an organization [1]. Its main focus is on optimizing the running costs of buildings as well as raising the efficiency and suitability of resource management. Frequently, decisions for facility management services require the integration of various types of information and knowledge created by different members of facilities, such as work orders, checklists, maintenance records, and causes and effects of failures. Failing to capture and use relevant information in real-time results in ineffective decisions and additional costs [2,3]. Therefore, the main role of facility managers is to harmonize and provide a safe and efficient working environment.
In practice, facilities managers are responsible for coordinating and managing an extremely wide range of specialist areas, including property and estates, maintenance and operations, IT, and support services. Their key role is resource management at the strategic level, planning for service provision based on business demands, as well as at the operational level with the day-to-day support of operations [4]. Such tasks involve the management of a complex set of interacting services and systems to achieve business objectives. At the same time, a huge amount of information flows within the organization which will overload facilities managers and can affect the decision-making process [5]. Effective data management and sharing is a primary activity for the efficient planning and management of facility services that support decision-making at operational and strategic levels.
Recently, significant advancements in computer technology have enabled facility managers to record, store, manage, access, and communicate a wealth of information. Today, organizations can store, process, and analyze a large amount of data in the hopes of extracting meaningful information [6]. Blockchain technology has emerged as a revolutionary digital technology [7]. It can be employed for effective data sharing and data protection while improving interoperability and reducing costs. A blockchain is a decentralized ledger in which all blocks are linked together to track all the transactions [8,9,10]. When data is recorded in the distributed blockchain ledger, this data is verified and then restricted access is made for amendment or deletion. Blockchains provide efficient and secure data storage and sharing of the dynamic records of value for facility services [11,12,13]. Each facility service in the blockchain is treated as a block, which is composed of several elements as shown in Figure 1.
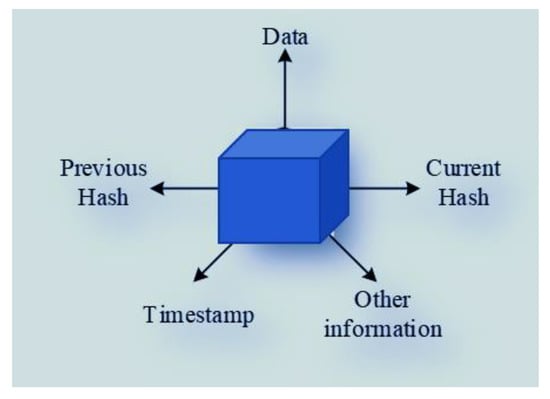
Figure 1.
Individual block with its main components.
In traditional facilities management, extracting data from paper documents consumes considerable time and effort. Unfortunately, accumulated paper documents increase errors and rework if one of the reports or any paper documents were lost [14,15]. Consequently, one of the most critical issues for improving a facility service system is implementing digital or electronic forms of data [16,17]. Electronic records are clusters of information in digital form, which positively impacts service quality and leads to cost reduction [18,19]. Nowadays, the vast development of data management and sharing technology has resulted in significant improvements to service quality in a wide range of business aspects [20,21]. Still, the increasing complexity and variety of services challenge facility managers to constantly strive for cutting incurred costs through effective planning and management of facility services while maximizing resource utilization [22,23].
Therefore, this research develops a blockchain framework for optimal management and planning of facility services called an Electronic Facility Services Record (eFSR). Optimization models are effective methods for determining the relevant block information [24,25,26,27,28]. In this framework, two mathematical optimization models are formulated for scheduling and sequencing facility services. The adoption of the developed system provides effective and secure information management and sharing directly to facility managers which facilitates the decision-making process and helps to achieve organizational goals. The remainder of this paper, including the introduction, is outlined as follows. Section 2 presents the developed eFSR system. Section 3 illustrates the application of eFSR in a real case study. Section 4 presents the research results. Section 5 summarizes conclusions and future research.
2. Electronic Facility Services Record
Typically, an organization is composed of several facilities as shown in Figure 2. The various facility service orders are sent via a cloud-based system or electronic system to the service center for planning and execution as shown in Figure 3. The service center is supported by skilled technicians who have specified skills and are responsible for performing the required facility services as shown in Figure 2. In this research, each service order is treated as a block with a pre-assigned due date and other relevant information regarding identification and tracking, type, and technicians’ skill requirements. An electronic facility service record (eFSR) is created for each building in the system. Each facility service may consist of one or more service tasks.
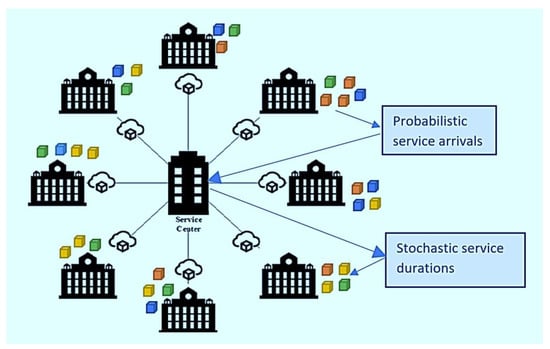
Figure 2.
Service order tasks (blocks represent tasks).
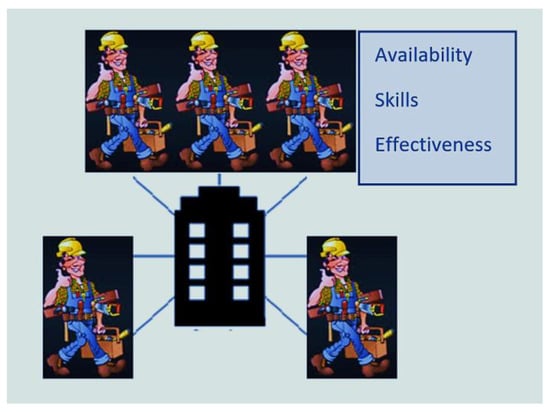
Figure 3.
Service center.
Facility services may include maintenance of oil and fat traps, maintenance of lifts, waste disposal, woodworking, and electric repairs. Suppose that a service order j; j = 1, …, J, consists of service task k; k = 1, …, K, of type e; e = 1, …, E. Each task k requires a particular skill s; s = 1, …, S, and is to be assigned to a dedicated technician c; c = 1, …, C, who has skill s; s = 1, …, S, needed to handle service task k. Finally, task k should be planned for execution within the specified time interval i; i = 1, …, I.
2.1. Scheduling Optimization Model
The optimization model for scheduling service tasks is formulated as follows:
- (a)
- Objective functions
- (i)
- Minimizing idle time and overtime costs
The objective function of the optimization model for scheduling service tasks is to minimize the incurred idle and overtime costs. Let Tdlt denote the total idle times in hours incurred by all technicians in all intervals while cdl denotes the unit cost per idle hour. Then, the total cost of idle time, TCdl, is mathematically expressed as:
Let Tovt denote the total overtime (hours) incurred by all technicians in all intervals and let cov denote the overtime cost per hour. Then, the total of overtime costs, TCov, is calculated using Equation (2).
Merging Equations (1) and (2), the first objective function is stated as given in Equation (3).
- (ii)
- Maximizing number of completed tasks for all buildings
Let Zjkeci be a binary decision variable that determines whether task k of service order j of type e is assigned to technician c in interval i, where a value of one indicates that task k is assigned and zero indicates otherwise. The second objective function seeks to maximize the number of completed tasks for all buildings, or mathematically:
+Constraints of scheduling model
The two objective functions are subjected to the following constraints:
- The order time of each service j, sotj, is treated as a probabilistic parameter with discrete possible outcomes associated with different probabilities. Based on technical knowledge, the possible outcome for the ordering times xz (xz = x1, …, XZ) is associated with a probability, pz (pz = p1, …, PZ) as given in constraints (5) and (6). Inequality (7) states that sotj cannot be a negative value.
- Task k from order j is only assigned to technician c during period i at or after sotj as stated in Equations (8) and (9).
- Practically, the task execution durations are stochastic parameters modeled by continuous normal distributions. Let sdtk denote the standard duration required to complete task k. The sdtk is generated from a normal distribution which is characterized separately for each type e with mean µe and standard deviation σe as expressed in Equation (10). Further, the sdtk shall be a non-negative value as stated in Inequality (11).
- Let adtk denote the actual duration required to execute task k. The adtk depends on technician effectiveness, βc, which is different from one technician to another. Hence, the actual time, adtk, should be equal to sdtk when βc is 100%; however, when βc is less than 100%, adtk will be longer than sdtk. Mathematically, this is presented in Equation (12).
- Let Tadtci denote the total actual task durations executed by technician c in interval i. Then, Tadtci is calculated as presented in Equation (13).
- Let dlci denote the idle time incurred by technician c in interval i. In addition, let avci be a binary variable that indicates the availability of technician c in interval i, where the value of one means that technician c is available in interval i and zero means otherwise. Then, the dlci is calculated by subtracting tadtci from the threshold hour of idle time, h, if the technician was available in that interval, avci, as presented in Equation (14).
- The dlci should be greater than or equal to zero and less than or equal to the maximum allowable idle time, mdl, as stated in Inequality (15).
- The total idle time in hours, Tdtl, incurred by all technicians in all intervals is computed as presented in Equation (16).
- Let ovtci denote the overtime incurred by technician c in interval i. Then, the ovtci is calculated when the technician is available in this interval, avci, as shown in Equation (17).
- The ovtci should be greater than or equal to zero and less than or equal to the maximum allowable overtime, mov, as stated in Inequality (18).
- The total overtime in hours, Tovt, incurred by all technicians in all intervals is computed as given in Equation (19).
- The skills required to complete task k should be respected. Thus, task k which requires skills should be assigned to technician c who has at least all the required skills to complete the task. Let ωcs be a binary parameter that determines whether technician c owns skill s, where the value of one indicates that technician c has skill s and zero indicates otherwise. Additionally, let δks be a binary parameter that determines whether task k requires skill s, where a value of one indicates it requires such and zero indicates otherwise. This constraint is mathematically stated in Equation (20).
- Service task k should be assigned only once to technician c in interval i. This is mathematically stated in Equation (21).
- Let χ(ek), (e′k′) be a binary variable which determines whether task k of type e depends on task k′ of type e′, where χ(ek), (e′k′) equals one when the task k depends on task k′ and zero otherwise. Let χ(e′k′), (ek) be a binary variable which determines whether task k′ of type e′ depends on task k of type e, where χ(e′k′), (ek) equals one when the task k′ of type e′ depends on task k of type e and zero otherwise. Assume that there are two tasks k and k′ of types e and e′, respectively. Let task k′ depends on task k. Then, task k should be assigned first; i.e., χ(e′k′), (ek) = 1. In addition, if the task k has not been assigned, then task k′ cannot be assigned as stated in Equation (22). When the execution of task k is scheduled after task k′ (χ(ek), (e′k′) = 1) but task k′ has not been performed yet, then task k cannot be assigned as stated in Equation (23). If task k depends on task k′ (χ(ek), (e′k′) = 1) and task k′ has been assigned, then task k might be assigned to be executed as presented in Equation (24). Similarly, if task k′ depends on task k (χ(e′k′), (ek)= 1) and task k has been assigned to be executed, then task k′ might be assigned to be executed as expressed in Equation (25).
- The variable Zjkeci is binary variable, as stated in Equation (26).
The scheduling model is solved using LINGO 11 solver software by computer with an Intel Core i7-9700 processor, processor Speed 2.5 GHz up to 4.70 GHz, and the results obtained determine the tasks assigned to every technician in each day as shown in Figure 4.
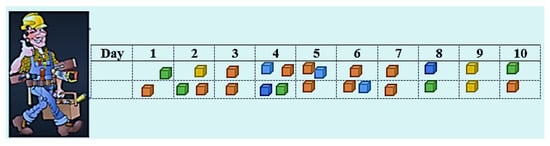
Figure 4.
Results of task scheduling for each technician in each day.
2.2. Sequencing Optimization Model
This step aims to determine the start and finish times of the assigned service tasks. For this purpose, the optimization model for sequencing service tasks is formulated as follows:
- Objective functions
- Minimizing delay costs to ensure that technicians respond quickly to service calls. Assume that a delay in task completion incurs delay costs. Let Tdt denote the total delay time in hours by all technicians in all intervals. In addition, let cdt denote the cost per delay hour. Then, total cost of delay time, TCdt, is mathematically expressed in Equation (27).
Then, the first objective function ensures fast response times by minimizing total delay costs, as stated in Equation (28).
- Minimizing the sum of the start times for the assigned tasks to ensure quick response to all services. Let stjkeci denote the sequencing start time for task k of service j of type e as assigned to technician c in interval i. The start times of service tasks should be sequenced at the earliest possible times to guarantee lower incurred costs. Consequently, the second objective function for sequencing service tasks is formulated to ensure fast response times by minimizing the sequencing start times, as presented in Equation (29).
- 2.
- Constraints of sequencing model
The two objective functions are subjected to key constraints, including:
- (1)
- The execution of any service task k of service j from type e by technician c in interval i should start after the order time of service j, sotj, as expressed in Equation (30).
- (2)
- Let ftjkeci denote the sequencing finish time for task k of type e in service j that is assigned to technician c in interval i. Then, ftjkeci is computed by adding the actual duration required to execute task k, adtk, to the sequencing start time, stjkeci, as calculated in Equation (31).
- (3)
- Let ftbj denote the finish time of service j. Therefore, ftbj should equal the finish time of the latest executed task k from service j of type e by technician c in interval i ftjkeci, as stated in Equation (32).
- (4)
- Let dutj denote the due date for completing service j. The delay time is incurred when the execution of any service extends after its due date, dutj. Then, the total delay time, Tdt, can be calculated—see Inequality (33)—as the difference between the service finish time, ftbj, and its due date, dutj. Moreover, the difference should be greater than or equal to zero as stated in Equation (34).
- (5)
- Technician c cannot perform more than one task at the same time. For example, suppose that technician c was assigned to complete task k of service j and task k’ of service j’ in the same interval i. Then, the sequencing start times for tasks k and k’ should not be set at the same time as expressed in Inequalities (35) and (36). Let service j’ belong to the set of J services (j’ ∈ J); task k’ belongs to the set of K tasks (k’ ∈ K); type e’ belongs to the set of E types (e’ ∈ E). In addition, let M denote a very large number.
- (6)
- When performing the tasks of service j, the tasks are prioritized such that the task with the smallest label number should be executed first unless that task depends on another task (χ(ek), (e’k’) = 0). For example, suppose that a specific service j has three tasks (k = 1, 2, 3). Then, the sequencing start time for task 1 should begin before tasks 2 and 3. Similarly, task 2 should be executed before task 3, as presented in Equation (37). Let technician c’ belong to the set of C technicians (c’ ∈ C). Mathematically,
- (7)
- The dependency between the scheduled tasks should be respected during the sequencing process. For example, suppose that there are two tasks (task k’ of type e’ and task k of type e) related to the same service j such that task k’ depends on task k (χ(e’k’), (ek) = 1). Additionally, suppose that the executions of tasks k and k’ have been assigned to be completed by the two technicians c and c’ in interval i (Zjkeci = Zjk’e’c’i = 1), respectively. Then, the start time of task k’ should begin after the finish time of task k as stated in Equation (38).
By solving the scheduling model using LINGO solver software, the obtained results determine the tasks assigned to every technician in each day, as illustrated in Figure 5.
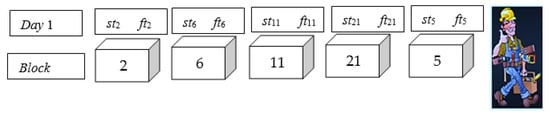
Figure 5.
Result of task sequencing for each technician in each day.
2.3. Block Data Storage and Sharing
Once the block information has been completed, the blocks are shared between the service center and the relevant facility managers to track progress of the required facility services, as shown in Figure 6. Moreover, all facility services with their corresponding tasks are allocated and sequenced through blockchain technology to avoid unauthorized access to the electronic system. Generally, the block includes different information involving the task type, assigned technician, and the service start and finish times. An illustration of how the eFSR stores and secures the data of service tasks in their corresponding blocks is presented in Figure 6.
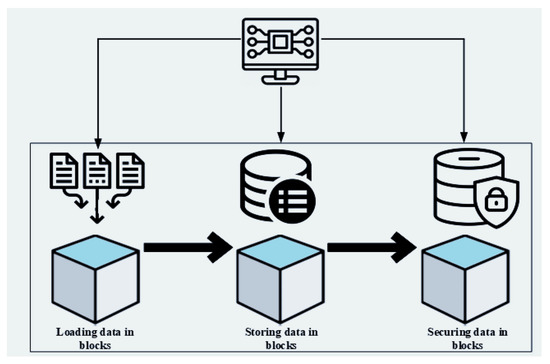
Figure 6.
Storage and security of block information.
2.4. Performance Monitoring and Assessment
The blocks with all the related information are transferred via computer networks and shared with relevant facilities. Through this system, the manager of a service center can monitor the progress of service tasks and assess the efficiency of the service process and the utilization of center resources. The eFSR system provides online daily, weekly, or monthly service progress reports, efficiency evaluations, and data on utilization of resources; hence, engineers and managers are enabled to take real and controlled decisions. The chains between the service center and facilities for data management and sharing are presented in Figure 7.
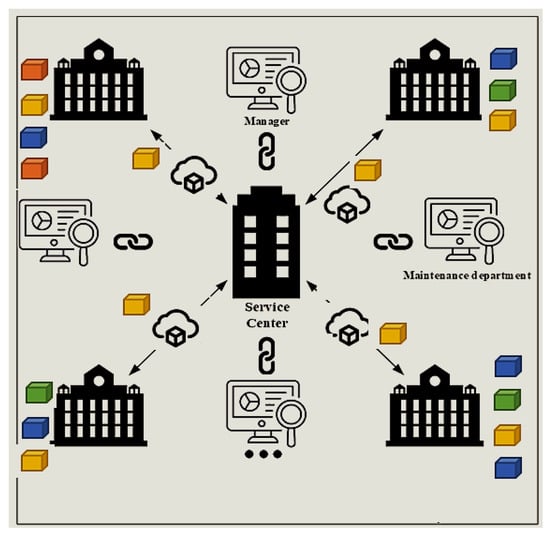
Figure 7.
The chains between the service center and other departments.
3. Application and Research Results
The proposed framework was implemented a university and is described as follows. A main service center at a university is responsible for receiving and executing service orders which are received from different university facilities. Four skilled technicians work in this center. This service center has received 47 service orders which constitute a total of 140 tasks from seven different service types, including: maintenance of oil and fat traps, maintenance of lifts, cleaning of premises, waste disposal, woodwork, electrical work, and minor repairs. The main service parameters are summarized in Table 1.

Table 1.
Values of the main input parameters.
Based on previous service logs, each service was placed for processing within seven possible outcomes, where each outcome has a specific probability in each day as shown in Table 2. Further, each service order consisted of one or more tasks and had a predetermined service order time, sotj, and due date, dutj, as shown in Table 3.
Table 2.
The probabilistic parameters for services order times.
Table 3.
Number of required tasks for each services with times.
The duration of execution for each task was generated stochastically from normal distributions as presented in Table 4. The services performed by the main service center at the university are also listed in Table 4. Figure 8 presents the number of tasks from each type. The required standard time for each task were estimated as shown in Table 5.
Table 4.
Services offered and normal distribution parameters for testing durations.
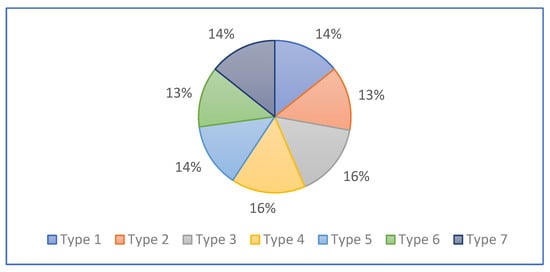
Figure 8.
Distribution of task types.
Table 5.
The generated standard durations and types for each task.
The skills of technicians in the service center fell into six main skills, which were related to facilities’ mechanical, electrical, cleaning, carpentry, lift, and general maintenance service repairs at different levels of effectiveness. The effectiveness measure determines the actual time required from the technician to complete the service tasks. Table 6 displays the skills, effectiveness, and availability for all technicians.
Table 6.
Technicians’ effectiveness and gained skills.
Given that 47 service orders (J = 47) of a total 140 tasks (K = 140) would be assigned to four skilled technicians (C = 4), comprising seven types (E = 7) during 12 intervals (I = 12), LINGO solver software employed to solve the optimization models using a computer with an Intel Core i7-9700 processor and processor speed from 2.5 GHz up to 4.70 GHz. The optimal number of tasks scheduled to each technician is presented in Figure 9.
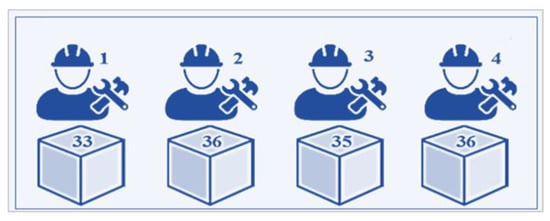
Figure 9.
The total number of tasks assigned to each technician.
The daily busy time for executing tasks for facility services by each technician are stated in Table 7. The total hours from technicians over 12 days are presented in Figure 10. The optimal schedule for completing tasks over 12 days is presented in Table 8.
Table 7.
The operated durations by each technician in all days (hours).
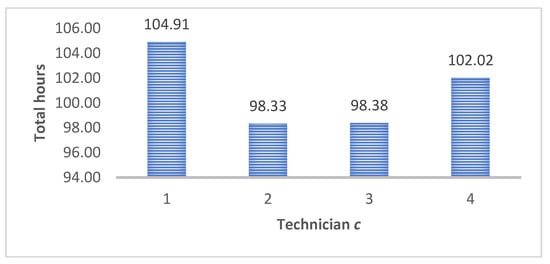
Figure 10.
Total hours operated by each technician over 12 days.
Table 8.
The optimal schedule for tasks by technicians over 12 days.
From the results, all tasks were scheduled optimally to be completed by technicians. An illustration for the planning process for service tasks by technicians in day 1 is presented in Figure 11.
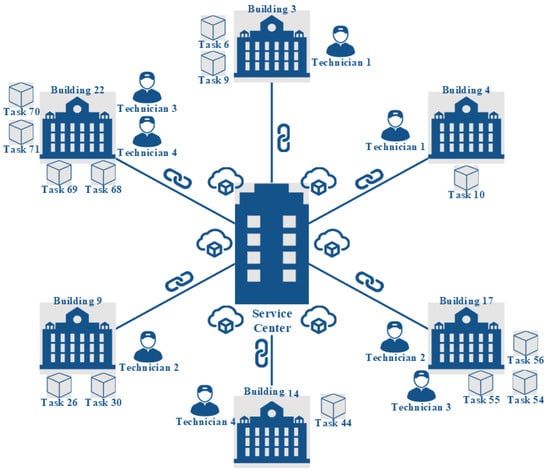
Figure 11.
The planning process for service tasks by technicians in day 1.
The next step was to determine the optimal sequencing timetable for completing service tasks. Table 9 represents the distribution of scheduled tasks for technicians from day 1 to 6.
Table 9.
The distribution of tasks for technicians in days 1 through 6.
The sequencing start and finish times for the tasks from day 1 to 6 are presented in Table 10. An illustration of the sequencing process for service tasks by technicians in day 1 is presented in Figure 12.
Table 10.
The sequencing time frame for tasks from day 1 to 6.
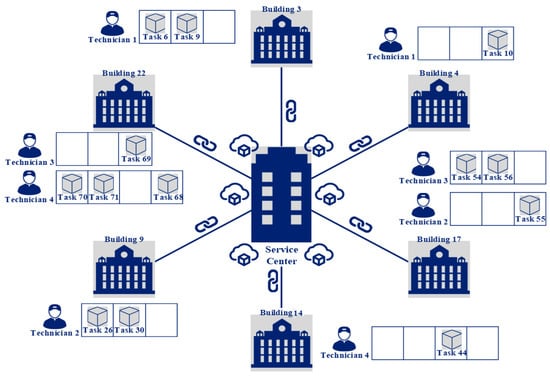
Figure 12.
The sequencing process for service tasks by technicians in day 1.
The remaining tasks were completed in the last six days. Table 11 represents the distribution of tasks for technicians from days 7 to 12. Over the next six days, 71 service tasks were sequenced optimally. The detailed sequencing start and finish times for the remaining tasks are stated in Table 12.
Table 11.
The distribution of tasks for technicians in days 7 to 12.
Table 12.
The sequencing timeframe for tasks from day 7 to 12.
The objective function for the sequencing optimization model mainly aims to minimize the delay costs incurred by finishing a service after its due date. However, the finished times for all services are presented in days and hours in Table 13.
Table 13.
The finished times for facility services.
The optimal sequencing results incurred zero delay costs. Figure 13 depicts the number of daily finished service orders.
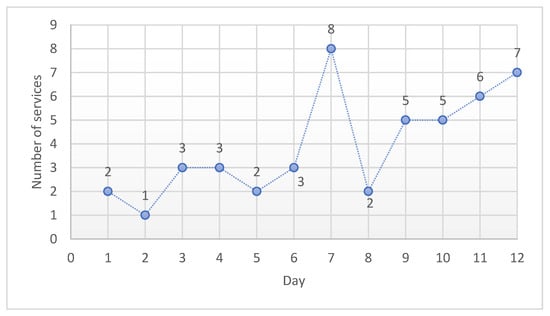
Figure 13.
Number of finished service orders in each day.
Further, the data was stored in each block. All facility services with their corresponding tasks were processed through blockchain technology to avoid unauthorized access to block service data in the eFSR system. This data was made a cluster of information in a digital form for security purposes and to eliminate privacy threats. In addition, data was available only for authorized users to make real-time decisions. Only authorized users were able to assess the resource efficiency utilization throughout the service process. Finally, the stored block data contained related data about the technicians that operated the service process.
4. Research Results
This research developed an eFSR utilizing two optimization models for the scheduling and sequencing of facility services. The eFSR system was implemented to manage 47 facility service orders comprising 140 tasks. The eFSR system effectively achieved the goals of the service center to minimize costs and maximize resource utilization to meet service due dates. The results showed that all service tasks were assigned to technicians over 12 days. Idle time was incurred if a technician operated less than 89% of the full-time working hours (8 h). On the other hand, overtime was incurred if a technician operated more than 8 h. The incurred idle times and overtime from all technicians over 12 days are listed in Table 14. The objective functions for the optimization model aimed to minimize the incurred costs from idle time and overtime. The incurred costs each day from all technicians are presented in Table 15.
Table 14.
Idle time and overtime hours over 12 days (h).
Table 15.
Idle time and overtime incurred costs over 12 days ($).
From Table 14, the total idle and overtime (hours) over 12 days were 9.56 and 8.34 h, respectively. In Table 15, the total cost incurred due to executing 47 service orders with 140 tasks from seven different types was $930.60. Moreover, no delay time incurred during sequencing the facility services. The efficiency for all technicians over a 12-day period was illustrated in Figure 14.
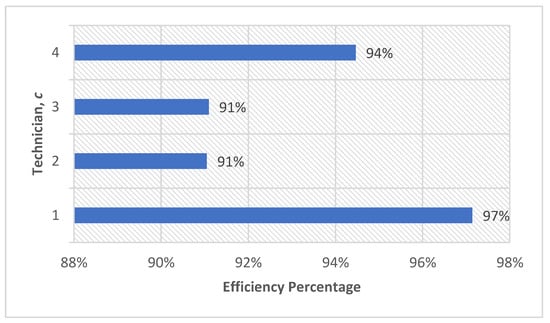
Figure 14.
The efficiency percentages for technicians.
Clearly, the proposed framework has the following advantages: (1) saving costly idle time and overtime costs, (2) achieving goals of the service center through efficient utilization of resources, (3) effective planning and management of service tasks that enable facility engineers in tracking the progress of service handling, (4) effective online data sharing of service information between relevant parties, (5) providing optimal task scheduling and sequencing, and (6) enhancing the decision-making process by tracking tasks handling on a real-time basis.
5. Conclusions
This research proposed an eFSR system for optimal electronic planning and management of facility services under the probabilistic and stochastic models of arrival time of service orders and service durations, respectively. The tasks of ordered facility services were treated as blocks. Two mathematical optimization models were developed to minimize costs and maximize the number of assigned services. A real case study was employed for illustration, where 47 service orders with a total of 140 tasks were received from university facilities and were required to be performed over a period of twelve days. The eFSR effectively managing service tasks and efficiently enhanced the utilization and performance of the service center resources. These advantages saved significant costs and resulted in optimal performance for the service center. In conclusion, the proposed optimal eFSR system can provide a valuable real-time assistance to facilities managers when planning service tasks over multiple periods. Future research consider multiple blockchains for management of production and maintenance activities simultaneously under stochastic conditions.
Author Contributions
Conceptualization, A.A.-R.; methodology, A.A.-H.; software, A.A.-H.; formal analysis, A.A.-R.; resources, A.A.-R.; data curation, A.A.-H.; writing—original draft, A.A.-H.; writing—review & editing, A.A.-R.; supervision, A.A.-R. All authors have read and agreed to the published version of the manuscript.
Funding
This research received no external funding.
Institutional Review Board Statement
Not applicable.
Informed Consent Statement
Not applicable.
Data Availability Statement
Data is included in the manuscript.
Conflicts of Interest
The authors declare no conflict of interest.
References
- Nazali Mohd Noor, M.; Pitt, M. A critical review on innovation in facilities management service delivery. Facilities 2009, 27, 211–228. [Google Scholar] [CrossRef]
- Durdyev, S.; Ashour, M.; Connelly, S.; Mahdiyar, A. Barriers to the implementation of Building Information Modelling (BIM) for facility management. J. Build. Eng. 2022, 46, 103736. [Google Scholar] [CrossRef]
- Mustaffa, S.A.H.; Adnan, H.; Jusoff, K. Facilities management challenges and opportunity in the Malaysian property sector. J. Sustain. Dev. 2008, 1, 79–85. [Google Scholar]
- Opoku, A.; Lee, J.Y. The Future of Facilities Management: Managing Facilities for Sustainable Development. Sustainability 2022, 14, 1705. [Google Scholar] [CrossRef]
- Jain, A.; Soojin Yoon, F.; Kang, K.; Hastak, M. Implementation of the Data-Driven Analytics Protocol through Facility Management and Real Estate Industry Cases. J. Manag. Eng. 2022, 38, 04021077. [Google Scholar] [CrossRef]
- Gunasekara, H.G.; Sridarran, P.; Rajaratnam, D. Effective use of blockchain technology for facilities management procurement process. J. Facil. Manag. 2022, 20, 452–468. [Google Scholar] [CrossRef]
- Hijazi, A.A.; Perera, S.; Alashwal, A.; Calheiros, R.N. Blockchain adoption in construction supply chain: A review of studies across multiple sectors. In Proceedings of the International Council for Research and Innovation in Building and Construction (CIB) World Building Congress, Hongkong, China, 17–21 June 2019. [Google Scholar]
- Zhao, G.; Liu, S.; Lopez, C.; Lu, H.; Elgueta, S.; Chen, H.; Boshkoska, B.M. Blockchain technology in agri-food value chain management: A synthesis of applications, challenges, and future research directions. Comput. Ind. 2019, 109, 83–99. [Google Scholar] [CrossRef]
- Tanwar, S.; Parekh, K.; Evans, R. Blockchain-based electronic healthcare record system for healthcare 4.0 applications. J. Inf. Secur. Appl. 2020, 50, 102407. [Google Scholar] [CrossRef]
- Olawumi, T.O.; Chan, D.W.; Ojo, S.; Yam, M.C. Automating the modular construction process: A review of digital technologies and future directions with blockchain technology. J. Build. Eng. 2021, 46, 103720. [Google Scholar] [CrossRef]
- Lemieux, V.L. Trusting records: Is Blockchain technology the answer? Rec. Manag. J. 2016, 26, 110–139. [Google Scholar] [CrossRef]
- Banerjee, A. Blockchain Technology: Supply Chain Insights from ERP. Adv. Comput. 2018, 111, 69–98. [Google Scholar] [CrossRef]
- Ying, W.; Jia, S.; Du, W. Digital enablement of blockchain: Evidence from HNA group. Int. J. Inf. Manag. 2018, 39, 1–4. [Google Scholar] [CrossRef]
- Jeet, R.; Singh Kang, S. Investigating the progress of human e-healthcare systems with understanding the necessity of using emerging blockchain technology. Mater. Today Proc. 2020. [Google Scholar] [CrossRef]
- Ismail, L.; Materwala, H.; Zeadally, S. Lightweight Blockchain for Healthcare. IEEE Access 2019, 7, 149935–149951. [Google Scholar] [CrossRef]
- Zhu, Q.; Bai, C.; Sarkis, J. Blockchain technology and supply chains: The paradox of the atheoretical research discourse. Transp. Res. Part E Logist. Transp. Rev. 2022, 164, 102824. [Google Scholar] [CrossRef]
- Al-Refaie, A.; Al-Hawadi, A.; Lepkova, N. Blockchain Design with Optimal Maintenance Planning. Buildings 2022, 12, 1902. [Google Scholar] [CrossRef]
- Sahney, R.; Sharma, M. Electronic health records: A general overview. Curr. Med. Res. Pract. 2018, 8, 67–70. [Google Scholar] [CrossRef]
- Al-Refaie, A.; Al-Shalaldeh, H.; Lepkova, N. Proposed procedure for optimal maintenance scheduling under emergent failures. J. Civ. Eng. Manag. 2020, 26, 396–409. [Google Scholar] [CrossRef]
- Al-Refaie, A.; Qapaja, A.; Al-Hawadi, A. Optimal Fuzzy Scheduling and Sequencing of Work-Intensive Multiple Projects Under Normal and Unexpected Events. Int. J. Inf. Technol. Proj. Manag. 2021, 12, 64–89. [Google Scholar] [CrossRef]
- Al-Refaie, A.; Al-Hawadi, A.; Fraij, S. Optimization models for clustering of solid waste collection process. Eng. Optim. 2020, 53, 2056–2069. [Google Scholar] [CrossRef]
- Al-Refaie, A.; Almowas, H. Multi-objective maintenance planning under preventive maintenance. J. Qual. Maint. Eng. 2021. [Google Scholar] [CrossRef]
- Al-Refaie, A.; Abedalqader, H. Optimal berth scheduling and sequencing under unexpected events. J. Oper. Res. Soc. 2022, 73, 430–444. [Google Scholar] [CrossRef]
- Al-Refaie, A.; Judeh, M.; Chen, T. Optimal multiple-period scheduling and sequencing of operating room and intensive care unit. Oper. Res. 2018, 18, 645–670. [Google Scholar] [CrossRef]
- Al-Refaie, A.; Chen, T.; Judeh, M. Optimal operating room scheduling for normal and unexpected events in a smart hospital. Oper. Res. 2018, 18, 579–602. [Google Scholar] [CrossRef]
- Al-Refaie, A.; Lepkova, N.; Camlibel, M.E. The Relationships between the Pillars of TPM and TQM and Manufacturing Performance Using Structural Equation Modeling. Sustainability 2022, 14, 1497. [Google Scholar] [CrossRef]
- Al-Refaie, A.; Al-Hawadi, A. Optimal fuzzy repairs’ scheduling and sequencing of failure types over multiple periods. J. Ambient Intell. Humaniz. Comput. 2022, 13, 201–217. [Google Scholar] [CrossRef]
- Carrizo Moreira, A.; Campos Silva Pais, G. Single Minute Exchange of Die: A Case Study Implementation. J. Technol. Manag. Innov. 2011, 6, 129–146. [Google Scholar] [CrossRef]


Disclaimer/Publisher’s Note: The statements, opinions and data contained in all publications are solely those of the individual author(s) and contributor(s) and not of MDPI and/or the editor(s). MDPI and/or the editor(s) disclaim responsibility for any injury to people or property resulting from any ideas, methods, instructions or products referred to in the content. |
© 2023 by the authors. Licensee MDPI, Basel, Switzerland. This article is an open access article distributed under the terms and conditions of the Creative Commons Attribution (CC BY) license (https://creativecommons.org/licenses/by/4.0/).