Article

Effects of the Design Parameters of Ridge Vents on Induced Buoyancy-Driven Ventilation

1
Graduate School of Design, National Yunlin University of Science and Technology, Douliou 640, Taiwan
2
Department of Creative Design, National Yunlin University of Science and Technology, Douliou 640, Taiwan
3
Department of Civil Engineering, National Cheng Kung University, Tainan 701, Taiwan
*
Author to whom correspondence should be addressed.
Buildings 2022, 12(2), 112; https://doi.org/10.3390/buildings12020112
Submission received: 8 January 2022 / Revised: 19 January 2022 / Accepted: 20 January 2022 / Published: 24 January 2022

Abstract

:
With ridge vents that are commonly used in building ventilation applications as the research object, this study analyzed how design parameters affect the efficiency of thermal buoyancy-driven ventilation induced by ridge vents through computational fluid dynamics (CFD). The design parameters of ridge vents include the width S, height H, and eave overhang E. In consideration of engineering practices, the parameter ranges were set as follows: S = 1.2, 1.8, 2.4, and 3 m; H = 0.3, 0.6, 0.9, and 1.2 m; and E = 0, 0.3, and 0.6 m. The results show that when a ridge vent is under buoyancy-driven ventilation, the height H serves as the dominant design parameter. Correlation equations of the induced ventilation rates with the relevant ridge vent design parameters are provided.

1. Introduction

Natural ventilation is the process of introducing fresh air into an indoor space by means of natural forces, such as wind and/or thermal buoyancy, instead of the use of mechanical energy. These natural forces, which usually affect the efficiency of natural ventilation, can be isolated, opposed, or mutually reinforced and sometimes work in synergy. The design methods and research results related to natural building ventilation have been fruitful. Further information can be found in review papers [1,2,3,4].
Ridge vents (or roof-mounted monitors), which are a common natural ventilation approach, encourage airflow by means of thermal buoyancy or wind. Designing and building a sloped roof with an opening at the soffits and ridges to promote airflow through the attic roof and/or the entire building are common practices. In cold or mild climates, ridge vents are mainly used to control moisture in attic spaces; in warm climates, they are used to remove the solar heat gain from roofs [5]. There are many studies on ridge vents, most of which focus on attic ventilation, whole building ventilation, and greenhouse environment control.
For the application of ridge vents in attic ventilation, Tariku and Iffa [5] applied transient boundary conditions to investigate the thermal dynamic responses of a typical attic roof with a ridge vent. Their results show that in terms of energy, an attic roof with a high ventilation rate could increase energy consumption in winter and reduce the cooling load in summer. Wang and Shen [6] used a transient computational fluid dynamics (CFD) model to analyze the effect of the ventilation ratio and vent balance on the cooling load and airflow in naturally ventilated attics. The results show that changes in the ventilation ratio and vent configuration had little impact on the streamline pattern. Iffa and Tariku [7] discussed how changes in roof sheathing, ceiling insulation (baffle size) and locations of the vent area affect the air and temperature distributions in the attic space in summer and winter. Their results show that when the airflow was driven by wind, increasing the baffle size significantly influenced the air distribution.
Regarding the application of ridge vents in whole building ventilation, Wen et al. [8] designed and developed a ventilated building-integrated photovoltaic (BIPV) system with a double-skin roof structure to enable environmental control and indoor ventilation induction. The influence of the locations of the covered ridges with sidewall openings (CRSOs) and BIPV openings (toward the outdoors and indoors) with different outdoor wind velocities on the flow structures was analyzed numerically. The results show that in calm wind situations, when the opening faced outward (i.e., soffits), the outdoor mode had a better ventilation effect than the indoor mode when the opening faced inward. In contrast, at a high wind velocity (2 m/s), the ventilation rate of the indoor mode was higher than that of the outdoor mode. Kang and Lee [9] conducted a wind tunnel test to explore the natural ventilation of entrained air (by outdoor wind blowing) in large factories. Three different types of louver ventilators were installed in the upper one-third of an open windward wall in a factory model. The results show that a ventilator with outer and inner louvers with appropriate inclination angles could effectively improve the overall ventilation efficiency of factories. A wind exchanger (or windcatcher), a structural form on the roof of a building, could increase wind-driven ventilation. Cruz-Salas et al. [10] experimentally evaluated six wind exchanger configurations with different wind orientations in a room with a window on the windward side. The results show that the performance of the wind exchanger depended on the relative relation between its opening and the wind direction.
Van Overbeke et al. [11] used a natural ventilation test facility to develop technology to measure sidewall and ridge vent ventilation rates with a 3D ultrasonic anemometer and a static 2D ultrasonic anemometer. The results show that the ridge vents had a relatively constant ventilation rate, while the side vents could change from outlet to inlet depending on the incidence angle of the wind. Wang et al. [12] conducted numerical simulations of pollutant diffusion between two workshops. One of the workshops had an open roof vent skylight with an opening width of 3 m. The results show that outdoor wind clearly interacted with the thermal buoyancy produced by the heat source of the downstream workshop. When the ventilation flow was driven by outdoor wind, the concentration of air pollutants in the pedestrian respiratory zone was low; when it was driven by thermal buoyancy, air pollutants migrated to the pedestrian respiratory zone.
Regarding the application of ridge vents in greenhouse environment control, Espinoza et al. [13] analyzed the impact of the ventilator configuration on the internal airflow pattern in a three-span Mediterranean greenhouse. The results show that the airflow pattern in the greenhouse depended on the ventilation surface distribution and how the ventilation flow was obstructed. The case with two roof vents and two side vents could improve the airflow at the height of the plants, although the overall volumetric flow rate was lower than that of the case with three roof vents and two side vents. Chu and Lan [14] investigated the wind-driven ventilation of monoslope greenhouses with ridge vents via a large eddy simulation (LES) model and wind tunnel experiments. The results show that the multispan greenhouses with open ridge vents had much higher ventilation rates than those with closed ridge vents. Villagran and Bojacá [15] conducted numerical simulations to assess how inflatable air ducts affect thermal behavior when the roofs of naturally ventilated multi-tunnel greenhouses were closed at night. The results show that an inflatable air duct could decrease the negative thermal gradient between the inside and outside of the greenhouse.
Taiwan is situated in a tropical area; on the ridges of buildings, various ridge vents (as illustrated in the red dotted zone in Figure 1) related to the aforementioned “whole building ventilation” purpose can be easily seen. However, people have different evaluations of their ability to induce natural ventilation. What is the ventilation rate? Are there any appropriate design parameters? To date, these details have not been unveiled in the literature. Therefore, in this study, CFD numerical simulations were conducted to investigate the influence of ridge vent design parameters on the efficiency of indoor buoyancy-driven ventilation. Ridge vents are applicable to various spaces, such as factories, stadiums, exhibition halls, greenhouses etc. For the convenience of explanation, an industrial workshop was used as the application scenario in this study.

2. Materials and Methods

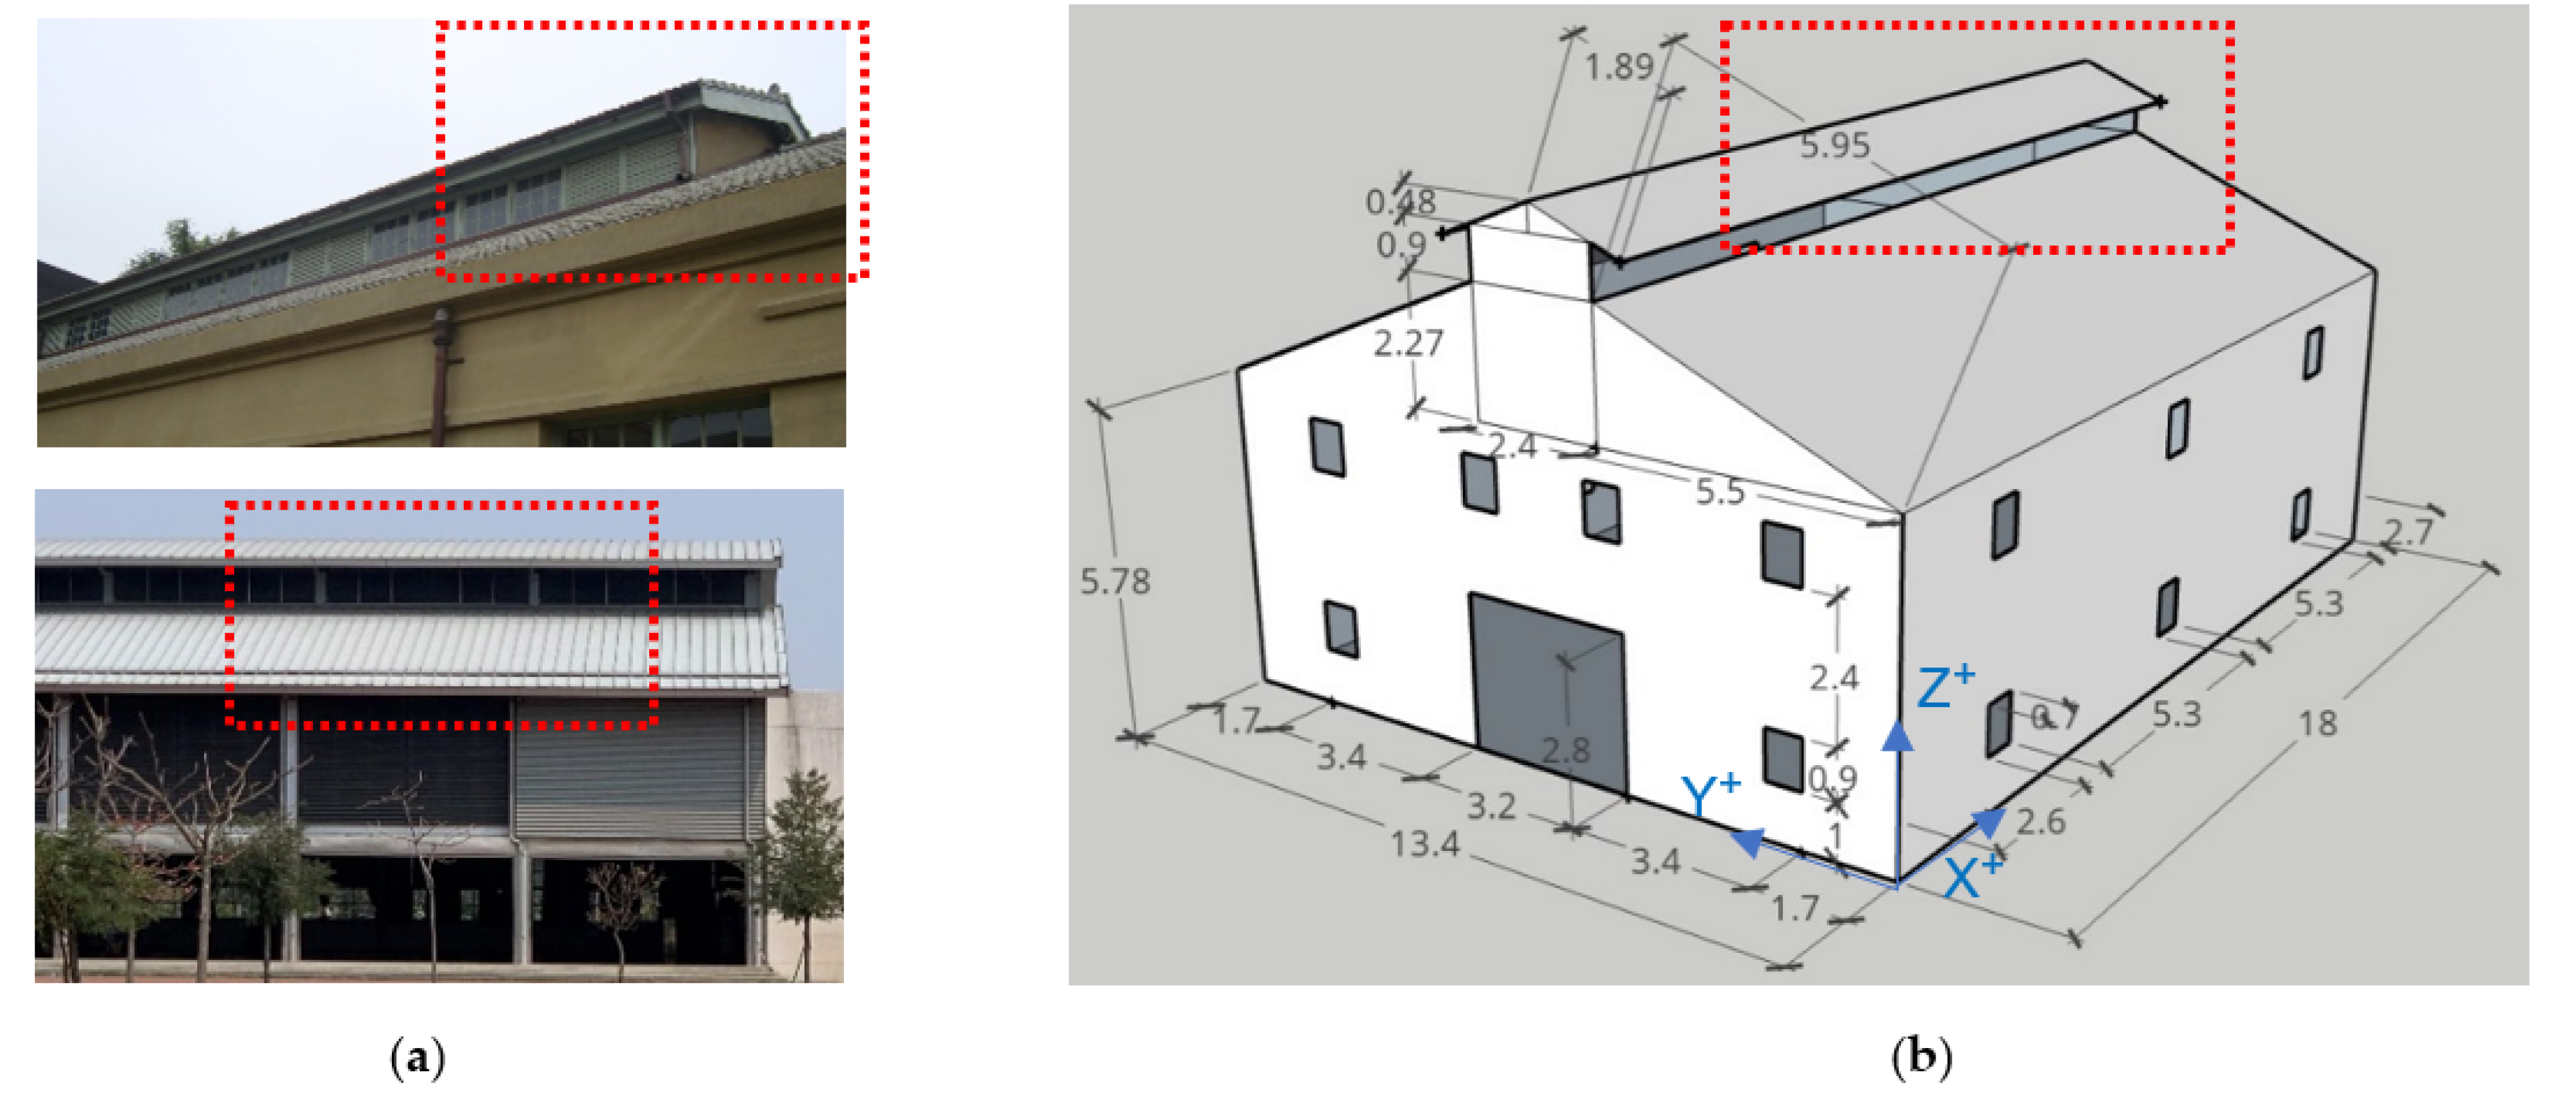
2.1. Research Object

As shown in Figure 2a, after the pitched roof ❶ of the industrial workshop receives solar heat, the air temperature around the roof panel increases. Because the roof panel is inclined, the indoor side below the panel experiences a buoyancy-driven boundary layer airflow that moves obliquely upward and then drives the flow of air inside the workshop below the roof panel. The two flows (buoyancy-driven airflow and induced indoor airflow) move outward through the ridge vent (❷), contributing to natural ventilation, as shown by the blue lines ❸ in the figure.
Alternatively, the local negative pressure caused by the external wind passing over the ridge vent can exhaust the indoor air, creating another natural ventilation mechanism. Although this issue is not what we are exploring in this study, but worthy of further consideration. When high temperatures and low wind velocities are present for a long period of time, the thermal buoyancy mentioned above becomes an important driving force for natural ventilation. In this study, the temperatures of all roof surfaces after solar heating are assumed to be isothermal, TH. In the external flow field, after the pitched roof receives solar heat, a buoyancy-driven flow that moves obliquely upward also forms on the outdoor side above the roof panel, which then drives the flow of outdoor air, as indicated by the green lines ❹.
Because the types of spaces below the roof and the openings are diverse and the aim of this study is to assess the thermal buoyancy-driven ventilation induced by ridge vents, in the process of physical modeling, the space below the ridge vent (i.e., the black dotted zone shown in Figure 2a) is ignored based on reasonable boundary condition settings. Then, a representative roof is obtained.
The geometric configurations (❶, ❷) and heat flow patterns (TH ❸, ❹) are symmetric. To save computational time, half of the representative roof is adopted as the physical model by means of the symmetry axis ❺, as shown in Figure 2b. During the process of CFD modeling, the following assumptions are made:
(1)
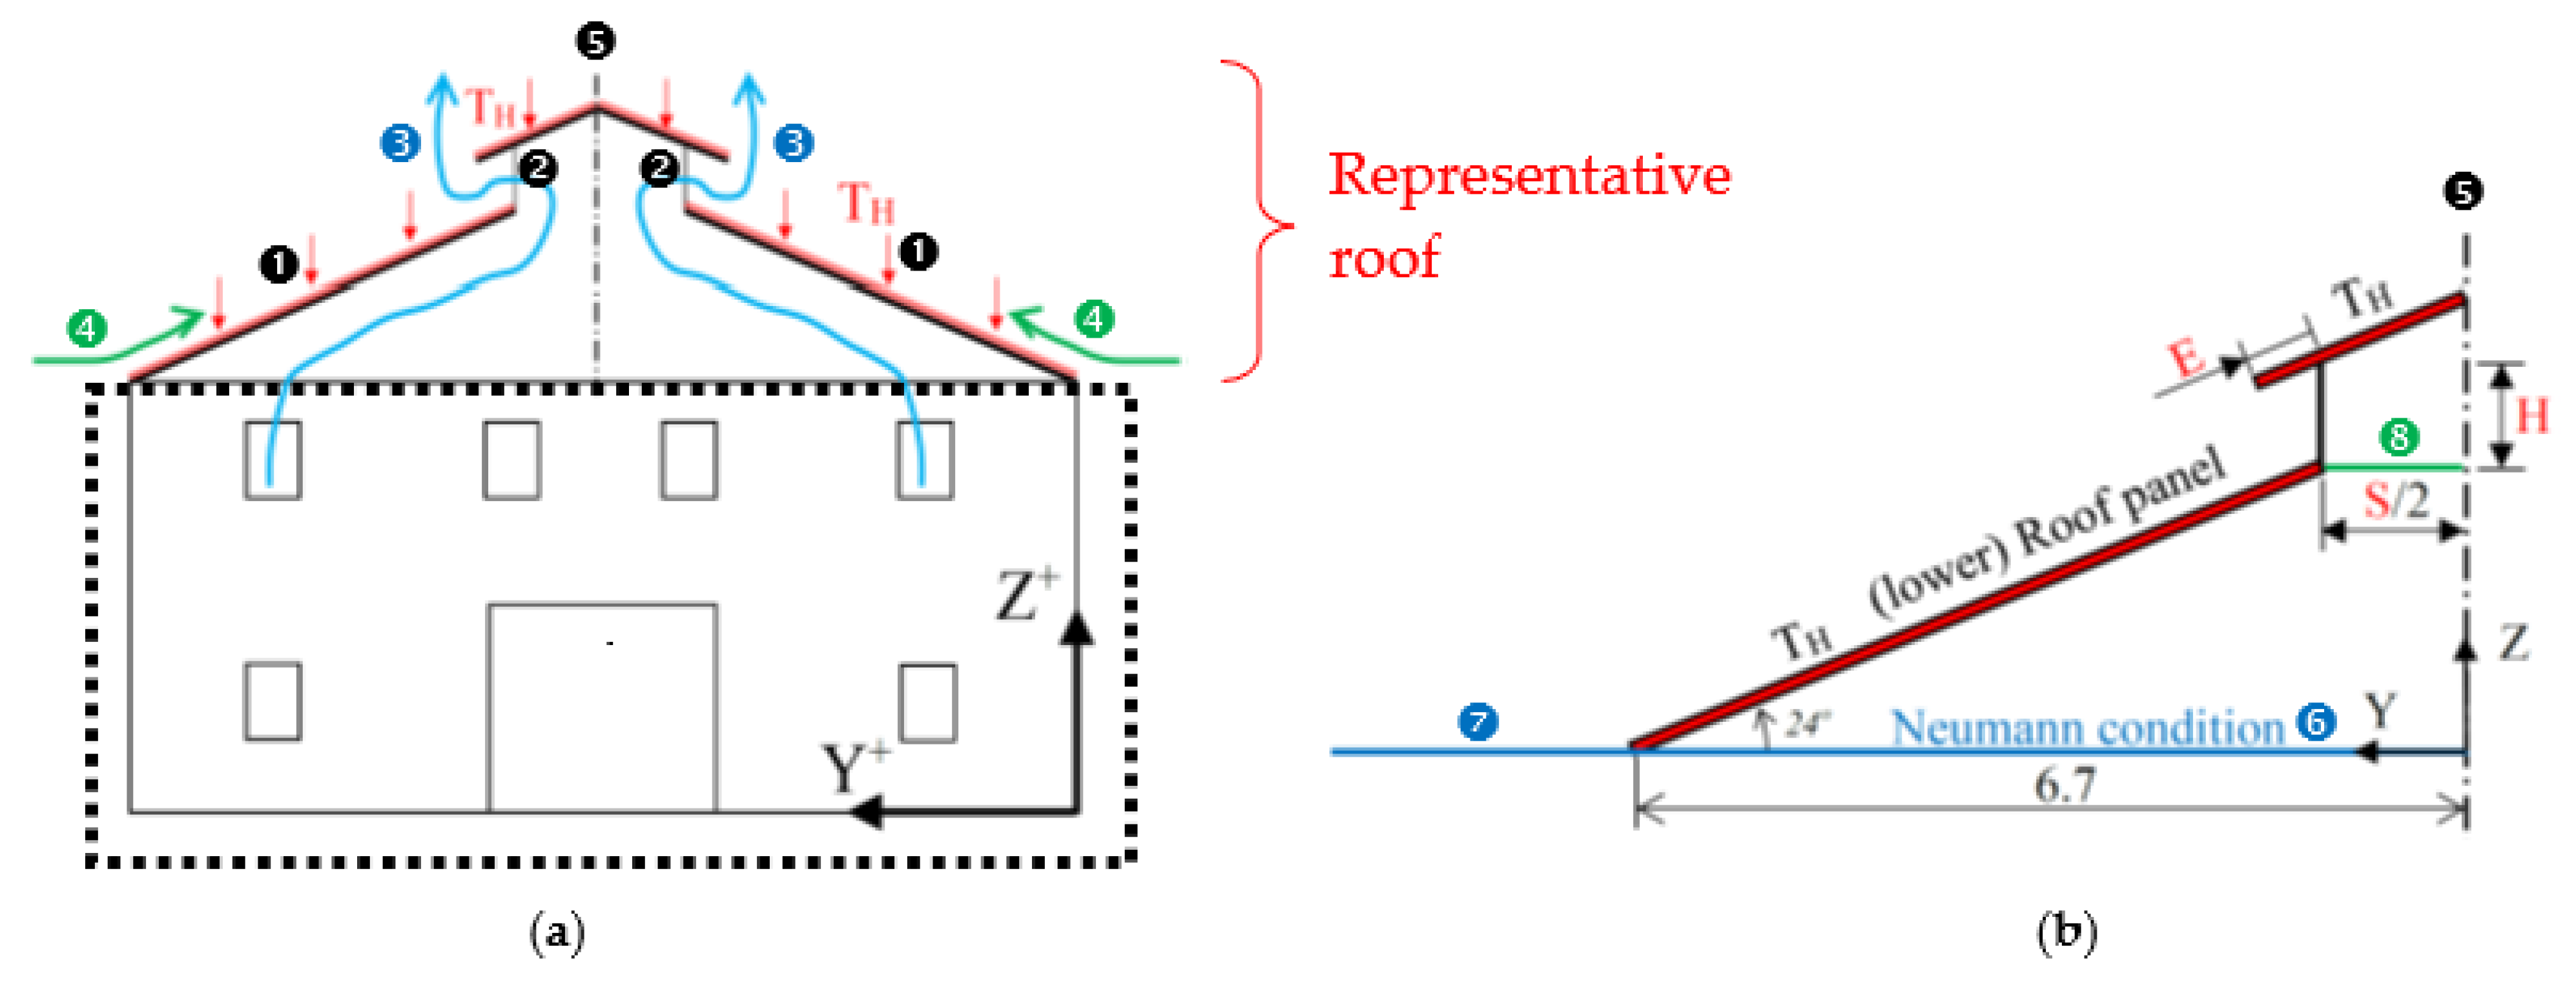
The plane Y = 0 (❺ in Figure 2b) is set at the boundary of the computational domain to a wall with no-slip conditions to realize symmetry of the flow fields.
(2)
The lower boundary of the computational domain below the roof is given Neumann conditions (blue line ❻, Y = 0–6.7 m; Z = 0 m) so that the fluid can flow freely into or out of the computational domain. This represents that air can flow into and out of the roof space from and to the workshop space.
(3)
For the external flow field, the lower boundary of the computational domain is also given Neumann conditions (blue line ❼, Y > 6.7 m; Z = 0 m) to represent the free flow of outdoor air (symbol ❹ in Figure 2a).
In the process of architectural design, the workshop space (area and height) in the black dotted zone in Figure 2a is determined first, and then the roof structure and possible roof ventilation design are determined. Therefore, the representative roof discussed in this paper has the same length (X+ direction) and width (Y+ direction) as those of the workshop space below, i.e., 18 m and 13.4 m, respectively. To simplify the CFD calculation, during the simulation process, only half of the roof and ridge vent (Y = 0–6.7 m, Figure 2b) in the Y+ axis direction (Figure 2a) was analyzed. To understand the possible edge effects on the ventilation performance of the ridge vent in the X-axis direction on both sides of the roof, the length of the physical model in the X-axis direction was determined by taking the entire representative roof into consideration (X = X+ = 0–18 m). For the relevant geometric data, see Table 1.
The parameters considered (i.e., variables discussed) in the design of the ridge vent include the width S, height H, and eave overhang E (Figure 2b). In consideration of engineering practices, the following ranges of design parameters S, H, and E are used:
  • Width S: 1.2, 1.8, 2.4, and 3 m;
  • Height H: 0.3, 0.6, 0.9, and 1.2 m;
  • Eave overhang E: 0, 0.3, and 0.6 m.
The heat source (driving force) of buoyant ventilation is the solar-heated roof panels. The aforementioned geometric configurations cause the areas of roof panels to vary with the design parameters. That is, when the design parameters are different, the heat sources may differ in size. For the upper roof panel, when E = 0.6 m, there is a larger deck area (i.e., a larger heat source); for the lower roof panel, when S = 3 m, there is a smaller deck area. For the conditions of controlling the heat source, this may not be an ideal heat-transfer study design, but the results can be applied in engineering practice.
The ventilation rate Q ˙ v e n t (m3/s) of a ridge vent design case is calculated by:
Q ˙ v e n t = i , j v z   ( i , j ) Δ A ( i , j )
in which v z   ( i , j ) : Outward velocity (component in the Z+ direction) at position (i, j) at the horizontal opening (m/s) (opening: ❽ Figure 2b, width S (m), length 18 m) Δ A i , j : Unit cross-section area at the opening (m2).

2.2. Numerical Methods

The commercial CFD code PHOENICS is used to perform the numerical simulations of the problem investigated on a laptop with an Intel® i7-1165G7. The governing equations, including a 3D incompressible Navier–Stokes equation, a time-independent convection diffusion equation and the LVEL turbulence model, with boundary conditions and parameters (shown in Table 2) are solved using the finite volume method. The formulations for these equations can be found in the PHOENICS handbook [16]; therefore, they are not available here. To connect the steep gradients of the dependent variables near a solid surface, a general wall function is used. The iterative computation continues until all field variables of the problem satisfy the specified 10−3 relative convergence.
The computational domain set is shown in Figure 3a. In the X’-, Y’- and Z’-axis directions, the distances between the physical model and the computational domain are Lx, Ly and 2 Lz, respectively. These distances, obtained through multiple tests, can properly indicate that the representative roof is in an open space. Lx, Ly and Lz represent the size of the physical model in the X’-, Y’- and Z’-axis directions, respectively. The plane of symmetry (Y’ = 0 m) is set to a wall with no-slip conditions, and the other boundaries are set to Neumann conditions.
For the grid point system, to increase the simulation correctness, the number of grids close to the model boundary and inside the model must be increased. When the grid independence of the mesh domain is tested, the air velocity along the Y’-axis (direction of the design parameter S) based on different grid points is used to calculate the deviation percentages and to determine a suitable grid point system for our calculations, as shown in Figure 3b by the case where S = 2.4 m, H = 1.2 m, and E = 0.6 m, with the grid point test. The sampling positions of the air velocity are X’ = 27 m, Y’ = 0–1 m, and Z’ = 2.22 m, as shown in ❽ in Figure 2b. The numerical simulation accuracy depends on the resolution of the computational mesh, and a finer grid leads to solutions that are more accurate. An increase in the number of cells provides better information; however, this is accompanied by a significant increase in computational resources. A grid system with approximately 90 × 201 × 154 (2,785,860) cells is used for the numerical simulations in this study.
To validate the present modeling works, simulations were performed for the selected case of the similar configuration and parameters for comparison with the experimental results. The experimental model (shown in Figure 3c), made of acrylic, is a 1/50 scale of the practical case shown in Figure 1c. To show the internal conditions, the heaters were removed from the roofs during image acquisition. Since it is difficult to place heaters over the two small upper roof panels and they have little impact on the temperature distribution inside the model, only 600 W/m2 heaters are laid over the two large lower roof panels. To get an obvious vertical temperature change, a 1000 W/m2 10 cm × 10 cm heater was placed in the middle of the model bottom. Type-T thermocouples with ± 0.1 °C uncertainties in the measured quantities are installed upward from the center of the heater at the model bottom, with 1 measuring point per centimeter and 20 points in total. Both the simulation and experimental environments have the same temperature, i.e., 28.1 °C.
The dimensions of the model and the computational domain are 0.36 m (X+) × 0.268 m (Y+) × 0.189 m (Z+) and 1.08 m × 1.07 m × 0.567 m, respectively. In simulations, the floor is an adiabatic plate with no-slip condition, and the other boundary conditions of the computational domain are Neumann conditions. Although the geometry of the experimental model (Figure 3c; 1/50 scale of Figure 1c) and that of the physical model in the present study (Figure 2b) are not identical, there is a sufficient amount of similarity to consider this validation approach: both models are isolated, same pitched roof configurations, both have similar boundary conditions and both are subjected to thermally buoyant force. As a result, the essential thermal and airflow features in the validation works will also be present in the physical model.
The validation result (Figure 3d) shows a good agreement between predicted air temperature and experimental values with an average error of 8.8%, which indicates the reliability of the CFD modeling.

3. Results and Discussion

3.1. Flow Patterns and Temperature Distribution Observations

As shown in Figure 4a, sunshine on the roof panel leads to heat accumulation and a temperature rise. Then, the air around the roof panel is heated, increasing the temperature and decreasing the density, which, together with the inclined roof surface, results in two buoyancy-driven boundary layer flows (❶ and ❷) moving obliquely upward on both the indoor and outdoor sides of the plate. The indoor buoyancy-driven flow ❶ moves toward the upper right underneath the roof panel and then turns upward and outside via the opening ❸ of the ridge vent. Later, this air flow combines with the outdoor buoyancy-driven flow ❷ from above of the panel and separates again at the top end of the upper roof panel. The separated airflow ❹ does not contact the upper roof panel. Instead, it flows vertically upward ❺ under the influence of thermal buoyancy and a symmetric flow pattern.
Then, the space below the representative roof is assumed to be a workshop to show how the flow pattern of the representative roof affects the air pollutant discharge in such a space. The distance between the air particles ➀ in the air trajectory and the central axis of symmetry, as shown in Figure 4a, is 0.6 m (i.e., S/2), and the air particles on the left (such as ➁ (1 m from the central axis of symmetry), ➂ (2 m), and ➃ (3 m)) can all smoothly flow upward from the workshop space below the representative roof and then out of the ridge vent with the buoyancy-driven flow. The air particles on the right side of ➀ are restricted by the inner circulation at the ridge vent from flowing outside. Equipment with heat dissipation is usually installed or a process for discharging air pollutants usually occurs in the space below ➀, ➁, ➂, and ➃. Then, according to the air trajectory, the high-temperature or polluted air inside is easily drawn out by the airflow. In contrast, the space below the right side of ➀ is generally the central aisle of the workshop, which seldom experiences high temperature or air pollutants. Thus, ventilation is not necessary there. Therefore, even if inner circulation occurs at the ridge vent above the aisle, the flow pattern has little influence on the entire ventilation efficiency.
The eave overhang (E value) in Figure 4a is 0. However, to prevent rainwater from entering the room through the ridge vent, an appropriate eave overhang is often designed. If the eave overhang is 0.6 m (as shown in Figure 4b), the buoyancy-driven flow ❶ below the roof panel has to experience a very large change in flow path, i.e., a large flow resistance, to flow out of the ridge vent ❸. Therefore, after combining with the buoyancy-driven flow ❷ above the roof panel, the separated flow ❹ has a lower flow intensity, producing an airflow ❺ moving obliquely toward the upper right and the central axis of symmetry.
A comparison between Figure 4a,c shows that when S increases (S = 1.2 to 3 m) and the other design parameters remain unchanged, the flow pattern and flow intensity are similar. A comparison between Figure 4c,d shows that when the other design parameters remain unchanged, an increase in H can decrease the curvature of the buoyancy-driven flow path below the upper roof panel, reduce the flow resistance, and improve the flow strength. Hence, the flow rate of the separated flow ❹ increases, as shown in Figure 4d. In terms of the air temperature, the indoor side of the upper roof panel (symbol A) accumulates heat, as shown in the red zone in Figure 4c,d. The air in the red zone is restricted by the inner circulation ❺ and the upper roof panel, so the heat in this area cannot disperse. Different design cases have similar temperature distributions.

3.2. Edge Effects

Figure 5 shows the change in the outward air velocity (Vz) at a horizontal exit of the ridge vent (❽ in Figure 2b) along the long axis of the workshop (X-axis). Y* is the dimensionless distance between the observation point and the central axis of symmetry (=Y/(S/2)) (Figure 5d). As shown in these figures, Vz significantly changes on both sides of the building (both the left and right sides of each figure), which are called edge effects. The influence range varies with the design parameters. As shown in Figure 5a, when S = 1.2 m, H = 0.3 m, and E = 0 m, there are edge effects within approximately 3 m of both sides of the building, as shown in the red zone; when E and S increase to 0.6 m and 3 m, as shown in the green zone in Figure 5b,c, the influence range of the edge effect expands accordingly. When H increases to 1.2 m, the blue zone in Figure 5d shows that Vz exhibits a more significant change along the X-axis. When S = 1.2 m (Figure 5a,b), the value of Vz increases with increasing Y*; that is, Vz increases toward the edge of the horizontal opening of the ridge vent (i.e., approaching the lower roof panel). However, when S = 3 m (Figure 5c,d), the value of Vz does not increase with increasing Y*. According to Figure 5c, the overall value of Q v is 2.83 m3/s. The ventilation rates in the edge effect zones on both sides are both 0.98 m3/s, the sum of which accounts for approximately 70% of Q v . The ventilation rate in the unit length along the X-axis within the edge effect zone is 0.163 (m3/s)/m, while that within the nonedge effect zone is 0.144 (m3/s)/m; the differences between the two are not significant.

3.3. Design Parameter Effects

As shown in Figure 6a, when H and E are constants, as S increases, ventilation rate Q v first increases and then decreases. Despite the slight change in Q v , the difference between the values can still be observed. When S = 1.8 m, Q v has local maximum values. However, since the ridge vent is designed in consideration of aesthetics and roof construction, the designer cannot always make S approximately 1.8 m; moreover, due to the small change in Q v , the design results of S hardly affect the value of Q v under different parameters. The design can be based on the actual needs without considering whether S can reach the local maximum value.
Figure 6b illustrates that when S and E are constants, Q v experiences a significant growth with increasing H. According to the line aggregations shown in the figure, S and E have far less of an impact on Q v than H does. When the ridge vent enables ventilation through thermal buoyancy, H becomes the dominant design parameter, which is beneficial for design work. When conditions of high temperature and low wind velocity occur most of the time, the designer may try to increase the height of the ridge vent (H) to improve the ventilation efficiency. However, considering the limitation of the vertical support, impact of typhoons, and visual aesthetics, the value of H is not considerably increased to attain a high ventilation rate.
According to Figure 6c, compared to E = 0.3 m and E = 0.6 m, E = 0 m leads to a higher ventilation rate, although the roof panel of the ridge vent has no overhang when E = 0 m. In this case, rainwater enters the room through the ridge vent, which seriously affects the indoor environment. Therefore, designers include overhang, and the value of E is generally no more than 0.6 m. When E = 0.3 m and E = 0.6 m, the values of Q v show little difference. Thus, a designer can design the eave overhang (E value) as desired without affecting the efficiency of buoyant ventilation.
Since E = 0 m rarely occurs in design practice and the Q v values of E = 0.3 m and E = 0.6 m are almost the same, we do not consider the parameter E in the comprehensive analysis. As shown in Figure 6d, the ventilation rate Q v (m3/s) can be expressed as follows:
Q v = 1.9 + 1.86 H ( 0.18 H + 0.1 ) ( S 1.8 ) 2   ( Error = 2.66 % )
The correlation equation deviates 2.66% from the simulation result. The applicable parameter ranges are S = 1.2–3.0 m, H = 0.3–1.2 m, and E = 0.3–0.6 m. For the convenience of prediction and clear description, H is the dominant design parameter, and the influence of S can be ignored. The ventilation rate Q v (m3/s) at this moment is simplified as follows (as shown in Figure 6d):
Q v = 1.9 + 1.86 H   ( Error = 5.36 % )
This correlation equation deviates just 5.36% from the simulation result, which is acceptable in engineering practice and helpful for quick estimation of the ventilation rate. For example, when the operating space in the workshop below the ridge vent is 6 m in height, 13.4 m in width, and 18 m in length (both the width and length are the same as those of our study model), then when H = 0.3–1.2 m, we can quickly obtain the ventilation rate per hour as (= 3600 Q v A i r   v o l u m e   ( 6 × 13.4 × 18 ) ) 0.75–3 air changes per hour (ACH) according to Equation (3).

4. Conclusions

Numerical simulations are used to investigate how the design parameters of ridge vents affect the efficiency of thermal buoyancy-driven natural ventilation. The length and width of the representative roof are 18 m and 13.4 m, respectively. The height depends on the design parameters of the ridge vent. The design parameters include the width S, height H, and eave overhang E. In consideration of engineering practices, their ranges are set as follows: S = 1.2, 1.8, 2.4, and 3 m; H = 0.3, 0.6, 0.9, and 1.2 m; and E = 0, 0.3, and 0.6 m. The results can be summarized as follows:
(1)
The flow patterns and temperature distributions in each case are similar. Two buoyancy-driven boundary layer flows that move obliquely upward form inside and outside of the roof panel occur under solar heating. The indoor buoyancy-driven flow moves toward the upper right underneath the roof panel and then turns upward and moves outside via the opening of the ridge vent. Later, this airflow combines with the outdoor buoyancy-driven flow from above the panel and separates again at the top end of the upper roof panel. The separated airflow flows vertically upward under the influence of thermal buoyancy and a symmetric flow pattern. High-temperature air accumulates at the indoor side of the upper roof panel of the ridge vent.
(2)
The ventilated airflow velocity significantly changes at both sides of the roof, resulting in edge effects. The influence range varies with the design parameters. When S = 3 m, H = 0.3 m and E = 0 m, the ventilation rate in the unit length along the X-axis (long axis of the roof) within the edge effect zone is 0.163 (m3/s)/m, while that within the non-edge effect zone is 0.144 (m3/s)/m, with no significant differences between the two.
(3)
For the design parameters of ridge vents, when there is thermal buoyancy-driven ventilation, height is the dominant design parameter. When there are high temperatures and low wind velocities over a long period of time, the designer can raise the ridge vent as high as possible to increase the ventilation efficiency.
(4)
The thermal buoyancy-driven ventilation rate Q v (m3/s) induced by ridge vents can be expressed as follows: Q v = 1.9 + 1.86 H . The correlation equation deviates 5.36% from the simulation result. The applicable parameter ranges are S = 1.2–3.0 m, H = 0.3–1.2 m, and E = 0.3–0.6 m.
The current results are limited to the investigated object and selected typical weather conditions. To explore practical applications and ventilation rates in other conditions, tests should be performed again under specific weather conditions. Configurations of the object (e.g., building height, geometry, building openings, ridge vent design, etc.) and design and layout of indoor partitions would affect ventilation performance. Although the investigation of these subjects (wind conditions, object configurations and indoor partitioning) is not what we explored in this study but is worth discussing.

Author Contributions

C.-M.C. and C.-M.L. conceived of and designed the model; C.-M.C. and Y.-P.L. performed the experimental and simulation works; C.-M.C. and S.-C.C. analyzed the data; and C.-M.C. and C.-M.L. wrote the paper. All authors have read and agreed to the published version of the manuscript.

Funding

This research received no external funding.

Institutional Review Board Statement

Not applicable.

Informed Consent Statement

Not applicable.

Data Availability Statement

The data presented in this study are available on request from the corresponding author.

Conflicts of Interest

The authors declare no conflict of interest.

References

  1. Aflaki, A.; Mahyuddin, N.; Al-Cheikh Mahmoud, Z.; Baharum, M.R. A review on natural ventilation applications through building façade components and ventilation openings in tropical climates. Energy Build. 2015, 101, 153–162. [Google Scholar] [CrossRef]
  2. Jomehzadeh, F.; Hussen, H.M.; Calautit, J.K.; Nejat, P.; Ferwati, M.S. Natural ventilation by windcatcher (Badgir): A review on the impacts of geometry, microclimate and macroclimate. Energy Build. 2020, 226, 110396. [Google Scholar] [CrossRef]
  3. Izadyar, N.; Miller, W.; Rismanchi, B.; Garcia-Hansen, V. Impacts of façade openings’ geometry on natural ventilation and occupants’ perception: A review. Build. Environ. 2020, 170, 106613. [Google Scholar] [CrossRef]
  4. Zhang, H.; Yang, D.; Tam, V.W.Y.; Tao, Y.; Zhang, G.; Setunge, S.; Shi, L. A critical review of combined natural ventilation techniques in sustainable buildings. Renew. Sustain. Energy Rev. 2021, 141, 110795. [Google Scholar] [CrossRef]
  5. Tariku, F.; Iffa, E. Temperature and air flow patterns in attic roof. J. Archit. Eng. 2017, 23, 04017014. [Google Scholar] [CrossRef]
  6. Wang, S.; Shen, Z. Impacts of ventilation ratio and vent balance on cooling load and air flow of naturally ventilated attics. Energies 2012, 5, 3218–3232. [Google Scholar] [CrossRef]
  7. Iffa, E.; Tariku, F. Attic baffle size and vent configuration impacts on attic ventilation. Build. Environ. 2015, 89, 28–37. [Google Scholar] [CrossRef]
  8. Wen, I.J.; Chang, P.C.; Lai, C.M.; Chiang, C.M. Numerical investigation on flow structures of two double roofs collocating with covered ridge with sidewall opening (CRSO). J. Inst. Eng. Archit. Eng. Div. 2008, 89, 20–25. [Google Scholar]
  9. Kang, J.H.; Lee, S.J. Improvement of natural ventilation in a large factory building using a louver ventilator. Build. Environ. 2008, 43, 2132–2141. [Google Scholar] [CrossRef]
  10. Cruz-Salas, M.V.; Castillo, A.; Huelsz, G. Experimental study on natural ventilation of a room with a windward window and different windexchangers. Energy Build. 2014, 84, 458–465. [Google Scholar] [CrossRef]
  11. Van Overbeke, P.; De Vogeleer, G.; Mendes, L.; Brusselman, E.; Demeyer, P.; Pieters, J. Methodology for airflow rate measurements in a naturally ventilated mock-up animal building with side and ridge vents. Build. Environ. 2016, 105, 153–163. [Google Scholar] [CrossRef]
  12. Wang, Y.; Zhao, T.; Cao, Z.; Zhai, C.; Wu, S.; Zhang, C.; Zhang, Q.; Lv, W. The influence of indoor thermal conditions on ventilation flow and pollutant dispersion in downstream industrial workshop. Build. Environ. 2021, 187, 107400. [Google Scholar] [CrossRef]
  13. Espinoza, K.; López, A.; Valera, D.L.; Molina-Aiz, F.D.; Torres, J.A.; Peña, A. Effects of ventilator configuration on the flow pattern of a naturally-ventilated three-span mediterranean greenhouse. Biosyst. Eng. 2017, 164, 13–30. [Google Scholar] [CrossRef]
  14. Chu, C.-R.; Lan, T.-W. Effectiveness of ridge vent to wind-driven natural ventilation in monoslope multi-span greenhouses. Biosyst. Eng. 2019, 186, 279–292. [Google Scholar] [CrossRef]
  15. Munar, E.V.; Bojacá, C. Study using a CFD approach of the efficiency of a roof ventilation closure system in a multi-tunnel greenhouse for nighttime microclimate optimization. Rev. Ceres 2020, 67, 345–356. [Google Scholar] [CrossRef]
  16. Spalding, D.B. The Phoenics Encyclopedia; CHAM Ltd.: London, UK, 1994. [Google Scholar]
Figure 1. Building design cases with ridge vents (red dotted area) (unit: m). (a) Field images, (b) A Factory case and its dimensions.
Buildings 12 00112 g001
Figure 2. Development process of the physical model in this study (not to scale; units: m). (a) Representative roof and the workshop space below; (b) Physical model.
Buildings 12 00112 g002
Figure 3. (a) The computational domain; (b) grid independency test results; (c) experimental model for numerical validation; (d) validation results.
Buildings 12 00112 g003
Figure 4. Distribution of flow fields and temperatures. (a) S = 1.2 m, H = 0.3 m, E = 0 m; (b) S = 1.2 m, H = 0.3 m, E = 0.6 m; (c) S = 3 m, H = 0.3 m, E = 0 m; (d) S = 3 m, H = 1.2 m, E = 0 m.
Buildings 12 00112 g004
Figure 5. Edge effects. (a) S = 1.2 m, H = 0.3 m, E = 0 m; (b) S = 1.2 m, H = 0.3 m, E = 0.6 m; (c) S = 3 m, H = 0.3 m, E = 0 m; (d) S = 3 m, H = 1.2 m, E = 0 m.
Buildings 12 00112 g005
Figure 6. Effect of design parameters on the ventilation rate and their relationship. (a) Effect of design parameter S; (b) Effect of design parameter H; (c) Effect of design parameter E; (d) Correlation.
Buildings 12 00112 g006
Table 1. Geometric data.
Parts of the ModelGeometric Data
Coordinates (X+, Y+, Z+)For illustration of the factory case and representative roof (Figure 1 and Figure 2a)
Coordinates (X, Y, Z)For illustration of the physical model (Figure 2b)
Coordinates (X’, Y’, Z’)For illustration of the computational domain (Figure 3a)
Representative roof (Figure 2a)18 m × 13.4 m × (Z+ − 5.78) m (H)
Physical model (CFD model) (Figure 2b)18 m × 6.7 m × Z m (H)
This Z value is determined by S and H; when S = 1.2 m and H = 1.2 m, Z reaches the maximum value, 3.9 m
Material and thickness of the roof panelSteel, 0.06 m
Angle between the roof panel and ground (Figure 2b)24°
Other building materialsAdiabatic plates
Width of the ridge vent S (m) (Figure 2b)1.2, 1.8, 2.4, 3
Height of the ridge vent H (m) (Figure 2b)0.3, 0.6, 0.9, 1.2
Eave overhang of the ridge vent E (m) (Figure 2b)0, 0.3, 0.6
Table 2. Parameters specified in the numerical calculations. (Figure 3a).
Distance between the physical model and computational domainLx (= 18 m), Ly (6.7 m), 2Lz
Computational domain54 m × 13.4 m × 3Lz
Direction of gravitational acceleration−Z’
Plane Y’ = 0 in the computational domain (Figure 3a)Wall with no-slip conditions
(realizing symmetry of the physical model)
Plane Z’ = 0 in the computational domain (Figure 3a)Neumann conditions
(realizing free indoor and outdoor airflow induced by solar-heated roof panel)
Other planesNeumann conditions (realizing free flow of the outdoor air)
Temperature of the roof surface (TH)70 °C
Environment temperature28 °C
Publisher’s Note: MDPI stays neutral with regard to jurisdictional claims in published maps and institutional affiliations.

