Article

Investigation of Indoor Polycyclic Aromatic Hydrocarbons (PAHs) in Rural Northeast China: Pollution Characteristics, Source Analysis, and Health Assessment

School of Municipal & Environmental Engineering, Jilin Jianzhu University, Changchun 130118, China
*
Author to whom correspondence should be addressed.
Buildings 2022, 12(2), 153; https://doi.org/10.3390/buildings12020153
Submission received: 8 January 2022 / Revised: 24 January 2022 / Accepted: 30 January 2022 / Published: 1 February 2022
(This article belongs to the Special Issue Healthy Green Building Planning and Design)

Abstract

:
Due to the low winter temperatures in rural areas of Northeast China, biomass fuels are widely used for heating and cooking, resulting in increased concentrations of PAHs in rural indoor areas during the heating period and threatening human health. Therefore, exploring the pollution characteristics, source localization, and risk assessment of indoor PAHs in rural Northeast China is of great significance for improving rural indoor air quality. In this study, PAHs were collected from a residential building in rural Northeast China for one consecutive year (January 2020–December 2020), and their concentrations were determined to explore the distribution patterns and sources of PAHs to further assess the carcinogenic risk of PAHs to humans. The results of the study showed that the average concentration of indoor PAHs in rural areas during the heating period (93.02 ng/m3) was about 1.81 times higher than that of the non-heating period (51.26 ng/m3). The main sources of PAHs were mixed combustion of biomass and coal, motor vehicle emissions, and domestic waste combustion. The level of indoor PAHs pollution has posed a carcinogenic risk to the health of the rural population in the Northeast.

1. Introduction

Particulate matter has become the primary pollutant in the air environment and is closely related to epidemiology [1]. Particulates tend to reach deep into the body and have a negative impact on health. Relevant studies have shown that high levels of particulates exposure increase cardiovascular risk [2,3,4,5,6], respiratory disease [7,8,9,10], premature death [11,12,13], etc. The chemical substances contained in particulates, such as polycyclic aromatic hydrocarbons (PAHs) and heavy metals, pose a more serious health risk than particulates only [14,15]. PAHs are a kind of Volatile Organic Compound (VOC) attached to particulate matter, which have a greater health impact on the human body [16]. Related epidemiological studies indicate that because of the toxicity, persistence, and bioaccumulation of PAHs [17], long-term or excessive human exposure to PAHs will lead to health diseases such as cancer [18,19], reproductive problems, and gene mutations [20,21]. In recent years, due to the continuous increasing emissions of PAHs in ambient air, large-scale populations are exposed to the dangers of PAHs emission toxicity [22,23]. Therefore, the environmental health problems caused by PAHs have attracted widespread attention.
According to the seventh population census of China [24] and the Ministry of Housing and Urban–Rural Development of China [25], the rural population is 509.79 million, accounting for 36.11% of the total population, and the per-capita living area in rural areas is 48.9 m2, accounting for 40.98% of the national living area, which shows that the rural population is still an important mainstay in China. Rural living conditions, housing quality, and energy demand are not as superior as those in urban areas. In addition, factors such as high population density, low fuel combustion efficiency, and poor ventilation in rural areas cause more serious indoor air pollution than in urban areas, as well as a relatively high risk of exposure to pollutants [26,27]. Therefore, the research on rural indoor air pollution and the creation of a healthy and sustainable living environment are extremely urgent.
The research on indoor air pollution in China is mostly focused on the urban living environment [28,29]. It is found that most of the pollution is transmitted from outdoors to indoors, a little is caused by smoking and cooking, and the level of indoor pollution is within a relatively stable range [30]. The sources of indoor pollution in rural areas are different from urban pollution sources. Rural buildings are older and the enclosure structure is poorly airtight, so outdoor sources contribute less to indoor pollution. Rural indoor pollution sources are more complex, with a mix of fuel combustion, smoking, and cooking, and the same variability in pollution over time. Therefore, a specific in-depth analysis of rural indoor air quality is needed.
As a result of the restriction of living standards and the influence of climate conditions, indoor air pollution in rural areas in Northeast China is more serious. Although the government has been vigorously promoting clean heating, biomass fuels are still widely used for cooking and heating in rural Northeast China due to farmers’ living habits and the large surplus of straw [31]. In recent years, relevant studies have shown that the annual global PAH emissions from rural and urban areas are 297 and 141 Gg (0.46 Gg and 0.20 Gg BaP-equivalent emissions, respectively) [32,33]. Studies on PAH emissions in China have also shown that PAHs emissions are higher in rural areas than in urban areas [34]. The Indoor Air Quality Standard (GB T18883-2002) [35] issued by the Chinese Ministry of Health stipulates a daily concentration limit of 1.0 ng/m3 for indoor BaP. When biomass fuels are used for cooking in rural kitchens in Northeast China, BaP concentrations were as high as 310 ng/m3 in winter and 58 ng/m3 in summer [36], which were 310 and 58 times the standard, respectively. Therefore, the study of indoor PAHs pollution in rural areas of Northeast China is particularly important. At present, the research on PAHs in rural areas of China mostly focused on Central China [37,38], North China [36,39], East China [40,41], Northwest China [42,43], and Southwest China [39,44,45,46,47]. The research on Northeast China is still blank, while the pollution in Northeast China is the most serious. This study will improve the rural indoor PAHs pollution research system in China, which is of great significance for improving the indoor environment and reducing PAHs pollution.
In this study, an ordinary farmer’s household in Northeast China was used as the monitoring object. The indoor PAHs were sampled for a period of 1 year, tested, and analyzed by GC-MS (Gas Chromatography-Mass Spectrometry). The following research content was carried out: (1) analysis of the pollution characteristics of PAHs concentration and ring number distribution; (2) exploring the pollution sources of PAHs; and (3) assessing the carcinogenic health risk of PAHs by health modeling.

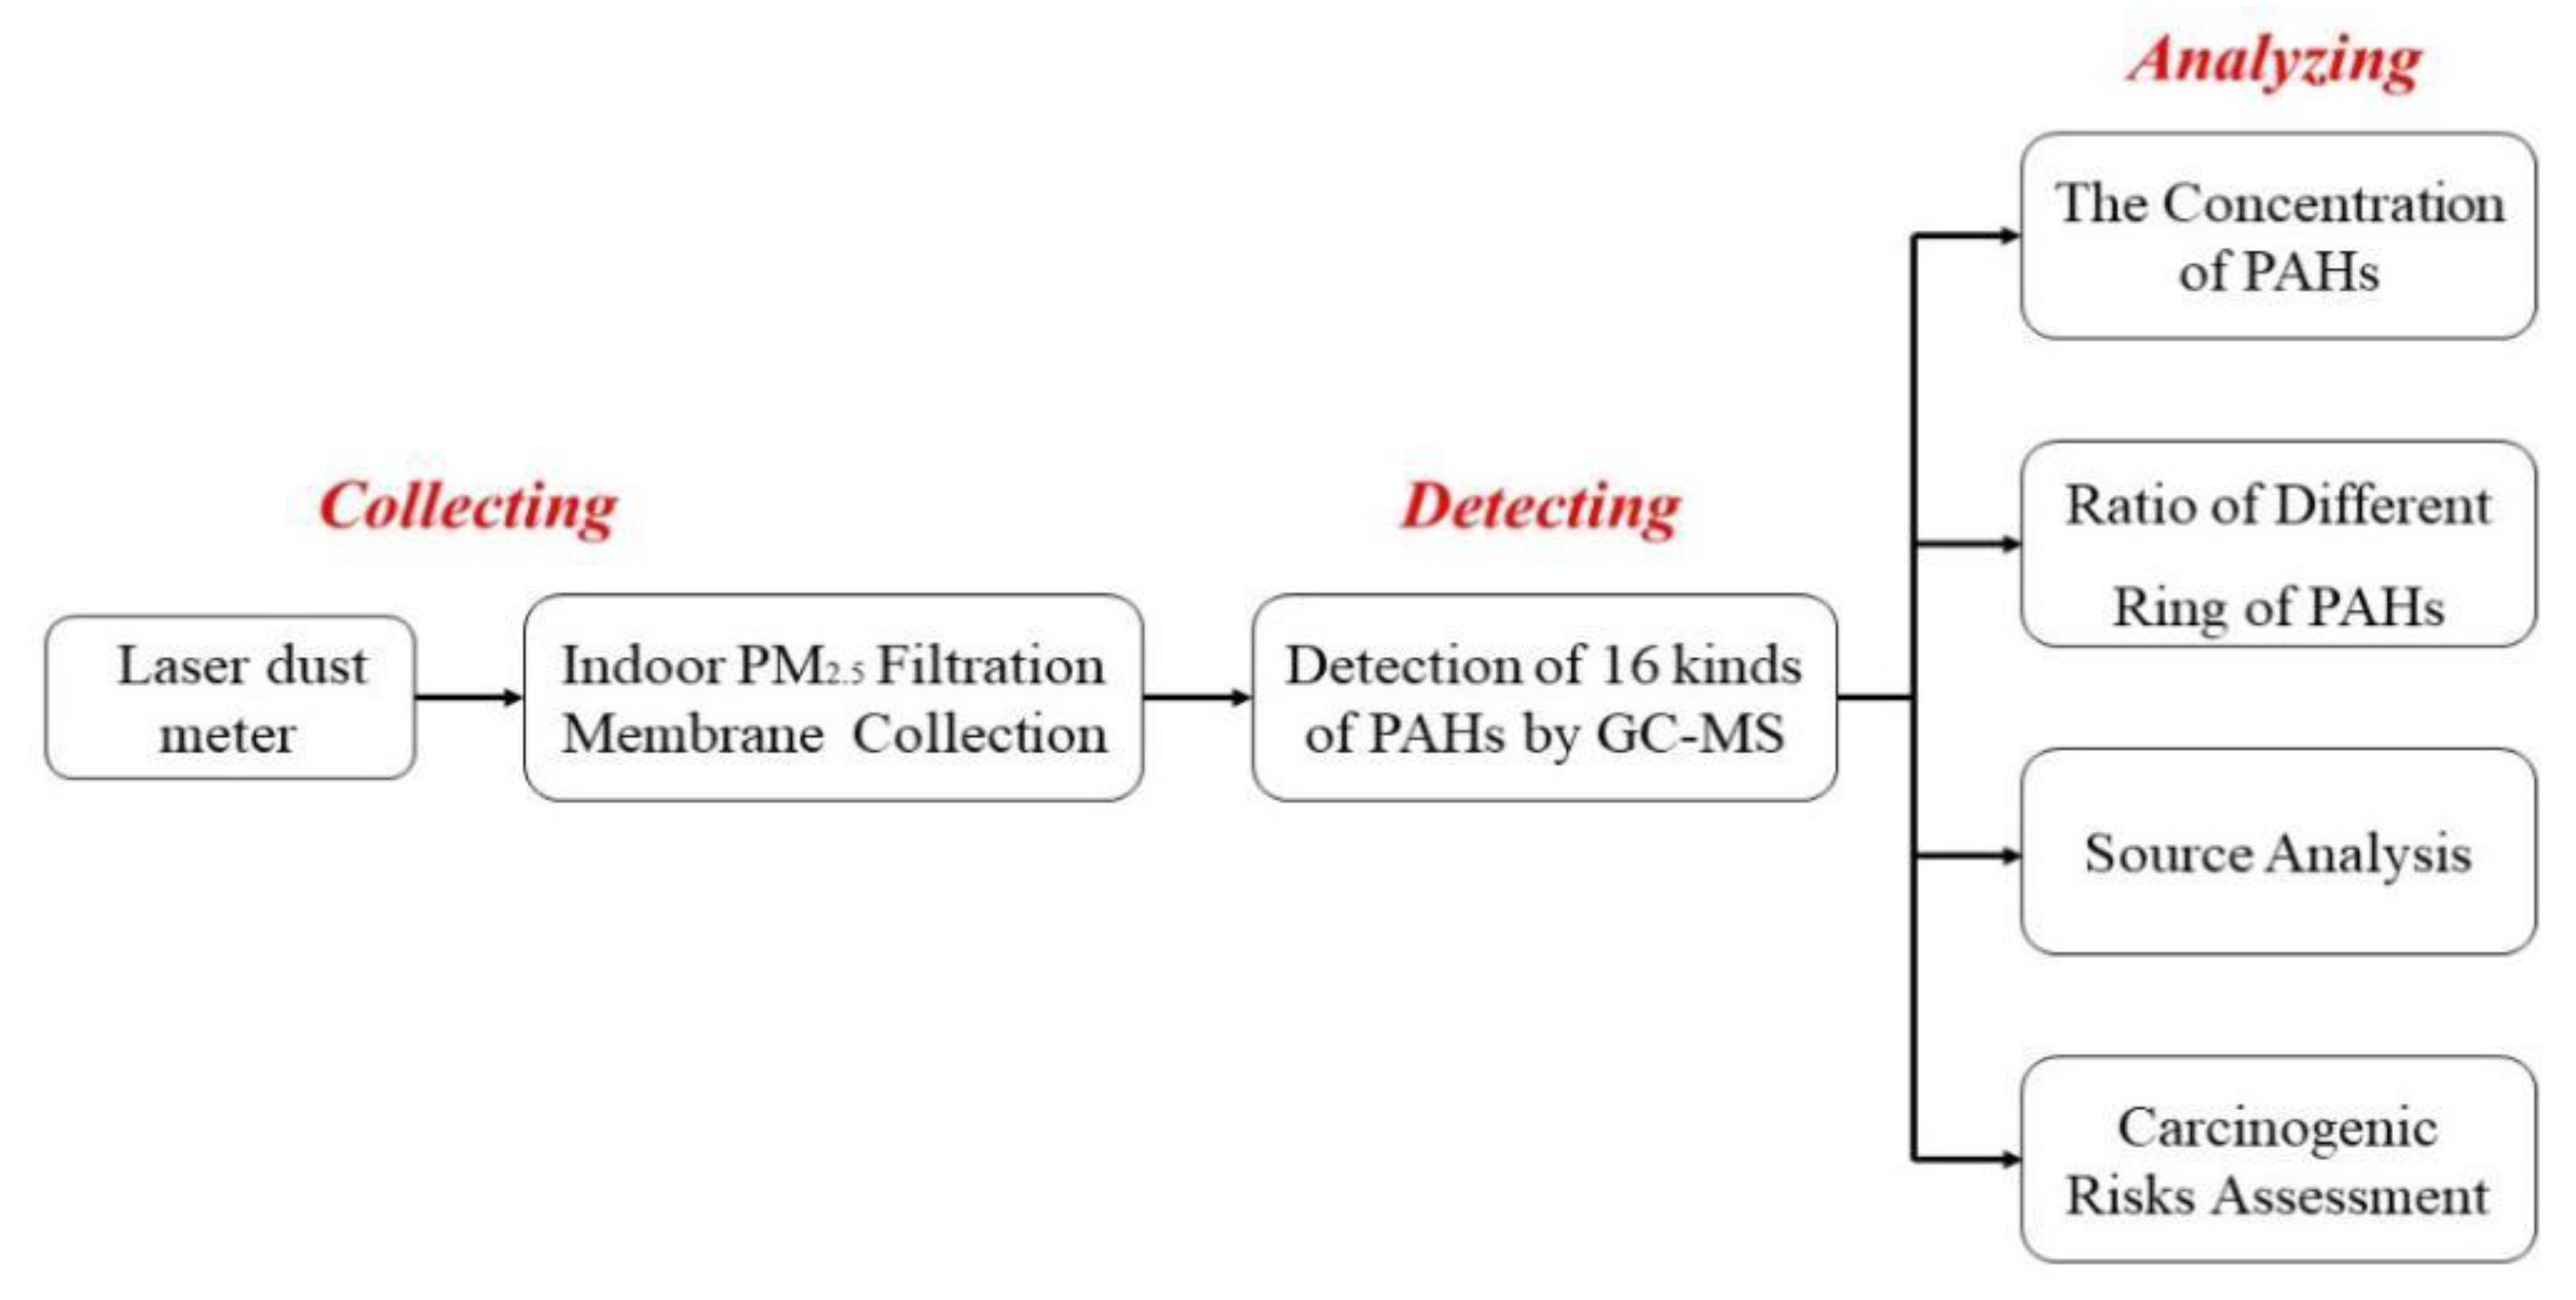
2. Materials and Methods

According to the U.S. Environmental Protection Agency (USEPA) publication, more than 200 PAHs have been identified, and the USEPA has listed 16 of them as priority contaminants for control in the environment [48]. The ring number classification and properties of the 16 preferentially controlled PAHs are shown in Table 1.
The main research methods of this study are as follows. (1) Sampling and testing: A Particulate Matter Sampler Model 1108A (Zhongte, Qingdao, China) was used for sampling and the filter membrane after sampling was subjected to pre-treatment to extract PAHs, and PAHs were detected by gas chromatography-mass spectrometry (GC-MS). (2) Theoretical analysis: According to the spatial and temporal characteristics of the sampling site combined with the pollution characteristics of the single PAH, the pollution characteristics of indoor PAHs were analyzed, and the source of PAHs was determined through Principal Component Analysis. (3) Model assessment: The carcinogenic risk of PAHs to adults and children was assessed using a carcinogenic risk model published by the US EPA. The flow chart of this study is shown in Figure 1.

2.1. Sites and Sampling

Rural areas in Northeast China are extremely similar in terms of building types, energy types, and climatic conditions. Building Type: Rural housing in Northeast China is inhabited by cottage buildings. These houses are mostly of brick and tile construction. Most of the internal structures are connected by a pot table and Kang (Kang, usually made of masonry, adobe, and cement, serves as a traditional bed platform and heating system for rural Chinese people, as shown in Figure 2). By burning biomass inside the pot table for heating and cooking, the heat generated is transferred to the Kang, which in turn raises the room temperature (heat transfer between the Kang and the pot table is shown in Figure 2 [49]). Most of these buildings are 20–30 years old and with poor enclosing structure airtightness. Energy types: Most of the domestic energy sources in rural areas are still mainly biomass, with LPG (Liquefied Petroleum Gas) and electricity as a secondary source. Climatic conditions: The northeast region is located in a severe cold region with temperate climate characteristics.
Jilin City, Jilin Province is in the center of Northeast China, so we selected a farm household in Yongji County, Jilin City, Jilin Province (125°48′9′ E–126°40′1′ E, 43°18′7′ N–43°35′00′ N) as a typical sampling site for this study. According to meteorological data, the average annual temperature is 4.6 °C, with historical highs of up to 40 °C and lows of −36.5 °C. The heating period in winter is about 180 days. Yongji County is one of the important grain production bases in China, and the total grain production in Yongji County in 2019 was 478,597 t [50]; this region has high grain production and abundant straw resources. With the increasing production of grain in recent years, the production of straw has also increased dramatically.
According to the survey, there were 76 households with about 310 people in the village where the sampled houses were located. The percentage of using straw for cooking and heating in the whole village was about 94.5%. The use of straw as a domestic energy source by the sampled households was chosen to be representative of this study. The natural conditions of the sample subjects were a residential population of four people, including one smoker. The building area of the house is 85 m2. The sampling time was January 2020–December 2020, 12 months of continuous monitoring, 7 days of random continuous monitoring per month, 24 h per day, from 8:00 am to 8:00 am the next day, data were recorded every 30 s, and one filter membrane was obtained for this monitoring point per month. During the non-heating period, LPG and electricity are mainly used as the main source of domestic energy. During the heating period, biomass is mainly used as the main energy source, with LPG and electricity as secondary energy sources.
According to the requirements of Indoor Air Quality Standard (GB/T 18883-2002) [35], the monitoring point was set in the bedroom, 1 m from the window and wall, and 1.5 m above the ground, which is basically the same height as the human breathing zone. The location of the sample is beside the highway, which is a provincial highway, and the common motor vehicles in the villages are cars and diesel vehicles. The sampling sites, monitoring setup points, and fuel combustion locations are shown in Figure 2.
The sampling instrument for this study was a 1108A particulate sampler (Qingdao Zhongte, Qingdao, China) with a flow rate of 100 L/min and a measurement accuracy of 10% with a repeatability error of only 2%. Sampling was of Swedish Munktell MK360 grade 90 mm quartz filter membranes. In order to avoid human factors or environmental pollution, the membranes were baked in a muffle furnace at 600 °C for 4 h before sampling and then dried at 20 °C and 50% humidity for 48 h until constant weight, weighed three times to take the average value as A0, and stored in a special membrane box at low temperature and protected from light. After sampling, the membranes must still be dried for 48 h to constant weight and weighed three times to take the average value as A1, and the weighed membranes were put into aluminum foil sealed bags and stored at −40 °C in an ultra-low temperature refrigerator for measurement.

2.2. Sample Treatment

2.2.1. Extraction and Purification

The collected membrane was cut into a 30 mL brown glass vial, 15 mL of extractant (acetone:n-hexane = 1:1) was added, and the extraction was sonicated for 30 min in a sonicator at 25 °C; then, 15 mL of extractant was added, the extraction was continued for 30 min, and the sonicated solution was transferred into a pear-shaped vial and spun to 1–2 mL with a rotary evaporator. Then, the spun solution was transferred into an activated SPE column. In the SPE column, the liquid flowed into the new pear-shaped vial through the SPE column, rinsed the pear-shaped vial with 10 mL of rinsing solution (dichloromethane:n-hexane = 3:7), transferred the rinsing solution into the new pear-shaped vial, and vaporized it to 0.5–1 mL with nitrogen blowing; then, the volume was fixed with hexane to 1 mL for measurement.
Ramp-up procedure: Start at 60 °C, maintain for 2 min, then ramp up to 140 °C at 30 °C/min, then to 300 °C at 8 °C/min, and retain for 10 min. Scan mode: selective ion scan (SIM). The characterization of the sample is mainly based on the retention time of the characteristic ions and chromatography.

2.2.2. Quality Control

In order to ensure the reproducibility and accuracy of the experimental process, blank labeled experiments were also analyzed in the experimental process to verify whether the experimental method would meet the recovery requirements. The stability of the instrument operation was verified through parallel sample experiments. In order to avoid excessive deviation in the peak location of PAHs in the sample testing process, standard samples were regularly used to correct the baseline position, and further blank samples were analyzed to judge whether the reagent was contaminated. The quality control of experiments was conducted as the internal standard method using 5 representative substances that were selected as specified in HJ 646-2013 [51]. The recovery rates of the indicator Naphthalene-D8, Acenaphthene-D10, Philippines-D10, Chrysene-D12, and Pyrene-D12 were 65.6 ± 20.1%, 61.5 ± 19.1%, 83.3 ± 17.1%, 95.6 ± 12.1%, and 97.6 ± 10.1%, respectively. After the above steps were completed, the 16 kinds of priority-controlled PAHs in samples were analyzed by GC-MS.

2.2.3. Chromatographic Conditions

Control parameters: the electron bombardment source (EI) was an ion source of 70 eV, the electron multiplier voltage (EMV) was 1678 eV, the column was 122-5532UI (30.00 m × 250 μm × 0.25 μm), the carrier gas was high-purity helium, the column flow rate was 1.0 mL/min, the pre-column pressure was 8.2317 psi, the inlet temperature was 250 °C, the transfer line temperature was 280 °C, the ion source temperature was 230 °C, and the injection volume 1 μL with no split injection.
Ramp-up procedure: Start at 60 °C, maintain for 2 min, then ramp up to 140 °C at 30 °C/min, then to 300 °C at 8 °C/min, and retain for 10 min. Scan mode: selective ion scan (SIM). The characterization of the sample was mainly based on the retention time of the characteristic ions and chromatography.

2.3. Health Risks Assessment

Among the 16 PAHs, BaP is regarded as one of the most toxic PAHs with national standard values. However, there are differences in the toxicity of PAHs with different ring numbers, so the toxicity equivalence factors (TEFs) of benzo[a]pyrene (BaP) is usually used as a reference to calculate the TEFs of other monomeric PAHs and to calculate the total toxic equivalent contents (TEQs) relative to BaP. The calculation equation is as follows [52]:
T E Q s = i = 1 16 ( C i × T E F i )
where TEQs—total toxic equivalent content, μg/kg; Ci—the content of monomeric PAHs, μg/m3; TEFi—toxicity of monomeric PAHs equivalence factor; TEF is taken as shown in Table 2 [53,54].
PAHs pose a carcinogenic risk to humans through three main routes: ingestion pathways (ILCRing), inhalation pathways (ILCRinh), and dermal-contact pathways (ILCRder). Equations (2)–(5) represent the carcinogenic risk of PAHs to adults or children through the above three pathways, respectively [55,56]. The significance and values of various parameters are shown in Table 3.
I L C R i n g = T E Q s × C S F i n g × B W / 70 3 × I R i n g × E F × E D B W × A T × 10 6
I L C R i n h = T E Q s × C S F i n h × B W / 70 3 × I R i n h × E F × E D B W × A T × P E F
I L C R d e r = T E Q s × C S F d e r × B W / 70 3 × S A × S L × A B S × E F × E D B W × A T × 10 6
T I L C R = I L C R i n g + I L C R i n h + I L C R d e r
The total lifetime carcinogenic risk (TILCR) represents the combined risk through the above three intake routes. When ILCR or TILCR < 10−6, it means no carcinogenic risk or negligible carcinogenic risk, when 10−4 < ILCR or TILCR < 10−6, it means some carcinogenic risk, and when ILCR > 10−4, it means high carcinogenic risk.

3. Results

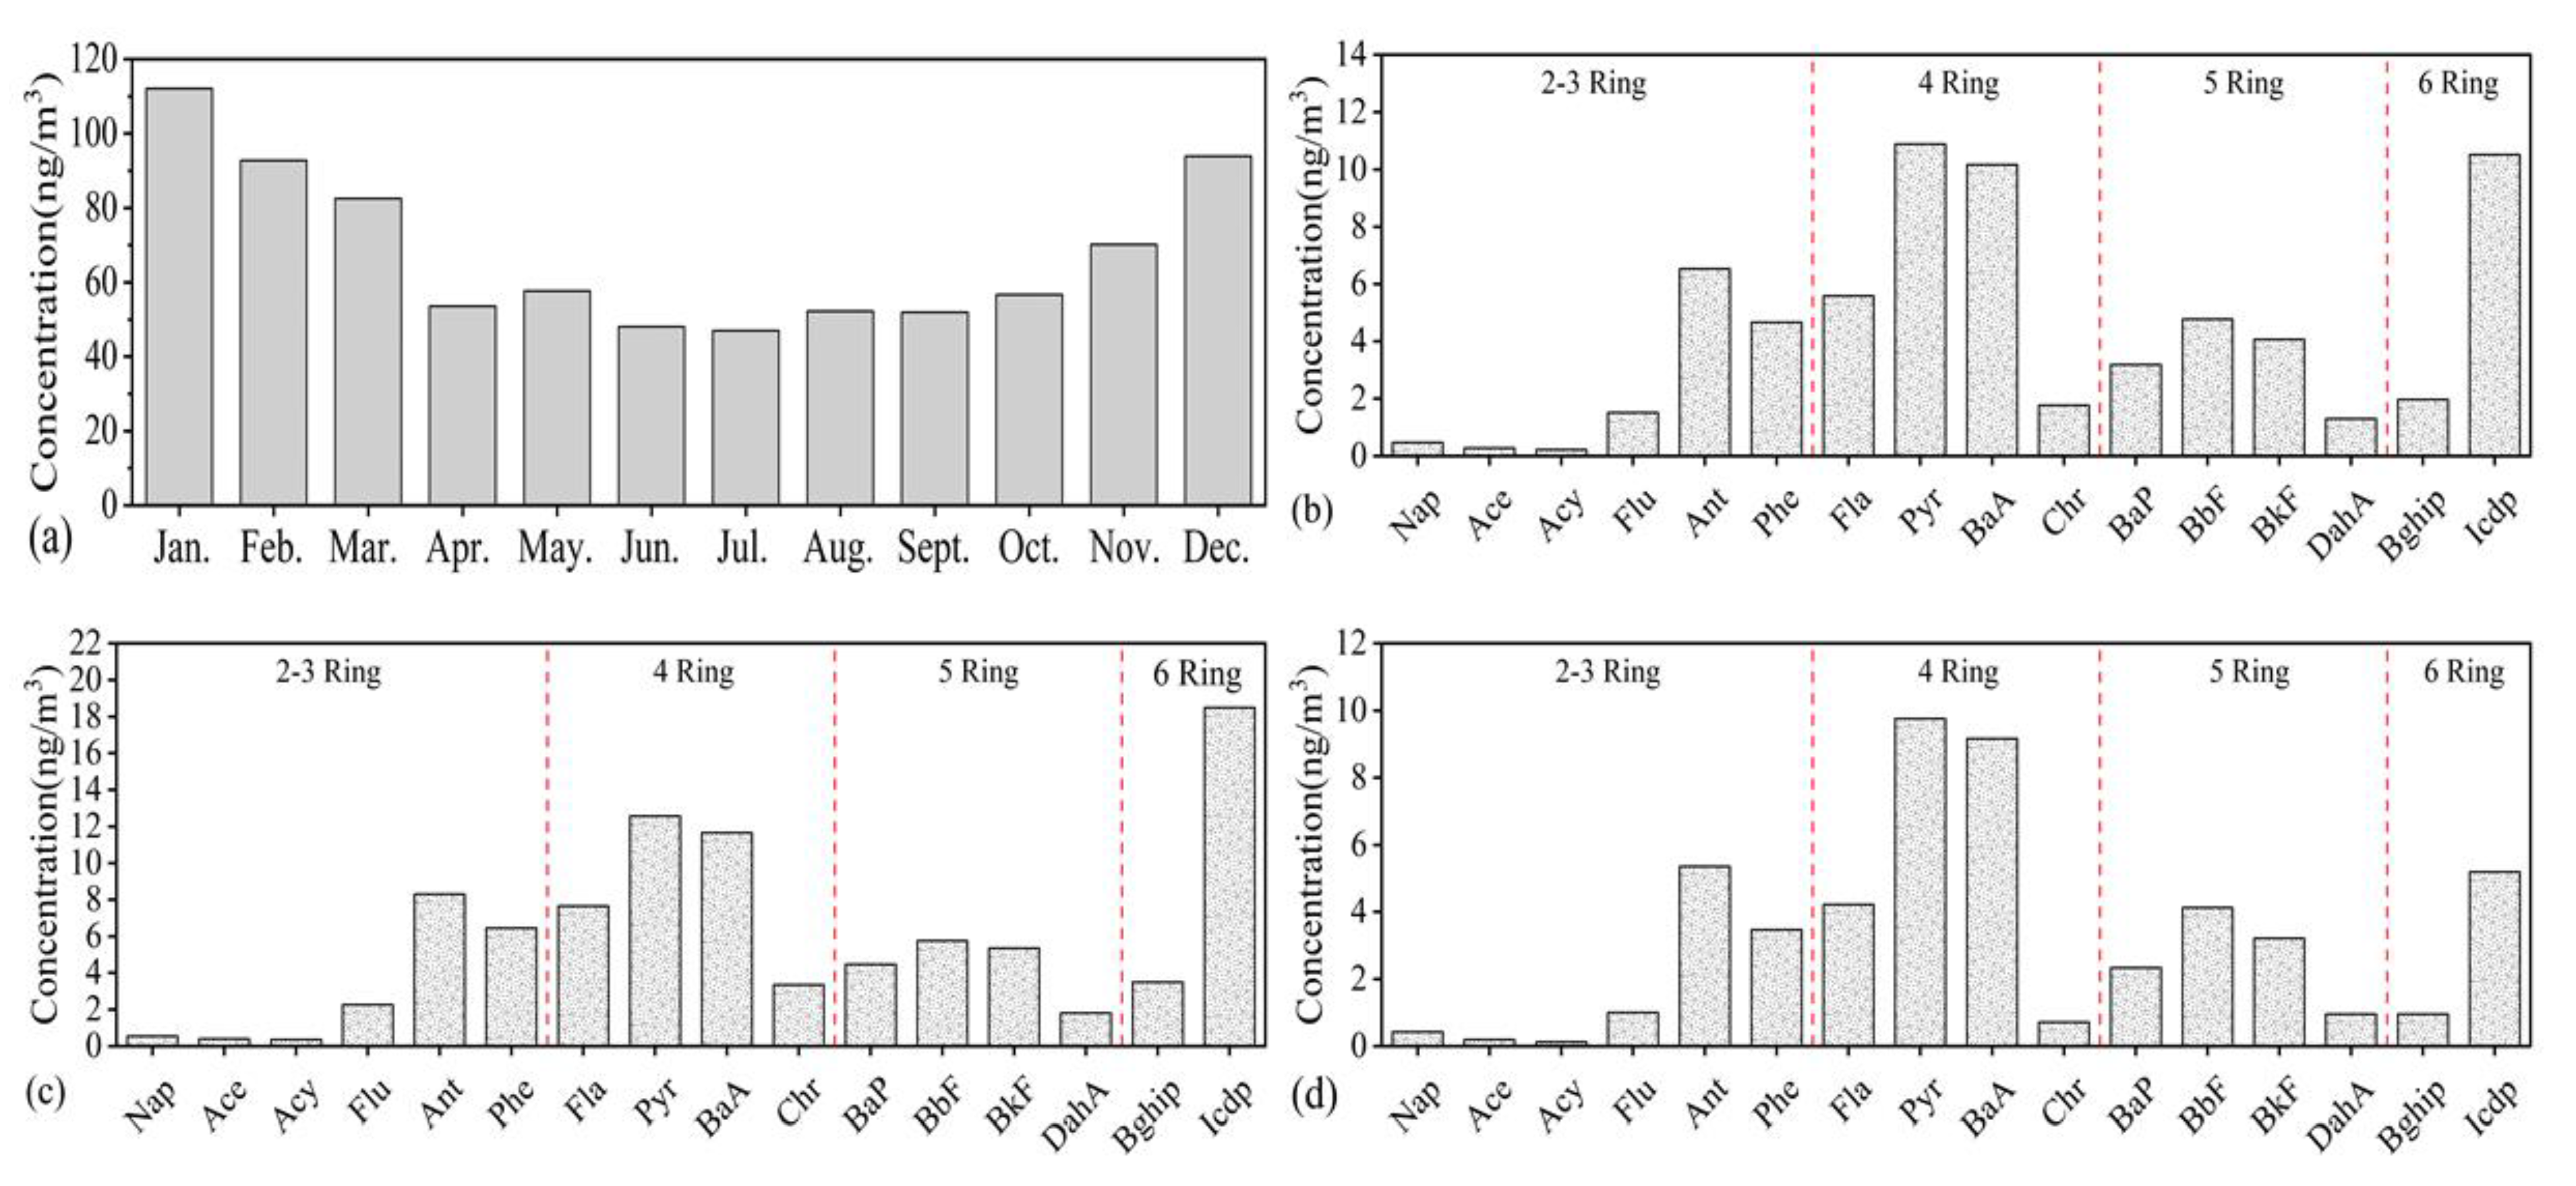
3.1. Pollution Characteristics of Indoor PAHs

3.1.1. The Concentration of PAHs

The monthly emissions of the 16 PAHs indoors are shown in Figure 3a. The highest emissions were in January at 115.76 ng/m3 and the lowest in June were 46.17 ng/m3, with an annual average of 67.97 ng/m3. January, February, March, November, and December are heating periods with an average emission of 93.02 ng/m3, and the rest of the months are non-heating periods with an average emission of 51.26 ng/m3, which is about 1.81 times higher in the heating period than in the non-heating period. Figure 3b–d represent the emissions of monomeric PAH at different periods of time; the highest monomeric PAH emissions are IcdP in the six rings and Pyr and BaA in the four rings.

3.1.2. Ratio of Different Ring of PAHs

The 16 preferred control PAHs in this study were classified into three categories according to the number of benzene rings in the structure: low ring LR (two rings and three rings), medium ring MR (four rings), and high ring HR (five rings and six rings). The proportion of each ring in the whole year, heating period, and non-heating period are indicated in Table 4. It can be seen in Table 4 that during the heating period, the ring distribution of PAHs is dominated by HR (42.10%), followed by MR (38.16%) and the least is by LR (19.74%). In contrast, the non-heating period was dominated by MR (46.67%), followed by HR (32.70%), and the minimum by LR (20.63%).
Since four-ring PAHs are semi-volatile organic compounds, they are easily transported over distances, and PAHs with more than five rings have a higher molecular weight and are mostly adsorbed on particles in solid form. Therefore, four rings/(4 rings + 5 rings) are usually used to determine whether the source of PAHs is a local source or an external source. Studies have shown that in rural areas: when 0.65 < four rings/(4 rings + 5 rings) < 1.87, the source is considered to be a local source, and the higher the ratio, the more it tends to be an exogenous source [63,64]. In this study, four rings/(4 rings + 5 rings) ranged from 0.63 to 0.83 in the heating period and from 0.80 to 0.89 in the non-heating period, and the four rings/(4 rings + 5 rings) in the heating period were smaller than those in the non-heating period, indicating that the effect of external sources on PAHs in the heating period was smaller than that in the non-heating period. Most of the PAHs in the heating period are local sources. Except for the influence of indoor sources inside the residential buildings themselves, most of the farmers in the villages use biomass for combustion, and a large amount of smoke is emitted from the chimneys to the atmosphere, which will enter the interior through the penetration of the doors and windows and have an impact on the concentration of indoor PAHs.

3.2. The Source Apportionment

The sources of PAHs were resolved by applying principal component analysis. Principal component analysis was performed on individual PAH fractions for the whole year, heating period, and non-heating period, respectively, and all factors with eigenvalues greater than 1 were extracted and rotated using the maximum variance method with Kaiser normalization, and three factors explaining the data variance were obtained to determine the pollution sources of PAHs. The results of the principal components of PAHs are shown in Figure 4.
From Figure 4, it can be found that there are three main sources of PAHs throughout the year, which are mixed combustion of biomass and coal, motor vehicle emissions, and domestic waste combustion. The main sources of PAHs in the non-heating period are domestic waste combustion and motor vehicle emissions, respectively. The main sources of PAHs during the heating period are consistent with the sources of PAHs throughout the year, indicating that the pollution during the heating period is critical for the whole year.

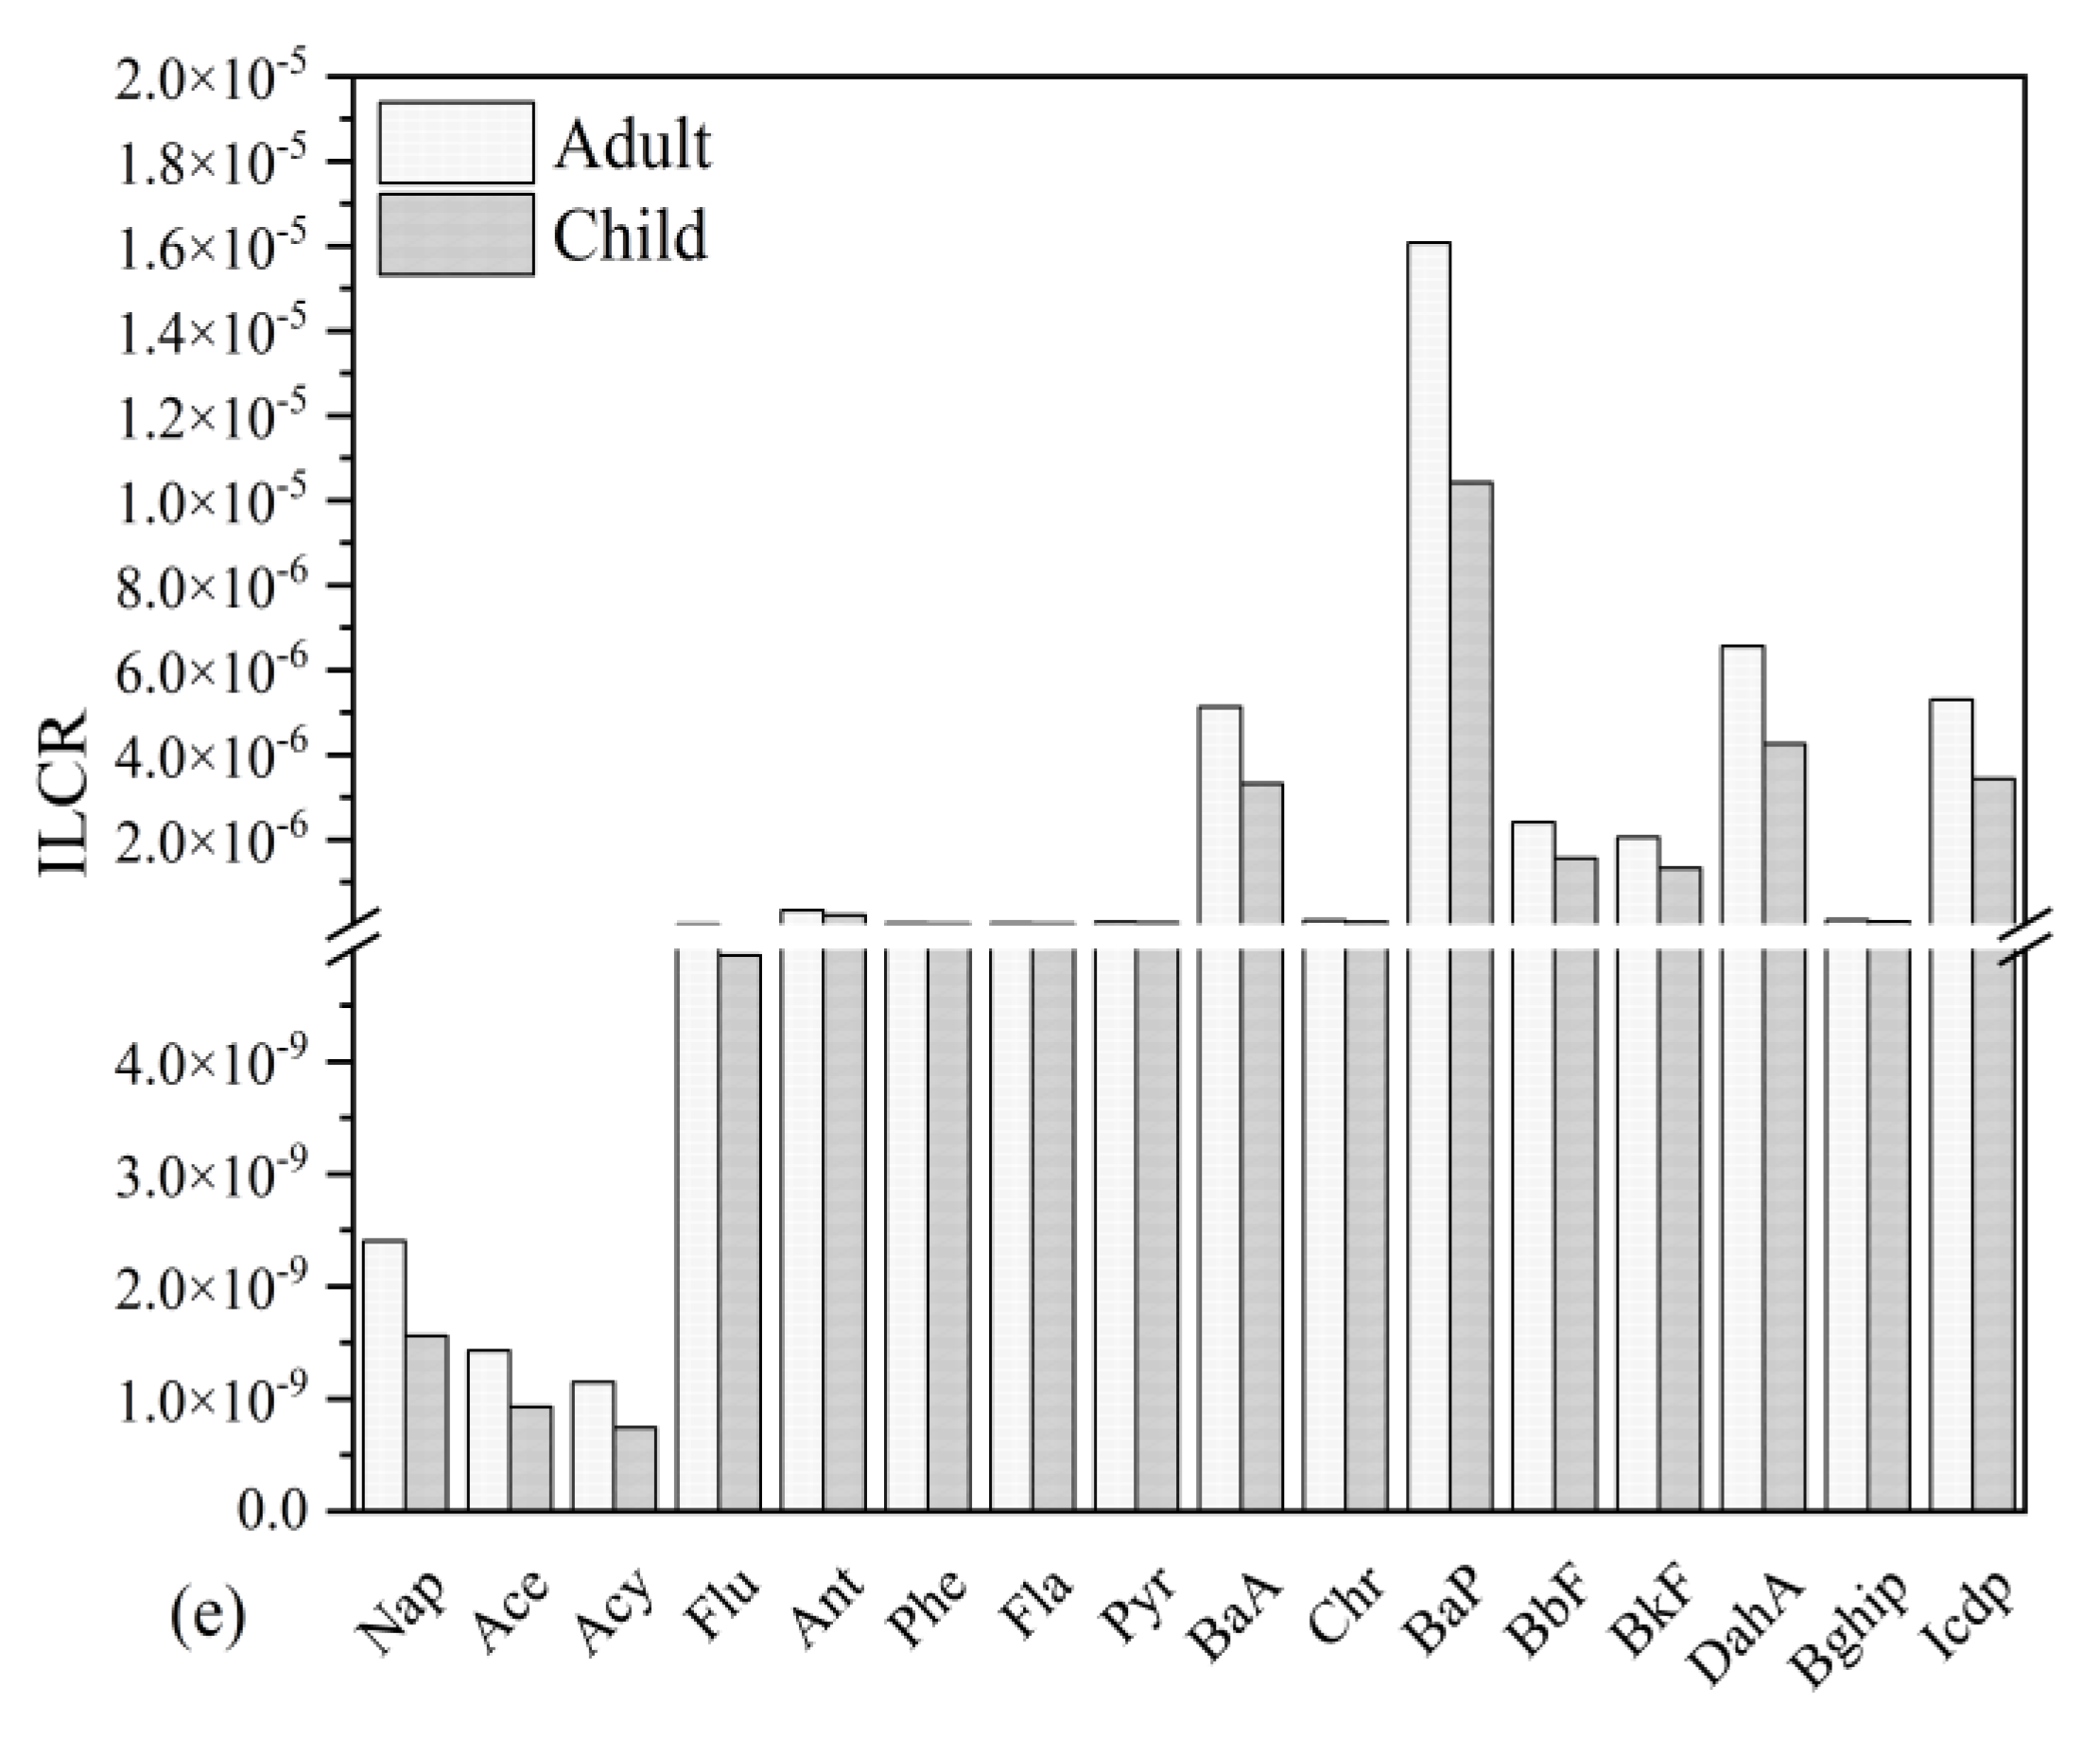
3.3. Carcinogenic Risks Assessment

3.3.1. Toxic Equivalent Concentration

The TEQs of indoor PAHs were calculated by Equation (1) and Table 2 as 75.73 ng/m3, 42.40 ng/m3, and 33.32 ng/m3 for the whole year, heating period, and non-heating period, respectively, and they were about 1.27 times higher in the heating period than in the non-heating period, indicating the increased toxicity of indoor PAHs due to heating in rural areas of Northeast China. According to the Ambient Air Quality Standard (GB3095-2012) [65] issued by the Chinese Ministry of Environmental Protection, the total toxic equivalent concentration limit of PAHs is 10 ng/m3, and the total toxic equivalent concentration of PAHs indoors in this study is much higher than this limit, which shows that indoor PAHs in rural Northeast China are extremely toxic and can cause serious health effects on humans. As shown in Figure 5a, the highest was 12.93 ng/m3 in January and the lowest was 5.07 ng/m3 in July. Figure 5b–d indicate that BaP, DahA, and IcdP contributed more to the total TEQs throughout the year, heating period, and non-heating period with the cumulative contribution of 73.22%, 76.79%, and 68.67%, respectively. Therefore, the control of rural indoor PAHs should mainly focus on these three individual PAHs.

3.3.2. Assessment of Lifelong Lung Carcinogenic Risk (ILCR)

The carcinogenic risks of monomeric PAH for adults and children under the three carcinogenic routes of intake were calculated separately according to Equations (2)–(5) and plotted in Figure 6. The risk of cancer is significantly higher during the heating period than that of the non-heating period. The order of magnitude of carcinogenic risk for each monomeric PAH under all three exposure routes was ILCRder > ILCRing > ILCRinh for adults and ILCRing > ILCRder > ILCRinh for children. It is mainly caused by the three high-ring PAH, DahA, IcdP, and BaP through ingestion pathways and dermal-contact pathways. Adults had a higher magnitude of the carcinogenic risk than children for different populations through inhalation pathways and dermal-contact pathways, while the reverse was found for ingestion pathways: children had a higher risk than adults.
It can be seen from Figure 6 that the total carcinogenic risk values for the whole year are 10−6 < children (5.95 × 10⁻⁵) < adults (6.63 × 10⁻⁵) < 10−4; in the heating period, the total carcinogenic risk values are 10−6 < children (8.23 × 10⁻⁵) < adults (9.28 × 10⁻⁵) < 10−4, and in the non-heating period, the total carcinogenic risk values are 10−6 < children (4.36 × 10⁻⁵) < adults (4.86 × 10⁻⁵) < 10−4, indicating that rural indoor PAHs are carcinogenic to different populations in different periods. The proportion of carcinogenic risk arising from the three routes of exposure to the total carcinogenic risk is shown in Table 5, from which it can be seen that for adults, the risk due to dermal-contact pathways is higher, which is followed by ingestion pathways, while for children, the carcinogenic risk due to ingestion pathways is higher, which is followed by the dermal-contact pathways. For the population as a whole, the risk due to the inhalation pathways is small and can be ignored.

4. Discussion

This section will further analyze the spatial and temporal distribution of PAHs in terms of pollution characteristics, ring number ratio, source analysis, and carcinogenic risk to different populations.
Table 6 shows the comparison between this study and other research on the concentration of PAHs in rural areas in different geographical areas. In general, the degree of indoor PAHs pollution in the northern region does not vary greatly, while in the economically developed areas, the whole region is seriously polluted, and the results of the PAHs studied are relatively high. The southwest is slightly less polluted than the north. Winter temperature is higher in the southwest, and the single use of fuel for heating is not as much as that in the north. In addition, proper natural ventilation can reduce the concentration. Comparing the degree of PAHs pollution by the difference of fuels reveals that the areas using solid fuels such as coal and biomass have higher pollution. The pollution caused by using yak dung as a cooking energy in the Tibetan region in the summer is very high. Relevant studies have shown that poorly ventilated housing and frequent summer rains in Tibetan areas lead to high moisture content in yak dung, resulting in low combustion efficiency [66], which can cause an increase in PAHs and endanger human health [67]. The temporal distribution of PAHs in this study showed a “U”-shaped distribution (Figure 3a); i.e., the heating period was significantly higher than that in the non-heating period. Henan and Hebei also showed that the PAHs concentrations were higher during the heating period than that in the non-heating period, indicating that indoor heating was an important cause of the increase in PAHs. The results of this study are similar to those of Henan, Shanxi, and Shaanxi during the heating period. All these regions use solid fuels, LPG, and electricity as domestic energy sources. It has been reported in the literature that more than 3 billion people worldwide still rely on solid fuels, including biofuels, to meet their energy needs [68,69], and indoor air pollution from solid fuel combustion is a major health risk factor in developing countries [70]. The combustion of solid fuels such as biomass promotes the pyrolysis and synthesis of organic matter, resulting in the emission of large amounts of PAHs into the room [71].
The highest PAHs concentrations were in January and February 2020; the sampling period coincided with the Chinese Spring Festival, when more people were indoors and the simultaneous increase in smoking promoted the emission of PAHs [72,73]. The cooking time in family kitchens during the Spring Festival will be prolonged, and the oil and gas produced by cooking oil and organic matter contained in cooking oil are oxidized and decomposed. There are no smoke exhaust measures in rural kitchens in Northeast China, and natural ventilation is generally not carried out due to the extremely low outdoor temperature, which will cause the serious pollution of PAHs [74,75,76]. The fireworks are a Chinese custom for the New Year; there are certain regulations for the fireworks in cities, but there is no supervision in rural areas. The burning of fireworks causes transient air pollution, which generates large amounts of PAHs that are brought indoors through the enclosure and the movement of people, causing serious pollution with the superimposed effect of PAHs in the room [77,78]. Zhang et al. did a detailed study of PAHs emissions during the fireworks display and found average concentrations of 238.3 ± 147.7 ng/m3 and 204.3 ± 127.4 ng/m3 in suburban and rural areas, respectively, indicating that the fireworks display has a significant impact on PAHs emissions [79]. From April to August, no heating is required, and straw is not generally used for cooking, which is usually done with LPG tanks. September and October are not considered heating months, but temperatures are around 0 °C in the mornings and evenings, and there is a large difference in temperature throughout the day, requiring a small amount of heating. As a result, PAHs concentrations tend to increase during these two months.
At the sampling site of this study, the indoor temperature was higher during the non-heating period, and the main form of low cyclic PAHs existed in gaseous form due to their higher saturation vapor pressure and Henry’s constant. The concentration of monomeric low cyclic PAHs was lower during the non-heating period. Indoor PAHs are mainly mesocyclic PAHs, which are distributed in both gas and solid phases, and it is easy for them to carry out long-distance transmission [80]. The enclosure structure in rural areas has poor airtightness, and high concentrations of outdoor PAHs enter the house through penetration. Relevant studies have shown that high-ring PAHs are mainly derived from internal combustion engine emissions [81] with the highest IcdP emissions in the high ring and increased emissions due to household vehicle and diesel engine emissions. The concentration of five-ring PAHs, which are also highly cyclic, is not as high as that of six-ring PAHs due to the fact that BaP is readily photolyzed [82] and BaP, BbF, and BkF are isomers, so the five-ring content is lower than that of six-ring PAHs.
By analyzing the sources of PAHs, reducing PAHs emissions from the source is an effective way to control pollution. In this study, the sources of PAHs were resolved by using Principal Component Analysis (PCA). Source analysis of PAHs for the whole year revealed three main sources (Figure 4). The primary source is a mixed combustion source of biomass and coal. Since biomass combustion and domestic coal combustion are important sources of PAHs [83], they are widely used for cooking and heating in rural areas with relatively low combustion efficiency, making their efficient combustion would also reduce PAHs emissions in rural areas [84]. Pongpiachan et al. also found that more than half of the total PAH emissions from Asian countries, including China, came from indoor biomass combustion [85]. The research of Colbeck et al. on the rural indoor environments in Pakistan also shows that biomass combustion is a major source of indoor pollution [86]. The second source is gasoline or diesel vehicle emission source. Related studies have found that vehicle emissions have become one of the most important sources of PAHs emissions in the environment [87,88]. Diesel vehicles are not very common in urban transportation, but in the rural areas of Northeast China, they have become an essential tool for farming and autumn harvest. Diesel vehicle exhaust contributes significantly to rural environmental pollution, and diesel vehicles exhaust contains high levels of PAHs and unsaturated fatty acids, which indirectly influence indoor concentration changes [89,90,91]. Finally, low-ring PAHs are also found as one of the main components, and low-ring PAHs would normally be considered as domestic waste combustion emissions [92]. In rural areas of China, an effective disposal system applicable to domestic wastes and wastes, etc., has not been established, and only about 30% of solid wastes are treated in an environmentally harmless manner [93,94]. Farmers usually burn the generated household waste mixed with biomass fuel during heating, producing particulate matter and PAHs that can have a negative impact on human health [95,96]. The main sources of PAHs in the non-heating period are domestic waste combustion and motor vehicle exhaust emissions. From the principal component results for the heating period, it was found that it was consistent with the principal component results of PAHs throughout the year, indicating that the emissions from the heating period directly affect the annual emissions, so the control of the heating period is crucial for the whole year.
The carcinogenic risk to adults and children from indoor PAHs in rural Northeast China was further explored and evaluated by calculating from Equations (2)–(5) (Figure 6). Rural indoor PAHs were found to be a carcinogenic risk for both adults and children at different times of life. Adults ingest mainly through both respiratory and dermal routes, while children ingest mainly through hand-to-mouth. Comparisons of respiratory pathway intake found that adults > children, which correlated with higher respiratory and metabolic rates in adults. DahA, IcdP, and BaP (all high ring) posed the highest carcinogenic risk to the population under all three exposure routes. The study of indoor PAHs in the Guanzhong Basin by Li et al. showed that predominantly medium-ring PAHs were mainly exposed, which is different from the predominantly high-ring exposure in this study, which was probably due to the different energy types and usage patterns from those in the Northeast [43]. Among the 16 PAHs indoors in rural Northeast China, three PAHs, DahA, IcdP and BaP, need to be controlled with emphasis. BaP is a class I carcinogen, and special attention should be paid to its protection.

5. Conclusions

Through the one-year monitoring and testing of indoor PAHs in rural Northeast China, the pollution characteristics, source analysis, and health risks of indoor PAHs to different populations are analyzed. According to the measured analysis and calculations, the following main conclusions are drawn.
The PAHs in this study showed a U-shaped distribution throughout the year, and the highest concentrations of indoor PAHs were reached during the heating period, especially during the Spring Festival, when the PAHs were influenced by a combination of indoor and outdoor factors. Compared with other regions, winter heating was found to be a significant factor in increasing PAHs. Indoor PAHs were mainly influenced by local sources, with less contribution from long-range transport through atmospheric dispersion. Using Principal Component Analysis showed that the main sources were mixed biomass and coal combustion sources, automobile and diesel vehicle emission sources, and domestic waste combustion sources. The mixed combustion sources of biomass and coal are the main sources of pollution only during the heating period. Pollution from motor vehicle exhaust is persistent. Rural indoor PAHs pose a carcinogenic risk to both adults and children at different times of life. The order of carcinogenic exposure routes was dermal-contact pathways > ingestion pathways > inhalation pathways for adults and ingestion pathways > dermal-contact pathways > inhalation pathways for children, which was mainly caused by three types of highly cyclic PAH, DahA, IcdP, and BaP through hand–oral and dermal ingestion.
This study fills the gap in the study of rural indoor PAHs pollution in Northeast China, but this study has some limitations. Firstly, this study only monitored and sampled bedrooms in real time, and it did not arrange sampling points for kitchens. Although personnel do not spend much time in the kitchen, many sources of PAHs occur in the kitchen, such as burning straw, cooking, etc. Secondly, in recent years, there has been an upward trend in the number of households removing pots and pans indoors to install small boilers, using coal for winter heating. The pollution characteristics of PAHs caused by coal combustion are very different from those caused by straw combustion. Finally, there is variability in the use of energy fuels in rural Northeast China. Although the use of straw as a domestic fuel is relatively high in rural areas of the northeast, there are various types of straw, such as corn straw, rice straw, and sorghum straw. Depending on the type of straw, the PAHs content of the individual monomers produced after combustion may also vary, causing different pollution and health hazards to humans. In addition to the use of straw resources, wood burning and electric heating are also used, and differences in energy use can lead to differences in PAHs pollution characteristics. However, this study puts forward the characteristics of indoor PAHs pollution and health hazards to humans caused using straw in rural Northeast China as a whole, which is still universal and has guiding significance for improving indoor air quality in rural Northeast China. In the next step, a detailed study of the above aspects to provide a scientific basis for creating a healthy and sustainable living environment indoors in rural areas will be conducted.

6. Suggestions

The Chinese government has taken environment protection and the reduction of carbon emissions as a national development strategy, and it has issued several policies to actively encourage the diversified application of straw. Burning straw in the fields is strictly prohibited to protect the atmosphere. In the face of the pollution problem of PAHs in indoor air in Northeast China, we should respond to the national call to reduce pollutant emissions at the source.
1. Strengthen the resource utilization of straw. Turn straw resources into treasure and promote straw diversification. Straw is mixed and burned in proportion to reduce the cost of power generation. Straw organic fertilizer replaces chemical fertilizer. Return straw to the field to realize the perpetual use of soil resources.
2. Improve farmers’ awareness and motivation. While implementing the policy, farmers should enhance their knowledge and ideas on resource utilization, strengthen the burn ban ordinance, and establish a complete recycling mechanism.
3. Reduce motor vehicle exhaust emissions. Farmers have independent yards. New energy charging piles can be established, and their use is not limited by location and time. Using diesel farm vehicles is unavoidable. The widespread establishment of agricultural cooperatives and centralized use of large equipment can reduce diesel combustion emissions.
4. Establish a complete domestic waste disposal system. Separate garbage bins are placed at the entrance of the courtyard, and garbage collection points are established at fixed locations. Daily centralized disposal for destruction can effectively reduce indoor pollution caused by garbage incineration.
We hope that through the guidance of government policies, the popularization of scientific knowledge of environmental protection, and the application of scientific and technological innovations, the vast majority of rural air pollution control and clean energy use in China will develop in a sustainable direction.

Author Contributions

Conceptualization, L.B. and C.L.; methodology, C.L.; formal analysis, C.L.; investigation, C.L.; resources, L.B.; data curation, C.L.; writing—original draft preparation, C.L.; writing—review and editing, L.B.; visualization, C.L.; supervision, L.B.; project administration, L.B.; funding acquisition, L.B. All authors have read and agreed to the published version of the manuscript.

Funding

This research was funded by the National Natural Science Foundation of China (51508224) and National Key Research and Development Program of China (2017YFC0702700).

Institutional Review Board Statement

Not applicable.

Informed Consent Statement

Informed consent was obtained from all subjects involved in the study.

Data Availability Statement

Not applicable.

Acknowledgments

We are very grateful to Na Li and Mengnan Shen for their help in the chemical analysis part of this study. We are also very grateful to Wanjun Xu and Jinhua Li for providing sampling sites for this study.

Conflicts of Interest

The authors declare no conflict of interest.

References

  1. Lu, C.; Deng, Q.H.; Yu, C.W.F. Strategies for reduction of episodic risk of PM10 by controlling industrial and traffic emissions of SO2 and NO2 and meteorological parameters. Indoor Built Environ. 2015, 24, 473–488. [Google Scholar] [CrossRef]
  2. Li, C.H.; Bai, L.; He, Z.J.; Liu, X.R.; Xiu, X.L. The effect of air purifiers on the reduction in indoor PM2.5 concentrations and population health improvement. Sustain. Cities Soc. 2021, 75, 103298. [Google Scholar] [CrossRef]
  3. Zhou, Y.; Deng, Y.; Wu, P.; Cao, S. The effects of ventilation and floor heating systems on the dispersion and deposition of fine particles in an enclosed environment. Build. Environ. 2017, 125, 192–205. [Google Scholar] [CrossRef]
  4. Cao, S.J.; Kong, X.R.; Li, L.Y.; Zhang, W.R.; Ye, Z.P.; Deng, Y.L. An investigation of the PM2.5 and NO2 concentrations and their human health impacts in the metro subway system of Suzhou, China. Environ. Sci. Process. Impacts 2017, 19, 666–675. [Google Scholar] [CrossRef] [PubMed]
  5. Bai, L.; Li, C.H.; Yu, C.W.; He, Z.J. Air pollution and health risk assessment in Northeastern China: A case study of Jilin Province. Indoor Built Environ. 2021, 30, 1857–1874. [Google Scholar] [CrossRef]
  6. Blazy, R. Living Environment Quality Determinants, Including PM2.5 and PM10 Dust Pollution in the Context of Spatial Issues—The Case of Radzionków. Buildings 2020, 10, 58. [Google Scholar] [CrossRef] [Green Version]
  7. Cheung, P.K.; Jim, C.Y. Indoor air quality in substandard housing in Hong Kong. Sustain. Cities Soc. 2019, 48, 101583. [Google Scholar] [CrossRef]
  8. Kim, A.; Medal, L.; Wang, S.; Larson, T. Indoor and Outdoor Concentrations of Particulate Matter in an Airport Terminal Building: A Pilot Study at Soekarno-Hatta International Airport in Indonesia. Buildings 2020, 10, 25. [Google Scholar] [CrossRef] [Green Version]
  9. Meng, M.; Cao, S.; Kumar, P.; Tang, X.; Feng, Z. Spatial distribution characteristics of PM2.5 concentration around residential buildings in urban traffic-intensive areas: From the perspectives of health and safety. Saf. Sci. 2021, 141, 105318. [Google Scholar] [CrossRef]
  10. Ejohwomu, O.A.; Shamsideen Oshodi, O.; Oladokun, M.; Bukoye, O.T.; Emekwuru, N.; Sotunbo, A.; Adenuga, O. Modelling and Forecasting Temporal PM2.5 Concentration Using Ensemble Machine Learning Methods. Buildings 2022, 12, 46. [Google Scholar] [CrossRef]
  11. Ścibor, M.; Balcerzak, B.; Galbarczyk, A.; Targosz, N.; Jasienska, G. Are we safe inside? Indoor air quality in relation to outdoor concentration of PM10 and PM2.5 and to characteristics of homes. Sustain. Cities Soc. 2019, 48, 101537. [Google Scholar] [CrossRef]
  12. Li, N.; Liu, Z.; Li, Y.P.; Li, N.; Chartier, R.; Mcwilliams, A.; Chang, J.R.; Wang, Q.; Wu, Y.X.; Xu, C.Y.; et al. Estimation of PM2.5 infiltration factors and personal exposure factors in two megacities, China. Build. Environ. 2018, 149, 297–304. [Google Scholar] [CrossRef]
  13. Fang, D.; Wang, Q.G.; Li, H.M.; Yu, Y.Y.; Lu, Y.; Qian, X. Mortality effects assessment of ambient PM2.5 pollution in the 74 leading cities of China. Sci. Total Environ. 2016, 569–570, 1545–1552. [Google Scholar] [CrossRef]
  14. Bai, L.; He, Z.J.; Ni, S.Y.; Chen, W.Y.; Li, N.; Sun, S.Y. Investigation of PM2.5 absorbed with heavy metal elements, source apportionment and their health impacts in residential houses in the North-east region of China. Sustain. Cities Soc. 2019, 51, 101690. [Google Scholar] [CrossRef]
  15. Mumford, J.L.; He, X.Z.; Chapman, R.S.; Cao, S.R.; Harris, D.B.; Li, X.M.; Xian, Y.L.; Jiang, W.Z.; Xu, C.W.; Chuang, J.C.; et al. Lung cancer and indoor air pollution in Xuan Wei, China. Science 1987, 235, 217–220. [Google Scholar] [CrossRef] [PubMed]
  16. Allen, J.O.; Dookeran, N.M.; Smith, K.A.; Sarofim, A.F.; Taghizadeh, K.; Lafleur, A.L. Measurement of Polycyclic Aromatic Hydrocarbons Associated with Size-Segregated Atmospheric Aerosols in Massachusetts. Environ. Sci. Technol. 1996, 30, 1023–1031. [Google Scholar] [CrossRef]
  17. Rostamia, R.; Zarei, A.; Saranjamc, B.; Ghaffari, H.R.; Hazratic, S.; Poureshg, Y.; Fazlzadeh, M. Exposure and risk assessment of PAHs in indoor air of waterpipe cafés in Ardebil, Iran. Build. Environ. 2019, 155, 47–57. [Google Scholar] [CrossRef]
  18. Liu, Y.; Qin, N.; Liang, W.; Chen, X.; Hou, R.; Kang, Y.; Guo, Q.; Cao, S.; Duan, X. Polycycl. Aromatic Hydrocarbon Exposure of Children in Typical Household Coal Combustion Environments: Seasonal Variations, Sources, and Carcinogenic Risks. Int. J. Environ. Res. Public Health 2020, 17, 6520. [Google Scholar] [CrossRef]
  19. Tadsanaprasittipol, A.; Tonrub, P.; Beverland, I.J.; Kalin, R.M. Characterization of PM10-Bound Polycyclic Aromatic Hydrocarbons and Associated Carcinogenic Risk in Bangkok, Thailand. Appl. Sci. 2021, 11, 4501. [Google Scholar] [CrossRef]
  20. Jeng, H.A.; Pan, C.H.; Lin, W.Y.; Wu, M.T.; Taylor, S.; Chang-Chien, G.P.; Zhou, G.; Diawara, N. Biomonitoring of polycyclic aromatic hydrocarbons from coke oven emissions and reproductive toxicity in nonsmoking workers. J. Hazard. Mater. 2013, 244–245, 436–443. [Google Scholar] [CrossRef]
  21. Lwegbue, C.M.A.; Tesi, G.O.; Overah, L.C.; Emoyan, O.O.; Nwajei, G.E.; Martincigh, B.S. Effects of Flooding on the Sources, Spatiotemporal Characteristics and Human Health Risks of Polycyclic Aromatic Hydrocarbons in Floodplain Soils of the Lower Parts of the River Niger, Nigeria. Polycycl. Aromat. Compd. 2017, 40, 228–244. [Google Scholar] [CrossRef]
  22. Villar-Vidal, M.; Lertxundi, A.; Dicastillo, M.D.M.L.D.; Alvarez, J.I.; Marina, L.S.; Ayerdi, M.; Basterrechea, M.; Ibarluzea, J. Air Polycyclic Aromatic Hydrocarbons (PAHs) associated with PM2.5 in a North Cantabric coast urban environment. Chemosphere 2014, 99, 233–238. [Google Scholar] [CrossRef] [PubMed]
  23. Hazarika, N.; Srivastava, A.; Das, A. Quantification of particle bound metallic load and PAHs in urban environment of Delhi, India: Source and toxicity assessment. Sustain. Cities Soc. 2017, 29, 58–67. [Google Scholar] [CrossRef]
  24. Chinese National Bureau of Statistics. Bulletin of the Seventh National Population Census (No. 7). 2021. Available online: https://www.stats.gov.cn/ztjc/zdtjgz/zgrkpc/dqcrkpc/ggl/202105/t20210519_1817700.html (accessed on 15 December 2021).
  25. Chinese Ministry of Housing and Urban-Rural Development. National Conference on Housing and Urban-Rural Development. 2020. Available online: https://www.mohurd.gov.cn/jsbfld/202012/t20201221_248547.html (accessed on 18 December 2021).
  26. Huang, Y.; Du, W.; Chen, Y.C.; Shen, G.F.; Su, S.; Lin, N.; Shen, H.Z.; Zhu, D.; Yuan, C.Y.; Duan, Y.H.; et al. Household air pollution and personal inhalation exposure to particles (TSP/PM2.5/PM1.0/PM0.25) in rural Shanxi, North China. Environ. Pollut. 2017, 231, 635–643. [Google Scholar] [CrossRef] [PubMed]
  27. Du, W.; Wang, J.Z.; Zhang, S.S.; Fu, N.; Yang, F.Q.; Wang, G.H.; Wang, Z.L.; Mao, K.; Shen, G.F.; Qi, M.; et al. Impacts of Chinese Spring Festival on Household PM2.5 Pollution and Blood Pressure of Rural Residents. Indoor Air 2021, 31, 1072–1083. [Google Scholar] [CrossRef]
  28. Feng, Z.B.; Zhou, X.Q.; Xu, S.H.; Ding, J.W.; Cao, S.J. Impacts of humidification process on indoor thermal comfort and air quality using portable ultrasonic humidifier. Build. Environ. 2018, 133, 62–72. [Google Scholar] [CrossRef]
  29. Stasiulaitiene, I.; Krugly, E.; Prasauskas, T.; Ciuzas, D.; Kliucininkas, L.; Kauneliene, V.; Martuzevicius, D. Infiltration of outdoor combustion-generated pollutants to indoors due to various ventilation regimes: A case of a single-family energy efficient building. Build. Environ. 2019, 157, 235–241. [Google Scholar] [CrossRef]
  30. Bai, L.; He, Z.J.; Li, C.H.; Chen, Z. Investigation of yearly indoor/outdoor PM2.5 levels in the perspectives of health impacts and air pollution control: Case study in Changchun, in the northeast of China. Sustain. Cities Soc. 2020, 53, 101871. [Google Scholar] [CrossRef]
  31. Zhang, Y.X.; Tao, S.; Cao, J., Jr.; Coveney, R.M. Emission of Polycyclic Aromatic Hydrocarbons in China by County. Environ. Sci. Technol. 2007, 41, 683–687. [Google Scholar] [CrossRef]
  32. Shen, H.Z.; Huang, Y.; Wang, R.; Zhu, D.; Li, W.; Shen, G.F.; Wang, B.; Zhang, Y.Y.; Chen, Y.C.; Lu, Y.; et al. Global atmospheric emissions of polycyclic aromatic hydrocarbons from 1960 to 2008 and future predictions. Environ. Sci. Technol. 2013, 47, 6415–6424. [Google Scholar] [CrossRef] [Green Version]
  33. Duan, X.; Wang, B.; Zhao, X.; Shen, G.; Xia, Z.; Huang, N.; Jiang, Q.; Lu, B.; Xu, D.; Fang, J.; et al. Personal inhalation exposure to polycyclic aromatic hydrocarbons in urban and rural residents in a typical northern city in China. Indoor Air 2014, 24, 464–473. [Google Scholar] [CrossRef] [PubMed]
  34. Li, W.; Wang, C.; Wang, H.; Chen, J.Q.J.; Chen, J.W.; Shen, H.Z.; Shen, G.F.; Huang, Y.; Wang, R.; Wang, B.; et al. Atmospheric polycyclic aromatic hydrocarbons in rural and urban areas of northern China. Environ. Pollut. 2014, 192, 83–90. [Google Scholar] [CrossRef]
  35. GB/T18883-2002; The Indoor Air Quality Standard. China Standard Press: Beijing, China, 2002. (In Chinese)
  36. Ding, J.; Zhong, J.; Yang, Y.; Li, B.; Shen, G.; Su, Y.; Wang, C.; Li, W.; Shen, H.; Wang, B.; et al. Occurrence and exposure to polycyclic aromatic hydrocarbons and their derivatives in a rural Chinese home through biomass fuelled cooking. Environ. Pollut. 2012, 169, 160–166. [Google Scholar] [CrossRef] [Green Version]
  37. Lin, N.; Chen, Y.C.; Du, W.; Shen, G.F.; Zhu, X.; Huang, T.B.; Wang, X.L.; Cheng, H.F.; Liu, J.F.; Xue, C.Y.; et al. Inhalation exposure and risk of polycyclic aromatic hydrocarbons (PAHs) among the rural population adopting wood gasifier stoves compared to different fuel-stove users. Atmos. Environ. 2016, 147, 485–491. [Google Scholar] [CrossRef]
  38. Wu, F.; Liu, X.; Wang, W.; Man, Y.B.; Chan, C.Y.; Liu, W.; Tao, S.; Wong, M.H. Characterization of particulate-bound PAHs in rural households using different types of domestic energy in Henan Province, China. Sci. Total Environ. 2015, 536, 840–846. [Google Scholar] [CrossRef] [PubMed]
  39. Fu, N.; Lv, S.J.; Xue, G.Y.; Li, D.P.; Zhou, B.H.; Chen, Y.S.; Du, W. Polycyclic Aromatic Hydrocarbons Pollution and Health Risks Associated with Solid Fuel Use in Rural Areas. Asian J. Ecotoxicol. 2020, 15, 123–133. [Google Scholar]
  40. Shen, G.F.; Zhang, Y.Y.; Wei, S.Y.; Chen, Y.C.; Yang, C.L.; Lin, P.C.; Xie, H.; Xue, M.; Wang, X.L.; Tao, S. Indoor/outdoor pollution level and personal inhalation exposure of polycyclic aromatic hydrocarbons through biomass fuelled cooking. Air Qual. Atmos. Health 2014, 7, 449–458. [Google Scholar] [CrossRef]
  41. Wu, C.W.; Lin, S.; Sun, J.J.; Li, M.L.; Zhou, X.; Cheng, C. Emission characteristics of polyaromatic hydrocarbon in PM2.5 from indoor combustion of biomass fuels. Hubei Agric. Sci. 2018, 58, 87–91. [Google Scholar]
  42. He, K.L.; Xu, H.M.; Feng, R.; Shen, Z.X.; Li, Y.Q.; Zhang, Y.; Sun, J.; Zhang, Q.; Zhang, T.; Yang, L.; et al. Characteristics of indoor and personal exposure to particulate organic compounds emitted from domestic solid fuel combustion in rural areas of northwest China. Atmos. Res. 2021, 248, 105181. [Google Scholar] [CrossRef]
  43. Li, Y.Q.; Xu, H.M.; Wang, J.H.; Ho, S.S.H.; He, K.L.; Shen, Z.X.; Ning, Z.; Sun, J.; Li, L.J.; Lei, R.H.; et al. Personal exposure to PM2.5 -bound organic species from domestic solid fuel combustion in rural Guanzhong Basin, China: Characteristics and health implication. Chemosphere 2019, 227, 53–62. [Google Scholar] [CrossRef]
  44. Du, W.; Chen, Y.C.; Zhu, X.; Zhong, Q.R.; Zhou, S.J.; Liu, W.J.; Hauang, Y.; Shen, G.F.; Tao, S. Wintertime air pollution and health risk assessment of inhalation exposure to polycyclic aromatic hydrocarbons in rural China. Atmos. Environ. 2018, 191, 1–8. [Google Scholar] [CrossRef]
  45. Ma, Y.L.; Dong, Z.Q.; Wu, K.J.; Pan, J. Indoor Air Quality and Characteristics of Fine Particle for Rural Guizhou. Environ. Monit. China 2015, 31, 28–34. [Google Scholar]
  46. Huang, Z.Y.; Wu, C.C.; Bao, L.J.; Wang, X.P.; Muir, D.; Zeng, E.Y. Characteristics and potential health risk of rural Tibetans’ exposure to polycyclic aromatic hydrocarbons during summer period. Environ. Int. 2018, 118, 70–77. [Google Scholar] [CrossRef]
  47. Lu, C.G.; Gao, X.; Yu, Q.; Li, C.L.; Chen, L.M. Indoor Air Polycyclic Aromatic Hydrocarbons in Rural Tibetan Residence and the Depositions in Human Respiratory Tract. J. Fudan Univ. (Nat. Sci.) 2006, 45, 714–718, 725. [Google Scholar]
  48. Yang, Y.M.; Zhao, H.C.; Meng, R.; He, L.S.; Zhao, H.; Du, S.L.; Ding, T.T. Sources and Ecological Risk Assessment of Polycyclic Aromatic Hydrocarbons in the Jiaxing River Network. Environ. Sci. 2020, 41, 4989–4998. [Google Scholar]
  49. Li, A.; Gao, X.; Yang, L. Field measurements, assessments and improvement of Kang: Case study in rural northwest China. Energy Build. 2016, 111, 497–506. [Google Scholar] [CrossRef]
  50. Yongji County People’s Government. Yongji County 2019 National Economic and Social Development Statistical Bulletin. 2020. Available online: http://www.jlyj.gov.cn/xxgk/tjxx/202012/t20201203_909496.html (accessed on 18 December 2021).
  51. HJ 646-2013; Ambient Air and Stationary Source Emissions—Determination of Gas and Particle-Phase Polycyclic Aromatic Hydrocarbons with Gas Chromatography/Mass Spectrometry. China Environmental Science Press: Beijing, China, 2013. (In Chinese)
  52. Bai, L.; Chen, W.Y.; He, Z.J.; Sun, S.Y.; Qin, J. Pollution characteristics, sources and health risk assessment of polycyclic aromatic hydrocarbons in PM2.5 in an office building in northern areas, China. Sustain. Cities Soc. 2020, 53, 101891. [Google Scholar] [CrossRef]
  53. Khanal, R.; Furumai, H.; Nakajima, F. Toxicity assessment of size-fractionated urban road dust using ostracod Heterocypris incongruens direct contact test. J. Hazard. Mater. 2014, 264, 53–64. [Google Scholar] [CrossRef]
  54. Wang, W.; Wang, Q.; Nakajima, D.; Lu, S.; Xiao, K.; Chowdhury, T.; Suzuki, M.; Liu, F. Industrial Source Contributions and Health Risk Assessment of Fine Particle-Bound Polycyclic Aromatic Hydrocarbons (PAHs) during Spring and Late Summer in the Baoshan Area, Shanghai. Processes 2021, 9, 2016. [Google Scholar] [CrossRef]
  55. Hua, Y.; Wang, S.X.; Jiang, J.K.; Zhou, W.; Xu, Q.C.; Li, X.X.; Liu, B.X.; Zhang, D.W.; Zheng, M. Characteristics and sources of aerosol pollution at a polluted rural site southwest in Beijing, China. Sci. Total Environ. 2018, 626, 519–527. [Google Scholar] [CrossRef]
  56. Iakovides, M.; Stephanou, E.G.; Apostolaki, M.; Hadjicharalambous, M.; Evans, J.S.; Koutrakis, P.; Achilleos, S. Study of the occurrence of airborne Polycyclic Aromatic Hydrocarbons associated with respirable particles in two coastal cities at Eastern Mediterranean: Levels, source apportionment, and potential risk for human health. Atmos. Environ. 2019, 213, 170–184. [Google Scholar] [CrossRef]
  57. Ali, N.; Ismail, I.M.I.; Khoder, M.; Shamy, M.; Alghamdi, M.; Khalaf, A.A.; Costa, M. Polycyclic aromatic hydrocarbons (PAHs) in the settled dust of automobile workshops, health and carcinogenic risk evaluation. Sci. Total Environ. 2017, 601–602, 478–484. [Google Scholar] [CrossRef] [PubMed]
  58. U.S. EPA. Supplemental Guidance for developing Soil Screening Levels for Superfund Sites. OSWER9355.4-24, U.S. Environmental Protection Agency, Washington DC. 2002. Available online: http://www.epa.gov/superfund/health/conmedia/soil/toc.html (accessed on 20 December 2021).
  59. Wei, W.; Huang, M.J.; Yuan, K.; Wang, H.S.; Leung, A.O.W.; Cheung, K.C.; Ming, H.W. Polycyclic aromatic hydrocarbons (PAHs) in urban surface dust of Guangzhou, China: Status, sources and human health risk assessment. Sci. Total Environ. 2011, 409, 4519–4527. [Google Scholar] [CrossRef]
  60. Stamatelopoulou, A.; Dasopoulou, M.; Bairachtari, K.; Karavoltsos, S.; Sakellari, A.; Maggos, T. Contamination and Potential Risk Assessment of Polycyclic Aromatic Hydrocarbons (PAHs) and Heavy Metals in House Settled Dust Collected from Residences of Young Children. Appl. Sci. 2021, 11, 1479. [Google Scholar] [CrossRef]
  61. Howard, I.C.; Okpara, K.E.; Techato, K. Toxicity and Risks Assessment of Polycyclic Aromatic Hydrocarbons in River Bed Sediments of an Artisanal Crude Oil Refining Area in the Niger Delta, Nigeria. Water 2021, 13, 3295. [Google Scholar] [CrossRef]
  62. Kang, Y.; Shao, D.D.; Li, N.; Yang, G.L.; Zhang, Q.Y.; Zeng, L.X.; Luo, J.W.; Zhong, W.F. Cancer risk assessment of human exposure to polycyclic aromatic hydrocarbons (PAHs) via indoor and outdoor dust based on probit model. Environ. Sci. Pollut. Res. 2015, 22, 3451–3456. [Google Scholar] [CrossRef]
  63. Dong, X.Y.; Wang, J.; Yang, Y.B.; Liu, T.; Wang, Q.; Wu, Y.X.; Fang, J.L. Characterization of ambient PM2.5 and PAHs during 2017 Spring Festival in urban and suburb areas of Beijing. Environ. Chem. 2018, 37, 2190–2198. [Google Scholar]
  64. Li, N.; Wei, X.; Zhou, Y.F.; Sun, S.Y.; Bai, L. Source Analysis and Health Risk Assessment of Polycyclic Aromatic Hydrocarbons in Atmospheric Environment PM2.5 in Changchun City. Sci. Technol. Eng. 2021, 21, 410–416. [Google Scholar]
  65. GB3095-2012; Ambient Air Quality Standards. Environmental Science Press: Beijing, China, 2012. (In Chinese)
  66. Ye, W.; Saikawa, E.; Avramov, A.; Cho, S.-H.; Chartier, R. Household air pollution and personal exposure from burning firewood and yak dung in summer in the eastern Tibetan Plateau. Environ. Pollut. 2020, 263, 114531. [Google Scholar] [CrossRef]
  67. Li, C.L.; Kang, S.C.; Chen, P.F.; Zhang, Q.G.; Fang, G.C. Characterizations of particle-bound trace metals and polycyclic aromatic hydrocarbons (PAHs) within Tibetan tents of south Tibetan Plateau, China. Environ. Sci. Pollut. Res. 2012, 19, 1620–1628. [Google Scholar] [CrossRef]
  68. Pruneda-Álvarez, L.G.; Pérez-Vázquez, F.J.; Salgado-Bustamante, M.; Martínez-Salinas, R.I.; Pelallo-Martinez, N.A.; Pérez-Maldonado, I.N. Exposure to indoor air pollutants (polycyclic aromatic hydrocarbons, toluene, benzene) in Mexican indigenous women. Indoor Air 2012, 22, 140–147. [Google Scholar] [CrossRef]
  69. World Health Organization. Indoor Air Pollution and Lower Respiratory Tract Infections in Children; World Health Organization: Geneva, Switzerland, 2007. [Google Scholar]
  70. GBD 2016 Risk Factors Collaborators. Global, Regional, and National Comparative Risk Assessment of 84 Behavioural, Environmental and Occupational, and Metabolic Risks or Clusters of Risks, 1990–2016: A Systematic Analysis for the Global Burden of Disease Study 2016. Lancet 2017, 390, 1345–1422. [Google Scholar] [CrossRef] [Green Version]
  71. Iwegbue, C.M.A.; Iteku-Atata, E.C.; Odali, E.W.; Egobueze, F.E.; Tesi, G.O.; Nwajei, G.E.; Martincigh, B.S. Distribution, Sources and Health Risks of Polycyclic Aromatic Hydrocarbons (PAHs) in Household Dusts from Rural, Semi-urban and Urban Areas in the Niger Delta, Nigeria. Expos. Health 2019, 11, 209–225. [Google Scholar] [CrossRef]
  72. Castro, D.; Slezakova, K.; Delerue-Matos, C.; Alvim-Ferraz, M.D.C.; Morais, S.; Pereira, M.D.C. Polycyclic aromatic hydrocarbons in gas and particulate phases of indoor environments influenced by tobacco smoke: Levels, phase distributions, and health risks. Atmos. Environ. 2011, 45, 1799–1808. [Google Scholar] [CrossRef] [Green Version]
  73. Saraga, D.E.; Maggos, T.E.; Sfetsos, A.; Tolis, E.I.; Andronopoulos, S.; Bartzis, J.G.; Vasilakos, C. PAHs sources contribution to the air quality of an office environment: Experimental results and receptor model (PMF) application. Air Qual. Atmos. Health 2010, 3, 225–234. [Google Scholar] [CrossRef]
  74. Alaejos, M.S.; Pino, V.; Afonso, A.M. Metabolism and toxicology of heterocyclic aromatic amines when consumed in diet: Influence of the genetic susceptibility to develop human cancer. A review. Food Res. Int. 2008, 41, 327–340. [Google Scholar] [CrossRef]
  75. Thiebaud, H.P.; Knize, M.G.; Kuzmicky, P.A.; Felton, J.S.; Hsieh, D.P. Mutagenicity and Chemical Analysis of Fumes from Cooking Meat. J. Agric. Food Chem. 1994, 42, 1502–1510. [Google Scholar] [CrossRef]
  76. Zhao, Y.J.; Chen, C.; Zhao, B. Emission characteristics of PM2.5-bound chemicals from residential Chinese cooking. Build. Environ. 2019, 149, 623–629. [Google Scholar] [CrossRef]
  77. Hu, T.P.; Mao, Y.; Liu, W.J.; Cheng, C.; Shi, M.M.; Chen, Z.L.; Tian, Q.; Zhang, J.Q.; Qi, S.H.; Xing, X.L. Fate of PM2.5-bound PAHs in Xiangyang, central China during 2018 Chinese spring festival: Influence of fireworks burning and air-mass transport. J. Environ. Sci. 2020, 97, 1–10. [Google Scholar] [CrossRef]
  78. Kong, S.F.; Li, X.X.; Li, L.; Yan, Y.; Chen, K.; Yuan, L.; Zhang, Y.J.; Shan, Y.P.; Ji, Y.Q. Variation of polycyclic aromatic hydrocarbons in atmospheric PM2.5 during winter haze period around 2014 Chinese Spring Festival at Nanjing: Insights of source changes, air mass direction and firework particle injection. Sci. Total Environ. 2015, 520, 59–72. [Google Scholar] [CrossRef]
  79. Zhang, J.; Yang, L.X.; Ledoux, F.; Courcot, D.; Mellouki, A.; Gao, Y.; Jiang, P.; Li, Y.Y.; Wang, W.X. PM2.5-bound polycyclic aromatic hydrocarbons (PAHs) and nitrated PAHs (NPAHs) in rural and suburban areas in Shandong and Henan Provinces during the 2016 Chinese New Year’s holiday. Environ. Pollut. 2019, 250, 782–791. [Google Scholar] [CrossRef] [PubMed]
  80. Li, X.X.; Kong, S.F.; Yan, Y.; Li, L.; Yuan, L.; Li, Q.; Xiao, H.; Chen, K. Polycyclic aromatic hydrocarbons (PAHs) in atmospheric PM2.5 around 2013 Asian Youth Games period in Nanjing. Atmos. Res. 2016, 174, 85–96. [Google Scholar] [CrossRef]
  81. Khairy, M.A.; Lohmann, R. Source apportionment and risk assessment of polycyclic aromatic hydrocarbons in the atmospheric environment of Alexandria, Egypt. Chemosphere 2013, 91, 895–903. [Google Scholar] [CrossRef] [Green Version]
  82. Liu, X.; Li, C.; Hong, T.; Wu, Y.; Chen, Y.; Huang, Q.; Sheng, W.; Xie, Q.; Yuan, Z.; Lu, Y. Analysis of the Effect of Meteorological Factors on PM2.5-Associated PAHs during Autumn-Winter in Urban Nanchang. Aerosol Air Qual. Res. 2016, 16, 3222–3229. [Google Scholar] [CrossRef] [Green Version]
  83. Li, X.; Wang, Z.; Guo, T. Emission of PM2.5-Bound Polycyclic Aromatic Hydrocarbons from Biomass and Coal Combustion in China. Atmosphere 2021, 12, 1129. [Google Scholar] [CrossRef]
  84. Yu, Q.Q.; Yang, W.Q.; Zhu, M.; Gao, B.; Li, S.; Li, G.H.; Fang, H.; Zhou, H.S.; Zhang, H.N.; Wu, Z.F.; et al. Ambient PM2.5-bound polycyclic aromatic hydrocarbons (PAHs) in rural Beijing: Unabated with enhanced temporary emission control during the 2014 APEC summit and largely aggravated after the start of wintertime heating. Environ. Pollut. 2018, 238, 532–542. [Google Scholar] [CrossRef] [PubMed]
  85. Pongpiachan, S.; Tipmanee, D.; Khumsup, C.; Kittikoon, I.; Hirunyatrakul, P. Assessing risks to adults and preschool children posed by PM2.5-bound polycyclic aromatic hydrocarbons (PAHs) during a biomass burning episode in Northern Thailand. Sci. Total Environ. 2015, 508, 435–444. [Google Scholar] [CrossRef]
  86. Colbeck, I.; Nasir, Z.A.; Ali, Z. Characteristics of indoor/outdoor particulate pollution in urban and rural residential environment of Pakistan. Indoor Air 2010, 20, 45–51. [Google Scholar] [CrossRef]
  87. Wang, Q.; Liu, M.; Yu, Y.P.; Li, Y. Characterization and source apportionment of PM2.5-bound polycyclic aromatic hydrocarbons from Shanghai city, China. Environ. Pollut. 2016, 218, 118–128. [Google Scholar] [CrossRef]
  88. Zhang, Y.J.; Lin, Y.; Cai, J.; Liu, Y.; Hong, L.N.; Qin, M.M.; Zhao, Y.F.; Ma, J.; Wang, X.S.; Zhu, T.; et al. Atmospheric PAHs in North China: Spatial distribution and sources. Sci. Total Environ. 2016, 565, 994–1000. [Google Scholar] [CrossRef]
  89. Cao, X.Y.; Hao, X.W.; Shen, X.B.; Jiang, X.; Wu, B.B.; Yao, Z.L. Emission characteristics of polycyclic aromatic hydrocarbons and nitro-polycyclic aromatic hydrocarbons from diesel trucks based on on-road measurements. Atmos. Environ. 2017, 148, 190–196. [Google Scholar] [CrossRef] [Green Version]
  90. Inomata, S.; Fushimi, A.; Sato, K.; Yamada, H. 4-Nitrophenol, 1-nitropyrene, and 9-nitroanthracene emissions in exhaust particles from diesel vehicles with different exhaust gas treatments. Atmos. Environ. 2015, 110, 93–102. [Google Scholar] [CrossRef]
  91. Zhao, T.; Yang, L.X.; Huang, Q.; Zhang, W.; Duan, S.F.; Gao, H.L.; Wang, W.X. PM2.5-bound polycyclic aromatic hydrocarbons (PAHs) and nitrated-PAHs (NPAHs) emitted by gasoline vehicles: Characterization and health risk assessment. Sci. Total Environ. 2020, 727, 138631. [Google Scholar] [CrossRef] [PubMed]
  92. Yang, H.Y.; Yue, B.; Yan, Z.Y.; Wu, X.H.; Wu, H.X.; Gao, H. Emission characteristics of polycyclic aromatic hydrocarbons (PAHs) during rural solid waste (RSW) and straw mixed burning. Acta Sci. Circumstantiae 2019, 39, 1626–1632. [Google Scholar]
  93. Ma, J.W.; Gao, C.; Yan, H.X.; Li, Y.Q.; Chen, J.J.; Zhao, Y.; Xia, X.H. Characteristics, sources, and in situ phytoremediation of polycyclic aromatic hydrocarbon in rural dumpsites. J. Soil Sediment. 2019, 19, 3945–3953. [Google Scholar] [CrossRef]
  94. Zeng, C.; Niu, D.J.; Zhao, Y.C. A comprehensive overview of rural solid waste management in China. Front. Environ. Sci. Eng. 2015, 9, 949–961. [Google Scholar] [CrossRef]
  95. Laden, F.; Neas, L.M.; Dockery, D.W.; Schwartz, J. Association of fine particulate matter from different sources with daily mortality in six U.S. Cities. Environ. Health Persp. 2000, 108, 941–947. [Google Scholar] [CrossRef]
  96. Sarti, E.; Pasti, L.; Scaroni, L.; Casali, P.; Cavazzini, A.; Rossi, M. Determination of n-alkanes, PAHs and nitro-PAHs in PM2.5 and PM1 sampled in the surroundings of a municipal waste incinerator. Atmos. Environ. 2017, 149, 12–23. [Google Scholar] [CrossRef]
Figure 1. Flow frame diagram in this study.
Buildings 12 00153 g001
Figure 2. Sampling locations, monitoring setup points, fuel combustion locations, and Kang.
Buildings 12 00153 g002
Figure 3. PAHs time distribution: (a) PAHs month distribution; (b) Monomeric PAH annual average concentration in total year; (c) Monomeric PAH annual average concentration in heating season; (d) Monomeric PAH annual average concentration in the non-heating season.
Buildings 12 00153 g003
Figure 4. Principal component analysis results: (a) PCA results for PAHs in Total year; (b) PCA results for PAHs in heating season; (c) PCA results for PAHs in non-heating season.
Buildings 12 00153 g004
Figure 5. TEQ of PAHs: (a) TEQs of every month; (b) Total year; (c) Heating season; (d) Non-heating season.
Buildings 12 00153 g005
Figure 6. Carcinogenic risk in different populations: (a) Carcinogenic risk of adult; (b) Carcinogenic risk of child; (c) Oral and hand ingestion; (d) Respiratory intake; (e) Skin intake.
Buildings 12 00153 g006aBuildings 12 00153 g006b
Table 1. 16 PAHs classification and carcinogenicity.
NameRingCategoryCarcinogenicity *
Naphthalene (Nap)2Low Ring (LR)2B
Acenaphthene (Ace)33
Acenaphthylene (Acy)3-
Anthracene (Ant)33
Fluorene (Flu)33
Phenanthrene (Phe)33
Benzo[a]anthracene (BaA)4Middle Ring (MR)2B
Chrysene (Chr)42B
Fluoranthene (Fla)43
Pyrene (Pyr)43
Benzo[a]pyrene (BaP)5High Ring (HR)1
Benzo[b]fluoranthene (BbF)52B
Benzo[k]fluoranthene (BkF)52B
Dibenzo[a,h]anthracene (DahA)52B
Benzo[ghi]perylene (BghiP)63
Indeno[1,2,3-cd]pyrene (IcdP)62A
* Carcinogenicity: 1 is a carcinogen. 2A is a likely carcinogen. 2B is a possible carcinogen. 3 is a substance that is not yet known to cause cancer in humans. (1, 2A, 2B, and 3 were classified into the carcinogenicity groups by the International Agency for Research on Cancer, IARC).
Table 2. TEF for monomer PAH.
Monomer PAHTEFMonomer PAHTEF
Nap0.001Fla0.001
Ace0.001Pyr0.001
Acy0.001BaP1
Ant0.01BbF0.1
Flu0.001BkF0.1
Phe0.001DahA1
BaA0.1BghiP0.01
Chr0.01IcdP0.1
Table 3. Parameter meaning and value.
SymbolUnitMeaningsChildAdultReference
CSFing(kg·d)/mgCarcinogenic slope coefficient of oral and hand ingestion7.3[57]
CSFinh(kg·d)/mgCarcinogenic slope coefficient of respiratory intake3.85[57]
CSFder(kg·d)/mgCarcinogenic slope coefficient of skin intake25[57]
EFd/aExposure frequency350[58]
EDaExposure duration624[58]
ATdAverage exposure time25,550[59]
IRingmg/dDust ingestion rate (IRingestion)200100[60]
IRinhm3/dInhalation rate (IRinhalation)520[14]
BWkgBody weight1662[14]
PEFm3/kgParticle emission factor1.32 × 109[61]
SAcm2Dermal exposure area16004350[58]
SLmg/(cm2·d)Skin adhesion0.20.07[62]
ABS-Dermal adsorption fraction0.13[62]
Table 4. The ratio of rings assigned to PAHs.
TimeLRMRHR
2 Rings3 Rings4 Rings5 Rings6 Rings
Total year20.28%43.26%36.46%
0.72%19.56%43.26%20.00%16.46%
Heating season19.74%38.16%42.10%
0.59%19.15%38.16%18.73%23.37%
Non-heating season20.63%46.67%32.70%
0.82%19.81%46.67%20.86%11.84%
Table 5. Ratio of three carcinogenic ways.
TimePopulationILCRingILCRinhILCRder
Total yearAdult42.450%0.003%57.547%
Child58.400%0.001%41.599%
Heating seasonAdult42.449%0.003%57.548%
Child58.398%0.001%41.601%
Non-heating seasonAdult42.448%0.003%57.549%
Child58.401%0.001%41.598%
Table 6. Comparison with indoor PAHs concentrations in rural areas in different regions.
LocationRegionTimeTypes *Concentrations
(ng/m3)
FuelsReferences
HubeiCentral ChinaHp (Winter)15922 ± 731Coal, Wood[37]
HenanHp (Winter)16762.5 ± 931.2Coal, LPG, Electricity[38]
HenanHp (Autumn)16150 ± 105Coal[38]
HebeiNorth ChinaHp (Winter)227500 ± 4100Biomass + LPG[36]
HebeiNp (Summer)22980 ± 110LPG[36]
ShanxiHp (Winter)16219.1 ± 192.9Coal[39]
JiangsuEast
China
Np (Autumn)15546 ± 95Biomass[40]
ZhejiangHp (Winter)15204.11Biomass[41]
ShanxiNorthwest ChinaHp (Winter)19211 ± 120Solid fuels[43]
ShanxiHp (Winter)19104 ± 132Coal + Straw[42]
SichuanSouthwest ChinaHp (Winter)16133.1 ± 107.3Biomass[39]
GuizhouHp (Winter)16125–1641Wood[44]
GuizhouHp (Winter)1632.64Coal[45]
XizangNp (Summer)162750 ± 2400Cow dung[46]
XizangHp (Winter)13538Biomass[47]
This studyNortheast ChinaHp16465.1Biomass + LPG + Electricity
This studyNp16350.5LPG + Electricity
This studyTotal year16815.6Biomass + LPG + Electricity
* HP: Heating period; NP: Non-heating period.
Publisher’s Note: MDPI stays neutral with regard to jurisdictional claims in published maps and institutional affiliations.

