Article

Life-Cycle Assessment of Sculptured Tiles for Building Envelopes in Mediterranean Climate

1
Department of Civil Engineering, Ariel University, Ariel 40700, Israel
2
Faculty of Architecture and Town Planning, Technion Israel Institute of Technology, Haifa 3200003, Israel
*
Author to whom correspondence should be addressed.
Buildings 2022, 12(2), 165; https://doi.org/10.3390/buildings12020165
Submission received: 13 January 2022 / Revised: 29 January 2022 / Accepted: 31 January 2022 / Published: 2 February 2022

Abstract

:
Life-cycle assessments (LCAs) were conducted to evaluate sculptured cement mortar tiles, proposed by Hershcovich et al. (2021), and conventional cement mortar flat tiles for thermal insulation of a typical residential building in Mediterranean climate. The production (P) and operational energy (OE) stages were compared between the sculptured tiles and the conventional flat tiles. The P stage used Portland cement with 95% clinker (CEM I) and Portland limestone cement with 65% clinker (CEM II). The OE stage used 31% coal, 56% natural gas, and 13% photovoltaic (PV) (adopted in 2020) and 8% coal, 57% natural gas, and 35% PV (planned for 2025). The ReCiPe2016 single-score method was used to assess environmental damage over short (20 years), long (100 years), and infinite (1000 years) time horizons of living pollutants. The results show that the use of sculptured tiles caused environmental damage in the short time horizon and environmental benefits in the long and infinite time horizons in the 2020 scenario, while it led to environmental benefits only in the infinite time horizon in the 2025 scenario.

1. Introduction

Buildings alone account for about 40% of the world’s energy consumption [1]. This large amount of energy consumption can be significantly reduced with proper insulation of the building’s envelope. For example, Sbrogiò et al. [2] and Al-Saqqaf et al. [3] used typical energy-saving technologies (e.g., cladding all exterior walls with mineral wool, insulating panels for floor slabs, double walls with polystyrene insulation, installation of a green roof and double low-E glass) to reduce energy consumption in heating and cooling old or heritage buildings. In both cases, the authors reported a significant energy-saving effect for the operational energy (OE) stage. However, the use of these energy-saving technologies is associated with the production of additional materials (production (P) stage), which in turn increases environmental damage. Therefore, to understand the impact of energy-efficient building technologies on the environment, at least the OE and P stages must be evaluated in parallel.
In this context, life-cycle energy assessment (LCEA) and life-cycle assessment (LCA) are typically considered as appropriate methods to measure the P and OE environmental consequences of insulation technology [4]. Both LCEA and LCA of a building include production and construction, operational energy and material replacement, and demolition and disposal stages. According to the literature, P and OE stages have the greatest impact on LCEA and LCA, while construction, demolition, and disposal are considered minor [5].
In addition, the P and OE stages are strongly influenced by: (i) local climate, (ii) construction technology, and (iii) the main fuel source for the OE production [5]. There is currently a limited amount of research analyzing LCEA or LCA of insulation technologies for buildings in the Mediterranean in general and specifically in Israel. Huberman and Pearlmutter [6] studied the wall insulation technology applied to the student dormitory complex of Ben-Gurion University, in the arid Negev region. The authors compared the LCEA of the suggested lightweight fly ash and soil-based blocks with that of standard concrete walls insulated with polystyrene layers. Based on the assessment of energy consumption and CO2 production, it was concluded that energy production decreased by 30%, and as a result, the LCEA value decreased by 16% [6]. As was noticed, the environmental impact of the OE stage is highly dependent on the primary fuel source used in power generation [5]. However, this effect was not investigated by Huberman and Pearlmutter [6].
Huberman et al. [7] analyzed changes in roof geometry, as the insulation technology suggested for low-rise residential buildings located in the arid Negev region. The authors compared the LCEA (P and OE stages) between vaulted roofs and conventional flat roofs. Vaulted roof technologies were considered by applying different configurations of segmental and parabolic vault forms. It was reported that vaulted roofs decreased the LCEA value by approximately 25% [7]. However, Huberman et al. [7] reported their P and OE results in GJ/m2 without consideration of the primary fuel source.
While LCEA results can serve as a reliable benchmarking indicator for building technologies, LCA estimates a wider range of environmental impacts in both the P and OE stages. Moreover, the fractions of these two stages can be quite different when using different fuel sources (fossil or renewable) for the OE stage [5].
In this respect, Pushkar and Verbitsky [8] analyzed wall insulation technology for residential buildings located in the hot Mediterranean climate of Tel Aviv, the arid climate of Beer Sheva, the mild Mediterranean climate of Jerusalem, and the desert climate of Eilat. The OE of buildings was supported by two fuel-based hypothetical scenarios: 100% natural gas (fossil source) or 100% photovoltaic (PV) (renewable source). The authors used LCA to compare autoclaved aerated blocks with standard concrete walls insulated with polystyrene layers. It was revealed that with natural gas, the OE stage was dominant with 85% of the total LCA, whereas for PV, the P stage was dominant with 70% of the total LCA. However, the current fuel mix used in Israel (31% coal, 56% natural gas, and 13% PV) was not analyzed by Pushkar and Verbitsky [8].
Hershcovich et al. [9] have recently proposed a new building envelope geometry based on the idea that the organization of material in a given space can improve the thermal performance of buildings. They studied sculptured tile thermal insulation technology for building envelopes. The following sculptured tiles with complex geometries were evaluated experimentally: fur (F), cavities (CV), bumps (B), cacti (C), and sponges (S). The authors reported a significant improvement (up to 24%) in the thermal performance of sculptured tiles over typical flat tiles. However, as noted earlier, different fuel sources can lead to different OE stage results [5]. Moreover, the P stage (which can be significant due to the excess amount of material used to make sculptured tiles) was not considered by Hershcovich et al. [9].
This study is intended to evaluate a new architectural approach to energy-efficient building technologies from an environmental point of view. According to the literature, LCA of sculptured tiles has not yet been carried out.
Therefore, the study aimed to compare sculptured tiles proposed by Hershcovich et al. [9] to typical flat tiles using LCA. To achieve this goal, we modeled a typical residential building in the hot Mediterranean climate of Tel Aviv, the building envelope of which is faced with flat or sculptured tiles. For the sensitivity analysis of the P stage, we used two types of local cement: Portland cement with 95% clinker (CEM I) and Portland cement with 65% clinker (CEM II). For a sensitivity analysis of the OE stage, we used two combinations of primary energy sources in Israel: 31% coal, 56% natural gas, and 13% PV, used in 2020, and 8% coal, 57% natural gas, and 35% PV, planned for 2025.

2. Materials and Methods

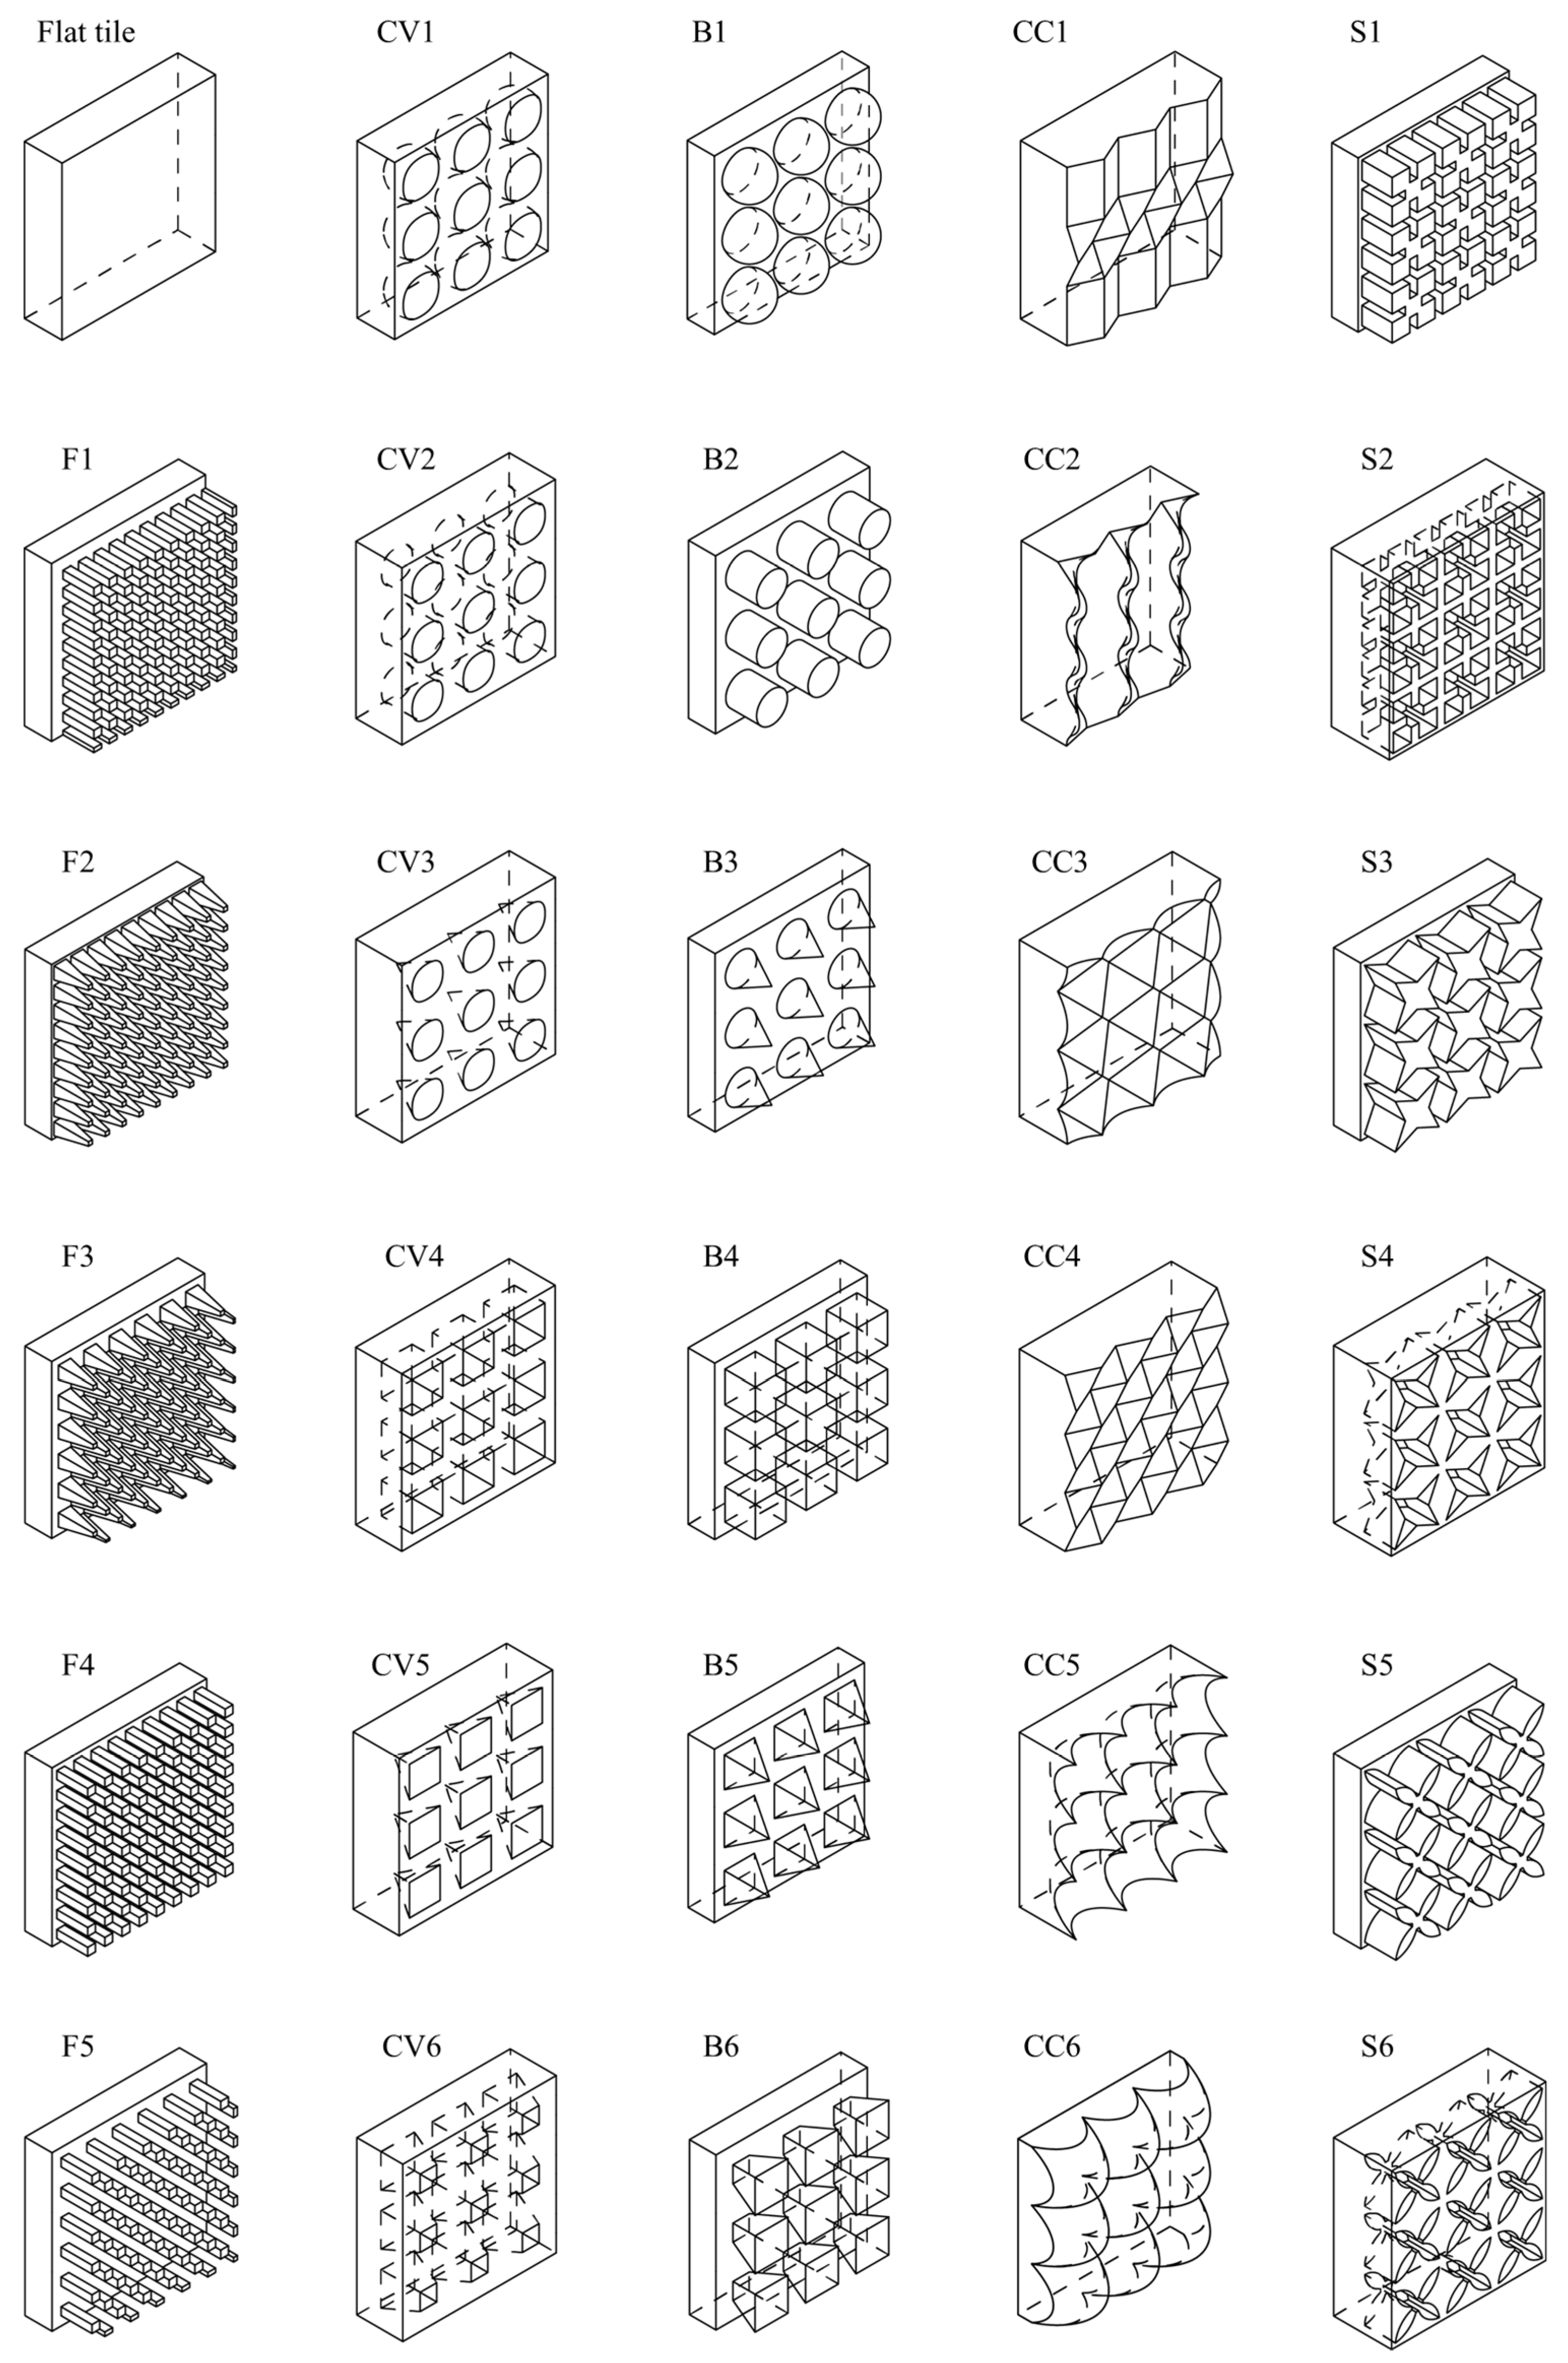
2.1. Design of Sculptured Tiles

Five groups of sculptured cement mortar tiles: fur (F), cavities (CV), bumps (B), cacti (CC), and sponges (S) (Figure 1), with their material volumes and U-values (Table 1), were adopted from the study of Hershcovich et al. [9].

2.2. Research Framework

This study evaluated the LCA of sculptured tiles versus conventional flat tiles (Figure 1 and Table 1). The tiles were applied to a simulated typical 9-story residential building located in Tel Aviv, Israel (Figure 2). Two LCA stages, P and OE, were evaluated. As can be seen from Table 1, the tile groups have different material volumes (which influence the P stage) and heat transfer coefficients (which influence the OE stage).
A 2-step procedure was used to evaluate flat and sculptured tiles in the LCA of P and OE stages. First, we evaluated OE using the ENERGYui model [10]. We worked with the difference between the OE of the building covered with each type of the sculptured tile and the building covered with flat tile. Lighting and equipment energy was the same for flat and sculptured tiles. Thus, only heating and cooling energy were evaluated for OE. Second, we performed P and OE environmental calculations using the ReCiPe method. Section 2.2.1 and Section 2.2.2 provide detailed descriptions of these steps.

2.2.1. Energy Assessment of the OE Stage

The main settings and building components of the investigated residential building are shown in Table 2 and Table 3, respectively. The building was modeled and simulated according to SI5282-1, Energy rating of buildings: Residential buildings [11], requirements. As a result, the resolution of the process was carried out at the level of apartments, each defined as one thermal zone. To speed up the simulation time, some of the windows were unified in the modeling (Figure 2).
The OE (kWh/m2 year) of the building with exterior walls covered with flat or sculptured tiles was estimated using the ENERGYui model. The model was specifically developed for building energy design in Israel [10] and includes building components and materials certified by the Standards Institution of Israel. The ENERGYui model is coupled with the robust hourly dynamic EnergyPlus simulation model created by the US Department of Energy [12].

2.2.2. LCA of P and OE Stages

LCA consists of: (i) goal and scope (a functional unit (FU) and system boundaries), (ii) life-cycle inventory (LCI), (iii) life-cycle impact assessment (LCIA), and (iv) interpretation [13].
Goal and scope. The FU refers to linked inputs (materials and energy) and outputs (emission and waste) [13]. Here, the FU had additional material quantity and energy saved for sculptured tiles compared to flat tile covering for a typical 9-story residential building served by OE for 50 years. To measure the P and OE stages related to FU, we used Pdelta (the difference between the material quantity required for each type of sculptured tiles and flat tile) and OEdelta (the difference between the OE of the building covered with each of the sculptured tile and the building covered with flat tile).
Thus, the system boundary included both the P and OE stages based on Pdelta and OEdelta. The Pdelta of the sculptured cement mortar tiles was evaluated with two amounts of clinker in Portland cement, 95% clinker + 5% gypsum (CEM I) and 65% clinker + 35% limestone (CEM II B-LL), referred to as CEM I Pdelta and CEM II Pdelta, respectively [14,15]. OEdelta of the tiles was evaluated with the current electricity sources in Israel in 2020 (31% coal, 56% natural gas, and 13% PV) and the predicted electricity sources in 2025 (8% coal, 57% natural gas, and 35% PV), referred to as 2020 OEdelta and 2025 OEdelta [16].
Life-cycle inventory (LCI). For Pdelta, the total quantities of relevant composite materials (sand, cement, and water) were evaluated based on a 3:1 sand–cement ratio, according to SI1920 Plaster: Requirements and test methods [17]. For OEdelta, the total consumption of relevant electricity (coal, natural gas, and PV) was assessed.
Then, the LCI of the material quantities and electricity consumption was modeled on the SimaPro platform using the built-in ecoinvent v3.2 database [18]. The ecoinvent database has comprehensive material and energy LCI databases [18]. Table 4 shows the ecoinvent v3.2 database sources adopted for Pdelta material production and OEdelta electricity sources. Secondary data were adopted due to the absence of local Israeli data. The data were considered to be appropriate based on a comparative assessment of the same materials and electricity sources used in Pdelta and OEdelta for the sculptured tiles. In addition, the data was modified to present locally used cement (CEM I and CEM II), as well as current (2020) and future (2025) electricity sources.
According to the ecoinvent v3.2 database [18], the production of sand includes the whole manufacturing process for digging of gravel and sand, transport, and infrastructure for machinery; the production of cement includes manufacturing, transport, and infrastructure; the use of water includes infrastructure and water treatment; the production of coal and natural gas electricity includes fuel input, infrastructure, and substances needed for operation; and the production of PV-based electricity includes the infrastructure for a 3 kWp PV plant and water for cleaning.
Life-cycle impact assessment. The commonly used LCIA methods in the construction sector are Eco-Indicator 99 [19], CML [20], and ReCiPe2016 [21]. ReCiPe2016 was developed based on the other two methods and has comparatively comprehensive and new evaluation indices [22], therefore, we used this method.
RCiPe2016 applies three perspectives on time horizons for living pollutants: individualist (I; short, 20 years), hierarchist (H; long, 100 years), and egalitarian (E; infinite, 1000 years) [22]. Applying each perspective, ReCiPe can evaluate midpoint (impact-based) and endpoint (damage-based) results.
The midpoint covers 17 environmental impacts, including, but not restricted to, global warming, stratospheric ozone depletion, ionizing radiation, ozone formation, water consumption, fine particulate matter formation, and terrestrial acidification [18].
The endpoint assigns the relevant impacts in terms of damage to human health, ecosystem quality, and resources. Finally, ReCiPe2016 uses two types of weighting sets: perspective-relevant (E, H, and I weightings) and average (A) weighting. In the I weighting, human health is the most important; in the H and E weightings, ecosystem quality is the most significant; and in the A weighting, human health and ecosystem quality are the most important. As a result, by applying these weightings, ReCiPe2016 can convert damage to human health, ecosystem quality, and resources to the following endpoint single-score results: individualist/average (I/A), hierarchist/average (H/A), egalitarian/average (E/A), individualist/individualist (I/I), hierarchist/hierarchist (H/H), and egalitarian/egalitarian (E/E) [15].
In this study, we performed midpoint (H) and endpoint single-score (I/A, H/A, and E/A) evaluations. For the midpoint, the analyzed impacts were global warming potential, terrestrial acidification, water consumption, and ionizing radiation, considered the most relevant to cement and fossil fuels (Table 5).
For the endpoint single-score, I/A, H/A, and E/A evaluations were preferred, as they present the short, long, and infinite time horizons for living pollutants with equal A weightings of human health, ecosystem quality, and resources. This allows a clear distinction among LCAs when using sculptured cement mortar tiles over short, long, and infinite time horizons.

3. Results and Discussion

3.1. Energy Assessment of the OE Stage

Table 6 shows the total heating and cooling energy consumption of the entire building for each flat and sculpted tile tested. As expected, among five groups of sculpted tiles, group F showed the lowest energy consumption. This is due to the lowest U-value associated with this group of sculptured tiles (Table 1). Therefore, in the further LCA, group F was selected as the main representative group, for which both midpoint and endpoint single-score results are presented. The results of groups CV, B, CC, and S of sculpted tiles are presented for endpoint single scores only.

3.2. LCA of P and OE Stages

3.2.1. Preparatory Results: Materials and Energy

Table 7 shows the total quantities of surplus cement mortar required for Pdelta and the saved energy for OEdelta of sculptured tile compared to flat tile covering for a typical 9-story residential building.

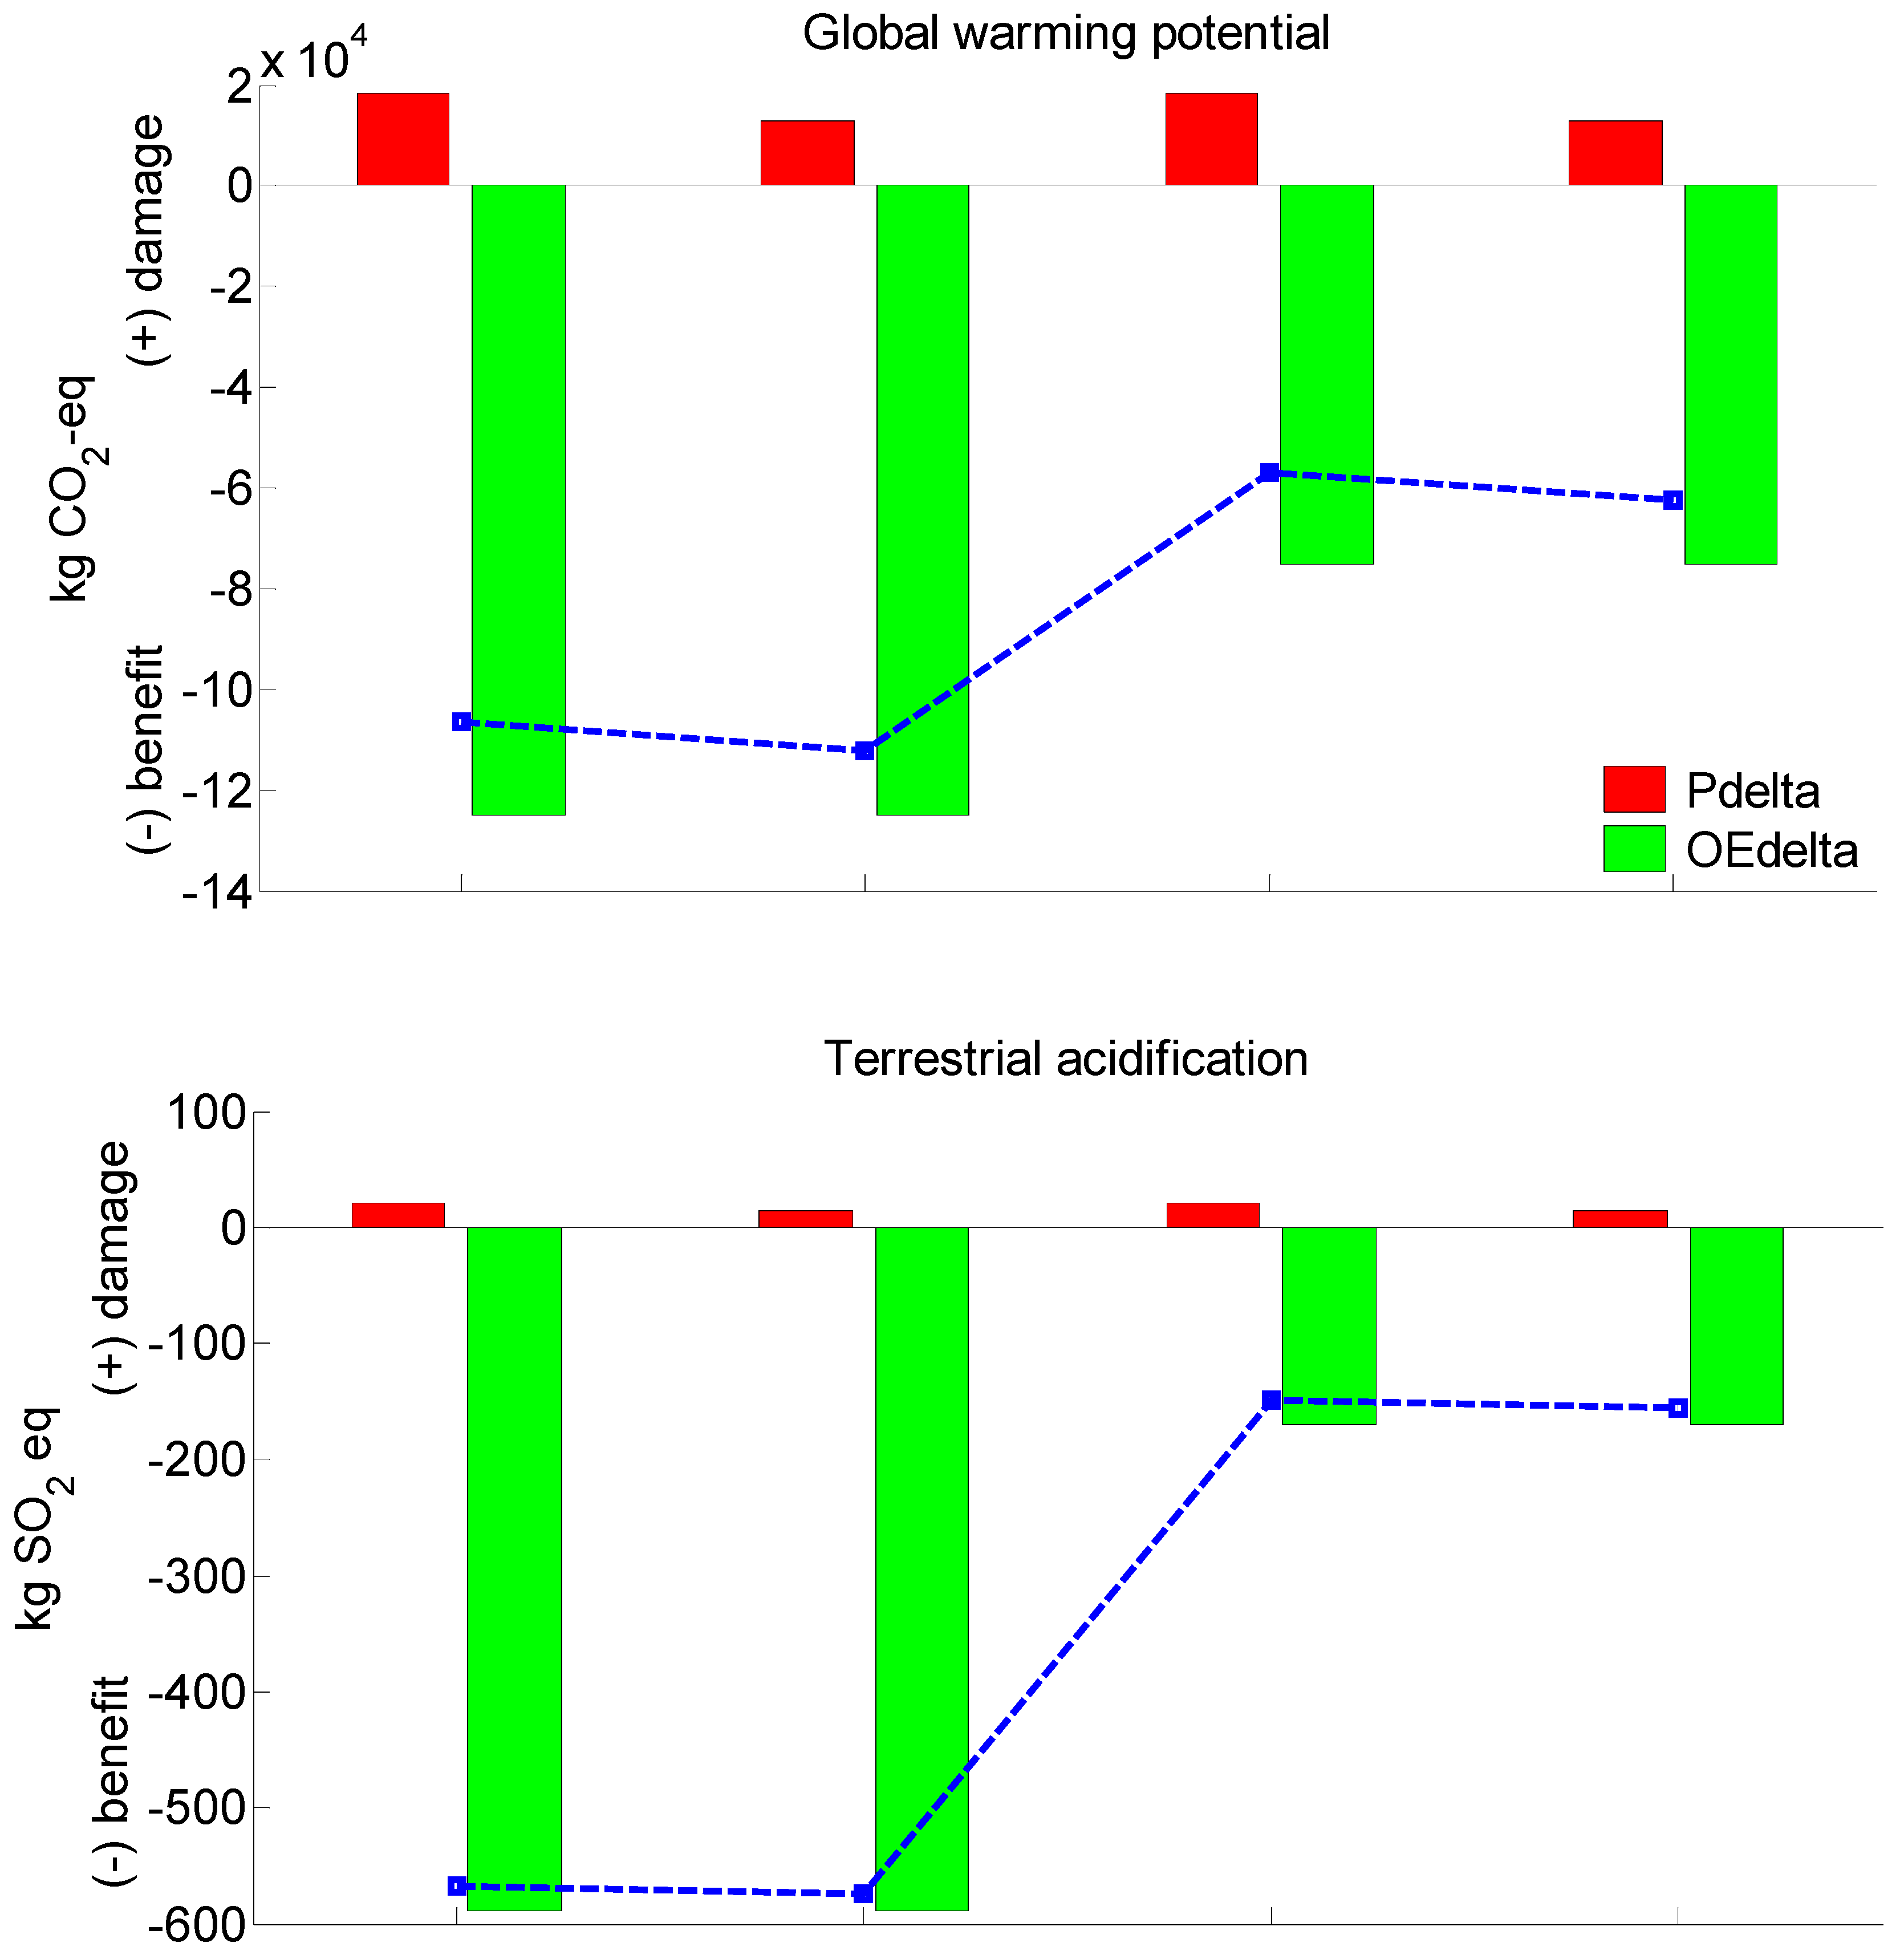
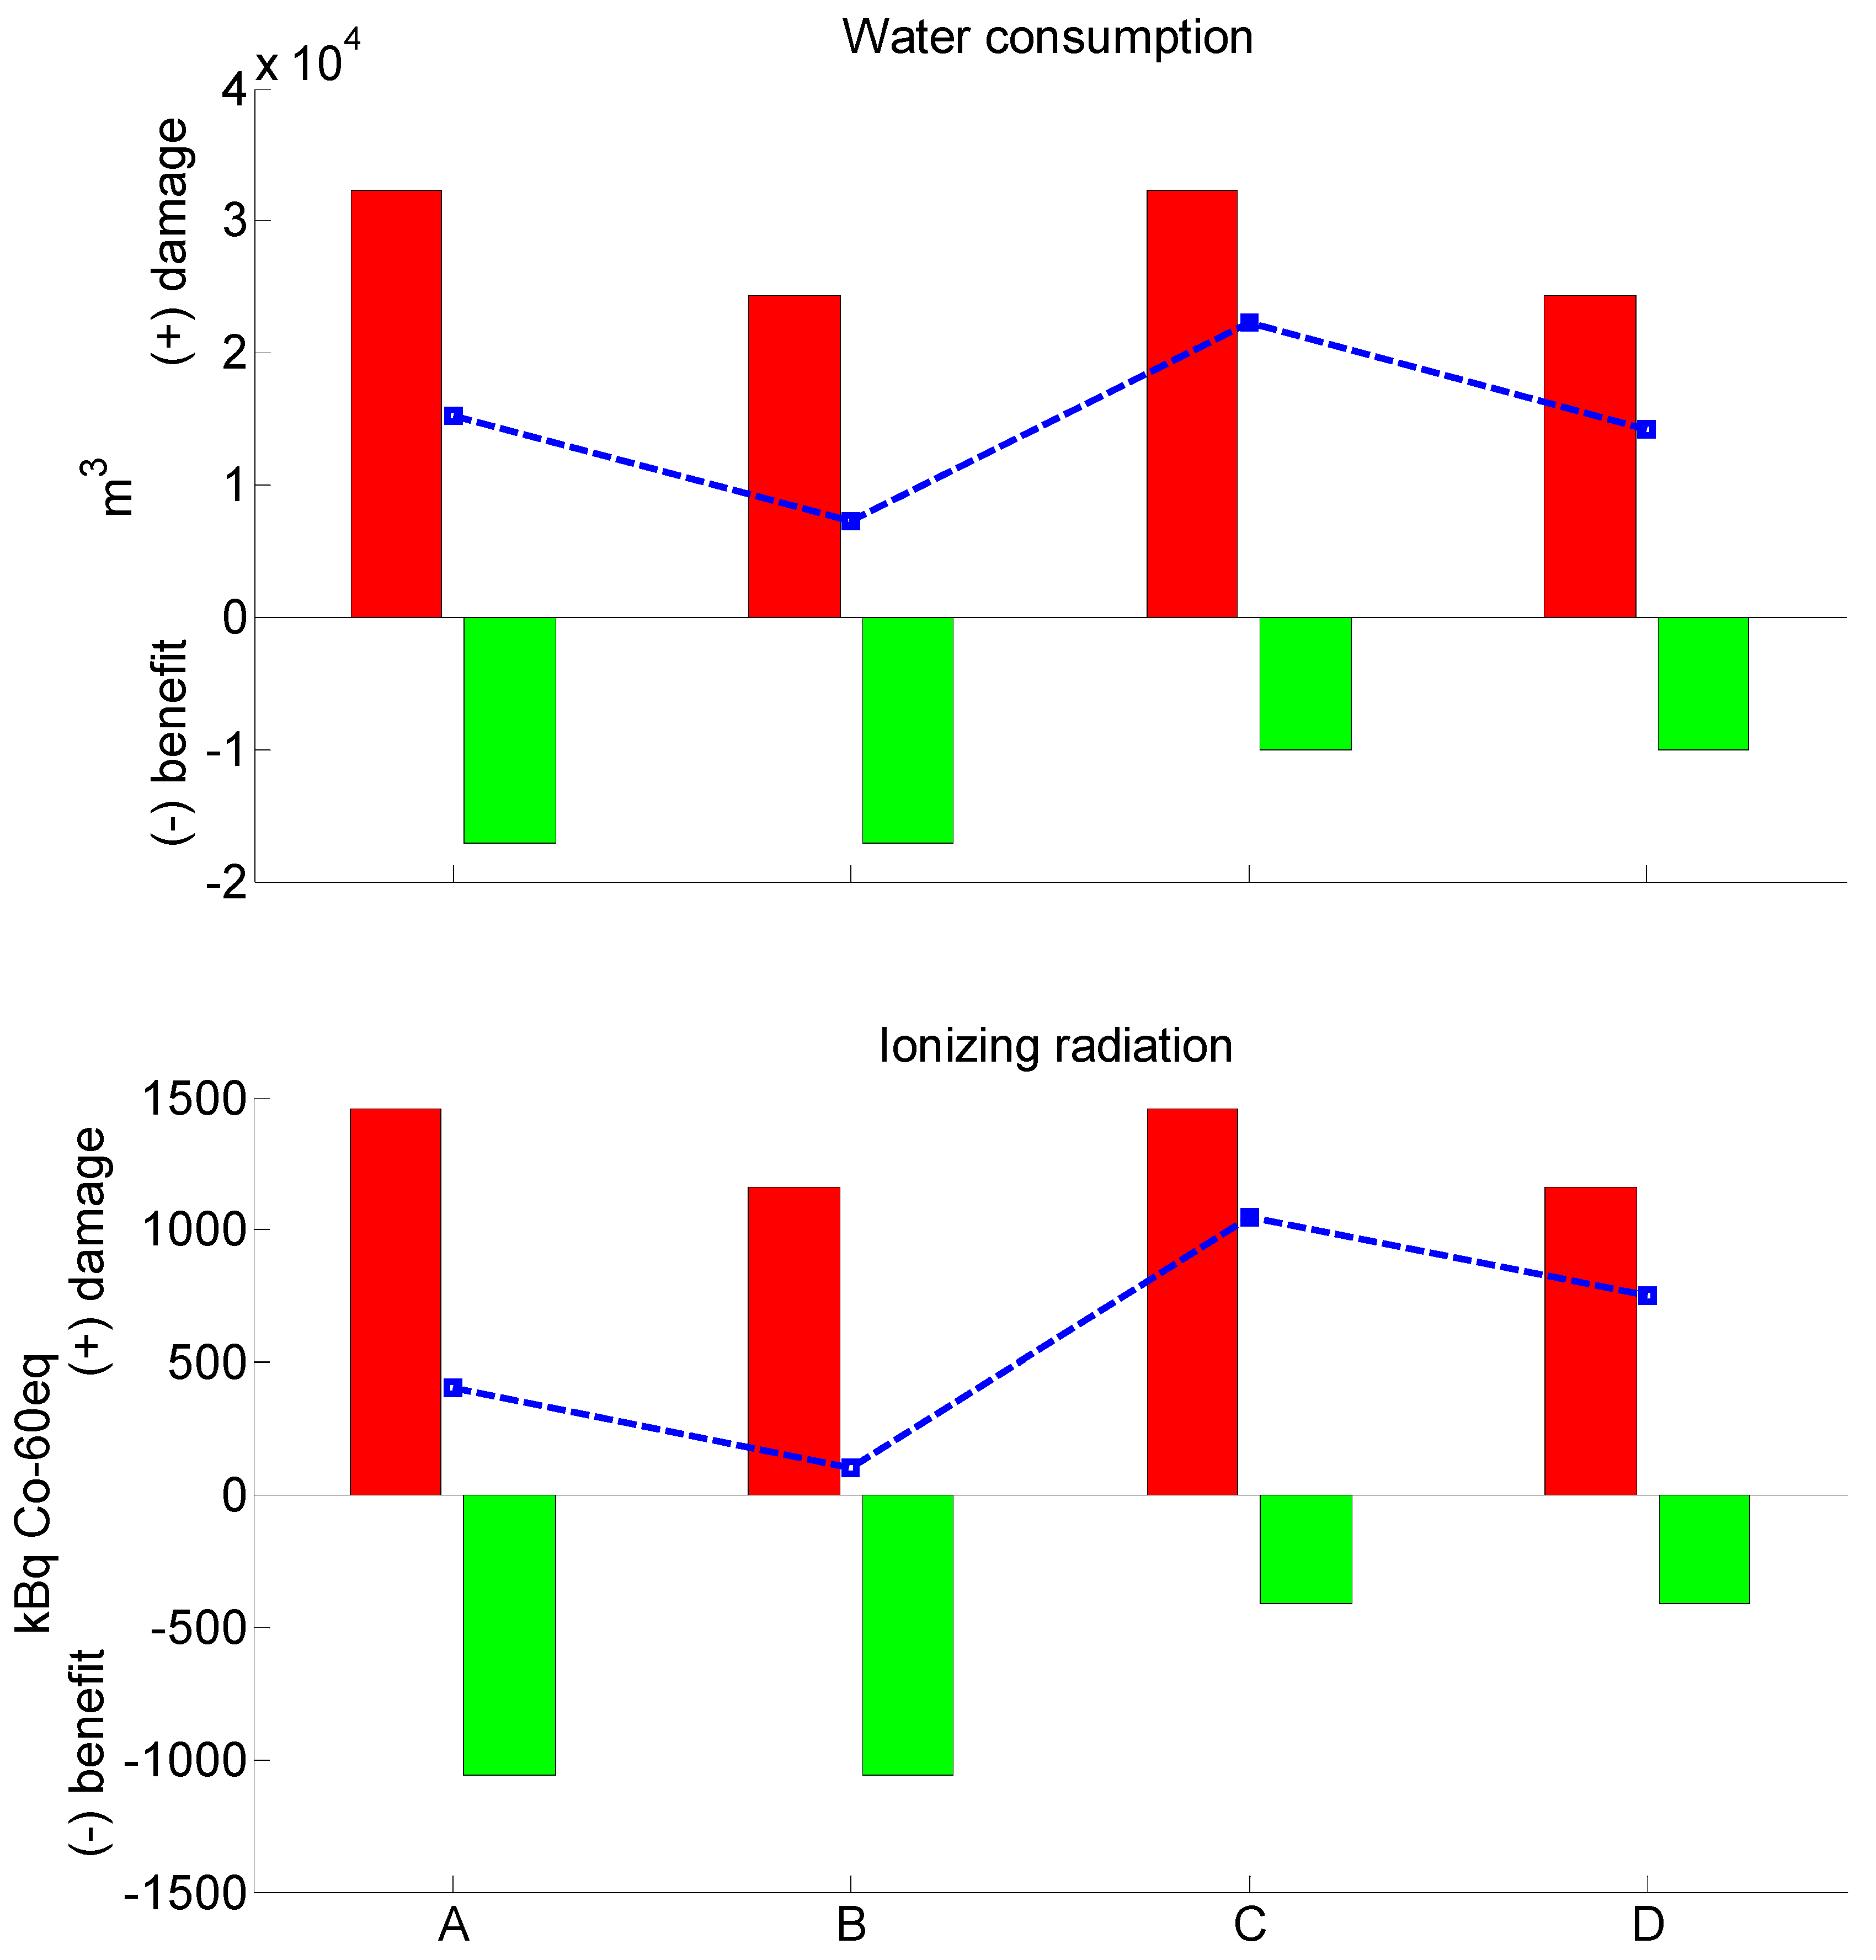
3.2.2. ReCiPe2016 Midpoint Results

Analyzing the F1 sculptured tiles, the Pdelta of surplus material (Table 7) resulted in environmental damage (Figure 3), whereas saved energy (Table 7) resulted in environmental benefit (Figure 3). In terms of global warming potential and terrestrial acidification, the benefit of OEdelta was significantly higher than the damage of Pdelta, whereas, in terms of water consumption and ionizing radiation, the damage of Pdelta was much higher than the benefit of OEdelta.
The high OEdelta value is achieved through the use of coal and natural gas (fossil fuel sources of electricity). During the burning process, coal releases large amounts of carbon dioxide (CO2), sulfur dioxide (SO2), nitrogen oxide (NOx), and methane (CH4) into the environment. Natural gas is considered to be a cleaner source of electricity than coal because it produces lower CO2, SO2, and NOx emissions [23]. Emitted CO2, SO2, and NOx increase global warming potential and terrestrial acidification, among other effects [24]. As a result, a large benefit in terms of global warming potential and terrestrial acidification impact was shown for the 2020 and 2025 OEdelta values. The results are more pronounced for the former than the latter due to a decrease in the total amount of coal and gas from 87% in 2020 to 65% in 2025 [16].
High energy consumption and cement calcination during cement production at 1500 °C are responsible for high CO2, NOx, SO2, and PM2.5 emissions. These lead to global warming potential, eutrophication, human toxicity, ionizing radiation, and particulate matter impact [25]. As a result, high damage from ionizing radiation was noted for the CEM I and CEM II Pdelta, with the former higher than the latter. This is due to the higher proportion of clinker included in CEM I (95%) compared to CEM II (65%) [14].
As reported in the literature, water inventories vary between 0.750 and 1.4 m3 water/kg clinker production [26]. Based on the ecoinvent database, cement production consumes 1.46 and 1.08 m3 of water for CEM I and CEM II, respectively (Table 5). Thus, in terms of water consumption impact, the high environmental damage of CEM I and CEM II Pdelta is mostly due to cement production, while the contribution of sand is small (Figure 3).
Figure 4 shows the impact of the four combinations of CEM I Pdelta, CEM II Pdelta, 2020 OEdelta, and 2025 OEdelta evaluated for the F1 sculptured tiles. For each combination, the dotted line shows the total Pdelta + OEdelta results. For current and future sources of electricity (based on 2020 and 2025, respectively), the overall results for Pdelta and OEdelta are as follows: global warming potential and terrestrial acidification resulted in environmental benefit, and water consumption and ionizing radiation resulted in environmental damage.
The results of replacing typical tiles with sculptured tiles in the transition from current to future energy sources showed different environmental benefit/damage for all types of environmental impact. In particular, the environmental benefit of total Pdelta + OEdelta was decreased in terms of global warming potential and terrestrial acidification, whereas the environmental damage was increased in terms of water consumption and ionizing radiation.
We can conclude, considering the two impacts with benefit (global warming potential and terrestrial acidification) and the two with damage (water consumption and ionizing radiation), that the total midpoint result cannot be unequivocally interpreted to decide on the damage/benefit of F1. In this respect, Huijbregts et al. [22] noted that midpoint results have lower uncertainty but cannot be interpreted easily. The other tiles (F2, F3, F4, and F5) showed similar benefit/damage results concerning the studied impacts, therefore those are not presented here.

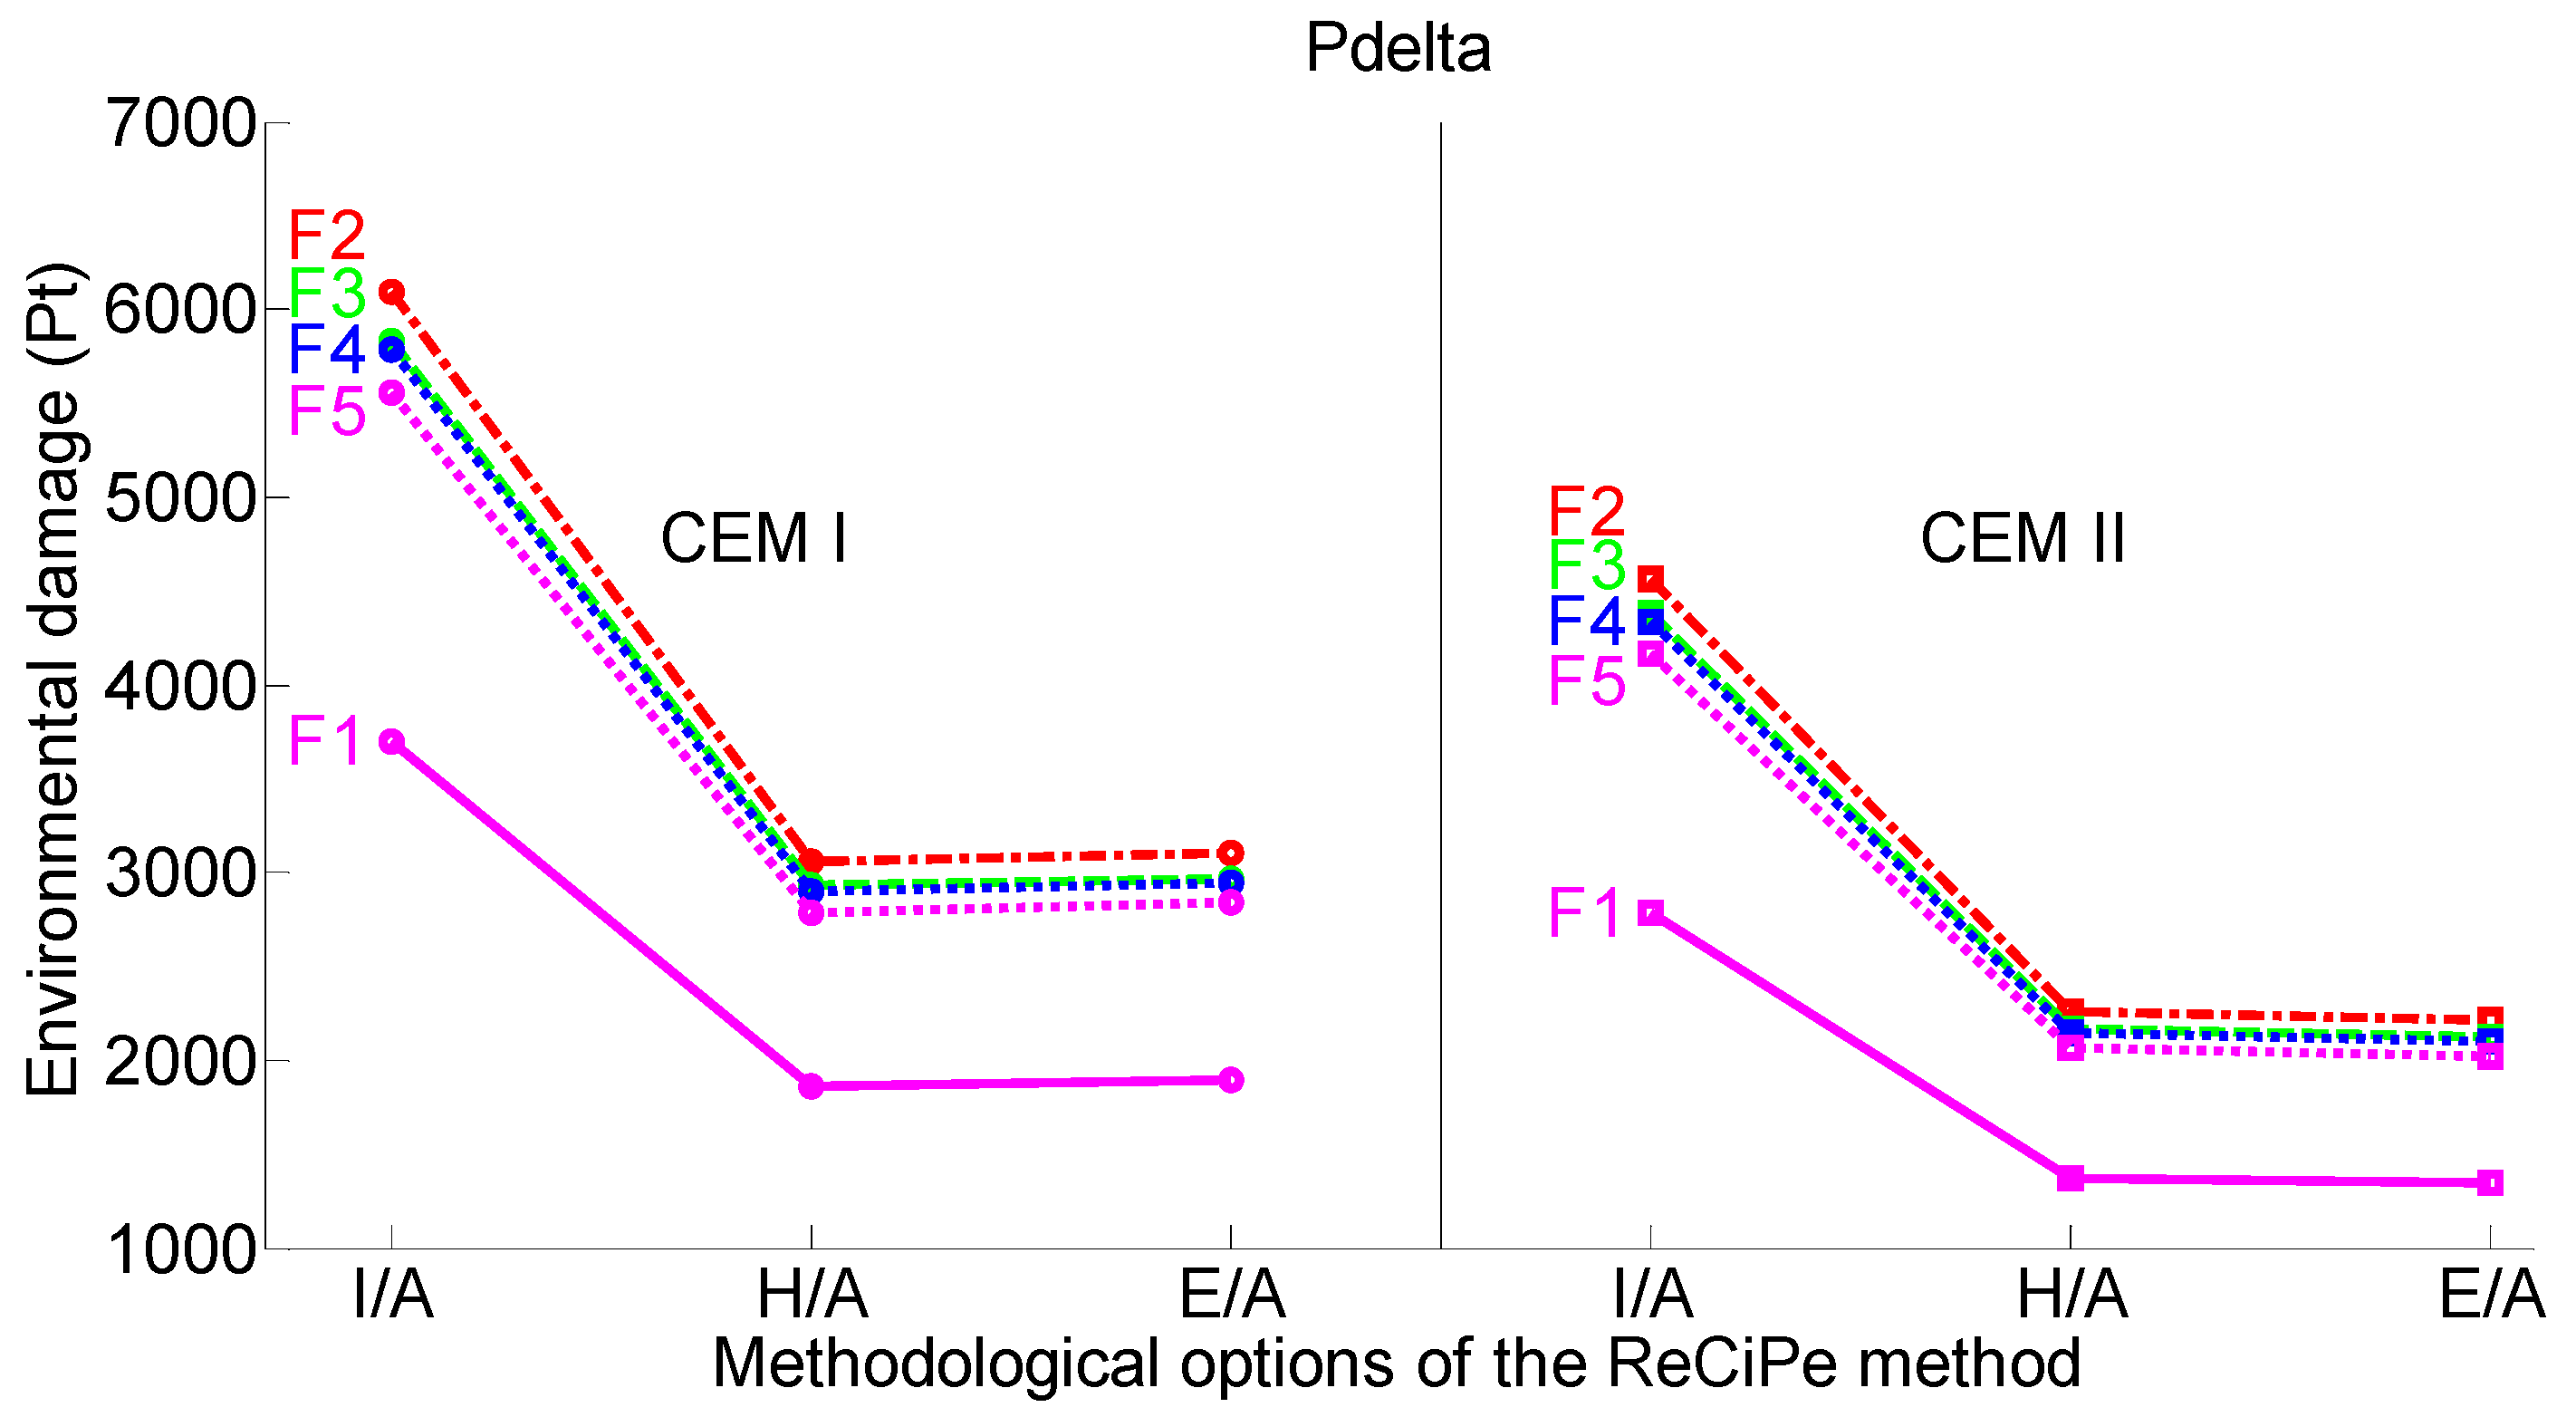
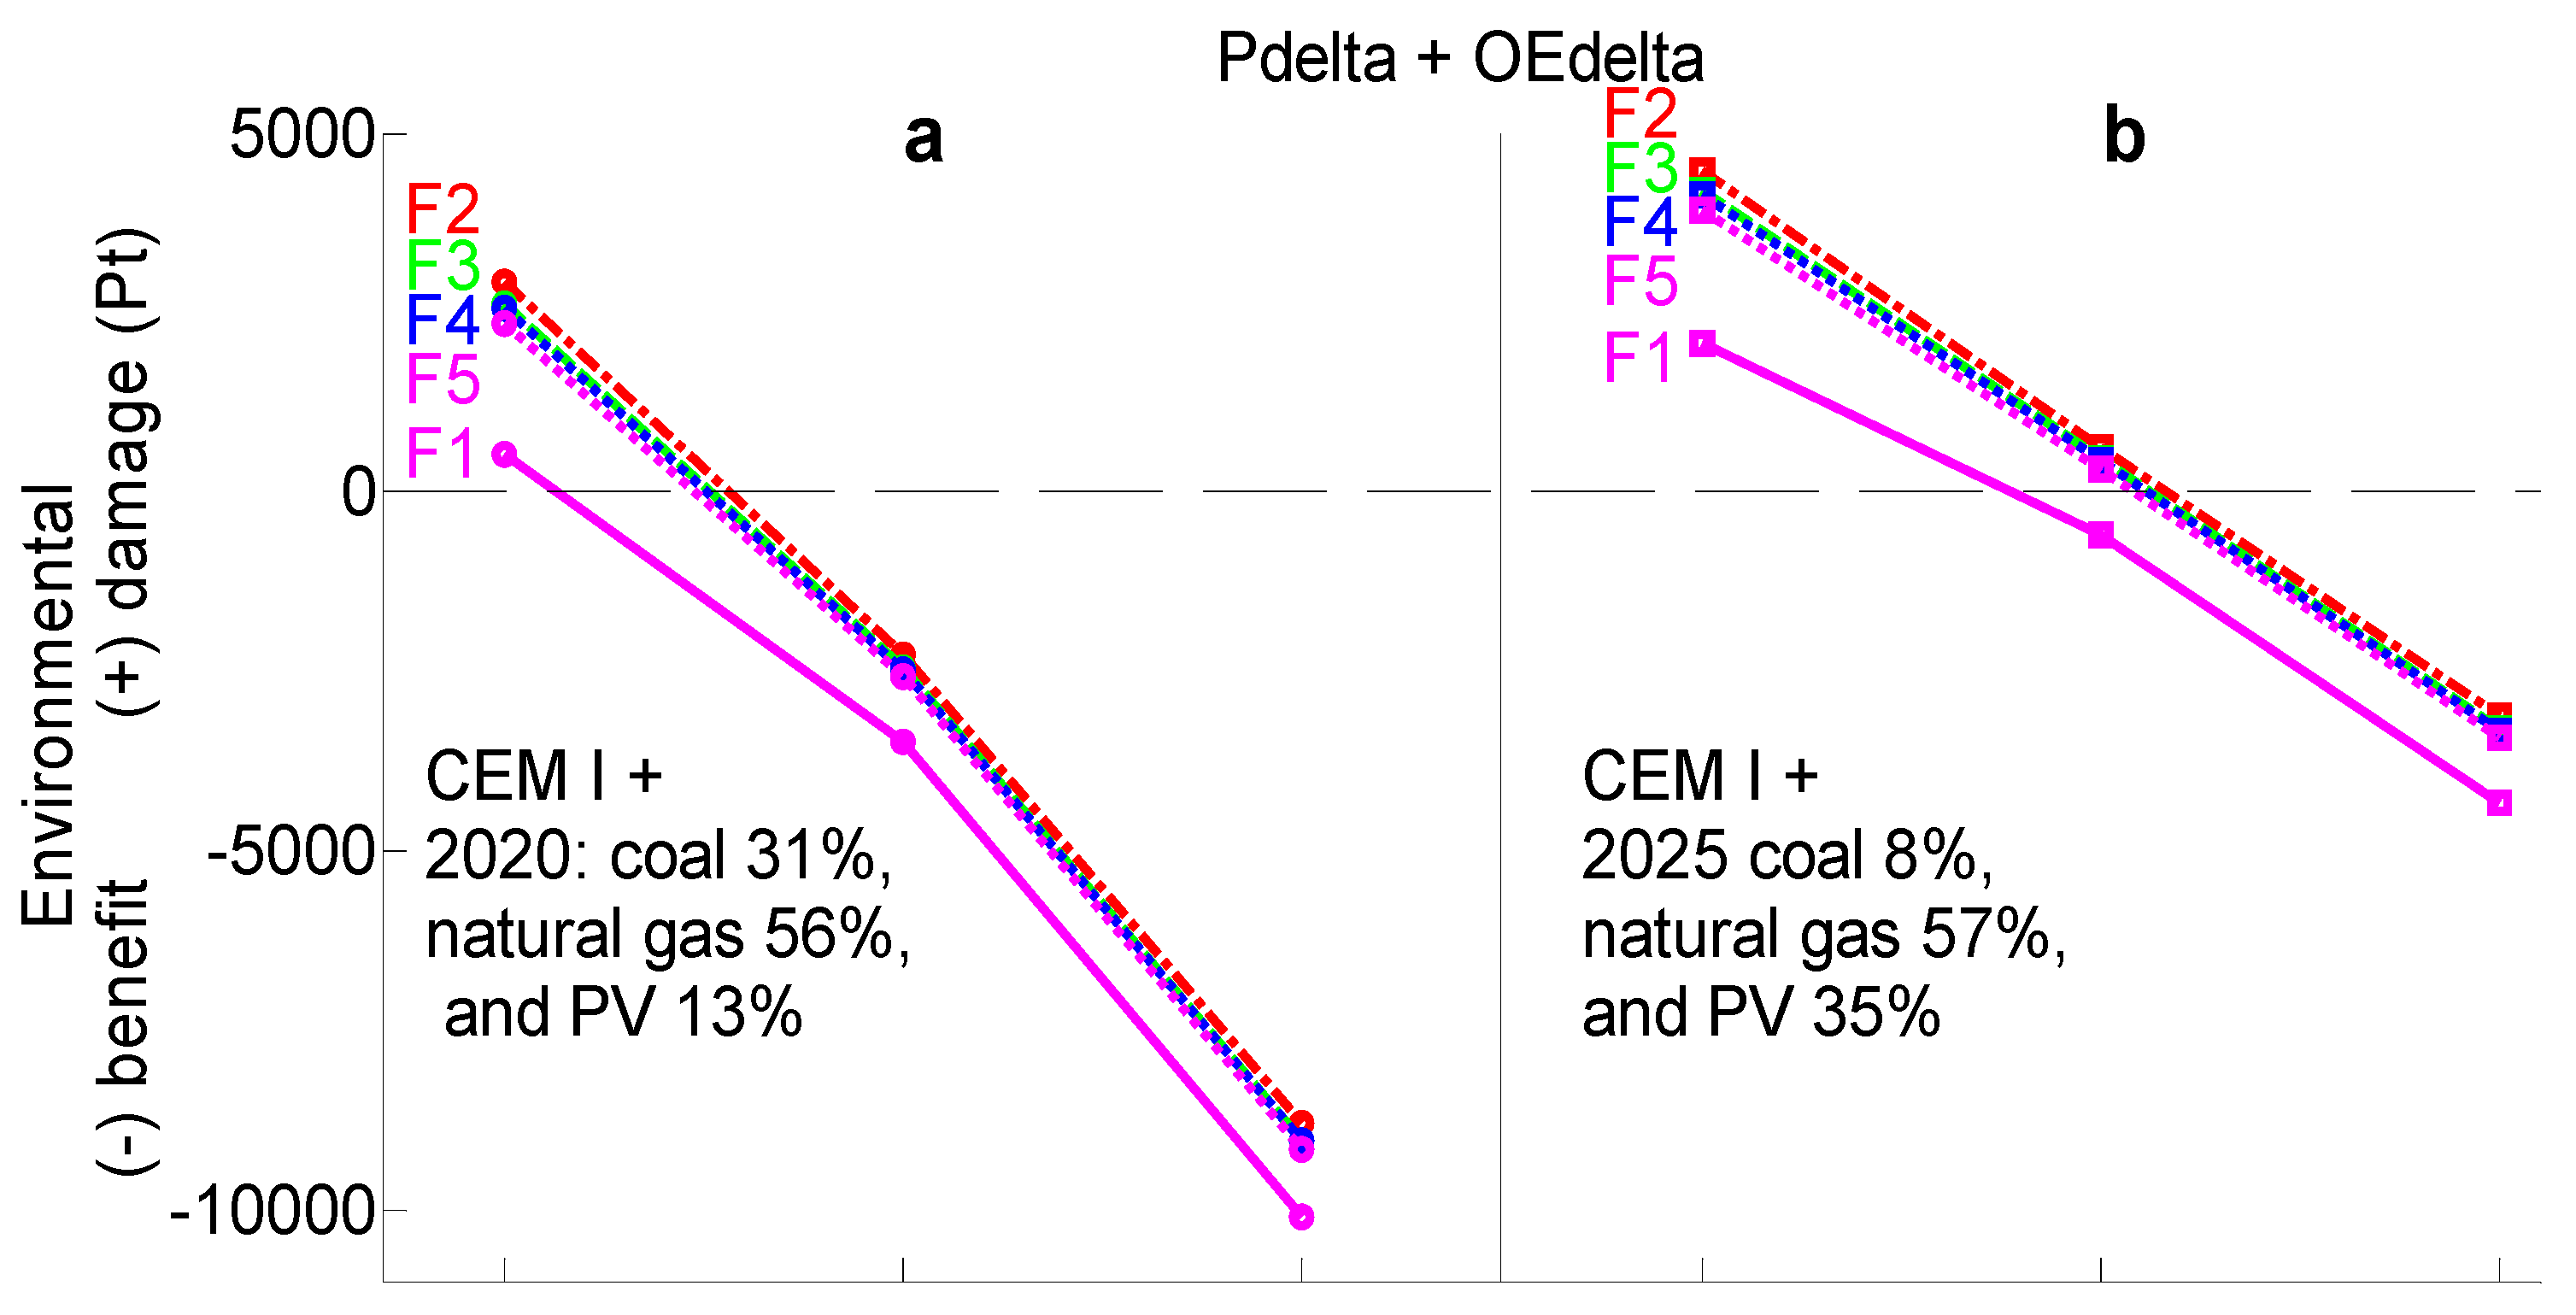
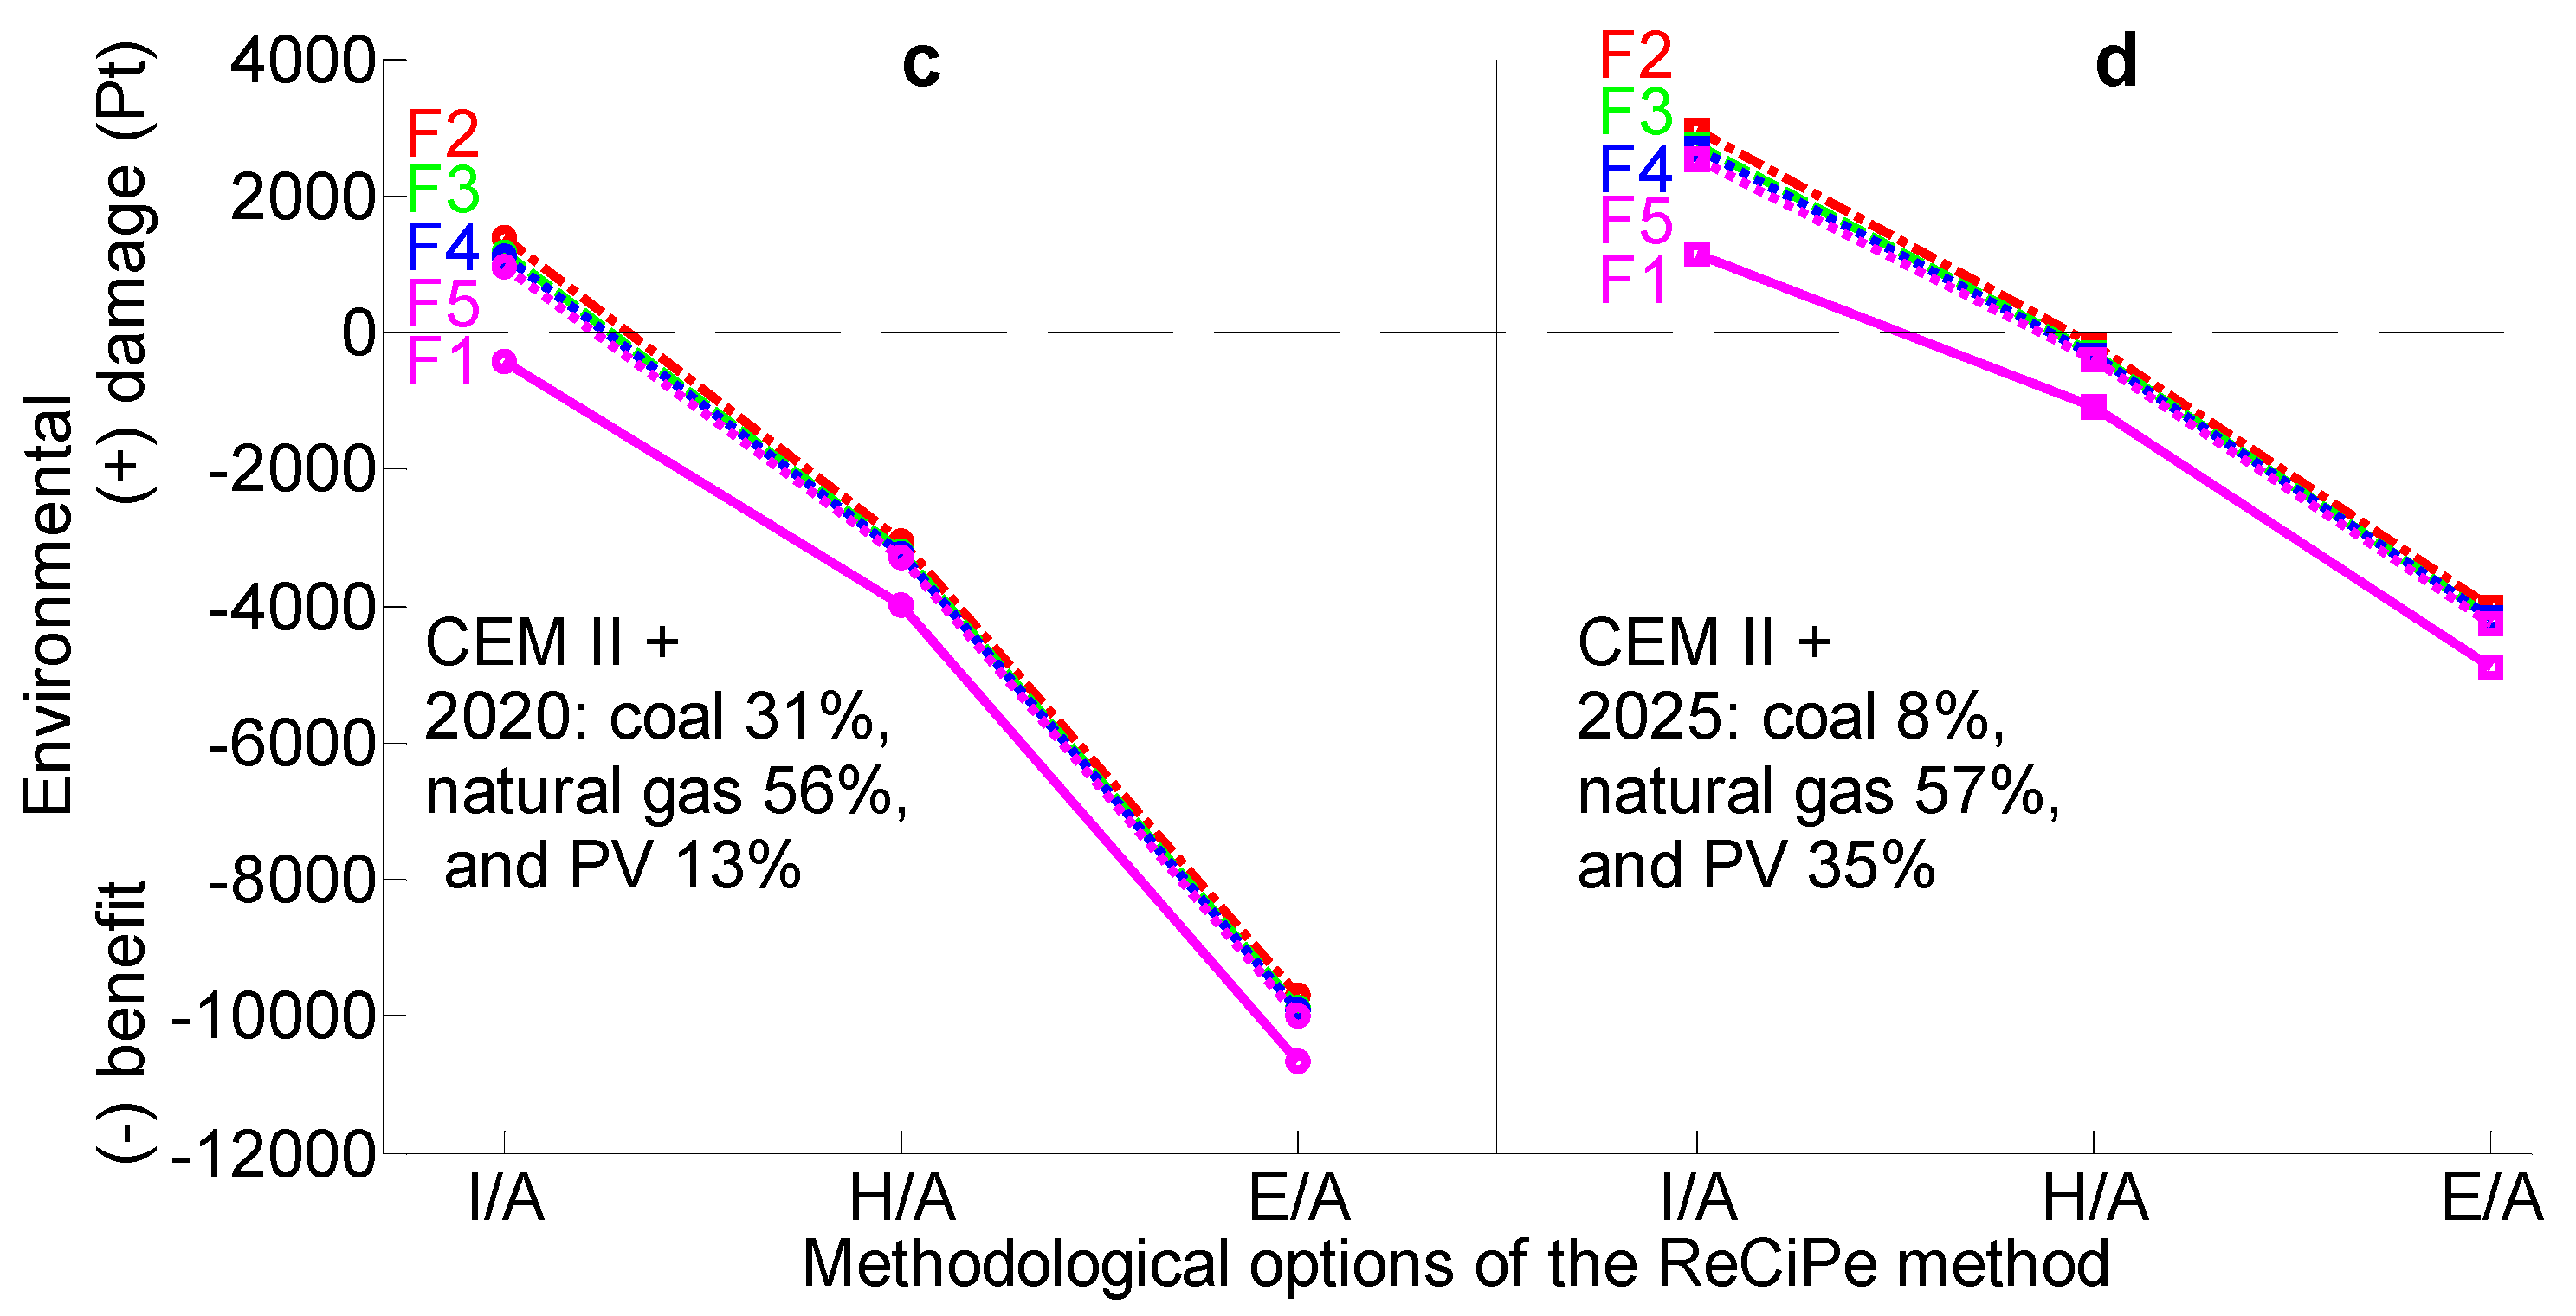
3.2.3. ReCiPe2016 2016 Endpoint Single-Score Results

Figure 5 shows the ReCiPe2016 endpoint single-score results of CEM I Pdelta and CEM II Pdelta for group F sculptured tiles. The P stage of F tiles showed increased environmental damage compared to flat tiles, as the use of additional cement mortar is required to make sculptured tiles (Table 7). In both CEM I and CEM II Pdelta, the ranking of sculptured tiles in terms of increasing environmental damage was in the following order: F1, F5, F4, F3, and F2. This ranking was expected due to the respective amounts of cement mortar used for the production of these tiles (Table 7).
Compared to CEM I Pdelta, the damage of CEM II Pdelta decreased by 25, 26, and 29% in I/A, H/A, and E/A, respectively. This is due to a decrease in the content of clinker, the most environmentally damaging component of cement, from 95 to 65% [26].
In addition, the choice of different time horizons for living pollutants led to different levels of environmental damage. For both CEM I and CEM II Pdelta, a comparison with the environmental damage assessed using I/A (20-year time horizon, short-lived pollutants), options of H/A (100-year time horizon, long-lived pollutants) and E/A (1000-year time horizon, infinite-lived pollutants) resulted in a reduction in damage of about 50%.
Figure 6 shows the results of the 2020 and 2025 OEdelta for group F sculptured tiles. For both types of electricity sources (2020 and 2021), OEdelta of all sculptured tiles resulted in almost similar environmental benefit. This is due to the very close operational energy savings associated with F1-F5 sculptured tiles (Table 7).
Moving from the electricity sources in 2020 to those in 2025, the environmental benefit of 2025 OEdelta decreased by 49, 54, and 48% under I/A, H/A, and E/A, respectively. This is due to the predicted dynamics of a decreasing dependence on fossil-fuel-based energy and an increasing reliance on renewable energy sources [16].
Similar to the results of the Pdelta stage (Figure 4), the results of the OEdelta stage also depended on the choice of a time horizon (Figure 5). In both the 2020 and 2025 OEdelta, compared to the I/A (20-year time horizon, short-lived pollutants) results, the H/A (100-year time horizon, long-lived pollutants) and E/A (1000-year time horizon, infinite-lived pollutants) results showed increased environmental benefit by approximately 60 and 280%, respectively.
Figure 7 shows the total CEM I Pdelta + 2020 OEdelta and CEM II Pdelta + 2020 OEdelta (left panel), and the total CEMI Pdelta + 2025 OEdelta and CEM II Pdelta + 2025 OEdelta (rigth panel). According to the results, for CEM I and CEM II with current OE electricity sources (left panel), the I/A (20-year time horizon, short-lived pollutants) evaluation results in environmental damage, whereas the H/A (100-year time horizon, long-lived pollutants) and E/A (1000-year time horizon, infinite-lived pollutants) evaluations result in environmental benefit.
However, for CEM I and CEM II with future OE electricity sources (right panel), the I/A option results in environmental damage and the E/A option results in environmental benefit, whereas the H/A option shows no consequence regarding damage/benefit (F1 leads to benefit, while F2–F5 lead to similar environmental results to the referenced flat tile).
When comparing current sources of electricity (left panel) with future sources of electricity (right panel), the total Pdelta + OEdelta results in increased environmental damage of about 65% (I/A option) and decreased environmental benefit of about 60% (option E/A). This is due to a decreased dependence on fossil fuel electricity [16] and increased use of electricity from renewable sources [27], resulting in less OE benefit and greater P damage in the LCA of buildings in Israel. These results confirm the previously identified effect of natural gas and PV on the P and OE stages for wall technologies used in Israel [8], as well as improvements in building modules following the Israeli energy standard SI5282 [28].
Table 8 shows the results of groups CV, B, CC, and S sculptured tiles. For these groups, only the total results of Pdelta + OEdelta are presented. The results of group B were very similar to those of group F (Figure 6). However, the results of groups CV, CC, and S were somewhat different for total CEM I Pdelta + 2025 OEdelta and CEM II Pdelta + 2025 OEdelta: I/A and H/A resulted in environmental damage, whereas E/A resulted in environmental benefit.

4. Conclusions

This study evaluated the environmental damage/benefit of replacing conventional flat tiles with sculptured tiles for a typical residential building. The LCA stages of P and OE were analyzed. The P stage used Portland cement with 95% clinker (CEM I) and Portland limestone cement with 65% clinker (CEM II), and the OE stage used the current 87% fossil and 13% renewable fuel sources and the future 65% fossil and 35% renewable fuel sources. The estimated difference in the P stage for the two types of cement and the difference in the OE stage for the two types of tiles (Pdelta and OEdelta, respectively) led to the following results:
According to the ReCiPe2016 midpoint results, Pdelta is responsible for increased water consumption and ionizing radiation impact, whereas OEdelta is responsible for decreased global warming potential and terrestrial acidification impact. As a result, the total Pdelta + OEdelta causes environmental damage in terms of water consumption and ionizing radiation and environmental benefit in terms of global warming potential and terrestrial acidification. Taking into account the ReCiPe2016 endpoint single-score results, OEdelta is twice as sensitive to the analyzed electricity sources as Pdelta is to the considered cement types. Thus, the total results of Pdelta + OEdelta are mainly influenced by the source of electricity generation.
The novelty of the study lies in the description of the environmental assessment of a promising architectural approach to the insulation of building envelopes. We have shown that the type of cement (CEM I or CEM II) does not significantly affect the environmental performance of sculptured tiles, while the electricity source of the OE stage significantly affects the environmental performance of sculptured tiles.
Replacing conventional flat tile with sculptured tile in 2020 results in environmental damage in the short time horizon and environmental benefits in the long and infinite time horizons, while by 2025, it will result in environmental benefits only in the infinite time horizon. However, the global trend of shifting from fossil fuels to renewable energy cannot be reversed. Therefore, we recommend directing future research toward finding new architectural approaches to the building envelope and replacing cement with more sustainable materials.

Author Contributions

Conceptualization, S.P., Y.J.G., C.H. and A.Y.; formal analysis, S.P. and A.Y.; investigation, S.P. and A.Y.; methodology, S.P., Y.J.G., C.H. and A.Y.; project administration, S.P., Y.J.G. and A.Y.; resources, S.P., C.H., Y.J.G. and A.Y.; software, S.P. and A.Y.; validation, S.P. and A.Y.; visualization, S.P., Y.J.G. and A.Y.; writing—original draft, S.P.; writing—review and editing, S.P., Y.J.G. and A.Y. All authors have read and agreed to the published version of the manuscript.

Funding

This research received no external funding.

Data Availability Statement

The data presented in this study are available from the corresponding author upon request. The data are not publicly available due to privacy issues.

Conflicts of Interest

The authors declare no conflict of interest.

References

  1. Sundaram, S.; Paul, M.C.; Mahmoudi, Y. Research on Hybrid Solar Photovoltaic/Thermal (PV/T) System. Energies 2022, 15, 886. [Google Scholar] [CrossRef]
  2. Sbrogiò, L.; Bevilacqua, C.; De Sordi, G.; Michelotto, I.; Sbrogiò, M.; Toniolo, A.; Tosato, C. Strategies for Structural and Energy Improvement in Mid-Rise Unreinforced Masonry Apartment Buildings. A Case Study in Mestre (Northeast Italy). Sustainability 2021, 13, 8819. [Google Scholar] [CrossRef]
  3. Al-Sakkaf, A.; Mohammed Abdelkader, E.; Mahmoud, S.; Bagchi, A. Studying Energy Performance and Thermal Comfort Conditions in Heritage Buildings: A Case Study of Murabba Palace. Sustainability 2021, 13, 12250. [Google Scholar] [CrossRef]
  4. Cabeza, L.F.; Rincón, L.; Vilariño, V.; Pèreza, G.; Castella, A. Life cycle assessment (LCA) and life cycle energy analysis (LCEA) of buildings and the building sector: A review. Renew. Sustain. Energ. Rev. 2014, 29, 394–416. [Google Scholar] [CrossRef]
  5. Karimpour, M.; Belusko, M.; Xing, K.; Bruno, F. Minimising the life cycle energy of buildings: Review and analysis. Build. Environ. 2014, 73, 106–114. [Google Scholar] [CrossRef]
  6. Huberman, N.; Pearlmutter, D. A life-cycle energy analysis of building materials in the Negev desert. Energ. Build. 2008, 40, 837–848. [Google Scholar] [CrossRef]
  7. Huberman, N.; Pearlmutter, D.; Gal, E.; Meir, I.A. Optimizing structural roof form for life-cycle energy efficiency. Energy Build. 2015, 104, 336–349. [Google Scholar] [CrossRef]
  8. Pushkar, S.; Verbitsky, O. Environmental damage from wall technologies for residential buildings in Israel. J. Green Build. 2016, 11, 98–106. [Google Scholar] [CrossRef]
  9. Hershcovich, C.; van Hout, R.; Rinsky, V.; Laufer, M.; Grobman, Y.J. Thermal performance of sculptured tiles for building envelopes. Build. Environ. 2021, 197, 107809. [Google Scholar] [CrossRef]
  10. Yezioro, A.; Capeluto, I.G. Energy Rating of Buildings to Promote Energy-Conscious Design in Israel. Buildings 2021, 11, 59. [Google Scholar] [CrossRef]
  11. SII. SI5282; Part 1. Energy Rating of Buildings: Residential Buildings. The Standards Institution of Israel (SII): Tel Aviv, Israel, 2017.
  12. US Department of Energy. EnergyPlus. Available online: https://energyplus.net/downloads (accessed on 12 December 2021).
  13. ISO 14040; Environmental Management Life Cycle Assessment Principles and Framework. International Organization for Standardization: Geneva, Switzerland, 2006.
  14. SII. SI1; Cement: Common Cements. The Standards Institution of Israel (SII): Tel Aviv, Israel, 2015.
  15. Nesher Israel Cement Enterprises. Ltd., Products Catalog. Available online: https://www.nesher.co.il/en/product-catalog/ (accessed on 10 December 2021).
  16. Israel Electricity Authority, Electricity Status Report. 2020. Available online: https://www.gov.il/BlobFolder/generalpage/dochmeshek/he/Files_Netunei_hashmal_doch_reshut_hasmal_2020_malle_n.xlsx.pdf (accessed on 14 December 2020). (In Hebrew)
  17. SII. SI1920; Plaster: Requirements and Test Methods. The Standards Institution of Israel (SII): Tel Aviv, Israel, 2021.
  18. PRé Consultants. SimaPro; Version 9.1. 0.35; PRé Consultants: Amersfoort, The Netherlands, 2019. [Google Scholar]
  19. Verbitsky, O.; Pushkar, S. Eco-Indicator 99, ReCiPe, and ANOVA for evaluating building technologies under LCA uncertainties. Environ. Eng. Manag. J. 2018, 17, 2549–2559. [Google Scholar] [CrossRef]
  20. Santoyo-Castelazo, E.; Solano-Olivares, K.; Martínez, E.; García, E.O.; Santoyo, E. Life cycle assessment for a grid-connected multi-crystalline silicon photovoltaic system of 3 kWp: A case study for Mexico. J. Clean. Prod. 2021, 316, 128314. [Google Scholar] [CrossRef]
  21. Jia, X.; Lv, F.; Li, P.; Wang, W. Life-cycle assessment of p-type multi-Si back surface field (BSF) solar module in China of 2019. Sol. Energ. 2020, 196, 207–216. [Google Scholar] [CrossRef]
  22. Huijbregts, M.A.J.; Steinmann, Z.J.N.; Elshout, P.M.F.; Stam, G.; Verones, F.; Vieira, M.; Zijp, M.; Hollander, A.; van Zelm, R. ReCiPe2016: A harmonised life cycle impact assessment method at midpoint and endpoint level. Int. J. Life Cycle Assess. 2017, 22, 138–147. [Google Scholar] [CrossRef]
  23. Farquharson, D.; Jaramillo, P.; Schivley, G.; Klima, K.; Carlson, D.; Samaras, C. Beyond global warming potential: A comparative application of climate impact metrics for the life cycle assessment of coal and natural gas-based electricity. J. Ind. Ecol. 2017, 21, 857–873. [Google Scholar] [CrossRef]
  24. Pikon, K.; Bogacka, M.; Stanek, W.; Czarnowska, L. Energy, exergy and environmental quality of hard coal and natural gas in whole life cycle concerning home heating. Therm. Sci. 2016, 20, 1147–1159. [Google Scholar] [CrossRef] [Green Version]
  25. García-Gusano, D.; Garraín, D.; Herrera, I.; Cabal, H.; Lechón, Y. Life Cycle Assessment of applying CO2 post-combustion capture to the Spanish cement production. J. Clean. Prod. 2015, 104, 328–338. [Google Scholar] [CrossRef]
  26. Mack-Vergara, Y.L.; Vanderley, M.J. Life cycle water inventory in concrete production—A review. Resour. Conservat. Recycl. 2017, 122, 227–250. [Google Scholar] [CrossRef]
  27. Halasah, S.A.; Pearlmutter, D.; Feuermann, D. Field installation versus local integration of photovoltaic systems and their effect on energy evaluation metrics. Energ. Pol. 2013, 52, 462–471. [Google Scholar] [CrossRef]
  28. Pushkar, S.; Verbitsky, O. Life-Cycle Assessment of the Energy Code for Office Buildings Using the Prescriptive Approach in Israel. In Proceedings of the International Conference on Sustainable Infrastructure 2017 (ASCE) Methodology, New York, NY, USA, 26–28 October 2017; pp. 207–217. [Google Scholar] [CrossRef]
Figure 1. Flat and sculptured tiles: fur (F), cavities (CV), bumps (B), cacti (CC), and sponges (S).
Buildings 12 00165 g001
Figure 2. Typical residential building.
Buildings 12 00165 g002
Figure 3. F1 sculptured tiles: damage and benefit impacts. I: CEM I Pdelta; II: CEM II Pdelta; III: 2020 OEdelta; IV: 2025 OEdelta. Evaluation was performed with ReCiPe2016 midpoint method, hierarchist (H) option.
Buildings 12 00165 g003
Figure 4. F1 sculptured tiles: damage and benefit impacts. A: CEM I Pdelta and 2020 OEdelta; B: CEM II Pdelta and 2020 OEdelta; C: CEM I Pdelta and 2025 OEdelta; D: CEM II Pdelta and 2025 OEdelta. Dotted line: total Pdelta + OEdelta. Evaluation was performed with ReCiPe2016 midpoint method, hierarchist (H) option.
Buildings 12 00165 g004aBuildings 12 00165 g004b
Figure 5. F group sculptured tiles. Production (P) stage: environmental damage of CEM I and CEM II Pdelta of F1–F5. Evaluation was performed with ReCiPe2016 endpoint single-score method using individualist/average (I/A), hierarchist/average (H/A), and egalitarian/average (E/A) options.
Buildings 12 00165 g005
Figure 6. Group F sculptured tiles. Operational energy (OE) stage: environmental benefit of 2020 and 2025 OEdelta of F1–F5. Evaluation was performed with ReCiPe2016 endpoint single-score method using individualist/average (I/A), hierarchist/average (H/A), and egalitarian/average (E/A) options.
Buildings 12 00165 g006
Figure 7. Group F sculptured tiles. Total P + OE stage: environmental damage/benefit of total Pdelta + OEdelta of F1–F5. (a) CEM I + 2020: coal 31%, natural gas 56%, and PV 13%, (b) CEM I + 2025: coal 8%, natural gas 57%, and PV 35%, (c) CEM II + 2020: coal 31%, natural gas 56%, and PV 13%, and (d) CEM II + 2025: coal 8%, natural gas 57%, and PV 35%. Evaluation was performed with ReCiPe2016 endpoint single-score method using individualist/average (I/A), hierarchist/average (H/A), and egalitarian/average (E/A) options.
Buildings 12 00165 g007aBuildings 12 00165 g007b
Table 1. Flat tiles (0.025 × 0.1 × 0.1 m3) and sculptured tiles (0.075 × 0.1 × 0.1 m3): material volume and overall heat transfer coefficients (U-values) (based on Hershcovich et al. [9]).
TileVolume (cm3)U-Value (W/m2K)TileVolume (cm3)U-Value (W/m2K)TileVolume (cm3)U-Value (W/m2K)TileVolume (cm3)U-Value (W/m2K)TileVolume (cm3)U-Value (W/m2K)
Flat2501.07CV16420.61B15380.62CC16900.63S16110.63
F14070.58CV26600.62B25200.61CC27020.63S25690.62
F25080.58CV37200.62B34600.63CC36500.63S35560.61
F34970.57CV46350.61B45450.62CC46900.63S46250.61
F44950.57CV57120.62B54680.62CC54350.57S55430.61
F54860.56CV66710.62B65090.59CC66080.63S66370.61
Table 2. Main settings of studied typical residential building.
ParameterSetting
Location-Tel Aviv
Structure (9 stories)Typical floor655.18 m2
LoadsPeople4 to 8, according to apartment size
Constant1 to 0.5 W/m2, according to apartment size
Non-constant8 to 4 W/m2, according to apartment size
Lighting-5 W/m2
Mechanical systemIdeal system heating/cooling load calculation
SetpointHeating20 °C
Cooling24 °C
Infiltration-1 ach
Seasons-All
Table 3. Building components with composite materials.
ComponentExternal Wall Covering
Flat TilesSculptured Tiles
Composite Materials (Thickness (m))
RoofBitumen (0.05 m), light concrete (0.05 m), polystyrene (0.04 m), concrete (0.14 m), lime–cement mortar (0.02 m)
Ground floorCement mortar (0.025 m), concrete (0.14 m), polystyrene (0.04 m), light concrete (0.05 m), sand (0.1 m), cement mortar (0.025), marble tile (0.04 m)
Internal floor Cement mortar (0.025 m), concrete (0.15 m), cement mortar (0.025 m), ceramic tile (0.015 m)
Interior wallsCement mortar (0.025 m), concrete block (0.10 m), cement mortar (0.025 m)
Exterior wallsFlat tiles (cement mortar) (0.025 m) 1,Sculptured tiles (cement mortar) (0.075 m) 1,
concrete (0.15 m),concrete (0.15 m),
polystyrene (0.045 m),polystyrene (0.045 m),
Carton–gypsum boards (0.012 m)Carton–gypsum boards (0.012 m)
Window area29 m2/apartment
Window typeSingle Glazing
ShadingExternal Blinds
1 Flat and sculptured tiles were modeled with U-values listed in Table 1.
Table 4. Pdelta and OEdelta: data input from ecoinvent v3.2 database (SimaPro v9.1, European data [18]).
Materials/EnergyData Source
Pdelta-
SandSand, at mine/CH 3
Cement 1Portland calcareous cement, at plant/CH 3
WaterTap water, at user/CH 3
OEdelta-
Electricity 2Electricity, hard coal, at power plant/ES 4
Electricity, natural gas, at power plant/ES 4
Electricity, PV, at 3 kWp flat roof installation, multi-Si/CH 3
Notes: 1 Cement was modified to present Portland cement with 95% clinker (CEM I) and Portland cement with 65% clinker (CEM II) used in Israel. 2 Electricity was modified to present Israeli electricity sources: 31% coal, 56% natural gas, and 13% PV, used in 2020, and 8% coal, 57% natural gas, and 35% PV, planned for 2025. 3 Switzerland. 4 Spain.
Table 5. Life-cycle impact based on evaluation of Pdelta and OEdelta of sculptured tiles (ReCiPe2016, hierarchist perspective [18]).
Materials/EnergyGWP
(kg CO2 eq)
TA
(kg SO2 eq)
WC
(m3)
IR
(kBq Co-60 eq)
Pdelta (1 kg)
Sand0.002420.00001180.260.00179
CEM I0.8730.0009721.460.0639
CEM II0.60.0006781.080.0495
Water0.0001710.0000005460.004480.000294
OEdelta (1 kWh)
Coal1.140.009370.2130.0151
Natural gas0.5190.0002230.0260.00122
PV0.09690.000362.150.0231
20200.6520.003060.2660.00733
20250.410.0009620.5320.0072
Table 6. Residential-type building: total heating and cooling energy assessment.
TileOE
(kWh/m2∙yr)
TileOE
(kWh/m2∙yr)
TileOE
(kWh/m2∙yr)
TileOE
(kWh/m2∙yr)
TileOE
(kWh/m2∙yr)
Flat18.57CV117.94B117.95CC117.95S117.95
F117.92CV217.94B217.94CC217.95S217.95
F217.92CV317.95B317.95CC317.95S317.93
F317.91CV417.94B417.95CC417.95S417.94
F417.91CV517.95B517.95CC517.91S517.93
F517.91CV617.95B617.92CC617.95S617.94
Table 7. Quantity of surplus material for production delta (Pdelta; kg) and saved energy for operational energy delta (OEdelta; kWh/whole building∙50 yr) for exterior sculptured tile compared to flat tile covering for typical 9-story residential building.
TilePdeltaOEdeltaTilePdeltaOEdeltaTilePdeltaOEdeltaTilePdeltaOEdeltaTilePdeltaOEdelta
Flat--CV1261,968−187,585B1192,780−185,421CC1294,231−183,854S1241,285−183,854
F1104,881−194,150CV2274,256−186,373B2180,881−188,401CC2302,498−183,854S2213,465−184,636
F2172,521−193,440CV3314,205−184,636B3140,544−183,466CC3267,500−184,245S3204,049−188,817
F3165,208−195,259CV4257,335−187,179B4197,415−184,636CC4294,231−183,466S4250,701−187,585
F4163,710−195,285CV5308,695−184,636B5146,055−185,421CC5123,601−195,259S5196,079−188,817
F5157,632−195,110CV6281,632−185,421B6173,116−191,973CC6239,274−183,080S6258,669−186,776
Table 8. Groups CV, B, CC, and S sculptured tiles. Total P + OE stage: environmental damage/benefit of Pdelta + OEdelta. Evaluation was performed with ReCiPe2016 endpoint single-score method using individualist/average (I/A), hierarchist/average (H/A), and egalitarian/average (E/A) options.
TileI/AH/AE/ATileI/AH/AE/ATileI/AH/AE/ATileI/AH/AE/A
CEM I Pdelta + 2020 OEdelta
CV17380150−6000B13750−1680−7930CC17380150−6000S15490−780−6960
CV27680300−5850B23280−1970−8340CC27680300−5850S24490−1300−7560
CV36410−330−6580B31940−2560−8770CC36410−330−6580S34090−1570−7930
CV47380160−6000B43930−1580−7850CC47380160−6000S45760−720−7090
CV51150−3540−9770B52100−2510−8770CC51150−3540−9770S53810−1720−8070
CV65430−800−6990B62950−2210−8680CC65430−800−6990S66060−560−6840
CEM II Pdelta + 2020 OEdelta
CV13850−1730−8240B12060−2570−8920CC14770−1200−7520S13370−1900−8200
CV24190−1540−7980B21690−2810−9280CC24990−1090−7410S22610−2280−8660
CV35280−960−7360B3700−3210−9490CC34050−1560−7960S32290−2520−8980
CV43740−1780−8190B42190−2490−8860CC44770−1190−7520S43550−1870−8380
CV55140−1030−7440B5820−3190−9520CC560−4110−10410S52080−2620−9080
CV64410−1410−7780B61420−3010−9580CC63330−1900−8230S63780−1750−8180
CEM I Pdelta + 2025 OEdelta
CV176702260−1310B152401070−2490CC188602880−610S169701950−1570
CV281202500−1050B24800820−2800CC291603030−460S259801440−2100
CV395503230−280B33420170−3370CC378902410−1100S356201230−2400
CV475102190−1390B454201160−2390CC488602890−600S472802060−1520
CV593503130−380B53590240−3330CC52720−280−4050S553401080−2540
CV683802640−890B64500640−3050CC669001920−1580S675602210−1340
CEM II Pdelta + 2025 OEdelta
CV153701050−2670B13550180−3480CC162501530−2130S14850830−2810
CV257001230−2470B23210−20−3740CC264701640−2020S24100460−3200
CV367701780−1900B32180−480−4090CC355301180−2480S33820280−3450
CV452501000−2710B43680250−3400CC462501540−2120S45070910−2810
CV566301710−1980B52310−440−4080CC51630−850−4690S53610180−3550
CV659001340−2340B62970−160−3950CC64800820−2820S652801020−2680
Note: “−“ denotes environmental benefit, “+” denotes environmental damage.
Publisher’s Note: MDPI stays neutral with regard to jurisdictional claims in published maps and institutional affiliations.

