Abstract
Personal thermal preference information can help to create a building environment that satisfies all staff, instead of an environment that only satisfies most people, to enhance personal thermal comfort. Research has shown that thermal preference can be predicted using parameters that are based on various local body parts, but the selected body parts are often different. Using too many body parts for the measurements leads to high costs, while using too few body parts results in large errors. In this study, 19 adult subjects (8 females and 11 males) were recruited, their overall and local thermal preferences were surveyed, and the skin temperature of seven body parts were measured. A machine learning algorithm, random forest, was employed to analyse the contributions of different body parts. Three criteria (the best combination, fewest combination, and common combinations) were employed to select body parts to use to establish thermal preference models for individuals and groups. The results show that the prediction power of these combinations reached 0.91 ± 0.07 (accuracy), 0.75 ± 0.16 (Cohen’s kappa), and 0.87 ± 0.09 (AUC) when using 2–8 body parts. The common combinations are recommended for their balance of their prediction power and the number of local body parts involved. This study offers a reference for efficient and economic measurements for thermal comfort research in building environments.
1. Introduction
Energy-saving heating, ventilation, and air conditioning (HVAC) systems are vital to reduce the total energy consumption of a building [1,2]. The main task of an HVAC system is to create a comfortable indoor environment to guarantee health and productivity [3,4,5]. However, the thermal comfort models used for existing standards [6,7,8], such as the predicted mean vote (PMV) model [9] and the adaptive comfort model [10,11,12,13,14], are used to predict group-averaged thermal comfort. Owing to the individual differences between subjects, personal thermal comfort requirements may not be satisfied under group-averaged prediction and building environment control [14,15,16,17]. Even when a building is operated in thermally neutral conditions based on PMV or the adaptive model, nearly one fifth of the occupants felt cold or hot [18]. Thus, it is important to achieve more accurate thermal comfort predictions for individuals to achieve a balanced thermal environment.
With the advances in data-driven approaches, such as machine learning algorithms, personal thermal comfort models have been developed to predict individual thermal comfort [19,20,21,22,23,24,25,26,27,28,29,30,31,32,33,34,35]. The prediction accuracy of data-driven models far exceeds that of traditional models, often reaching over 80% [20,25,27,28,29,30,31,32,33,34]. The input parameters of these personal thermal comfort models usually include physiological parameters (skin temperature, heart rate, etc.) [23,24,25,26,27,28,29,30,31,32,33,36,37,38], environmental parameters (air temperature, relative humidity, air velocity, CO2 concentration, etc.) [24,28,29,34,36], and clothing insulation [38]. Local skin temperature has been used in many studies to predict personal thermal comfort because of its high correlation with the heat balance state of the human body. Aryal et al. [23] found that the prediction accuracy of a model incorporating skin temperature at the wrist and environmental parameters increased by 3–5% compared to models that only used environmental parameters. Chaudhuri et al. [27] only used hand skin temperature and its gradient as factors to predict overall thermal sensation and the results showed an accuracy of 87%. As accuracy only reflects prediction power without considering the imbalance of thermal preference, Liu et al. [24] suggested that Cohen’s kappa and AUC be employed to judge thermal comfort models. They measured the skin temperature at the wrist and ankle, heart rate, wrist acceleration, air temperature around the upper clothes and lower clothes, and environmental parameters. The results showed that prediction powers of 43%, 77%, and 0.78 (Cohen’s kappa, accuracy, and the area under the receiver operating characteristic curve (AUC), respectively) could be reached and that the prediction accuracy for non-neutral preferences (cooler, warmer) was higher than that of the PMV model.
Random forest (RF) is an improved decision-making tool, compared to a single decision tree, and can avoid overfitting. RF is an ensemble of tree-structured classifiers that aggregate and weigh the results of multiple decision trees. RF has been widely applied to predict thermal comfort or sensation using environmental parameters and personal subjective votes.
Chaudhuri et al. [39] used RF to establish thermal comfort models for different genders. With seven physiological parameters for males and six for females, the precision for discomfort and comfort were 0.853 (male) and 0.857 (female) and 1.000 (male) and 0.979 female, respectively.
Liu et. al. [24] compared the predictive power of different machine learning algorithms and found that RF, one of the most frequently used algorithms, had a high to medium prediction power of 25.71%, 72.21%, and 0.74% (Cohen’s kappa, accuracy, and AUC, respectively).
Wang et al. [36] established a thermal comfort model especially designed for older people using RF. The prediction accuracy of the overall thermal sensation reached 76.7% using combinations of forehead, lower arm, leg, chest, and back skin temperatures.
Jia et al. [40] predicted the thermal comfort and thermal sensation of 20 younger individuals with the RF algorithm using five facial skin temperatures. The average accuracy was 95.1 ± 7.1%.
However, the selection of body parts for local skin temperature measurement was different in the different studies. As there is not a selection criterion for body parts, researchers usually have to measure as many body parts as possible [26,32,36,37], or at least several body parts [23,24,25,27,30,31,38], and then filter the data. Including too many body parts leads to over-complicated measurements and higher costs; however, if an insufficient number of body parts are considered, large errors may occur due to over-simplification. Moreover, skin temperature usually requires a certain period of time to reach a steady state [31]. Zhou et al. [41] reported that at least 0.5 h was required to stabilise skin temperature. In daily life, people may move between different thermal conditions within a short period, making it even more difficult to use skin temperature to predict overall thermal comfort.
Unlike skin temperature, the thermal preference of local body parts is directly related to overall thermal comfort and can be used to predict the optimal management of the HVAC system needed to create a comfortable space [42]. If we knew which body part(s) most strongly affect overall thermal comfort, it would be possible to adjust overall thermal comfort through local thermal adjustments. When Zhang [43] established a thermal sensation model, the chest, back, and pelvis were considered the dominant body parts affecting overall thermal sensation and the thermal sensation group (from −4 (extremely cold) to 4 (extremely hot)) contained more body parts that governed overall thermal sensation. Similarly, if the effect of local thermal preferences on overall thermal preference was clear, we could determine which body part(s) make the greatest contribution to overall thermal preference. It could also provide a reference for suitable skin temperature measurement locations.
As described in a review [35], the use of thermal preference was the second most frequent evaluation indicator and the most frequent energy-saving method used in practice. The thermal sensation and thermal comfort votes record the environmental parameters at which people feel hot or cold and comfortable or not, respectively. In ISO 10551, they are explained as evaluative judgements on personal thermal states after the questions “how are you feeling now?” and “do you find this …?”, respectively. Thermal preferences are used in assessment and offer a “value” judgement from the subjects. They compare how the subject is to how the subject would like to be [44]. Ideally, outside of the thermal neutrality (thermal sensation) and thermal comfort zones, the thermal preference of subjects can help to bring people back to thermal neutrality and ensure thermal comfort. For example, a man who feels extremely hot (thermal sensation) and uncomfortable (thermal comfort) may prefer a cooler environment (thermal preference). However, thermal preference is also chosen based on the subject’s exact context. Sometimes, people would prefer to be slightly cooler on a hot day or slightly warmer on a cold day. Thus, ISO 10551 suggests the use of a combination of scales integrated into a questionnaire. In addition, in the ASHRAE Standard 55 [7], an evaluation method based on survey results suggests that a thermal sensation vote of between −1.5 and 1.5 would be acceptably comfortable. However, in recent scale project research [45], the authors found that the distance between different thermal sensation or thermal comfort levels is not equal. Moreover, the climate type of the subject’s living area can result in the subject’s tendency to feel comfortable on the non-neutral side of thermal sensation. Compared to thermal sensation and thermal comfort, thermal preference can be used worldwide to describe whether the current surrounding conditions should be changed and the direction in which the HVAC system should be changed. Moreover, personal thermal adjustments, such as desk fans and heating/cooling pads, could be employed to relieve negative factors for individual thermal sensation and comfort.
In this study, we aimed to quantitatively optimise the selection of body parts for skin temperature measurement to estimate personal thermal comfort, which would solve the lack of criteria for body part selection. To achieve this, body part selection in a personal thermal preference model for thermal preference prediction was investigated. The thermal preferences of 13 local body parts of the subjects were surveyed and used to predict their overall thermal preferences. If successful, researchers would be able to select the number of body parts and add specific parts as factors to predict overall thermal preference after selecting and combining the relevant data. This study can be used as a reference for the location of body part measurements for personal thermal comfort estimation.
2. Materials and Methods
In this study, we focused on the selection of local body areas, the thermal preferences of which could be used to predict overall thermal preference. Local body parts are usually employed to predict thermal preference, but there is currently no consensus on how many nor on which parts can best represent overall thermal preference. In this study, we developed a personal thermal preference model to solve this problem by surveying local and overall thermal preferences. The thermal sensations of 13 local body parts and the skin temperature of seven local body parts were recorded to study the relationship between local skin temperature, local thermal sensation, and local thermal preference. An RF machine learning algorithm was employed to train the personal thermal preference model for each subject.
2.1. Subjects
Considering the number of iButtons available and the duration of the test, we recruited six subjects (ID: W1–W6; five males and one female) living in Shanghai, but W4 (male) did not complete the experiment. Thus, the votes and metric data of five subjects were analysed to develop personal thermal preference models for each individual and to predict their overall thermal preference. The average age of the remaining subjects was 25 ± 3 years old, and the average BMI was 21.04 ± 2.92 kg/m2. The subjects reported no medical treatments nor smoking or drinking habits. Table 1 shows the anthropometric data of the participants.

Table 1.
The anthropometrics of the subjects in the test.
The establishment of models based on only five subjects must raise doubt. To test and validate these models, their prediction results were validated using the votes of a further 14 subjects (IDs marked with “M”; 23 ± 1 years old; BMI: 21.44 ± 2.25 kg/m2). Their personal information is also shown in Table 1.
In this study, all subjects marked with either “W” or “M” were college students living in Shanghai. They all worked on the same campus and had similar identities and daily routines. During the experiment, they spent most of their time in the research group office of the School of Mechanical Engineering and various classrooms on the same campus. All rooms were equipped with HVAC systems.
2.2. Questionnaire
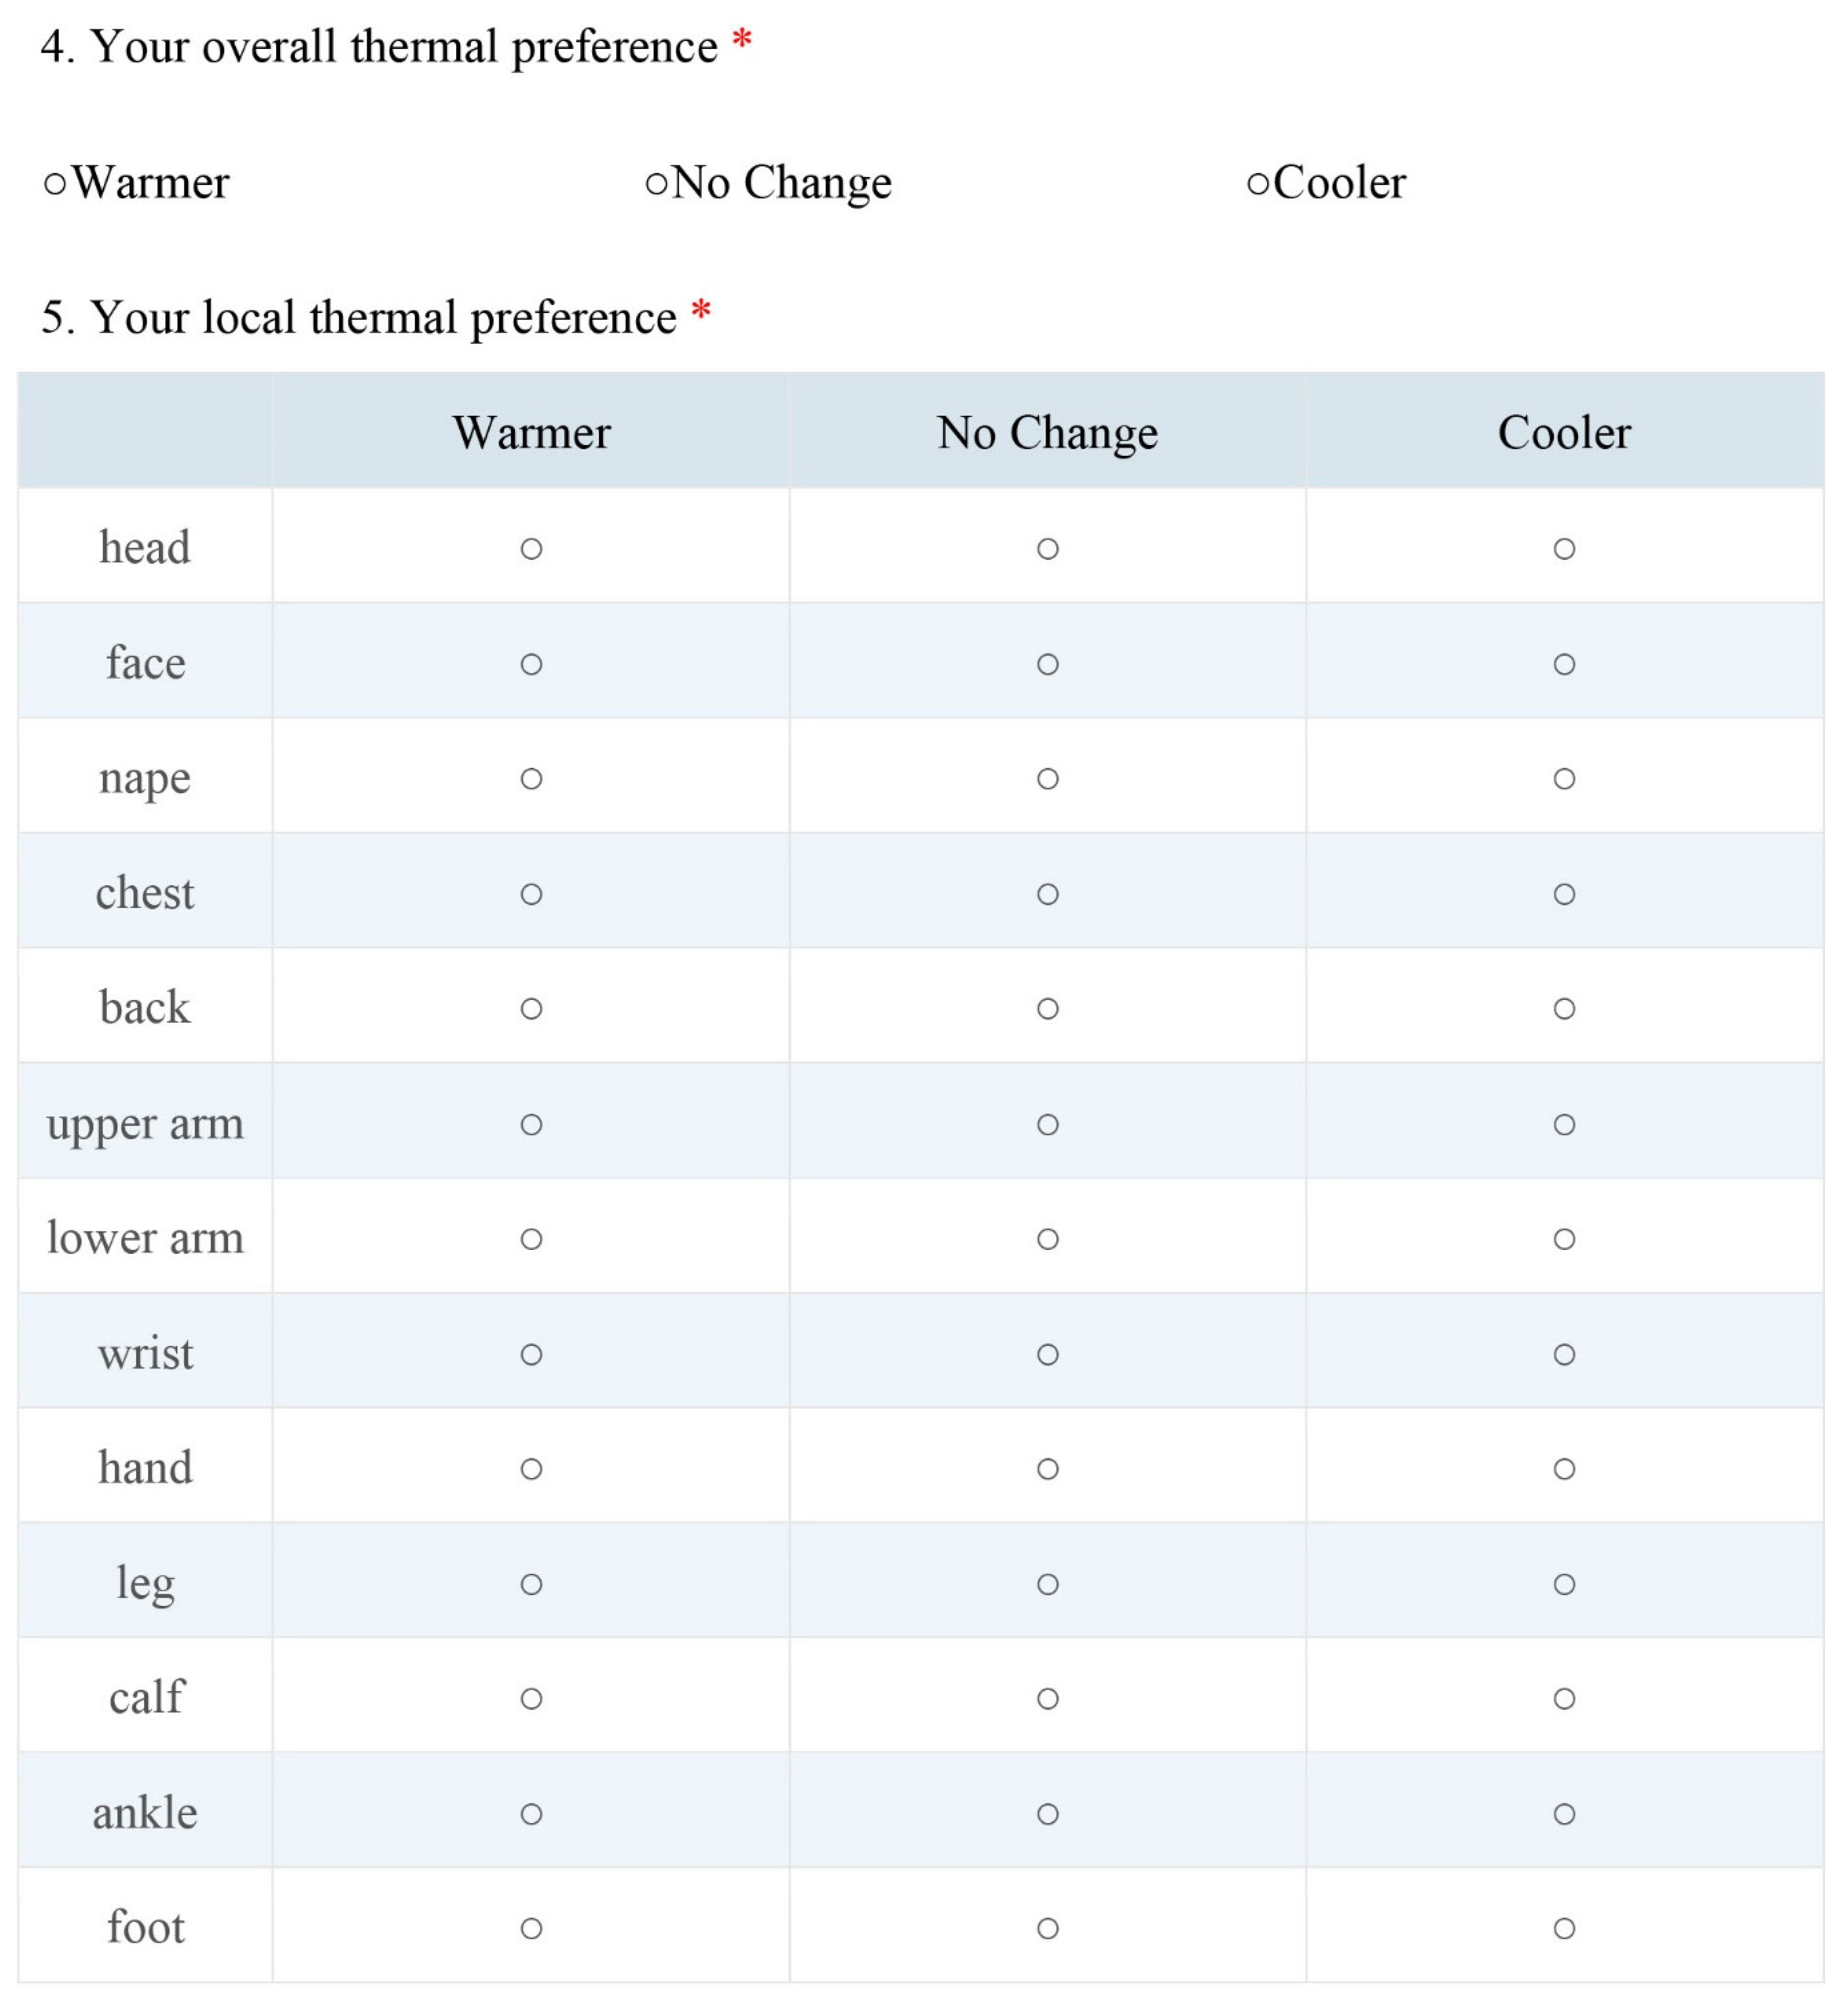
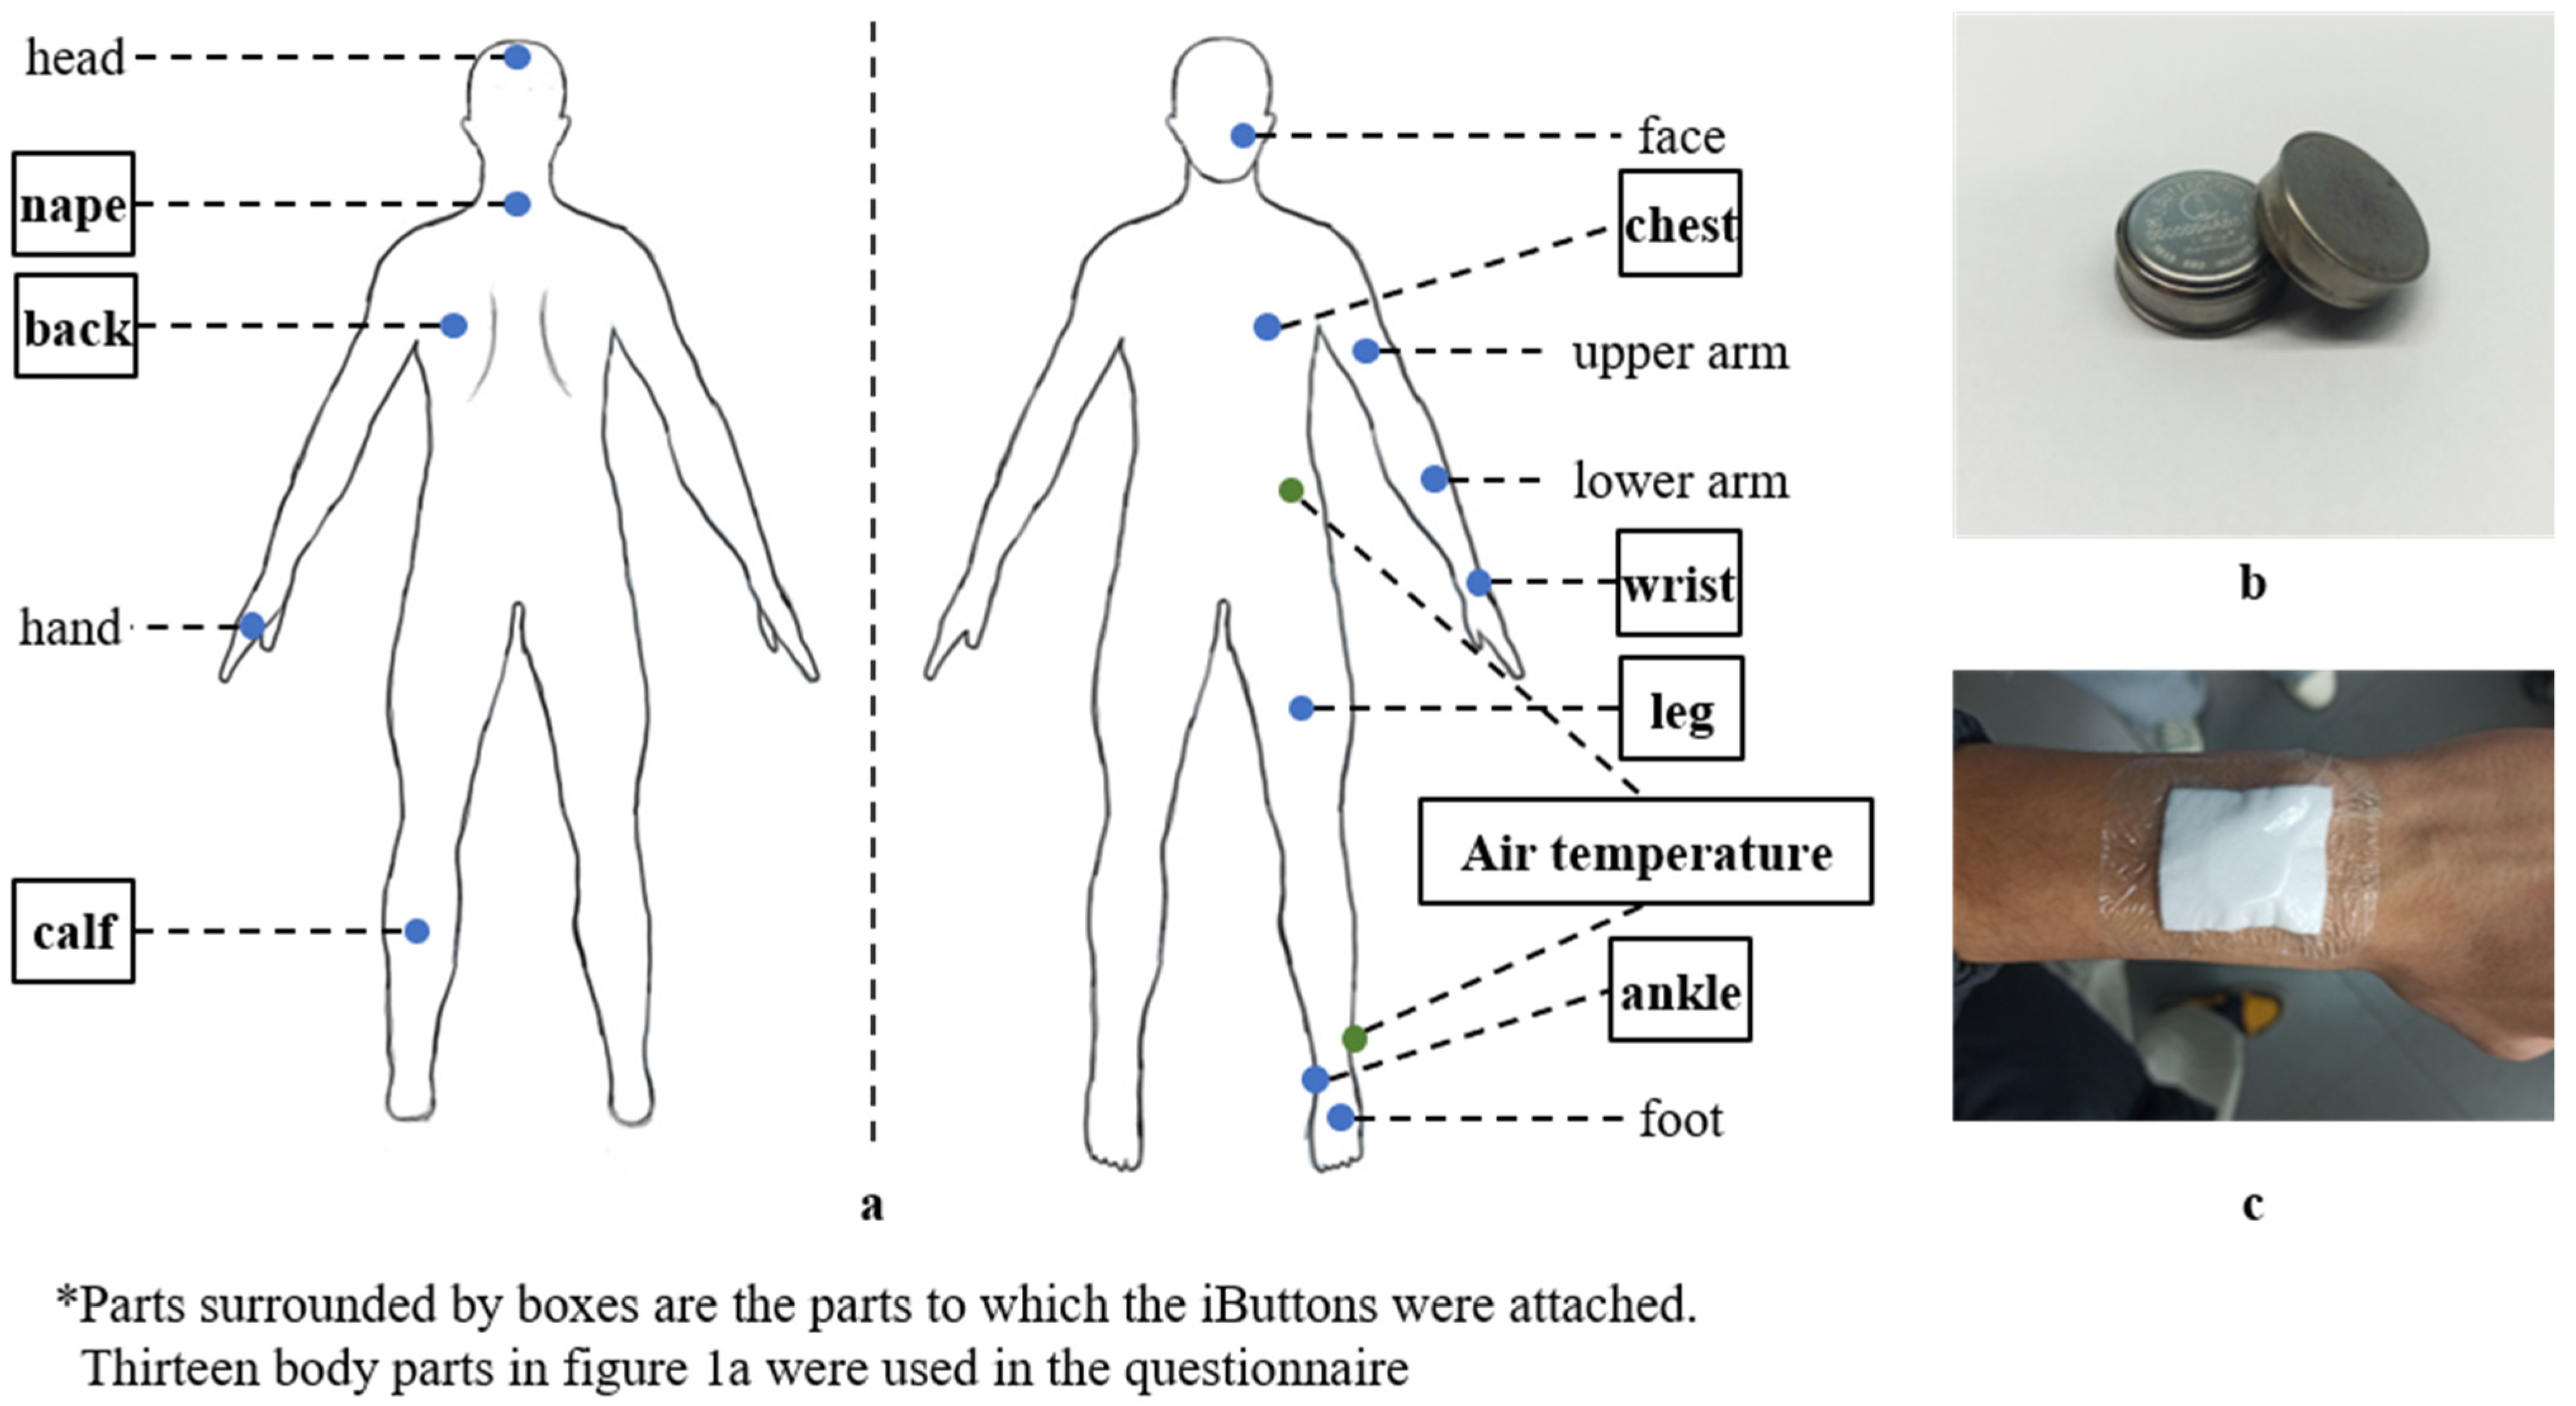
An online questionnaire was used for this study (Appendix A). The questionnaire included: (1) overall thermal sensation (a seven-point scale from −3 (cold) to 3 (hot)) and overall thermal preference (1 (cooler), 0 (no change), and −1 (warmer)); (2) local thermal sensations and the thermal preferences for 13 local body parts. The completion time of each questionnaire was recorded automatically. The 13 local body parts surveyed in the questionnaire are shown in Figure 1a. Subjects W1–W6 were required to fill out 200 questionnaires over 14 days. Subjects M1–M14 were required to fill out more than 150 questionnaires. In a previous study by Liu [24], the Cohen’s kappa, accuracy, and AUC values of an individual did not show dramatic changes after 150 votes. However, as long duration participation would be uncomfortable for the subjects, we set a 14-day/200-questionnaire limit for W1–W6 and a 150-questionnaire limit for M1–M14.
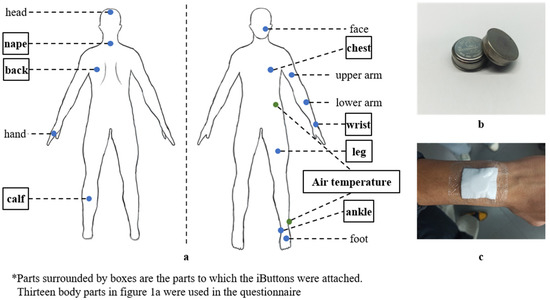
Figure 1.
(a) A diagram of the 13 body parts; (b) iButtons; (c) an iButton attached to the skin.
2.3. Measurement of Skin Temperature
In this study, iButtons (Pyrobutton-L, Opulus, Philadelphia, PA, USA) with an accuracy of 0.2 °C were used for skin temperature measurement. Figure 1a,b shows the sensors and the attachment locations on the body. We only measured the skin temperature of seven of the body parts shown in Figure 1 for several reasons. First, fitting iButtons to the head, face or foot is unsightly and uncomfortable. Second, we measured the skin temperature of the wrist to represent the entire arm. Third, we also did not measure the skin temperature of the hand, as the subjects washed their hands many times a day and this could affect skin temperature measurement. In the first instance, the researchers fitted the iButtons to the participants and showed them the correct location of each iButton. A diagram was also provided before the formal experiment. Subsequent fittings were performed by the subjects themselves. To prevent any inconvenience to the subjects and to avoid losing iButtons, large bandages were used to hold the iButtons in the specific locations (Figure 1c). To record the air temperature around the subjects, we used two more iButtons fixed onto the outside of their clothing using a magnet button. The upper one measured the air temperature around the abdomen and the lower one around the ankle. The frequency of data acquisition was set to 1 min. The subjects attached the iButtons after getting up in the morning or arriving at the office and removed them at the end of their workday.
2.4. Procedure
In this study, a timetable was designed to guide the subjects in filling in an online questionnaire. They filled in the questionnaire for the first time every day after wearing the iButtons for at least half an hour. Thereafter, we sent a message to the subjects once per hour requesting that they fill out the online questionnaire. When leaving or returning to the office, they were encouraged to complete an additional questionnaire to collect various thermal preference and skin temperature data in the surrounding environment. There was no limit to the number of times the questionnaire was filled in, but the testing period for each subject lasted at least two weeks (not necessarily continuously).
Two of the subjects participated in a one-week preliminary test to ensure that the sensors were correctly placed and to adjust the questionnaire and test. The Ethics Review Centre of Tongji University approved the procedure of the experiment (No. 2020tjdx051). All subjects were trained to wear the iButtons and fill in the questionnaire correctly before the experiment. The duration of the daily experiments was not limited. The subjects could stop wearing the iButtons and answering the questionnaire if they were uncomfortable, as long as the experiment was completed over the course of the winter season.
Finally, 1005 samples were collected to analyse the skin temperature of seven body parts and the subjective thermal preference of thirteen body parts. Each subject voted 201 times on average during the entire test period from 17 December 2020 to 7 February 2021. From 19 September 2021 to 2 October 2021, we received 2164 samples to validate the applicability of the established thermal preference models. The combinations selected using the W1–W6 data were applied to the M1–M14 data, and RF was utilised to predict personal overall thermal preferences from the local thermal preferences of the body parts used in these combinations. Based on the prediction results, we obtained the prediction power (values of five metrics mentioned in Section 2.6) of the selected combinations.
2.5. Machine Learning Algorithms
Data cleaning and machine learning were completed using R software (version 4.0.5, 31 March 2021) [46]. RF [24,47] was selected to develop personal thermal preference models based on the data collected. Thermal preference (cooler, no change, warmer) was predicted because of its direct relationship with HVAC system management. Local thermal preferences were used as the inputs to predict the overall thermal preference.
A personal model was designed for each subject based on a data-driven method. In addition, a combined dataset was also trained to predict the group thermal preference. Missing data were deleted during the establishment of the model. Three-fold cross-validation was applied in this study. The dataset was divided into three groups; each group was set as the test set once per session and every group was tested.
2.6. Evaluation Metrics
To evaluate the performance of the developed personal thermal preference models, five metrics were used (accuracy, Cohen’s kappa [48], AUC, precision, and recall). Accuracy is widely used for thermal comfort prediction. However, it has also been confirmed that, due to the imbalance of thermal comfort, the classification of the non-neutral condition cannot be presented by accuracy. To avoid high accuracy resulting from chance, Cohen’s kappa and the AUC were also calculated. The precision and recall of the non-neutral conditions were checked separately. The prediction power was a comprehensive evaluation of the values of these five metrics. Accuracy, precision, and recall were defined as follows:
where TP and TN indicate that the samples are correctly predicted to be positive or negative, respectively, and FP and FN indicate that the samples are falsely predicted to be positive or negative, respectively. P + N represents all the samples. In this study, accuracy was applied to assess the performance of the personal thermal preference models for all preferences (cooler, no change, warmer) and precision was used to judge whether the model predicted each preference correctly.
2.7. Selection of Body Part Combination
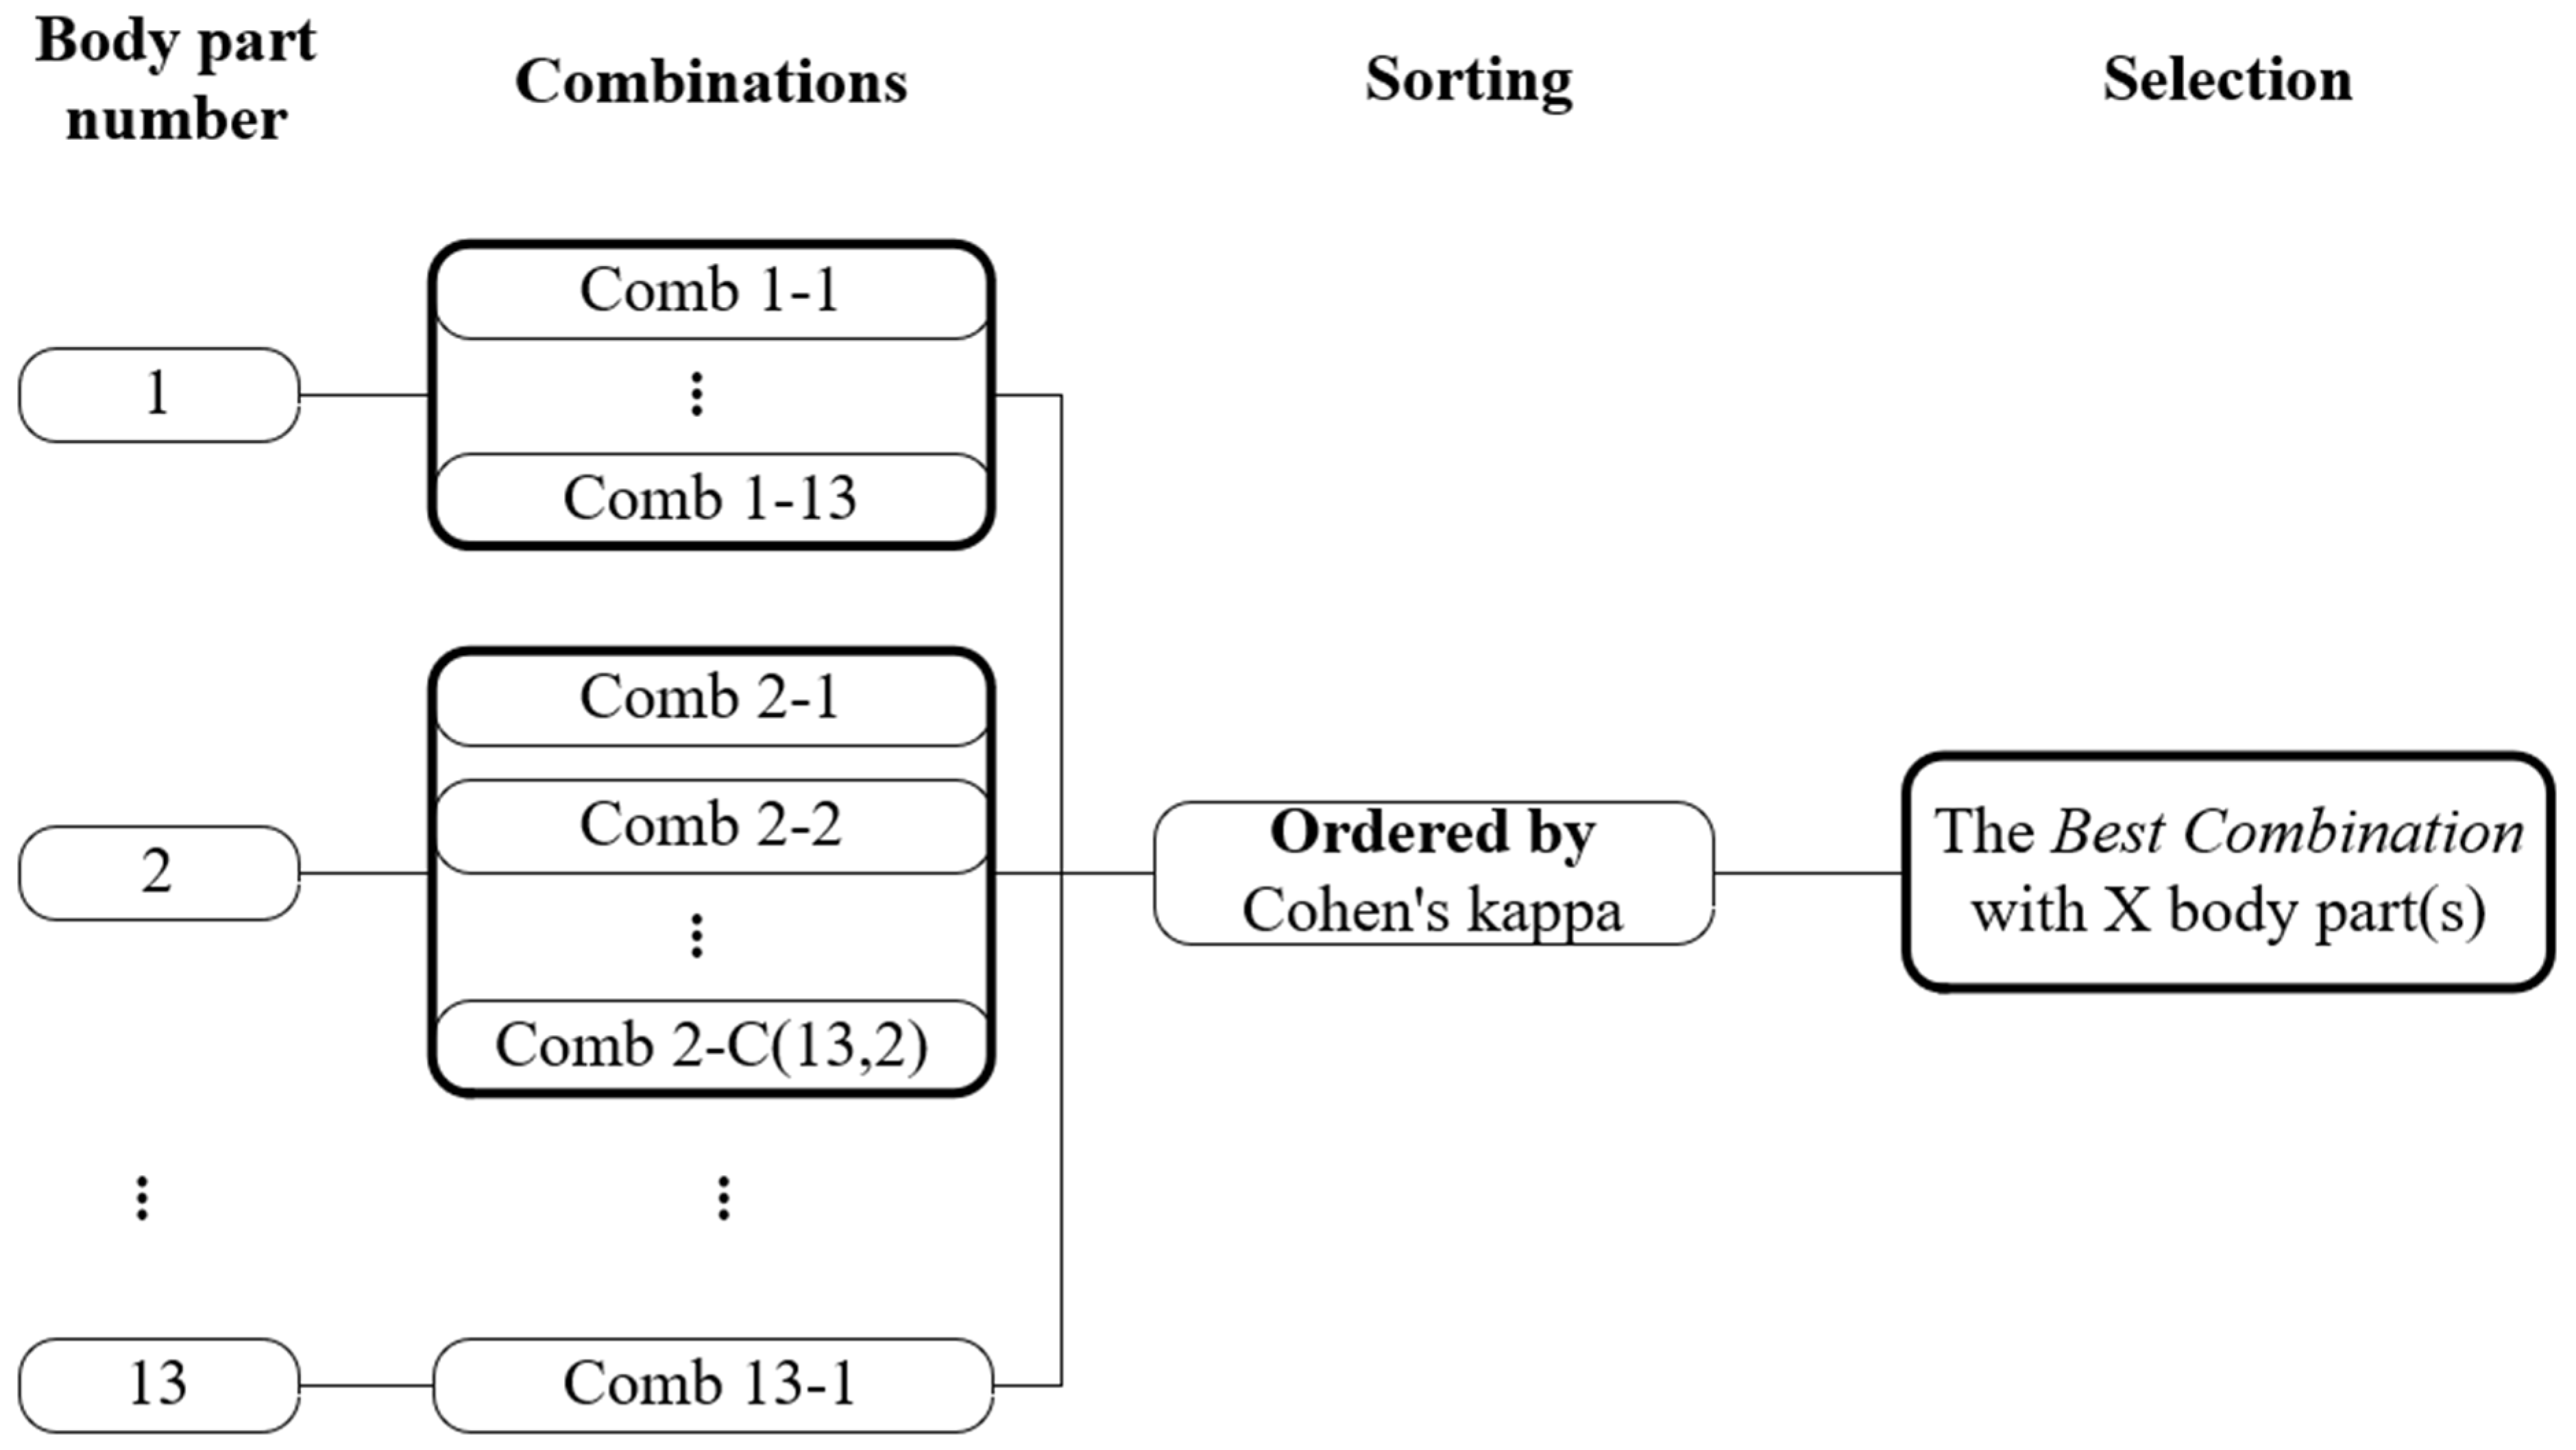
Three combination types were compared in this study. First, the best body part combination (the best combination (BC)) was selected based on the Cohen’s kappa values of each subject. As explained in Figure 2, we sorted the body part combinations according to Cohen’s kappa. The combination with the highest value of Cohen’s kappa was named the BC.

Figure 2.
The method of selection for the best combination.
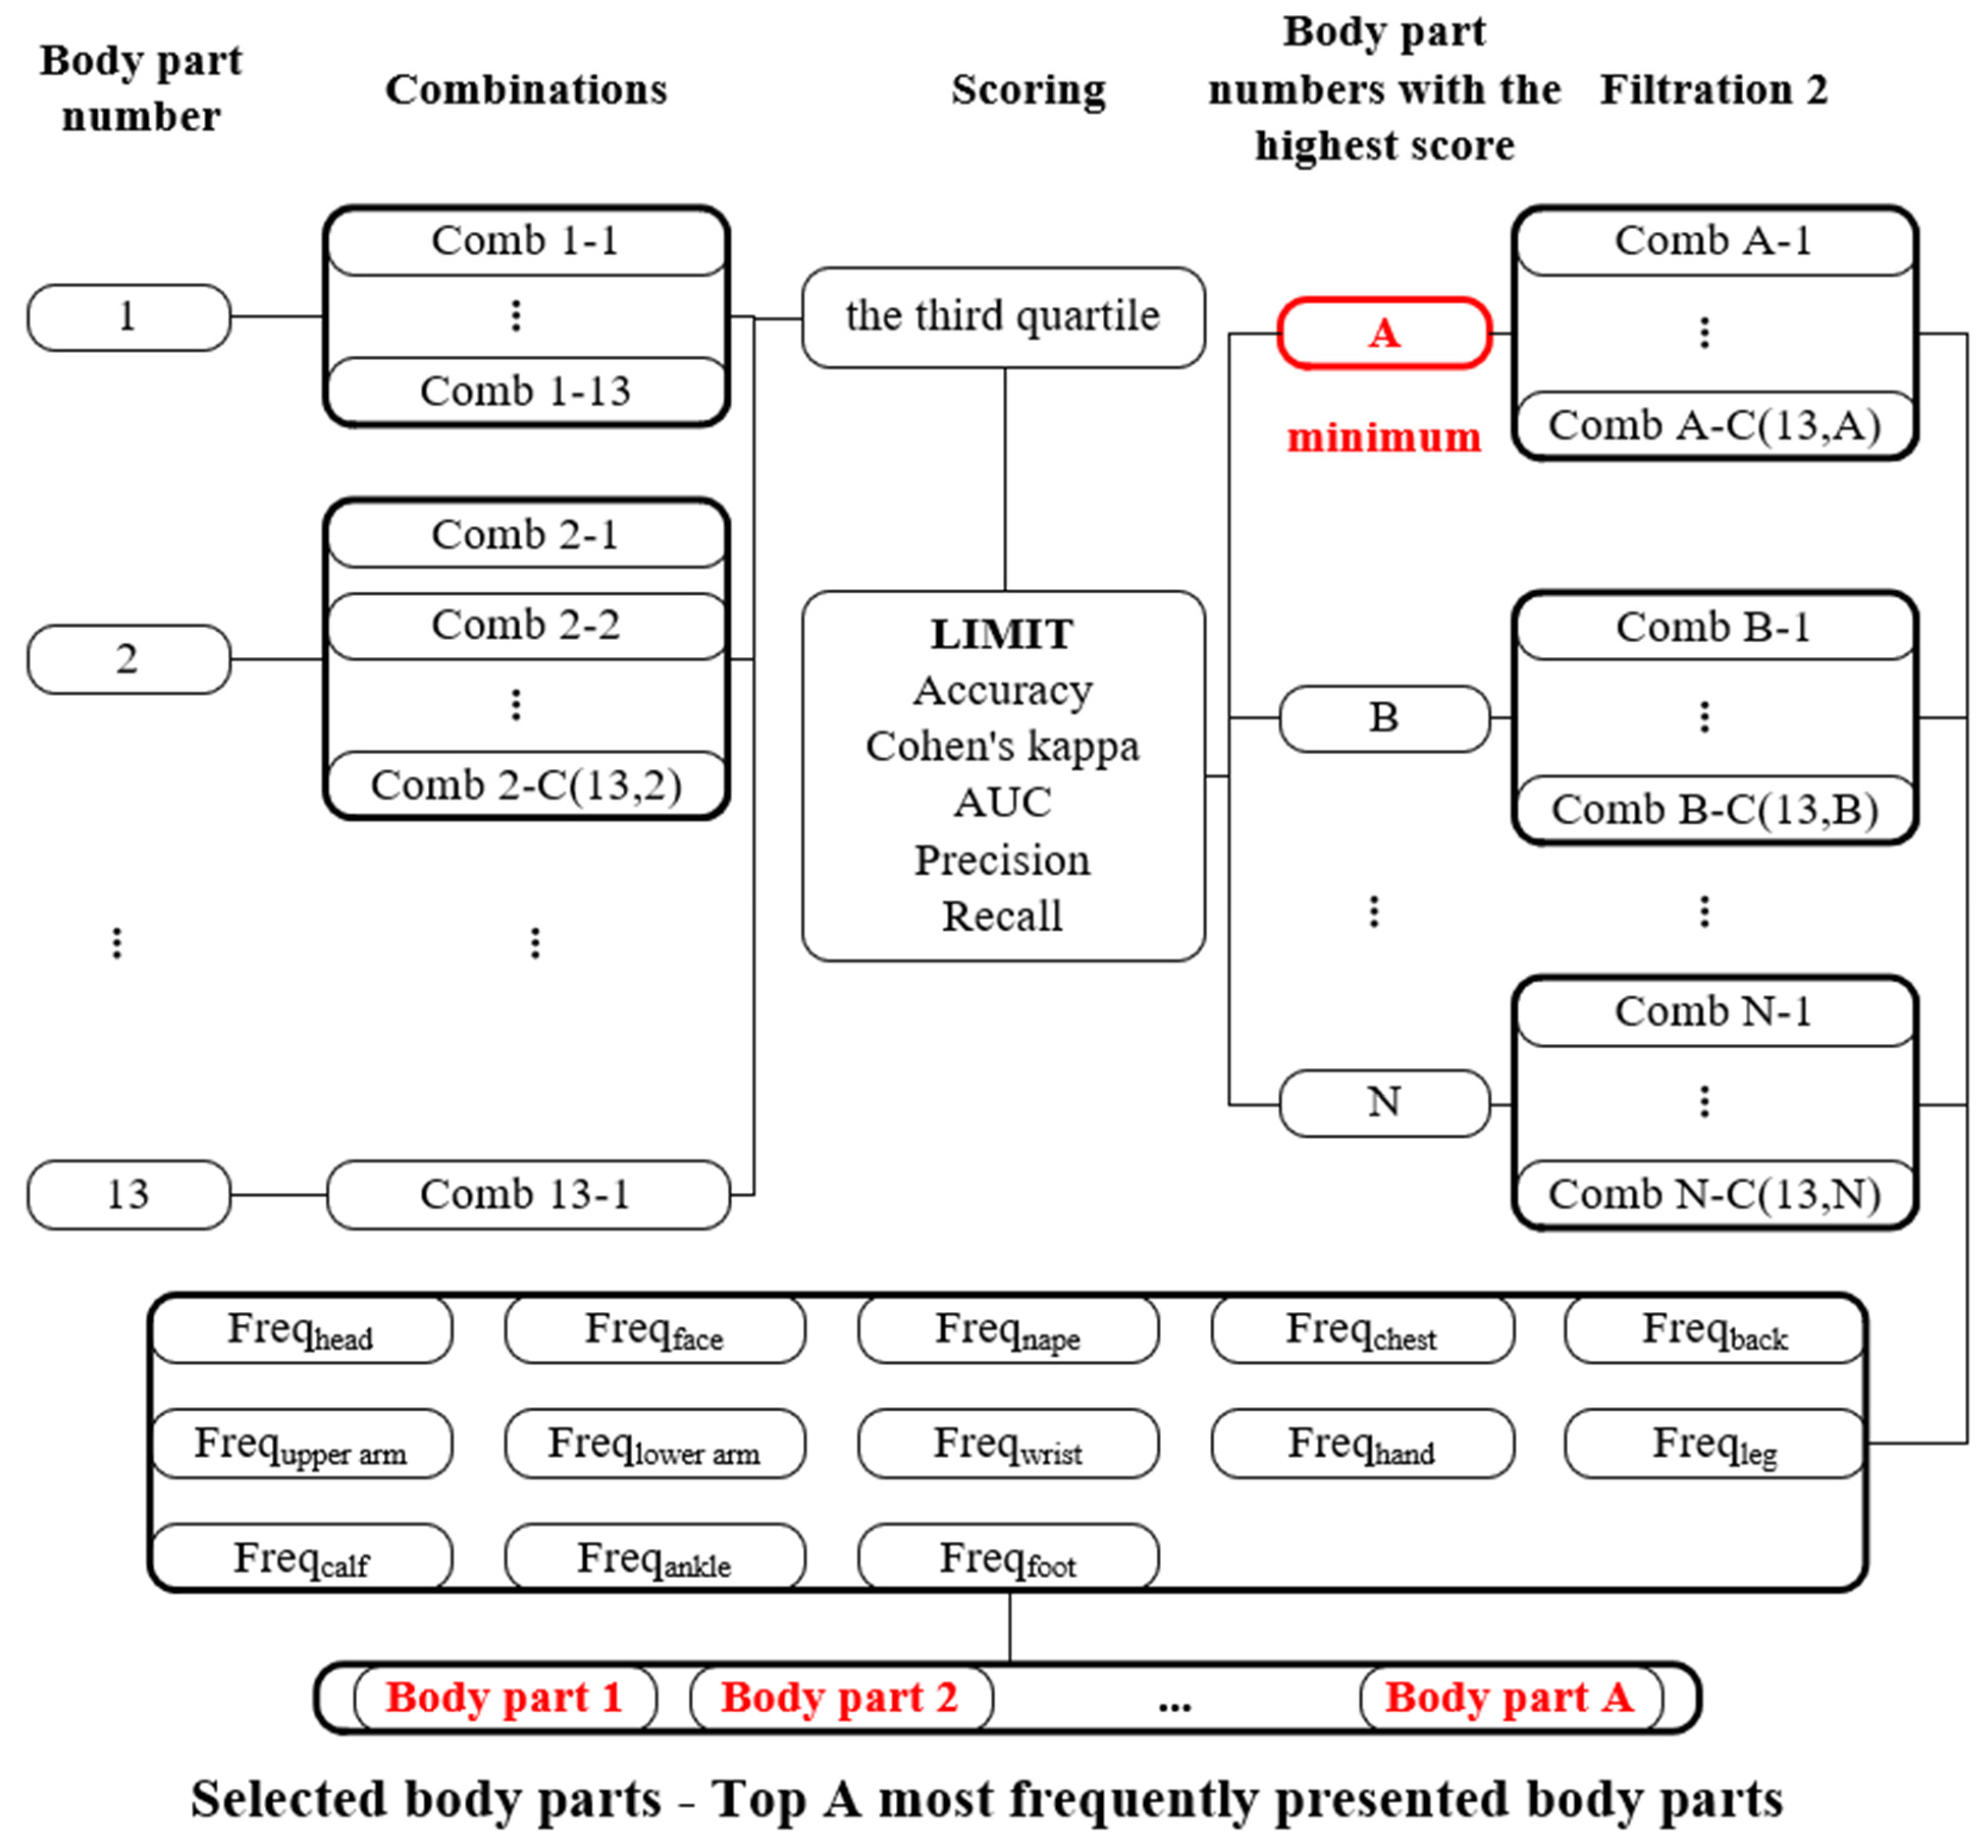
Using fewer body parts provides more effective prediction preparation. Thus, the fewest combination (FC) was selected using the method shown in Figure 3. Limitations were set for each metric (accuracy ≥ 0.80, Cohen’s kappa ≥ 0.60, AUC ≥ 0.85, precision ≥ 0.80, and recall ≥ 0.80). First, we calculated the third quartile of the nine indicators using the same body parts. Then, for combinations with X (X = 1–13) body part(s), a binomial value was assigned according to the set limits; an indicator with a third quartile value exceeding the limit would be marked “1”, otherwise a “0” value was assigned. As nine indicators were used in this study, the ideal score was 9. However, the highest score was sometimes 8 or less. In such cases, the combinations containing the same number of body parts as the highest scored combinations were selected. Accordingly, we could obtain the fewest number “A” of body parts to predict overall thermal preference. To identify the exact parts, all body parts in exact combinations (not only with the corresponding body part number but also with the highest score, because not every combination with the corresponding body part number had the highest score) were analysed for their occurrence frequency. As combinations of five, six, and seven body parts scored an 8 and the other combinations scored a 5, this was taken to mean that combinations with five, six or seven body parts had the highest prediction power. However, the fewer body parts involved, the less data collection work and calculation was needed; thus, five parts (“A” in Figure 3; combinations with six, seven, eight, and other larger numbers of body parts are represented by other letters in alphabetical order) were deemed as sufficient to predict overall thermal preference. Thus, we obtained several detailed combinations of five, six, and seven body parts. Next, the frequencies of the 13 parts presented in these combinations were compared. Finally, the five body parts with the highest appearance frequencies were selected as the predictors of overall thermal preference.
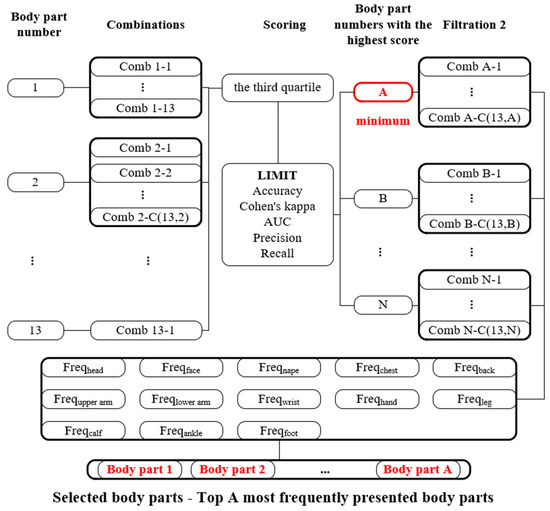
Figure 3.
The method of selection for the fewest combination.
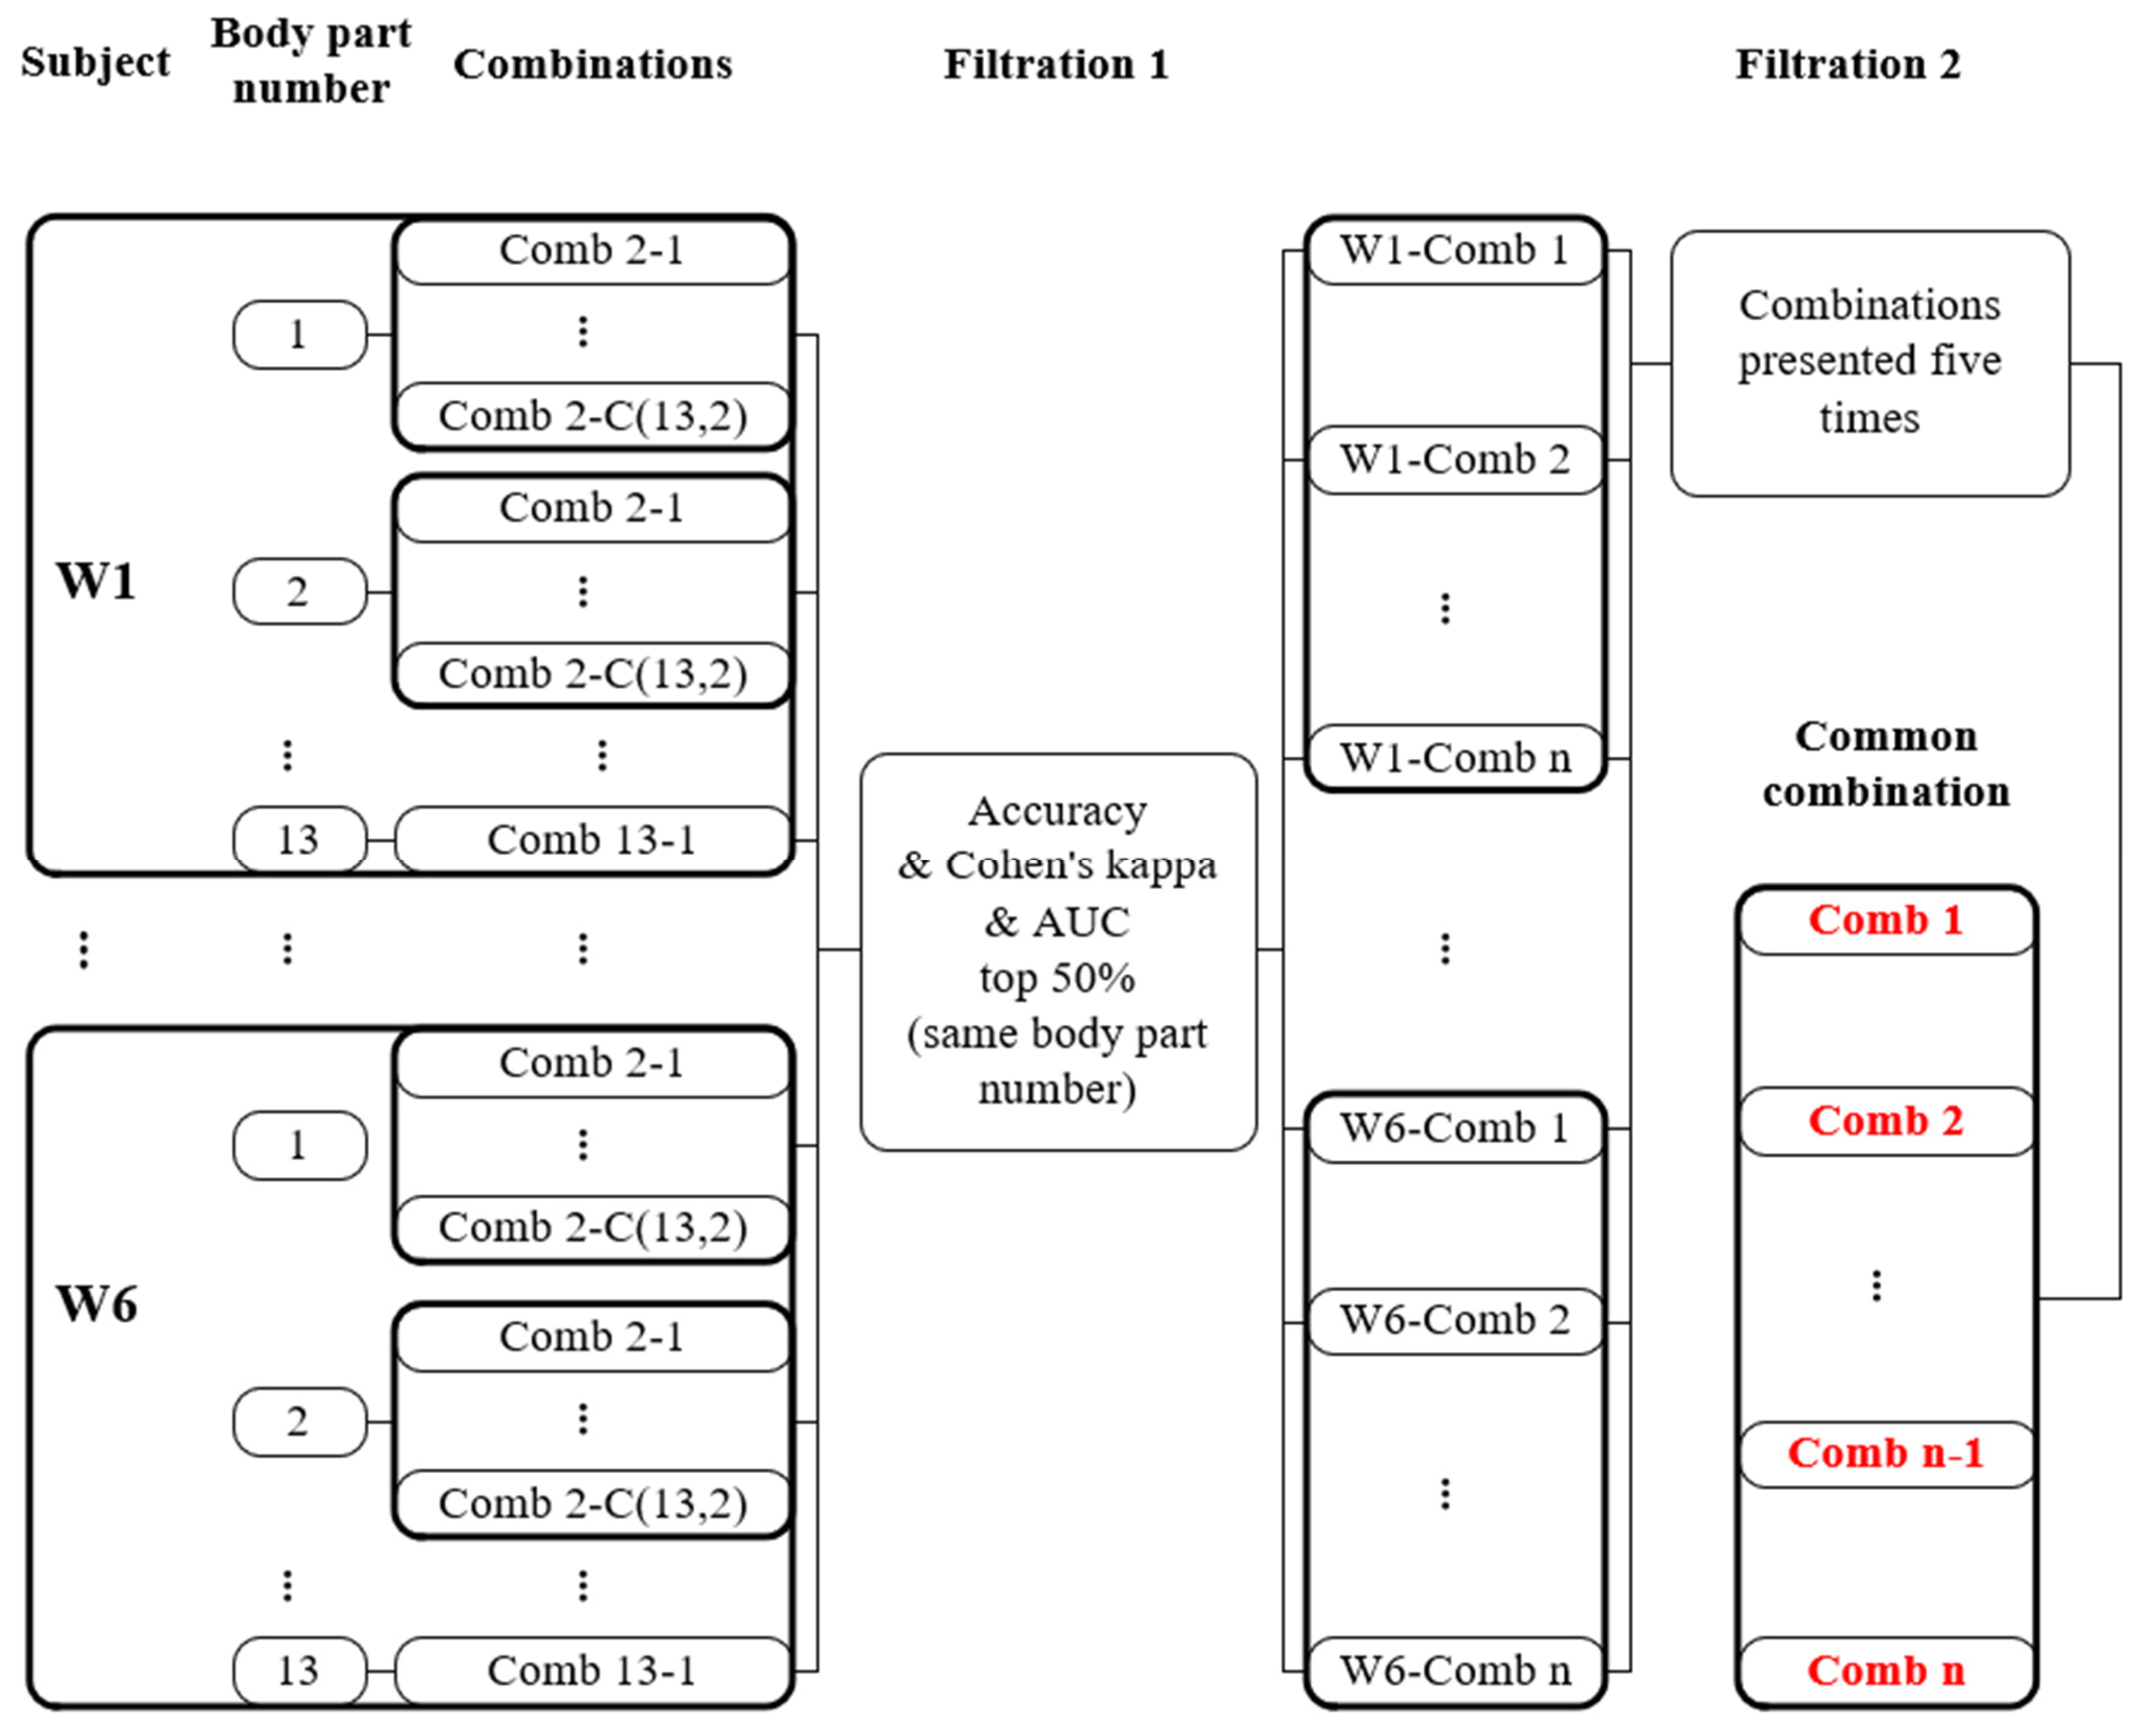
However, BC and FC were both derived from and applied to a single individual, which meant that the work had to be repeated if the prediction was applied to a new individual. To obtain more useful common body part combinations (common combinations (CCs)), we designed the process presented in Figure 4. After collecting the combinations in the top 50% of prediction power (accuracy, Cohen’s kappa, and AUC) out of all combinations with the same number of body parts, the combinations that occurred in every subject’s combination group was selected as the CCs. As more subjects become involved, the CCs may change. This is another reason that we recruited more subjects to validate the models. If the selected CCs were suitable for subjects outside of the training queue, it would mean that they could be used to predict the thermal preferences of individuals with the same characteristics, such as age, living conditions or work environment.
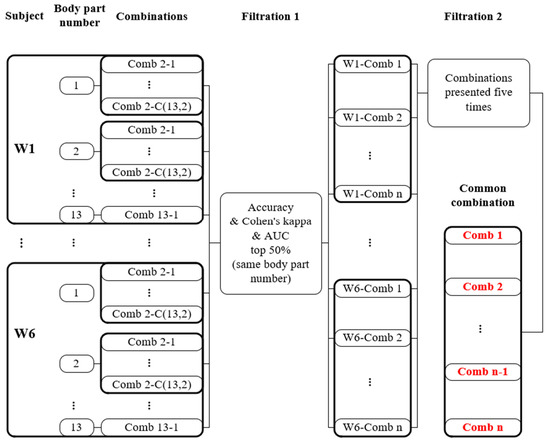
Figure 4.
The method of selection for the common combinations.
3. Results
3.1. Thermal Experience
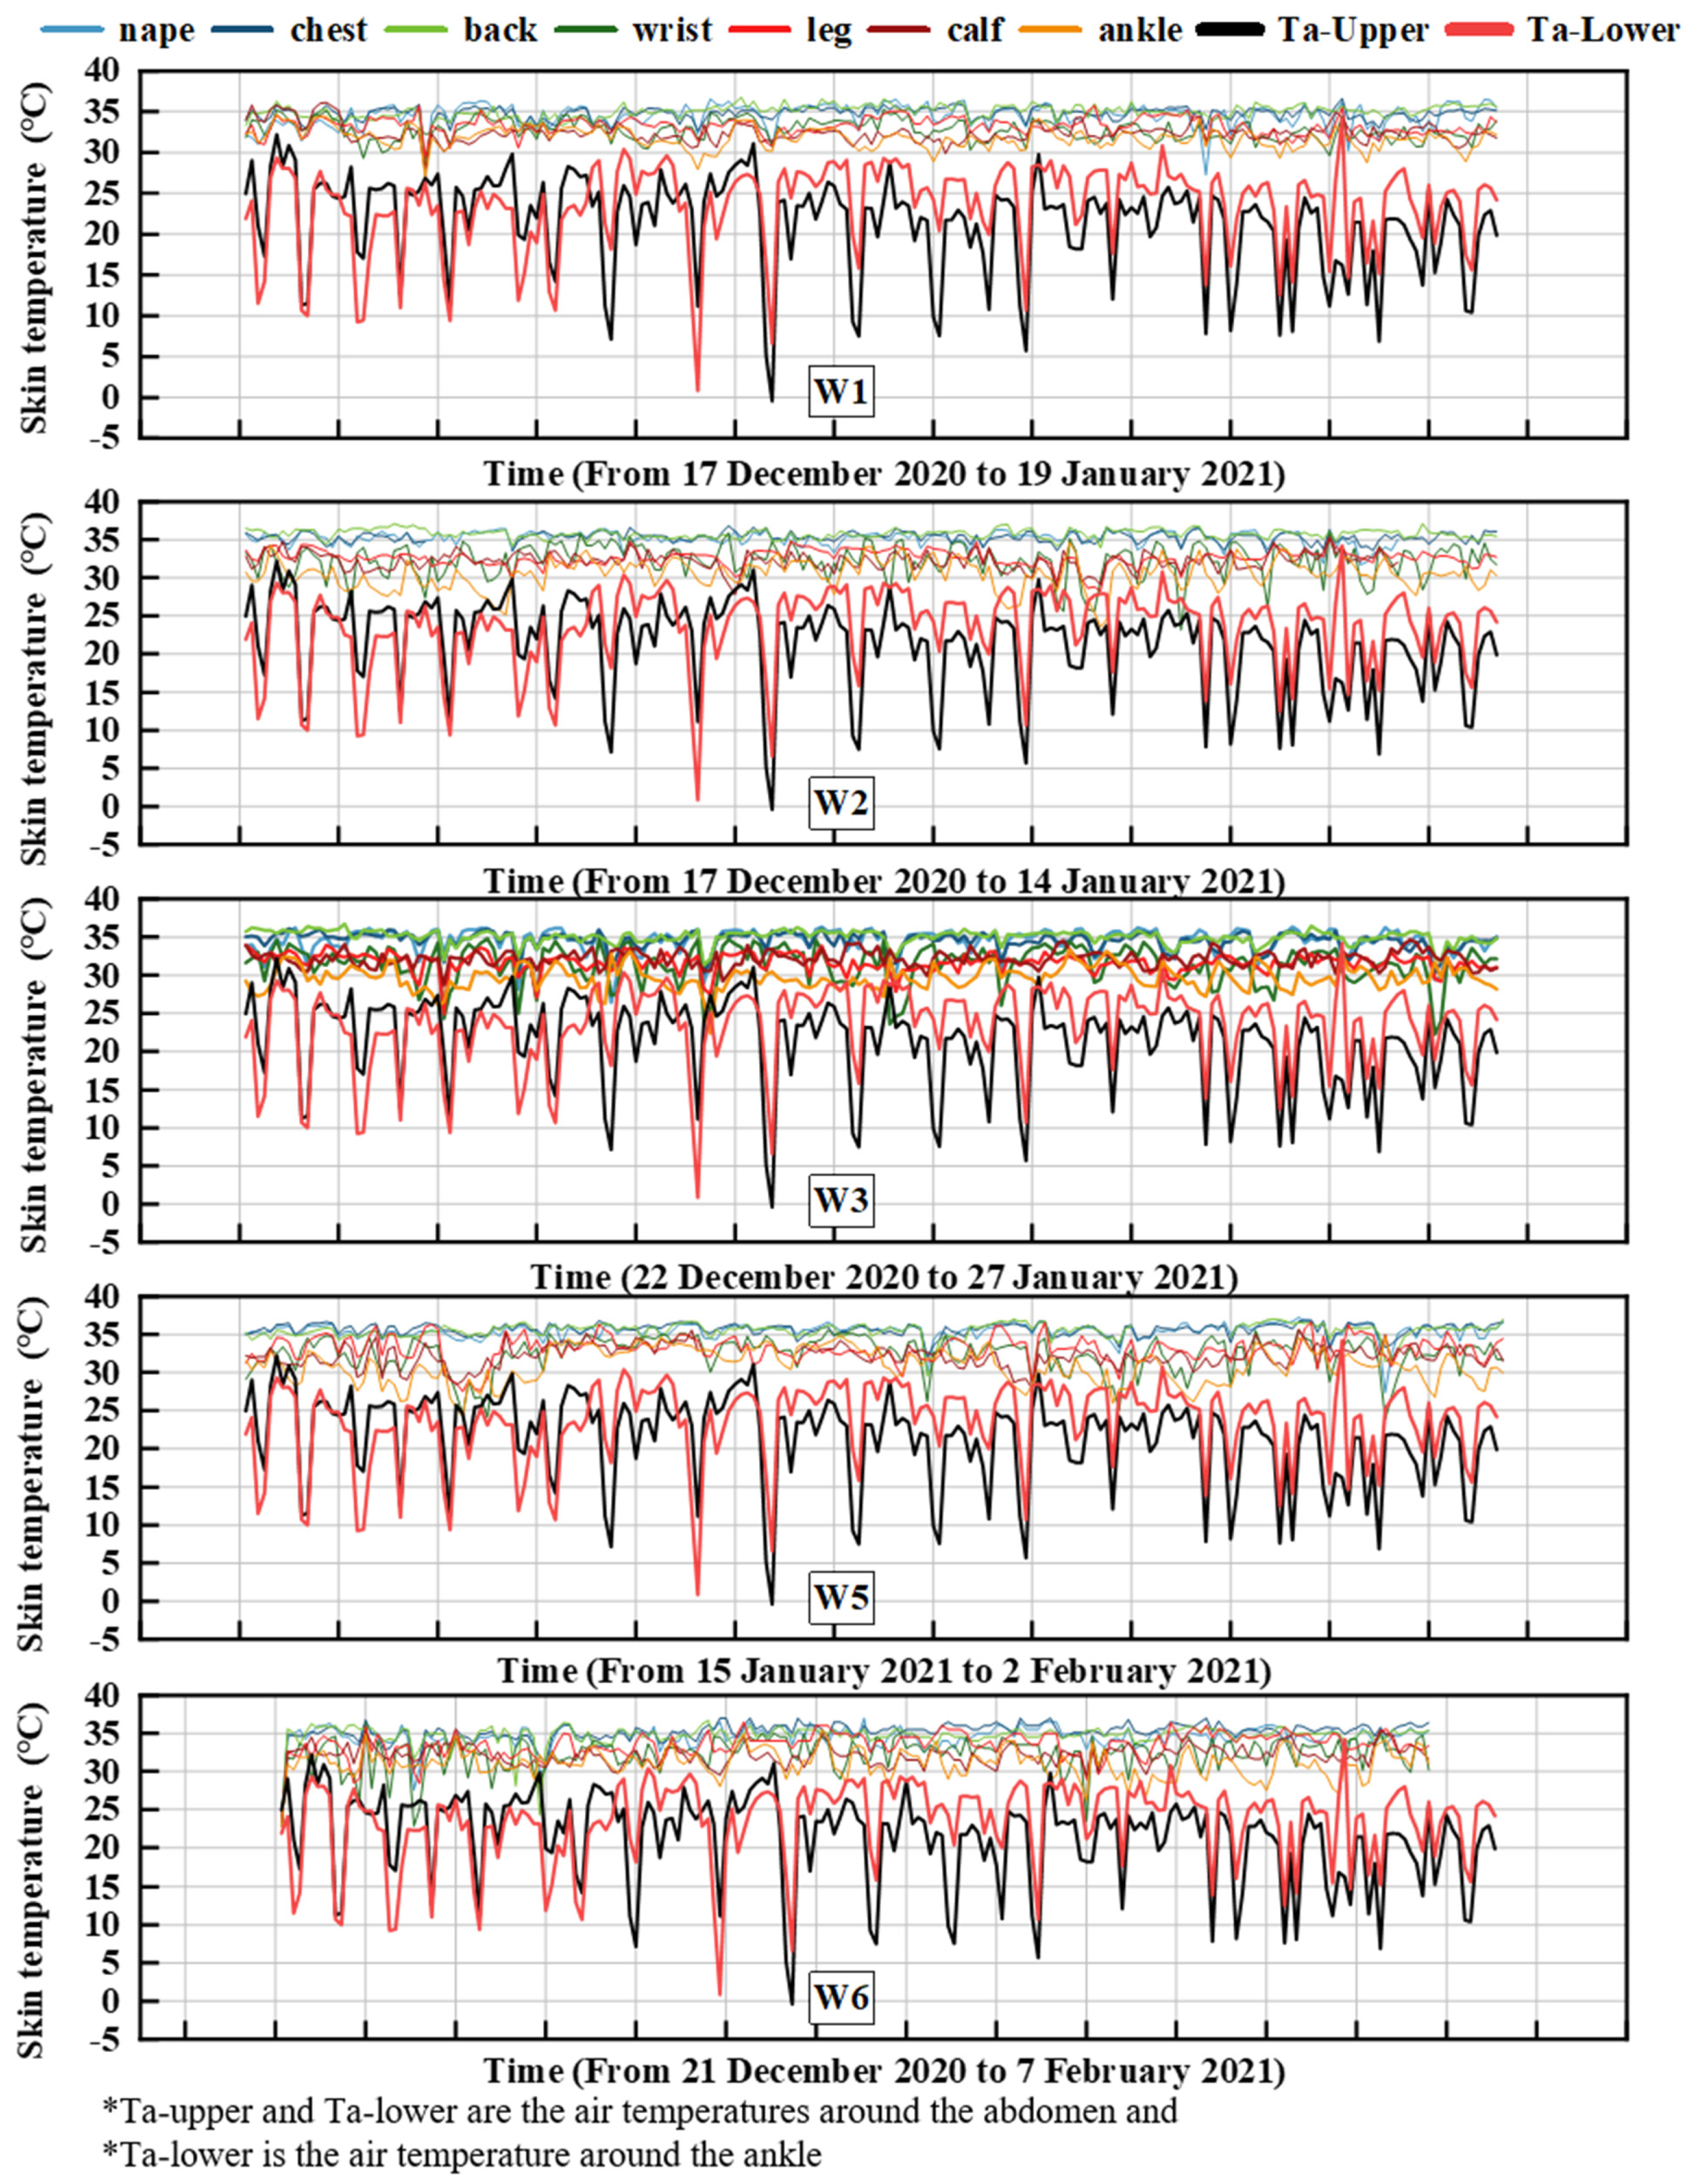
This study was not carried out in a controlled climate chamber, but rather under daily conditions, which resulted in an unsteady process as subjects could change their location and activity freely. Therefore, it was important to record the thermal experiences of the subjects W1–W6. Figure 5 shows the real-time skin temperature of the subjects.
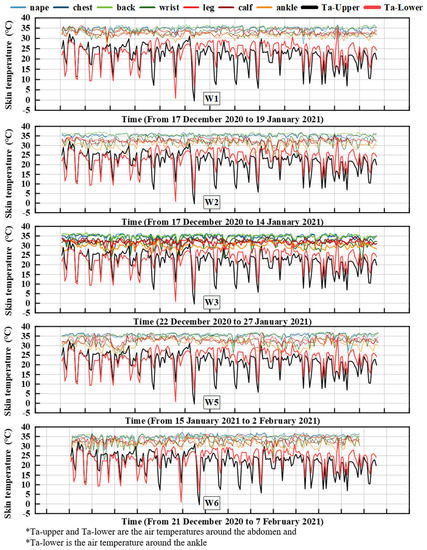
Figure 5.
The thermal experiences of the subjects.
3.2. Thermal Preference
The votes for cooler, no change, and warmer are shown in Table 2. Although the test was completed in winter, there were still some votes for cooler and the votes for no change accounted for the largest proportion.
Table 2.
A summary of votes for each subject.
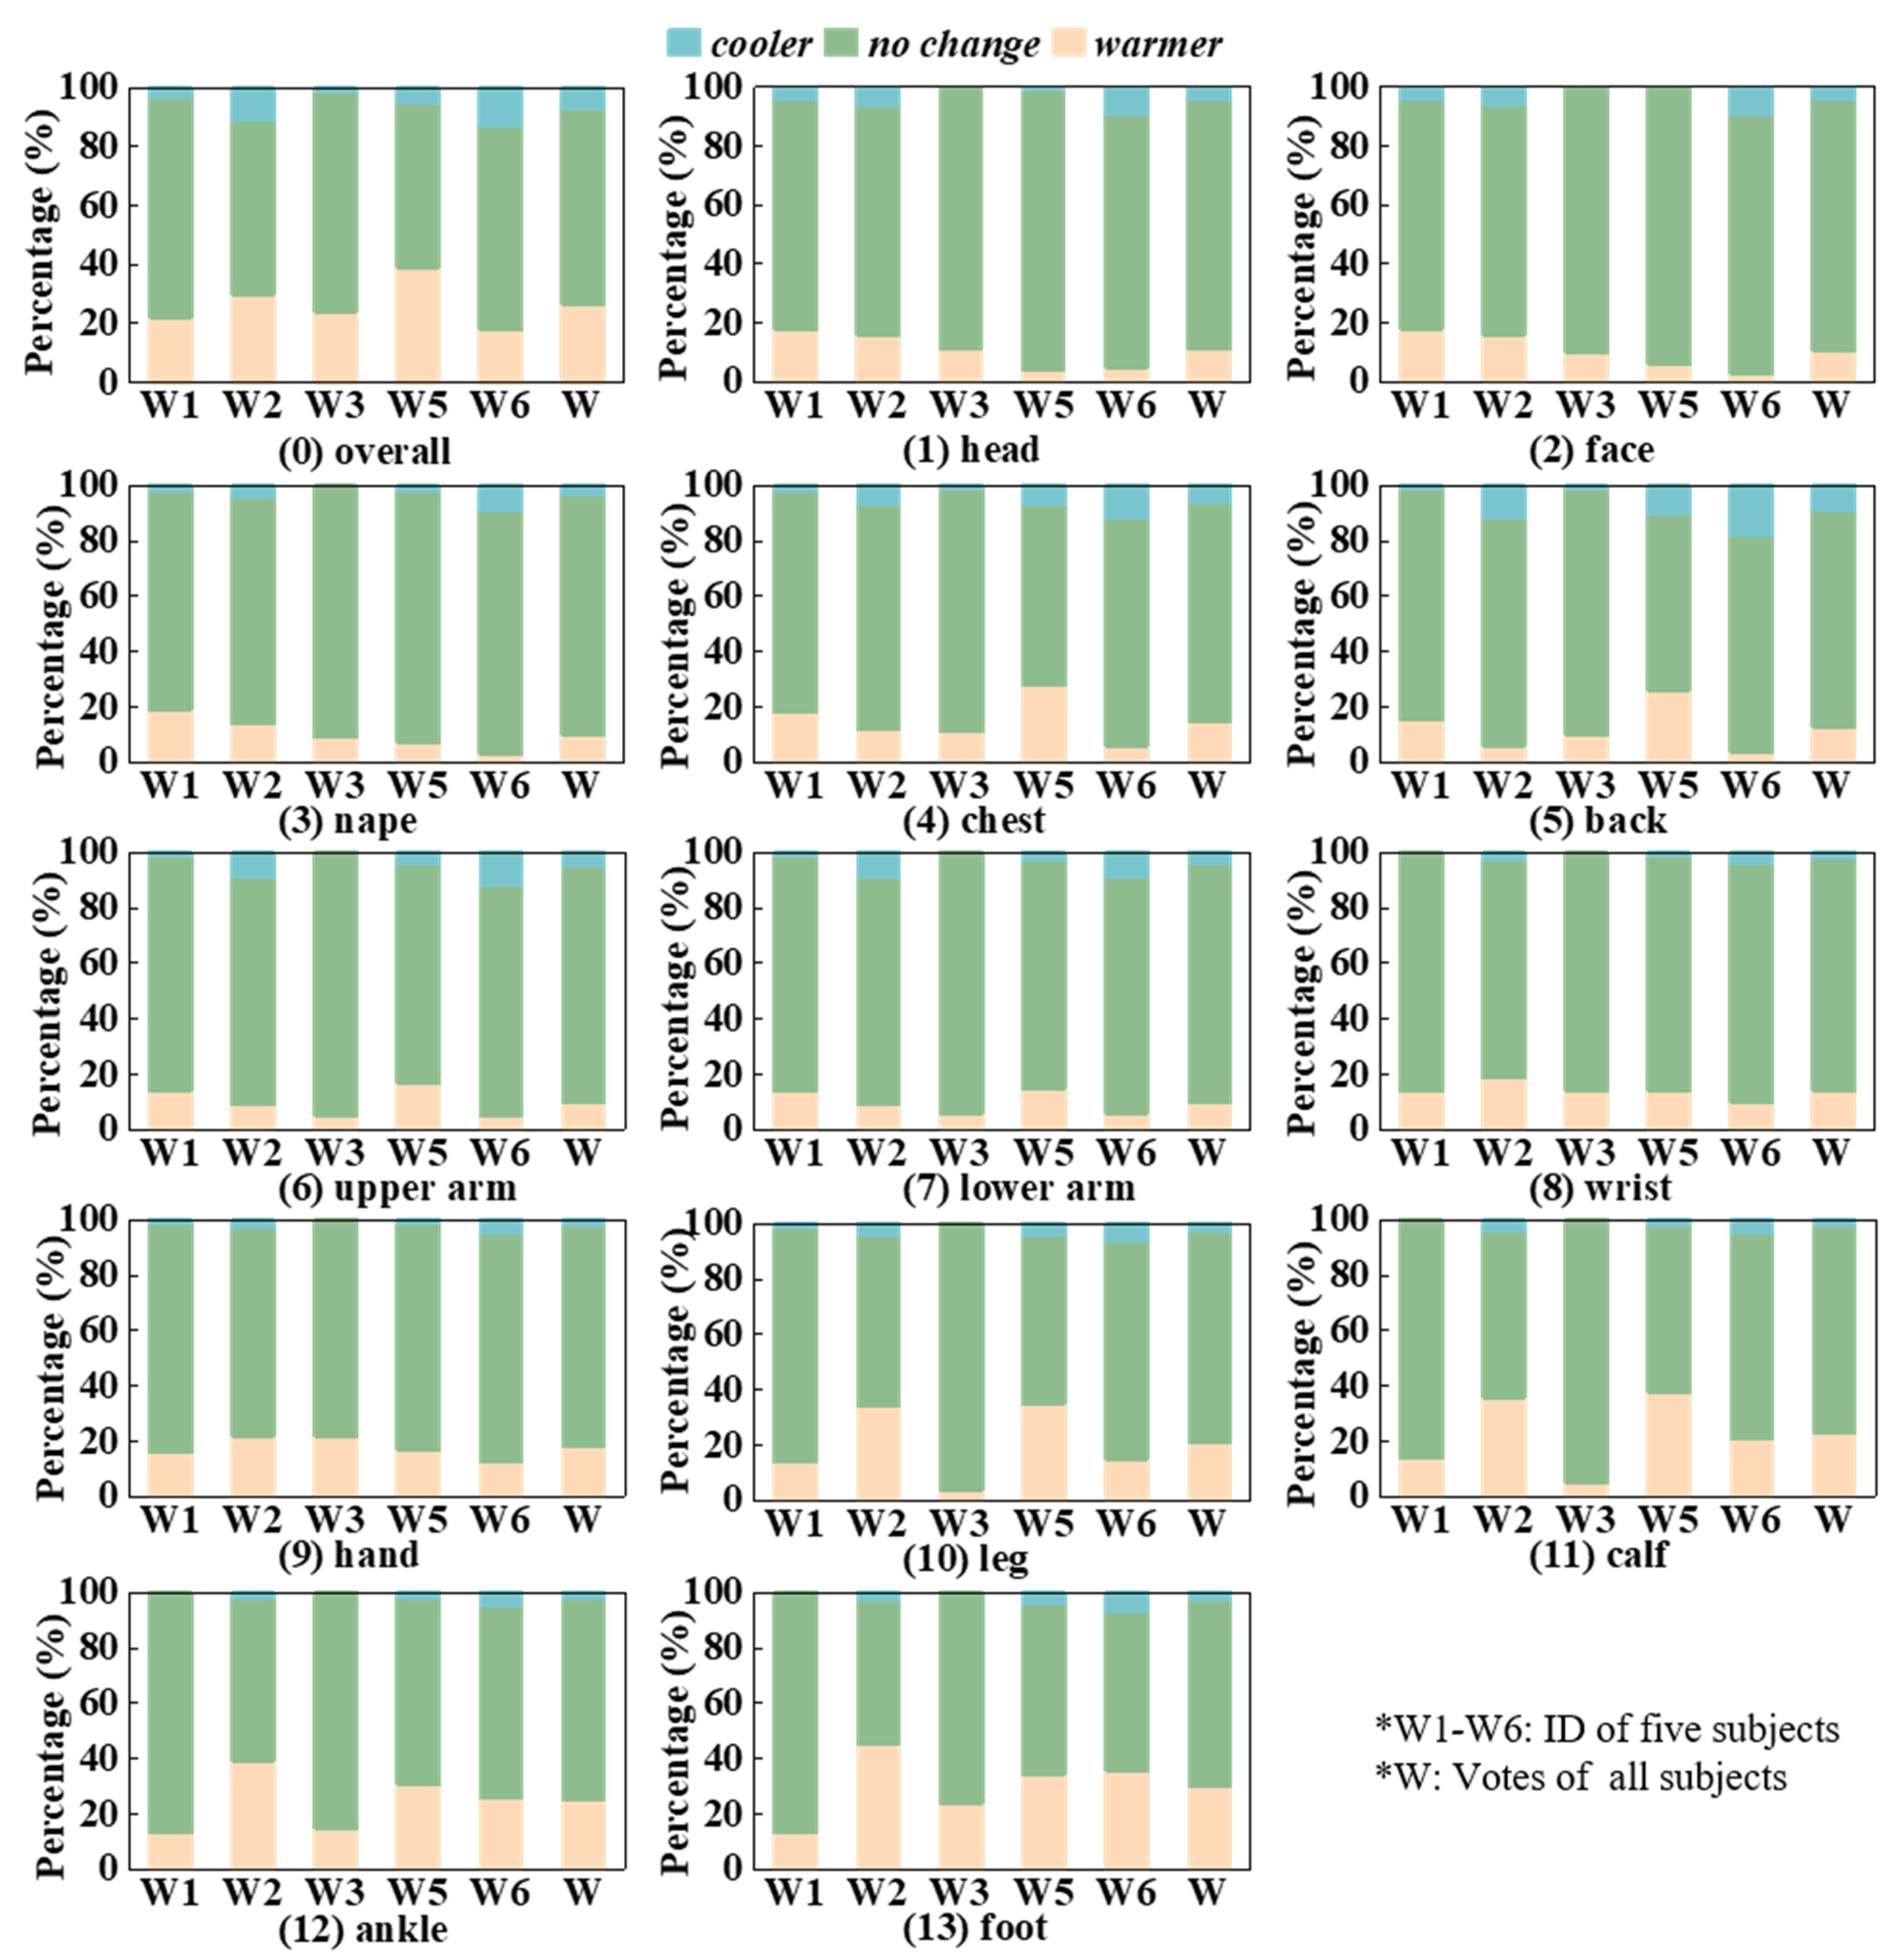
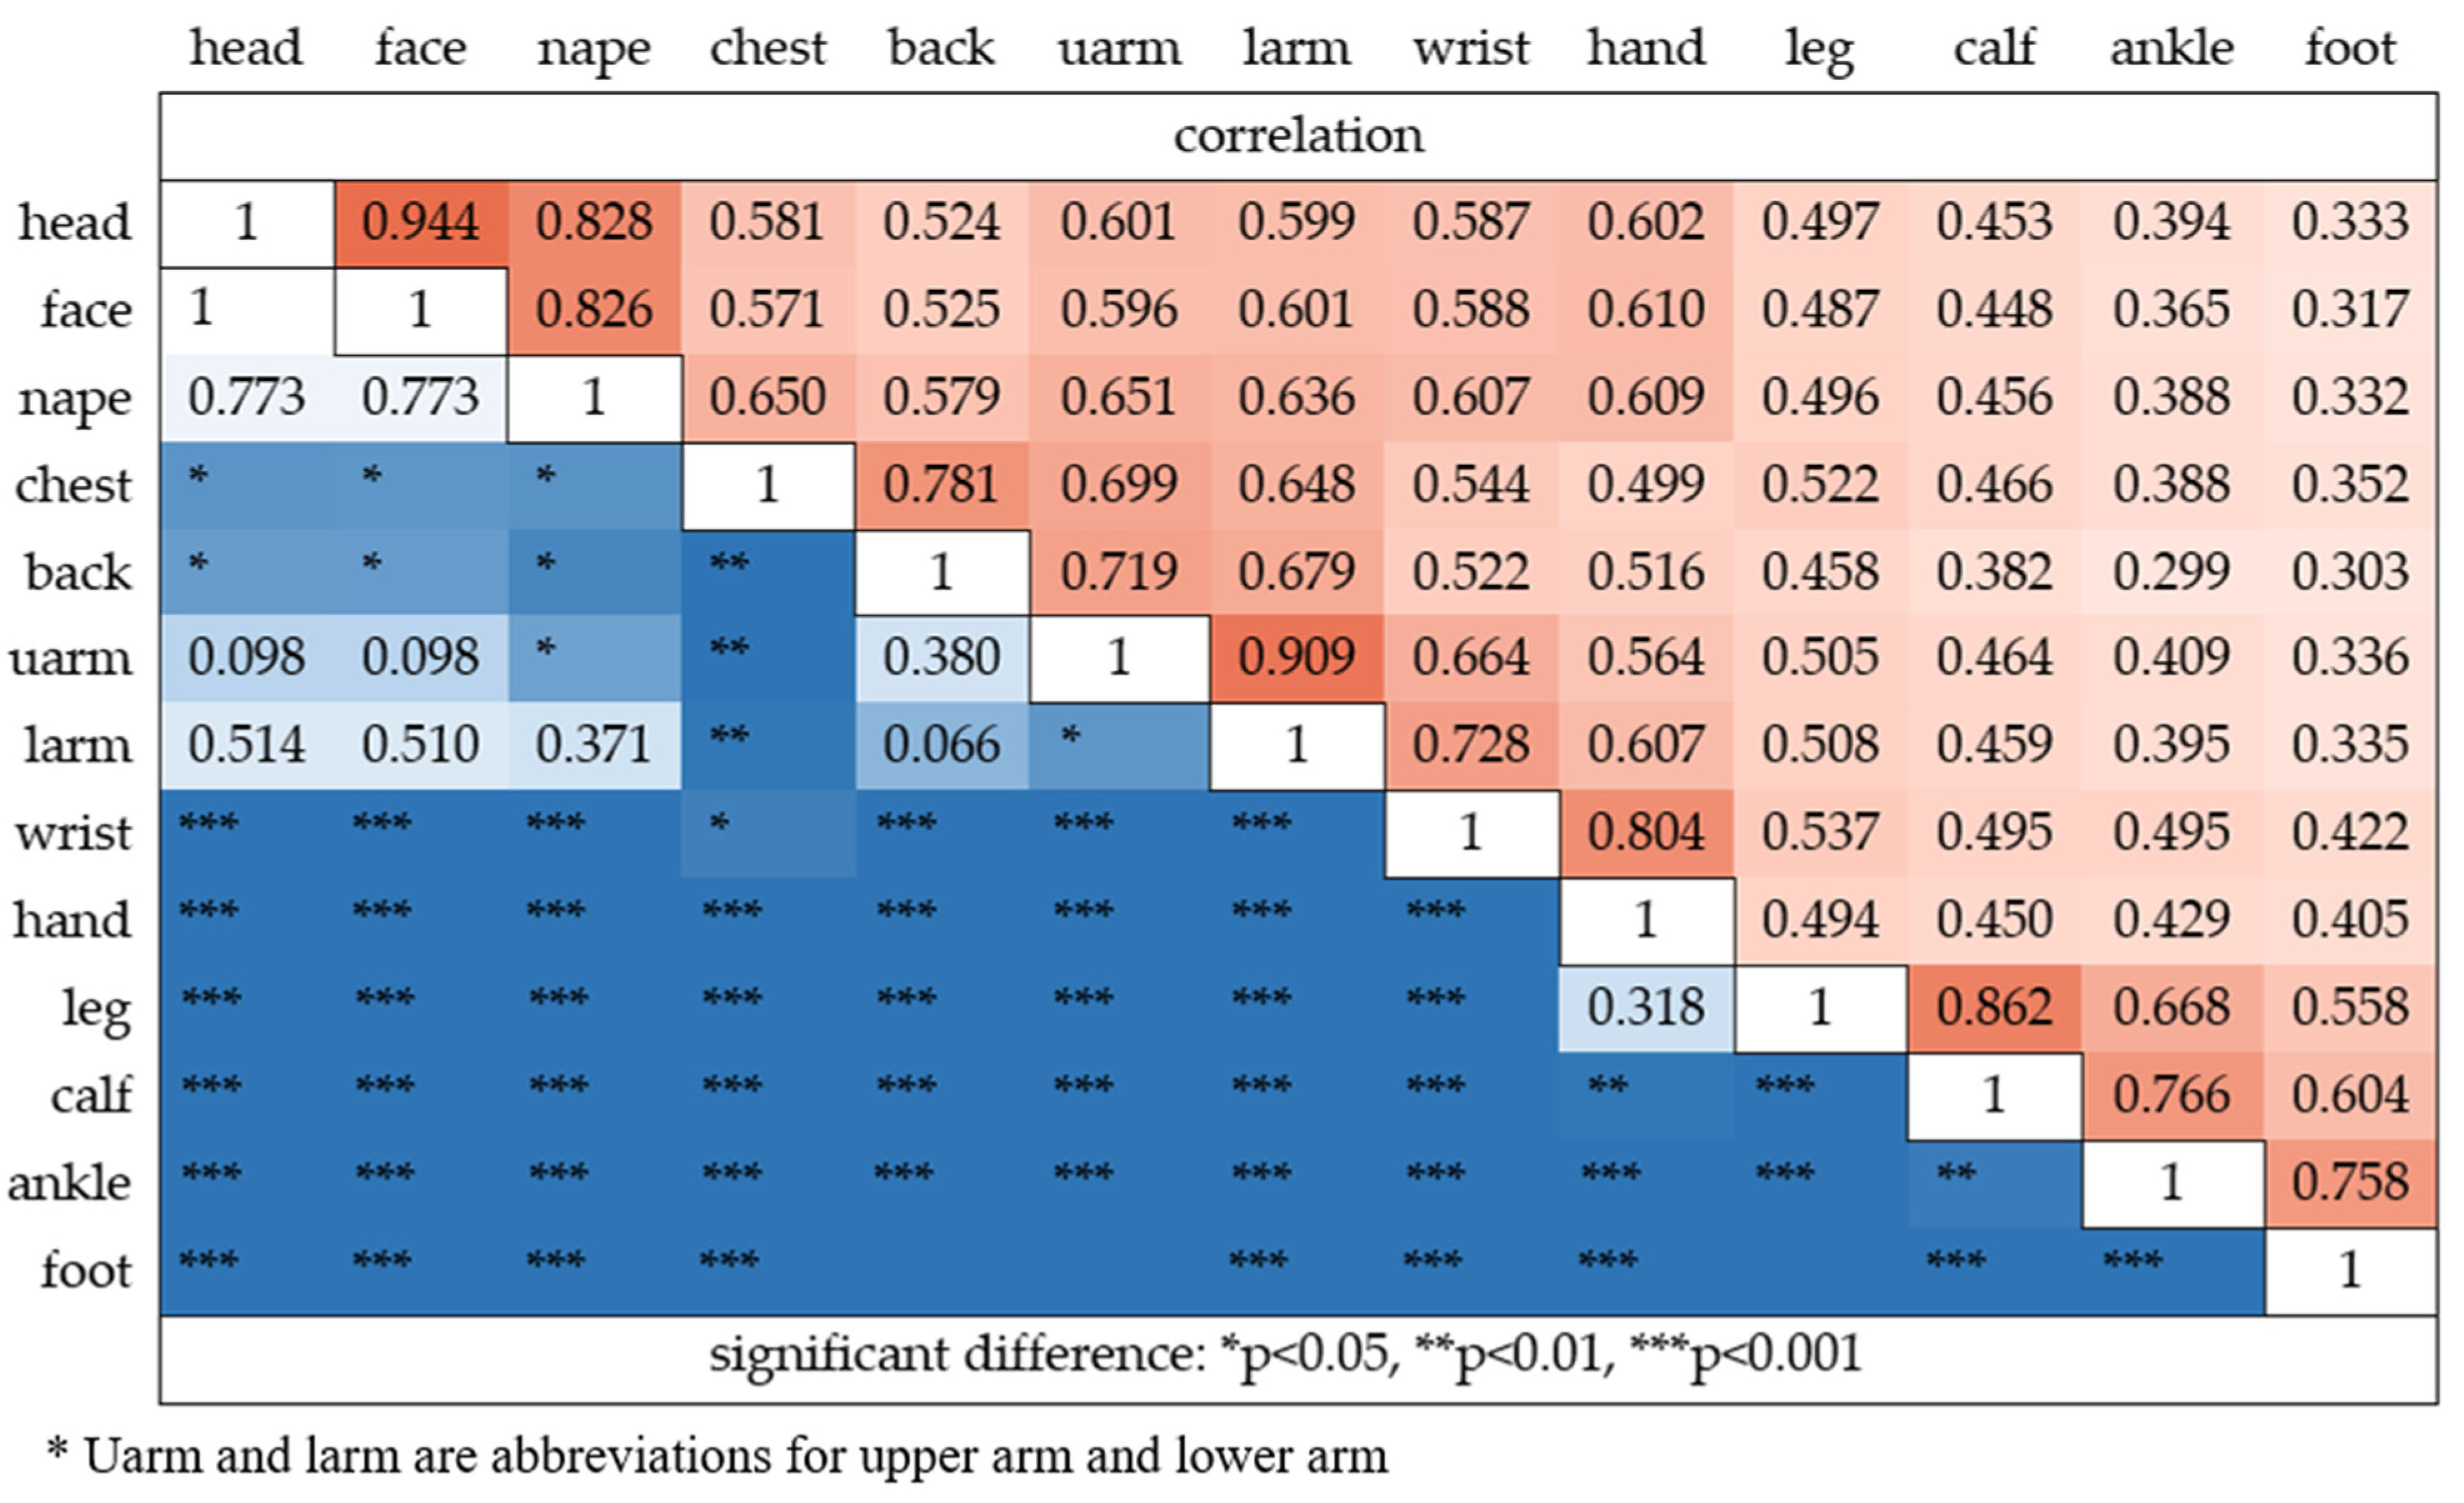
The plots in Figure 6 show the overall thermal preferences and 13 local thermal preferences of the subjects W1–W6. The last bar, marked “W” in Figure 6, is the percentage of thermal preference when the thermal preference of the subject W1–W6 is summed. In winter, the chest (6%) and back (9%) often felt hotter than the other body parts, resulting in cooler votes. In contrast, the legs (21%), calves (23%), ankles (25%), and feet (30%) garnered more warmer votes, as they were uncomfortably cold. The overall thermal preference and the thermal preference of lower parts of the body for warmer environments was greater than that for cooler environments. Based on the results, we found that when subjects performed their daily work in winter, their legs, calves, ankles, and feet often required adjustment to a warmer temperature. In addition, the thermal preference of the chest and back for cooler environments was greater than that of the other body parts. Figure 7 displays the results of paired sample t-tests between the thermal preferences of each possible pair of body parts. The thermal preferences of the different local body parts were significantly correlated.

Figure 6.
The local thermal preferences of the subjects.
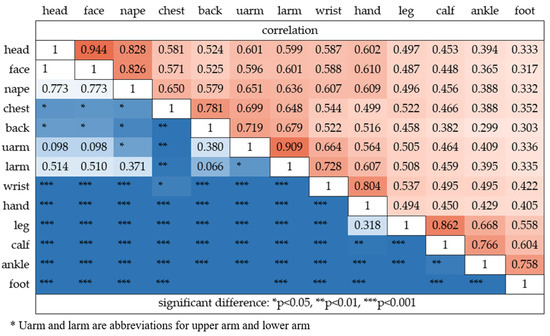
Figure 7.
The correlations and significant differences between the thermal preferences of the 13 body parts.
3.3. Prediction of Overall Thermal Preference
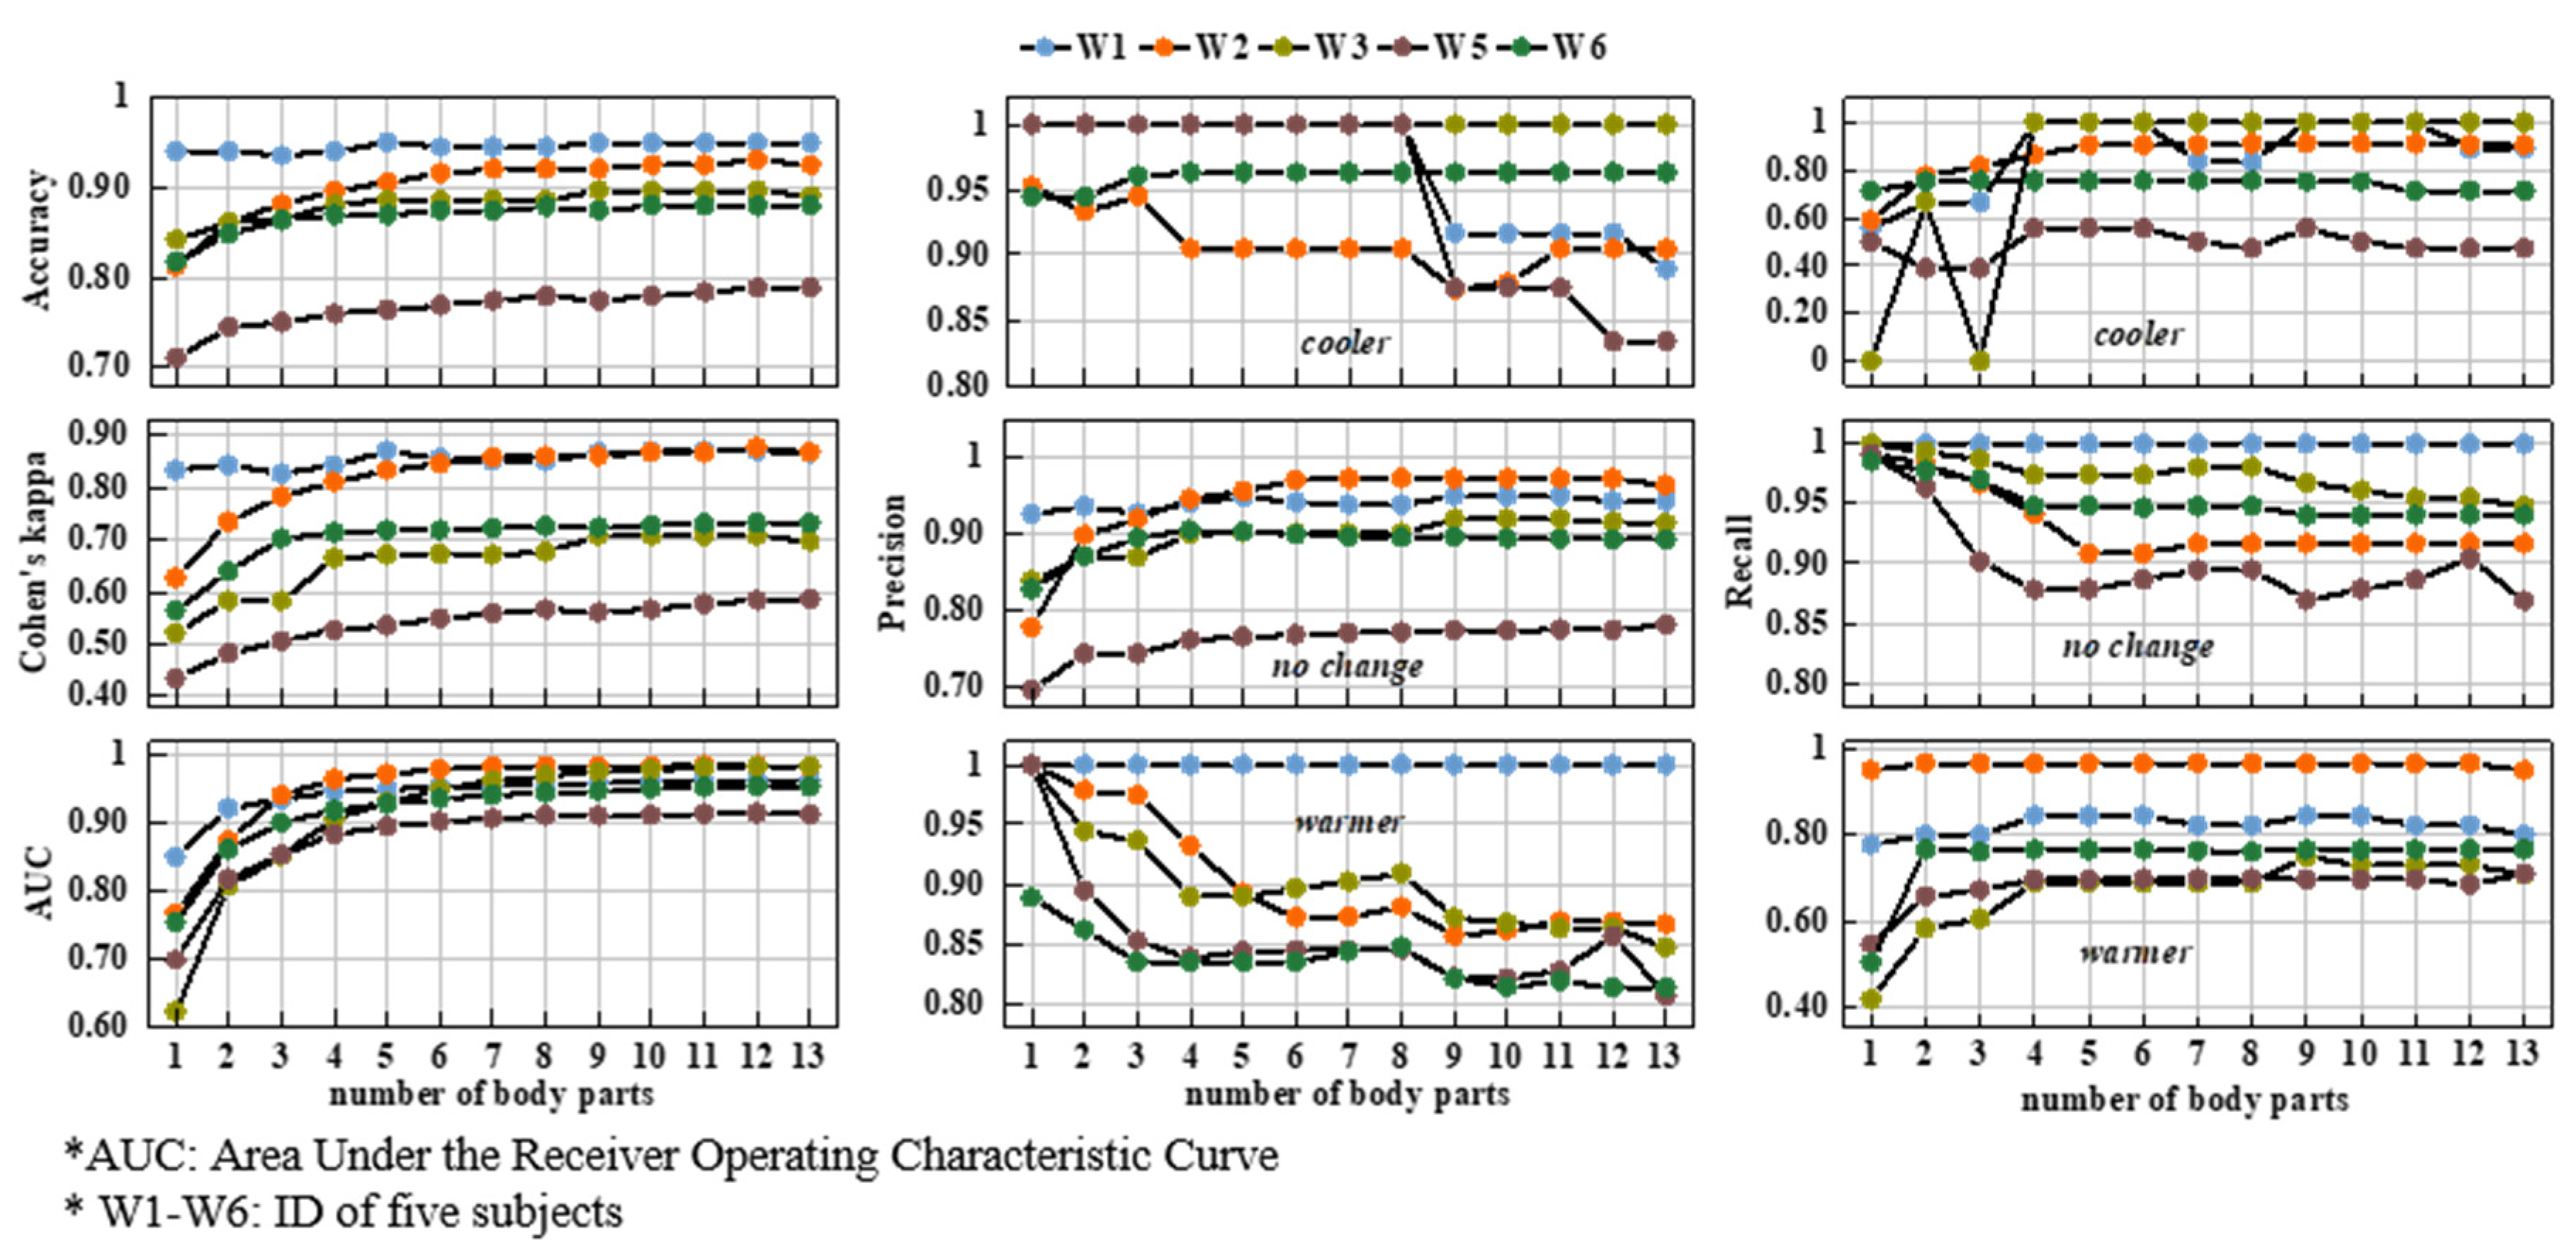
The third quartiles of each indicator for subjects W1–W6 are shown in Figure 8. For subjects W1 and W2, the combinations of 1–13 body parts met all requirements. The accuracy, Cohen’s kappa, and AUC improved and stabilised as the number of body parts increased. However, the quality of some indicators, especially those of non-neutral preferences, fluctuated or declined. Where precision and recall were both low, this could have been caused by the small non-neutral thermal preference sample size. However, for most subjects, the values of precision and recall approached a satisfying level. We concluded that overall thermal preference in winter is affected by several body parts. Due to differences in their adjustment ranges and intensity, some body parts may prefer warmer or cooler conditions. However, this may not affect overall thermal preference, which has been studied as a weighted factor [49,50,51] of local thermal sensation in overall thermal sensation.
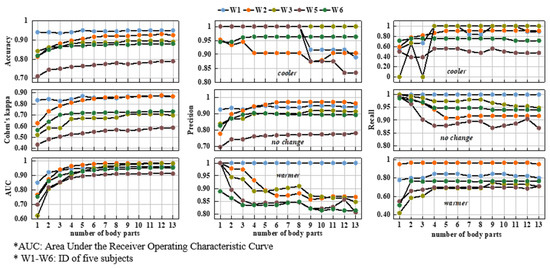
Figure 8.
The average prediction powers of the combinations with different numbers of body parts.
3.3.1. The Best Combination
The prediction results illustrated that the combination with all parts could be the worst at predicting overall thermal preference, as shown in Figure 9. Including too many or too few parts in the combination reduces the prediction power.
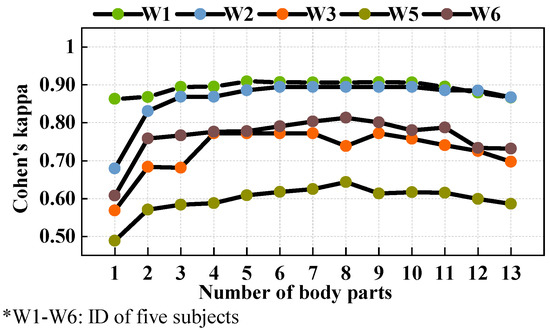
Figure 9.
The Cohen’s kappa of the best combination.
For example, the thermal preference of W1 could be predicted using five body parts (the face, nape, chest, wrist, and leg) with an accuracy of 0.97, Cohen’s kappa of 0.91, AUC of 0.96, and precision and recall above 0.83. This meant that the model established for W1 was reliable. However, as shown in Figure 10, the BC for each subject still consisted of 5–9 body parts, which meant that a large number of inputs was required for the prediction and many questionnaires had to be completed. This was the main cause of the subjects’ aversion to the questionnaire.
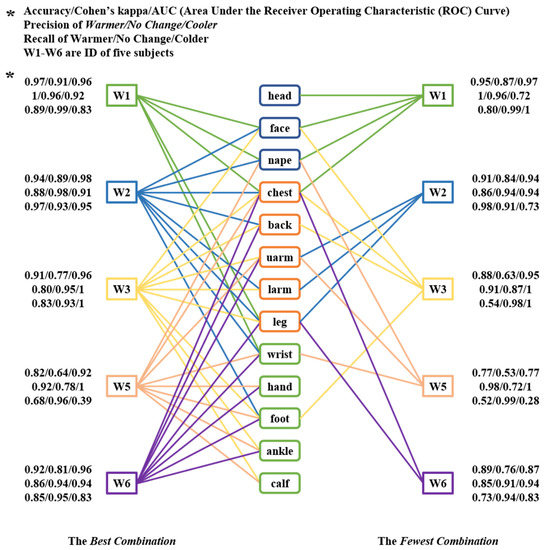
Figure 10.
The best combination and fewest combination of each subject.
3.3.2. The Fewest Combination
For this reason, the method in Section 2.7 was used to identify the FC. The completed scores and selected numbers of body parts for each subject are shown in Table 3.
Table 3.
The score and selected number of body parts for each subject.
After comparing the occurrence frequency of the 13 body parts for each subject, the final decision was made. As shown in Figure 10, subjects W1 and W5 had thermal preferences influenced mainly by the head area and upper part of the body, while the others were affected by all parts of the body. Moreover, the extremities (lower arm, wrist, hand, calf, ankle, and foot) were rarely selected. For all subjects, their hand, calf, and ankle were not important to their overall thermal preference. For individual subjects, the thermal preferences of 2–4 body parts could predict their overall thermal preference well.
3.3.3. The Common Combinations
Finally, 26 combinations with four, five, six, seven, eight, nine, and thirteen body parts were selected. The prediction power of these combinations was 0.88 ± 0.05 (accuracy), 0.74 ± 0.10 (Cohen’s kappa), and 0.95 ± 0.03 (AUC). In practice, the more local body parts involved in the prediction, the more tedious the preparation. Considering feasibility, we selected one combination with four body parts and three combinations with five body parts as the CCs in this study (0.88 ± 0.05 (accuracy), 0.73 ± 0.11 (Cohen’s kappa), 0.93 ± 0.03 (AUC)). Detailed information on the selected CCs is listed in Table 4 and presented in Figure 11. The worst prediction (for W5) using the CCs had an accuracy of 0.77. The details of the body parts and prediction power values of the other combinations used are presented in Appendix C and Appendix D.
Table 4.
The subject-averaged prediction power of four common combinations for subjects W1-W6.
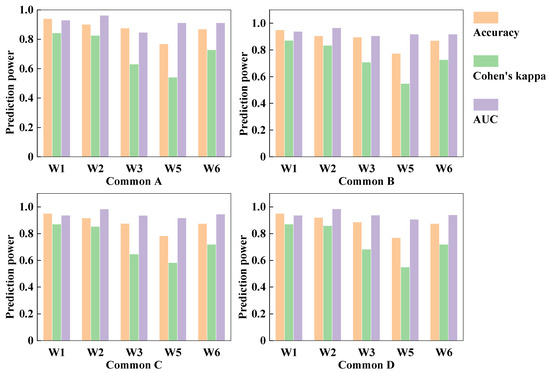
Figure 11.
The prediction power of four common combinations.
3.4. Model Validation
To verify the applicability of the above 14 selected combinations, their prediction power when used to predict the thermal preferences of M1–M14 was examined. The results are shown in Figure 12. The t-tests performed on the accuracy and Cohen’s kappa values of the different combinations indicated that, at a significance level of 0.05, they were not significantly different from one another. However, a significant difference was observed for the AUC. The BC and CCs had similar prediction powers based on the three metrics and FC performed the worst, especially in terms of the AUC. Considering the number of body parts, the CCs were the most appropriate for thermal preference prediction. The accuracy, Cohen’s kappa, and AUC values of the four CCs for the 14 validated subjects are listed in Table 5. The overall accuracy, Cohen’s kappa, and AUC values of the four CCs were 0.92 ± 0.06, 0.77 ± 0.14, and 0.90 ± 0.08, respectively.
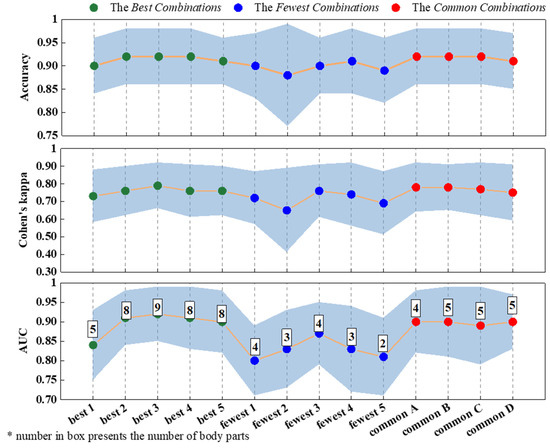
Figure 12.
The average prediction power of all three combination types across the 14 subjects.
Table 5.
The accuracy, Cohen’s kappa, and AUC of the four selected common combinations in the validation.
4. Discussion
4.1. The Prediction Power of Different Combinations
Liu et al. [24] showed that ankle and wrist skin temperature was important in predicting overall thermal preference, except for when outdoors. These two body parts were used in our study. This study found that when only a single body part was used, the accuracy of the wrist and ankle thermal preferences were 0.81 and 0.71, respectively. For W5, they produced the worst prediction; their prediction accuracies were only 0.71 and 0.67, respectively. The combination of the wrist and ankle was listed 70th out of the 78 combinations containing two body parts, and the lowest accuracy (0.69) was for W5.
As reported by Dai [26], three body parts can provide enough information to classify overall thermal preference. In this study, when three body parts were used, the average accuracies were 0.92, 0.86, 0.95, 0.73, and 0.84 for the five subjects. However, the Cohen’s kappa and AUC values indicated that more body parts needed to be involved to establish a satisfactory model to classify thermal preferences.
Wang [36] established a thermal sensation model for older people using skin temperature from the head, forearm, thigh, chest, and back with an overall accuracy of 76.7%. In this study, the combination with these body parts was not selected as a BC, FC or CC. The prediction accuracy of the BC with five body parts was 0.97 (Figure 10; W1). The body parts in this combination were the face, nape, chest, leg, and wrist. In the validation, the prediction accuracy of this combination was 0.90 ± 0.06. The number of body parts in the FCs was < 5. The prediction accuracy of the four CCs with five body parts was 0.88 ± 0.6 and in the validation, the accuracy was 0.92 ± 0.06. The body parts included in these combinations are listed in Appendix C, Table A2.
Shan et al. [52] established a personal comfort model using an artificial neural network. It included the skin temperature of six body parts (wrist, neck, chest, upper arm, thigh, and calf) and the air temperature around the wrist. The average accuracy of the three subjects was 89.2%. The prediction accuracy of the same body part combination in this study was 0.88 ± 0.06, which was nearly equal to the results of Shan et al.
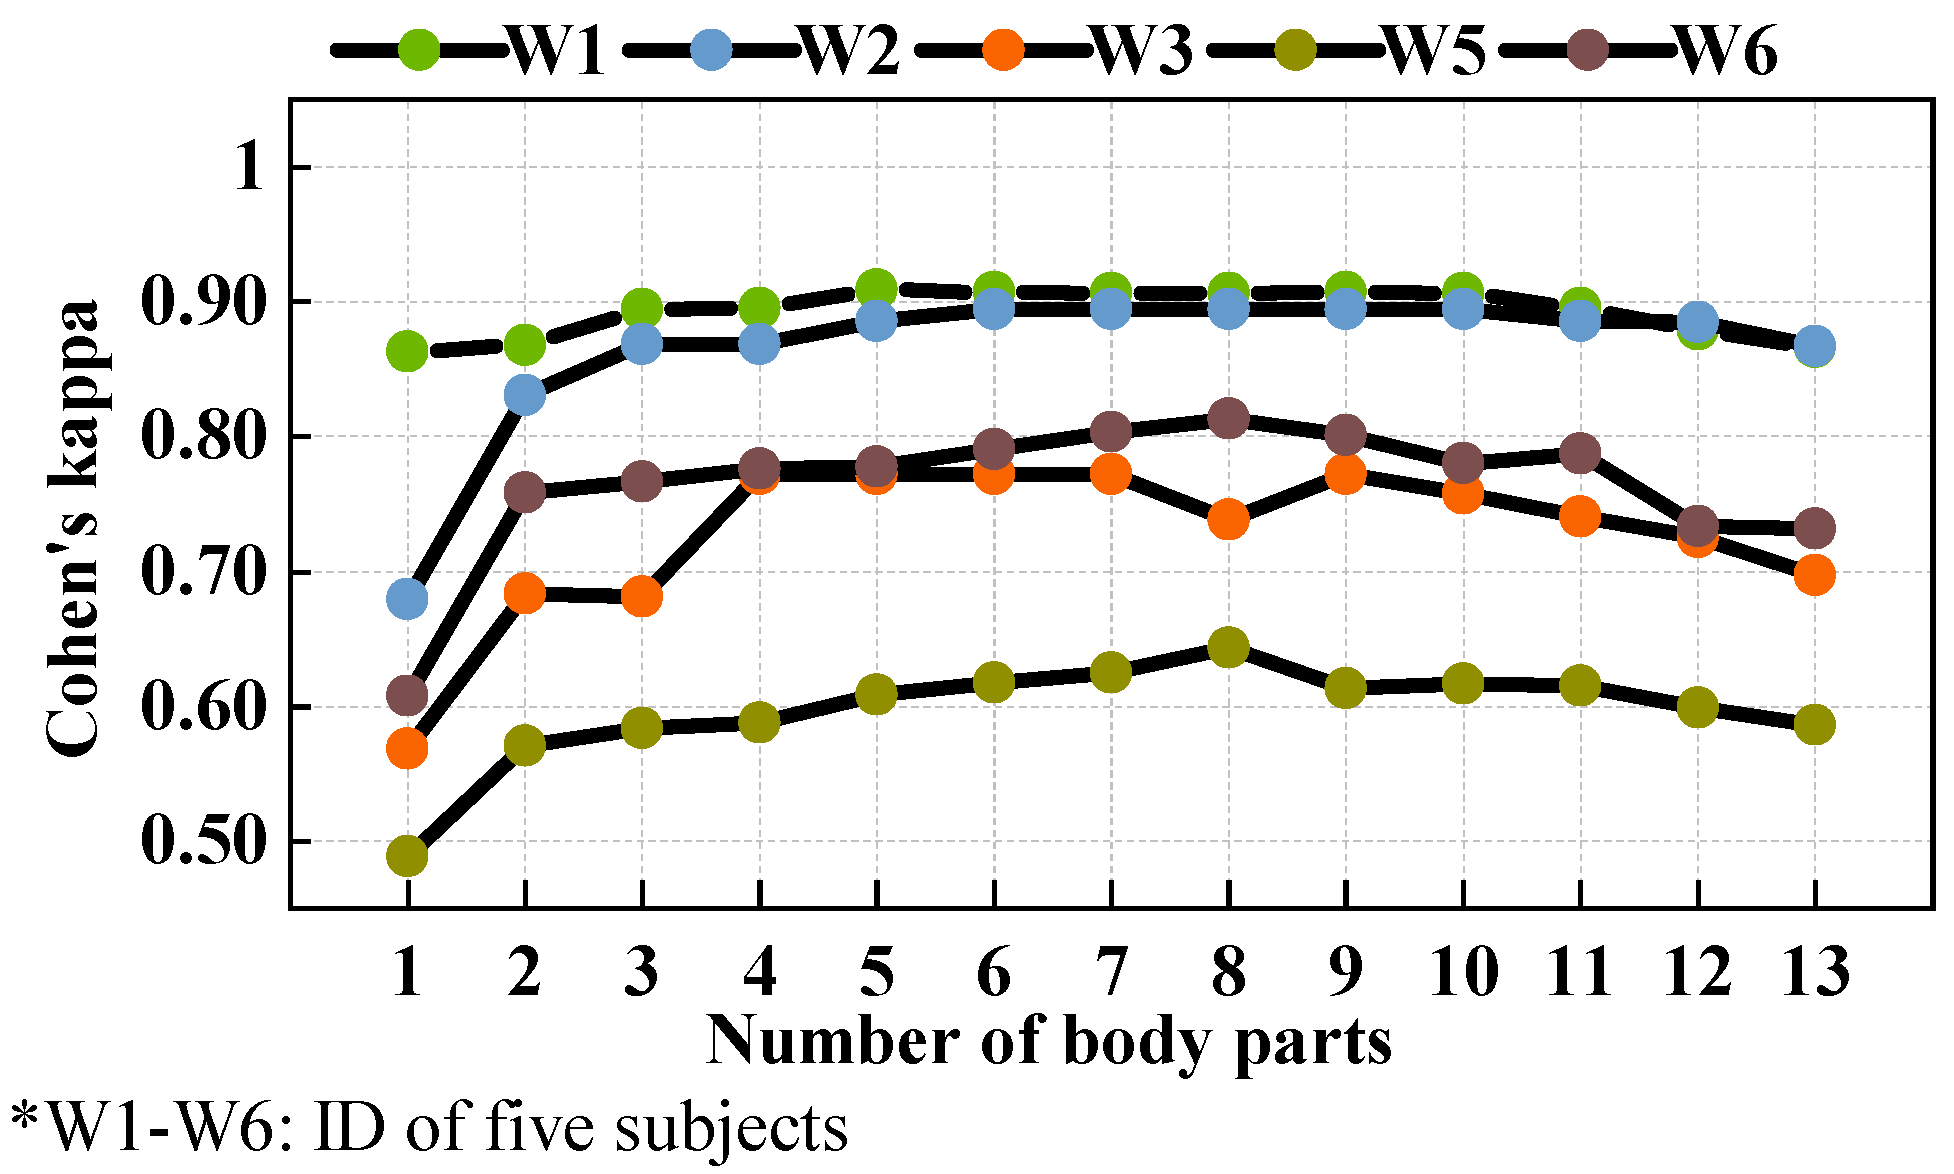
As shown in Figure 13, we found an increasing trend of accuracy as more body parts were included in the prediction. No obvious decrease occurred for any of the metrics when the number of body parts increased. The combinations containing 1–5 body parts had an accuracy of over 0.80 (except for W5). For the Cohen’s kappa, the combinations with 4–9 body parts could meet the requirements of the three metrics (except for W5) and according to the AUC, 5–8 body parts were sufficient to predict overall thermal preference.
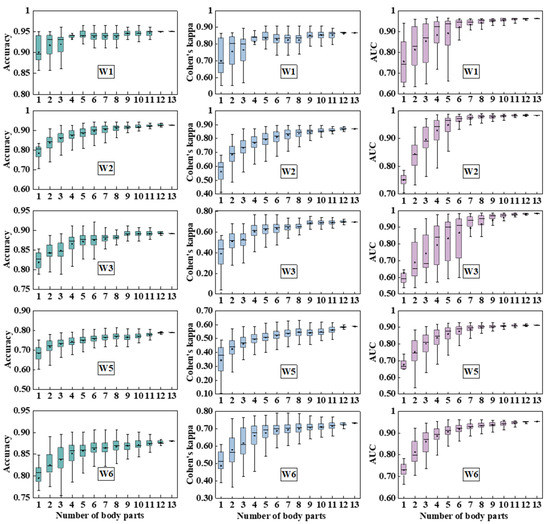
Figure 13.
The accuracy, Cohen’s kappa, and AUC for each subject with different numbers of body parts in the combinations.
4.2. Comparison of the Best Combination, Fewest Combination, and Common Combinations
The prediction power of the BC for each subject reached 0.91 ± 0.06 (accuracy), 0.80 ± 0.11 (Cohen’s kappa), and 0.96 ± 0.02 (AUC); 0.89 ± 0.07 (precision for warmer), 0.92 ± 0.08 (precision for no change), and 0.95 ± 0.04 (precision for cooler); and 0.84 ± 0.11 (recall for warmer), 0.95 ± 0.02 (recall for no change), and 0.80 ± 0.24 (recall for cooler). The FC predicted thermal preference with values of 0.88 ± 0.07 (accuracy), 0.73 ± 0.14 (Cohen’s kappa), and 0.90 ± 0.08 (AUC); 0.92 ± 0.07 (precision for warmer), 0.88 ± 0.10 (precision for no change), and 0.92 ± 0.12 (precision for cooler); and 0.71 ± 0.19 (recall for warmer), 0.96 ± 0.04 (recall for no change), and 0.77 ± 0.30 (recall for cooler). For the CCs, the average prediction power for the subjects was 0.88 ± 0.06 (accuracy), 0.73 ± 0.12 (Cohen’s kappa), and 0.93 ± 0.03 (AUC); 0.86 ± 0.08 (precision for warmer), 0.90 ± 0.08 (precision for no change), and 0.88 ± 0.14 (precision for cooler); and 0.77 ± 0.13 (recall for warmer), 0.93 ± 0.05 (recall for no change), and 0.79 ± 0.23 (recall for cooler).
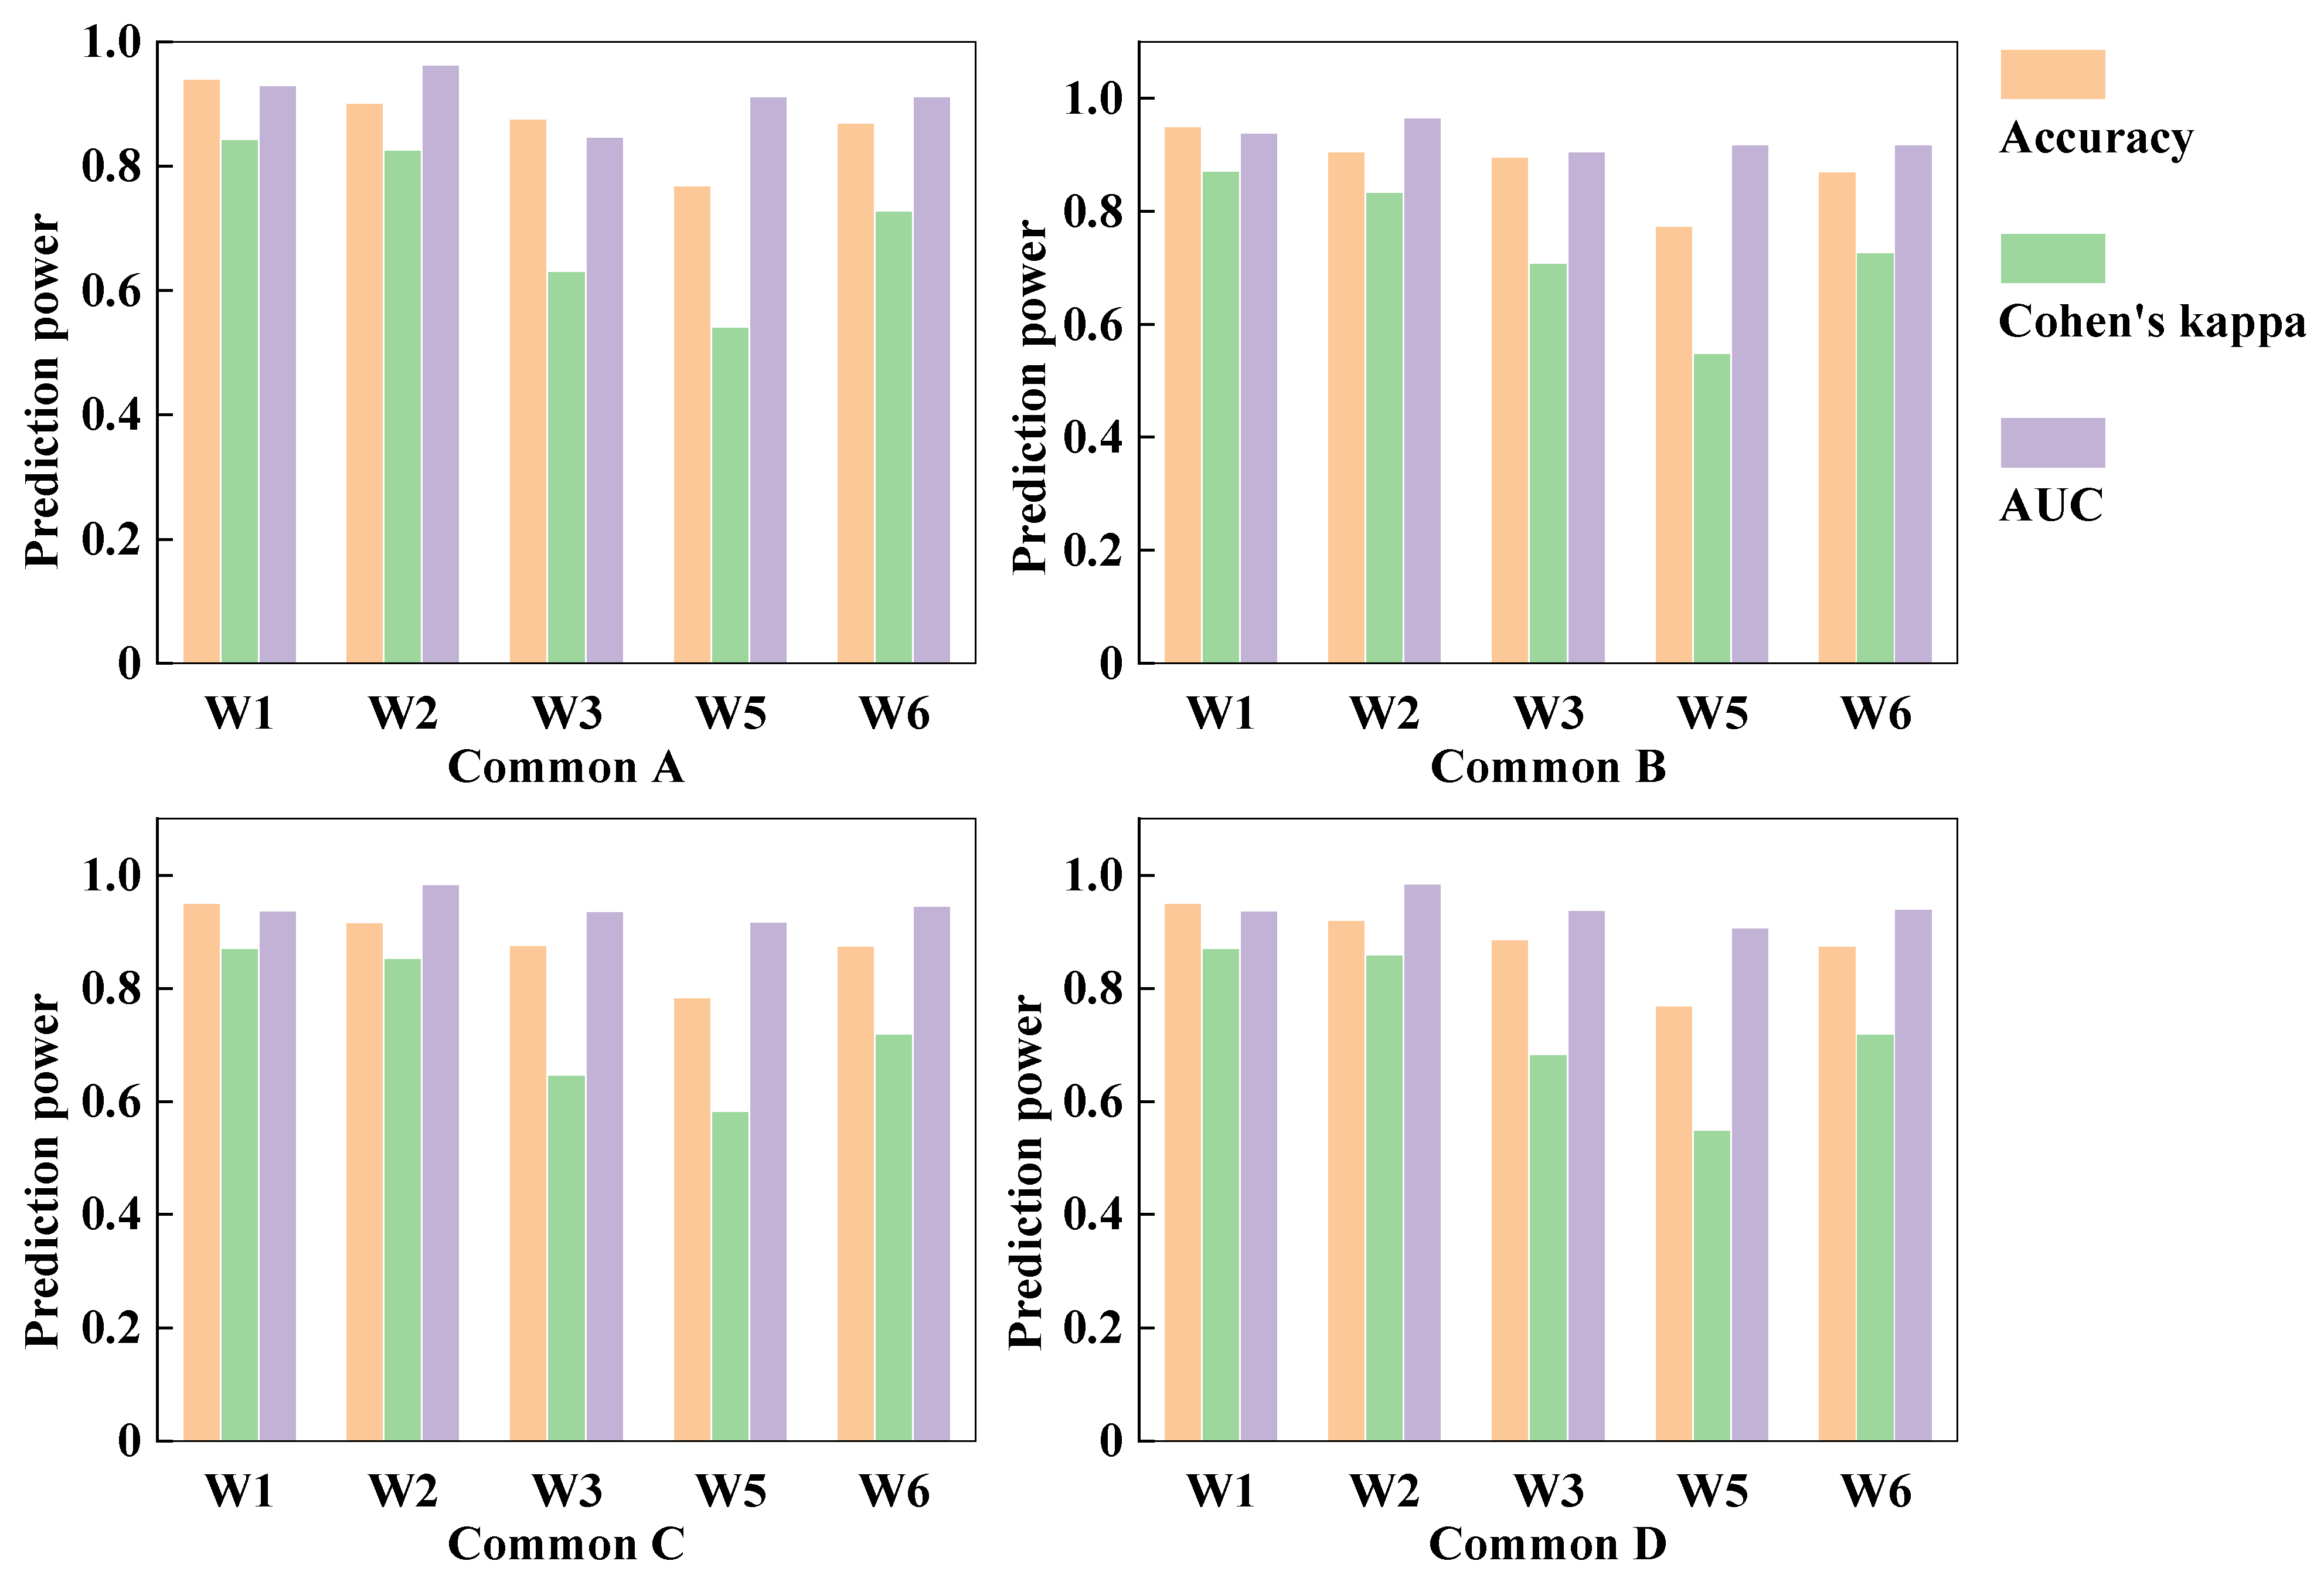
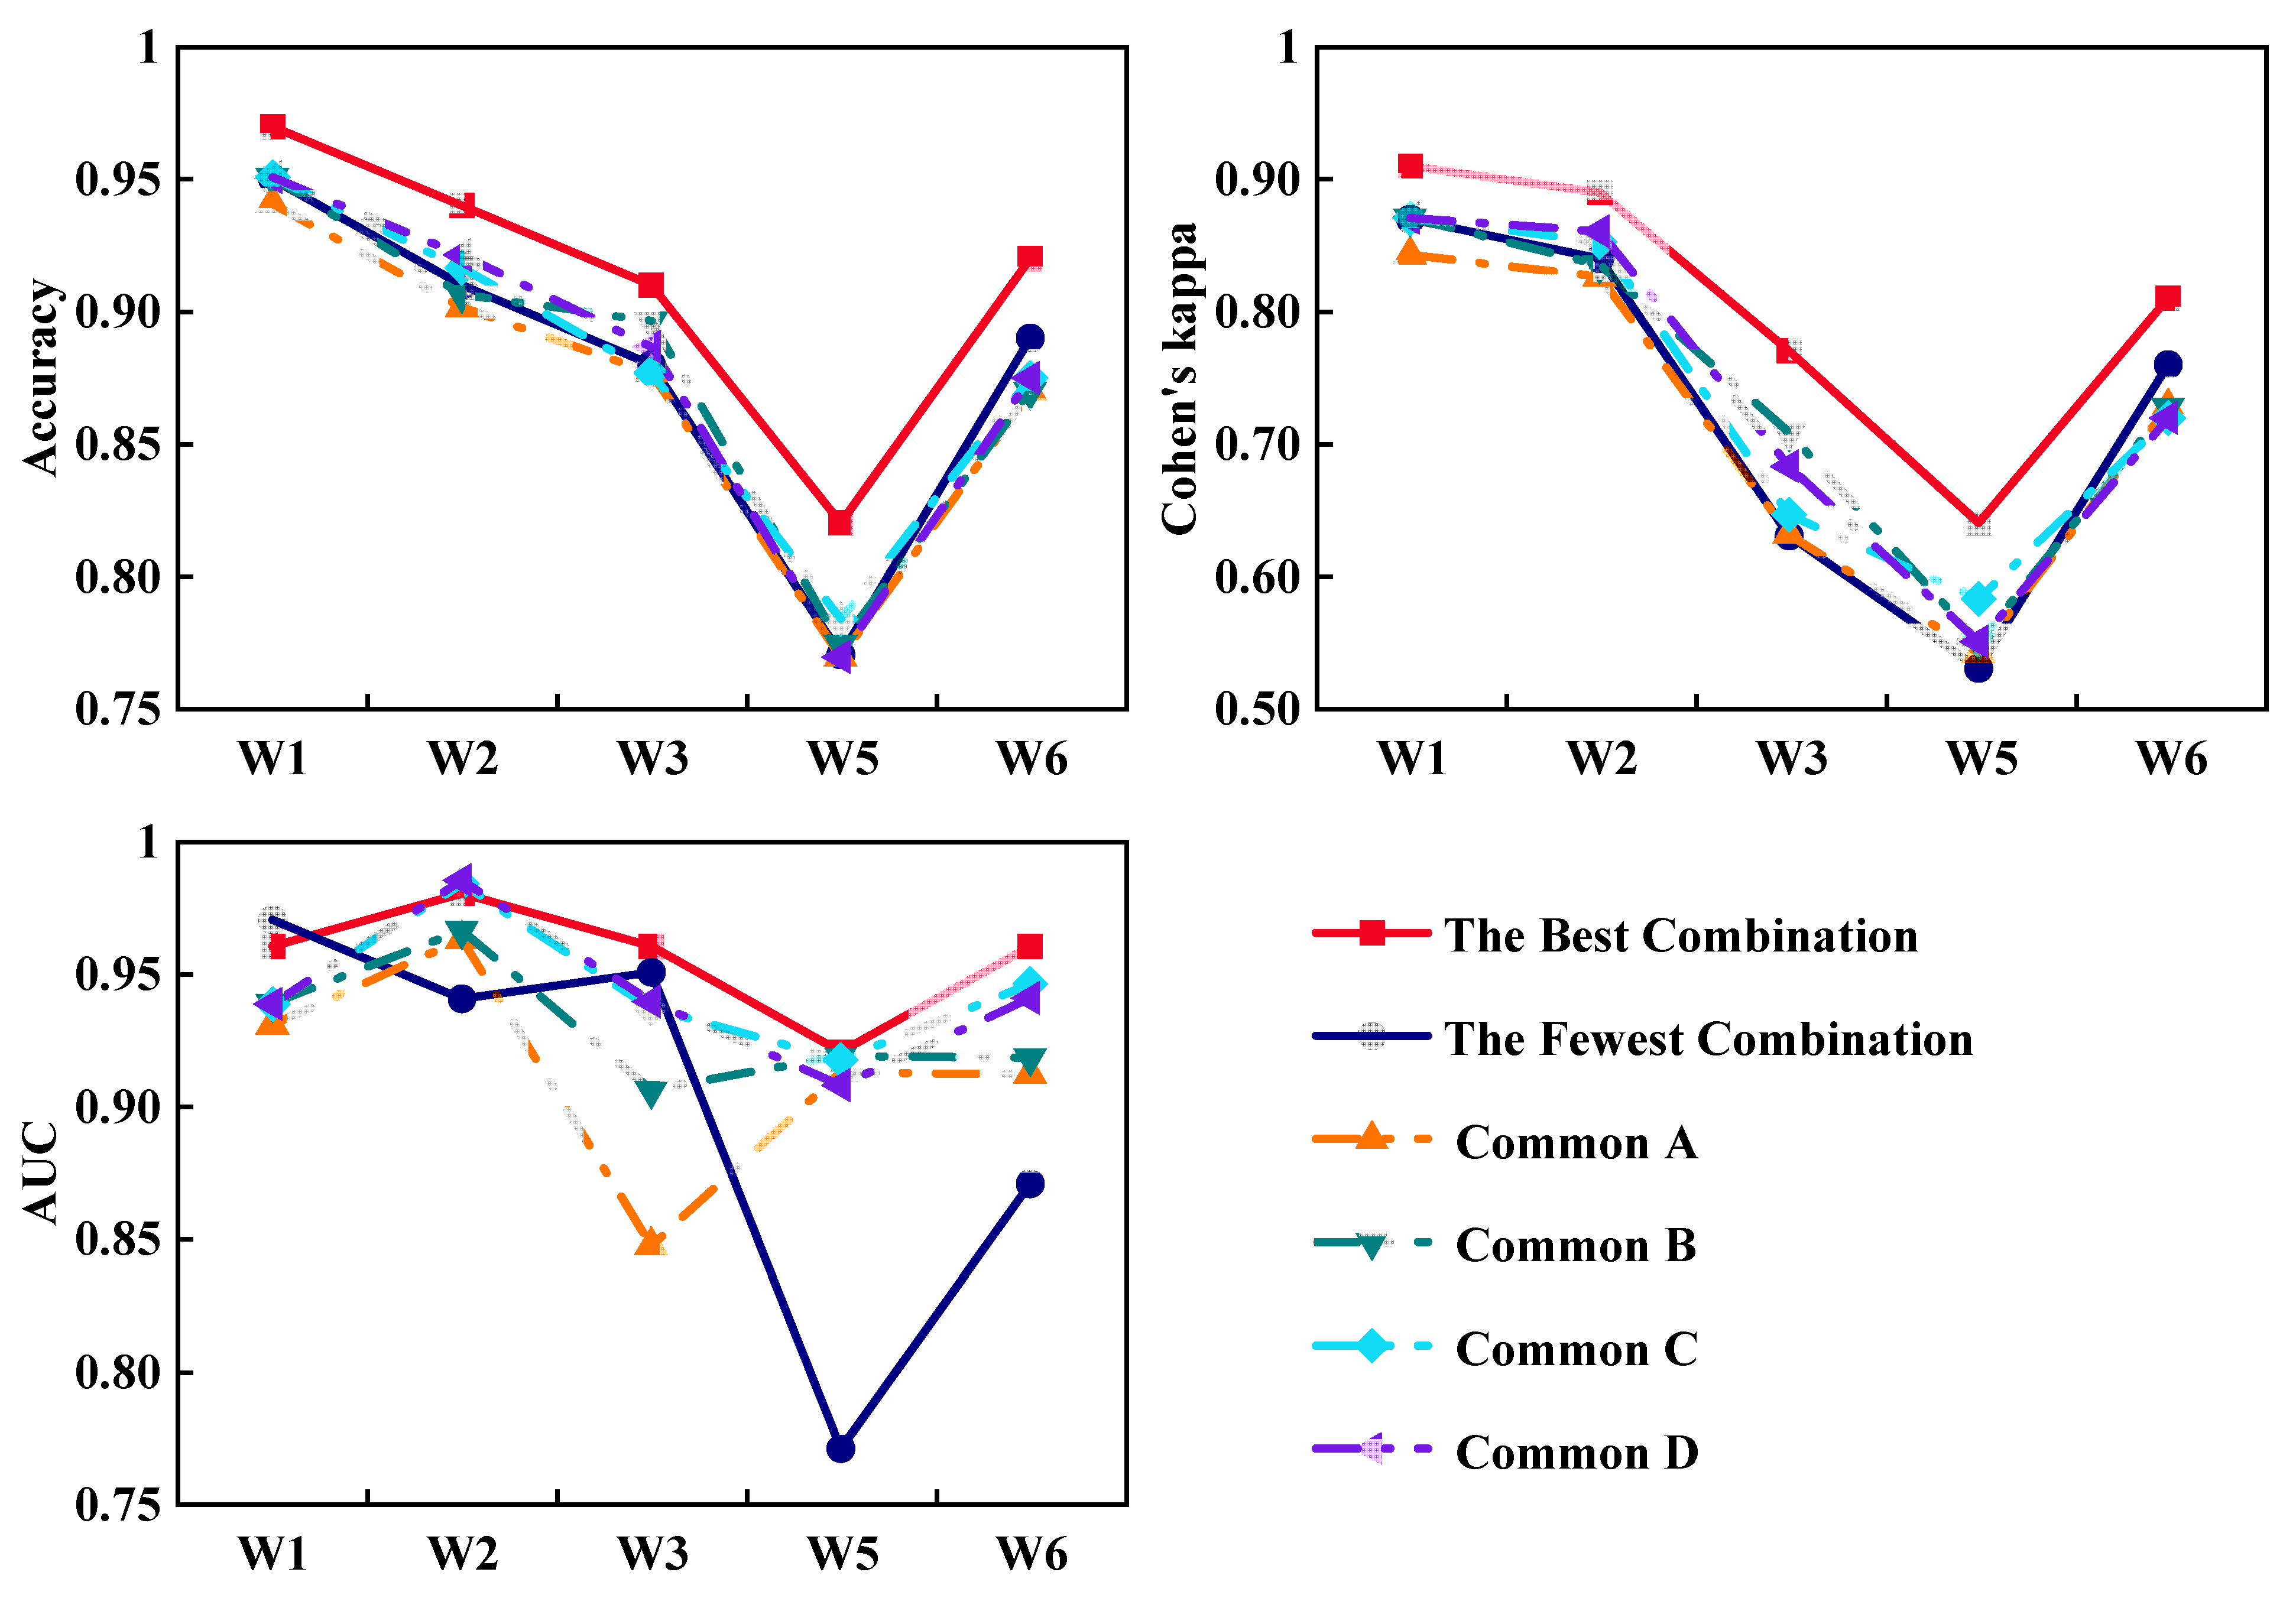
The differences in prediction power between the BC, FC, and CCs are shown in Figure 14. Although the BC was selected based on Cohen’s kappa, its indicator accuracy was also higher than that of the other five combinations. All combinations presented weak prediction power when applied to the thermal performance prediction of W5, with accuracies < 0.85. Although the AUC of the BC was not always the highest, it was consistently above 0.90, thereby guaranteeing its reliability. The FC and CCs had similar accuracy and Cohen’s kappa values, and the CCs with five body parts performed better than the CCs with four body parts and the FC in these two aspects. All of the combinations had Cohen’s kappa values < 0.6 but > 0.5 when the thermal preference of W5 was predicted. When it came to the AUC, the FC and CCs fluctuated with a value ≥ 0.85, except for the AUC of the FC for W5 and that of the “Common A” CC for W3.

Figure 14.
The prediction power of the best combination, fewest combination, and common combinations.
Finally, we could conclude that the CCs can be selected to establish a thermal preference model that can be applied to more people. They can also achieve a balance between the prediction power and the number of body parts. The validation results of the CCs in Table 5 present the prediction power of each CC for each subject. “Common A” and “Common B” performed better than “Common C” and “Common D” in terms of their accuracy, Cohen’s kappa, and AUC values.
4.3. Limitations and Future Studies
This study was performed under unsteady conditions for two reasons. First, the survey was processed over a relatively long period and the subjects were all students who had to continue with their daily tasks. Second, the more realistic the test process, the more practical the model that was established from the collected samples. In addition, the thermal experience (the local skin temperature of seven body parts and the adjustment methods) of each of the five original subjects (those marked with a “W”) is presented in Figure 5.
If the research purpose of identifying the body parts were adjusted, non-neutral thermal preferences would contribute the main portion of the votes. The test for the model establishment was performed in winter. Although all thermal preferences occurred, the preference for cooler conditions accounted for a very small portion and that for no change was enhanced. As the prediction power of most combinations for the winter dataset was satisfactory, we considered there to be little influence of data imbalance on the prediction results. This is also supported by the validation by the “M” subjects, which was performed in summer. This study confirmed that overall thermal preference could be predicted by local thermal preference, but more work should be performed in non-neutral conditions.
More “W” subjects should be recruited to improve the applicability of the selected combinations and to establish an accurate thermal preference model. However, to validate the applicability of the model, this study designed another survey that was conducted in September. There are both pros and cons to this approach. First, since Shanghai is cold in winter and hot in summer, the main thermal sensations and preferences of the subjects was different in the different seasons, which was supported by the portioning of their thermal preference votes. However, the benefit of the season transition is that the application limitations of the model established in winter can be examined.
5. Conclusions
Personal thermal comfort information is important for the development of an economic and comfortable building environment. In the measurement of thermal comfort data, including too many or too few body parts can lead to high costs or significant errors in the predictions. This study minimised the number of body parts used in personal overall thermal preference prediction and decided which body parts should be selected according to the characterisation of each subject. The results led to the following conclusions:
- This study proposed three combinations: the BC, FC, and CCs. The BC consisted of eight, six, six, eight, and six body parts for subjects W1, W2, W3, W5, and W6, respectively, while the FC consisted of two, three, four, three, and four. From 26 commonly used combinations, one combination with four body parts and three combinations with five body parts were selected as the CCs.
- This study compared the effects of the three combination strategies. In the first stage, the BC performed the best and the FC performed slightly worse than the CCs. In the second stage, the validation of these models using another 14 subjects, the BC and CCs showed nearly equal prediction power. Among the four CCs, “Common A” and “Common B” had better comprehensive performances than “Common C” or “Common D”.
- Overall, a CC strategy is recommended. The validation of the five BCs, five FCs, and four CCs certified their prediction power. Their accuracy, Cohen’s kappa, and AUC were 0.91 ± 0.07, 0.75 ± 0.16, and 0.87 ± 0.09, respectively. The four CCs had an advantage in terms of the prediction power and the minimal number of local body parts used.
This study provides a recommendation for the selection of body parts to create a satisfactory building environment for all individuals. Based on our conclusions, researchers can design more efficient and economical experimental schemes. The link between local skin temperature and local thermal preference requires further investigation in the future. The skin temperature difference between each body part greatly contributes to the difference in local thermal preference (Appendix E). Research on local thermal preference should be carried out to improve the prediction power for overall thermal preference.
Author Contributions
Conceptualization, K.Z.; data curation, K.Z.; formal analysis, K.Z.; funding acquisition, H.Y.; investigation, K.Z.; methodology, K.Z., Y.T. and C.L.; resources, H.Y.; supervision, Y.T. and M.L.; validation, K.Z.; visualization, Z.S.; writing—original draft, K.Z; writing—review and editing, Y.T. All authors have read and agreed to the published version of the manuscript.
Funding
This research was funded by the National Natural Science Foundation of China (no. 52078355 and no. 52108086).
Institutional Review Board Statement
The study was conducted in accordance with the Declaration of Helsinki, and approved by The Ethics Review Center of Tongji University (protocol code 2020tjdx051 and date of 7 April 2021).
Informed Consent Statement
Informed consent was obtained from all subjects involved in the study.
Data Availability Statement
The data presented in this study are available on request from the corresponding author.
Acknowledgments
We would like to thank the 19 subjects for their participation.
Conflicts of Interest
The authors declare no conflict of interest.
Appendix A

Figure A1.
Personal information questionnaire.
Figure A1.
Personal information questionnaire.
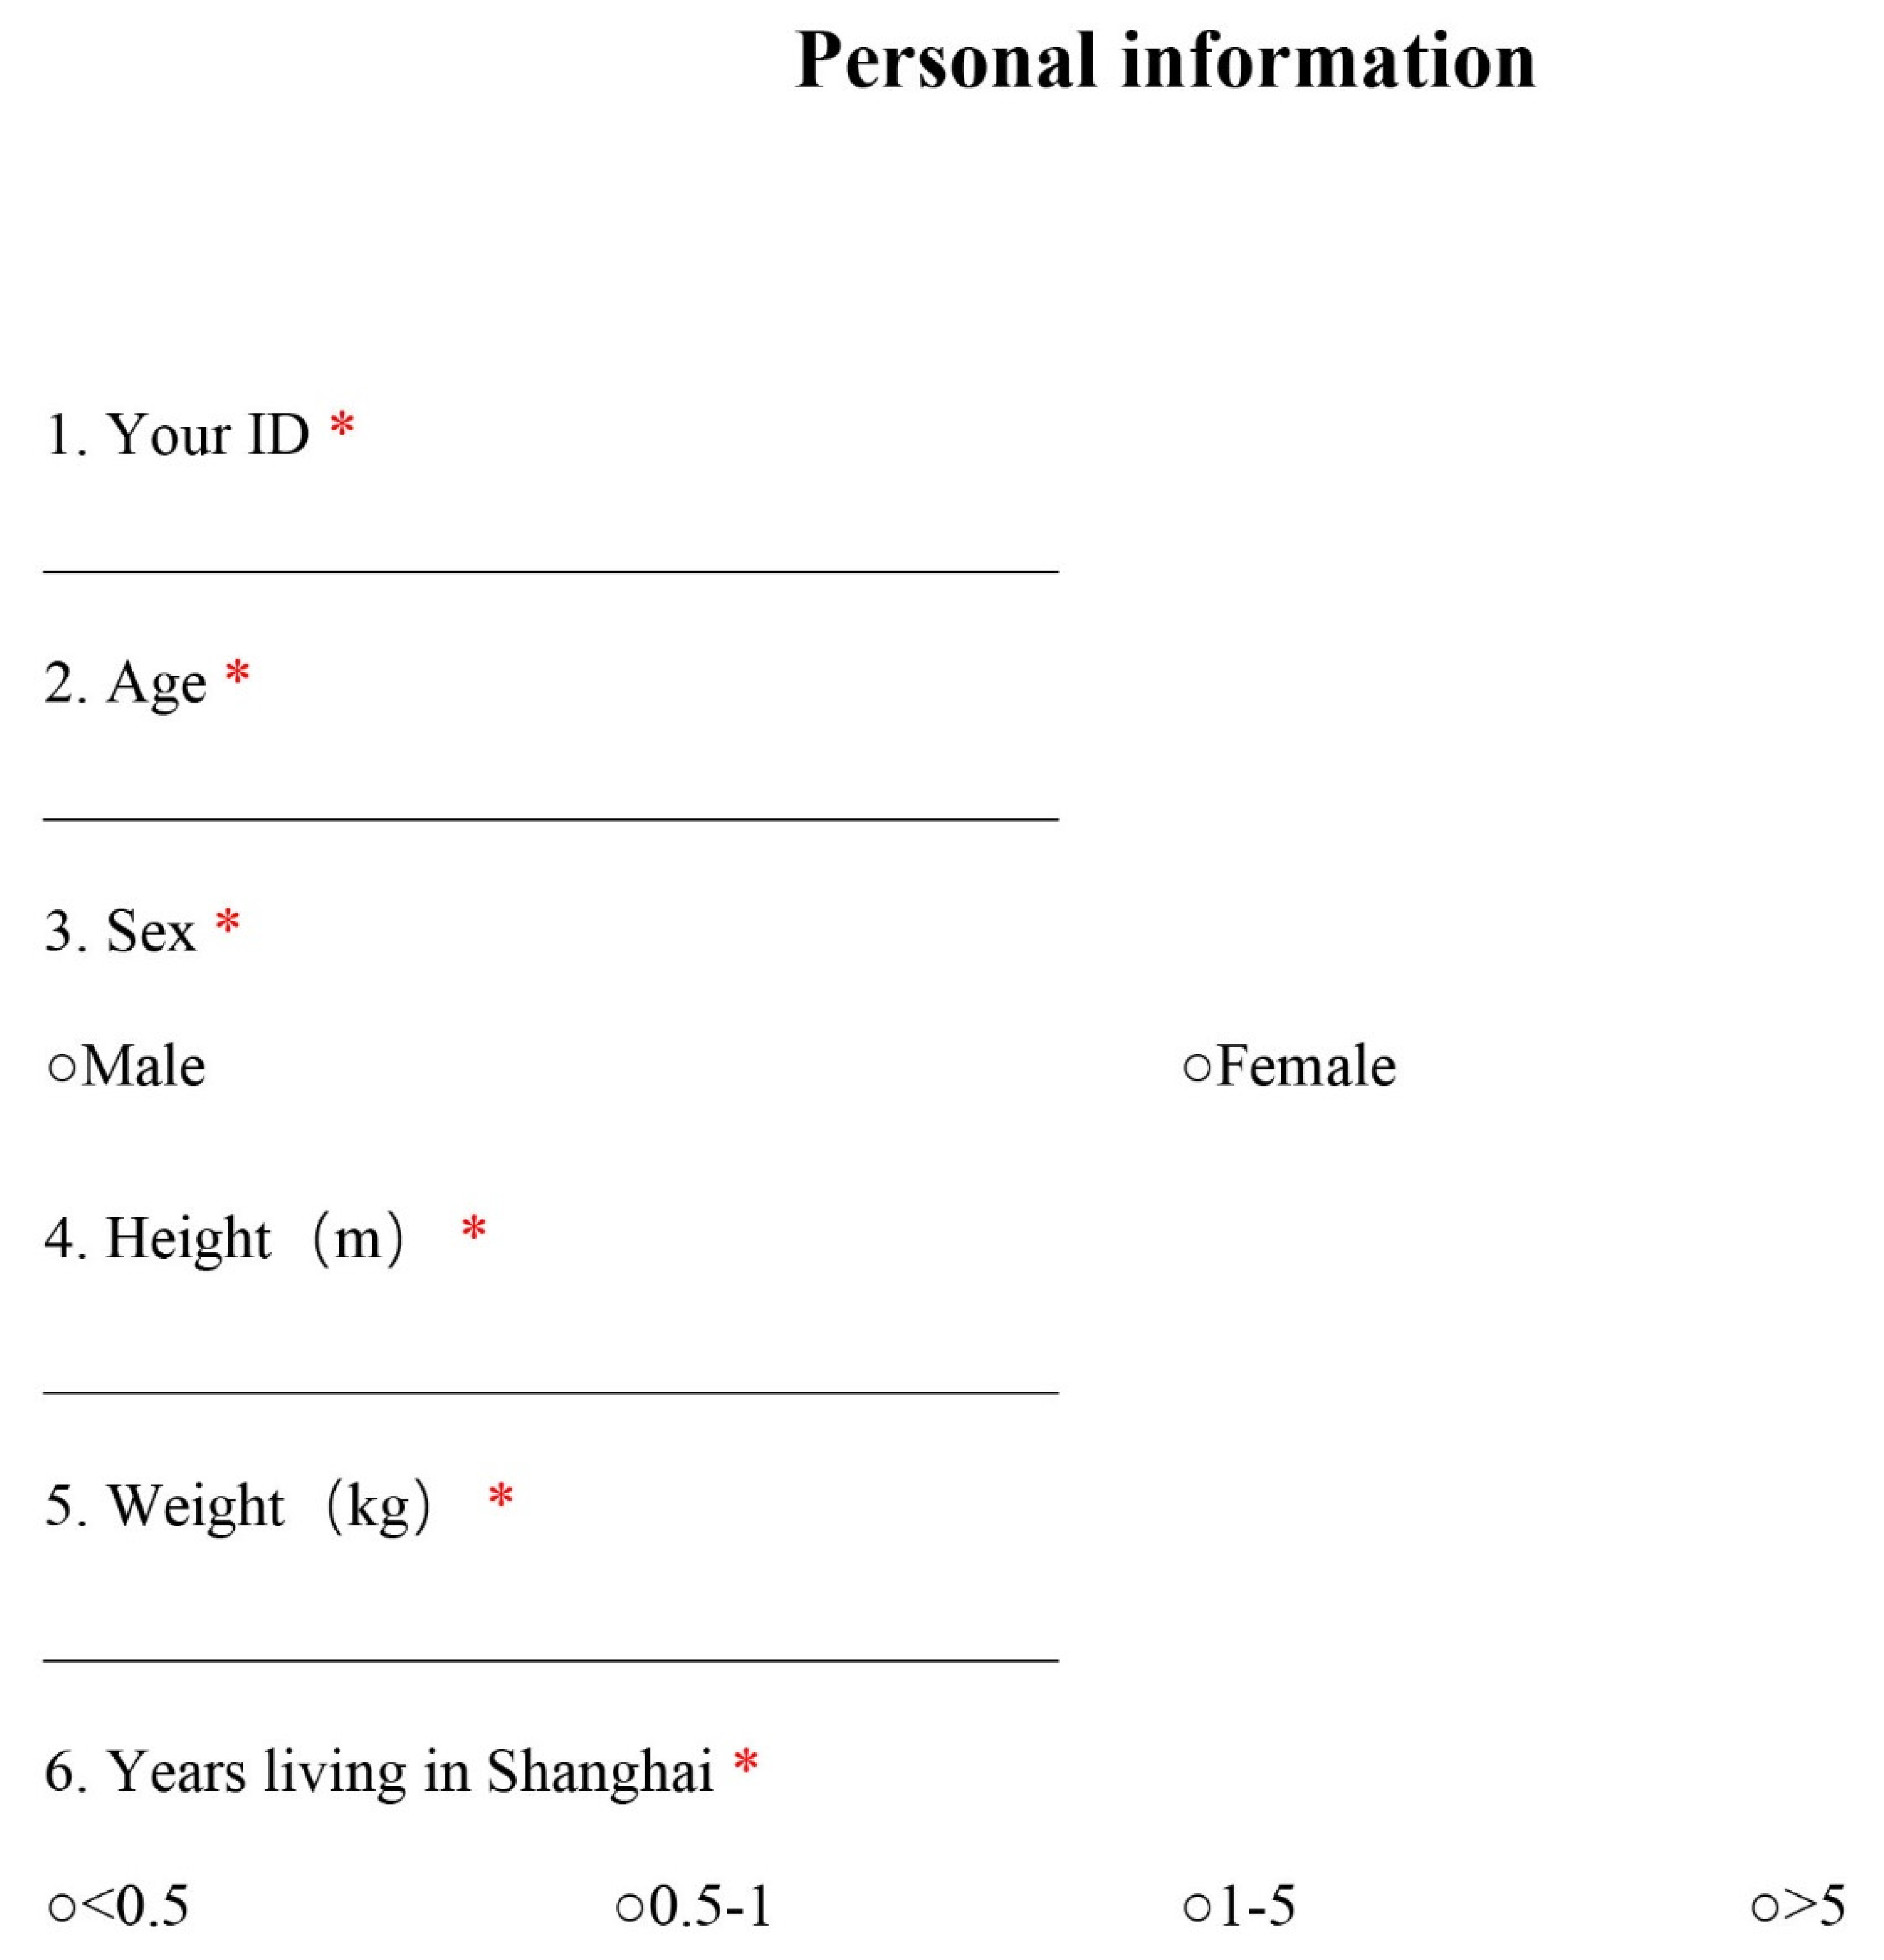
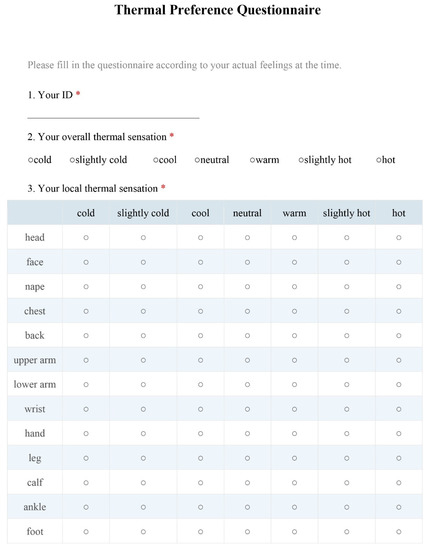
Figure A2.
Thermal preference questionnaire, part one.
Figure A2.
Thermal preference questionnaire, part one.
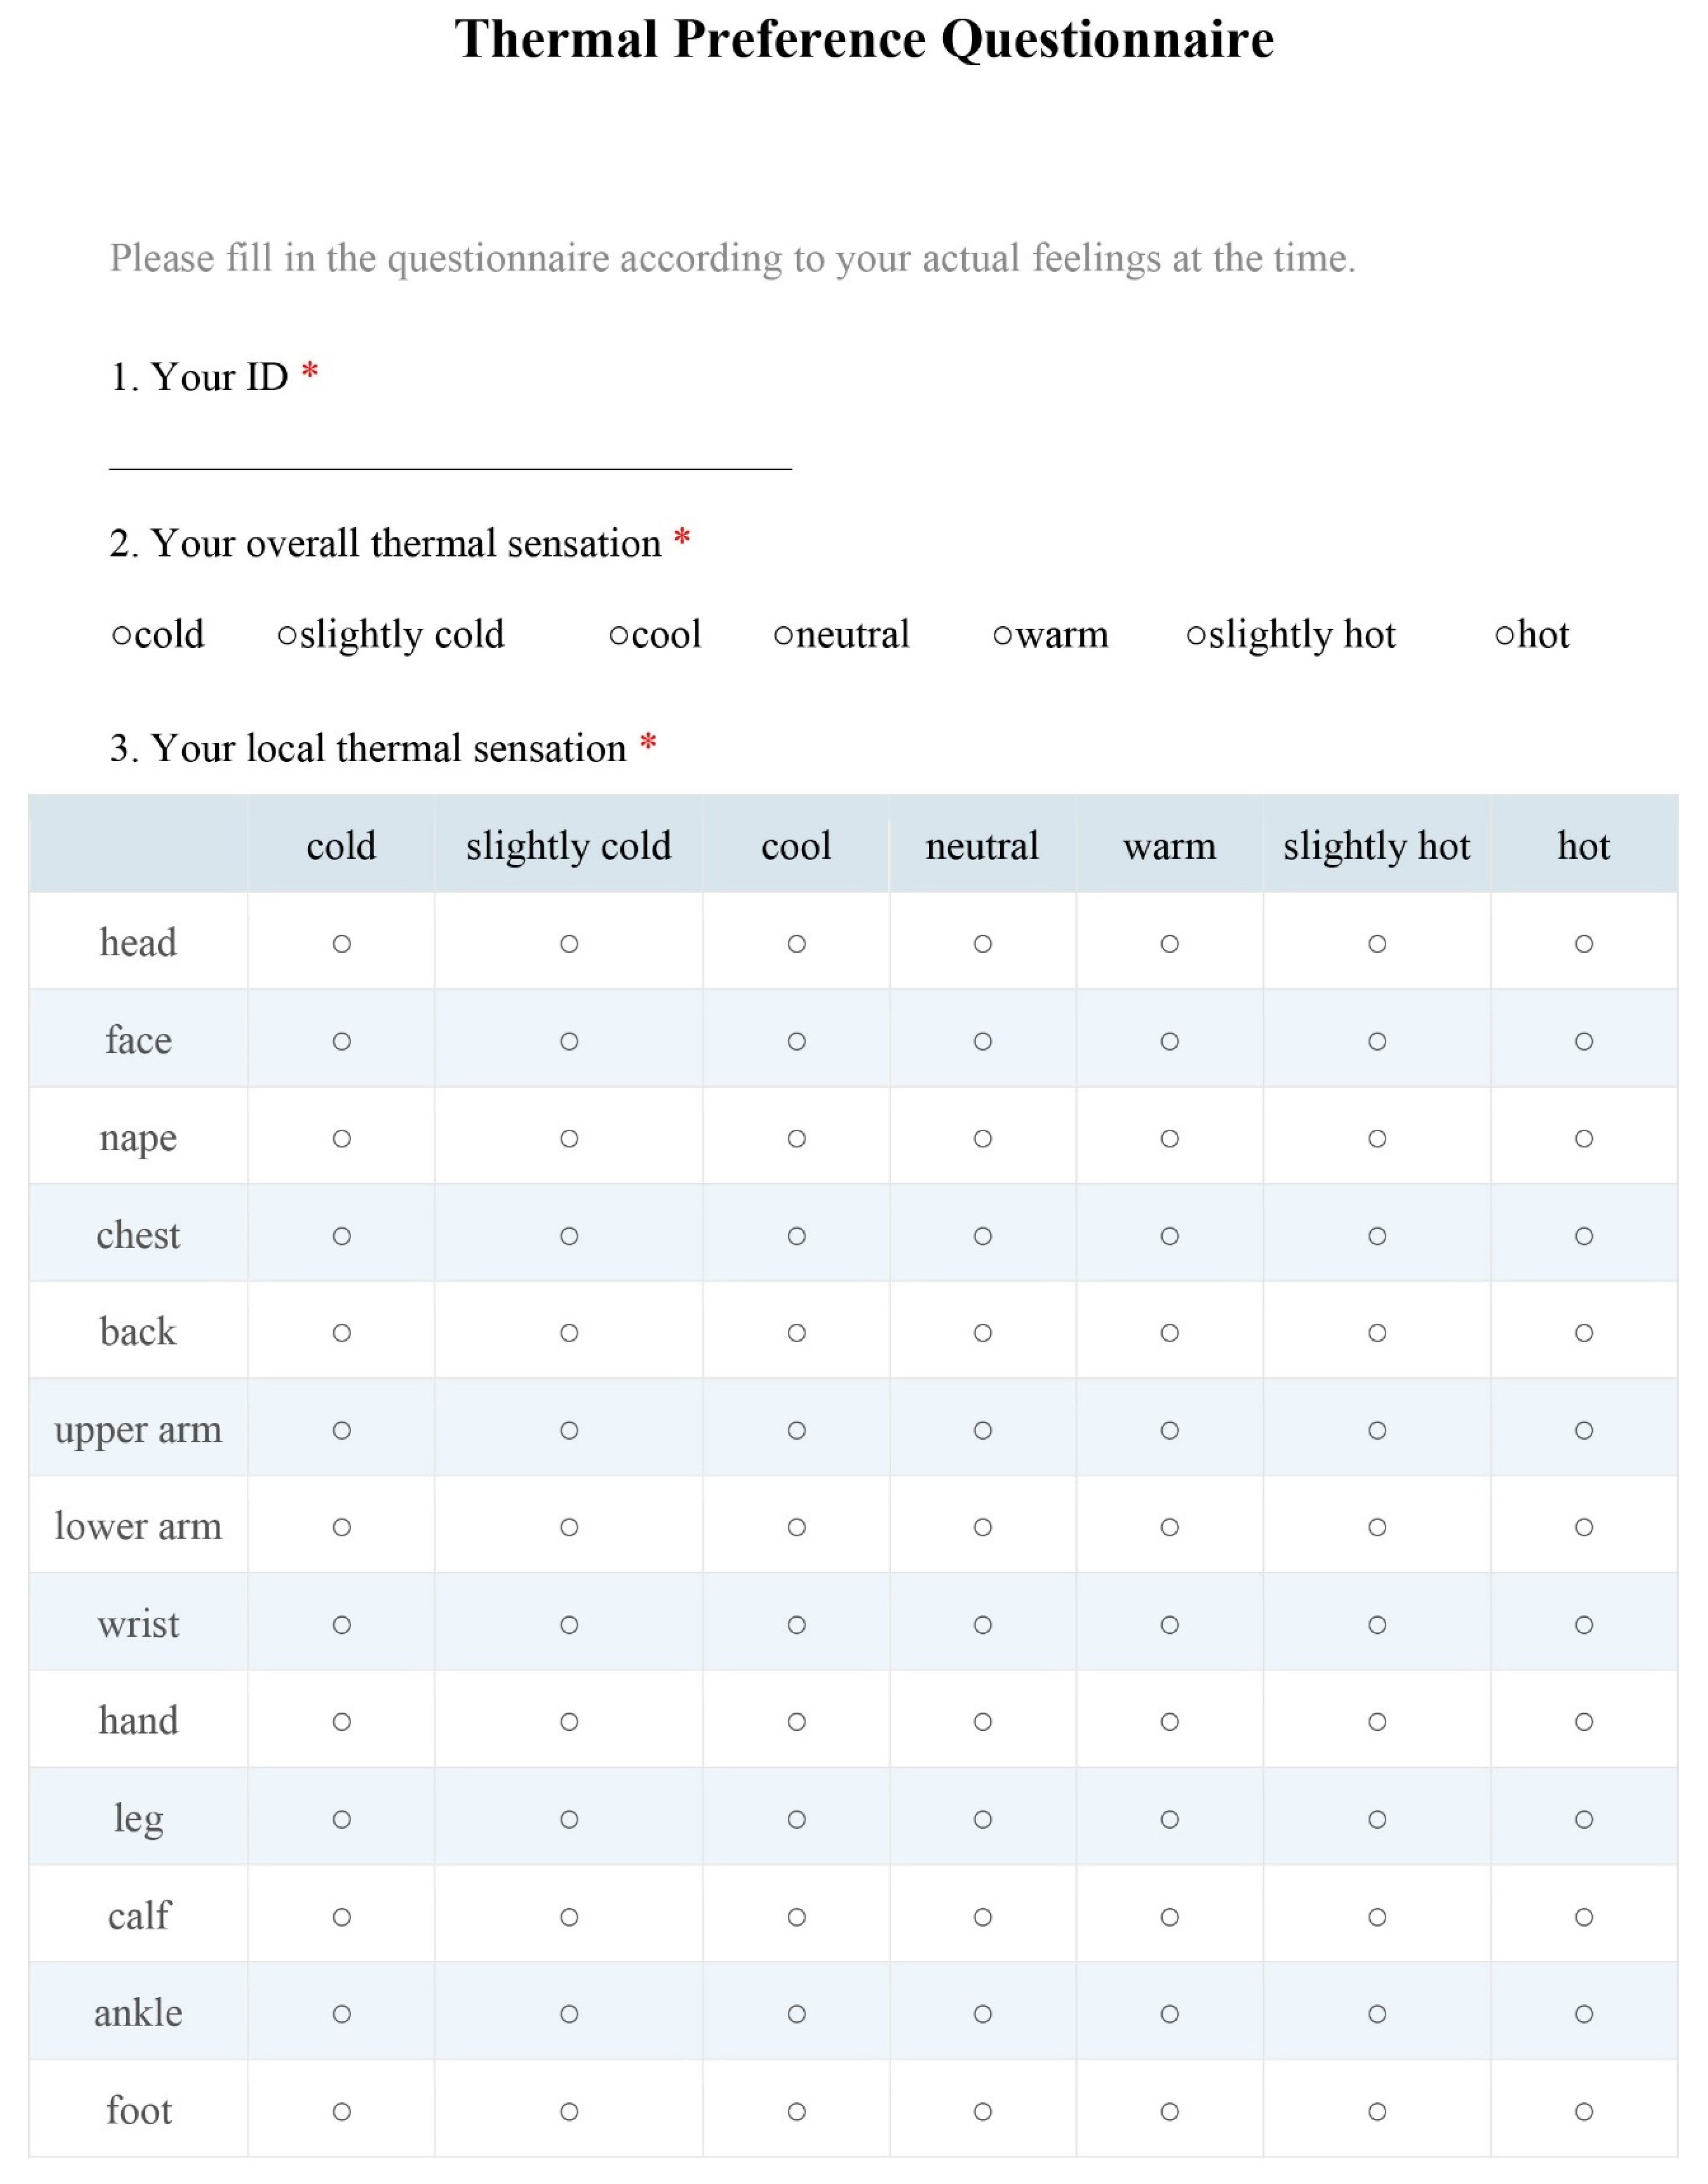
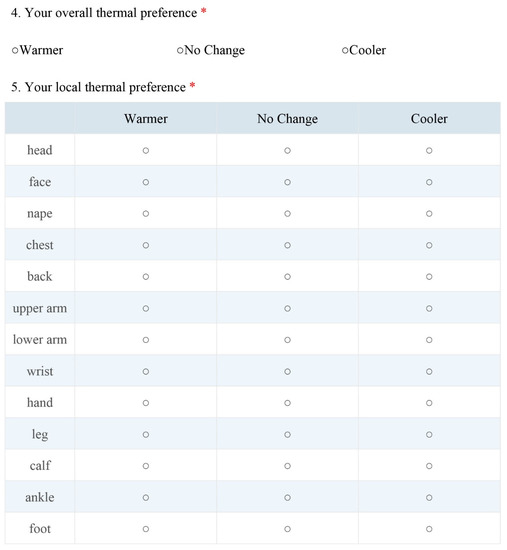
Figure A3.
Thermal preference questionnaire, part two.
Figure A3.
Thermal preference questionnaire, part two.
Appendix B
Table A1.
The thermal preference votes of the rest of the subjects.
Table A1.
The thermal preference votes of the rest of the subjects.
| Subject ID | M6 | M7 | M8 | M9 | M10 | ||||||||||
|---|---|---|---|---|---|---|---|---|---|---|---|---|---|---|---|
| Questionnaires | 161 | 156 | 150 | 154 | 153 | ||||||||||
| Percentage of votes | cooler | no change | warmer | cooler | no change | warmer | cooler | no change | warmer | cooler | no change | warmer | cooler | no change | warmer |
| Overall | 49.38 | 48.75 | 1.88 | 17.50 | 80.63 | 1.88 | 2.50 | 91.88 | 5.63 | 0.63 | 95.00 | 4.38 | 1.25 | 98.13 | 0.63 |
| Head | 20.78 | 75.32 | 3.90 | 13.64 | 81.82 | 4.55 | 11.69 | 78.57 | 9.74 | 10.39 | 83.77 | 5.84 | 9.09 | 88.96 | 1.95 |
| Face | 18.71 | 75.48 | 5.81 | 16.77 | 79.35 | 3.87 | 16.77 | 79.35 | 3.87 | 16.77 | 79.35 | 3.87 | 17.42 | 78.71 | 3.87 |
| Nape | 14.57 | 83.44 | 1.99 | 14.57 | 83.44 | 1.99 | 14.57 | 82.78 | 2.65 | 14.57 | 83.44 | 1.99 | 13.91 | 86.09 | 0 |
| Chest | 24.84 | 64.33 | 10.83 | 24.20 | 64.33 | 11.46 | 24.20 | 64.33 | 11.46 | 23.57 | 65.61 | 10.83 | 23.57 | 66.24 | 10.19 |
| Back | 38.61 | 60.76 | 0.63 | 5.70 | 92.41 | 1.90 | 3.80 | 94.30 | 1.90 | 2.53 | 96.20 | 1.27 | 10.76 | 87.97 | 1.27 |
| Upper arm | 16.77 | 81.94 | 1.29 | 15.48 | 83.87 | 0.65 | 12.90 | 85.16 | 1.94 | 7.10 | 92.90 | 0 | 5.16 | 94.84 | 0 |
| Lower arm | 12.67 | 83.33 | 4.00 | 4.00 | 87.33 | 8.67 | 3.33 | 88.00 | 8.67 | 2.67 | 96.00 | 1.33 | 4.67 | 94.00 | 1.33 |
| Wrist | 12.99 | 83.77 | 3.25 | 13.64 | 75.32 | 11.04 | 10.39 | 79.22 | 10.39 | 10.39 | 85.71 | 3.90 | 9.09 | 87.01 | 3.90 |
| Hand | 47.06 | 52.29 | 0.65 | 49.67 | 43.79 | 6.54 | 43.14 | 52.94 | 3.92 | 41.83 | 56.86 | 1.31 | 41.18 | 57.52 | 1.31 |
| Leg | 27.15 | 58.28 | 14.57 | 12.58 | 62.25 | 25.17 | 7.95 | 68.21 | 23.84 | 1.99 | 96.69 | 1.32 | 3.31 | 96.03 | 0.66 |
| Calf | 16.56 | 82.12 | 1.32 | 5.30 | 94.04 | 0.66 | 0.66 | 86.09 | 13.25 | 0 | 100 | 0 | 1.32 | 98.01 | 0.66 |
| Ankle | 57.42 | 41.29 | 1.29 | 20 | 65.16 | 14.84 | 12.26 | 67.74 | 20 | 5.81 | 90.32 | 3.87 | 10.97 | 89.03 | 0 |
| Foot | 22.88 | 65.36 | 11.76 | 7.19 | 64.05 | 28.76 | 7.19 | 66.01 | 26.80 | 3.27 | 85.62 | 11.11 | 3.92 | 82.35 | 13.73 |
| Subject ID | M11 | M12 | M13 | M14 | |||||||||||
| Questionnaires | 151 | 151 | 155 | 153 | |||||||||||
| Percentage of votes | cooler | no change | warmer | cooler | no change | warmer | cooler | no change | warmer | cooler | no change | warmer | |||
| Overall | 14.38 | 85.63 | 0 | 6.25 | 91.88 | 1.88 | 2.50 | 95.00 | 2.50 | 31.88 | 66.25 | 1.88 | |||
| Head | 12.34 | 87.01 | 0.65 | 12.34 | 79.87 | 7.79 | 9.09 | 68.83 | 22.08 | 9.09 | 85.71 | 5.19 | |||
| Face | 16.77 | 81.29 | 1.94 | 16.13 | 81.94 | 1.94 | 16.13 | 81.94 | 1.94 | 16.13 | 81.94 | 1.94 | |||
| Nape | 13.91 | 86.09 | 0 | 13.91 | 86.09 | 0 | 13.91 | 86.09 | 0 | 13.91 | 85.43 | 0.66 | |||
| Chest | 23.57 | 65.61 | 10.83 | 22.29 | 64.97 | 12.74 | 22.29 | 66.24 | 11.46 | 23.57 | 66.24 | 10.19 | |||
| Back | 7.59 | 91.77 | 0.63 | 7.59 | 91.77 | 0.63 | 2.53 | 97.47 | 0 | 3.80 | 96.20 | 0 | |||
| Upper arm | 15.48 | 83.87 | 0.65 | 14.84 | 84.52 | 0.65 | 5.81 | 93.55 | 0.65 | 14.84 | 81.94 | 3.23 | |||
| Lower arm | 2.00 | 92.67 | 5.33 | 2.00 | 92.67 | 5.33 | 2.00 | 97.33 | 0.67 | 6.00 | 92.67 | 1.33 | |||
| Wrist | 8.44 | 90.26 | 1.30 | 7.79 | 92.21 | 0 | 7.14 | 92.21 | 0.65 | 7.14 | 92.21 | 0.65 | |||
| Hand | 41.83 | 50.33 | 7.84 | 40.52 | 53.59 | 5.88 | 42.48 | 50.98 | 6.54 | 44.44 | 48.37 | 7.19 | |||
| Leg | 16.56 | 72.19 | 11.26 | 13.91 | 74.83 | 11.26 | 3.97 | 94.04 | 1.99 | 3.31 | 95.36 | 1.32 | |||
| Calf | 4.64 | 94.70 | 0.66 | 0 | 84.77 | 15.23 | 0 | 99.34 | 0.66 | 7.28 | 86.09 | 6.62 | |||
| Ankle | 16.13 | 60.65 | 23.23 | 12.26 | 54.19 | 33.55 | 6.45 | 82.58 | 10.97 | 20.65 | 78.06 | 1.29 | |||
| Foot | 9.15 | 77.12 | 13.73 | 8.50 | 78.43 | 13.07 | 9.15 | 84.97 | 5.88 | 13.07 | 74.51 | 12.42 | |||
Appendix C
Table A2.
Details of the body parts used in 26 common combinations.
Table A2.
Details of the body parts used in 26 common combinations.
| Combination | Body Parts | |
|---|---|---|
| 4 | Common A | Face, back, upper arm, calf |
| 5 | Common B | Face, back, upper arm, wrist, calf |
| Common C | Face, back, upper arm, leg, ankle | |
| Common D | Face, back, lower arm, leg, ankle | |
| 6 | Common 6.1 | Head, face, chest, upper arm, hand, ankle |
| Common 6.2 | Face, nape, chest, upper arm, hand, ankle | |
| Common 6.3 | Face, chest, back, upper arm, leg, ankle | |
| Common 6.4 | Face, chest, back, lower arm, leg, ankle | |
| Common 6.5 | Face, chest, back, lower arm, calf, ankle | |
| Common 6.6 | Face, chest, upper arm, lower arm, hand, ankle | |
| Common 6.7 | Face, chest, lower arm, wrist, hand, ankle | |
| Common 6.8 | Face, chest, lower arm, wrist, leg, ankle | |
| 7 | Common 7.1 | Head, face, chest, upper arm, lower arm, hand, ankle |
| Common 7.2 | Head, nape, back, upper arm, hand, leg, foot | |
| Common 7.3 | Face, nape, chest, lower arm, hand, leg, ankle | |
| Common 7.4 | Face, nape, back, lower arm, wrist, leg, ankle | |
| Common 7.5 | Face, chest, lower arm, hand, leg, ankle, foot | |
| 8 | Common 8.1 | Head, face, chest, upper arm, hand, leg, calf, ankle |
| Common 8.2 | Head, face, chest, upper arm, hand, leg, ankle, foot | |
| Common 8.3 | Face, chest, back, upper arm, hand, leg, ankle, foot | |
| Common 8.4 | Face, chest, back, lower arm, hand, leg, calf, ankle | |
| 9 | Common 9.1 | Face, nape, chest, back, upper arm, hand, leg, ankle, foot |
| Common 9.2 | Face, nape, chest, upper arm, lower arm, hand, leg, ankle, foot | |
| Common 9.3 | Face, nape, chest, upper arm, hand, leg, calf, ankle, foot | |
| Common 9.4 | Face, chest, upper arm, lower arm, wrist, hand, leg, ankle, foot | |
| 13 | Common 13.1 | Head, face, chest, upper arm, lower arm, wrist, hand, leg, ankle, foot |
Appendix D
Table A3.
Subject-averaged prediction power of 26 commonly used combinations.
Table A3.
Subject-averaged prediction power of 26 commonly used combinations.
| Combination | Accuracy | Cohen’s Kappa | AUC | Precision | Recall | |||||
|---|---|---|---|---|---|---|---|---|---|---|
| Cooler | No Change | Warmer | Cooler | No Change | Warmer | |||||
| 4 | Common A | 0.87 ± 0.06 | 0.71 ± 0.13 | 0.91 ± 0.04 | 0.86 ± 0.10 | 0.89 ± 0.09 | 0.84 ± 0.21 | 0.75 ± 0.18 | 0.93 ± 0.05 | 0.81 ± 0.22 |
| 5 | Common B | 0.88 ± 0.07 | 0.74 ± 0.13 | 0.93 ± 0.02 | 0.85 ± 0.10 | 0.90 ± 0.09 | 0.86 ± 0.18 | 0.79 ± 0.14 | 0.93 ± 0.05 | 0.80 ± 0.26 |
| Common C | 0.88 ± 0.06 | 0.73 ± 0.13 | 0.94 ± 0.02 | 0.86 ± 0.07 | 0.90 ± 0.07 | 0.92 ± 0.07 | 0.78 ± 0.12 | 0.92 ± 0.05 | 0.72 ± 0.27 | |
| Common D | 0.88 ± 0.07 | 0.74 ± 0.13 | 0.94 ± 0.03 | 0.87 ± 0.06 | 0.90 ± 0.08 | 0.90 ± 0.06 | 0.77 ± 0.12 | 0.93 ± 0.05 | 0.82 ± 0.23 | |
| 6 | Common 6.1 | 0.88 ± 0.07 | 0.73 ± 0.14 | 0.95 ± 0.03 | 0.88 ± 0.10 | 0.88 ± 0.08 | 0.90 ± 0.11 | 0.75 ± 0.09 | 0.94 ± 0.04 | 0.69 ± 0.28 |
| Common 6.2 | 0.88 ± 0.07 | 0.73 ± 0.13 | 0.95 ± 0.03 | 0.91 ± 0.07 | 0.87 ± 0.07 | 0.82 ± 0.21 | 0.73 ± 0.09 | 0.96 ± 0.05 | 0.63 ± 0.23 | |
| Common 6.3 | 0.88 ± 0.07 | 0.74 ± 0.12 | 0.95 ± 0.02 | 0.87 ± 0.07 | 0.90 ± 0.07 | 0.91 ± 0.13 | 0.78 ± 0.11 | 0.92 ± 0.07 | 0.82 ± 0.16 | |
| Common 6.4 | 0.88 ± 0.07 | 0.74 ± 0.13 | 0.95 ± 0.02 | 0.87 ± 0.08 | 0.90 ± 0.08 | 0.90 ± 0.14 | 0.78 ± 0.11 | 0.92 ± 0.07 | 0.79 ± 0.19 | |
| Common 6.5 | 0.88 ± 0.07 | 0.73 ± 0.13 | 0.94 ± 0.03 | 0.84 ± 0.10 | 0.90 ± 0.08 | 0.88 ± 0.19 | 0.79 ± 0.11 | 0.91 ± 0.07 | 0.79 ± 0.19 | |
| Common 6.6 | 0.88 ± 0.06 | 0.73 ± 0.13 | 0.95 ± 0.03 | 0.90 ± 0.09 | 0.88 ± 0.07 | 0.89 ± 0.13 | 0.74 ± 0.08 | 0.95 ± 0.04 | 0.56 ± 0.35 | |
| Common 6.7 | 0.89 ± 0.07 | 0.75 ± 0.13 | 0.94 ± 0.03 | 0.90 ± 0.09 | 0.89 ± 0.08 | 0.91 ± 0.12 | 0.75 ± 0.09 | 0.95 ± 0.04 | 0.78 ± 0.22 | |
| Common 6.8 | 0.88 ± 0.07 | 0.73 ± 0.13 | 0.95 ± 0.03 | 0.85 ± 0.09 | 0.90 ± 0.07 | 0.87 ± 0.15 | 0.80 ± 0.10 | 0.91 ± 0.07 | 0.59 ± 0.36 | |
| 7 | Common 7.1 | 0.88 ± 0.07 | 0.73 ± 0.13 | 0.95 ± 0.03 | 0.91 ± 0.07 | 0.88 ± 0.08 | 0.82 ± 0.12 | 0.73 ± 0.08 | 0.96 ± 0.03 | 0.63 ± 0.40 |
| Common 7.2 | 0.88 ± 0.07 | 0.72 ± 0.13 | 0.94 ± 0.02 | 0.88 ± 0.11 | 0.88 ± 0.08 | 0.93 ± 0.07 | 0.75 ± 0.13 | 0.94 ± 0.06 | 0.57 ± 0.34 | |
| Common 7.3 | 0.88 ± 0.06 | 0.74 ± 0.12 | 0.95 ± 0.03 | 0.86 ± 0.08 | 0.90 ± 0.07 | 0.85 ± 0.14 | 0.79 ± 0.12 | 0.92 ± 0.07 | 0.62 ± 0.23 | |
| Common 7.4 | 0.88 ± 0.07 | 0.73 ± 0.13 | 0.95 ± 0.03 | 0.86 ± 0.08 | 0.90 ± 0.08 | 0.92 ± 0.08 | 0.79 ± 0.12 | 0.93 ± 0.06 | 0.60 ± 0.24 | |
| Common 7.5 | 0.89 ± 0.07 | 0.75 ± 0.13 | 0.95 ± 0.03 | 0.88 ± 0.07 | 0.91 ± 0.07 | 0.89 ± 0.14 | 0.80 ± 0.11 | 0.92 ± 0.07 | 0.66 ± 0.23 | |
| 8 | Common 8.1 | 0.88 ± 0.05 | 0.73 ± 0.11 | 0.95 ± 0.03 | 0.88 ± 0.07 | 0.90 ± 0.07 | 0.89 ± 0.12 | 0.77 ± 0.11 | 0.94 ± 0.04 | 0.61 ± 0.39 |
| Common 8.2 | 0.89 ± 0.06 | 0.74 ± 0.12 | 0.95 ± 0.03 | 0.89 ± 0.07 | 0.90 ± 0.08 | 0.89 ± 0.12 | 0.79 ± 0.12 | 0.94 ± 0.04 | 0.55 ± 0.34 | |
| Common 8.3 | 0.89 ± 0.07 | 0.76 ± 0.14 | 0.96 ± 0.02 | 0.88 ± 0.08 | 0.90 ± 0.08 | 0.93 ± 0.08 | 0.81 ± 0.12 | 0.93 ± 0.06 | 0.79 ± 0.19 | |
| Common 8.4 | 0.89 ± 0.06 | 0.74 ± 0.12 | 0.95 ± 0.03 | 0.88 ± 0.07 | 0.90 ± 0.07 | 0.90 ± 0.14 | 0.77 ± 0.13 | 0.94 ± 0.05 | 0.78 ± 0.18 | |
| 9 | Common 9.1 | 0.89 ± 0.07 | 0.75 ± 0.13 | 0.96 ± 0.03 | 0.86 ± 0.08 | 0.90 ± 0.08 | 0.92 ± 0.11 | 0.81 ± 0.12 | 0.93 ± 0.06 | 0.73 ± 0.25 |
| Common 9.2 | 0.89 ± 0.06 | 0.75 ± 0.11 | 0.96 ± 0.03 | 0.88 ± 0.07 | 0.90 ± 0.07 | 0.88 ± 0.10 | 0.80 ± 0.12 | 0.94 ± 0.04 | 0.72 ± 0.24 | |
| Common 9.3 | 0.88 ± 0.06 | 0.74 ± 0.12 | 0.95 ± 0.03 | 0.86 ± 0.08 | 0.90 ± 0.08 | 0.92 ± 0.11 | 0.79 ± 0.12 | 0.93 ± 0.05 | 0.71 ± 0.23 | |
| Common 9.4 | 0.89 ± 0.06 | 0.75 ± 0.11 | 0.96 ± 0.03 | 0.87 ± 0.07 | 0.90 ± 0.07 | 0.85 ± 0.14 | 0.79 ± 0.11 | 0.93 ± 0.05 | 0.79 ± 0.19 | |
| 13 | Common 13.1 | 0.89 ± 0.06 | 0.75 ± 0.12 | 0.96 ± 0.03 | 0.87 ± 0.08 | 0.90 ± 0.07 | 0.92 ± 0.07 | 0.79 ± 0.10 | 0.93 ± 0.05 | 0.80 ± 0.21 |
Appendix E
Skin Temperature and Thermal Preference
The skin temperature of the nape (34.83 ± 1.41°C), chest (35.11 ± 1.06 °C), and back (35.21 ± 1.07 °C) were obviously higher than those of the wrist (32.21 ± 2.17 °C), leg (32.83 ± 1.50 °C), calf (32.23 ± 1.25 °C), and ankle (30.80 ± 1.92 °C). As local thermal preference can accurately predict overall thermal preference, we hoped that there is a measurable parameter representing local thermal preference and that overall thermal preference can be predicted without surveying subjective feelings. Thus, local skin temperature was considered first. However, after trying to predict local thermal preference, this study found that skin temperature and its related parameters (average value, gradient value) showed poor performance. This result is consistent with the research of Salehi [31]. He found that exposure time affected thermal sensation but had no obvious influence on skin temperature.
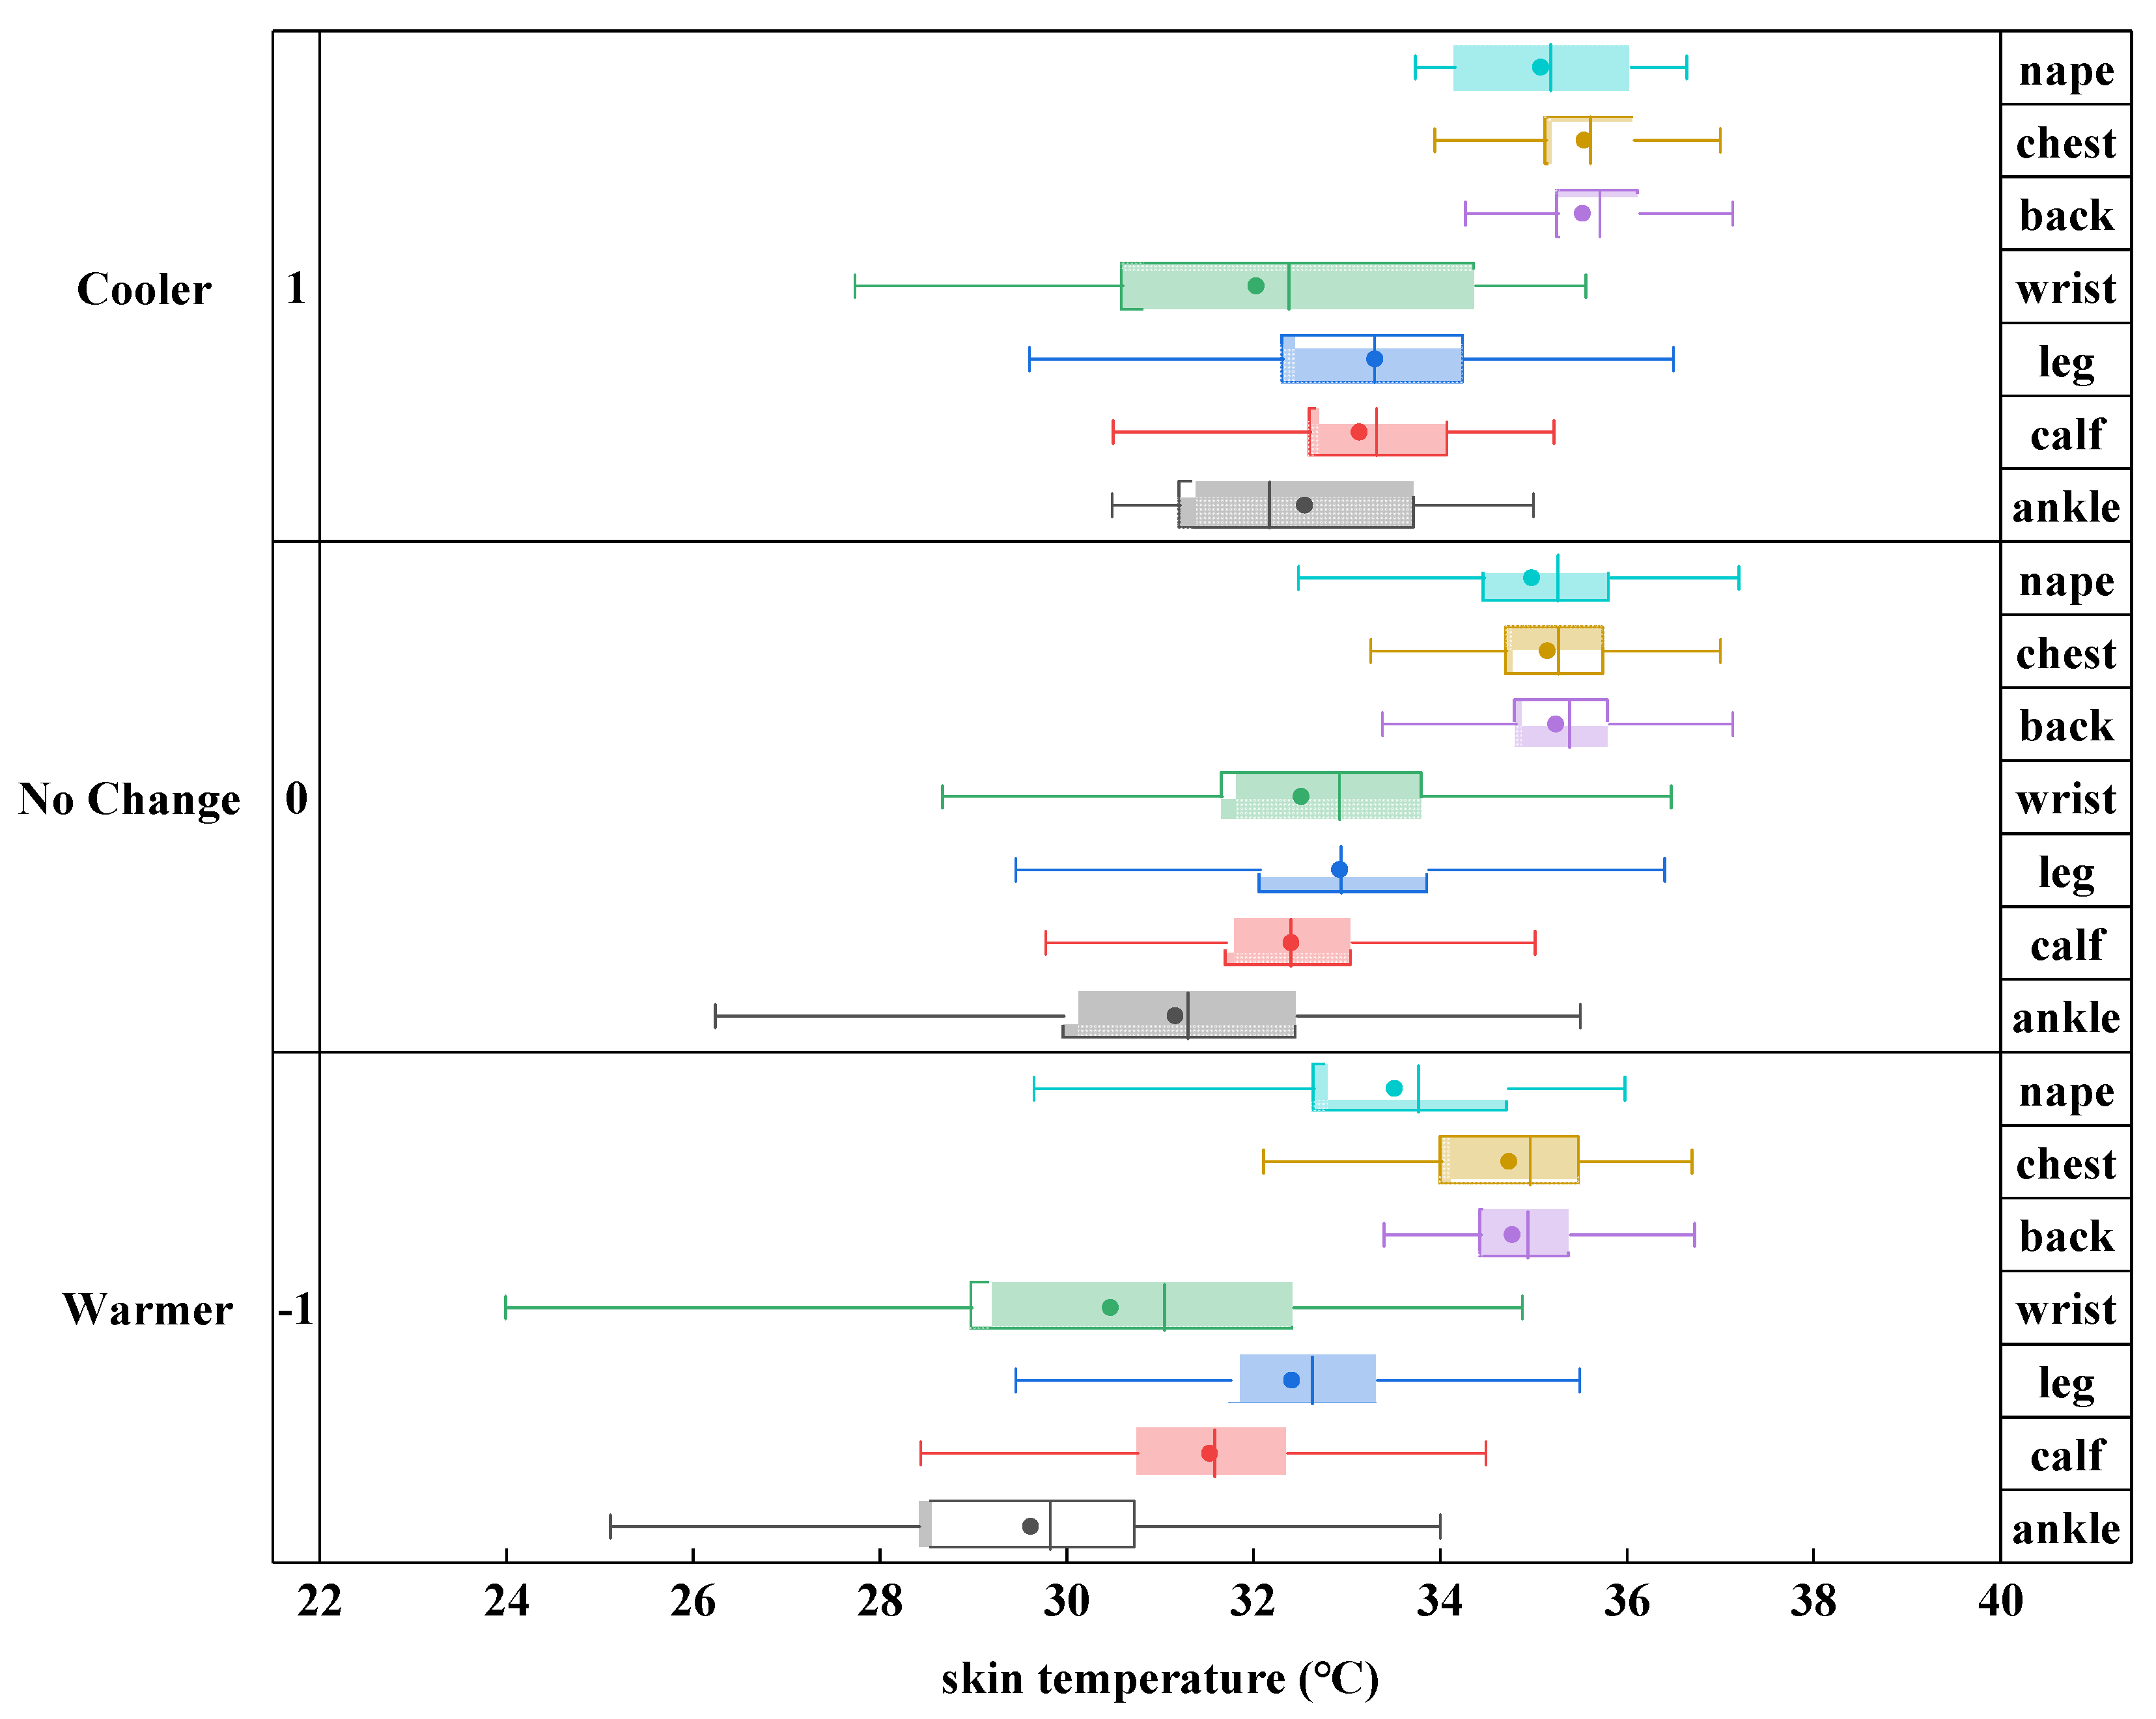
A two-sample t-test that was performed indicated that, at a significance level of 0.05, the skin temperature of different body parts was significantly different from each other. A boxplot of the skin temperature and thermal preferences is shown in Figure A4, where the local skin temperature of the wrist, leg, calf, and foot were significantly lower than those of the other parts. The wrist (32.03 °C (cooler), 32.51 °C (no change), and 30.47 °C (warmer)) and ankle (32.55 °C, 31.16 °C, and 29.61 °C) had the lowest skin temperature for all three thermal preferences. The skin temperature of the nape, chest, and back (group 1) were significantly higher than those of the other body parts (group 2) for all thermal preferences. As the thermal preference changed from 1 (cooler) to −1 (warmer), the value of Average (group 1) − Average (group 2) increased from 1.62 to 3.31 °C, which is obviously higher than the decreasing trend of each body part. This means that the local thermal preference may depend on the skin temperature differences between body parts. Thus, more attention should be paid to skin temperature differences between body parts.
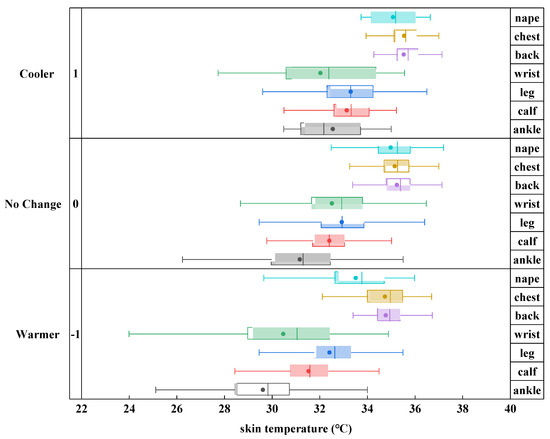
Figure A4.
Local skin temperature and thermal preference.
Figure A4.
Local skin temperature and thermal preference.
References
- Yao, R.; Li, B.; Steemers, K. Energy policy and standard for built environment in China. Renew. Energy 2005, 30, 1973–1988. [Google Scholar] [CrossRef]
- Yong, C.; Yiping, W.; Li, Z. Performance analysis on a building-integrated solar heating and cooling panel. Renew. Energy 2015, 74, 627–632. [Google Scholar] [CrossRef]
- Chenari, B.; Dias Carrilho, J.; Gameiro da Silva, M. Towards sustainable, energy-efficient and healthy ventilation strategies in buildings: A review. Renew. Sustain. Energy Rev. 2016, 59, 1426–1447. [Google Scholar] [CrossRef]
- Lan, L.; Tang, J.Y.; Wargocki, P.; Wyon, D.P.; Lian, Z. Cognitive performance was reduced by higher air temperature even when thermal comfort was maintained over the 24–28 degrees C range. Indoor Air 2022, 32, e12916. [Google Scholar] [CrossRef] [PubMed]
- Kükrer, E.; Eskin, N. Effect of design and operational strategies on thermal comfort and productivity in a multipurpose school building. J. Build. Eng. 2021, 44, 102697. [Google Scholar] [CrossRef]
- Criteria for the Indoor Environment Including Thermal, Indoor Air Quality, Light and Noise; EN15251:2007; European Committee for Standardization: Brussels, Belgium, 2007.
- ASHRAE. Thermal Environmental Conditions for Human Occupancy; ANSI/ASHRAE Standard 55-2013; American Society of Heating, Refrigerating and Air-Conditioning Engineers: Atlanta, GA, USA, 2013. [Google Scholar]
- ISO. Ergonomics of the Thermal Environment—Analytical Determination and Interpretation of Thermal Comfort Using Calculation of the PMV and PPD Indices and Local Thermal Comfort Criteria; ISO: Geneva, Switzerland, 2006. [Google Scholar]
- Fanger, P.O. Thermal Comfort. Analysis and Applications in Environmental Engineering; Danish Technical Press: Copenhagen, Denmark, 1970. [Google Scholar]
- De Dear, R.J.; Brager, G.S. Developing an Adaptive Model of Thermal Comfort and Preference. In Proceedings of the ASHRAE Transactions, Toronto, ON, Canada, 27 June–1 July 1998; pp. 145–167. [Google Scholar]
- Nicol, J.F.; Humphreys, M.A. Adaptive thermal comfort and sustainable thermal standards for buildings. Energy Build. 2002, 34, 563–572. [Google Scholar] [CrossRef]
- Zaki, S.A.; Damiati, S.A.; Rijal, H.B.; Hagishima, A.; Razak, A.A. Adaptive thermal comfort in university classrooms in Malaysia and Japan. Build. Environ. 2017, 122, 294–306. [Google Scholar] [CrossRef]
- Khalid, W.; Zaki, S.A.; Rijal, H.B.; Yakub, F. Investigation of comfort temperature and thermal adaptation for patients and visitors in Malaysian hospitals. Energy Build. 2019, 183, 484–499. [Google Scholar] [CrossRef]
- Jiao, Y.; Yu, H.; Yu, Y.; Wang, Z.; Wei, Q. Adaptive thermal comfort models for homes for older people in Shanghai, China. Energy Build. 2020, 215, 109918. [Google Scholar] [CrossRef]
- Beshir, M.Y.; Ramsey, J.D. Comparison between male and female subjective estimates of thermal effects and sensations. Appl. Ergon. 1981, 12, 29–33. [Google Scholar] [CrossRef]
- Wang, Z.; de Dear, R.; Luo, M.; Lin, B.; He, Y.; Ghahramani, A.; Zhu, Y. Individual difference in thermal comfort: A literature review. Build. Environ. 2018, 138, 181–193. [Google Scholar] [CrossRef]
- Wang, Z.; Zhang, H.; He, Y.; Luo, M.; Li, Z.; Hong, T.; Lin, B. Revisiting individual and group differences in thermal comfort based on ASHRAE database. Energy Build. 2020, 219, 110017. [Google Scholar] [CrossRef]
- Arens, E.; Humphreys, M.A.; de Dear, R.; Zhang, H. Are ‘class A’ temperature requirements realistic or desirable? Build. Environ. 2010, 45, 4–10. [Google Scholar] [CrossRef] [Green Version]
- Kim, J.; Schiavon, S.; Brager, G. Personal comfort models—A new paradigm in thermal comfort for occupant-centric environmental control. Build. Environ. 2018, 132, 114–124. [Google Scholar] [CrossRef] [Green Version]
- Liu, W.; Lian, Z.; Zhao, B. A neural network evaluation model for individual thermal comfort. Energy Build. 2007, 39, 1115–1122. [Google Scholar] [CrossRef]
- Zhao, Q.; Zhao, Y.; Wang, F.; Wang, J.; Jiang, Y.; Zhang, F. A data-driven method to describe the personalized dynamic thermal comfort in ordinary office environment: From model to application. Build. Environ. 2014, 72, 309–318. [Google Scholar] [CrossRef]
- Auffenberg, F.; Stein, S.; Rogers, A. A personalised thermal comfort model using a Bayesian network. In Proceedings of the Twenty-Fourth International Joint Conference on Artificial Intelligence, Buenos Aires, Argentina, 25–31 July 2015. [Google Scholar]
- Aryal, A.; Becerik-Gerber, B. A comparative study of predicting individual thermal sensation and satisfaction using wrist-worn temperature sensor, thermal camera and ambient temperature sensor. Build. Environ. 2019, 160, 106223. [Google Scholar] [CrossRef]
- Liu, S.; Schiavon, S.; Das, H.P.; Jin, M.; Spanos, C.J. Personal thermal comfort models with wearable sensors. Build. Environ. 2019, 162, 106281. [Google Scholar] [CrossRef] [Green Version]
- Choi, J.-H.; Yeom, D. Study of data-driven thermal sensation prediction model as a function of local body skin temperatures in a built environment. Build. Environ. 2017, 121, 130–147. [Google Scholar] [CrossRef]
- Dai, C.; Zhang, H.; Arens, E.; Lian, Z. Machine learning approaches to predict thermal demands using skin temperatures: Steady-state conditions. Build. Environ. 2017, 114, 1–10. [Google Scholar] [CrossRef] [Green Version]
- Chaudhuri, T.; Zhai, D.; Soh, Y.C.; Li, H.; Xie, L. Thermal comfort prediction using normalized skin temperature in a uniform built environment. Energy Build. 2018, 159, 426–440. [Google Scholar] [CrossRef]
- Kim, J.; Zhou, Y.; Schiavon, S.; Raftery, P.; Brager, G. Personal comfort models: Predicting individuals’ thermal preference using occupant heating and cooling behavior and machine learning. Build. Environ. 2018, 129, 96–106. [Google Scholar] [CrossRef] [Green Version]
- Du, C.; Li, B.; Liu, H.; Ji, Y.; Yao, R.; Yu, W. Quantification of personal thermal comfort with localized airflow system based on sensitivity analysis and classification tree model. Energy Build. 2019, 194, 1–11. [Google Scholar] [CrossRef]
- Katić, K.; Li, R.; Zeiler, W. Machine learning algorithms applied to a prediction of personal overall thermal comfort using skin temperatures and occupants’ heating behavior. Appl. Ergon. 2020, 85, 103078. [Google Scholar] [CrossRef] [PubMed]
- Salehi, B.; Ghanbaran, A.H.; Maerefat, M. Intelligent models to predict the indoor thermal sensation and thermal demand in steady state based on occupants’ skin temperature. Build. Environ. 2020, 169, 106579. [Google Scholar] [CrossRef]
- Liu, W.; Tian, X.; Yang, D.; Deng, Y. Evaluation of individual thermal sensation at raised indoor temperatures based on skin temperature. Build. Environ. 2021, 188, 107486. [Google Scholar] [CrossRef]
- Pigliautile, I.; Casaccia, S.; Morresi, N.; Arnesano, M.; Pisello, A.L.; Revel, G.M. Assessing occupants’ personal attributes in relation to human perception of environmental comfort: Measurement procedure and data analysis. Build. Environ. 2020, 177, 106901. [Google Scholar] [CrossRef]
- Morresi, N.; Casaccia, S.; Sorcinelli, M.; Arnesano, M.; Uriarte, A.; Torrens-Galdiz, J.I.; Revel, G.M. Sensing Physiological and Environmental Quantities to Measure Human Thermal Comfort Through Machine Learning Techniques. IEEE Sens. J. 2021, 21, 12322–12337. [Google Scholar] [CrossRef]
- Xie, J.; Li, H.; Li, C.; Zhang, J.; Luo, M. Review on occupant-centric thermal comfort sensing, predicting, and controlling. Energy Build. 2020, 226, 110392. [Google Scholar] [CrossRef]
- Wang, Z.; Yu, H.; Luo, M.; Wang, Z.; Zhang, H.; Jiao, Y. Predicting older people’s thermal sensation in building environment through a machine learning approach: Modelling, interpretation, and application. Build. Environ. 2019, 161, 106231. [Google Scholar] [CrossRef] [Green Version]
- Tejedor, B.; Casals, M.; Gangolells, M.; Macarulla, M.; Forcada, N. Human comfort modelling for elderly people by infrared thermography: Evaluating the thermoregulation system responses in an indoor environment during winter. Build. Environ. 2020, 186, 107354. [Google Scholar] [CrossRef]
- Li, X.; Chen, Q. Development of a novel method to detect clothing level and facial skin temperature for controlling HVAC systems. Energy Build. 2021, 239, 110859. [Google Scholar] [CrossRef]
- Chaudhuri, T.; Zhai, D.; Soh, Y.C.; Li, H.; Xie, L. Random forest based thermal comfort prediction from gender-specific physiological parameters using wearable sensing technology. Energy Build. 2018, 166, 391–406. [Google Scholar] [CrossRef]
- Jia, M.; Choi, J.-H.; Liu, H.; Susman, G. Development of facial-skin temperature driven thermal comfort and sensation modeling for a futuristic application. Build. Environ. 2022, 207, 108479. [Google Scholar] [CrossRef]
- Zhou, X.; Liu, Y.L.; Luo, M.H.; Zhang, L.; Zhang, Q.; Zhang, X. Thermal comfort under radiant asymmetries of floor cooling system in 2 h and 8 h exposure durations. Energy Build. 2019, 188, 98–110. [Google Scholar] [CrossRef] [Green Version]
- Pellerin, N.; Deschuyteneer, A.; Candas, V. Local thermal unpleasantness and discomfort prediction in the vicinity of thermoneutrality. Eur. J. Appl. Physiol. 2004, 92, 717–720. [Google Scholar] [CrossRef]
- Zhang, H.; Arens, E.; Huizenga, C.; Han, T. Thermal sensation and comfort models for non-uniform and transient environments, part III: Whole-body sensation and comfort. Build. Environ. 2010, 45, 399–410. [Google Scholar] [CrossRef] [Green Version]
- Ergonomics of the Physical Environment—Subjective Judgement Scales for Assessing Physical Environments; ISO 10551:2019; ISO: Geneva, Switzerland, 2019.
- Schweiker, M.; André, M.; Al-Atrash, F.; Al-Khatri, H.; Alprianti, R.R.; Alsaad, H.; Amin, R.; Ampatzi, E.; Arsano, A.Y.; Azar, E.; et al. Evaluating assumptions of scales for subjective assessment of thermal environments—Do laypersons perceive them the way, we researchers believe? Energy Build. 2020, 211, 109761. [Google Scholar] [CrossRef]
- R Core Team. R: A Language and Environment for Statistical Computing; R Foundation for Statistical Computing: Vienna, Austria, 2021; Available online: https://www.R-project.org/ (accessed on 21 December 2021).
- Luo, M.; Xie, J.; Yan, Y.; Ke, Z.; Yu, P.; Wang, Z.; Zhang, J. Comparing machine learning algorithms in predicting thermal sensation using ASHRAE Comfort Database II. Energy Build. 2020, 210, 109776. [Google Scholar] [CrossRef]
- Cohen, J. A Coefficient of Agreement for Nominal Scales. Educ. Psychol. Meas. 1960, 20, 37–46. [Google Scholar] [CrossRef]
- Zhang, H. Human Thermal Sensation and Comfort in Transient and Non-Uniform Thermal Environments; University of California: Berkeley, CA, USA, 2003. [Google Scholar]
- Jin, Q.; Li, X.; Duanmu, L.; Shu, H.; Sun, Y.; Ding, Q. Predictive model of local and overall thermal sensations for non-uniform environments. Build. Environ. 2012, 51, 330–344. [Google Scholar] [CrossRef]
- Zhang, Y.; Zhao, R. Effect of local exposure on human responses. Build. Environ. 2007, 42, 2737–2745. [Google Scholar] [CrossRef]
- Shan, C.; Hu, J.; Wu, J.; Zhang, A.; Ding, G.; Xu, L.X. Towards non-intrusive and high accuracy prediction of personal thermal comfort using a few sensitive physiological parameters. Energy Build. 2020, 207, 109594. [Google Scholar] [CrossRef]


Publisher’s Note: MDPI stays neutral with regard to jurisdictional claims in published maps and institutional affiliations. |
© 2022 by the authors. Licensee MDPI, Basel, Switzerland. This article is an open access article distributed under the terms and conditions of the Creative Commons Attribution (CC BY) license (https://creativecommons.org/licenses/by/4.0/).