Abstract
The demand for categorising technology that requires minimum manpower and equipment is increasing because a large amount of waste is produced during the demolition and remodelling of a structure. Considering the latest trend, applying an artificial intelligence (AI) model for automatic categorisation is the most efficient method. However, it is difficult to apply this technology because research has only focused on general domestic waste. Thus, in this study, we delineate the process for developing an AI model that differentiates between various types of construction waste. Particularly, solutions for solving difficulties in collecting learning data, which is common in AI research in special fields, were also considered. To quantitatively increase the amount of learning data, the Fréchet Inception Distance method was used to increase the amount of learning data by two to three times through augmentation to an appropriate level, thus checking the improvement in the performance of the AI model.
1. Introduction
The construction industry is a pivotal player in the national economy in terms of gross domestic production and employment. According to the World Bank statistics [1], the construction industry is responsible for approximately 24.7% of the gross domestic product on average globally. Similarly, the construction industry in the South Korean economy plays a key role, accounting for approximately 26.8% of the gross domestic production in 2019 [2]. Additionally, it is indicated that the construction industry provided approximately two million jobs, accounting for approximately 7.5% of the overall employment in all manufacturing sectors in South Korea [2].
Behind the positive role of this industrial sector in the national economy, it has been pointed out that this industry not only consumes a large amount of natural resources and energy, but also emits a large amount of greenhouse gases (GHGs) for the production of various building materials and operation of a building or facility during the entire life cycle. According to the Intergovernmental Panel on the Climate Change report, the construction industry consumes approximately 40% of the total global energy and accounts for approximately 30% of the overall GHG emissions per annum [3]. Additionally, the construction industry generates a vast amount of construction and demolition waste, thereby contributing a significant portion to the overall waste generated globally [4,5,6]. In South Korea, construction and demolition waste represent approximately 50% of the total waste, including municipal solid waste and commercial and industrial waste from all industrial sectors [4,7,8]. Similarly, the Australian National Waste Report suggests that approximately 37% of the core waste in 2016–2017 was generated by the construction industry. In Europe, various construction and demolition activities produce approximately 8.2 million tons of waste, accounting for approximately 46% of the total waste [9]. As discussed above, the generation of construction and demolition waste would not only cause several environmental problems (e.g., GHG emissions, rainwater leaching, and infiltration of surface water caused by landfilling), but also financial problems, such as disposal costs, including the demolition, classification, and transportation of construction waste.
Various countries, including South Korea, have implemented various measures to mitigate the adverse impacts of construction and demolition waste. The 3R approach which stands for Reduction, Reuse, and Recycling is one of the most popular approaches to mitigate the potential impact of the waste [10]. Recycling is one of the effective strategies to minimise waste as well as to achieve sustainable construction waste management. Although there are several advantages of recycling waste, it would be arduous as time and human resources are required to segregate the waste into predetermined categories. Moreover, it has been found that manual involvement and the sorting of waste is error-prone, inconsistent, related to health and safety issues, and expensive [11]. In order to deal with such difficulties to recycle construction waste, artificial intelligence-based technologies have emerged for alternatives. In particular, vision-based methods would make it possible to minimise human errors and reduce the time consuming methods [12,13]. The purpose of this research is to develop an automated waste segmentation and classification system for recycling construction and demolition waste on real construction sites. As the practical application to real-world construction sites is a significant factor, high accuracy and speed of detecting and classifying objects in an image are essential factors in selecting an appropriate architecture among various Convolutional Neural Network (CNN) algorithms. Based on this consideration, a You Only Look At CoefficienTs (YOLACT) algorithm, which is one of the fastest fully convoluted models for real-time instance segmentation and classification, was chosen for the experiment [14]. It is expected that the proposed system would make it possible to enhance the productivity and cost efficiency by reducing the manpower for construction and demolition waste management at the site. The remainder of this paper is organised as follows: first, relevant works on waste management and classification are described in Section 2. The research methods for the segmentation and classification of construction and demolition waste using deep neural networks are described in Section 3. Finally, the experimental results and discussion of this study are presented in Section 4, and the conclusions and further research directions are provided in Section 5.
2. Related Works
2.1. Waste Management
According to Tam and Tam [15], an intensive policy with a gradual increase in benefits would be an effective approach to encourage employees to participate in waste reduction activities. On the other hand, Lu and Yuan [11] suggested that detailed regulations on waste management at construction sites are essential for successfully reducing construction waste. While waste management through incentive policies and regulations would be an effective method from a short-term perspective, the reduction of waste through recycling would make it possible to decrease waste generation and achieve a circular economy [16,17,18]. According to Edwards [16], recycling, which would be an effective strategy for waste minimisation, would reduce the demand for new resources, reduce transportation and production energy costs, and prevent land loss for landfills. Previous studies claimed that automation systems for recycling would be a potential solution for sorting and classifying waste [19,20,21]. For example, Picon et al. [19] adopted hyperspectral images for sorting non-ferrous metal waste from electric and electronic equipment. Their proposed system achieved approximately 98% accuracy in classifying waste, thereby making it possible to replace the existing manual sorting procedures. Similarly, Aleena et al. [22] proposed an automatic waste segregator using inductive proximity sensors and robotic arms for classifying solid waste into three main categories: metallic, organic, and plastic.
Likewise, on-site automated waste separation and classification is an essential function for recycling construction and demolition waste in the construction industry. For example, Xiao et al. [23] proposed an online construction waste classification system, which used industrial cameras to capture the region of the objects and hyperspectral cameras to obtain spectral information to discern the waste materials into concrete, rubber, black brick wood, plastic, and brick. Similarly, Hollstein et al. [6] developed a new compact hyperspectral camera, which could overcome the existing problems of hyperspectral imagers, for automatic construction waste sorting. Although there are several advantages of using hyperspectral images for automated construction and demolition waste classification, it has several problems, such as a high initial investment cost and insufficient robustness of optical sensors. Recently, the advances in computer vision-based object detection and classification techniques have provided potential solutions for automatic construction and demolition waste classification [5,20,21,24,25,26,27].
2.2. Convolutional Neural Network (CNN)
Convolutional neural networks (CNNs) are widely adopted models for classifying objects in images in various fields, such as medical diagnosis, autonomous driving, facial recognition, and so forth [25,26,27,28]. CNNs are applied to various fields in the construction industry, such as structural health monitoring and prediction, health and safety monitoring on a construction site, workplace assessment, and activity recognition of construction workers for predicting hazards [29,30,31,32]. Zhang et al. [30] proposed a posture recognition method that used deep CNN-based 3D ergonomic posture recognition to enhance the health and safety of construction workers. Additionally, several studies attempted to adopt this model to predict structural safety. Deng et al. [33] developed a CNN-based model for predicting the compressive strength of recycled concrete by learning deep features of the water–cement ratio, recycled coarse aggregate replacement ratio, recycled fine aggregate replacement ratio, fly ash replacement ratio, and their combinations. Cha et al. used CNN in a vision-based approach for detecting cracks in concrete images [25]. In this research, the test results of crack detection using the CNN model showed better performance compared to the conventional edge detection methods. Gopalakrishnan et al. [34] used a deep CNN model to detect the pavement distress from digitised pavement surface images. In this research, the authors applied the VGG-16 deep CNN model, which yielded the best performance compared to other machine learning classifiers. Similarly, Dung [35] proposed a fully convolutional network-based concrete crack detection and density evaluation method, which showed an accuracy rate of more than 90% for concrete surface crack detection. Although CNN has established itself as the core of machine learning technology and is expanding the scope of applications in the construction industry, studies on the classification of construction and demolition waste using the CNN method are relatively scarce.
Since a deep learning model called AlexNet won the ImageNet Large Scale Visual Recognition Challenge championship in 2012, CNNs have become the mainstream image recognition model among different computer vision algorithms. Vision-based object detection is a technology that recognises certain objects directly from image data without any programs or commands [36,37,38]. Object recognition and detection technology have progressed from just determining the existence of an object to distinguishing the location and category of an object. The application of CNN models for waste management is divided into two major approaches in the research domain: (1) creating and validating the viability of the dataset, and (2) applying CNN algorithms to classify waste into various categories and verifying and comparing the performance of different algorithms to explore the best approaches.
The TrshNet dataset, which was released by Yang and Thung [39] in 2016, is one of the most frequently used datasets for training waste images. They applied a support vector machine (SVM) and CNN to classify the trash images into six categories: glass, paper, cardboard, plastic, metal, and trash. The test results showed that the SVM and CNN models achieved accuracies of 63% and 22%, respectively. In this study, the authors found that it would be possible to classify various types of trash into predefined categories using machine learning and computer vision algorithms. Furthermore, they pointed out that although the accuracy rate of this study was relatively low, continuously growing the dataset would improve the accuracy of trash classification using machine learning and computer vision algorithms. Similarly, Proença and Simões [40] introduced an open image dataset containing photos of litter taken from various environments. In this dataset, the pictures were manually labelled and segmented in accordance with a hierarchical taxonomy to train and evaluate object detection algorithms. All the images were labelled with objects and backgrounds to easily detect images in various contexts, such as grass, road, and underwater. According to Liang and Gu [26], existing artificial intelligence-based waste classification methods only deal with single-label waste classification rather than multiple stacked wastes, as in real-world situations. To overcome such problems and to enhance the applicability of waste classification systems, they suggested a multi-label waste classification model that would detect and localise several types of waste in images. Furthermore, they established a new dataset, which contained more than 56,000 images in four categories, and improved the efficiency of learning. The results of their study showed that the F1 score for assessing multi-label waste classification was approximately 96% and the average precision score was approximately 82%.
2.3. Comparison of Artificial Intelligence Models
Along with building a new dataset for waste classification, several studies have dealt with the performance comparison of different CNN algorithms. With the development of computer technology, there is a growing interest in developing optimised AI models to yield a better performance. For example, Ahmad et al. [41] tried to improve the reliability and accuracy of waste classification by combining state-of-the-art deep learning algorithms. The authors proposed a method that combined multiple deep learning models using a feature and score-level fusion method named double fusion. In previous studies, one of the most common difficulty in training images for recognising objects was to identify them at various positions. Wang et al. [42] classified plastic bottles with different positions and colours during the recycling process on a conveyor belt. The ReliefF algorithm was applied to select the colour features of recycled bottles, and the colour was identified using SVM. The accuracy of the colour recognition of the recycled bottles was 94.7%. Additionally, research areas related to waste classification attempted to apply various newly proposed image detection and classification algorithms to enhance its capability for practical implementation. Adedeji and Wang [24] suggested a waste classification system that could classify different components of waste. The purpose of this system was to minimise human intervention to separate the waste in sorting facilities, thereby reducing the harmful influence on humans. The system was developed using a 50-layer residual net (ResNet), which is a CNN algorithm used to classify waste materials. The accuracy of the proposed model was 87% for the dataset.
The speed of object detection and classification is an essential factor in general applications in real-time waste classification. De Carolis et al. [43] proposed YOLO TrashNet by applying YOLOv3 for real-time waste detection in video streams. The suggested method would not only help alleviate waste reporting in a city requiring labour-intensive tasks, but also achieve the goal of a smart city. YOLOv3 is a CNN composed of 106 layers. The first 53 layers refer to the Darknet-53 network used as a feature extractor, and it was pre-trained on ImageNet, allowing deep transfer learning. The successive 53 layers allow object detection on 3 scales of size (small, medium, and large objects). Moreover, an important feature of YOLOv3 is the use of the anchor box, which is predetermined by using the k-means clustering algorithm on the training set. This improvement allows for faster and more stable network training. In this research, the authors trained the last 53 layers of YOLOv3 using their dataset. They called the proposed neural network YOLO TrashNET. According to Liang and Gu [26], the existing AI-based waste classification methods only deal with single-label waste classification rather than multiple stacked wastes in real-world situations. To overcome such problems and enhance the applicability of waste classification systems, they suggested a multi-label waste classification model that would detect and localise several types of waste in images. Furthermore, they established a new dataset, which contained more than 56,000 images in 4 categories, and improved the efficiency of learning. The results of their study showed that the F1 score for assessing the multi-label waste classification reached approximately 96%, and the average precision score was marked over 82%.
Previous studies suggest that many studies regarding waste classification are related to municipal solid waste segregation, rather than construction and demolition waste classification. Although research on the classification of construction and demolition waste using deep neural networks has been increasing, it is relatively rare compared to municipal solid waste classification.
3. Development of Recognition Model for Five Types of Construction Waste
3.1. Development Procedure
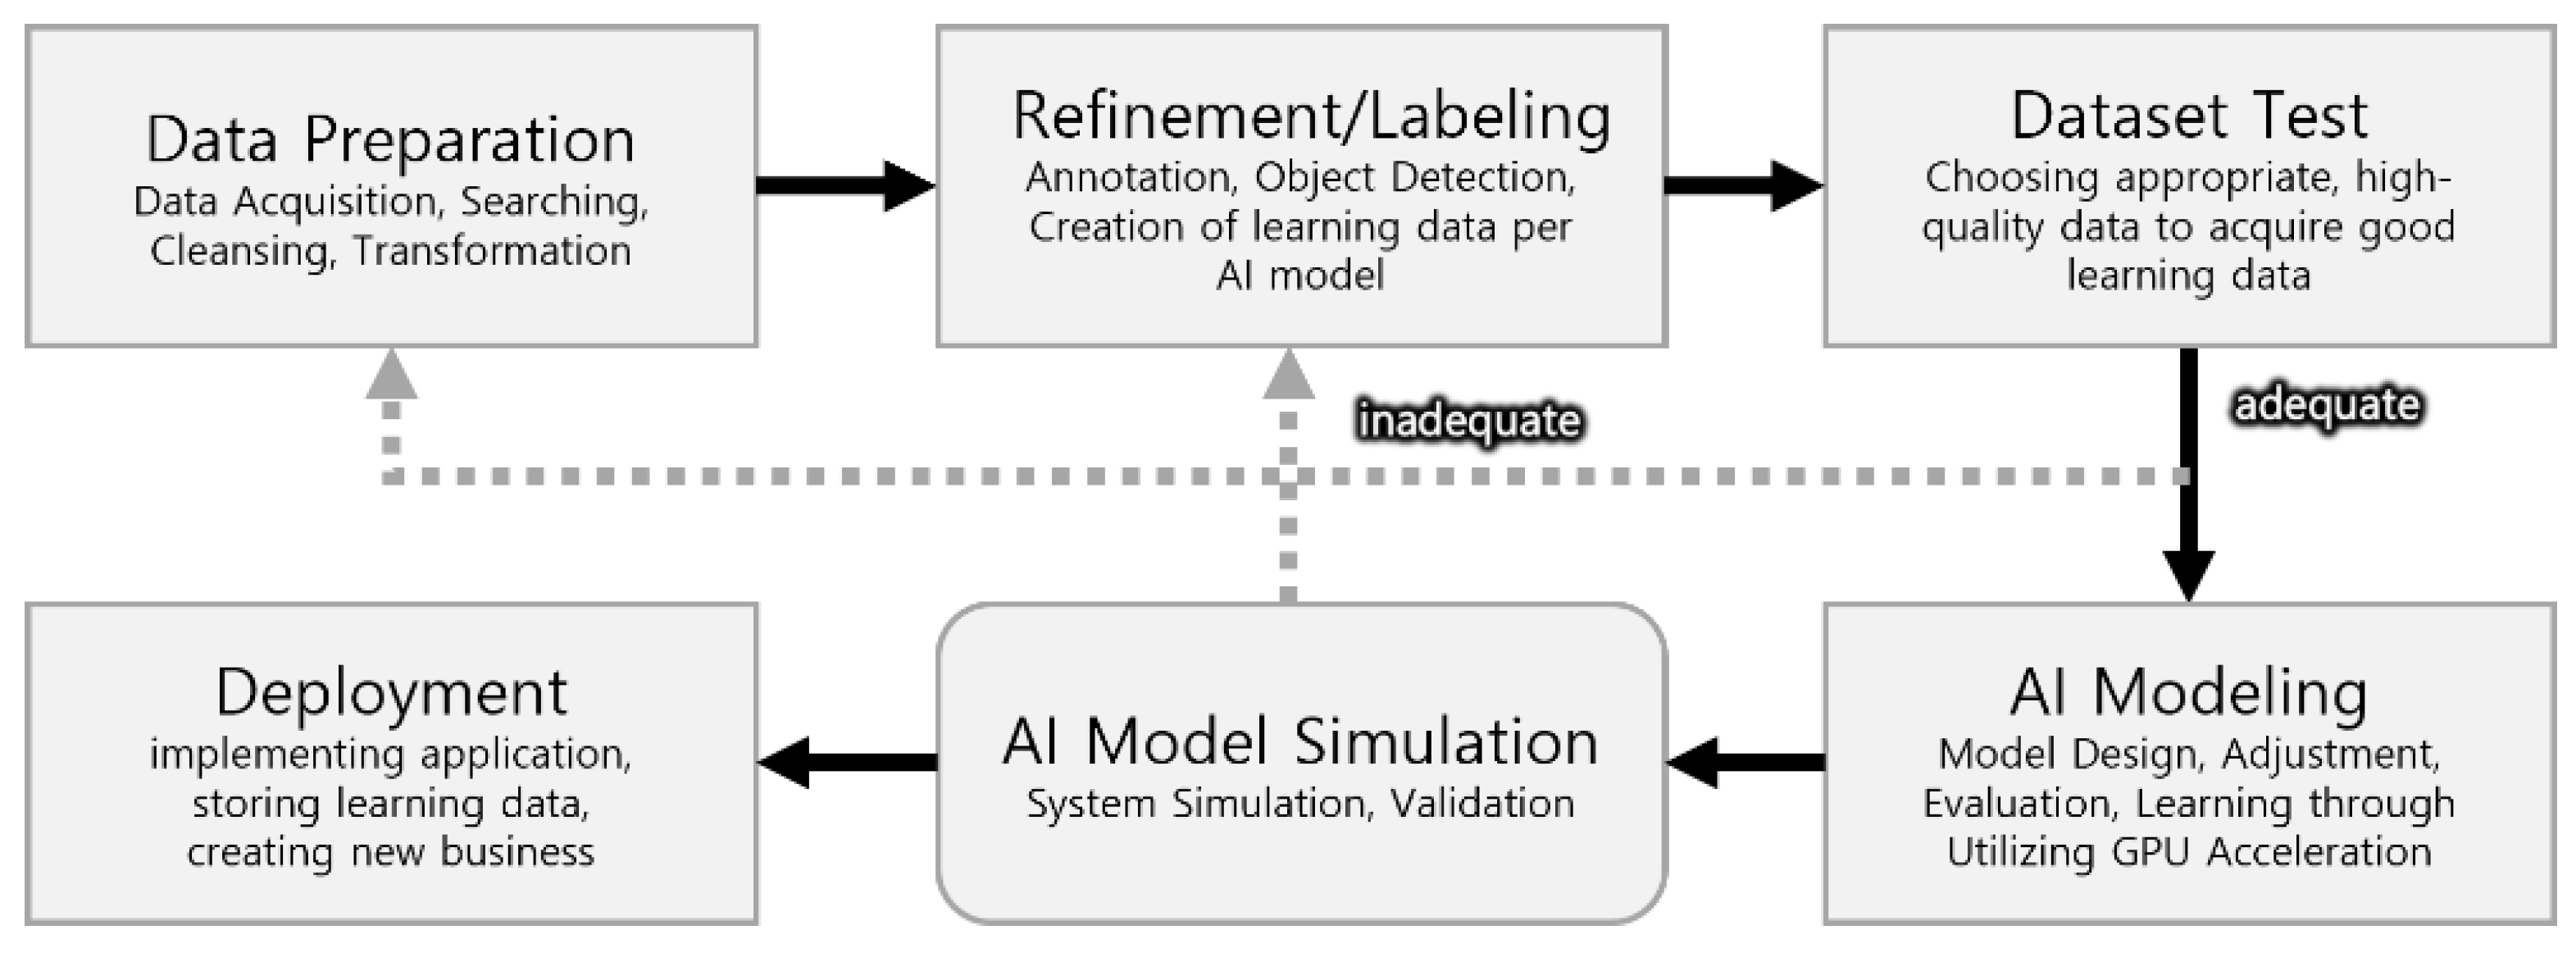
Developers generally follow the process shown in Figure 1, to prepare an AI model that recognises objects. This process is in line with the guidebook on establishing a dataset for AI learning published by the National Information Society Agency, an affiliated organisation of Ministry of Science and ICT (Information and Communication Technology) of South Korea, and made quality evaluation on datasets mandatory, unlike the existing research methods [44,45]. There are several reasons for publishing the guidebook at the government level. First, as the amount of learning data increases, inappropriate learning data are included in the dataset, leading to an increase in cases when the models are not learned properly. Furthermore, there have been frequent cases of development failure, where the model outputted inaccurate results owing to the lack of development of human resources or unskillfulness. Thus, the model was unable to verify the dataset properly or randomly deformed the dataset without a specific standard with augmentation, such that even the developer could not identify the created data, which were included in the dataset without additional verification. The first two issues can be solved when skilled manpower is acquired, but the last one needs an adequate program to solve it.

Figure 1.
Current AI R&D process in academia and industry.
3.2. Constructing the Dataset and Selecting the Learning Model
According to the “Enforcement decree of the wastes control act” in South Korea, construction waste is divided into 18 categories to enhance the recycling rate. Among these categories, the research team collected image data on five typical types of construction waste, which constitute a major proportion of the total construction waste [46]. The five types of waste, which include concrete, brick, lumber, board, and mixed waste, as shown in Table 1, were sequentially selected from the most emitted waste at the construction site. Data were labelled during segmentation through the processing process, and the prepared three were designated to transfer learning to the YOLACT model. The backbone of the YOLACT model was ResNet-50, which was assumed to be capable of processing real-time segmentation with small computation to enable operation on on-site computers or edge computers. The standard for real time is Closed-Circuit Television (CCTV) under 30 fps, which is usually used in real life and on construction sites. The YOLACT model is expected to operate at 30 fps if there are no network problems [14].

Table 1.
Type of work performed in each category and work index in accordance with the time and manpower consumed for processing.
In this study, we established two hypotheses. The first hypothesis is that the research team performed research focusing on processing and labelling the learning data, which are unlike images of objects with clean backgrounds, as used in the existing research. When there are various objects mixed in the background, the model capacity is expected to have no difference if the designated object is accurately segmented. Another hypothesis is that the function of the AI network changes according to the quantity and quality of the learning data. The remaining sections of this chapter deal with our hypotheses regarding labelling and the performance of the AI model.
3.3. Constructing the Learning Dataset
The images used for learning included 500 images directly taken at the waste dump site located at a semiconductor manufacturing facility construction site and 288 images acquired by web crawling. The collected source data were cropped into 512 × 512 pixels with the size of approximately 100 kB considering the Graphics Processing Unit (GPU) memory (Nvidia GTX3080, NVIDIA, Santa Clara, CA, USA). Since the YOLACT model is based on instance segmentation, each image was segmented in polygonal shape using “LableMe” programme, as shown in Figure 2 [47].
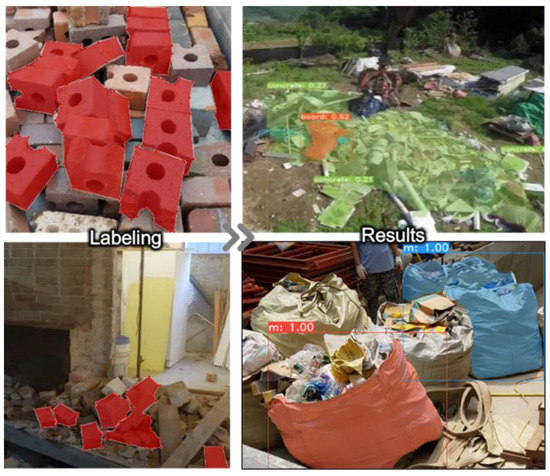
Figure 2.
Labelling by applying instance segmentation to the collected construction waste images and the result of learning.
The time consumed for labelling tasks for the images of construction waste in each category is shown in Table 1. The labelling tasks required 22–32 h with at least 2 men every hour to complete the composition of learning data sets. When these were calculated using Equation (1), which shows the level of difficulty, data collection and processing showed 9–11 and labelling showed 4–6, with an efficiency rate of 60% compared to the previous research [48]. Since similar objects, such as the concrete and brick, are difficult to differentiate based on colour and shape, it took additional time to sort. Therefore, the work index of brick and concrete were low compared to other categories as the labelling difficulty was high.
3.4. Optimal Data Labelling Method
As a result of transfer learning to the YOLACT model through labelling, it was verified that transfer learning to the dataset was performed normally, as discussed in Section 3.3. Based on the results of the transfer learning, we describe the results of variable research conducted to find the optimal labelling method in this section.
When collecting learning data, if the images with a clean background and a single object would be collected, it is possible for the workers to mitigate the confusion during labelling and create a robust AI learning model for the purposes. However, the images for the learning data with such conditions would be difficult to obtain. On the other hand, the images or video clips that would be easily able to collect might contain variety of unnecessary objects for learning. In addition, in order to construct a data set for learning, it would take a lot of time and cost to remove unnecessary objects on one image and to label objects necessary for learning. Thus, it is required to explore an appropriate method to reduce time and manpower for creating a suitable learning data set.
By considering the cases that utilised learning data that were collected by only considering classification as there are numerous studies that have a significant amount of data, it is possible to decrease the learning data collection time by using them appropriately. Although the possibility of applying it to the latest AI method has not been verified, researchers tend to avoid its usage. Therefore, the previous learning dataset is simply stored and eventually treated as digital waste. Thus, it is necessary to verify the data usage level, and a variable study was conducted by categorising four cases.
Table 2 summarises the results of the labelling and optimal instance segementaion method for the construction waste. In Case A, a pixel labelling method was used by taking pictures on a clean background with the designated waste, whereas in Case B, individually labelled designated waste on a picture taken at the dumpsite were used (see Figure 3). Therefore, both cases differentiated the designated wastes well, but in Case B, the algorithm tended to not recognise some wastes when several types of waste were mixed in the image. The parts that could not be recognised were hidden behind other wastes or had different colours and shapes to previously learned data. This was considered as a lack of learning data. Case C comprised the dataset by simultaneously labelling two to five classes from the pictures taken at the dumpsite, whereas Case D classified one class per image, thereby increasing the overall dataset quantity. Consequently, even if several images were mixed, class classification was possible by forming learning data with accurate labelling. For Case C, it was unable to recognise the pixel boundary of the classified class. However, when the amount of data increased in Case D, this phenomenon seemed to disappear. Thus, the amount of learning data was important in terms of AI recognition. Moreover, the work index was 2.39 for Case D and 1.73 for Case C, which showed a lower level of difficulty. Case A was similar to the data collected to develop the existing classification model. Considering the model learning results, the existing data could be used by the latest AI model.
Table 2.
Method and result to find the optimal instance segmentation labelling method.
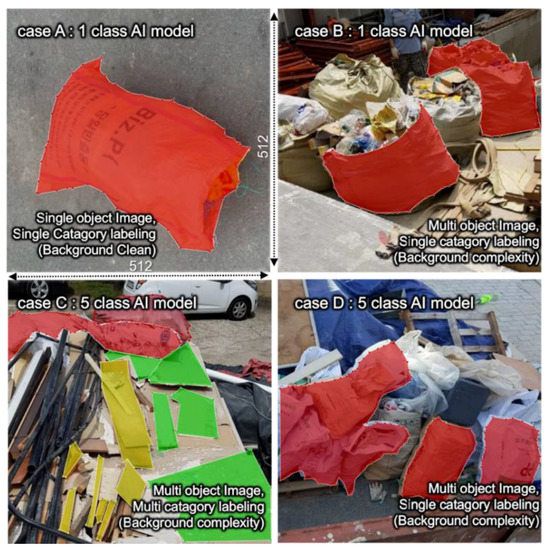
Figure 3.
Representing the image and labelling methods per case.
3.5. Result of Learning
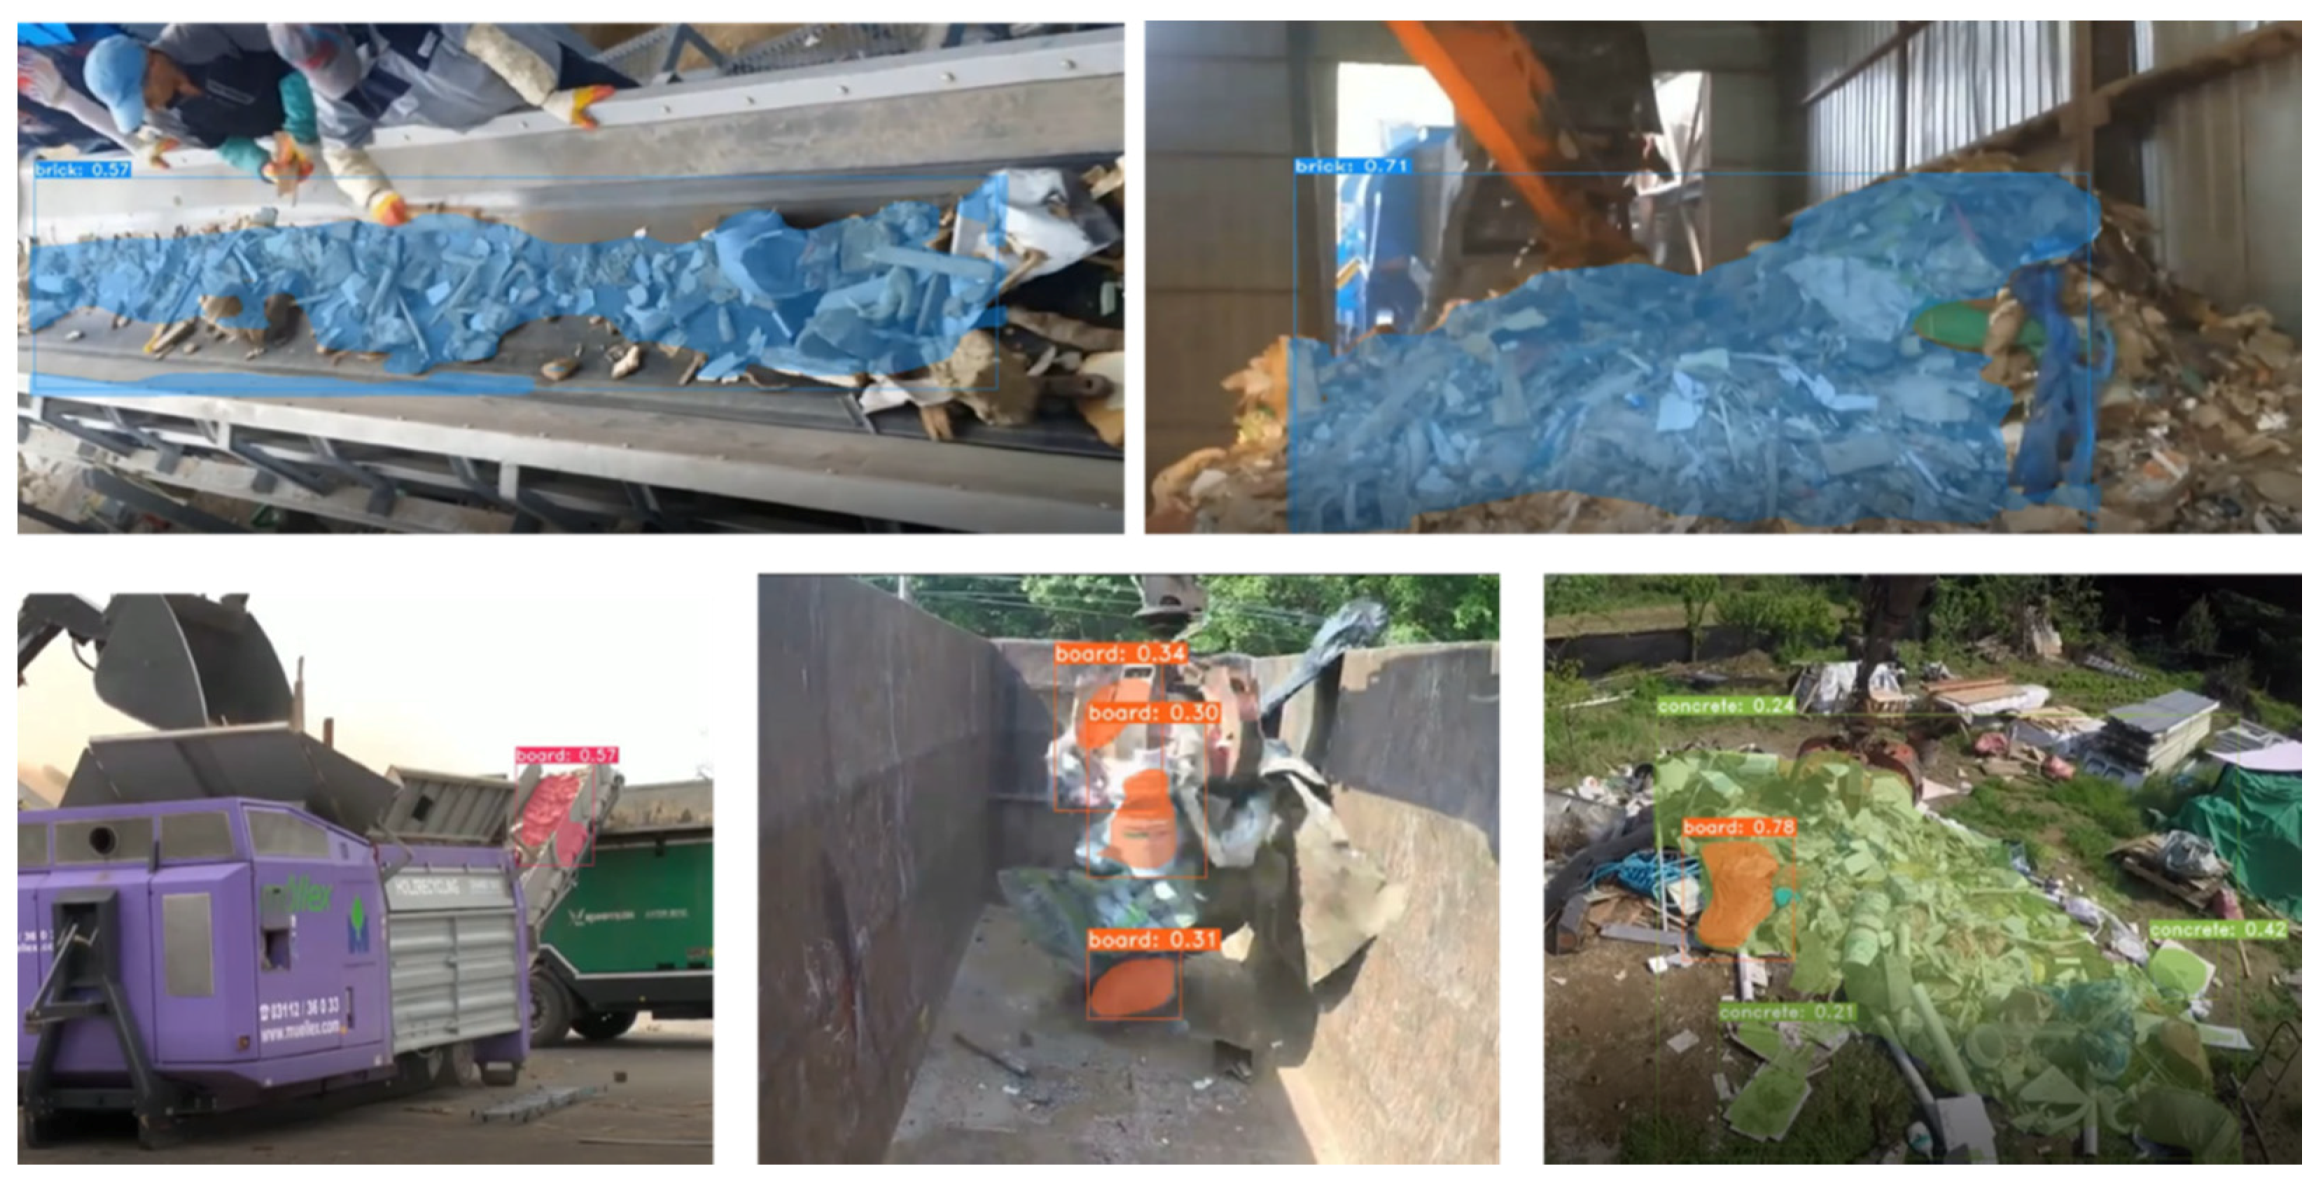
The research team finally concluded that Case D, which indicates the high value of the mean Average Precision (mAP) amongst all cases, was suitable for waste classification model development, and performed transfer learning by adding learning image quantity. In Case D, the total number of images was 788 as shown in Table 3. The results are shown in Figure 4 and there are some parts to discuss the ultimately re-classified networks. Unlike ordinary objects, wastes have a very atypical shape, and in the case of concrete waste, the colour, texture, and shape are similar to those of a brick. Moreover, as discovered in a previous research problem, concrete shape is somewhat similar to sand and broken brick. Hence, the learning model categorised the cement brick crumbs as concrete waste.
Table 3.
YOLACT-based training mAP learned with data labelled in the method of Case D.

Figure 4.
AI model output result obtained by utilising the refined data in Case D.
Timber wastes are in the shape of rectangular lumber, plywood, and palette, but are irregularly fragmented at the waste level. Moreover, the shape of plywood is the same as that of board waste. Therefore, the collection and refinement levels had to consider various situations, as shown in Table 4. This evidence shows the importance of the refinement step, and it can be observed that developing an AI model is difficult by simply increasing the data quantity without quantitative evaluation. This is a limitation of transfer learning as the problem occurs owing to the difference in category and labelling used for previous model development. However, this problem can be solved by re-planning the AI model for the characteristics of the desired object.
Table 4.
Factors considered for acquiring AI model characteristics based on the category/labelling, step, and parts solved.
4. Quantitative Evaluation Method for Learning Data Using the Fréchet Inception Distance (FID) Technique
As a result of re-classifying the YOLACT model, it was verified that the accuracy and recognition rate were affected depending on the quantity and quality of the learning data. Thus, for improving the efficiency of research and development, increasing the amount of learning through automatised augmentation is the most appropriate solution. This section describes the quantitative evaluation of the augmentation level using the FID technique and the result of learning by increasing the learning data using this technique.
4.1. Fréchet Inception Distance (FID) Technique
AI is a concept designed to mimic human intelligence. Therefore, the objects that are difficult for people to differentiate in the image would also be difficult for AI to recognise. Particularly, construction wastes are not only similar in colour but also in shape, e.g., concrete and cement brick. However, objects that are completely different in shape, such as palette and rectangular lumber, also exist. The colour of the photographed image may change owing to the amount of light on site, and the resolution may drop depending on the performance of the camera.
As a result of these variables, it is necessary to check whether the data were learned properly and the model was made well. This is called the quality evaluation of the model. The model performance was checked manually by human beings before a quantitative method was developed for qualitative assessment. When applying this method, the subjectivity of a human affects the model evaluation, and when the amount of data is increased to exceed the human recognition range, there are cases when the standard is ambiguous in the middle of the evaluation. To solve this issue, a program using the FID score, which quantitatively assesses the model, was developed. This technique uses a pre-trained inception model, which is classified using 1000 labels on ImageNet. Here, the inception model is supposed to differentiate the characteristics of ordinary objects properly, and only used parts that extract 2048 output attributes without using the model as it is [6]. The evaluation equation of FID is shown in Equation (2).
where m indicates the average attributes of the real data, C refers to the attribute covariance of the real data, mw is the average attribute of the fake data, and Cw is the attribute covariance of the fake data.
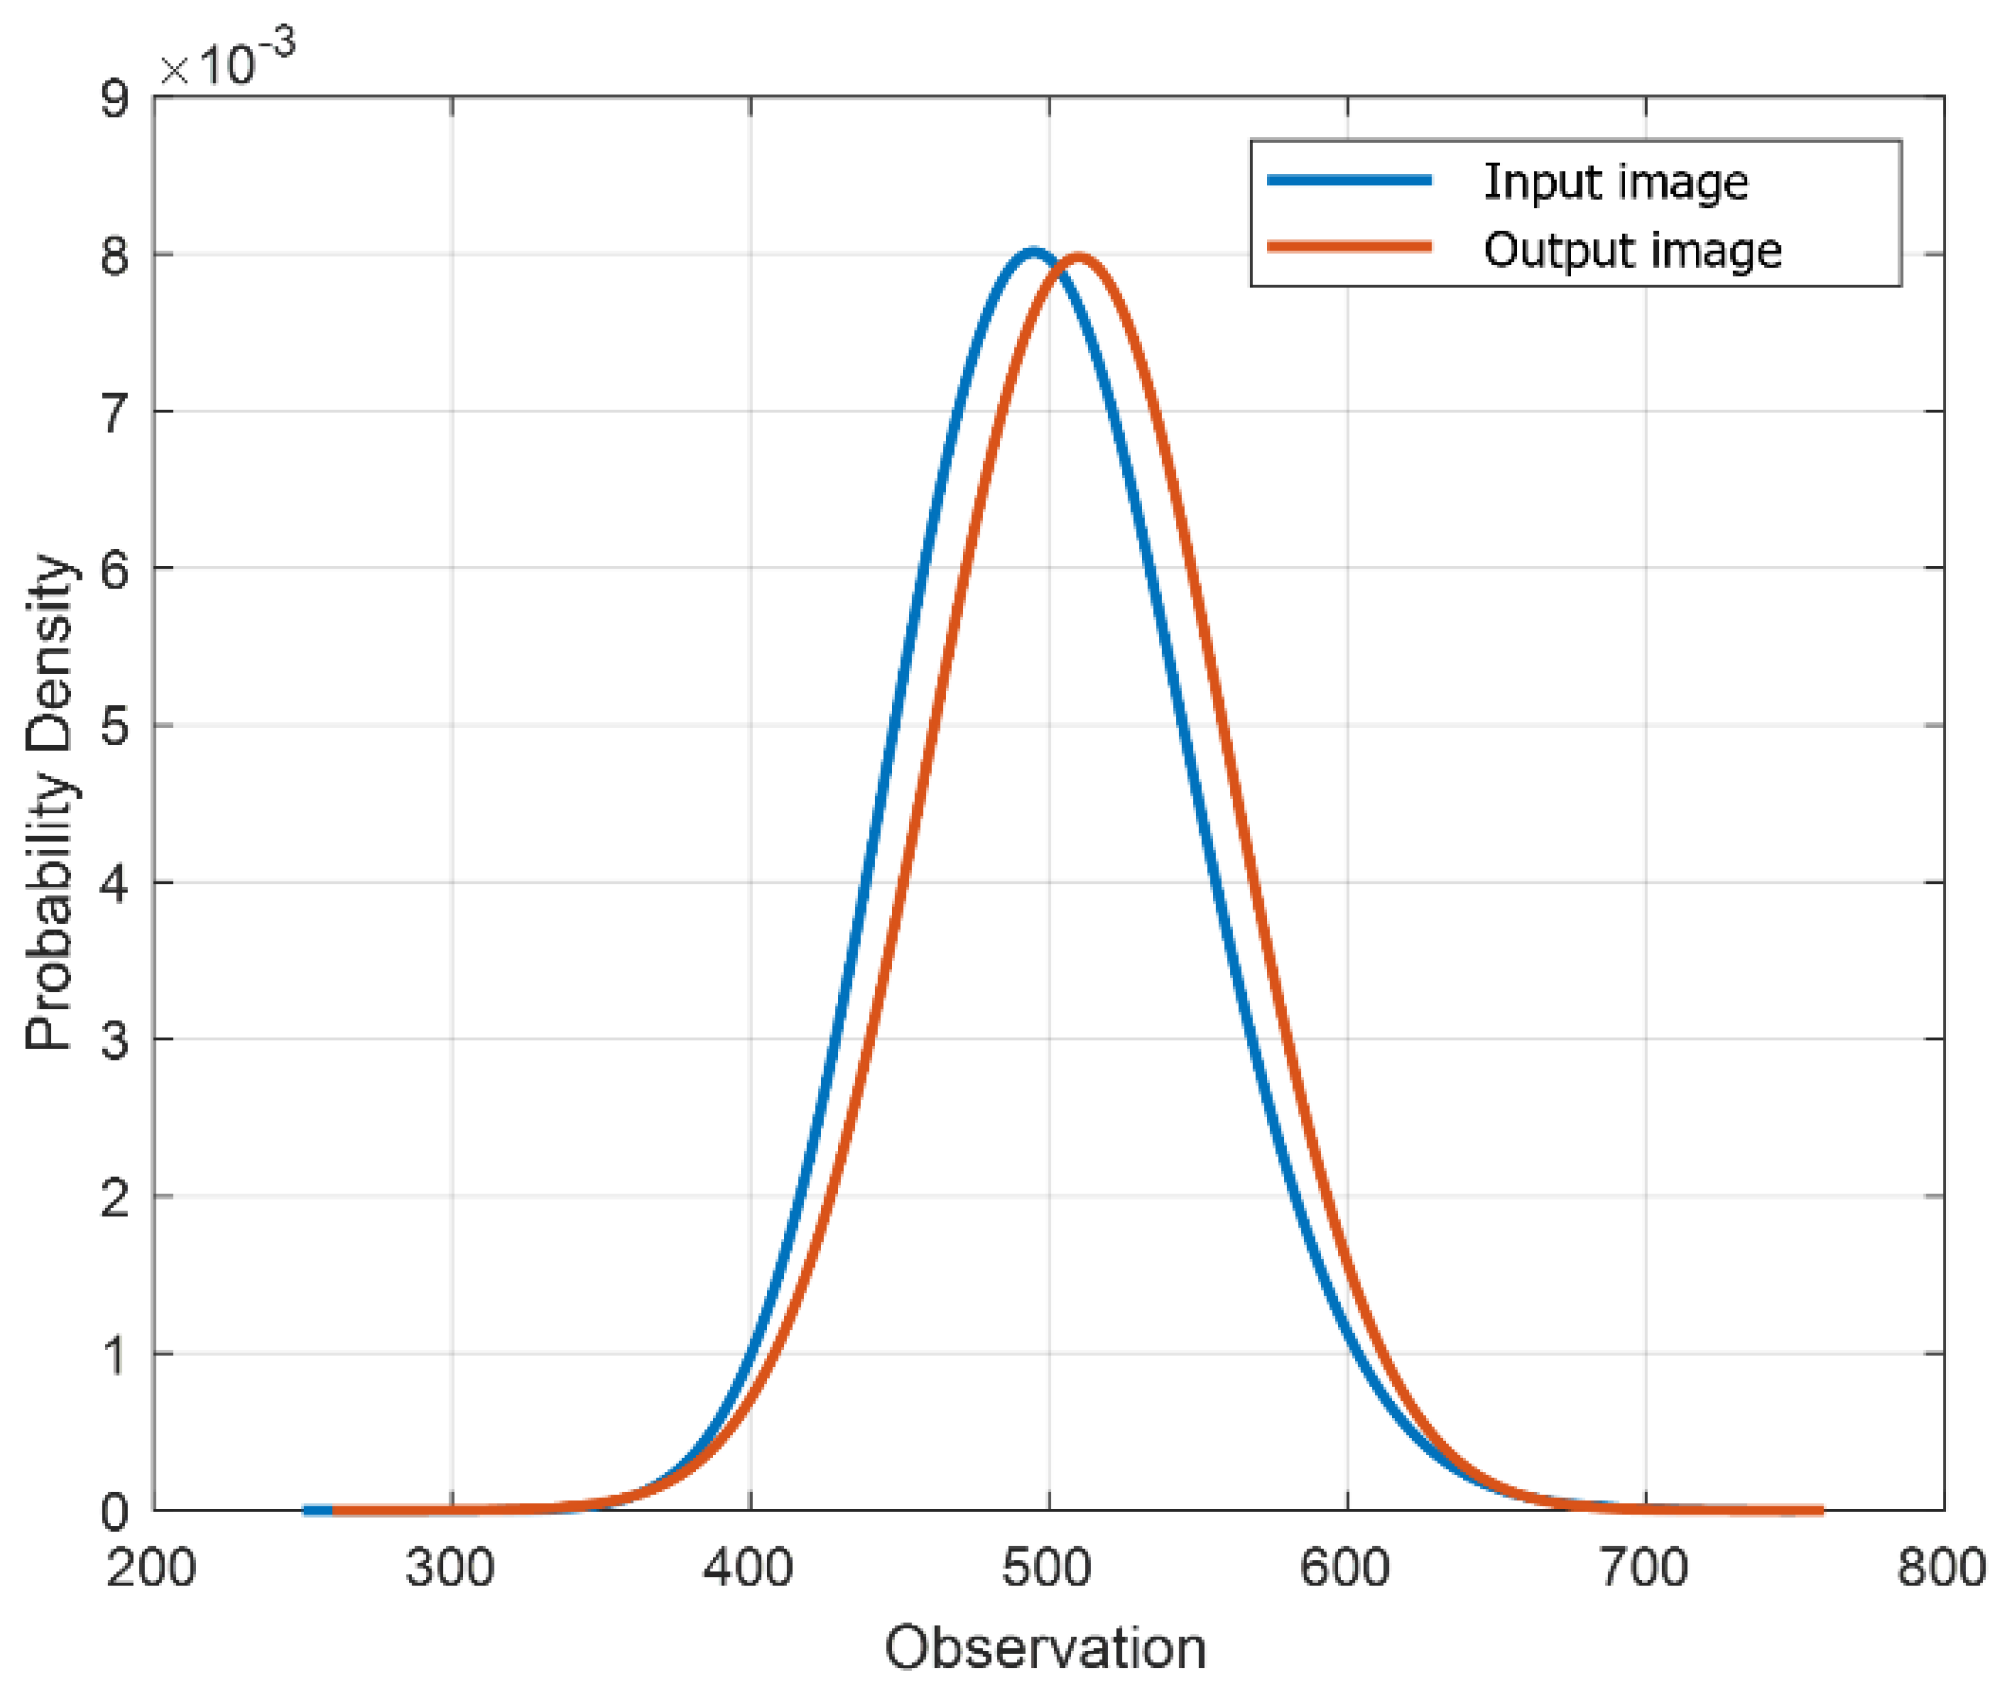
The input and output images through FID following Gaussian distribution as a prerequisite are shown in Figure 5; the smaller the difference between the two distributions, better the performance shown in the result. Although there is an inception score, an index to evaluate the AI model performance, it is not currently in use. This is because real data are not used in performance evaluation, and marks are presented on fake images. Even for a fake image, the image used for the evaluation should have meaning to assess the model performance properly. However, as FID evaluates only real images, all images possess meanings and all data are assessed individually, not on conditional probability.
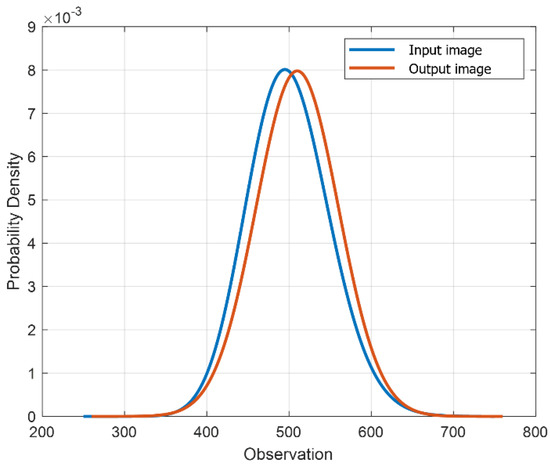
Figure 5.
Matrix of the FID used for measuring the features of real and created images.
Thus, after calculating the output result using the real image model and the gap of the input value from the probability distribution, it can be said that the model performance is good when the value is small. Although the exact accordance of the probability distribution is ideal, it is impossible in reality. Additionally, if these are analysed with respect to mAP, the level of performance change per learning entity can be assessed quantitatively. The advantage of this technique is that it can customise the algorithm by using the inception model if there is a better AI model to extract the output features. However, this technique is noise sensitive and thus has clear limits for evaluation. This issue occurs chronically in image research and is related to the colour temperature and radiation intensity. This issue can be addressed if multiple images can be evaluated using sufficient pictures and videos.
4.2. Susceptibility Level of Re-Classified Model Due to Noise, Colour Change, and Others
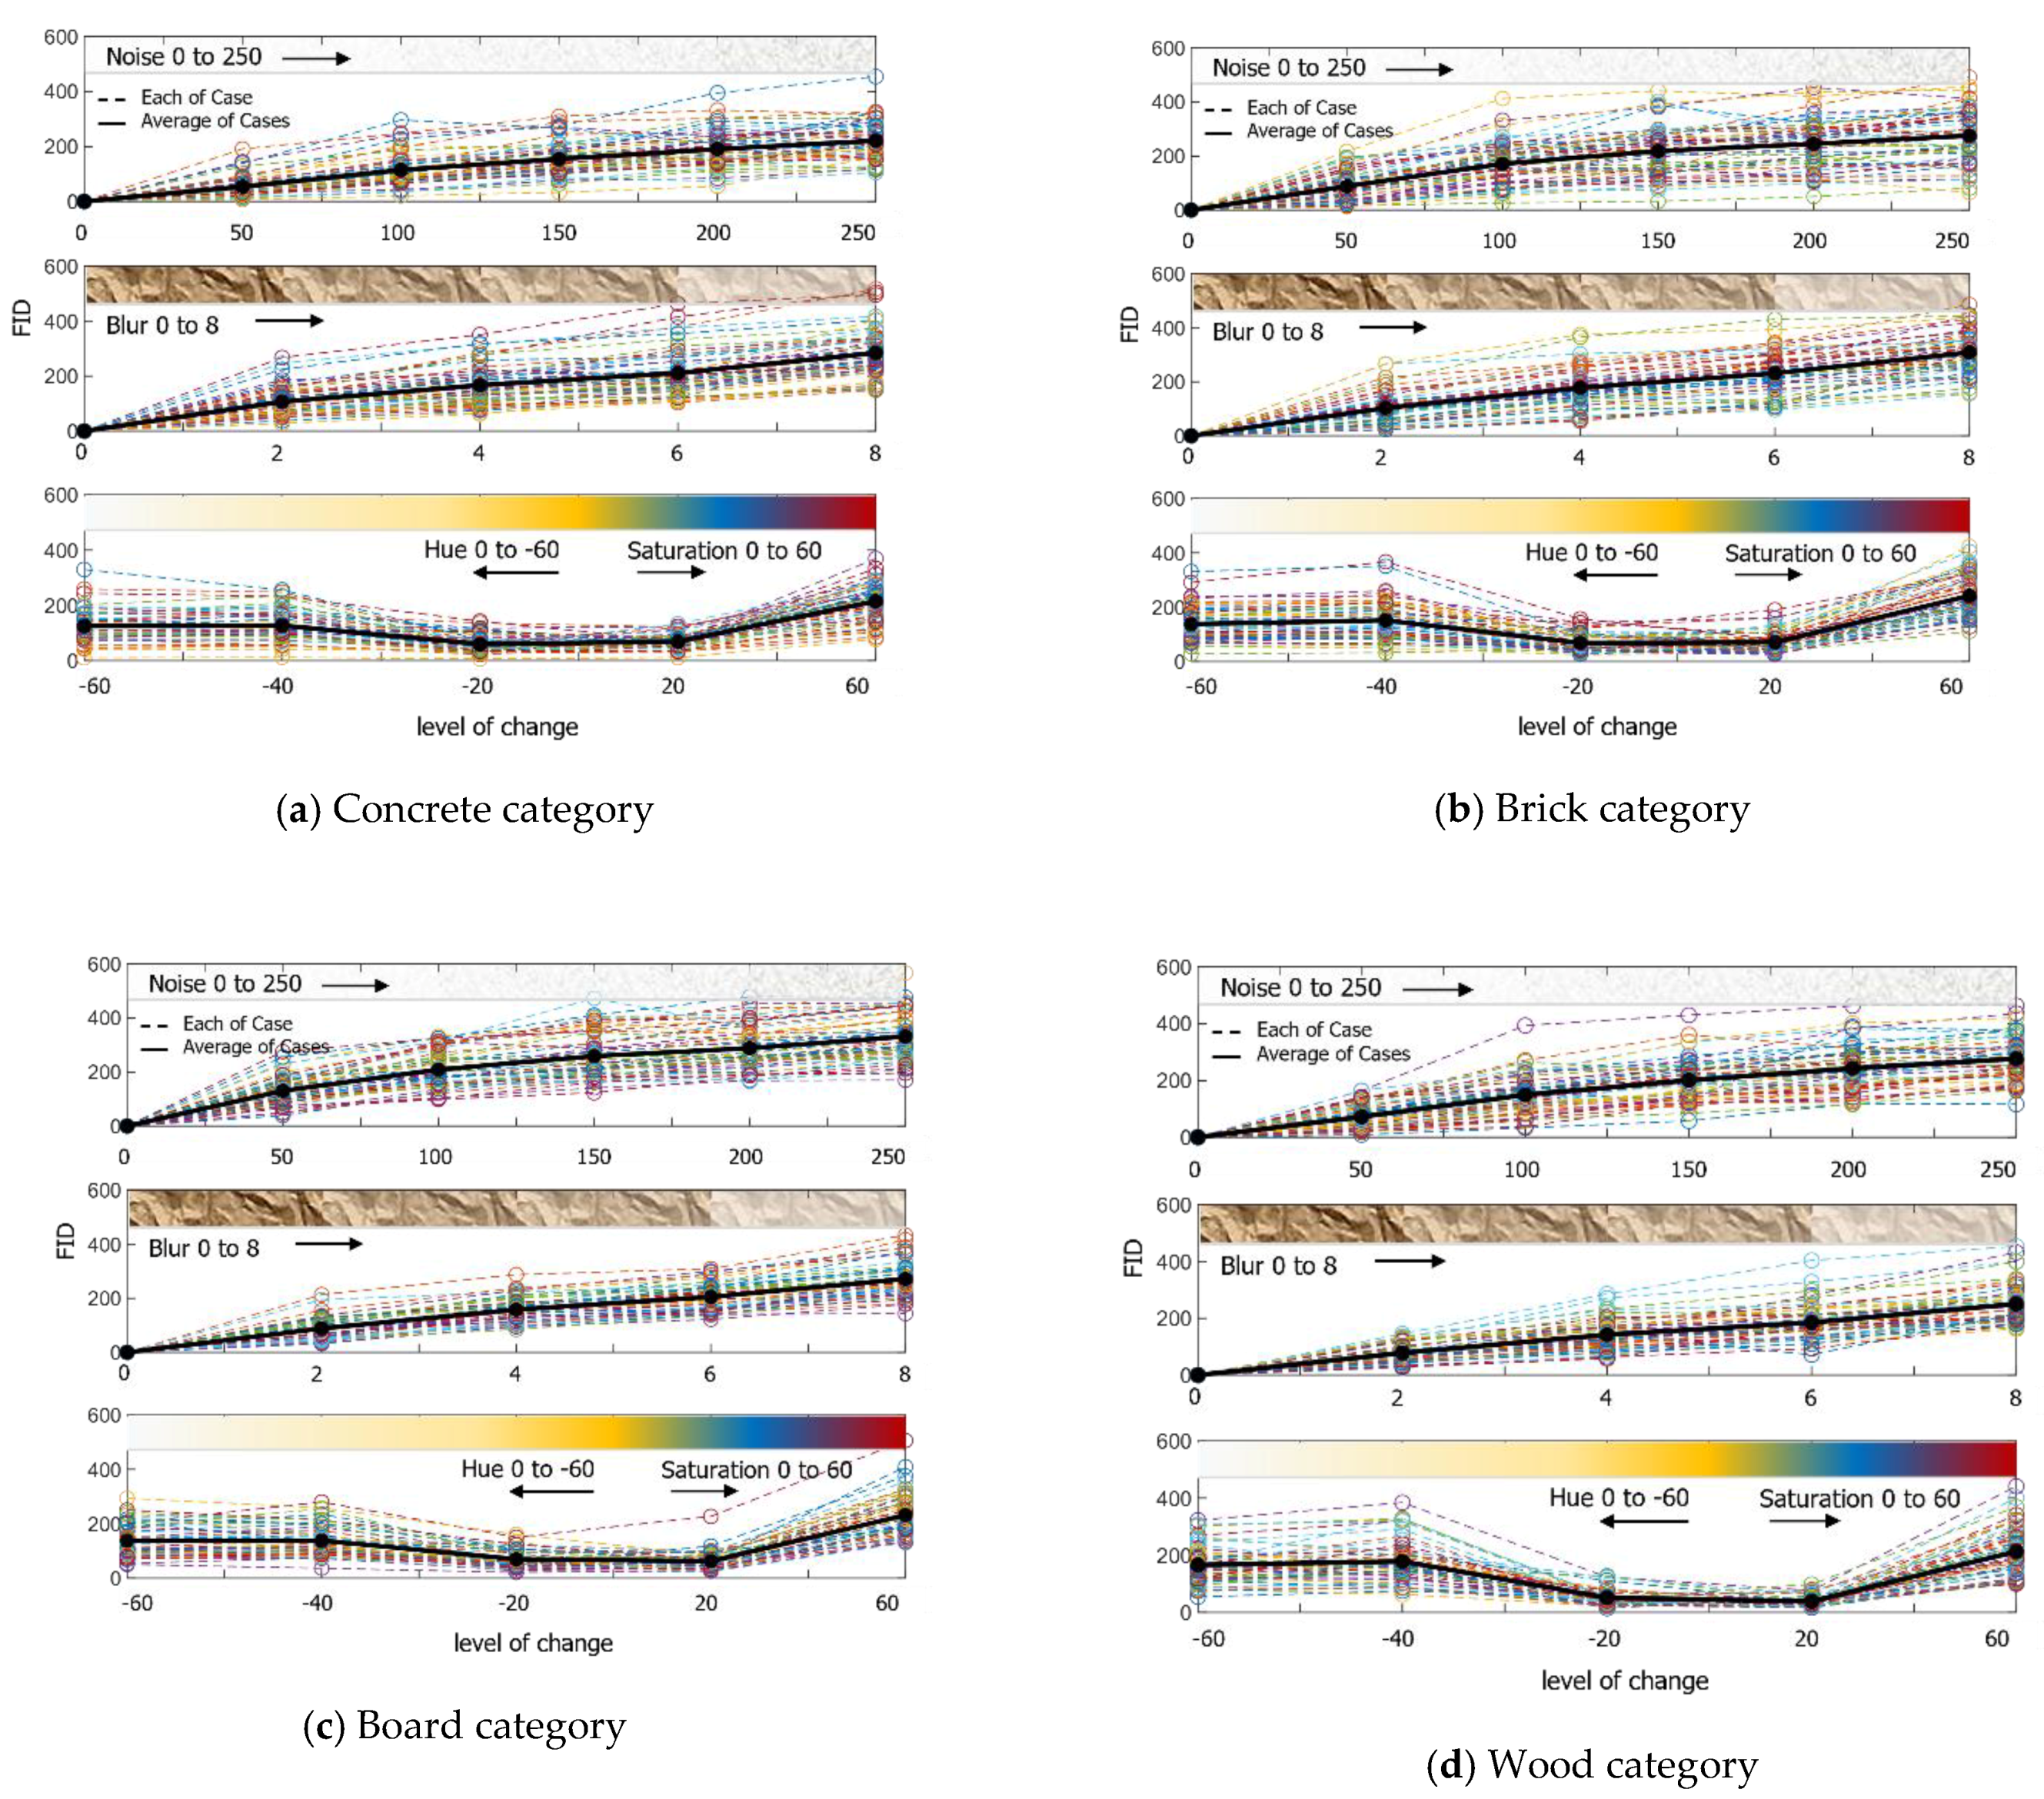
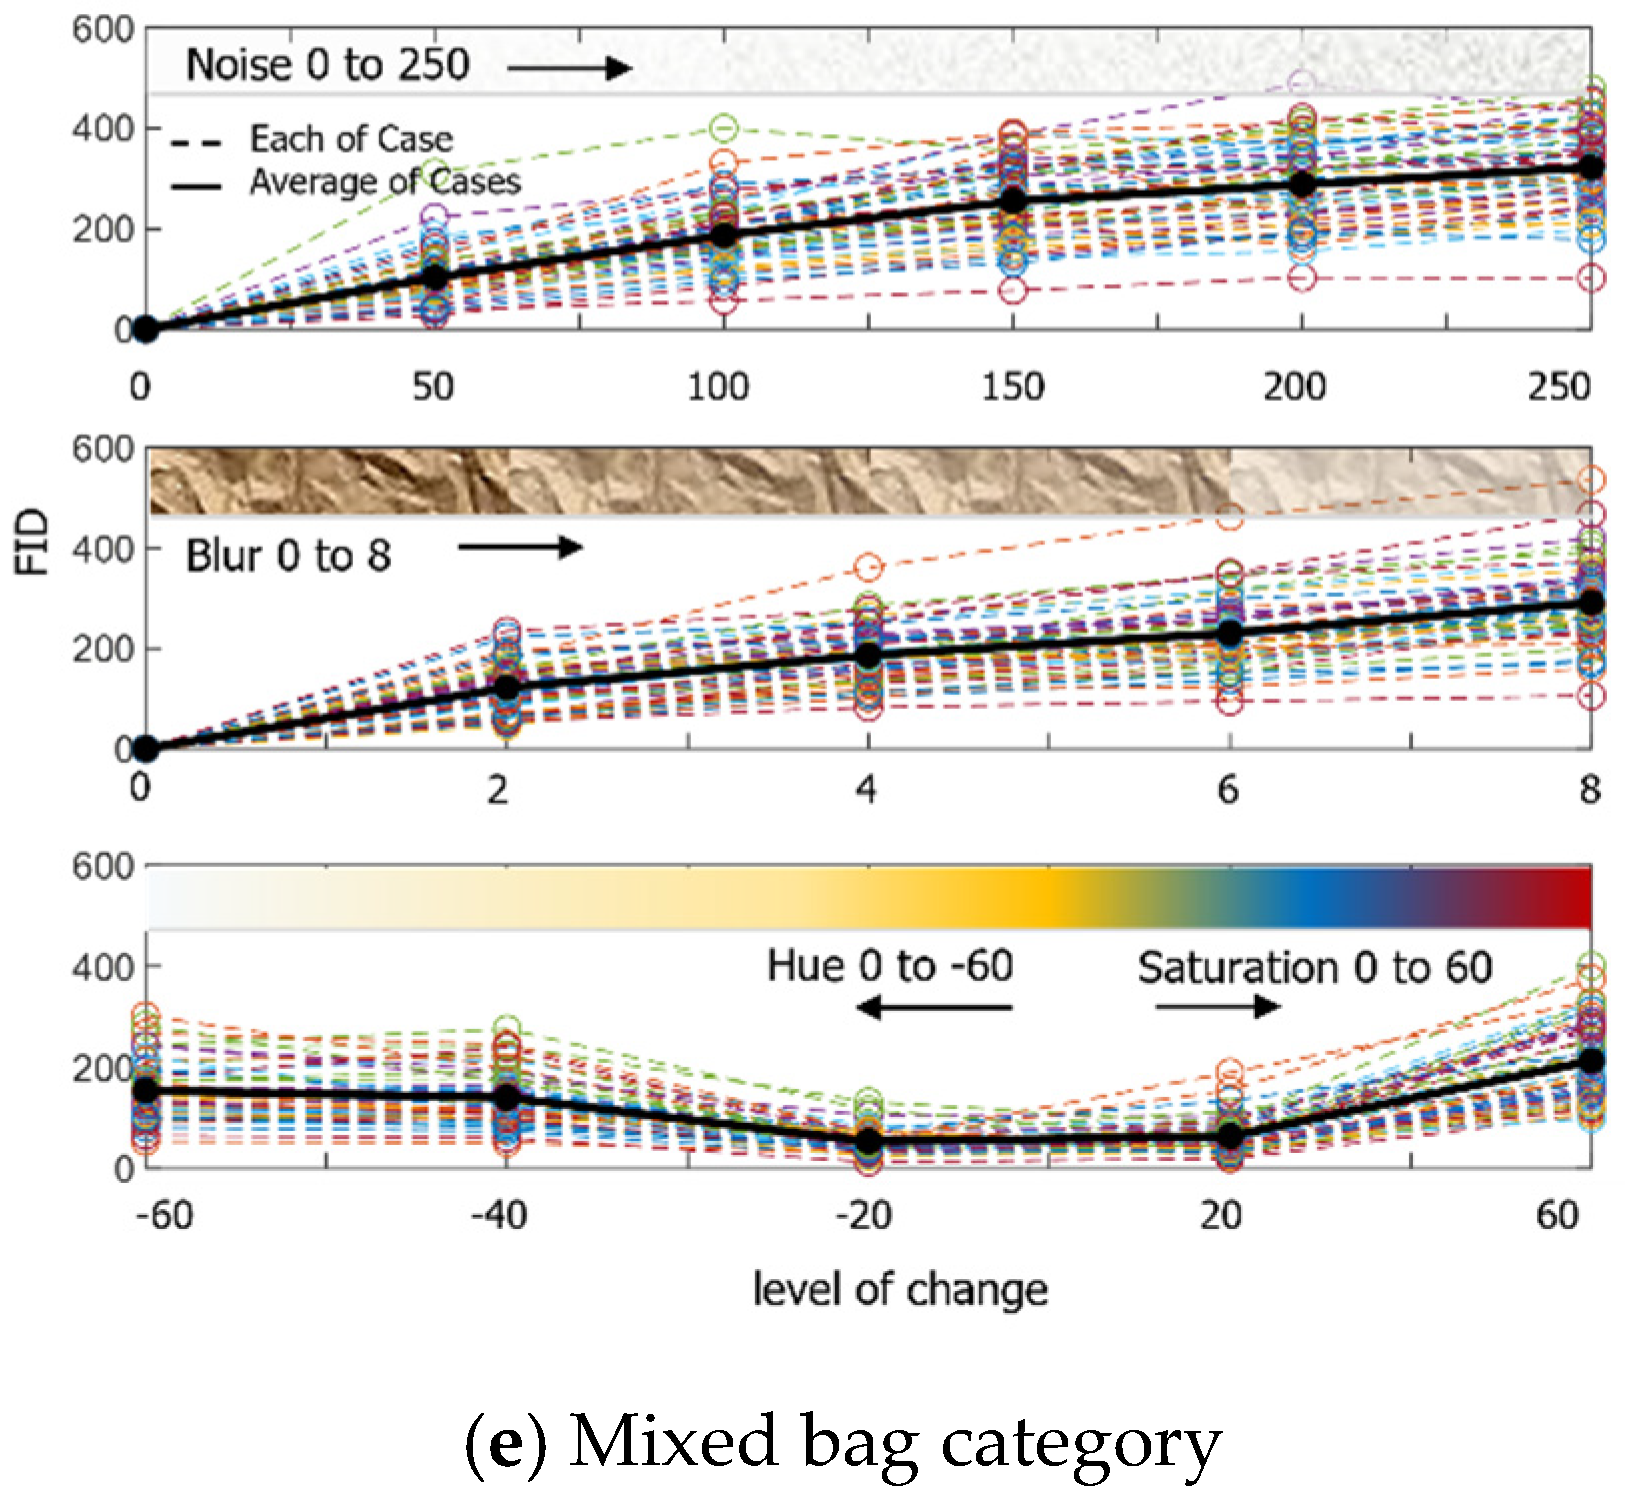
To enhance the AI model described in Section 3, additional learning is required. Thus, the amount of learning data was planned to be increased three times through the augmentation of each image. The augmentation technique added noise, a blur effect, and hue and saturation, and augmented 50 learning data from 5 super-categories to select a proper level of change. The result of the image FID is shown in Figure 6. The Python library applied was Python imgaug.
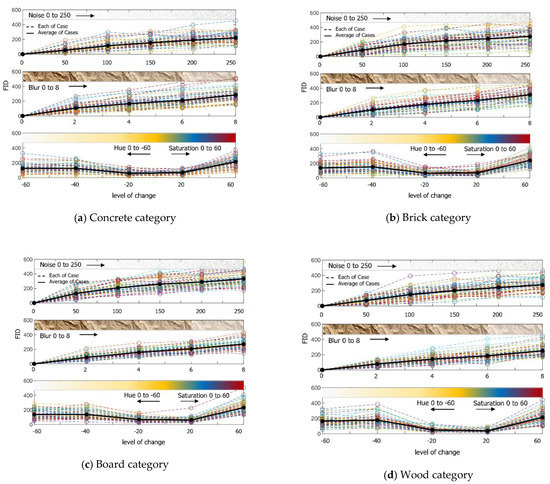
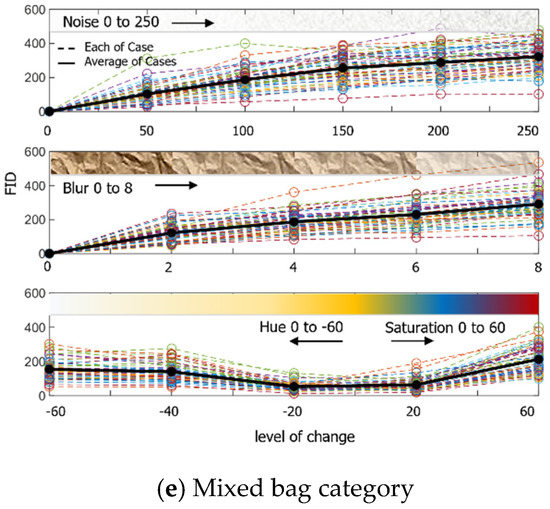
Figure 6.
Result of calculating the FID by augmenting 50 images per category each step by adding noise, giving blur effects, and changing colour.
4.2.1. Noise Change
The addition of noise is expected to influence the image resolution and size. Although the level of AI learning equipment enhanced, it is becoming a trend to learn a large amount of data. Therefore, it is necessary to decrease the size of the learning data, and noise is inevitable in this case. However, excessive noise distorts the target object, and unintended errors, such as spots or marks on the image, may be labelled, thereby ruining the learning data.
Furthermore, because it is a part being affected by the performance of the collected device, in case of old devices, images may not be collected in abundance or may result in noise resulting from a deteriorated image sensor.
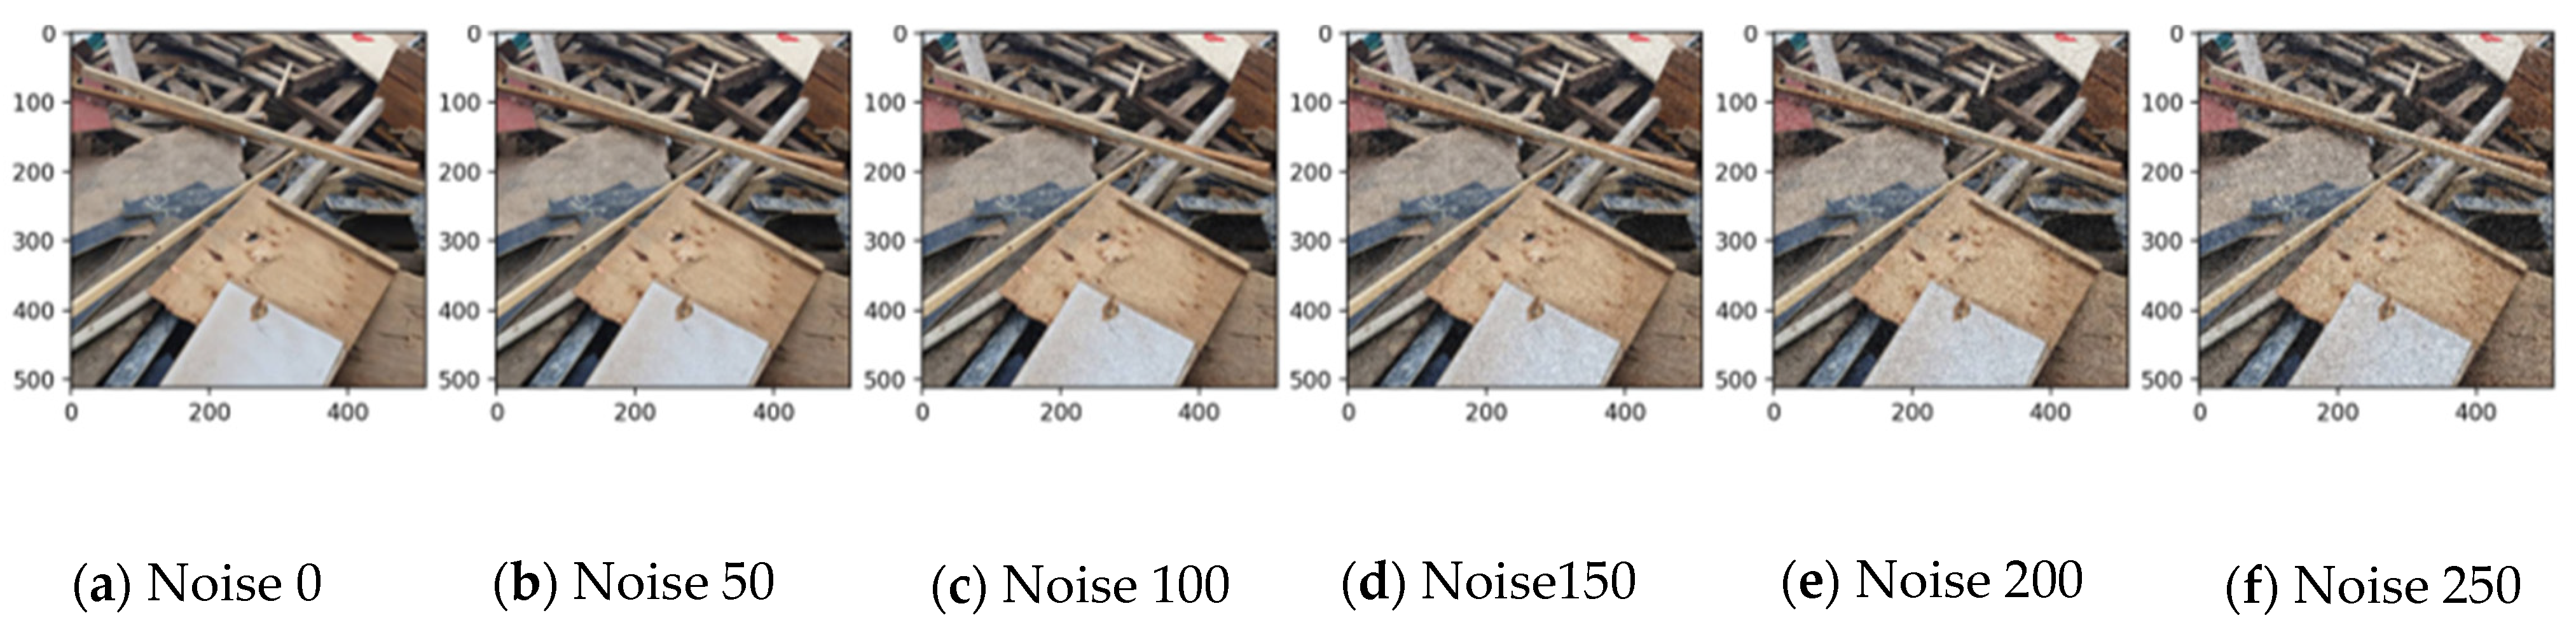
Therefore, a verification of this is necessary, and the research has examined the proper level by categorising noise into five steps. Noise was used by adding a noise technique according to the Gauss function, which involves loading the image, adding noise in accordance with the function, and combining it with the original image. Each noise step is the number of times overlapping Gaussian noise is sampled once per pixel in a normal distribution.
Table 5 shows the results of the data being learned above the appropriate level. It shows a decrease in the model performance when the noise is more than 100 times the FID. The 100 times noise, as shown in Figure 7, is considerable when looking with the naked eye, but seems to not have a significant impact on the accuracy of the learning data.
Table 5.
mAP of model according to the noise augmentation level.
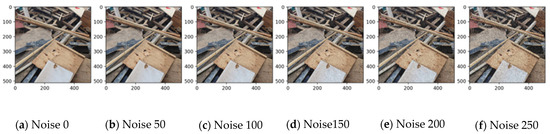
Figure 7.
Gaussian noise for the wood category per step.
4.2.2. Adding Blur Effect
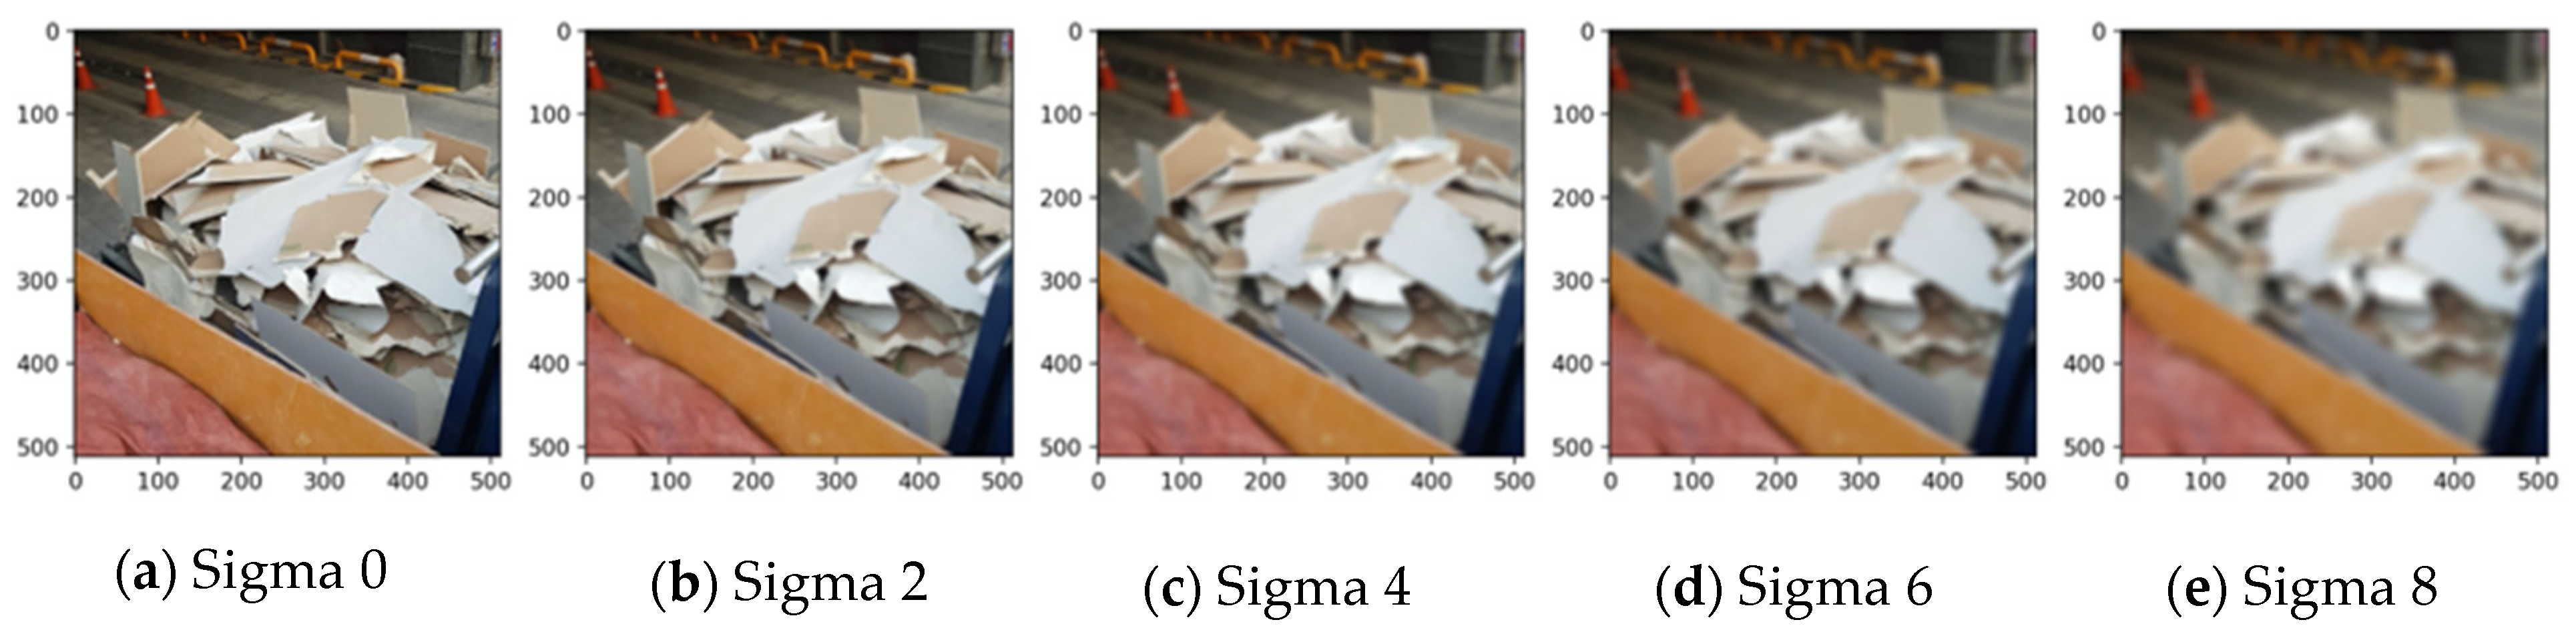
The blur effect appears to be correlated with the focus of the collected image. When collecting the data, out-of-focus data may exist owing to manpower or equipment problems, and if this evaluation is applied, the data could be utilised. Gaussian blur was used for the blur effect, and the steps were classified using sigma values. As shown in Table 6, the blur effect lowered the model capacity when over sigma 2. However, human eyesight could differentiate objects until sigma 6, as shown in Figure 8. However, if these data were labelled and used, there are concerns regarding a decrease in the model performance.
Table 6.
Model mAP per noise augmentation level.

Figure 8.
Gaussian noise for the board category in each step.
4.2.3. Hue and Saturation
It is expected that the circumstances of the data collected through variable research on hue and saturation changes could be investigated. Especially in outside circumstances, the overall colour of the obtained image changes depending on the amount of sunshine and time taken to capture the picture, and the effects can be verified through FID. For the changes, the image was brought from the source colour space and converted to HSV, H (hue) and S (saturation) channels were extracted, colour channel on the set colour code angle was applied, and finally converted to the original colour space again. In Figure 9, as observed by human vision, the image is to be observed in black and white when the hue reaches −60, and the image loses the original colour at saturation 20. As a result of the performance evaluation of the model, it was verified that the accuracy drastically dropped when the hue was below −20 and saturation was over 20, as shown in Table 7. Thus, the characteristics of the AI model primarily depend on the colour data and evaluate.
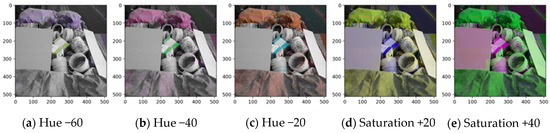
Figure 9.
Hue and saturation for the mixed bag category in each step.
Table 7.
Model mAP for different hue/saturation augmentation levels.
4.3. Final Learning Results
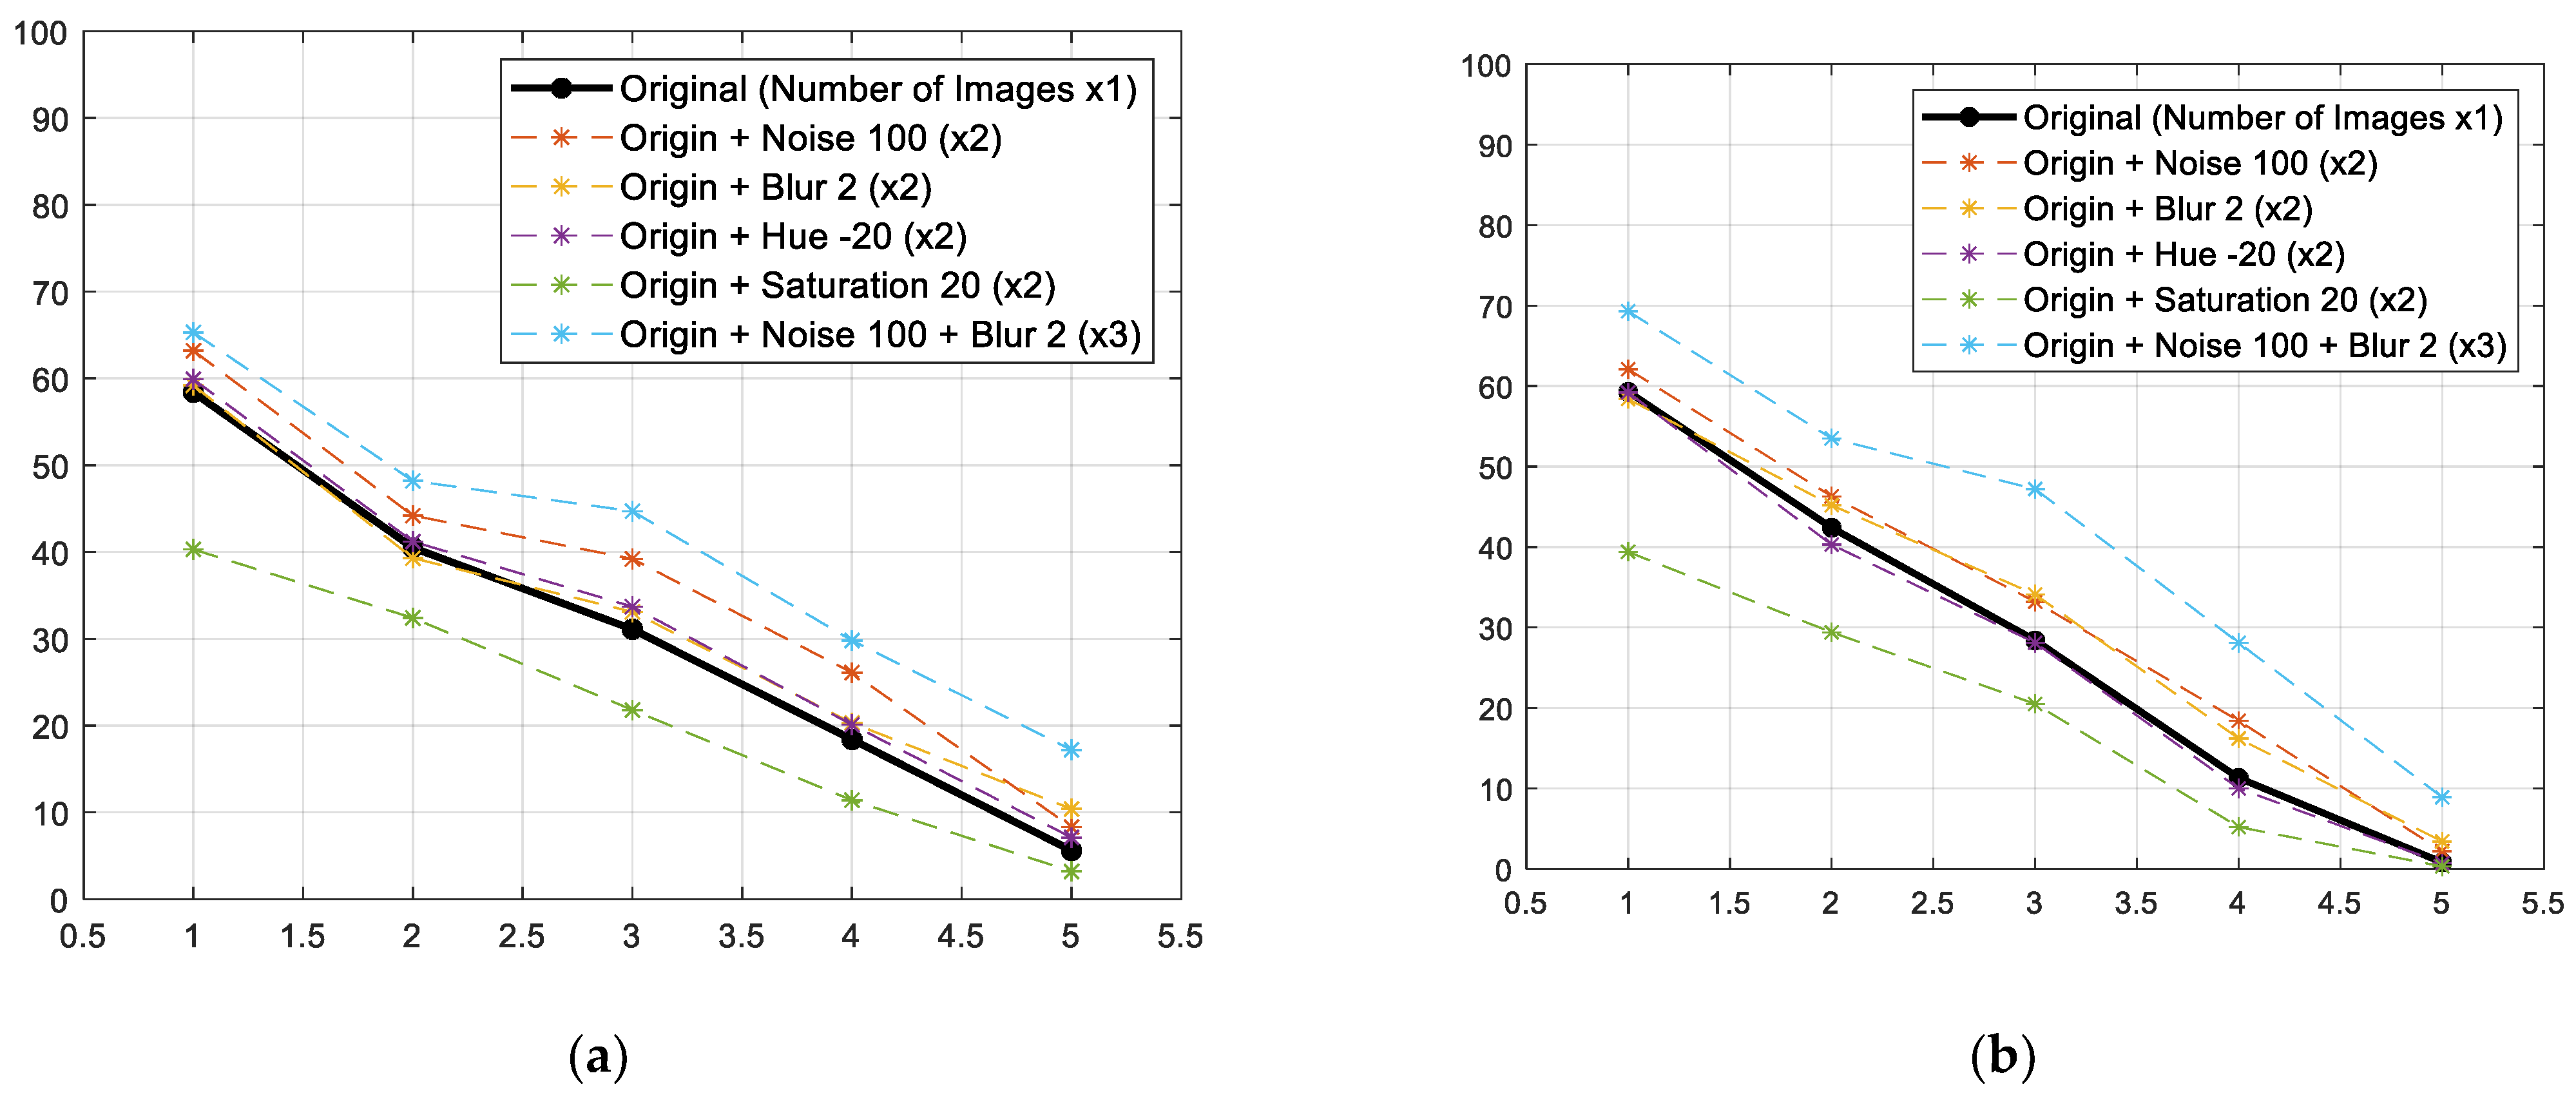
The results of learning by quantitatively adding the learning data according to the abovementioned results are shown in Figure 10. By doubling the amount of learning data, a maximum increase of 16% in the mAP was verified. This is a result of learning that amassed the noise filter 100 times, and tripled the learning data (2364) through augmentation in Sigma 2. On the other hand, the dataset with changed saturation data showed a decline in performance. Moreover, the proposed model seems insusceptible to changes in brightness, but is affected by noise or blur; thus, the results can be utilised in data acquisition for developing the model to recognise construction waste.
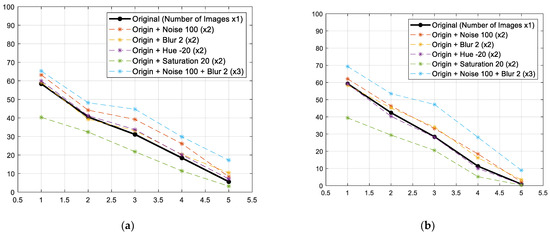
Figure 10.
Comparison results on mAP, which trained the model by adding images for learning through augmentation. (a) Box mAP; (b) Mask mAP.
5. Conclusions
Transfer learning was applied to an AI model to differentiate between five types of construction waste. Finally, differentiation was successful through transfer learning of the AI model using segmentation. However, there were some situations in which some categories could not be recognised, but could be solved by developing data quality assessment methods and refinement techniques.
- Advancement in refinement techniques to list the situation on the model function from the data collection step is needed, and not just labelling objects.
- Labelling was impossible without professional knowledge owing to the characteristics of construction waste. Additionally, supervisors were required to manage refined data because there were many objects that could not be differentiated while labelling.
- When the existing classification techniques are mainstream, it is possible to re-use the collected data for an instance segmentation model.
- Regarding the image data with complicated backgrounds, the precise classification of one category seems to enhance the model performance and decrease resource consumption rather than classifying several categories in one image.
- It was verified that increasing the amount of data indiscriminately worsened the quality of the model. Furthermore, it was necessary to apply quantitative augmentation to the learning data in each category.
- To develop an AI model that recognises construction waste, less data with minimum focus and noise, better the collected data performance. Although it does not have much impact on brightness, such as sunlight, to collect data avoiding time, such as sunrise/sunset, which affects image colour, seems better.
- By increasing the amount of data through augmentation using transfer learning, it was verified that mAP increased by 16%. However, the AI model needs to be redesigned by reflecting the characteristics of construction waste if the performance of the model cannot be acquired.
This study highlights the importance of data augmentation and transfer learning for efficient utilisation of artificial intelligence data set. In particular, it is considered that it would be possible to train artificial intelligence models using a small number of image data, since the data augmentation method presented in this study is a useful technique through the change of image values without taking additional pictures in various environments. Furthermore, the data augmentation methods suggested in this study would be applicable not only to construction waste, but also to other image-based artificial intelligence models.
Author Contributions
Conceptualisation, S.N. and S.H. (Sehee Han).; methodology, S.H. (Seokjae Heo) and Y.S.; software, S.H. (Sehee Han), Y.S. and M.L.; validation, S.N. and S.H. (Seokjae Heo); formal analysis, S.N. and S.H. (Seokjae Heo); investigation, S.H. (Seokjae Heo) and S.H. (Sehee Han); resources, S.N. and S.H. (Seokjae Heo); data curation, S.H. (Sehee Han), Y.S. and M.L.; writing—original draft preparation, S.N. and S.H. (Seokjae Heo); writing—review and editing, S.N. and S.H. (Sehee Han); visualisation, S.H. (Seokjae Heo) and M.L.; supervision, S.H. (Seokjae Heo); project administration, S.N.; funding acquisition, S.H. (Seokjae Heo). All authors have read and agreed to the published version of the manuscript.
Funding
This work was supported by the National Research Foundation of Korea (NRF) grant funded by the Korea government Ministry of Education (No. NRF-2018R1A6A1A07025819 and NRF-2020R1C1C1005406).
Data Availability Statement
The data used to support the results in this article are included within the paper. In addition, some of the data in this study are supported by the references mentioned in the manuscript. If you have any queries regarding the data, the data of this study would be available from the correspondence upon request.
Conflicts of Interest
The authors declare no conflict of interest.
References
- The World Bank. World Bank Open Data. 2021. Available online: https://data.worldbank.org (accessed on 21 November 2021).
- Bank of Korea. Economic Statistics System. 2021. Available online: https://ecos.bok.or.kr/EIndex_en.jsp (accessed on 25 November 2021).
- Intergovernmental Panel on Climate Change, Global warming of 1.5C. 2018. Available online: www.ipcc.ch/sr15/download/#chapter (accessed on 30 November 2021).
- Na, S.; Heo, S.-J.; Han, S. Construction Waste Reduction through Application of Different Structural Systems for the Slab in a Commercial Building: A South Korean Case. Appl. Sci. 2021, 11, 5870. [Google Scholar] [CrossRef]
- Davis, P.; Aziz, F.; Newaz, M.T.; Sher, W.; Simon, L. The classification of construction waste material using a deep convolutional neural network. Autom. Constr. 2021, 122, 103481. [Google Scholar] [CrossRef]
- Hollstein, F.; Cacho, Í.; Arnaiz, S.; Wohllebe, M. Challenges in automatic sorting of construction and demolition waste by hyperspectral imaging. In Advanced Environmental, Chemical, and Biological Sensing Technologies XIII; International Society for Optics and Photonics: Washington, DC, USA, 2017. [Google Scholar]
- Won, J.; Cheng, J.C.; Lee, G. Quantification of construction waste prevented by BIM-based design validation: Case studies in South Korea. Waste Manag. 2016, 49, 170–180. [Google Scholar] [CrossRef]
- Cha, G.-W.; Moon, H.J.; Kim, Y.-C.; Hong, W.-H.; Jeon, G.-Y.; Yoon, Y.R.; Hwang, C.; Hwang, J.-H. Evaluating recycling potential of demolition waste considering building structure types: A study in South Korea. J. Clean. Prod. 2020, 256, 120385. [Google Scholar] [CrossRef]
- Pickin, J.; Randell, P.; Trinh, J.; Grant, B. National Waste Report 2018; Department of the Environment and Energy: Melbourne, Victoria, Australia, 2018. [Google Scholar]
- Kabirifar, K.; Mojtahedi, M.; Wang, C.; Tam, V.W. Construction and demolition waste management contributing factors coupled with reduce, reuse, and recycle strategies for effective waste management: A review. J. Clean. Prod. 2020, 263, 121265. [Google Scholar] [CrossRef]
- Lu, W.; Yuan, H. A framework for understanding waste management studies in construction. Waste Manag. 2011, 31, 1252–1260. [Google Scholar] [CrossRef] [Green Version]
- Akinosho, T.D.; Oyedele, L.O.; Bilal, M.; Ajayi, A.O.; Delgado, M.D.; Akinade, O.O.; Ahmed, A.A. Deep learning in the construction industry: A review of present status and future innovations. J. Build. Eng. 2020, 32, 101827. [Google Scholar] [CrossRef]
- Yang, Q.; Shi, W.; Chen, J.; Lin, W. Deep convolution neural network-based transfer learning method for civil infrastructure crack detection. Autom. Constr. 2020, 116, 103199. [Google Scholar] [CrossRef]
- Bolya, D.; Zhou, C.; Xiao, F.; Lee, Y.J. YOLACT: Real-Time Instance Segmentation. In Proceedings of the 2019 IEEE/CVF In-ternational Conference on Computer Vision (ICCV), Seoul, Korea, 27 October–2 November 2019; pp. 9156–9165. [Google Scholar] [CrossRef] [Green Version]
- Tam, V.W.; Tam, C.M. Waste reduction through incentives: A case study. Build. Res. Inf. 2008, 36, 37–43. [Google Scholar] [CrossRef]
- Edwards, D.; Schelling, J. Municipal waste life cycle assessment: Part 2: Transport analysis and glass case study. Process Saf. Environ. Prot. 1999, 77, 259–274. [Google Scholar] [CrossRef]
- Menegaki, M.; Damigos, D. A review on current situation and challenges of construction and demolition waste management. Curr. Opin. Green Sustain. Chem. 2018, 13, 8–15. [Google Scholar] [CrossRef]
- Islam, R.; Nazifa, T.H.; Yuniarto, A.; Uddin, A.S.; Salmiati, S.; Shahid, S. An empirical study of construction and demolition waste generation and implication of recycling. Waste Manag. 2019, 95, 10–21. [Google Scholar] [CrossRef]
- Picon, A.; Ghita, O.; Iriondo, P.M.; Bereciartua, A.; Whelan, P.F. Automation of waste recycling using hyperspectral image analysis. In Proceedings of the 2010 IEEE 15th Conference on Emerging Technologies & Factory Automation (ETFA 2010), Bilbao, Spain, 13–16 September 2010. [Google Scholar]
- Toğaçar, M.; Ergen, B.; Cömert, Z. Waste classification using AutoEncoder network with integrated feature selection method in convolutional neural network models. Measurement 2020, 153, 107459. [Google Scholar] [CrossRef]
- Mao, W.-L.; Chen, W.-C.; Wang, C.-T.; Lin, Y.-H. Recycling waste classification using optimized convolutional neural network. Resour. Conserv. Recycl. 2021, 164, 105132. [Google Scholar] [CrossRef]
- VJ, A.; Balakrishnan, K.; Rosmi, T.B.; Krishna, K.S.; Sreejith, S.; Subha, T.D. Automatic waste segregator and monitoring system. J. Microcontroller Eng. Appl. 2016, 3, 1–7. [Google Scholar]
- Xiao, W.; Yang, J.; Fang, H.; Zhuang, J.; Ku, Y. A robust classification algorithm for separation of construction waste using NIR hyperspectral system. Waste Manag. 2019, 90, 1–9. [Google Scholar] [CrossRef]
- Adedeji, O.; Wang, Z. Intelligent Waste Classification System Using Deep Learning Convolutional Neural Network. Procedia Manuf. 2019, 35, 607–612. [Google Scholar] [CrossRef]
- Cha, Y.-J.; Choi, W.; Büyüköztürk, O. Deep Learning-Based Crack Damage Detection Using Convolutional Neural Networks. Comput. Civ. Infrastruct. Eng. 2017, 32, 361–378. [Google Scholar] [CrossRef]
- Liang, S.; Gu, Y. A deep convolutional neural network to simultaneously localize and recognize waste types in images. Waste Manag. 2021, 126, 247–257. [Google Scholar] [CrossRef]
- Wang, H. Garbage Recognition and Classification System Based on Convolutional Neural Network VGG16. In Proceedings of the 2020 3rd International Conference on Advanced Electronic Materials, Computers and Software Engineering (AEMCSE), Shenzen, China, 24–26 April 2020. [Google Scholar]
- Shin, Y.; Heo, S.; Han, S.; Kim, J.; Na, S. An Image-Based Steel Rebar Size Estimation and Counting Method Using a Convolutional Neural Network Combined with Homography. Buildings 2021, 11, 463. [Google Scholar] [CrossRef]
- Cha, Y.-J.; Choi, W. Vision-Based Concrete Crack Detection Using a Convolutional Neural Network. In Dynamics of Civil Structures; Springer: Berlin, Germany, 2017; Volume 2, pp. 71–73. [Google Scholar]
- Zhang, H.; Yan, X.; Li, H. Ergonomic posture recognition using 3D view-invariant features from single ordinary camera. Autom. Constr. 2018, 94, 1–10. [Google Scholar] [CrossRef]
- Abioye, S.O.; Oyedele, L.O.; Akanbi, L.; Ajayi, A.; Delgado, J.M.D.; Bilal, M.; Akinade, O.O.; Ahmed, A. Artificial intelligence in the construction industry: A review of present status, opportunities and future challenges. J. Build. Eng. 2021, 44, 103299. [Google Scholar] [CrossRef]
- Pan, Y.; Zhang, L. Roles of artificial intelligence in construction engineering and management: A critical review and future trends. Autom. Constr. 2021, 122, 103517. [Google Scholar] [CrossRef]
- Deng, F.; He, Y.; Zhou, S.; Yu, Y.; Cheng, H.; Wu, X. Compressive strength prediction of recycled concrete based on deep learning. Constr. Build. Mater. 2018, 175, 562–569. [Google Scholar] [CrossRef]
- Gopalakrishnan, K.; Khaitan, S.K.; Choudhary, A.; Agrawal, A. Deep Convolutional Neural Networks with transfer learning for computer vision-based data-driven pavement distress detection. Constr. Build. Mater. 2017, 157, 322–330. [Google Scholar] [CrossRef]
- Dung, C.V.; Anh, L.D. Autonomous concrete crack detection using deep fully convolutional neural network. Autom. Constr. 2019, 99, 52–58. [Google Scholar] [CrossRef]
- Koch, C.; Georgieva, K.; Kasireddy, V.; Akinci, B.; Fieguth, P. A review on computer vision based defect detection and condition assessment of concrete and asphalt civil infrastructure. Adv. Eng. Informatics 2015, 29, 196–210. [Google Scholar] [CrossRef] [Green Version]
- Son, H.; Seong, H.; Choi, H.; Kim, C. Real-Time Vision-Based Warning System for Prevention of Collisions between Workers and Heavy Equipment. J. Comput. Civ. Eng. 2019, 33, 04019029. [Google Scholar] [CrossRef]
- Spencer, B.F., Jr.; Hoskere, V.; Narazaki, Y. Advances in computer vision-based civil infrastructure inspection and monitoring. Engineering 2019, 5, 199–222. [Google Scholar] [CrossRef]
- Yang, M.; Thung, G. Classification of Trash for Recyclability Status. CS229 Project Report 2016. Available online: https://pdfs.semanticscholar.org/c908/11082924011c73fea6252f42b01af9076f28.pdf (accessed on 30 November 2021).
- Proença, P.F.; Simões, P. TACO: Trash Annotations in Context for Litter Detection. arXiv 2020, arXiv:2003.06975. [Google Scholar]
- Ahmad, K.; Khan, K.; Al-Fuqaha, A. Intelligent Fusion of Deep Features for Improved Waste Classification. IEEE Access 2020, 8, 96495–96504. [Google Scholar] [CrossRef]
- Wang, Z.; Peng, B.; Huang, Y.; Sun, G. Classification for plastic bottles recycling based on image recognition. Waste Manag. 2019, 88, 170–181. [Google Scholar] [CrossRef]
- De Carolis, B.; Ladogana, F.; Macchiarulo, N. YOLO TrashNet: Garbage Detection in Video Streams. In Proceedings of the 2020 IEEE Conference on Evolving and Adaptive Intelligent Systems (EAIS), Bari, Italy, 27-29 May 2020. [Google Scholar]
- National Information Society Agency. AI Learning Data Quality Management Guidelines; National Information Society Agency: Daegu, Korea, 2021.
- National Information Society Agency. AI Dataset Construction Guidebook; National Information Society Agency: Daegu, Korea, 2021.
- Ministry of Environment. Enforcement Decree of the Wastes Control Act; Ministry of Environment: Seoul, Korea, 2019.
- Russell, B.C.; Torralba, A.; Murphy, K.P.; Freeman, W.T. LabelMe: A Database and Web-Based Tool for Image Annotation. Int. J. Comput. Vis. 2008, 77, 157–173. [Google Scholar] [CrossRef]
- Heo, S.; Han, S.; Shin, Y.; Na, S. Challenges of Data Refining Process during the Artificial Intelligence Development Projects in the Architecture, Engineering and Construction Industry. Appl. Sci. 2021, 11, 10919. [Google Scholar] [CrossRef]


Publisher’s Note: MDPI stays neutral with regard to jurisdictional claims in published maps and institutional affiliations. |
© 2022 by the authors. Licensee MDPI, Basel, Switzerland. This article is an open access article distributed under the terms and conditions of the Creative Commons Attribution (CC BY) license (https://creativecommons.org/licenses/by/4.0/).