
Study of Damage Quantification of Concrete Drainage Pipes Based on Point Cloud Segmentation and Reconstruction


Abstract
:1. Introduction
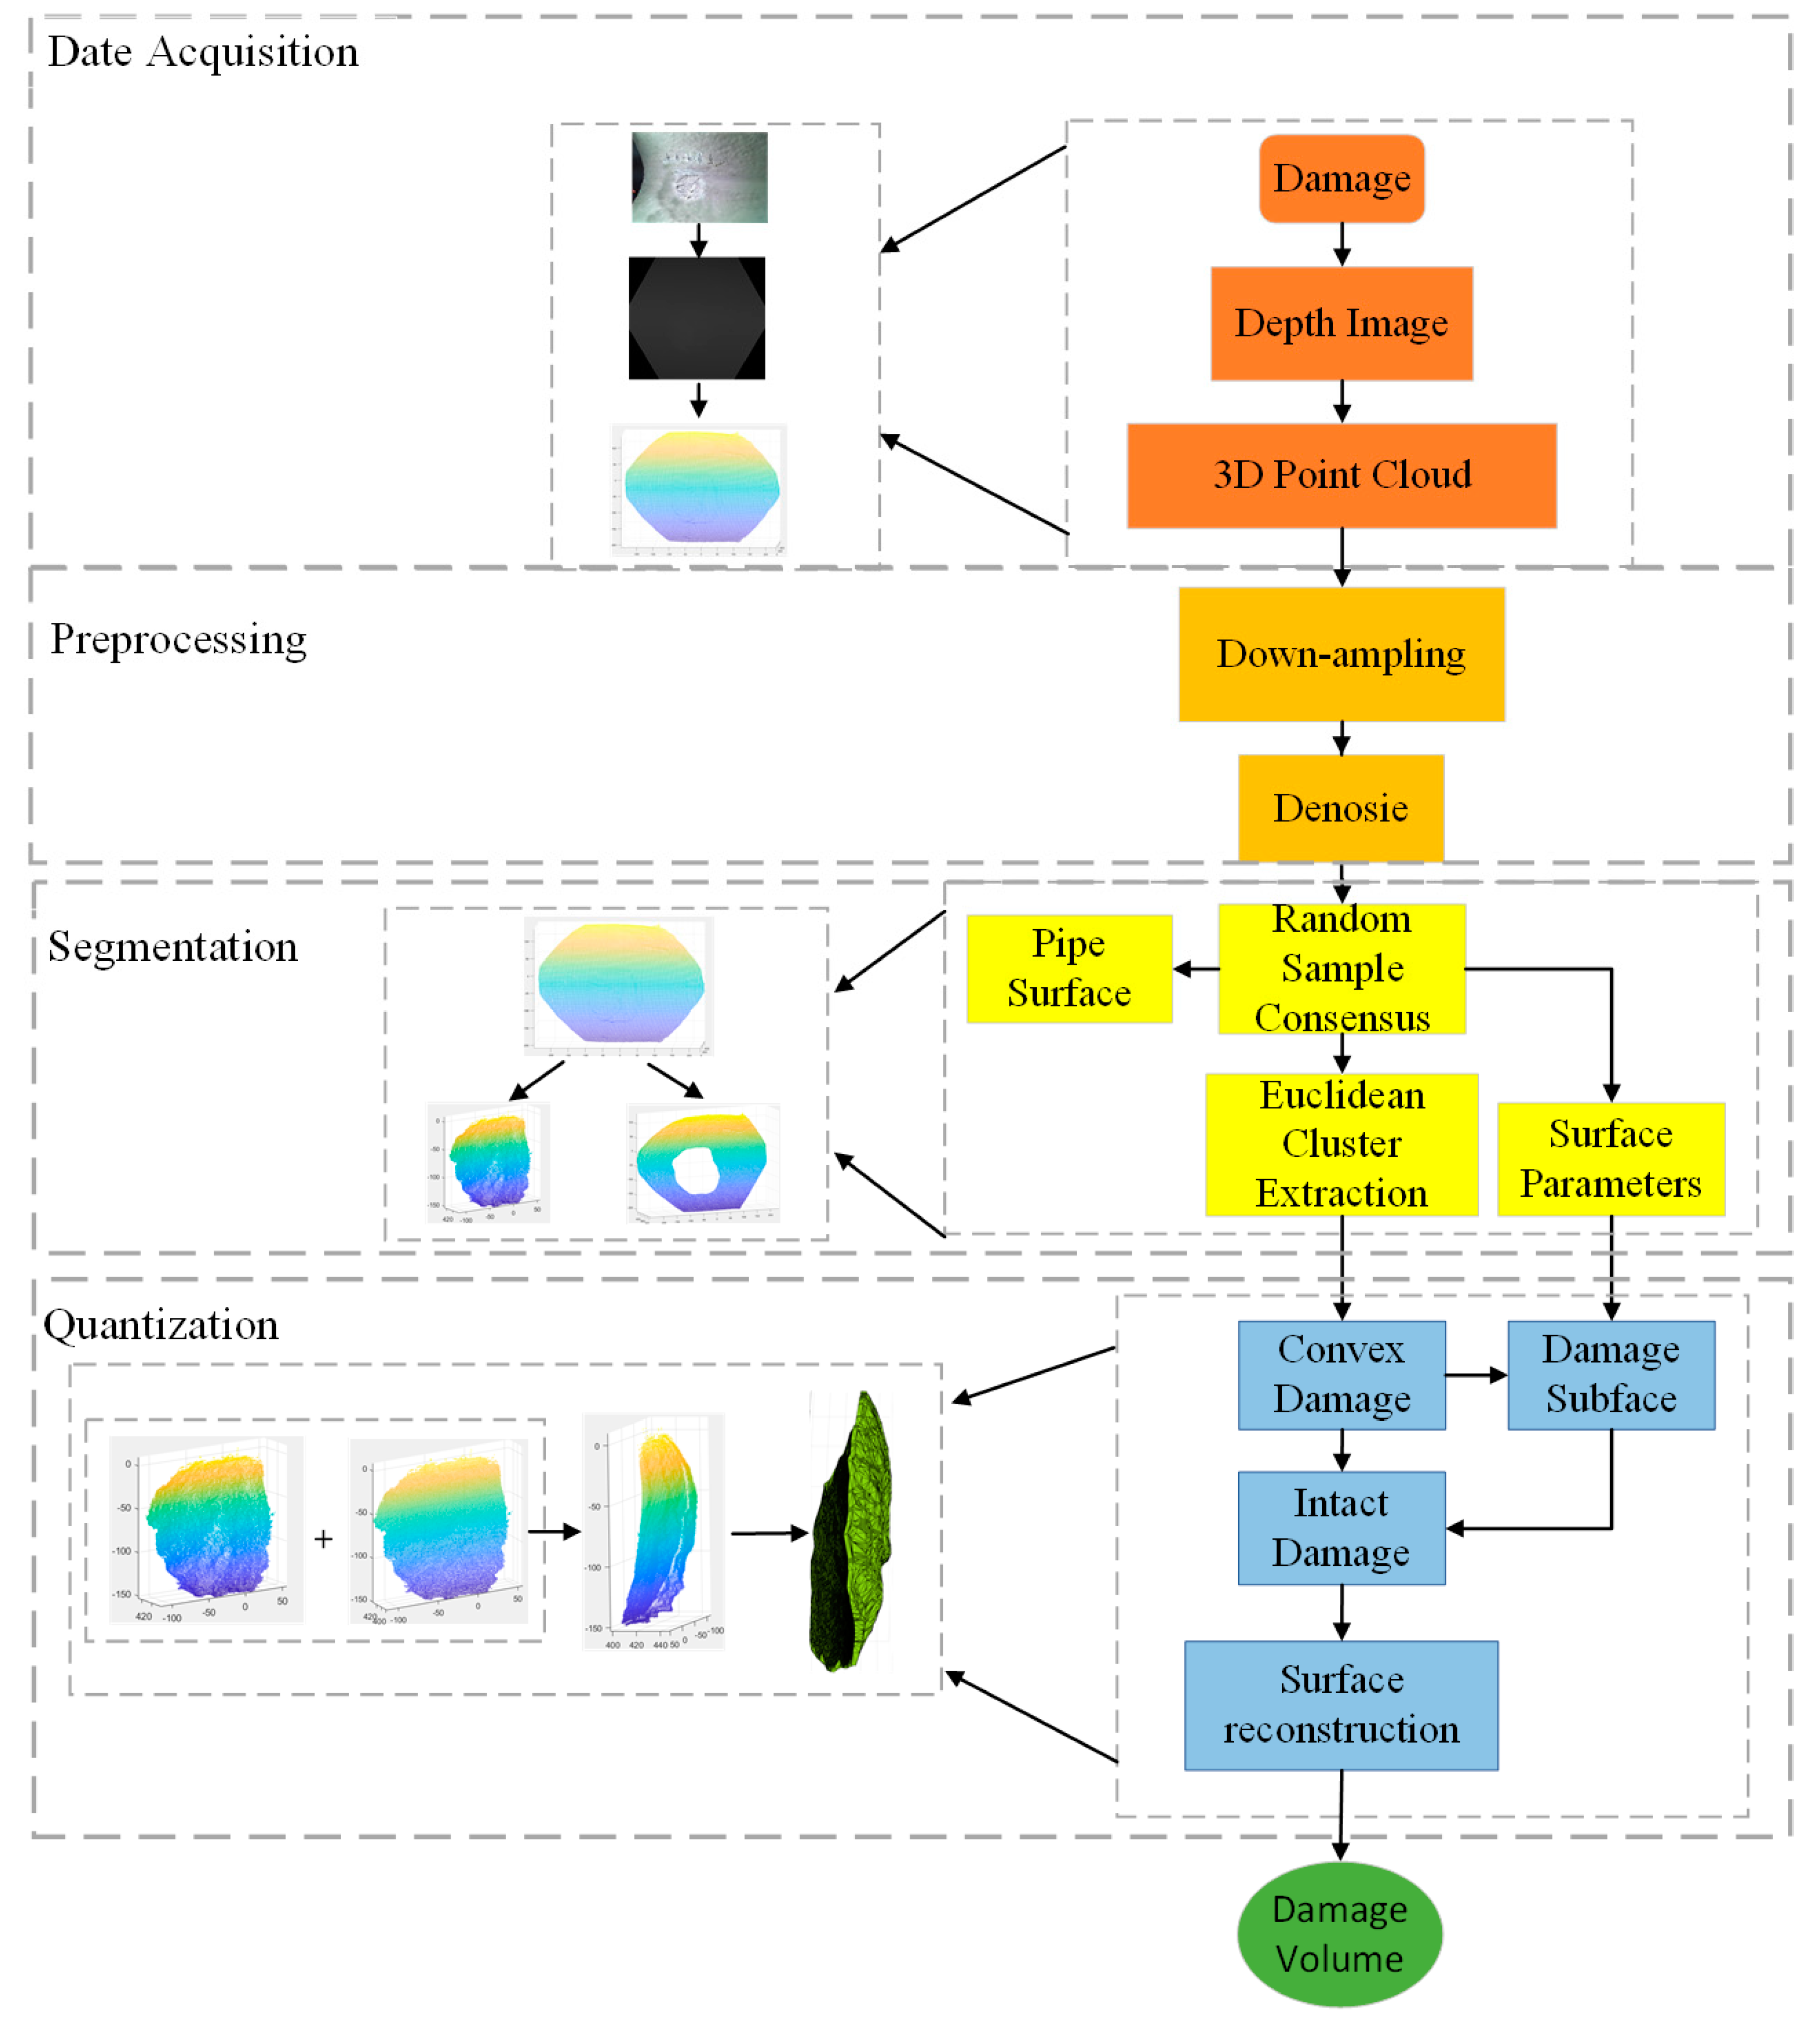
2. Concrete Pipeline Damage Volume Quantitative Detection Framework
2.1. Data Acquisition
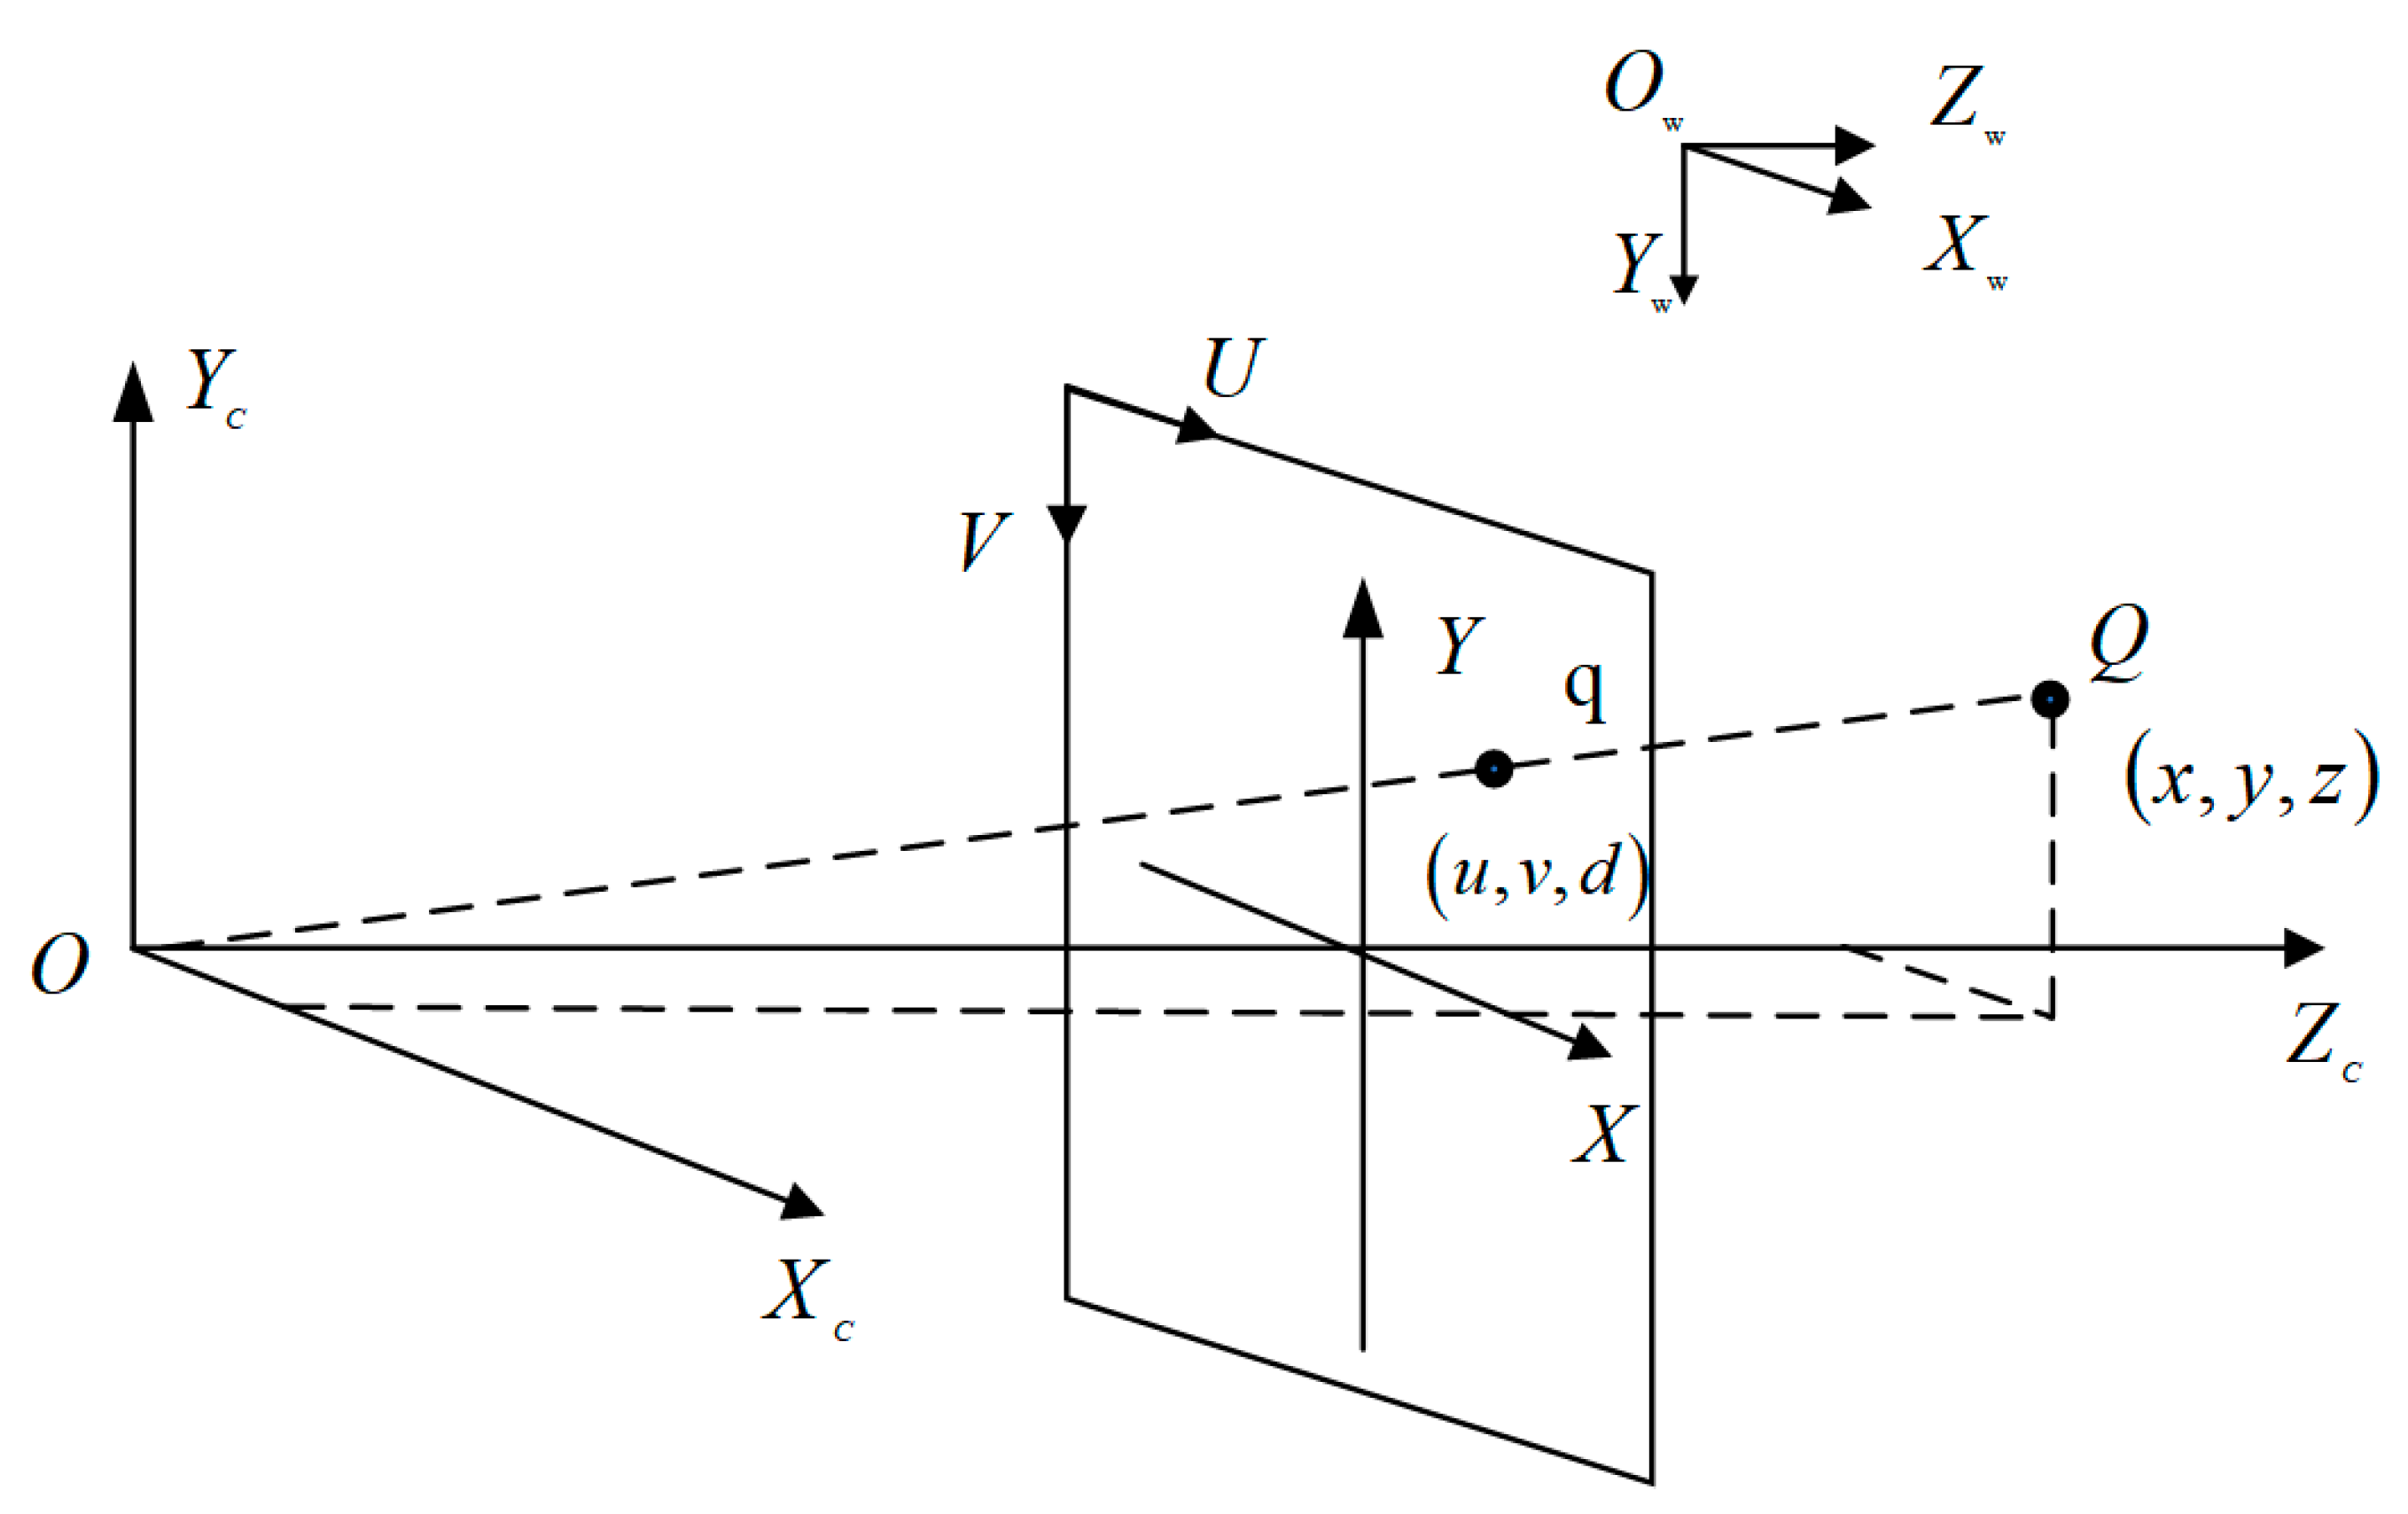
2.1.1. RGB-D Camera
2.1.2. Depth Frame-Mapping 3D Point Cloud
2.2. Data Preprocessing
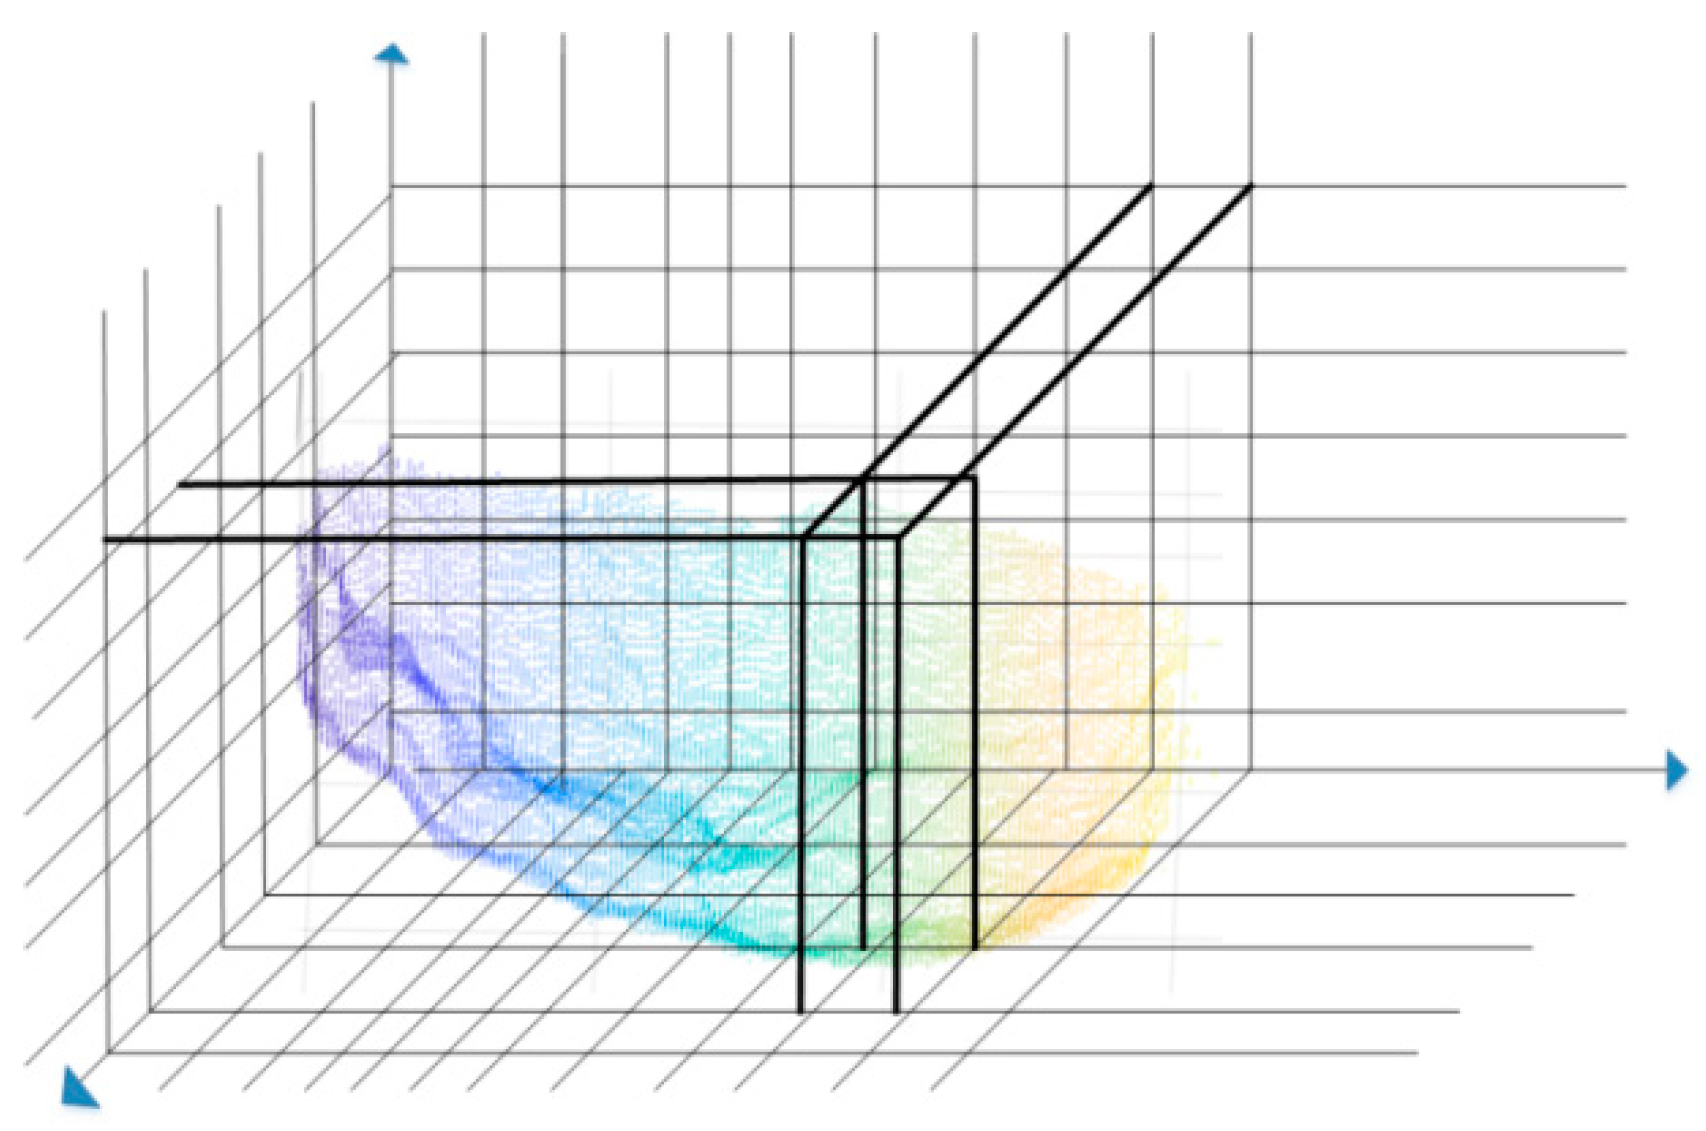
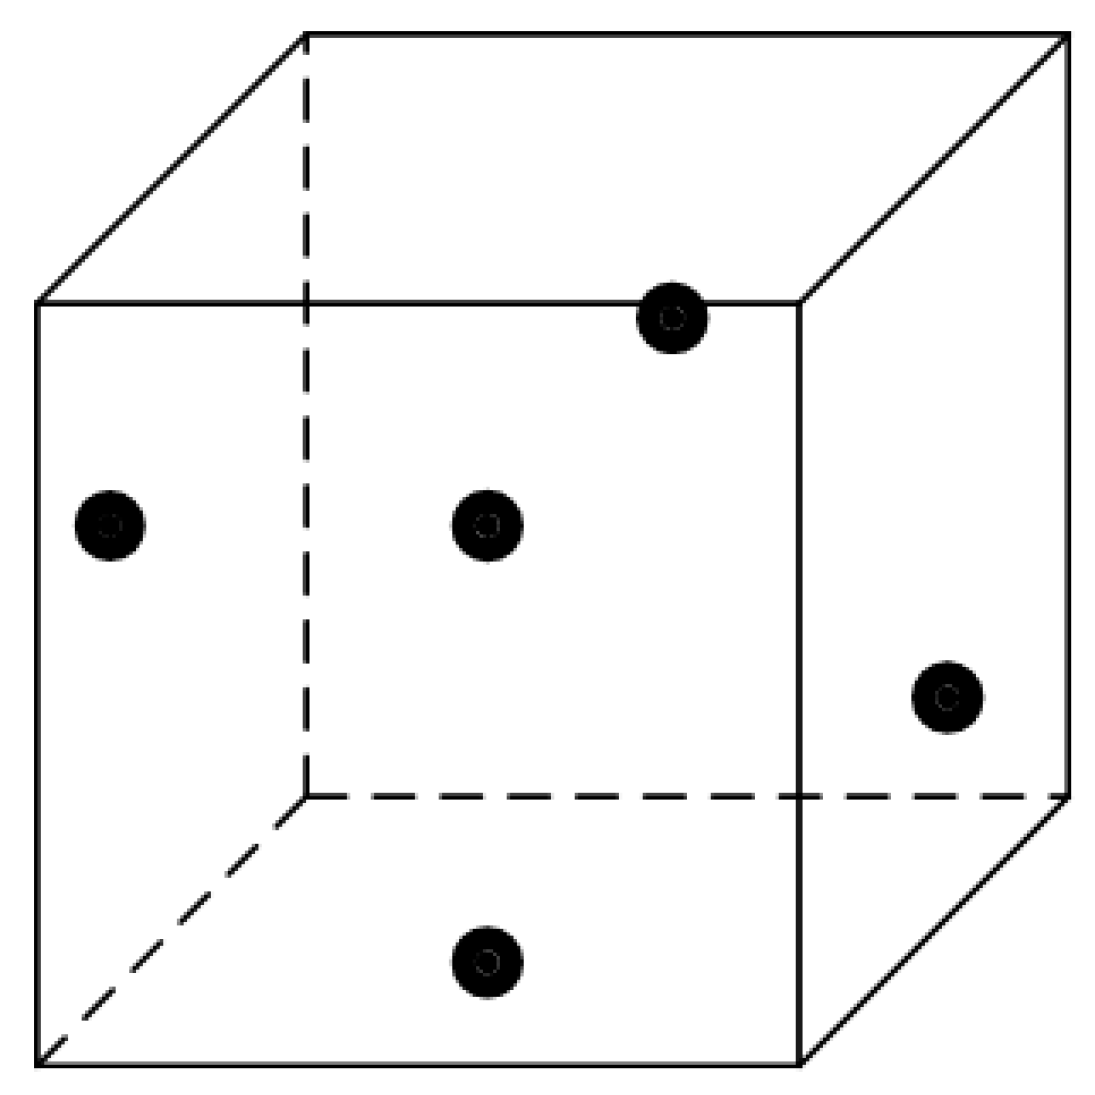
2.2.1. Voxel Sampling
2.2.2. Gaussian Filtering Reduces Surface Noise
2.3. Surface Segmentation
2.3.1. RANSAC Algorithm to Remove Surface Point Clouds
2.3.2. Damage Clustering Segmentation
2.4. Volume Quantization
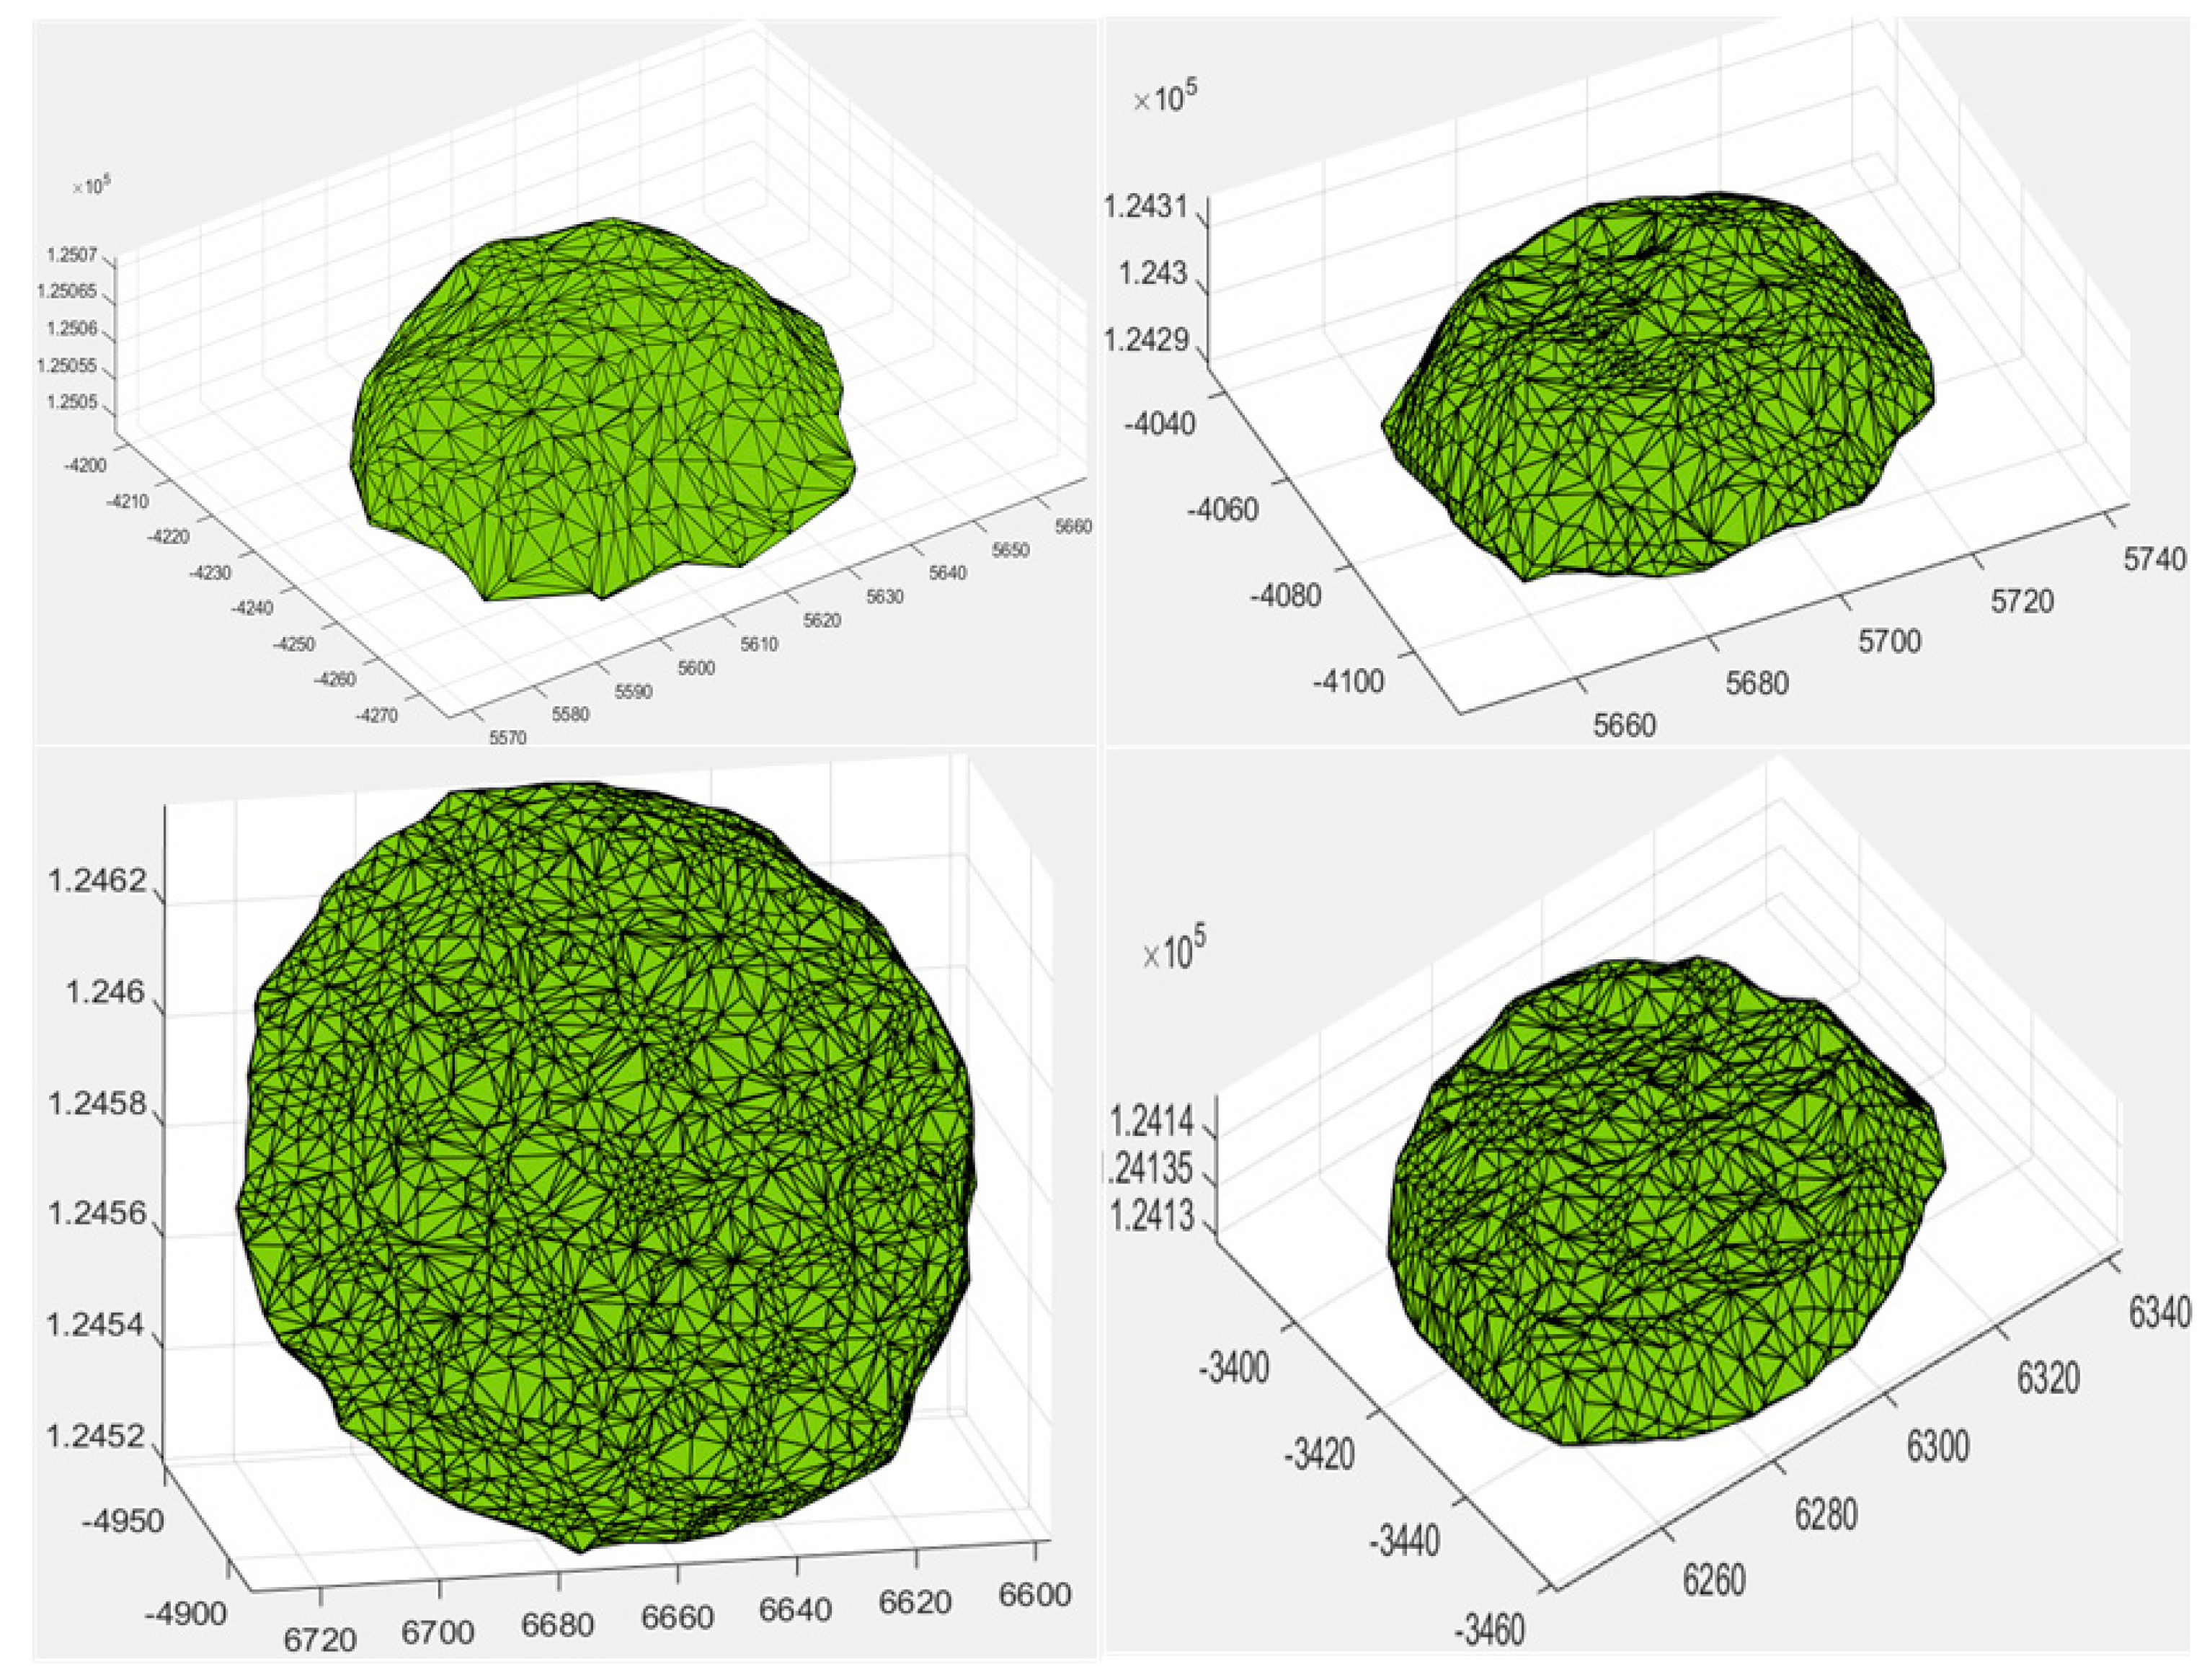
2.4.1. Damage Reconstruction
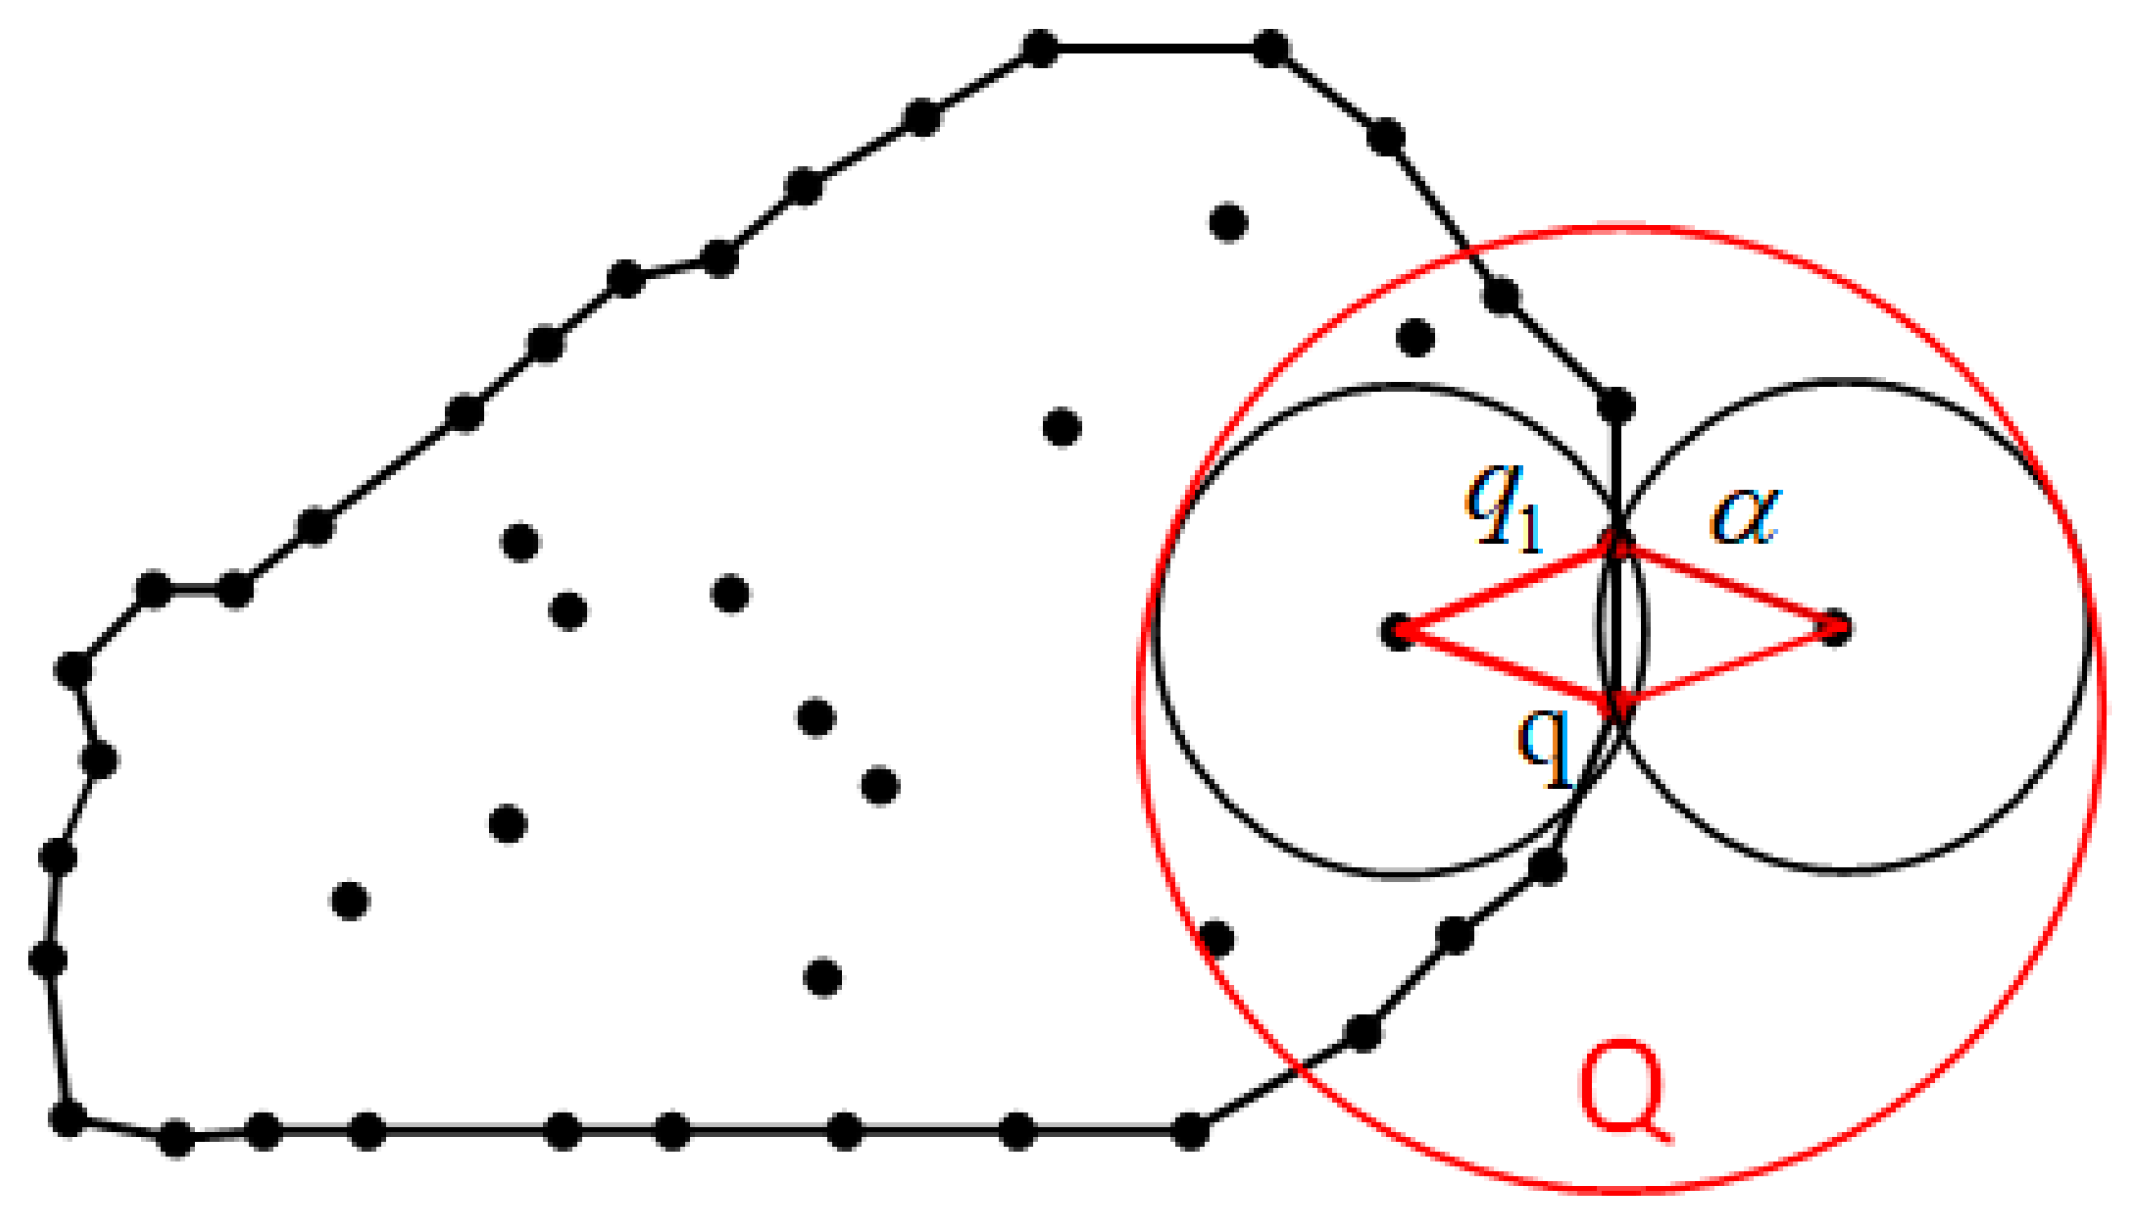
2.4.2. Surface Reconstruction
3. Experiment
3.1. Damage Real Volume Measurement Experiment
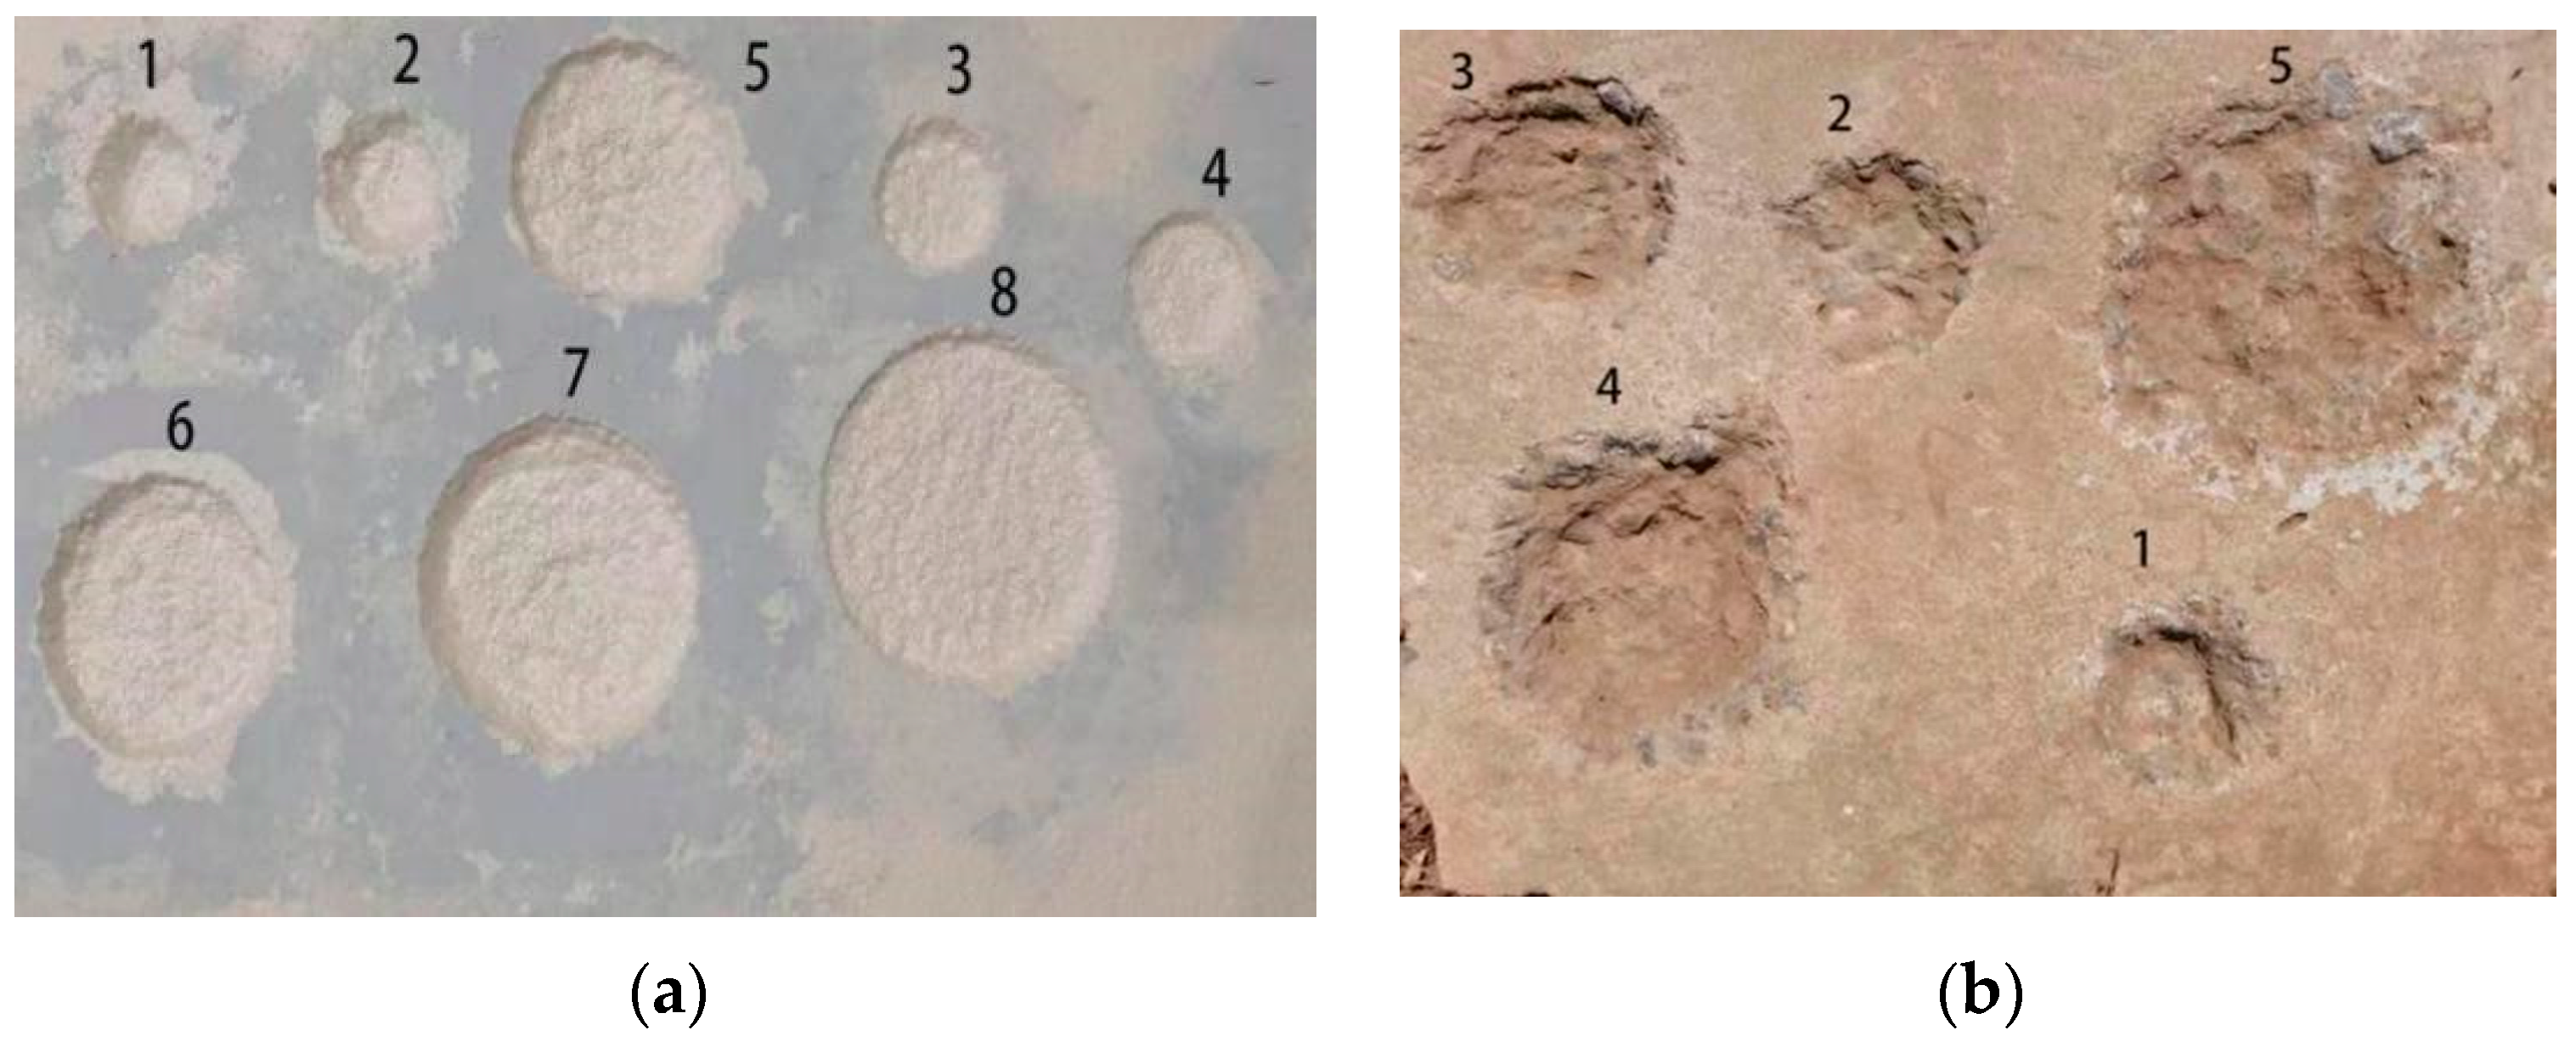
3.1.1. Damage Setting
3.1.2. Measurement of Real Damage Volume
3.2. Volume Quantization of 3D Point Cloud Damage Test
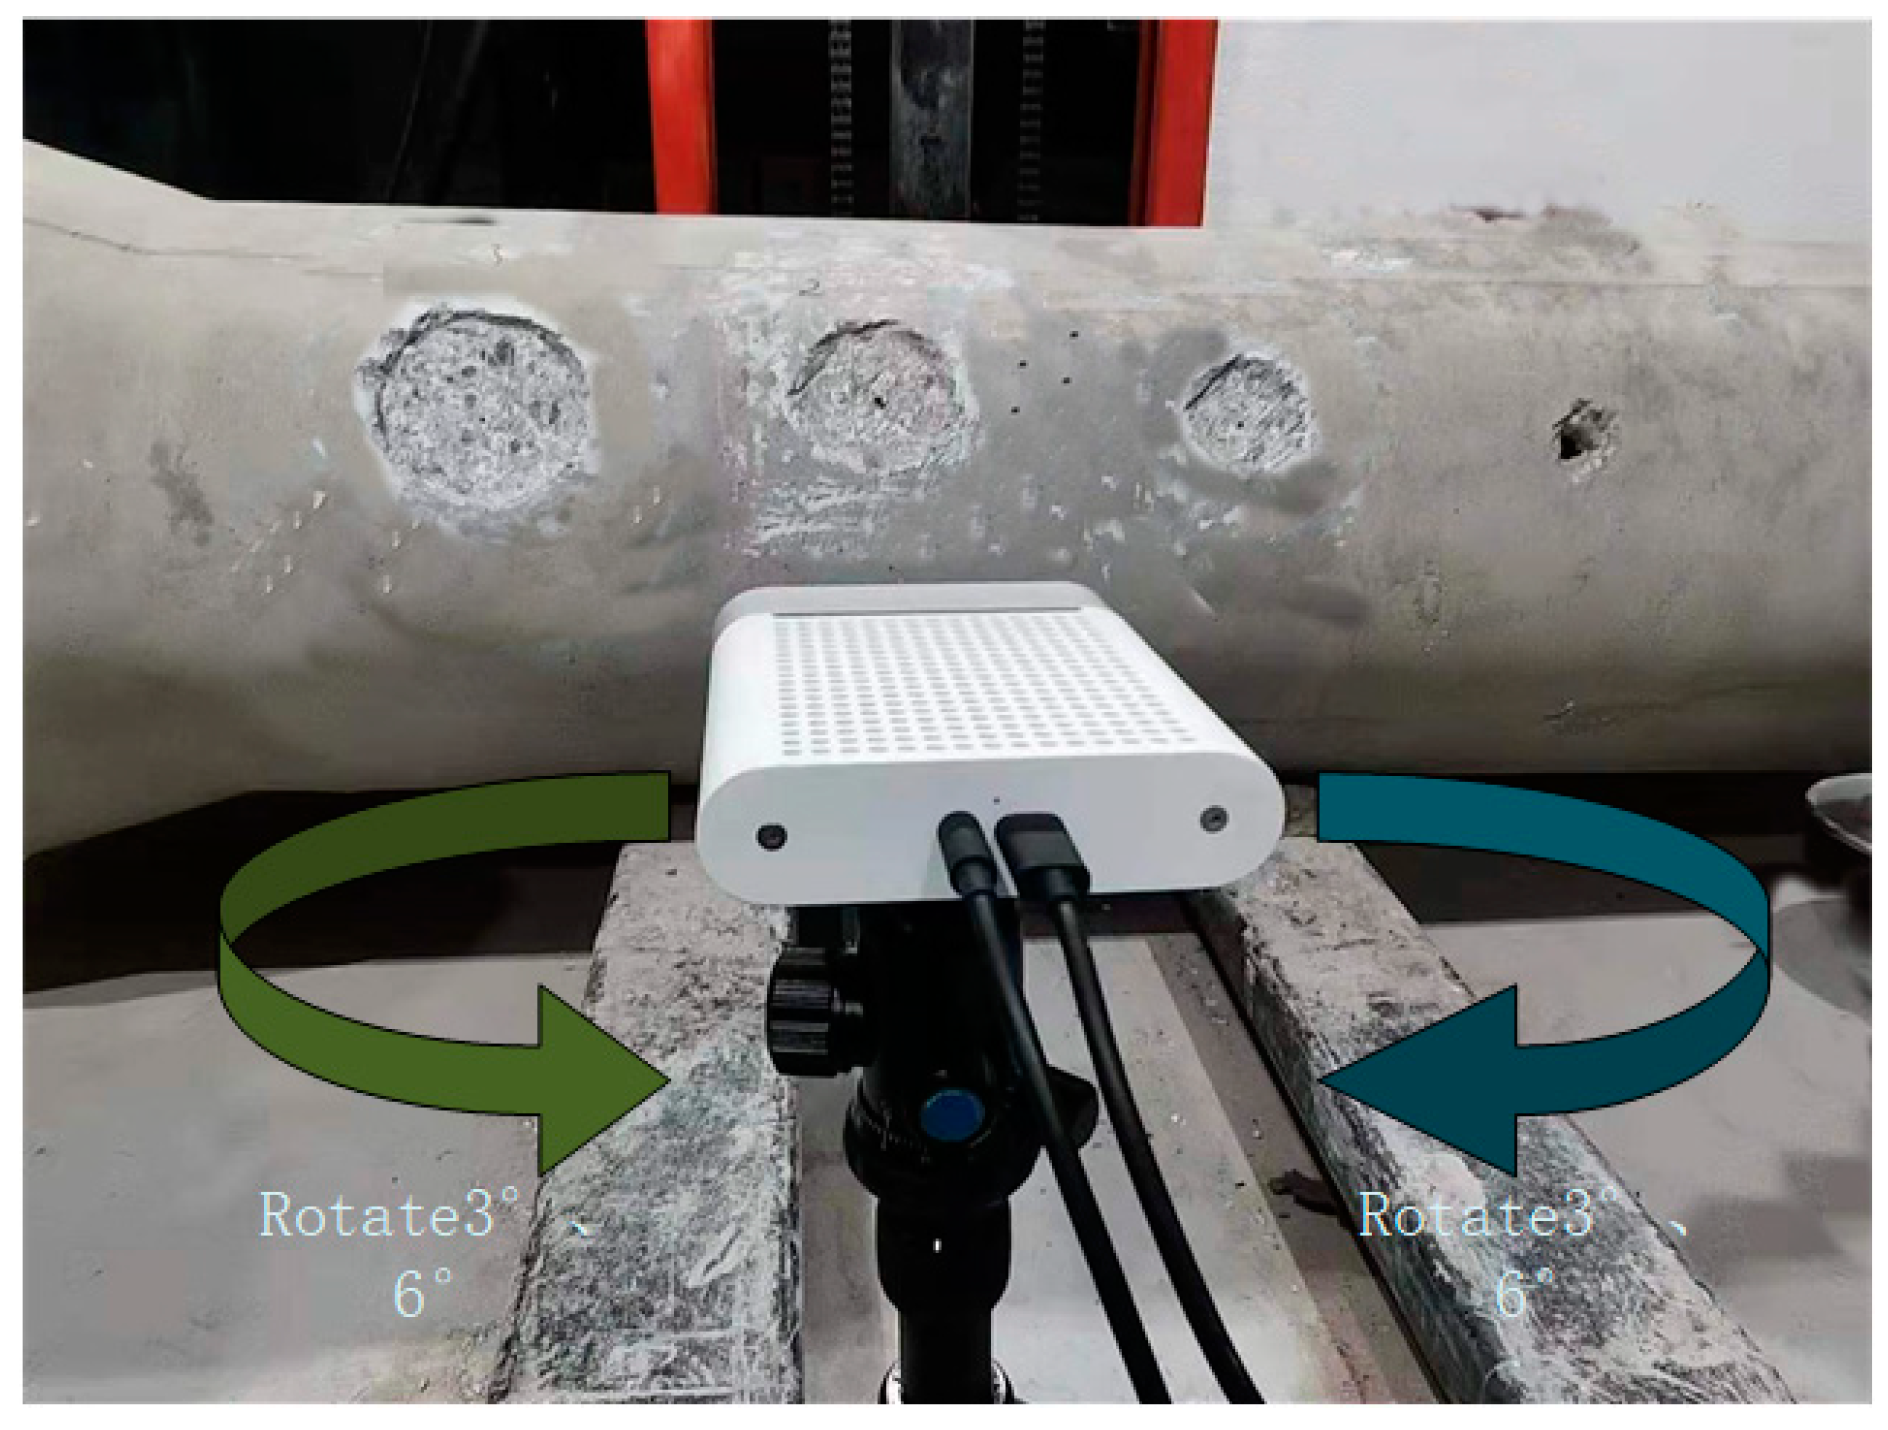
3.2.1. 3D Point Cloud Damage Shooting
3.2.2. Volume Quantization Results of 3D Point Cloud Damage Test
4. Performance Analysis
4.1. Performance of Foam Board
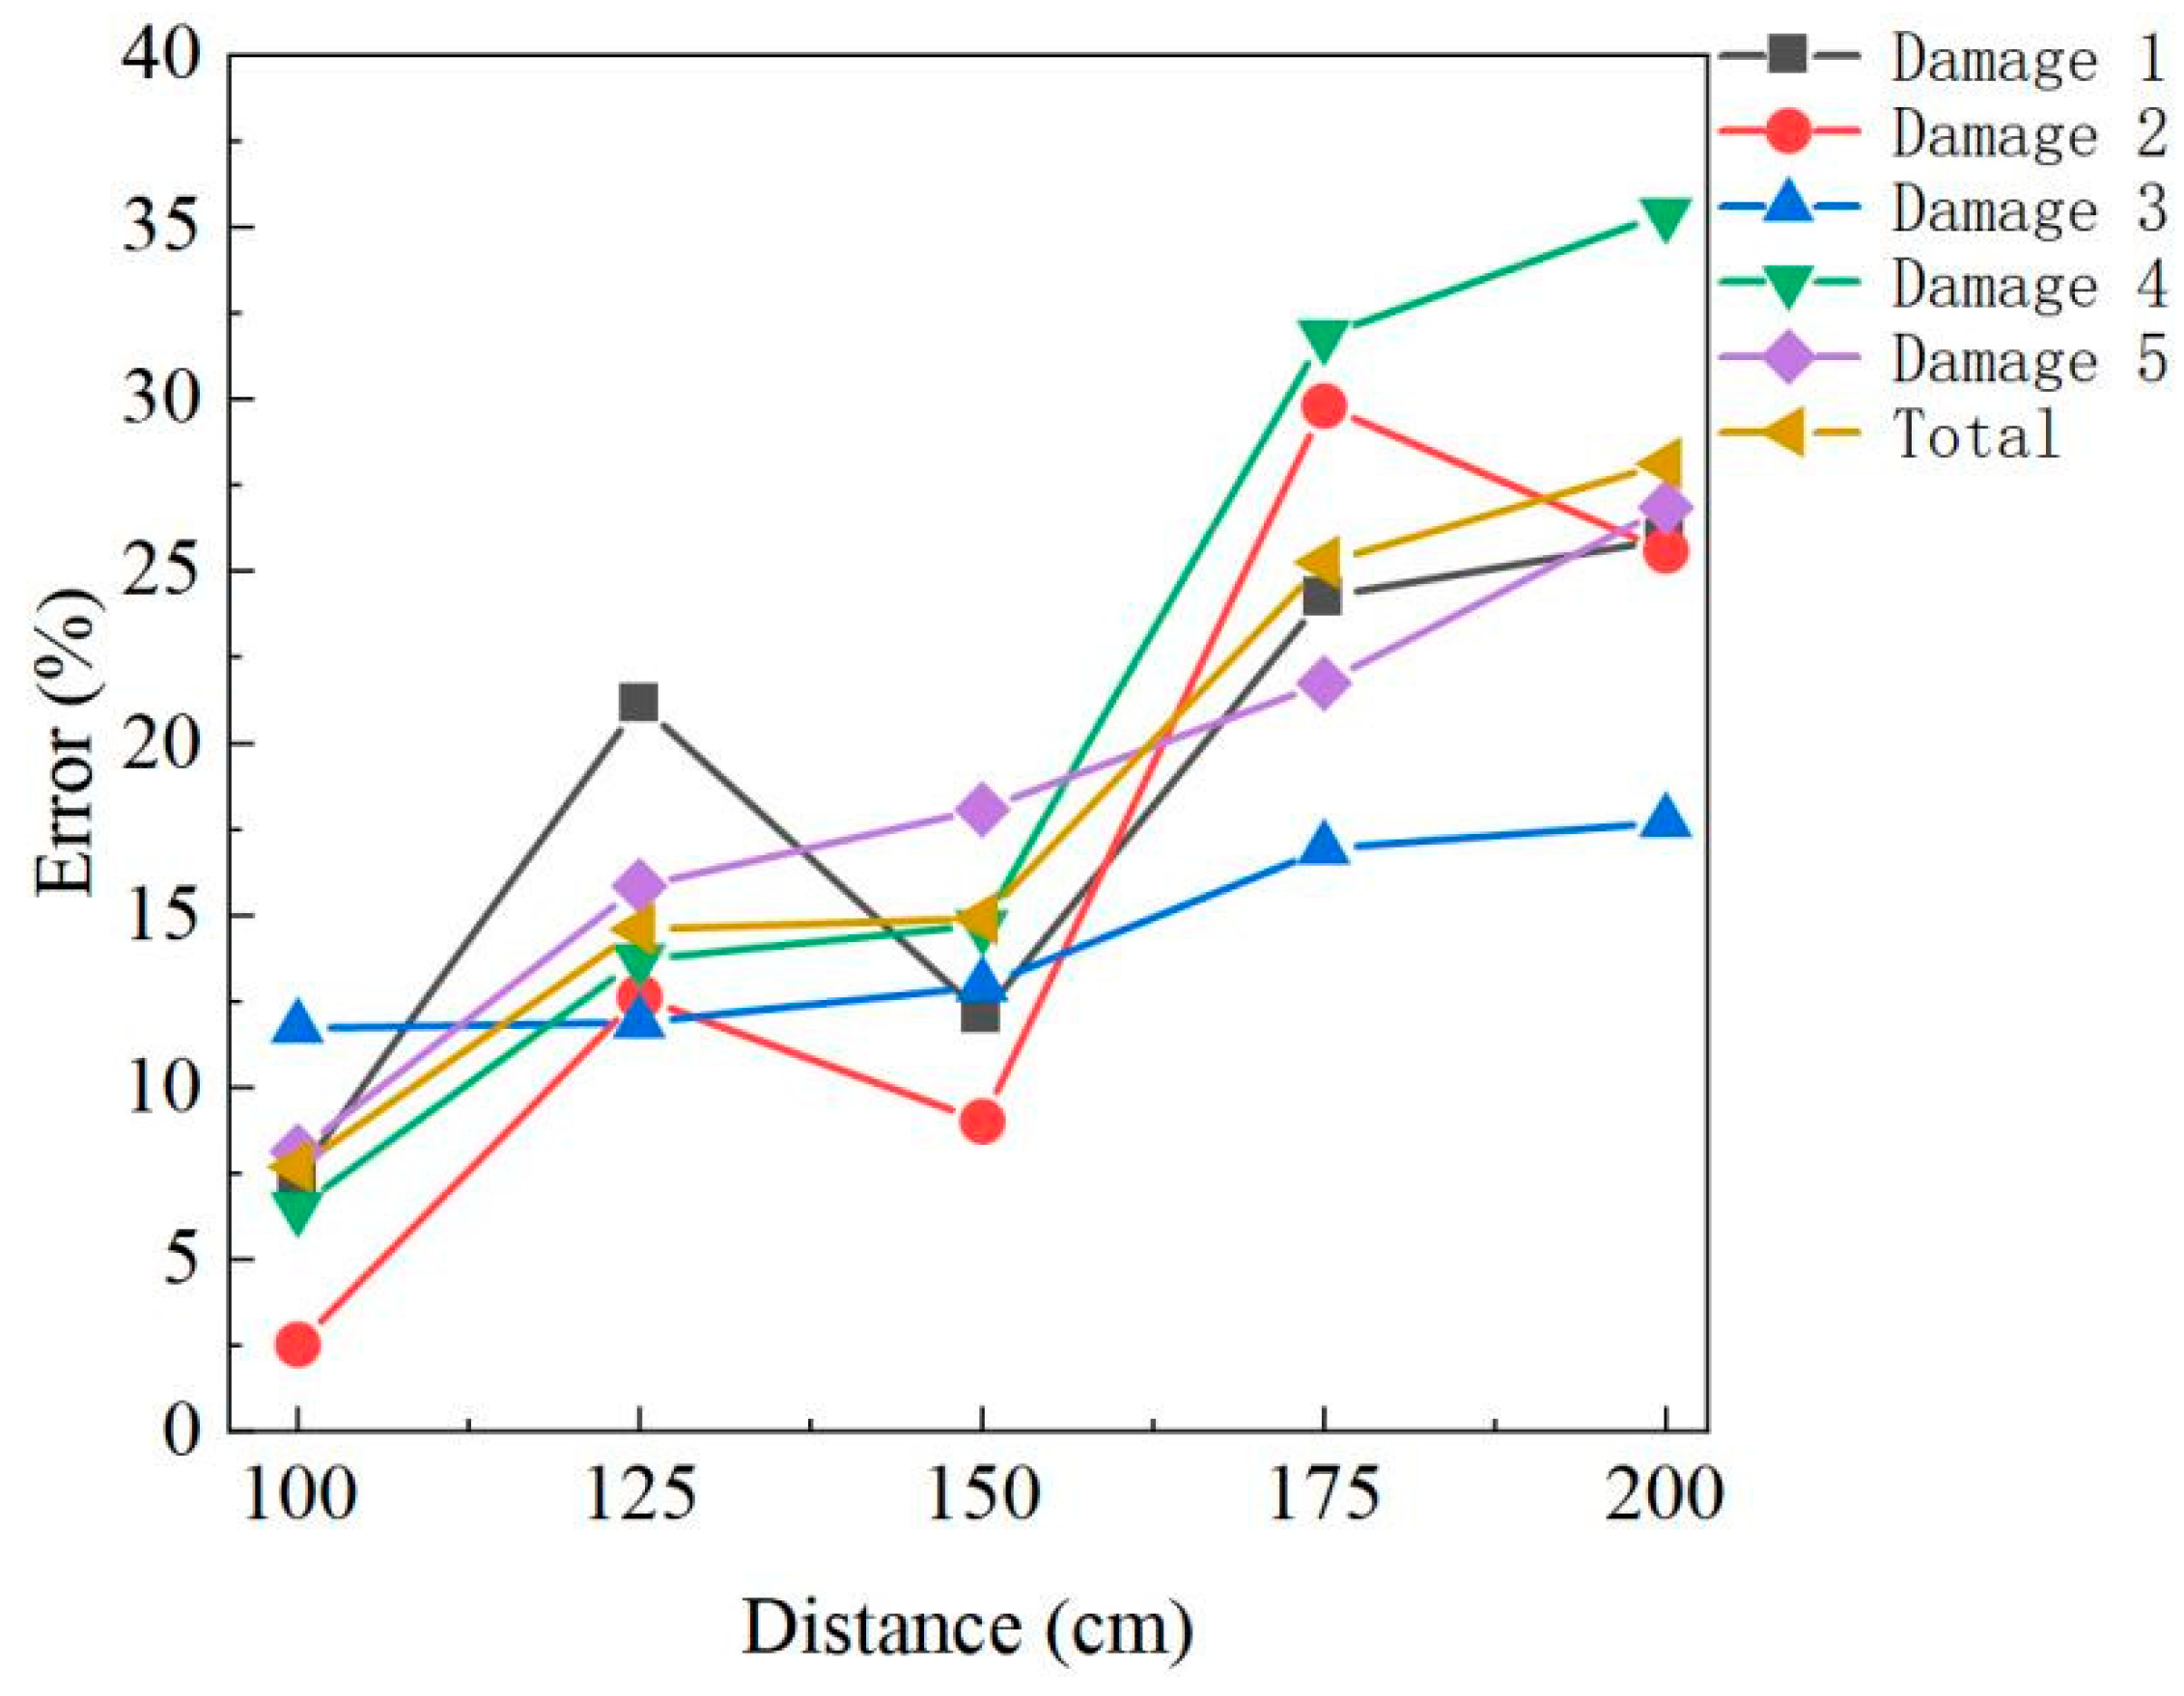
4.2. Performance of Concrete Slab
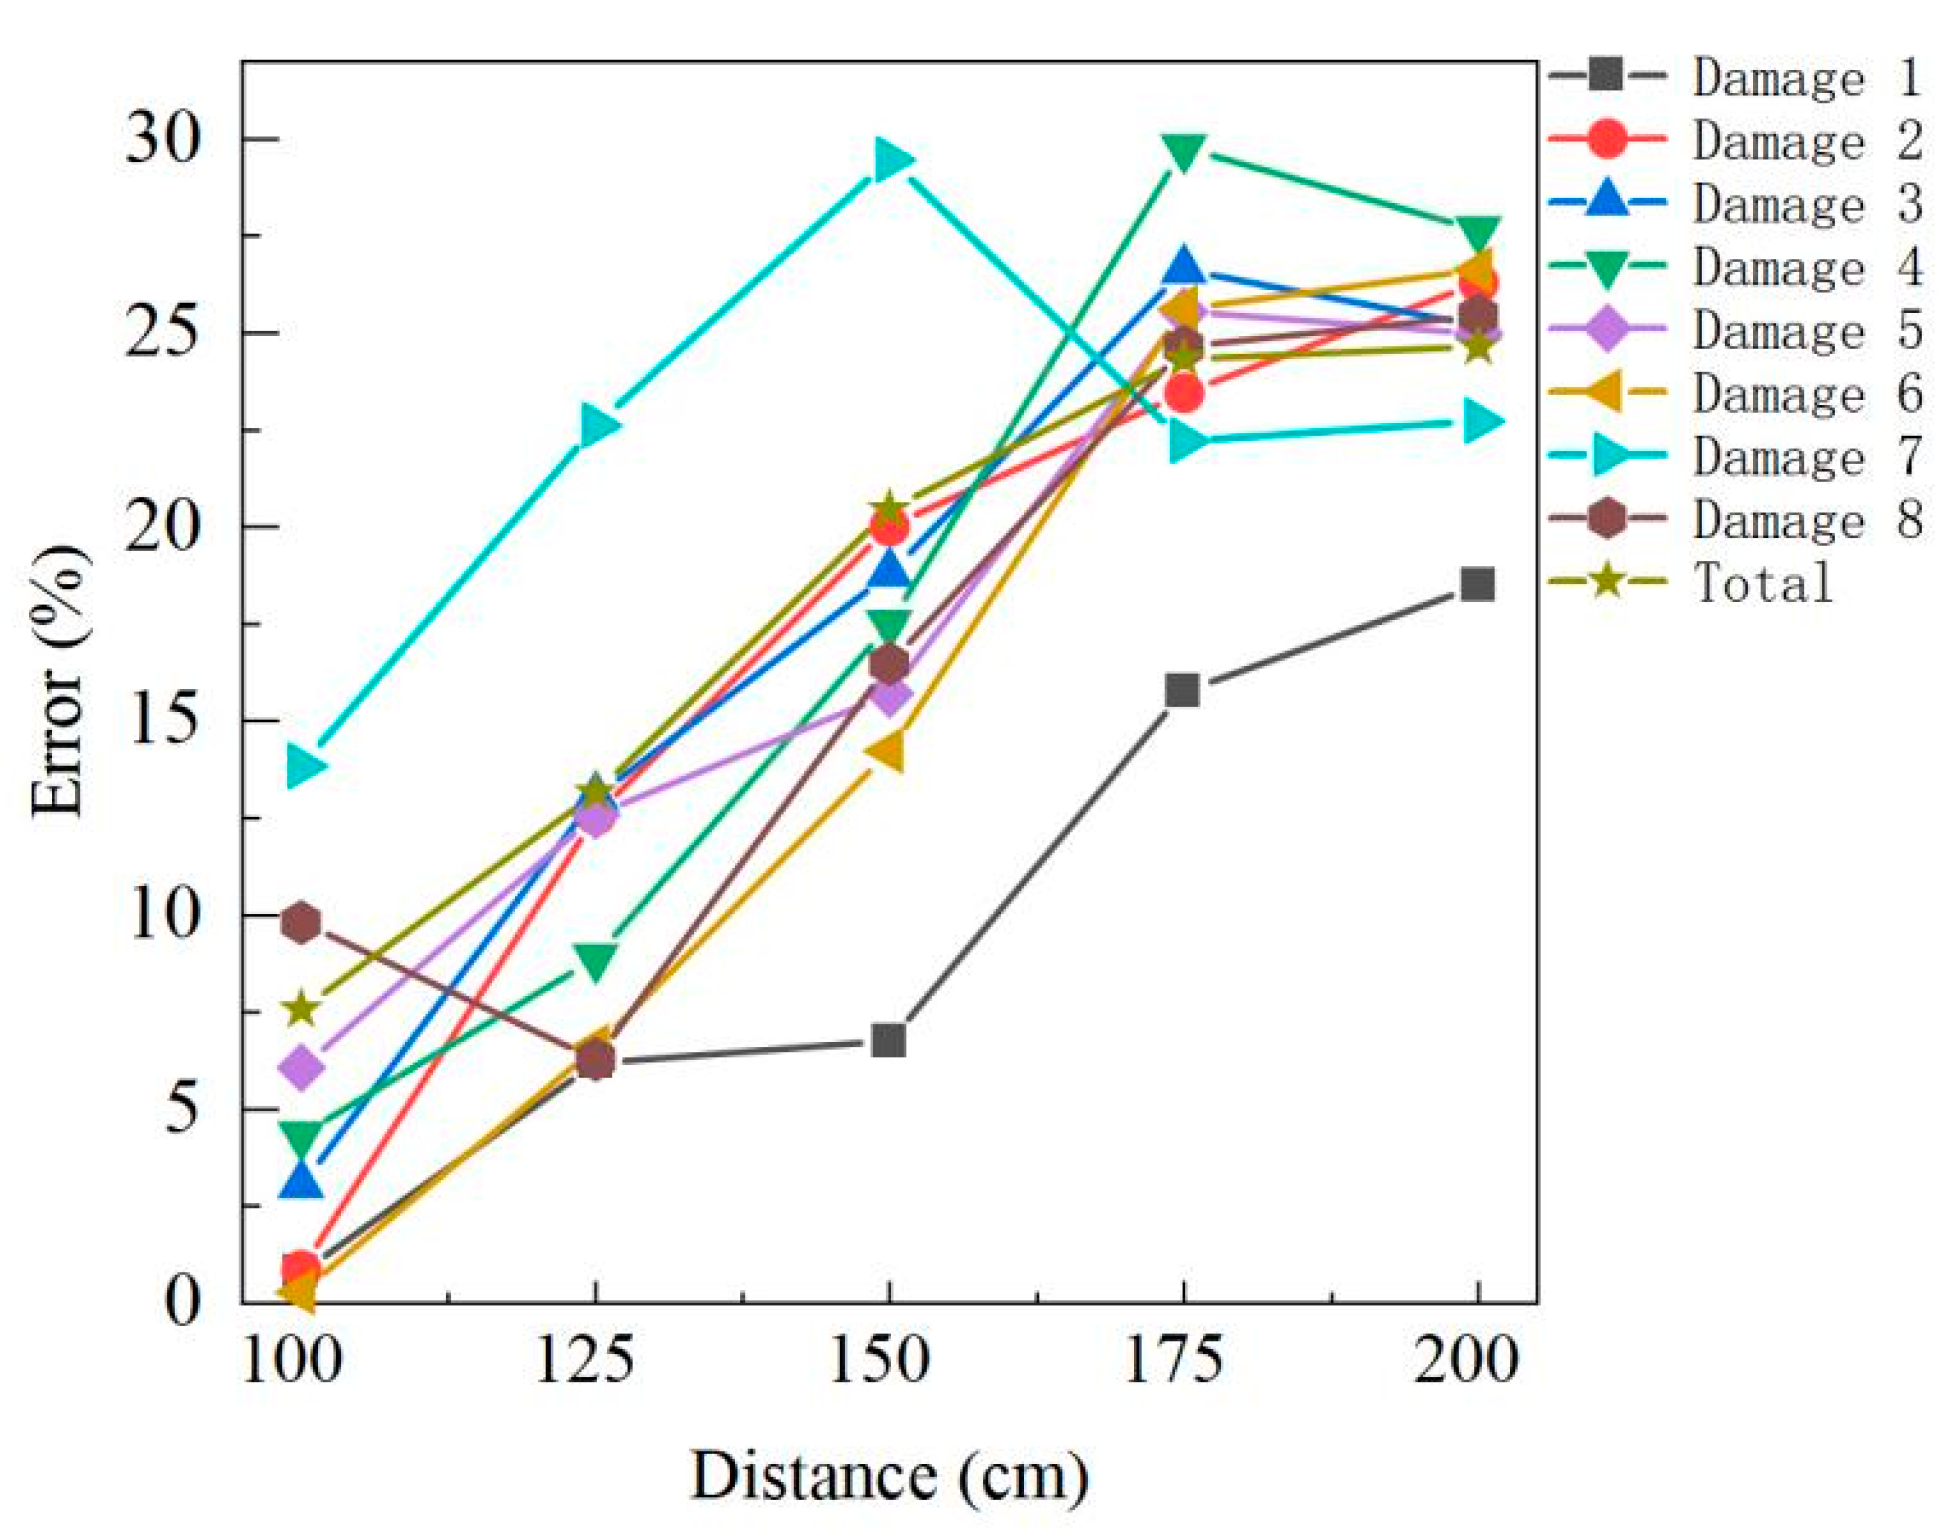
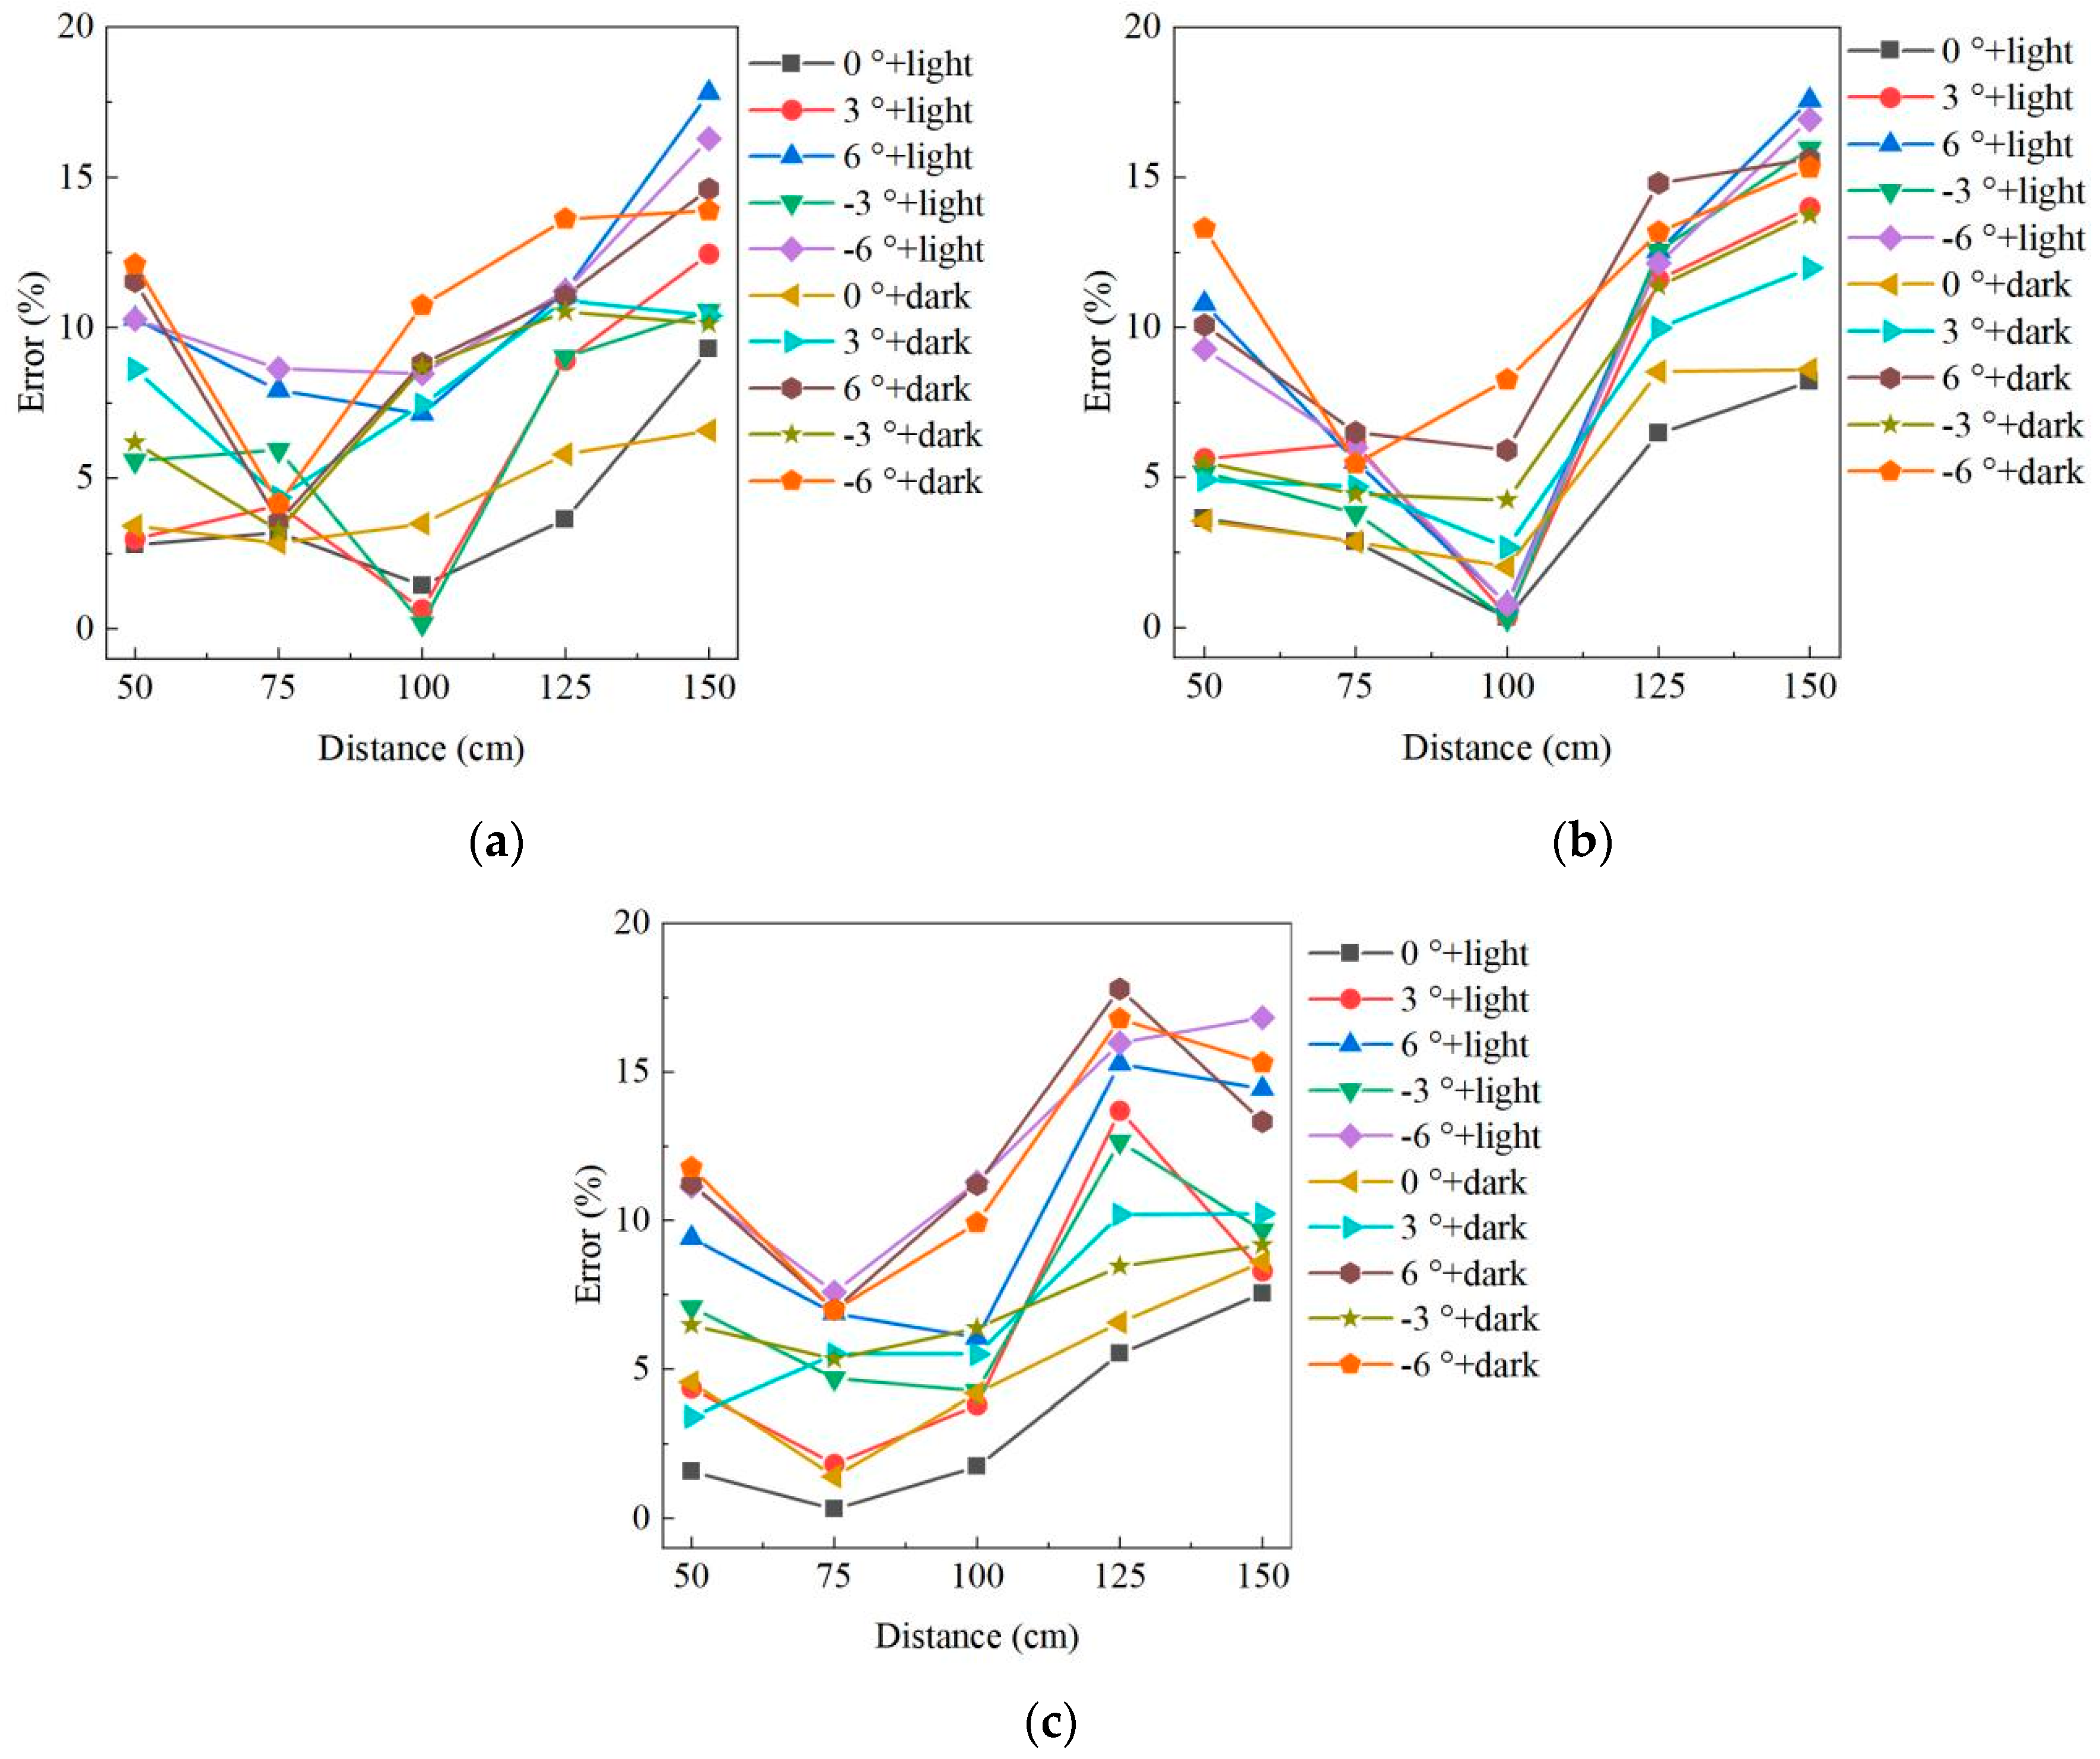
4.3. Performance of Outside the Concrete Pipe
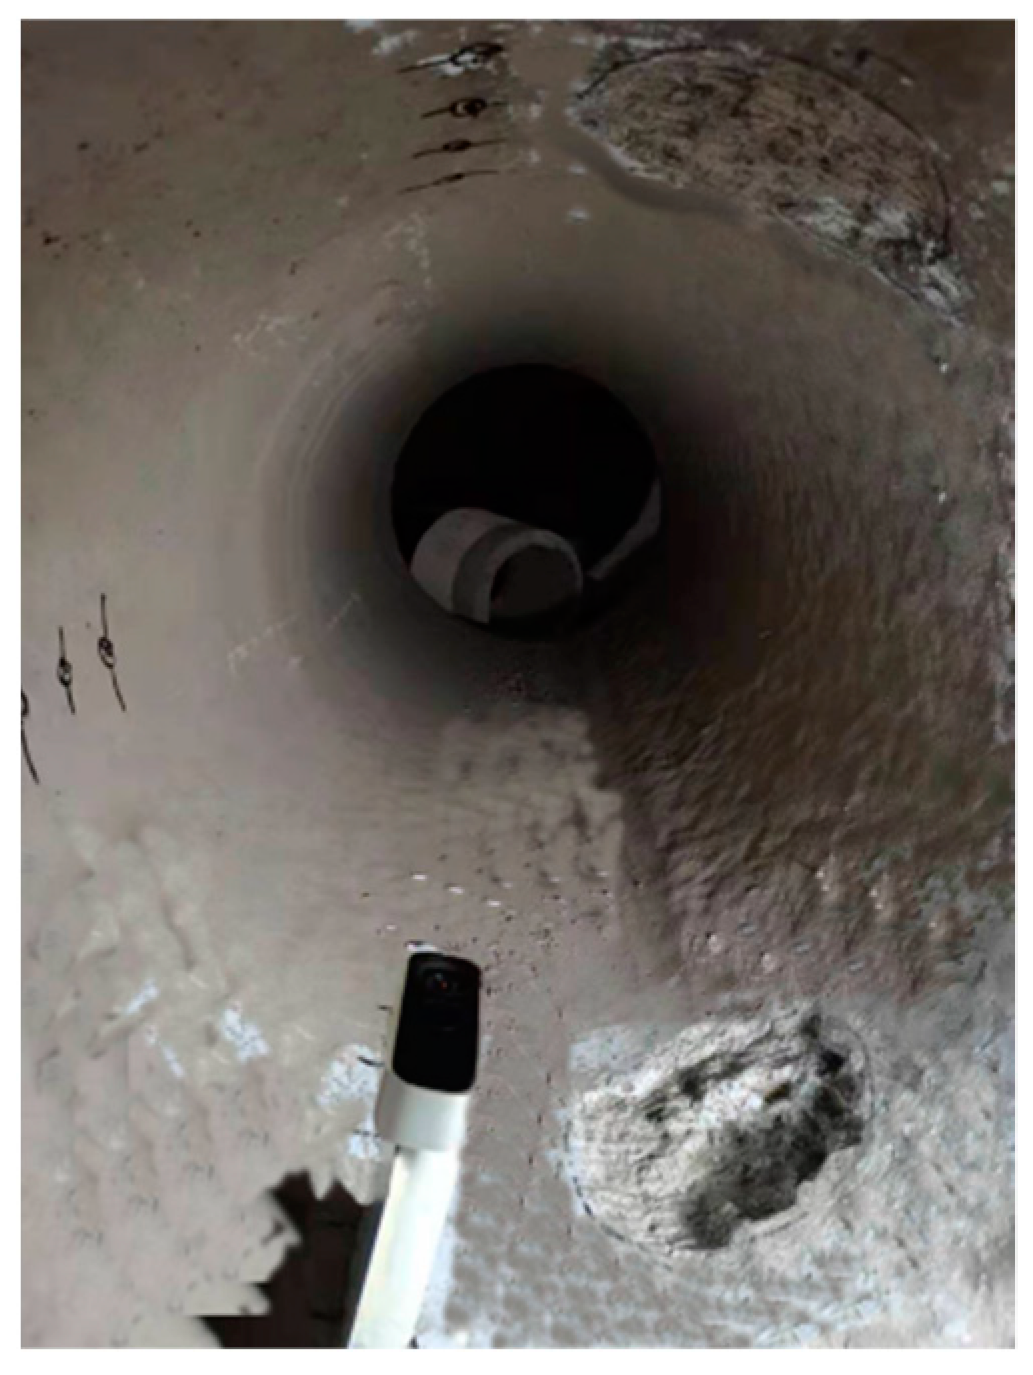
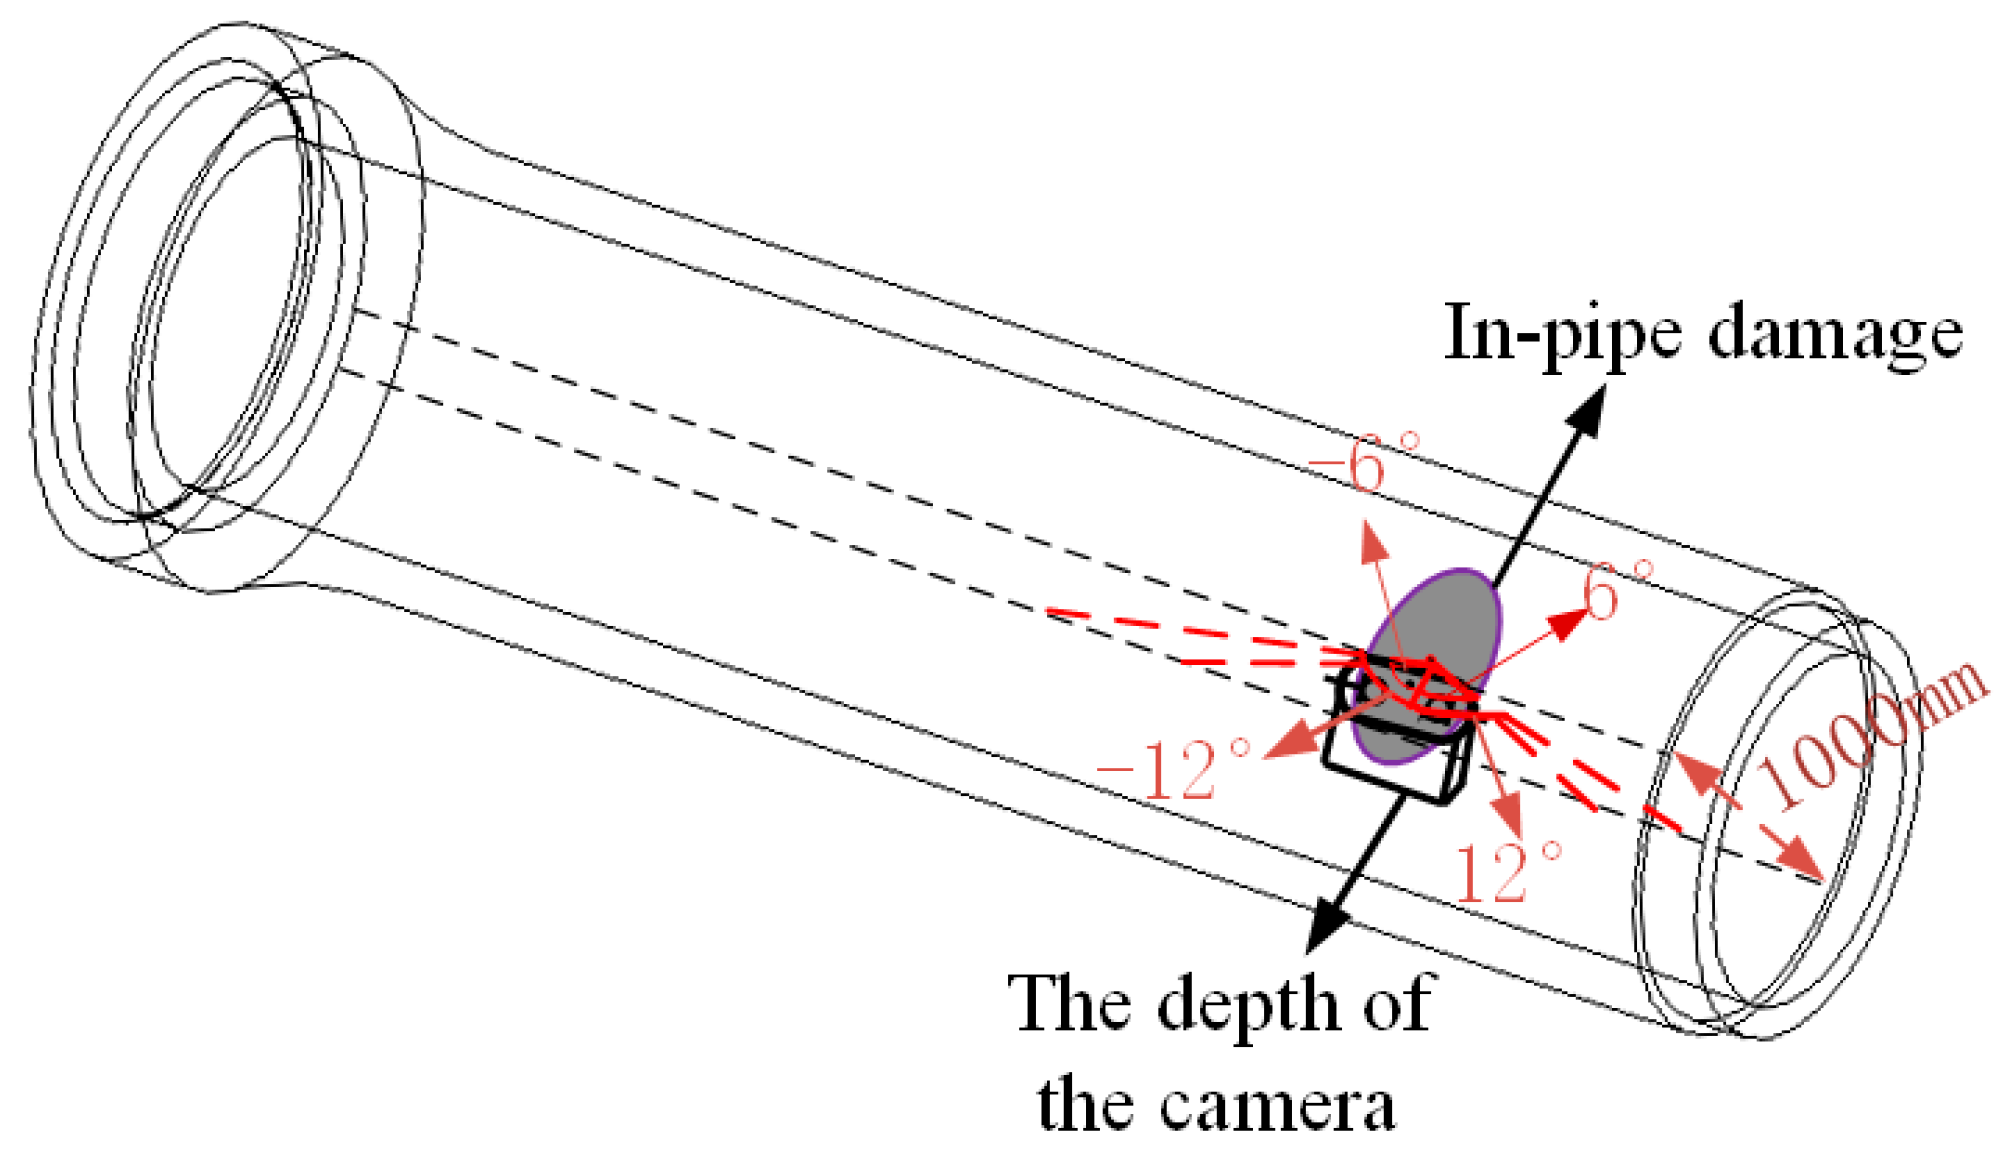
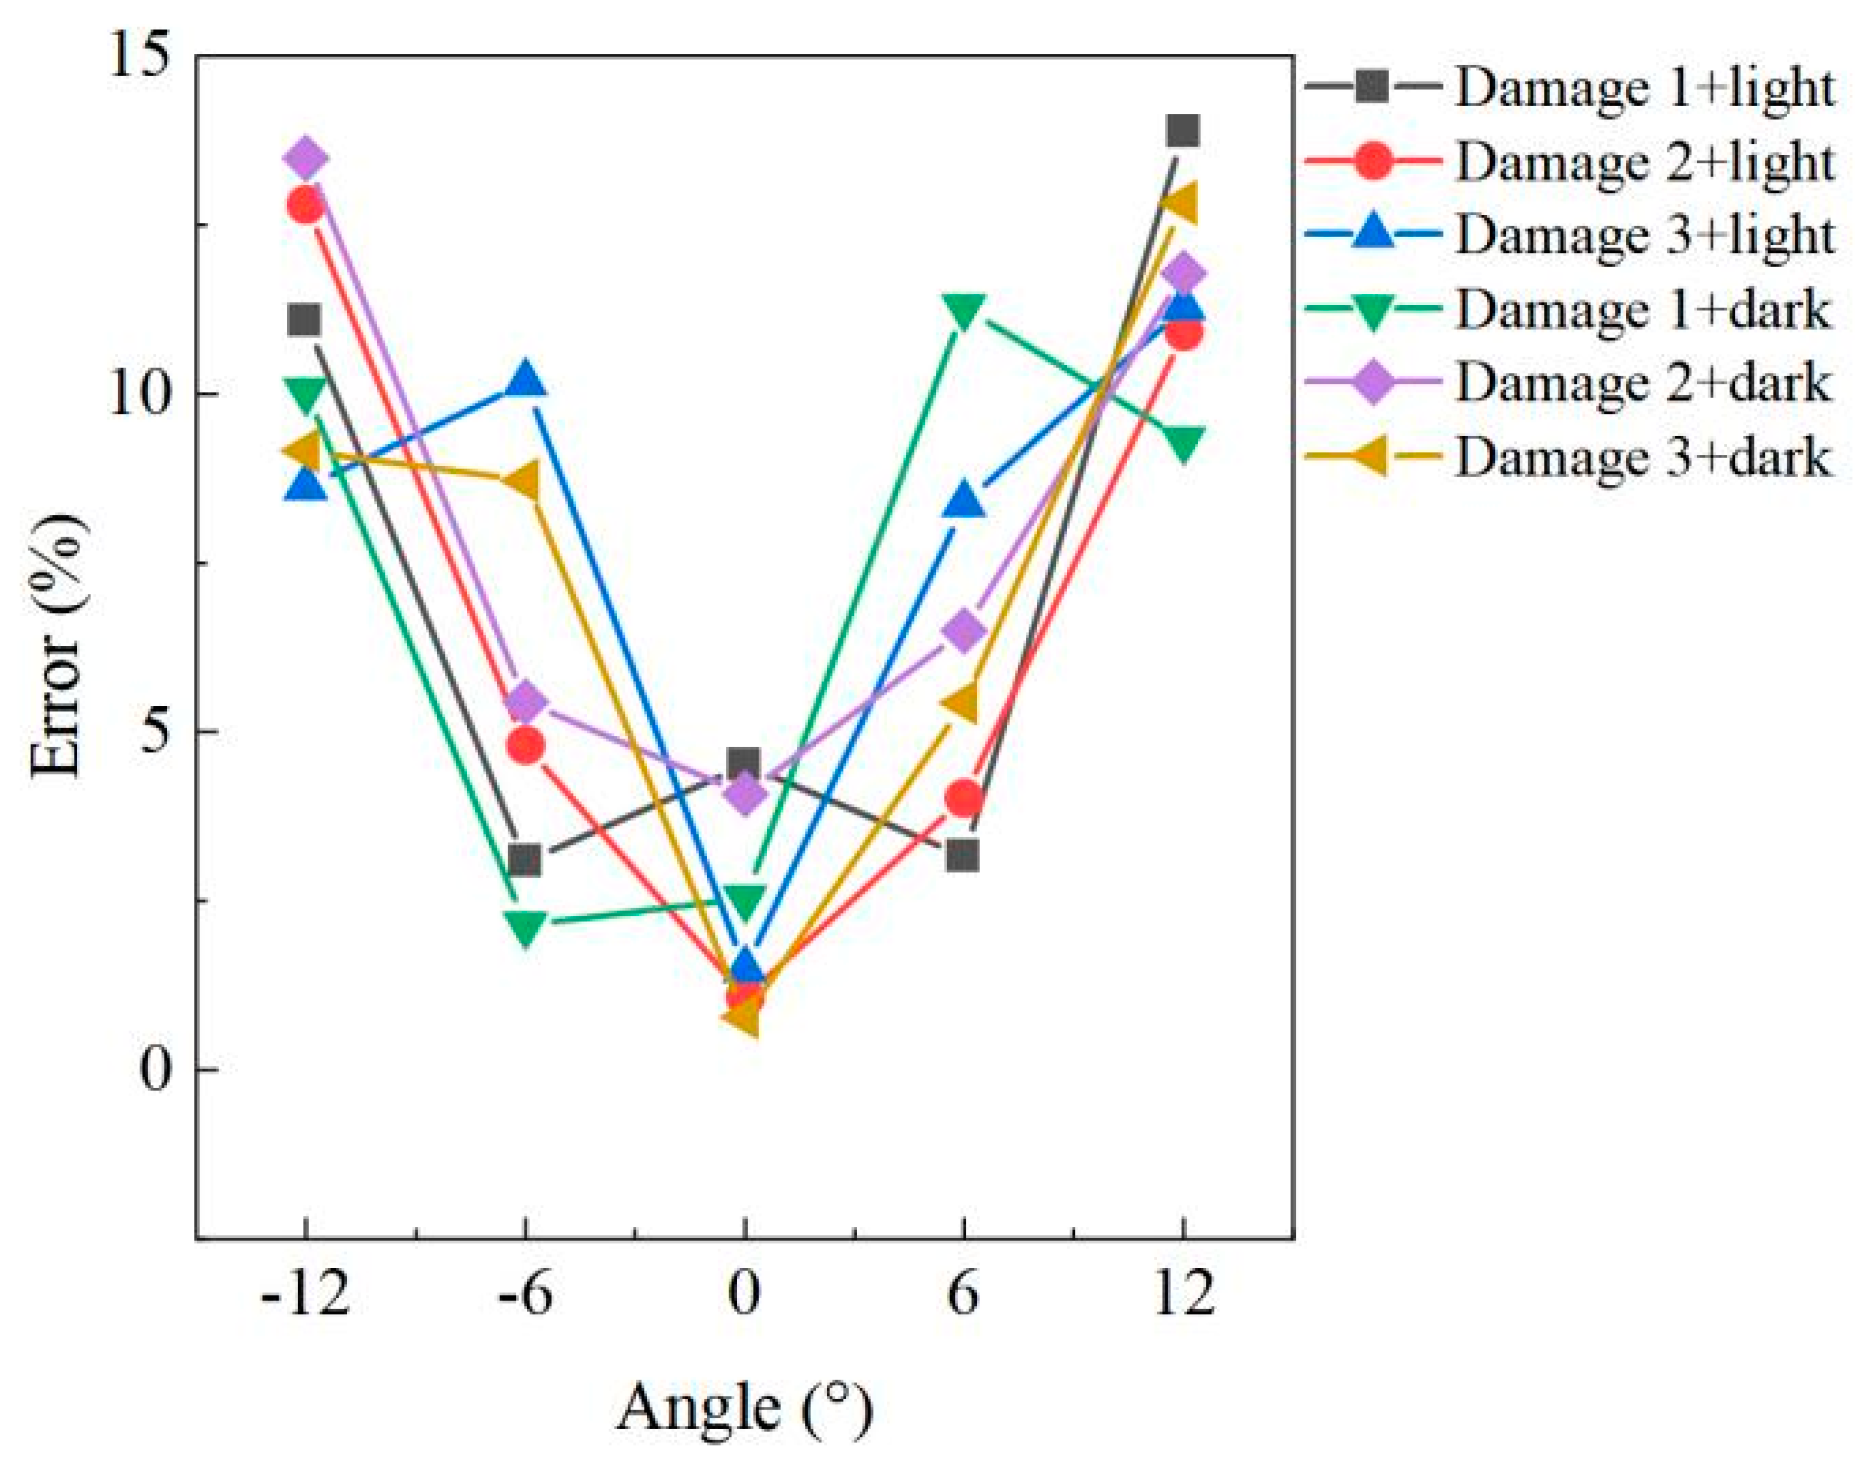
4.4. Internal Performance of Concrete Pipes
5. Discussion
6. Conclusions
Author Contributions
Funding
Institutional Review Board Statement
Informed Consent Statement
Data Availability Statement
Acknowledgments
Conflicts of Interest
References
- Meeker, E. The improving health of the United States, 1850–1915. Explor. Econ. Hist. 1971, 9, 353–373. [Google Scholar] [CrossRef]
- Xu, M.; Shen, D.; Rakitin, B. The longitudinal response of buried large-diameter reinforced concrete pipeline with gasketed bell-and-spigot joints subjected to traffic loading. Tunn. Undergr. Space Technol. 2017, 64, 117–132. [Google Scholar] [CrossRef]
- Sinha, S.K.; Knight, M.A. Intelligent system for condition monitoring of underground pipelines. Comput.-Aided Civ. Infrastruct. Eng. 2004, 19, 42–53. [Google Scholar] [CrossRef]
- Cheng, J.C.P.; Wang, M. Automated detection of sewer pipe defects in closed-circuit television images using deep learning techniques. Autom. Constr. 2018, 95, 155–171. [Google Scholar] [CrossRef]
- Duran, O.; Althoefer, K.; Seneviratne, L.D. State of the art in sensor technologies for sewer inspection. IEEE Sens. J. 2002, 2, 73–81. [Google Scholar] [CrossRef]
- Jun, Z. The Detection, Evaluation, and Repair Technology Application of Drainage Pipeline. In Proceedings of the International Conference on Pipelines and Trenchless Technology, Wuhan, China, 19–22 October 2012. [Google Scholar]
- Ékes, C.; Neducza, B.; Takacs, P. Pipe Penetrating Radar inspection of large diameter underground pipes. In Proceedings of the 15th International Conference on Ground Penetrating Radar, Brussels, Belgium, 30 June–4 July 2014. [Google Scholar]
- Snavely, N. Scene reconstruction and visualization from internet photo collections: A survey. IPSJ Trans. Comput. Vis. Appl. 2011, 3, 44–66. [Google Scholar] [CrossRef] [Green Version]
- Mahami, H.; Nasirzadeh, F.; Ahmadabadian, A.H.; Nahavandi, S. Automated progress controlling and monitoring using daily site images and building information modelling. Buildings 2019, 9, 70. [Google Scholar] [CrossRef] [Green Version]
- Golparvar-Fard, M.; Thomas, J.; Peña-Mora, F.; Savarese, S. Remote assessment of pre-and post-disaster critical physical infrastructures using mobile workstation chariot and D4AR models. In Proceedings of the International Conference on Computing in Civil and Building Engineering, Nottingham, UK, 30 June 2010; pp. 63–69. [Google Scholar]
- Torok, M.M.; Golparvar-Fard, M.; Kochersberger, K.B. Image-based automated 3D crack detection for post-disaster building assessment. J. Comput. Civ. Eng. 2014, 28, A4014004. [Google Scholar] [CrossRef]
- Nowak, R.; Orłowicz, R.; Rutkowski, R. Use of TLS (LiDAR) for building diagnostics with the example of a historic building in Karlino. Buildings 2020, 10, 24. [Google Scholar] [CrossRef] [Green Version]
- Youn, H.C.; Yoon, J.S.; Ryoo, S.L. HBIM for the Characteristics of Korean Traditional Wooden Architecture: Bracket Set Modelling Based on 3D Scanning. Buildings 2021, 11, 506. [Google Scholar] [CrossRef]
- Zeibak-Shini, R.; Sacks, R.; Ma, L.; Filin, S. Towards generation of as-damaged BIM models using laser-scanning and as-built BIM: First estimate of as-damaged locations of reinforced concrete frame members in masonry infill structures. Adv. Eng. Inform. 2016, 30, 312–326. [Google Scholar] [CrossRef]
- Wang, M.; Wang, C.C.; Zlatanova, S.; Sepasgozar, S.; Aleksandrov, M. Onsite Quality Check for Installation of Prefabricated Wall Panels Using Laser Scanning. Buildings 2021, 11, 412. [Google Scholar] [CrossRef]
- Turkan, Y.; Hong, J.; Laflamme, S.; Puri, N. Adaptive wavelet neural network for terrestrial laser scanner-based crack detection. Autom. Constr. 2018, 94, 191–202. [Google Scholar] [CrossRef] [Green Version]
- Liu, C.; Shirowzhan, S.; Sepasgozar, S.M.E.; Kaboli, A. Evaluation of classical operators and fuzzy logic algorithms for edge detection of panels at exterior cladding of buildings. Buildings 2019, 9, 40. [Google Scholar] [CrossRef] [Green Version]
- Kamal, K.; Mathavan, S.; Zafar, T.; Moazzam, I.; Ali, A.; Ahmad, S.U.; Rahman, M. Performance assessment of Kinect as a sensor for pothole imaging and metrology. Int. J. Pavement Eng. 2018, 19, 565–576. [Google Scholar] [CrossRef]
- Besl, P.J.; Jain, R.C. Segmentation through variable-order surface fitting. IEEE Trans. Pattern Anal. Mach. Intell. 1988, 10, 167–192. [Google Scholar] [CrossRef] [Green Version]
- Tóvári, D.; Pfeifer, N. Segmentation based robust interpolation-a new approach to laser data filtering. Int. Arch. Photogramm. Remote Sens. Spat. Inf. Sci. 2005, 36, 79–84. [Google Scholar]
- Biosca, J.M.; Lerma, J.L. Unsupervised robust planar segmentation of terrestrial laser scanner point clouds based on fuzzy clustering methods. ISPRS J. Photogramm. Remote Sens. 2008, 63, 84–98. [Google Scholar] [CrossRef]
- Ballard, D.H. Generalizing the Hough transform to detect arbitrary shapes. Pattern Recognit. 1981, 13, 111–122. [Google Scholar] [CrossRef] [Green Version]
- Fischler, M.A.; Bolles, R.C. Random sample consensus: A paradigm for model fitting with applications to image analysis and automated cartography. Commun. ACM 1981, 24, 381–395. [Google Scholar] [CrossRef]
- Rabbani, T.; Van Den Heuvel, F. Efficient hough transform for automatic detection of cylinders in point clouds. In Proceedings of the ISPRS WG III/3, III/4, V/3 Workshop “Laser scanning 2005”, Enschede, The Netherlands, 12–14 September 2005; pp. 60–65. [Google Scholar]
- Vo, A.V.; Truong-Hong, L.; Laefer, D.F.; Bertolotto, M. Octree-based region growing for point cloud segmentation. ISPRS J. Photogramm. Remote Sens. 2015, 104, 88–100. [Google Scholar] [CrossRef]
- Chen, D.; Zhang, L.; Mathiopoulos, P.T.; Huang, X. A methodology for automated segmentation and reconstruction of urban 3-D buildings from ALS point clouds. IEEE J. Sel. Top. Appl. Earth Obs. Remote Sens. 2014, 7, 4199–4217. [Google Scholar] [CrossRef]
- Lee, D.T.; Schachter, B.J. Two algorithms for constructing a Delaunay triangulation. Int. J. Comput. Inf. Sci. 1980, 9, 219–242. [Google Scholar] [CrossRef]
- Boissonnat, J.D.; Cazals, F. Smooth surface reconstruction via natural neighbour interpolation of distance functions. Comput. Geom. 2002, 22, 185–203. [Google Scholar] [CrossRef] [Green Version]
- Amenta, N.; Bern, M.; Kamvysselis, M. A new Voronoi-based surface reconstruction algorithm. In Proceedings of the 25th Annual Conference on Computer Graphics and Interactive Techniques, Orlando, FL, USA, 19–24 July 1998; pp. 415–421. [Google Scholar]
- Bernardini, F.; Mittleman, J.; Rushmeier, H.; Silva, C.; Taubin, G. The ball-pivoting algorithm for surface reconstruction. IEEE Trans. Vis. Comput. Graph. 1999, 5, 349–359. [Google Scholar] [CrossRef]
- Rusu, R.B.; Cousins, S. 3d is here: Point cloud library (pcl). In Proceedings of the 2011 IEEE International Conference on Robotics and Automation, Shanghai, China, 9–13 May 2011; pp. 1–4. [Google Scholar]
- Rusu, R.B.; Marton, Z.C.; Blodow, N.; Dolha, M.; Beetz, M. Towards 3D point cloud based object maps for household environments. Robot. Auton. Syst. 2008, 56, 927–941. [Google Scholar] [CrossRef]
- Joubert, D.; Tyatyantsi, A.; Mphahlehle, J.; Manchidi, V. Pothole tagging system. In Proceedings of the 4th Robotics and Mechatronics Conference of South Africa (RobMech 2011), CSIR International Conference Centre, Pretoria, South Africa, 23–25 November 2011. [Google Scholar]


| Sensor Picture | The Technical Specification | Microsoft Azure Kinect DK |
|---|---|---|
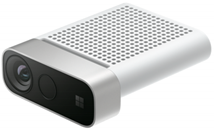 | RGB camera | 3840 × 2160 pixels |
| The depth of the camera | 1024 × 1024 pixels | |
| Maximum depth range | 5.46 m | |
| Minimum depth distance | 0.25 m | |
| Vertical field angle | 120° | |
| Horizontal field angle | 120° |
| Volume (cm3) | |||
|---|---|---|---|
| Damage of Materials | Real Volume | Calculated Value | Error (%) |
| Foam board | 1297.3 | 1199.2 | 7.56 |
| Concrete slab | 1014.7 | 936.76 | 7.68 |
| Outside the concrete pipe | 390.7 | 387.3 | 0.87 |
| Concrete pipe | 604.3 | 617.42 | 2.17 |
| Damage | 1 | 2 | 3 | 4 | 5 | 6 | 7 | 8 | Total | |
|---|---|---|---|---|---|---|---|---|---|---|
| Real volume (cm3) | 37.7 | 52.4 | 207.8 | 43.2 | 51.9 | 216.2 | 405.8 | 282.3 | 1297.3 | |
| Distance (cm) | ||||||||||
| 100 | test volume | 37.4 | 52.85 | 201.45 | 41.33 | 48.75 | 213.9 | 348.9 | 254.62 | 1199.2 |
| error (%) | 0.8 | 0.86 | 3.06 | 4.33 | 6.07 | 0.28 | 13.85 | 9.81 | 7.56 | |
| 125 | test volume | 35.36 | 45.81 | 180.68 | 39.35 | 45.37 | 201.92 | 313.37 | 264.53 | 1126.39 |
| error (%) | 6.21 | 12.58 | 13.05 | 8.91 | 12.58 | 6.6 | 22.62 | 6.29 | 13.17 | |
| 150 | test volume | 35.15 | 41.91 | 168.71 | 35.63 | 43.74 | 185.43 | 285.68 | 235.75 | 1032 |
| error (%) | 6.76 | 20.02 | 18.81 | 17.52 | 15.72 | 14.23 | 29.46 | 16.49 | 20.45 | |
| 175 | test volume | 31.75 | 40.11 | 152.49 | 30.34 | 38.64 | 160.75 | 314.95 | 212.73 | 981.76 |
| error (%) | 15.78 | 23.45 | 26.62 | 29.77 | 25.55 | 25.65 | 22.23 | 24.64 | 24.33 | |
| 200 | test volume | 30.73 | 38.62 | 155.43 | 31.25 | 38.92 | 158.63 | 313.54 | 210.43 | 977.55 |
| error (%) | 18.49 | 26.3 | 25.2 | 27.66 | 25.01 | 26.63 | 22.74 | 25.46 | 24.65 | |
| Damage | 1 | 2 | 3 | 4 | 5 | Total | |
|---|---|---|---|---|---|---|---|
| Real volume (cm3) | 74.85 | 80.3 | 166.85 | 350.2 | 342.5 | 1014.7 | |
| distance (cm) | |||||||
| 100 | test volume | 69.3 | 78.27 | 147.27 | 327.35 | 314.57 | 936.76 |
| error (%) | 7.41 | 2.53 | 11.74 | 6.52 | 8.15 | 7.68 | |
| 125 | test volume | 59.01 | 70.17 | 147.05 | 302.15 | 288.16 | 866.54 |
| error (%) | 21.16 | 12.62 | 11.87 | 13.72 | 15.87 | 14.60 | |
| 150 | test volume | 65.77 | 73.07 | 145.27 | 298.7 | 280.56 | 863.37 |
| error (%) | 12.13 | 9 | 12.93 | 14.71 | 18.08 | 14.91 | |
| 175 | test volume | 56.71 | 56.36 | 138.61 | 238.65 | 267.97 | 758.3 |
| error (%) | 24.24 | 29.81 | 16.93 | 31.85 | 21.76 | 25.27 | |
| 200 | test volume | 55.43 | 59.75 | 137.31 | 226.28 | 250.47 | 729.24 |
| error (%) | 25.95 | 25.59 | 17.7 | 35.39 | 26.87 | 28.13 | |
| Damage | 1 | 2 | 3 | Total | ||||||||||||||
|---|---|---|---|---|---|---|---|---|---|---|---|---|---|---|---|---|---|---|
| Real volume (cm3) | 50.1 | 126.1 | 214.5 | 1953.5 | ||||||||||||||
| Distance (cm) | Angle | |||||||||||||||||
| 0° | 3° | 6° | −3° | −6° | 0° | 3° | 6° | −3° | −6° | 0° | 3° | 6° | −3° | −6° | ||||
| 50 | light | test volume | 48.7 | 48.61 | 44.94 | 47.3 | 55.25 | 121.52 | 119.0 | 112.5 | 119.58 | 114.40 | 217.88 | 205.17 | 194.32 | 199.32 | 190.6 | 1839.09 |
| error (%) | 2.79 | 2.97 | 10.3 | 5.59 | 10.28 | 3.63 | 5.63 | 10.79 | 5.17 | 9.28 | 1.58 | 4.35 | 9.41 | 7.08 | 11.14 | 5.86 | ||
| dark | test volume | 48.39 | 45.78 | 44.32 | 47.0 | 56.16 | 130.59 | 119.90 | 113.39 | 119.15 | 109.34 | 204.72 | 207.19 | 190.41 | 200.60 | 239.75 | 1876.69 | |
| error (%) | 3.41 | 8.62 | 11.54 | 6.19 | 12.1 | 3.56 | 4.92 | 10.08 | 5.51 | 13.29 | 4.56 | 3.41 | 11.23 | 6.48 | 11.77 | 3.93 | ||
| 75 | light | test volume | 46.58 | 45.58 | 58.80 | 43.57 | 59.6 | 129.71 | 118.37 | 119.13 | 121.31 | 118.55 | 215.14 | 218.43 | 199.75 | 204.41 | 198.22 | 1897.15 |
| error (%) | 3.20 | 4.11 | 7.92 | 5.94 | 8.64 | 2.86 | 6.13 | 5.53 | 3.80 | 5.99 | 0.30 | 1.83 | 6.88 | 4.70 | 7.59 | 2.88 | ||
| dark | test volume | 48.67 | 47.91 | 51.89 | 48.47 | 48.01 | 122.5 | 132.03 | 117.9 | 120.50 | 133 | 217.5 | 202.70 | 199.48 | 203.05 | 199.52 | 1893.13 | |
| error (%) | 2.85 | 4.37 | 3.57 | 3.25 | 4.17 | 2.85 | 4.70 | 6.50 | 4.44 | 5.47 | 1.40 | 5.50 | 7.00 | 5.34 | 6.98 | 3.09 | ||
| 100 | light | test volume | 50.82 | 49.78 | 53.68 | 50.19 | 54.35 | 125.7 | 126.57 | 127.1 | 126.48 | 127.06 | 210.78 | 206.37 | 201.53 | 205.34 | 190.28 | 1906.03 |
| error (%) | 1.44 | 0.64 | 7.15 | 0.18 | 8.48 | 0.32 | 0.37 | 0.79 | 0.30 | 0.76 | 1.73 | 3.8 | 6.05 | 4.27 | 11.29 | 2.43 | ||
| dark | test volume | 51.85 | 46.37 | 45.68 | 54.46 | 55.48 | 123.54 | 122.73 | 118.65 | 120.73 | 115.68 | 205.49 | 202.7 | 190.47 | 200.82 | 193.25 | 1847.9 | |
| error (%) | 3.49 | 7.45 | 8.82 | 8.7 | 10.74 | 2.03 | 2.67 | 5.91 | 4.25 | 8.26 | 4.2 | 5.5 | 11.2 | 6.38 | 9.91 | 5.41 | ||
| 125 | light | test volume | 48.28 | 45.63 | 55.72 | 54.63 | 55.72 | 117.96 | 111.48 | 110.28 | 110.27 | 110.79 | 202.68 | 185.11 | 181.75 | 187.34 | 180.23 | 1757.87 |
| error (%) | 3.63 | 8.92 | 11.22 | 9.04 | 11.22 | 6.46 | 11.59 | 12.54 | 12.55 | 12.14 | 5.51 | 13.70 | 15.27 | 12.66 | 15.98 | 10.01 | ||
| dark | test volume | 53.0 | 44.63 | 44.56 | 55.38 | 43.28 | 115.36 | 113.52 | 107.43 | 111.74 | 109.48 | 200.43 | 192.64 | 176.33 | 196.38 | 250.49 | 1814.65 | |
| error (%) | 5.79 | 10.92 | 11.06 | 10.54 | 13.61 | 8.52 | 9.98 | 14.81 | 11.39 | 13.18 | 6.56 | 10.19 | 17.79 | 8.45 | 16.78 | 7.11 | ||
| 150 | light | test volume | 54.75 | 56.34 | 41.17 | 44.80 | 58.26 | 115.76 | 108.44 | 104.95 | 105.96 | 147.45 | 198.32 | 196.72 | 183.55 | 193.75 | 178.43 | 1788.65 |
| error (%) | 9.28 | 12.46 | 17.82 | 10.57 | 16.29 | 8.2 | 14 | 17.57 | 15.97 | 16.93 | 7.54 | 8.29 | 14.43 | 9.67 | 16.82 | 8.44 | ||
| dark | test volume | 53.4 | 44.89 | 57.42 | 45.02 | 43.14 | 115.27 | 110.99 | 145.79 | 108.78 | 106.79 | 196.04 | 192.57 | 185.90 | 194.84 | 181.69 | 1782.53 | |
| error (%) | 6.59 | 10.4 | 14.61 | 10.14 | 13.89 | 8.59 | 11.98 | 15.61 | 13.74 | 15.31 | 8.6 | 10.22 | 13.33 | 9.17 | 15.30 | 8.75 | ||
| 175 | light | test volume | 42.86 | 57.68 | 41.29 | 42.34 | 40.34 | 114 | 108.43 | 102.63 | 105.72 | 101.41 | 194.75 | 185.65 | 171.91 | 187.31 | 175.63 | 1671.95 |
| error (%) | 14.45 | 15.12 | 17.58 | 15.49 | 19.48 | 9.60 | 14.01 | 18.61 | 16.16 | 19.58 | 9.21 | 13.45 | 19.86 | 12.68 | 18.12 | 14.41 | ||
| dark | test volume | 44.23 | 43.39 | 42.06 | 43.75 | 40.69 | 114.85 | 109.27 | 105.44 | 106.39 | 104.31 | 195.05 | 188.37 | 178.62 | 190.56 | 178.35 | 1685.33 | |
| error (%) | 11.72 | 13.45 | 16.05 | 12.67 | 18.78 | 8.92 | 13.35 | 16.38 | 15.63 | 17.28 | 9.07 | 12.18 | 16.73 | 11.16 | 16.85 | 13.73 | ||
| Damage | 1 | 2 | 3 | Total | ||||||||||||||
|---|---|---|---|---|---|---|---|---|---|---|---|---|---|---|---|---|---|---|
| Real volume (cm3) | 265 | 155.1 | 184.2 | 3021.5 | ||||||||||||||
| Distance (cm) | Angle | |||||||||||||||||
| 0° | 6° | 12° | −6° | −12° | 0° | 6° | 12° | −6° | −12° | 0° | 6° | 12° | −6° | −12° | ||||
| 50 | light | test volume | 276.95 | 273.41 | 228.2 | 256.83 | 235.65 | 153.43 | 148.85 | 145.15 | 130.64 | 106.25 | 186.94 | 199.63 | 163.43 | 165.47 | 168.33 | 2839.16 |
| error (%) | 4.51 | 3.17 | 13.89 | 3.08 | 11.08 | 1.08 | 4.03 | 10.93 | 4.81 | 12.80 | 1.49 | 8.38 | 11.28 | 10.17 | 8.62 | 6.03 | ||
| dark | test volume | 271.72 | 294.88 | 240.29 | 259.31 | 238.39 | 148.76 | 134.02 | 129.81 | 133.65 | 114.18 | 185.65 | 194.2 | 207.84 | 168.13 | 167.33 | 2888.16 | |
| error (%) | 2.54 | 11.28 | 9.32 | 2.15 | 10.04 | 4.09 | 6.50 | 11.79 | 5.45 | 13.49 | 0.79 | 5.43 | 12.83 | 8.72 | 9.16 | 4.41 | ||
Publisher’s Note: MDPI stays neutral with regard to jurisdictional claims in published maps and institutional affiliations. |
© 2022 by the authors. Licensee MDPI, Basel, Switzerland. This article is an open access article distributed under the terms and conditions of the Creative Commons Attribution (CC BY) license (https://creativecommons.org/licenses/by/4.0/).
Share and Cite
Pang, G.; Wang, N.; Fang, H.; Liu, H.; Huang, F. Study of Damage Quantification of Concrete Drainage Pipes Based on Point Cloud Segmentation and Reconstruction. Buildings 2022, 12, 213. https://doi.org/10.3390/buildings12020213
Pang G, Wang N, Fang H, Liu H, Huang F. Study of Damage Quantification of Concrete Drainage Pipes Based on Point Cloud Segmentation and Reconstruction. Buildings. 2022; 12(2):213. https://doi.org/10.3390/buildings12020213
Chicago/Turabian StylePang, Gaozhao, Niannian Wang, Hongyuan Fang, Hai Liu, and Fan Huang. 2022. "Study of Damage Quantification of Concrete Drainage Pipes Based on Point Cloud Segmentation and Reconstruction" Buildings 12, no. 2: 213. https://doi.org/10.3390/buildings12020213
APA StylePang, G., Wang, N., Fang, H., Liu, H., & Huang, F. (2022). Study of Damage Quantification of Concrete Drainage Pipes Based on Point Cloud Segmentation and Reconstruction. Buildings, 12(2), 213. https://doi.org/10.3390/buildings12020213