Abstract
By analyzing dynamic track geometric irregularity data of high-speed railway (HSR) with ballast track in China, there is a peak of [5, 11] m wavelength for the longitudinal level at the beam joint of simply supported girder bridges. The difference between the absolute value of track longitudinal level at the beam joint and that at the midspan is one to three mm. Under annual temperature cycle, the ballast at the beam joint loosens because of the bridge–track interaction, which results in the longitudinal level at the beam joint gets larger in winter and smaller in summer, that means the longitudinal level is negatively correlated with temperature, and at the same time, the development of the track longitudinal level and Track Quality Index (TQI) with the temperature are given. In addition, the vertical acceleration of axle box and bogie, and wheel–rail vertical force are larger when the train passes the beam joint than when it passes the midspan, which threatens running safety significantly. This article established a three-dimensional vehicle–track–bridge finite element model (FEM), thus the thresholds of track longitudinal level at the beam joint for simply supported girder bridge with ballast track in 250 km/h HSR were proposed, i.e., the maximum of dynamic track longitudinal level is 14 mm, and the maximum of static value is 11 mm. Once one of the two thresholds exceeds the corresponding limit, the train speed should be reduced to 160 km/h or below.
1. Introduction
High-speed railway (HSR) in China has been operating for more than one decade, and the infrastructure and track structure are enduring various diseases, such as track longitudinal level, affecting running safety and comfort. A ballastless track is often used in HSR around 350 km/h, while a ballast track is often used in HSR under 250 km/h. Various factors, such as temperature [1], ground settlement, shrinkage and creep of concrete, and train dynamic load, will cause track longitudinal level in bridges [2]. For simply supported girder bridges with continuous equal spans, bridge creep would also lead to continuous periodic track longitudinal level [3,4]. The vibration of high-speed trains caused by bridge pier settlement and bridge creep was analyzed [5]. Xu, Yang and Gou investigated the dynamic response of vehicle–track–bridge and variation characteristic of train running under the action of bridge creep [6,7,8] according to the vehicle–bridge coupling dynamic theory. Xia studied the influence of bridge creep and temperature effect of prestressed concrete beam on the dynamic response and running safety of the HSR vehicle–bridge system [9].
Periodic deformation of bridges will cause short-wavelength irregularity at the beam joint. The longitudinal level oscillogram usually present as a valley at the beam joint, while the peak at the midspan of the bridge [10], as shown in Figure 1a, 32 m span prestressed reinforced concrete simply supported box girders are widely used in high-speed railway line, for example, the main focus of this short review is to showcase how the fast HSR construction in China during the past decade was achieved by using typical simply supported bridges and continuous beam bridges [11]. Zhang established the HSR simply supported beam bridge and gave the seismic response analysis [12,13], Jiang [14] found that the subgrade part of high-speed railway simply supported beam bridge–track structure system has a critical rail length by evaluating the natural vibration characteristics under different interlayer stiffness and lengths of rails at different subgrade parts. Xia based this on the theoretical solution for vibrations of simply supported bridges under moving train loads, resonance and cancellation conditions are derived [15]. Moveover, the diagram of girder cross section is shown in Figure 1b. Scholars have conducted more research [16] on ballastless-track simply supported beam bridges, but less research on track irregularity of the 32-meter simply supported beam bridge of HSR with a ballast track. Especially, there is a lack of research on the variation of track irregularity and running safety at the simply supported beam joint with ballast track.
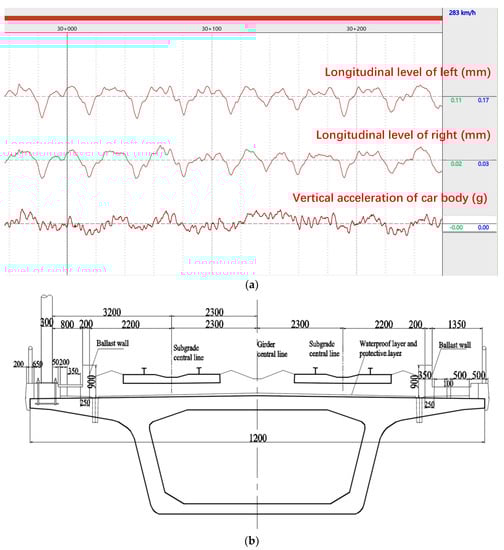
Figure 1.
Track geometric irregularity and cross-section arrangement of HSR with ballast track. (a) Wave of track geometric irregularity. (b) Diagram of cross−section arrangement.
In this paper, the variation regular of track longitudinal level at the beam joint for 32-meter simply supported girder bridge with ballast track, and its influence on vehicle dynamic response were analyzed, which is based on the dynamic track irregularity data from high-speed comprehensive inspection train in about ten years. Finally, based on the simulation results of the vehicle–track–bridge space coupling dynamic model and current situation of operation and maintenance for China railway high-speed [17], the management limit of the track longitudinal level at the beam joint was suggested. To ensure the running safety and ride comfort, the maintenance suggestions for simply supported girder bridges with ballast track were given [10], and the operation of the engineering department considered.
2. Analysis of Track State at the Beam Joint
2.1. Vehicle Model
The analysis of two-stage suspension train is carried out, and 35 independent degrees of freedom are considered, including lateral motion, vertical motion, roll motion, pitch motion and yaw motion, respectively, as shown in Table 1. The train dynamic analysis model is presented in Figure 2. The physical meaning of each variable in Figure 2 is shown in the manuscript [18]. The CRH380A is used as the dynamic simulation model. To improve calculation efficiency, 1 × Motor car-1 × Trail is selected.

Table 1.
Degree of freedom of vehicle model.
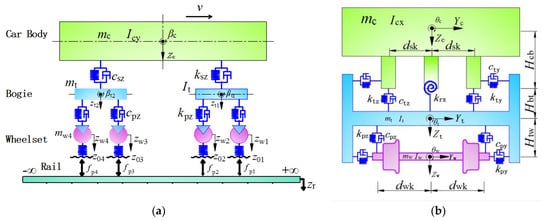
Figure 2.
Vehicle dynamic analysis model. (a) Side view of vehicle model. (b) Front view of vehicle model.
The accurate three-dimensional finite element model of vehicle–track–slab–bridge is established, as shown in Figure 3. The dynamic wheel–rail coupling relationship, the reasonable equations and solving methods are established. The inspection track geometric irregularity of continuous simply supported bridge section in the HSR line with ballast track in Section 3 is selected, then the dynamic simulation calculation is carried out to provide the premise for evaluating the running performance and structural service performance, though adjusting the amplitude of longitudinal level. Based on vehicle response and structure service response, the limit value of the longitudinal level at the beam joint for simply supported girder bridge with ballast track is proposed.
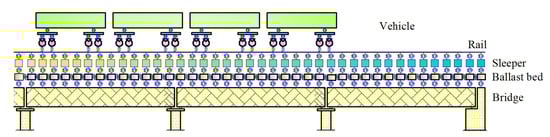
Figure 3.
Vehicle–track–bridge dynamic simulation model.
2.2. Coupled Equation and Numerical Solution Method for Vehicle-Track-Substructure
Vehicle, track and bridge constitute the dynamic simulation analysis system, which is coupled by wheel–rail force. The system vibration should obey the force equilibrium and deformation compatibility at any time. The motion equation of the system is as follows
where {x}, , and {P} represent the displacement, velocity, acceleration and load of the whole system, respectively. The array {x} and {P} are expressed as
where [M], [C], [K] are the mass matrix, damping matrix and stiffness matrix of the whole system, respectively. These parameters are expressed as
where xc, xr, xb represent the displacement vectors of each degree of freedom for vehicle, track and substructure, respectively. Pc, Pr, Pb represent the load vectors of each degree of freedom for vehicle, track and substructure, respectively. Mc, Mr, Mb represent the mass matrices of each degree of freedom for vehicle, track and substructure, individually. Kcc, Krr, Kbb represent the stiffness matrix of each degree of freedom for vehicle, track and substructure, respectively. The damping matrices are similar. Kcr represents the additional stiffness matrix of vehicle caused by wheel–rail contact. Kbr represent the additional stiffness matrix of substructure caused by track stiffness. Krc, Krb equal Kcr, Kbr for the absolute value, but the meaning is opposite. Crc, Crb, Ccr, Cbr are similar to the stiffness matrices. The Newmark-ß method is an unconditionally stable implicit integral scheme, belonging to the self-starting method. The value of time step ∆t does not affect the stability of the solution. 5 × 10⁻⁵ s is adopted in this study.
The dynamic inspection data [19] of a HSR line with ballast track are selected as the source, as shown in Figure 1a. The inspection equipment is the high-speed comprehensive inspection train, which is independently developed by China [20,21]. The 32-meter span prestressed reinforced concrete simply supported box girders are widely used in this railway line, and ballast track is arranged on these bridges. Bridge expansion devices are set at the beam joints, to ensure that ballast would not drop under the repeated action of temperature and free expansion of girder. For the continuous simply supported girder bridge section, bridge creep [22,23] is the main disease affecting the track state on the bridge, causing periodic track longitudinal level consistent with the bridge.
2.3. Track Longitudinal Level at the Beam Joint with Temperature
The studied HSR line has been in operation for more than 10 years. Annual data of 2020 were selected for analysis. By 2020, the bridges creep development had tended to be stable [7]. Ballast bed and rail are laid on bridges, and ballast bed belongs to the granular structure. The vertical stiffness of bridges is much larger than the stiffness of the ballast track and the bending stiffness of the rail. Accordingly, the deformation caused by bridge creep can be transmitted to the rail surface through the ballast bed. As a continuous elastic body, the rail has a certain smoothing effect on the bending angle at the beam joint. However, due to less bending stiffness of the rail, the longitudinal level by bending angle would still be transmitted to the rail surface. Due to the reason of structure arrangement, the stiffness is different at the midspan and the beam end [24]. Under the trainload, the vertical deformation of the rail at the beam end will be aggravated. Hence, it will produce the longitudinal level with a wavelength of 5~11 m at the beam end, which is represented as a “peak” in the waveform diagram. The deviations for the track longitudinal level at the beam joint and midspan are −4.86 mm and 1.33 mm at the span with the largest difference of amplitude, and the difference of absolute value is 1~3 mm, as shown in Figure 4a. In Figure 4b, the power spectral density (PSD) method [25] is used to analyze the track longitudinal level data from 19.3 km to 24.4 km, and the deformation characteristics are obtained. By analyzing track longitudinal level at the location of 19.481 km in different periods, we found that the track longitudinal level at the beam joint is larger in winter and smaller in summer, as shown in Figure 4c.
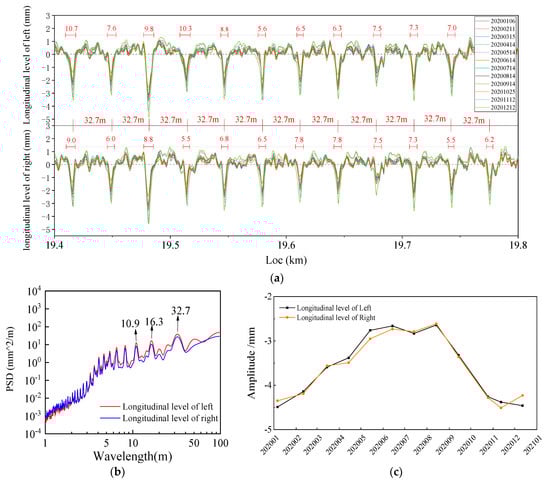
Figure 4.
Various characteristics of track longitudinal level. (a) Longitudinal level. (b) PSD of longitudinal level. (c) Longitudinal level at the location of 19.481 km.
To study the interaction relation between the track longitudinal level at the beam joint and temperature, 6 beam joints are randomly selected for the down line, and their mileage positions are, respectively, 35.731 km (K35.731 in the following figure legends, the same bellow), 82.200 km, 135.139 km, 185.267 km, 233.762 km, 286.312 km. According to 24 comprehensive inspection data of 2020, the maximum daily temperature was recorded. The relation curves of the longitudinal level at the beam joint and temperature with time are shown in Figure 5. The longitudinal level at the beam joint decrease with the increase in temperature. The longitudinal level-temperature scatter diagram and the fitting lines of scatter points are presented in Figure 6. The magnitude and variation trend of the longitudinal level are different at different beam joints, which is due to the difference of structure itself, construction, ballast bed, and ambient temperature. However, the longitudinal level at the beam joints is negatively correlated with temperature, which basically meets the linear relationship. To reduce the error, the average value of the longitudinal level (LL) at six locations is taken for fitting, and the fitting formula is expressed as
where T is temperature (unit: °C), LL is the longitudinal level at the beam joint (units: mm).
LL = 0.0642T − 3.3376
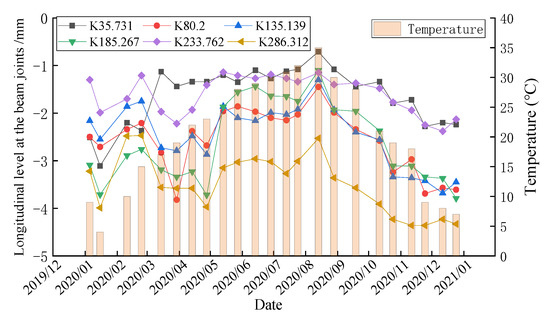
Figure 5.
Variation of the longitudinal level at the beam joint and temperature with time.
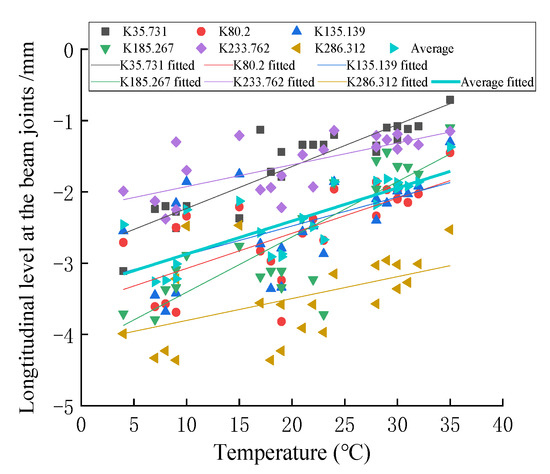
Figure 6.
Variation of the longitudinal level at the beam joint with temperature.
2.4. Analysis of TQI at the Beam Joint with Temperature
The TQI (Track Quality Index) focuses on the overall quality state of track in a section. In theory, the TQI is a statistical description of track geometric irregularity, reflecting the fluctuation of track geometric irregularity in the section of 200 m length. The TQI is used to manage the track, so-called the mean value management, which can reflect the track quality state realistically. The TQI is calculated by [26]
where is the single deviation of longitudinal level of left, longitudinal level of right, alignment of left, alignment of right, track gauge, cross level, twist, calculated by
where N is the sampling number in the section of 200 m, is the average value of the peak values , the data of [1.5, 42] m wavelength for longitudinal level and alignment.
This paper selected the mileages of 6 beam joint and calculated the TQI considering 100 m forward and 100 m backward with each beam joint as the center, finally, got the variation relationship of TQI at the beam joint with temperature. The results are shown in Figure 7 and Figure 8, where variation curves of the TQI and temperature with time and the TQI with temperature are plotted. The TQI at the beam joint shows a linear decreasing trend with the increase in temperature. Same as Section 2.1, the average value of the longitudinal levels at six locations are fitted, and the fitting formula is shown as
TQI = −0.02043T + 3.3314
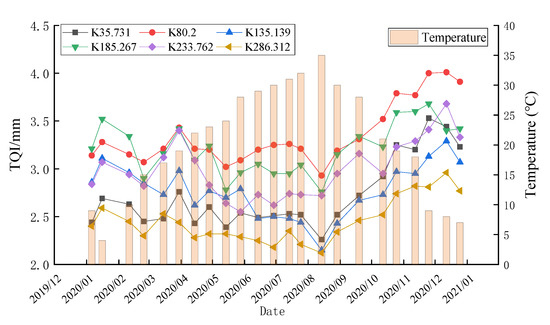
Figure 7.
Variation of TQI and temperature with time.
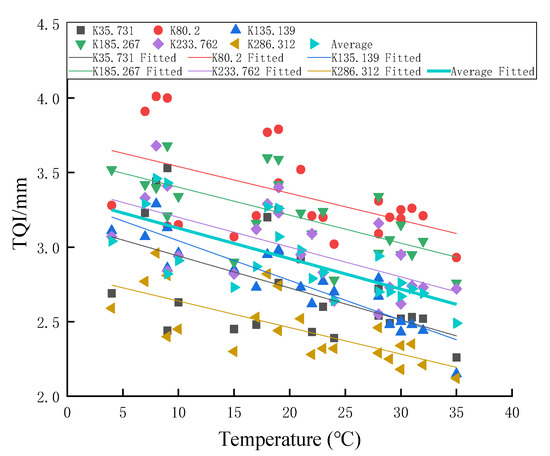
Figure 8.
Variation of TQI with temperature.
2.5. Analysis of Reasons for Track State at the Beam Joint with Temperature
In light of the introduction of Section 2.1 and Section 2.2, two main conclusions can be reached after analyzing the variation relations of the track longitudinal level and the TQI at the beam joint with temperature. First, during the temperature cycling process, the longitudinal expansion of the movable end of simply supported girder will make the ballast bed disturbed, leading to the ballast continuously reorganizing and the compactness changing. Second, rail will expand and shrink with the fluctuation of rail temperature. Moreover, due to the constraint effect of fasteners or ballast damping, rail cannot freely expand, resulting in significant temperature stress. The significant temperature stress would drive sleepers to move, causing the ballast continuously to be reorganized, and compactness to be changed, which is consistent with the result in the paper [27]. The two causes work together, resulting in the fluctuation of longitudinal level at the beam joint for bridges with the ballast track. In particular, it gets larger in winter and smaller in summer, which is opposite to those for bridges with a ballastless track [2,28].
3. Analysis of Vehicle Response
3.1. Spectral Analysis
To investigate the influence on running performance of the track longitudinal level at the beam joint of simply supported girder bridges in China railway (high-speed with a ballast track), dynamic responses inspection data of vehicle components were analyzed. Combined with the structure deformation characteristics of 32-meter simply supported girder bridge [9,24], the influence of bridge deformation on running performance was obtained.
The spectral analysis of track longitudinal level and vehicle dynamic response data in the 10-kilometer section of China railway (high-speed with a ballast track) were performed. Views are shown in Figure 9, where the energy of a 32.7-meter wavelength is the strongest for the track longitudinal level and the vertical acceleration of the car body. The energy of a 32.7-meter wavelength is also prominent, which is reflected in vertical acceleration of bogie, axle box, and wheel/rail force, far less than those of other wavelength components. In the meanwhile, the PSDs of track alignment, lateral acceleration of car body, and WR (wheel–rail) lateral force show no obvious peak at the 32.7-meter wavelength. The influence of bridge creep deformation and bending angle at the beam on the track longitudinal level is mainly shown in the vertical deformation, which reduces the riding comfort, but shows little influence on the lateral vibration.
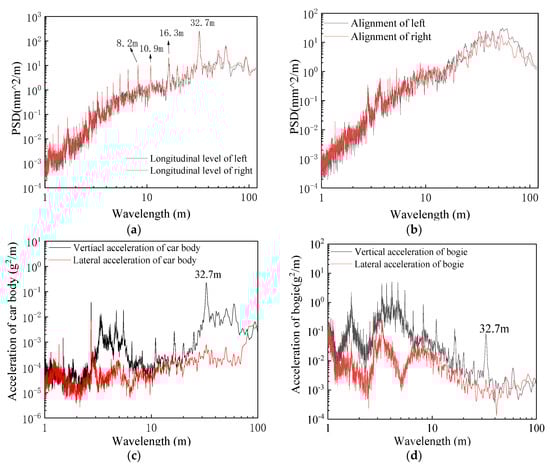
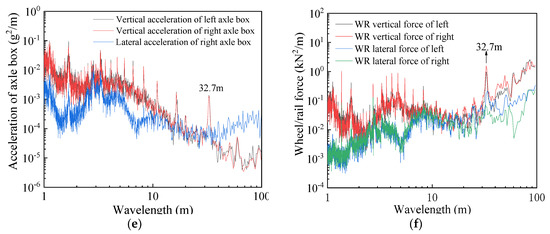
Figure 9.
PSDs of track longitudinal level and vehicle response. (a) Track longitudinal level. (b) Track alignment. (c) Acceleration of car body. (d) Acceleration of bogie. (e) Acceleration of axle box. (f) Wheel/rail force.
3.2. Analysis of Vehicle Response Inspection Data
According to the analysis results of Section 3.1, the impact on vertical vibration response of the vehicle of bridge deformation is analyzed. Due to the great difference in detection principle, device and frequency, it is necessary to preprocess the data of track longitudinal level, vertical vibration acceleration of vehicle components, and WR vertical force before comparison and analyses. Three categories of inspection data are mileage synchronized. The mileage of another two kinds of data is rectified according to the mileage of track longitudinal level. Based on the standards [29,30], band-pass filtering [0.5, 20] Hz is carried out for the vertical acceleration of car body, and band-pass filtering of 0.5–30 Hz is carried out for the vertical acceleration of bogie, and band-pass filtering of 0.5–50 Hz is carried out for the vertical acceleration of axle box and WR vertical force. After filtering, there is periodic peak for the vertical vibration acceleration of the car body at the beam joint, and there is short-term vibration at the beam joint for other components of the vehicle. Due to the two-stage suspension characteristics of vehicles, vertical acceleration of axle box and WR vertical force are the largest, followed by vertical acceleration of bogie, and the acceleration of car body is the least. More specifically, time history curves of the track longitudinal level, vertical acceleration of the vehicle components, and WR force during the K140~K141 section are presented in Figure 10. Figure 10a shows the track longitudinal level curve and the positions and amplitudes of the beam joints are highlighted. The maximum amplitudes of the longitudinal level of left at the beam joints and midspan are −3.1 mm and 1.1 mm, respectively for the same span of 32-meter simply supported girder bridge. The difference of absolute value between the longitudinal level at the beam joint and that at the midspan is [1, 3] mm. The time history curves of vehicle response when the train passes this section are shown in Figure 10b. The vertical vibration acceleration of vehicle components and WR force at the beam joints are marked with ”.’’ The vertical vibration accelerations of the car body at the midspan and beam joint are −0.05 g and 0.0 g, respectively, for the same span. The difference of absolute value is little, and the maximum difference is 0.02 g. The vertical vibration acceleration of bogie at the beam joint is 1.21 g larger than that at the midspan, and the vertical vibration acceleration of the left axle box at the beam joint is 3.93 g larger than that at the midspan, and the vertical WR force on the left side of wheelset at the beam joint is 7.75 kN larger than that at the midspan.
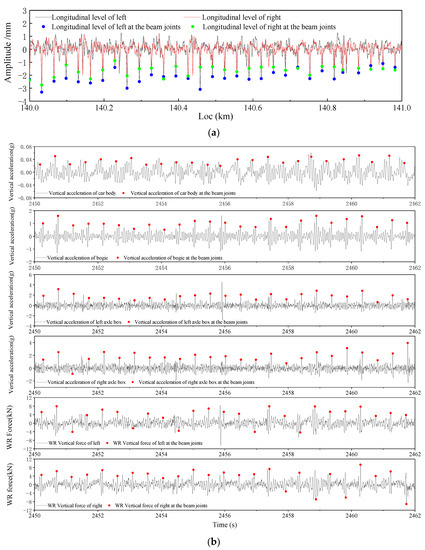
Figure 10.
Time history curves of vehicle dynamic responses and WR force. (a) Track longitudinal level (section). (b) Vehicle dynamic response data.
The analysis of the vertical vibration acceleration of vehicle components and WR vertical force passing the continuous simply supported girder bridge section with a ballast track is performed. The angular angle irregularity (short wavelength and large amplitude) at the beam joints forms under the action of the bridge creep arch and temperature cycling. The vehicle response at the beam joints is obviously larger than that at the midspan. It only affects the ride comfort instead of the running safety. Therefore, the engineering department should focus on the track state at the beam joints. Once the large value occurs, it should be eliminated in time.
4. Model of Vehicle–Track–Bridge Interaction
4.1. Model of Track-Bridge
Based on the FE software Midas, a three-dimensional finite element model of 10-span 32-meter simply supported beam bridge–track–CWR rail is established, including rail, fastening system, sleepers, ballast bed and bridge structure components, as shown in Figure 11a, and the enlarged view in some positions is shown in Figure 11b. Some material characteristic parameters of the bridge can refer to this paper [31], and the specific cross-sectional dimensions are shown in Figure 1b. The length of every bridge span is 32.6 m, the length between the cross sections of the two bearings is 32 m, and the gap width between the center line of every bridge span is 0.01 m. Finally, the overall length of the rail is 900 m considering the influence of train entering and leaving the bridge, one about 300 m track is added on both sides of bridges. Furthermore, the height of every pier is 20 m. Moreover, one end of the track fastener is connected to the rail and the other is consolidated on the ground. In the model, the beam element simulates the rail of CHN60, and spring-damping element simulates the constraint of the fastener and rubber on the rail, the constraint between the sleeper and the ballast bed, and the connection between the ballast bed and bridge, with the fastener spacing being 0.6 m. The ballast bed laid on the bridge is of granular structure. To improve the computation efficiency, the model adopts beam element to simulate the sleepers and uses rigid connection to restrict the beam element in the longitudinal direction of bridge [32]. The simply supported girder bridges and piers are simulated by beam elements based on structure and mechanical characteristics [33], as shown in Figure 11b. The main-slave relation simulates the bridge bearing, and the piers bottom are fixed on the ground, leaving out the friction of the active bearing.
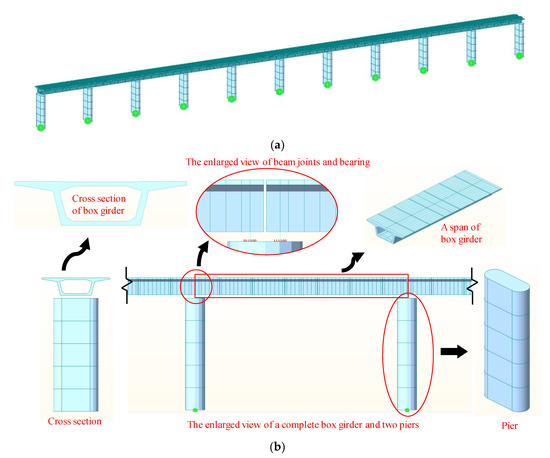
Figure 11.
Three-dimensional finite element model of rail–track–bridge. (a) Three-dimensional finite element model of rail–track–bridge with 10-span box girders. (b) The enlarged view of box girder and piers.
Rayleigh damping is adopted for the damping matrix of the rail system and track–bridge system. The influence of fasteners on the stiffness matrix and damping matrix is considered according to the principle “seat by number” [34]. The Rayleigh damping calculation is as follows
where and are the overall mass matrix and stiffness matrix, respectively. α and β can be obtained by
where and are the first and second natural frequencies, and are the corresponding damping coefficients, respectively. For the steel track, and are about 1%; however, for sleepers, track bed and bridges, and are about 2% [35].
The vertical static stiffness of the rail pad is 60 MN/m, and the vertical damping is 75 kN·s/m. The lateral static stiffness of the rail pad is 20 MN/m, and the horizontal damping is 60 kN·s/m [18]. The vertical and lateral static stiffness of the ballast bed are 150 MN/m, and the vertical and lateral damping are 60 KN·s/m.
4.2. Wheel–Rail Contact Principle
The Hertz nonlinear elastic contact theory is adopted in the normal direction of wheel–rail, the vertical force between the wheel and rail is as follows
where G is the wheel–rail contact constant, and the unit is m/N2/3. is the elastic compression between the wheel and rail, and the unit is m.
The longitudinal, lateral and spin creep forces between the wheel and rail are solved by Kalker linear creep theory, expressed as
The Shen–Hedrick–Elkins theory is used to make nonlinear corrections for the longitudinal and lateral creep slip forces between wheel and rail, and the calculation details and parameters description are presented in this paper [36].
4.3. Selection of Track Geometric Irregularity
With reference to the inspection track geometric irregularity of 32-meter simply supported girder bridge in HSR with a ballast track in Section 2, the longitudinal level and alignment are shown in Figure 12. The vehicle–track–bridge dynamic simulation analysis was carried out by adjusting the amplitude of 1, 1.5, 2, 2.5, 3 and 3.5 times as large as the original longitudinal level, while the alignment stay invariable, as shown in Figure 13. Because the wavelength of the track longitudinal level at the beam joint is about [7, 15] m, shorter than that caused by the creep camber, the 10-meter chord measurement value of the track longitudinal level at the beam joint is also larger than that at the midspan. The original longitudinal level and 10-meter chord measurement value are shown in Figure 14.
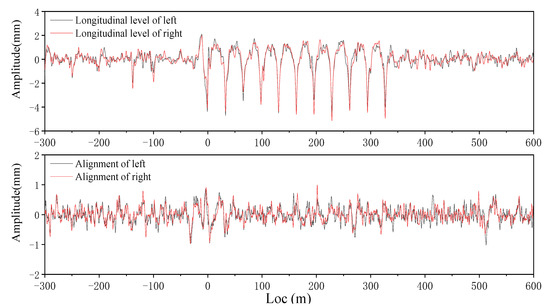
Figure 12.
Original track longitudinal level and alignment.
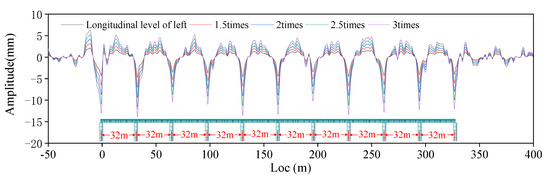
Figure 13.
Track longitudinal level and times.
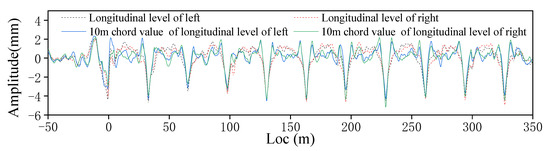
Figure 14.
Track longitudinal level and 10-meter chord measurement in bridge section.
The amplitude of track longitudinal level, 10-meter chord measurement value, and peak-to-peak value (the difference between the maximum value of the track longitudinal level at the midspan of the beam and the average value of the left and right beam joints for each span) are shown in Table 2. The table shows that when the dynamic longitudinal level at the beam joint is −10.30 mm, the corresponding 10-meter chord measurement value reaches −10.44 mm, which is close to the level IV (11 mm) of the static-track geometric irregularity allowable deviation management value [17].
Table 2.
The detail of track longitudinal level.
5. Threshold of Longitudinal Level at the Beam Joint
Based on the vehicle–track–bridge dynamic simulation model, the dynamic simulation calculation is carried out with the train speeds of 200, 230 and 250 km/h, considering the inspection track longitudinal level in the bridge section with a ballast track of a Chinese high-speed railway. The vertical acceleration of the car body and bogie, the Sperling index, rate of wheel load reduction (△P/P) and WR vertical force are used to evaluate the driving performance. The vertical displacement and acceleration of the rail and bridge at the midspan and end of bridge are used to evaluate the structure service performance. The deformation limit is given according to the vehicle dynamic standard, shown in [17,26].
From Figure 15, Figure 16 and Figure 17, it can be concluded that the vehicle will be obviously impacted when passing the beam joint. The vertical acceleration of car body is large at the beam joint and midspan. Moreover, the WR vertical force is significantly larger at the beam joint than that at the midspan, and the increase of wheel load is more serious than the decrease of the wheel load. Especially when the train enters the bridge section, the WR vertical force is significantly larger, and the vehicle and track will be impacted greatly. Consequently, the service performance of vehicle and rail components will be reduced and even damaged.
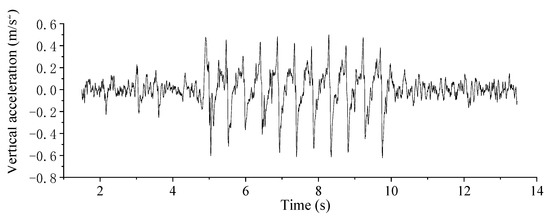
Figure 15.
Time history curve of vertical acceleration of car body.
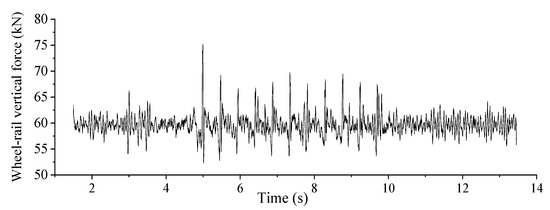
Figure 16.
Time history curve of wheel–rail vertical force.
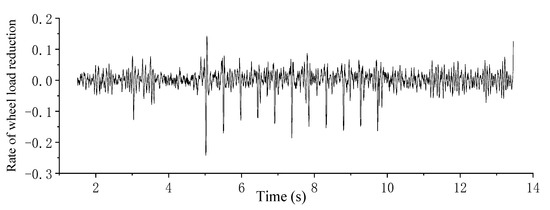
Figure 17.
Time history curve of rate of wheel load reduction.
The findings from Figure 18, Figure 19, Figure 20, Figure 21, Figure 22, Figure 23, Figure 24 and Figure 25 show that the vertical acceleration of the car body, Sperling index, WR vertical force, rate of wheel load reduction and the vertical acceleration of the bridge midspan and beam joint positively correlates with the longitudinal level at the beam joint and train speed.
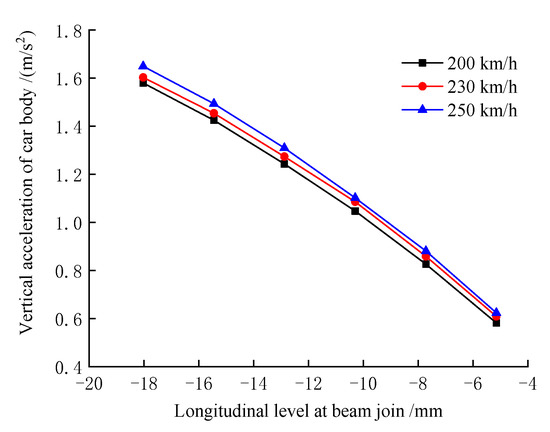
Figure 18.
Vertical acceleration of car body.
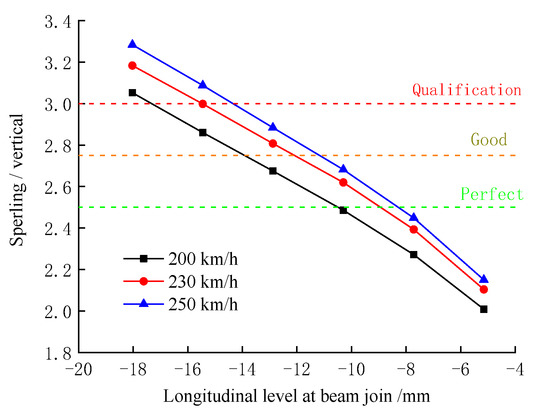
Figure 19.
Sperling/vertical.
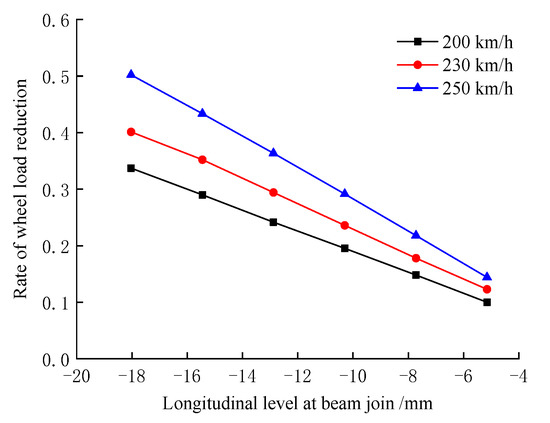
Figure 20.
Rate of wheel load reduction.
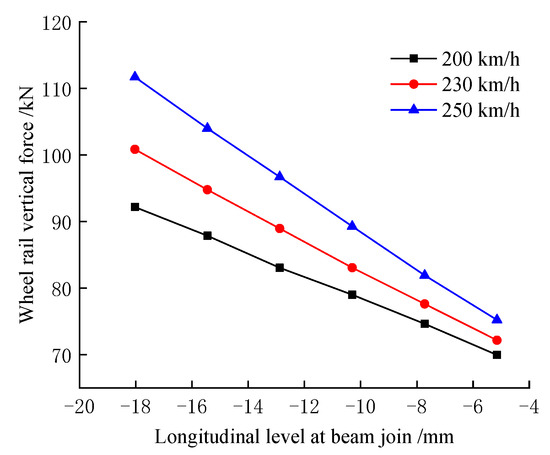
Figure 21.
Wheel–rail vertical force.
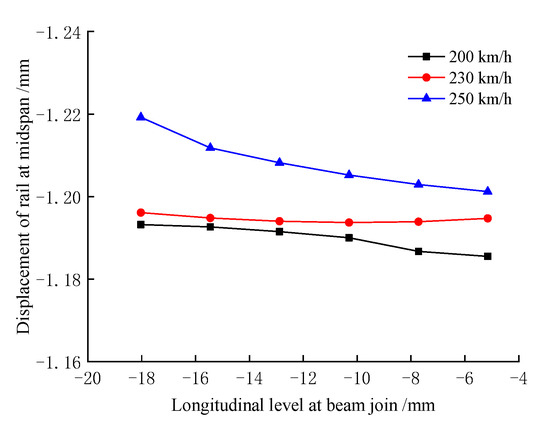
Figure 22.
Displacement of rail at midspan.
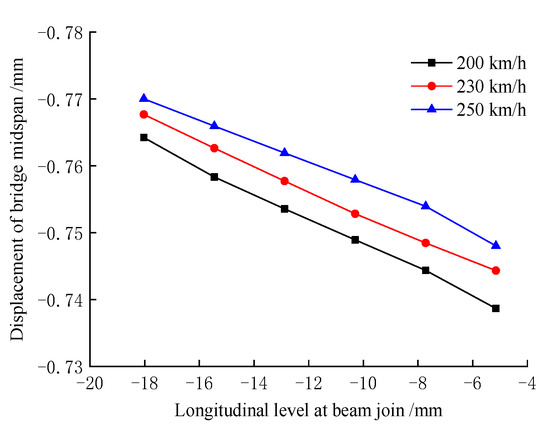
Figure 23.
Displacement of bridge midspan.
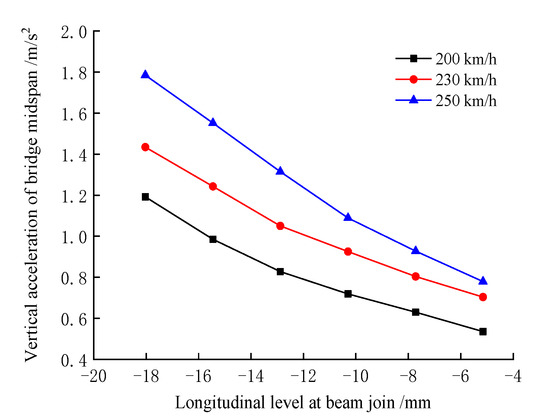
Figure 24.
Vertical acceleration of bridge midspan.
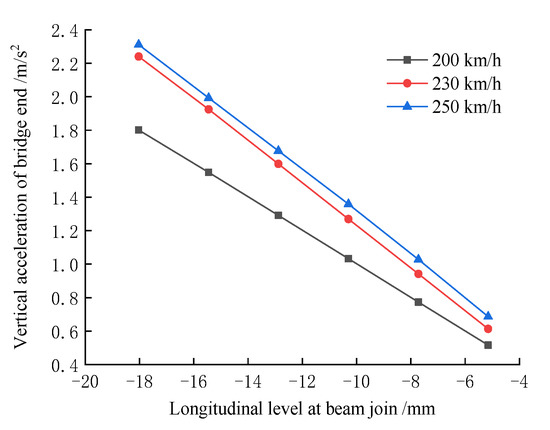
Figure 25.
Vertical acceleration of bridge end.
When the amplitude of longitudinal level at the beam joint is 15.45 mm, the 10-meter chord value is 15.66 mm, and the peak-to-peak value is 19.52 mm. Under the train speed of 350 km/h, the maximum rate of wheel load reduction is 0.43, and the vertical acceleration of car body is 1.49 m/s2, reaching class II-comfort index [17] of track dynamic management threshold, and the vertical Sperling index exceeding the qualified index [2]. The vertical displacement of the rail, vertical displacement of the bridge midspan and vertical acceleration of bridge are positive correlations to the increase in the train speed. Comparing to the vertical acceleration, the vertical displacement of rail and bridge rarely increase with the increase of train speed. Additionally, the vertical acceleration at the beam end is larger than that at the midspan, but they do not exceed the standard of 3.5 m/s2 [36].
Since the creep of the simply supported girder bridge in HSR will continuously exist [37], ride discomfort will unfortunately occur when Sperling index exceeds the standard limit, even if rate of wheel load reduction does not exceed the standard limit. Taking the calculation results and the management requirements of the track dynamic and static track geometric irregularity in the maintenance rules of a Chinese high-speed railway with a ballast track into consideration, the threshold of the dynamic longitudinal level at the beam joint should be 14 mm, and the static longitudinal level should be 11 mm for those lines with the design speed of 250 km/h. When reaching or even exceeding any limit, the maximum speed of operating a train online should be limited to 160 km/h to ensure the run safety. Simultaneously, the engineering department needs to carry out emergency operations for the track.
6. Maintenance Suggestions
A HSR line with a ballast track was officially opened and operated in 2009. The dynamic inspection track irregularity of 2013–2016 for these bridges section was selected for comparative analysis. As is shown in Figure 26 and Figure 27, the position of 177.034 km (K177 + 034) is the beam joint of a span, and the maximum value of longitudinal level reaches −4.49 mm on 25 March 2013. Before 26 June 2013, the engineering department carried out maintenance for this line, and the track state at the beam joint was moderately elevated. After the operation, the maximum longitudinal level was increased to 1.36 mm. After that, the track longitudinal level decreased slowly to 0, and then increased gradually to −0.72 mm until December 2016. The track longitudinal level can thus maintain for a long time.
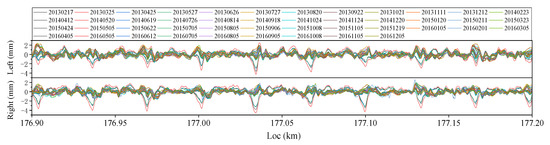
Figure 26.
Curve of track longitudinal level of a HSR line.
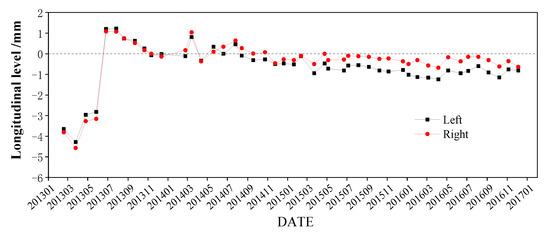
Figure 27.
Variation curve of track longitudinal level with time at 177.034 km of a HSR line.
Through field investigation, from June 9 to 24, 2019, the engineering department carried out large machine tamping operation for the downward line. The effect of operation is obvious. In Figure 28a, b, the amplitude of track longitudinal level is reduced from −2.13 mm to −0.20 mm, as shown in Figure 28c. The TQI from 174.000 km to 174.200 km section is reduced from 4.81 to 3.06, and track state is significantly improved, as shown in Figure 28d.
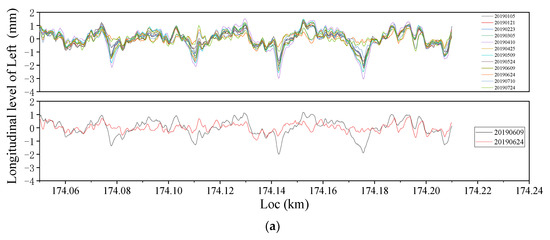
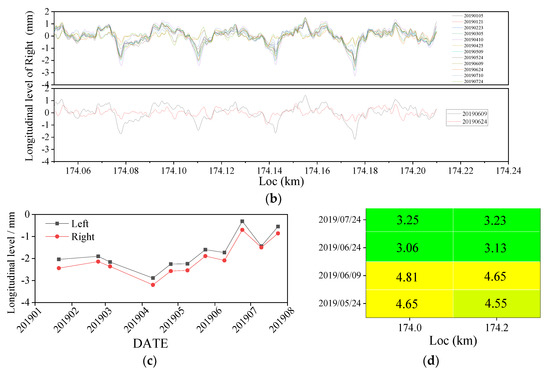
Figure 28.
Track longitudinal level and the amplitude at the beam joint. (a) Track longitudinal level of left. (b) Track longitudinal level of right. (c) Longitudinal level at the location of 174.175 km. (d) TQI from 174.000 km to 174.400 km.
Track operation experience suggests that engineering department should carry out emergency maintenance operations for the sections where the longitudinal level at the beam joint exceeds 11 mm, and carry out planned maintenance operations for the section where the longitudinal level exceeds 8 mm. Meanwhile, the maintenance operations need to refer to the amplitude of track longitudinal level and 10 m chord measurement value at the beam joint and abide by the maintenance rules of HSR with ballast track. On the premise of ensuring the overall smoothness of the line, the longitudinal level at the beam joint can be adjusted to a positive value. If the longitudinal level at beam joints of the whole bridge section is large, large machine equipment are required to carry out tamping operation.
7. Conclusions
- A peak of [5, 11] m wavelength for track longitudinal level exists at the beam joint of simply supported girder bridge in HSR with ballast track. In particular, the longitudinal level gets larger in winter and smaller in summer, which is opposite to those for bridges with a ballastless track. The difference between the absolute value of track longitudinal level at the beam joint and that at the midspan is [1, 3] mm;
- The relation between track longitudinal level at the beam joint and temperature can be summarized as LL = 0.0642T−3.3376. The relation between the TQI and temperature can be summarized as TQI = −0.02043T + 3.3314;
- According to vehicle response data and dynamic simulation results, train will suffer a significant shock at the beam joint, which will threaten running safety and service performance of the vehicle and track. There is a small difference in the vertical accelerations of the car body at the beam joint and midspan for the same bridge, and the maximum difference is just 0.02 g. The vertical acceleration of bogie at the beam joint is 1.21 g larger than that at the midspan, and the vertical acceleration of left axle box at the beam joint is 3.93 g larger than that at the midspan, and the WR vertical force at the left of the beam joint is 7.75 kN larger than that at the midspan;
- The dynamic longitudinal level at the beam joint of simply supported girder bridge in HSR with ballast track cannot exceed 14 mm, and the static value (10-meter chord measurement value) cannot exceed 11 mm, otherwise the maximum speed of train should be limited to 160 km/h or below, and the track operation should be carried out;
- The engineering department should carry out emergency maintenance operations for the sections where the track longitudinal level at the beam joint exceeds 11 mm, and carry out planned maintenance operations for the section where the track longitudinal level exceeds 8 mm. At the same time, on the premise of ensuring the overall smoothness of the line, the track longitudinal level at the beam joint can be adjusted to be a positive value. Furthermore, if the track longitudinal level at most beam joints of the whole bridge section is large, then large machine equipment is used to conduct tamping operation.
Author Contributions
Conceptualization, G.L. and F.Y.; methodology, G.L.; software, G.L.; validation, F.Y., Z.K. and X.S.; formal analysis, F.Y.; investigation, G.L.; resources, B.L.; data curation, W.Z.; writing—original draft preparation, G.L. and X.S.; writing—review and editing, G.L., Y.Z. and F.Y.; visualization, B.L.; supervision, Z.K.; project administration, F.Y. and Z.K.; funding acquisition, Y.Z. All authors have read and agreed to the published version of the manuscript.
Funding
This research was funded by the National Key R&D Program of China (No.2020YFF0304104), China State Railway Group Corporation Limited science foundation (No. P2021T013) and China Academy of Railway Sciences Corporation Limited science foundation (No.2020YJ184)..The supports are gratefully acknowledged.
Institutional Review Board Statement
Not applicable.
Informed Consent Statement
Not applicable.
Data Availability Statement
The data used to support the findings of this study are available from the authors upon request.
Conflicts of Interest
The authors declare no conflict of interest.
References
- Xie, K.; Xing, J.; Wang, L.; Tian, C.; Chen, R.; Wang, P. Effect of temperature difference load of 32 m simply supported box beam bridge on track vertical irregularity. J. Mod. Transp. 2015, 23, 262–271. [Google Scholar] [CrossRef]
- Wang, Y.; Wang, P.; Tang, H.; Liu, X.; Xu, J.; Xiao, J.; Wu, J. Assessment and prediction of high speed railway bridge long-term deformation based on track geometry inspection big data. Mech. Syst. Signal Process. 2021, 158, 107749. [Google Scholar] [CrossRef]
- Tian, X.; Gao, L.; Liu, M.; Cai, X. Study on residual creep arching threshold of 32 m simply-supported beam bridge of high-speed railway after track laying. China Railw. Sci. 2020, 41, 45–52. (In Chinese) [Google Scholar]
- Li, D.; Yang, F.; Ma, H. Effect of periodic track irregularities on simply supported beam bridge with common span for high-speed railway. China Railw. Sci. 2020, 41, 59–67. (In Chinese) [Google Scholar]
- Wang, S.J.; Xu, Z.D.; Li, S.; Dyke, S.J. Safety and stability of light-rail train running on multi-span bridges with deformation. J. Bridge Eng. 2016, 21, 06016004. [Google Scholar] [CrossRef]
- Xu, Q.-Y.; Lin, Q.-T.; Fang, Z.-Y.; Lou, P.; Zhang, Z. Influence of creep camber of bridge on dynamic characteristics of railway with longitudinal connected ballastless track on bridge. J. Railw. Eng. Soc. 2018, 35, 56–61. (In Chinese) [Google Scholar]
- Yang, H.; Chen, Z.; Zhang, H.; Fan, J. Dynamic Analysis of Train-Rail-Bridge Interaction considering Concrete Creep of a Multi-Span Simply Supported Bridge. Adv. Struct. Eng. 2014, 17, 709–720. [Google Scholar] [CrossRef]
- Gou, H.; Yang, L.; Mo, Z.; Guo, W.; Shi, X.; Bao, Y. Effect of long-term bridge deformations on safe operation of high-speed railway and vibration of vehicle-bridge coupled system. Int. J. Struct. Stab. Dyn. 2019, 19, 645–660. [Google Scholar] [CrossRef]
- Xia, H.; Zhang, N.; Guo, W. Dynamic Interaction of Train-Bridge Systems in High-Speed Railways: Theory and Applications; Science Press: Beijing, China, 2018. [Google Scholar]
- Gao, L.; Ma, S.; Liu, X. Creep camber recognition method of simply supported girders in high-speed railway based on longitudinal level. J. Railw. Eng. Soc. 2020, 37, 25–30, 100. [Google Scholar]
- Yan, B.; Dai, G.L.; Hu, N. Recent development of design and construction of short span high-speed railway bridges in China. Eng. Struct. 2015, 100, 707–717. [Google Scholar] [CrossRef]
- Zhang, Y.; Jiang, L.; Zhou, W.; Feng, Y.; Tan, Z.; Chai, X. Study of bridge-subgrade longitudinal constraint range for high-speed railway simply-supported beam bridge with CRTSII ballastless track under earthquake excitation. Constr. Build. Mater. 2020, 241, 118026. [Google Scholar] [CrossRef]
- Zhang, Y.; Jiang, L.; Zhou, W.; Lai, Z.; Liu, X.; Peng, K.; Wang, Z.; Feng, Y. Control of Difference of Seismic Response Across Different Spans of High-Speed Railway Multi-Spans Simply Supported Bridge. Res. Sq. 2021. [Google Scholar] [CrossRef]
- Jiang, L.; Feng, Y.; Zhou, W.; He, B. Vibration characteristic analysis of high-speed railway simply supported beam bridge-track structure system. Steel Compos. Struct. 2019, 31, 591–600. [Google Scholar]
- Xia, H.; Li, H.L.; Guo, W.W.; Roeck, G.D. Vibration Resonance and Cancellation of Simply Supported Bridges under Moving Train Loads. J. Eng. Mech. 2014, 140, 04014015. [Google Scholar] [CrossRef]
- Fang, W.; Han, B.; Yang, S.K. Creep Effects on Simply Supported Prestressed Concrete Box Girder of High-Speed Railway with Ballastless Tracks. Appl. Mech. Mater. 2012, 238, 733–737. [Google Scholar]
- TG/GW115-2012; Gaosu Tielu Wuzha Guidao Xianlu Weixiu Guize (Shixing). China Railway Publishing House: Beijing, China, 2012. (In Chinese)
- Zhai, W. Vehicle-Track Coupled Dynamics: Theory and Application; Science Press: Beijing, China, 2020. [Google Scholar]
- Ma, S.; Gao, L.; Liu, X.; Lin, J. Deep Learning for Track Quality Evaluation of High-Speed Railway Based on Vehicle-Body Vibration Prediction. IEEE Access 2019, 7, 185099–185107. [Google Scholar] [CrossRef]
- Hou, W. Comprehensive Inspection Technologies of High-Speed Railways. In Proceedings of the 2010 Joint Rail Conference, Urbana, IL, USA, 27–29 April 2010; Volume 1, pp. 323–328. [Google Scholar]
- Wang, H.; Berkers, J.; van den Hurk, N.; Layegh, N.F. Study of loaded versus unloaded measurements in railway track inspection. Measurement 2020, 169, 108556. [Google Scholar] [CrossRef]
- Xu, M.; Wang, F. Study on creep control of prestressed concrete simply supported beam bridge in China high-speed railway. China Railw. 1999, 11, 19–22. [Google Scholar] [CrossRef]
- Su, Y.; Shi, L.; Hu, S.; Ban, X.; Yang, X. Design research on creep camber control for 40 m span prestressed concrete simply supported box girder on high-speed railway at 350 km/h. Railw. Eng. 2018, 58, 31–36. [Google Scholar]
- Zhai, W. The Vertical dynamic response of a rail vehicle caused by track stiffness variations along the track. Veh. Syst. Dyn. 1996, 25 (Suppl. 1), 175–187. [Google Scholar]
- Kang, X.; Liu, X.; Li, H.; Yang, F.; Gao, J.; Zhai, W. PSD of ballastless track irregularities of high-speed railway. Sci. Sin. Technol. 2014, 44, 687–696. [Google Scholar]
- TB/T 3355-2014; Track Geometry Dynamic Inspections and Evaluation Method. China Railway Publishing House: Beijing, China, 2014. (In Chinese)
- Wei, A. Study on force Transfer Characteristics of Granular Ballast of CWR on Ballasted Track Bridge; Southwest Jiaotong University: Chengdu, China, 2019. [Google Scholar]
- Cai, X.-P.; Luo, B.-C.; Zhong, Y.-L.; Zhang, Y.-R.; Hou, B.-W. Arching mechanism of the slab joints in CRTS II slab track under high temperature conditions. Eng. Fail. Anal. 2019, 98, 95–108. [Google Scholar] [CrossRef]
- GB/T 5599-2019; Specification for Dynamic Performance Assessment and Testing Verification of Rolling Stock. Standards Press of China: Beijing, China, 2019. (In Chinese)
- UIC 518:2009; Testing and Approval of Railway Vehicles from the Point of View of Their dynamic Behavior-Safety-Track Fatigue-Running Behavior. International Union of Railway: Paris, France, 2005.
- Zeng, Z.-P.; Liu, F.-S.; Lu, Z.-H.; Yu, Z.-W.; Lou, P.; Chen, L.-K. Three-dimensional rail-bridge coupling element of unequal lengths for analyzing train-track-bridge interaction system. Lat. Am. J. Solids Struct. 2016, 13, 2490–2528. [Google Scholar] [CrossRef][Green Version]
- Lang, A.V.; Diachenko, L.K.; Labutin, N.A. Comparison of various calculation models for the bridge dynamic analysis. IOP Conf. Ser. Mater. Sci. Eng. 2020, 786, 012083. [Google Scholar] [CrossRef]
- Ge, X.; Ling, L.; Yuan, X.; Wang, K. Effect of distributed support of rail pad on vertical vehicle-track interactions. Constr. Build. Mater. 2020, 262, 120607. [Google Scholar] [CrossRef]
- Ling, L.; Dhanasekar, M.; Thambiratnam, D.P. Dynamic response of the train-track-bridge system subjected to derailment impacts. Veh. Syst. Dyn. 2018, 56, 638–657. [Google Scholar] [CrossRef]
- Li, X.; Lei, H.; Zhu, Y. Analysis of Rayleigh damping parameters in a dynamic system of vehicle-track-bridge. J. Vib. Shock. 2013, 32, 52–57, 73. (In Chinese) [Google Scholar]
- TB10761-2013; Technical Regulations for Dynamic Acceptance for High-Speed Railway Construction. China Railway Publishing House: Beijing, China, 2013. (In Chinese)
- MC90, CEB-FIP Model Code 1990, Design Code. Available online: https://pdfgoal.com/downloads/ceb_fip_model_code_1990_design_code_pdf (accessed on 4 April 2022).
Publisher’s Note: MDPI stays neutral with regard to jurisdictional claims in published maps and institutional affiliations. |
© 2022 by the authors. Licensee MDPI, Basel, Switzerland. This article is an open access article distributed under the terms and conditions of the Creative Commons Attribution (CC BY) license (https://creativecommons.org/licenses/by/4.0/).