
The Effect of External Wall Insulation on Mold and Moisture on the Buildings

Abstract
:1. Introduction
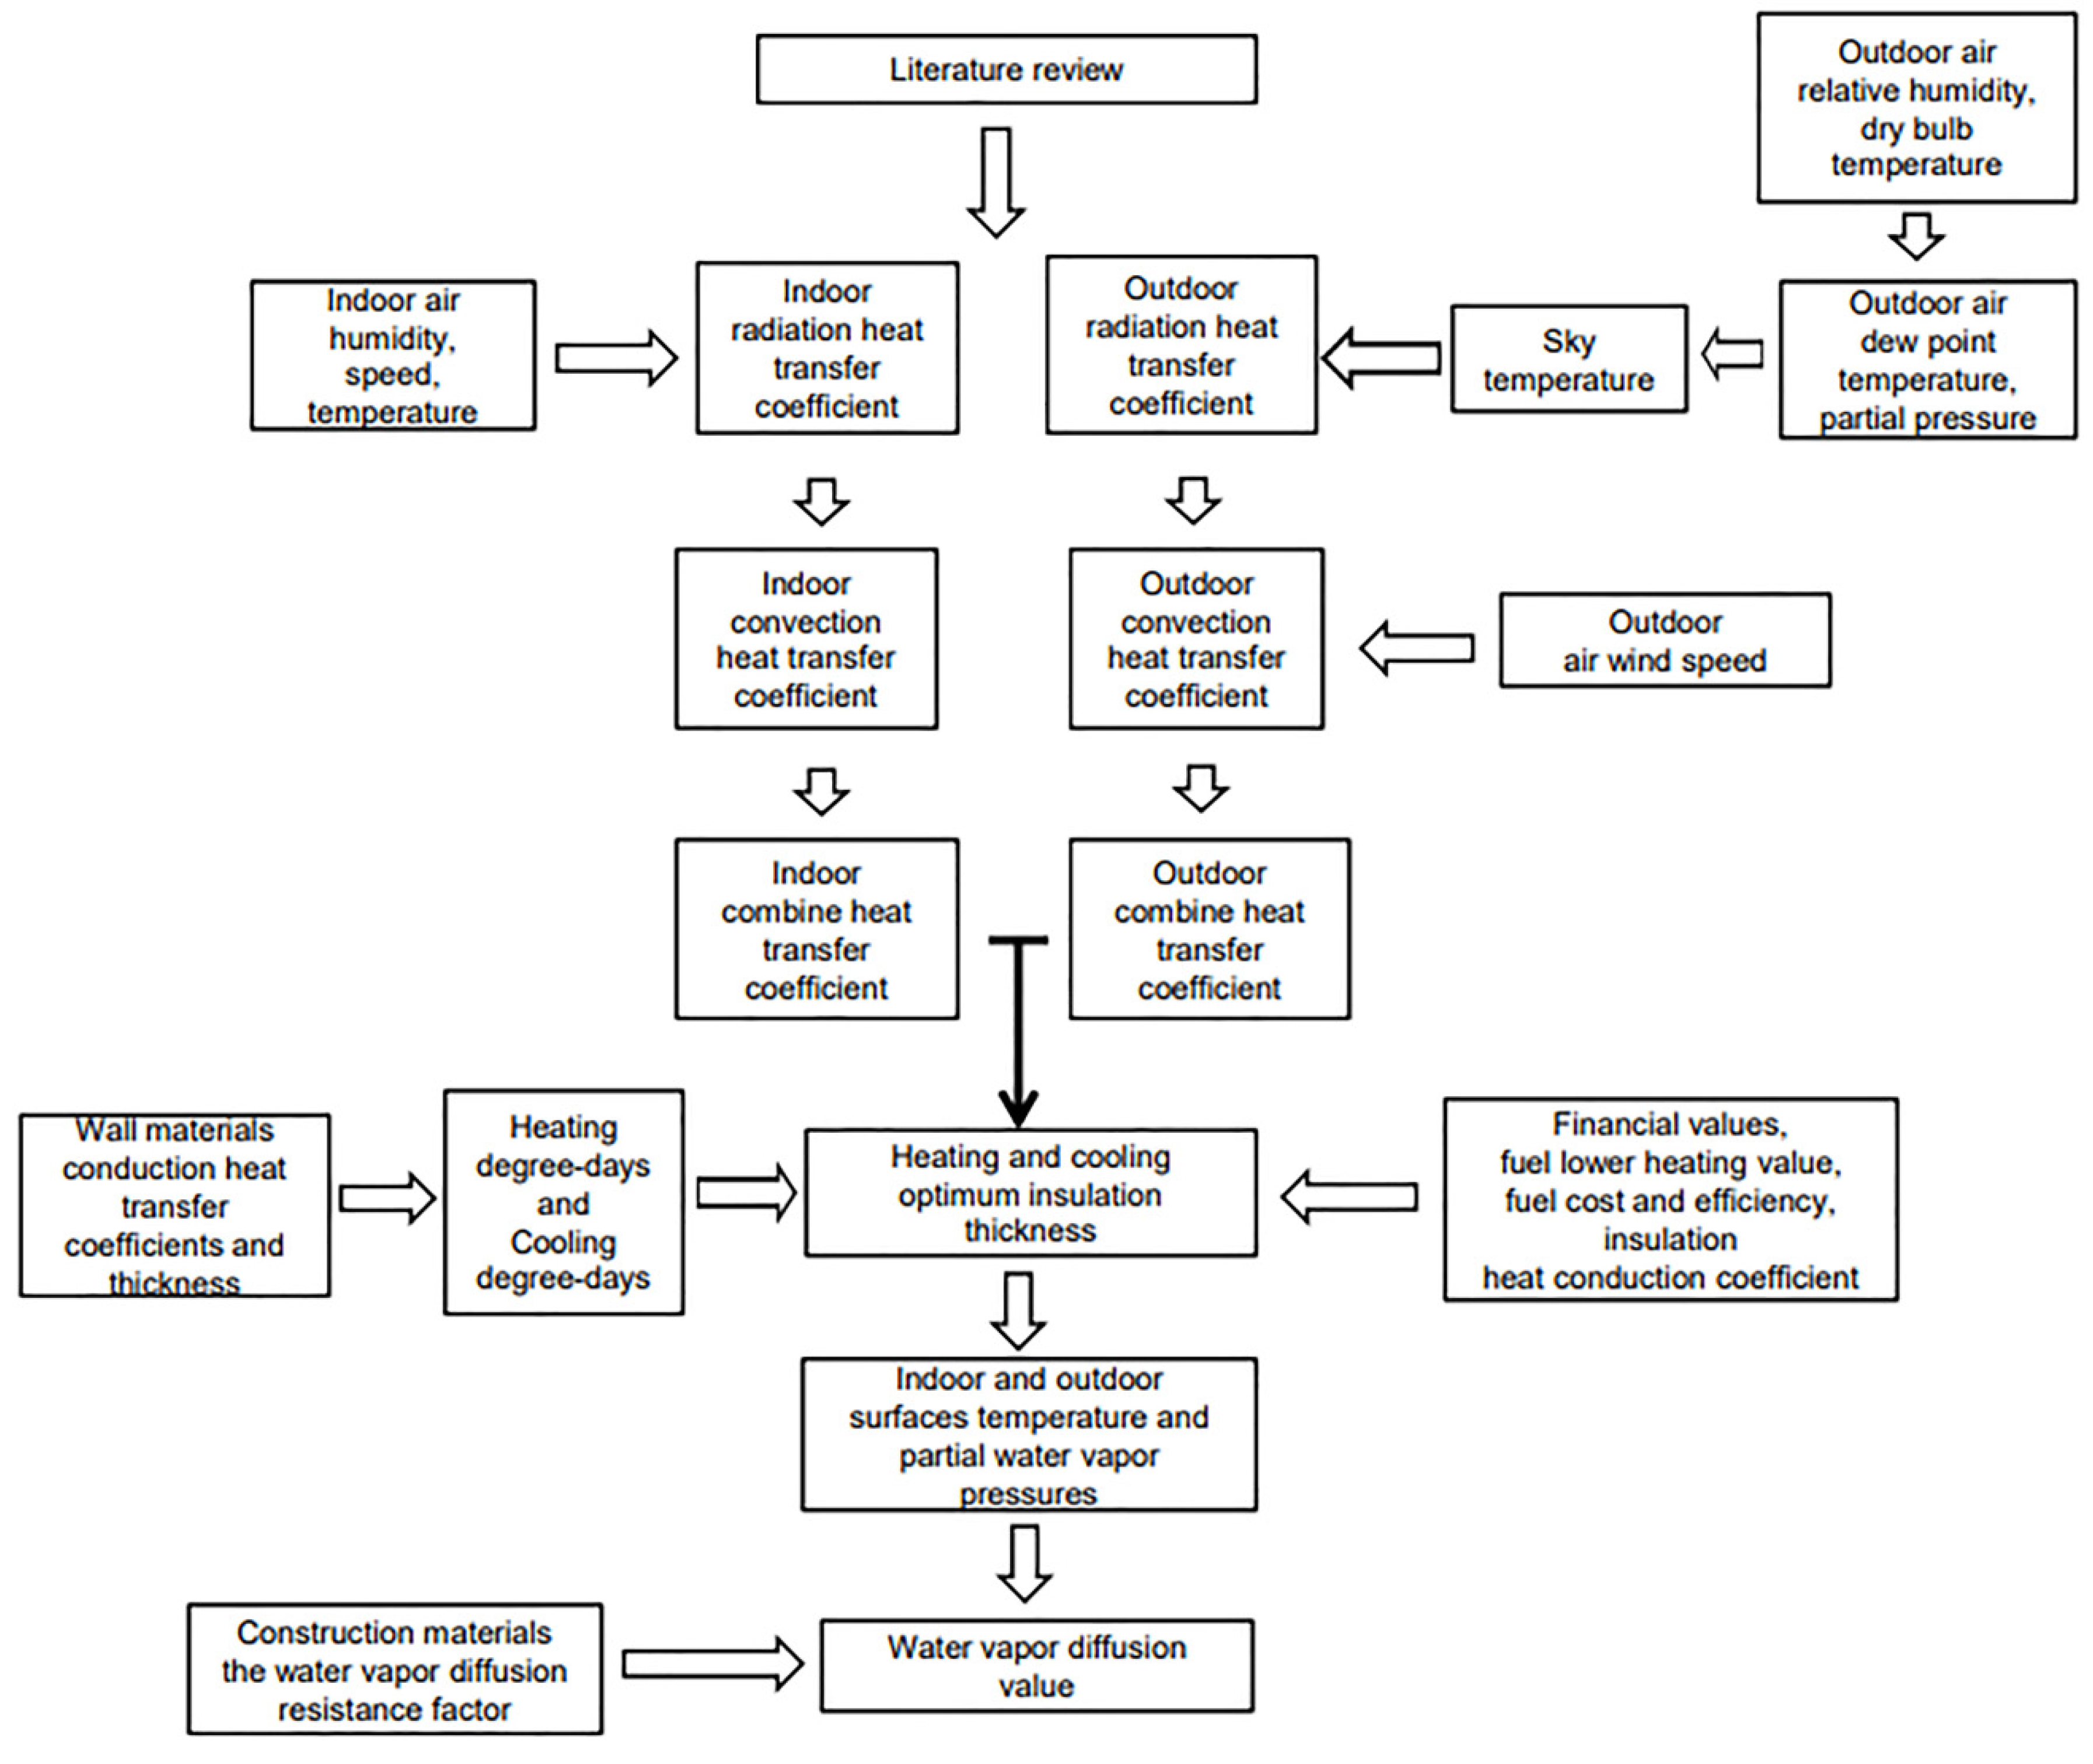
2. Methodology
2.1. Radiative Heat Transfer Coefficient Calculation
2.2. Convective Heat Transfer Coefficient Calculation
2.3. Optimum Insulation Thickness Calculation
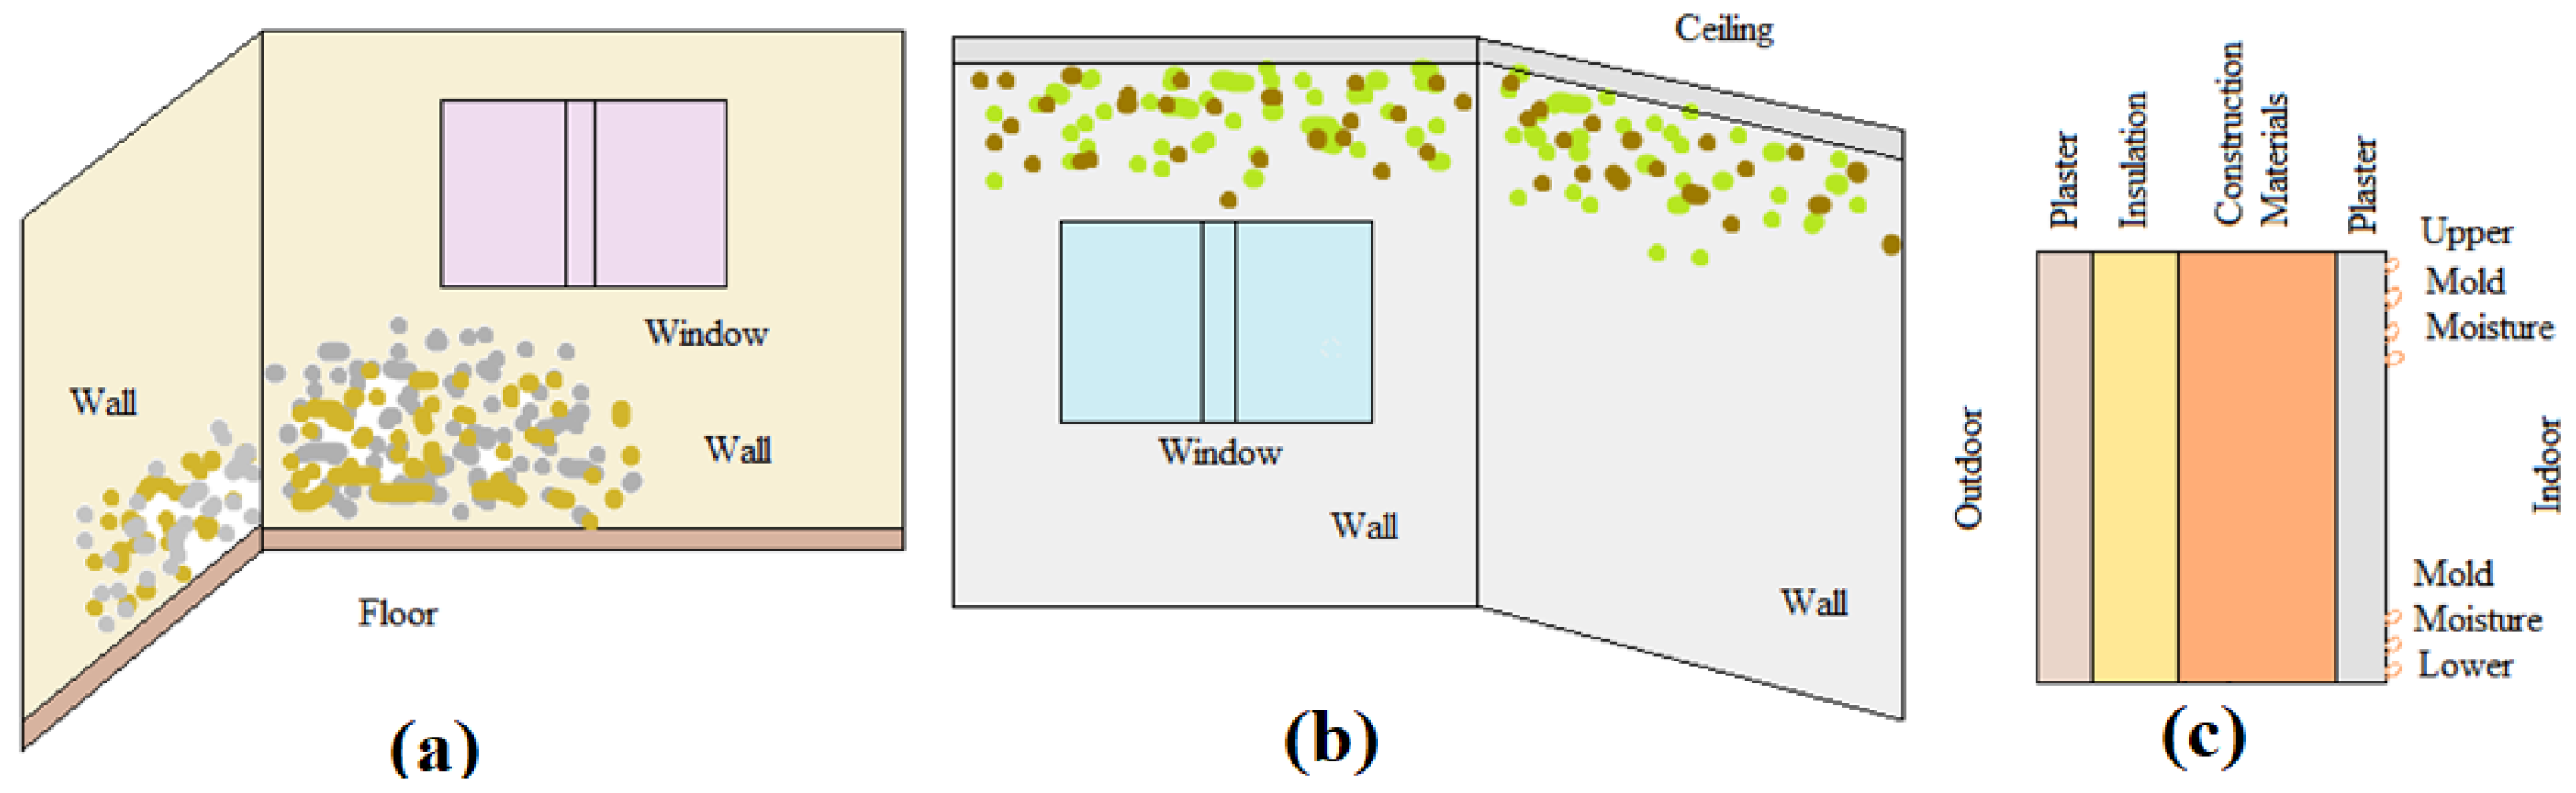
2.4. Relative Humidity Calculation for Mold Formation on the Wall Surface
2.5. Calculation of the Amount of Condensed Moisture
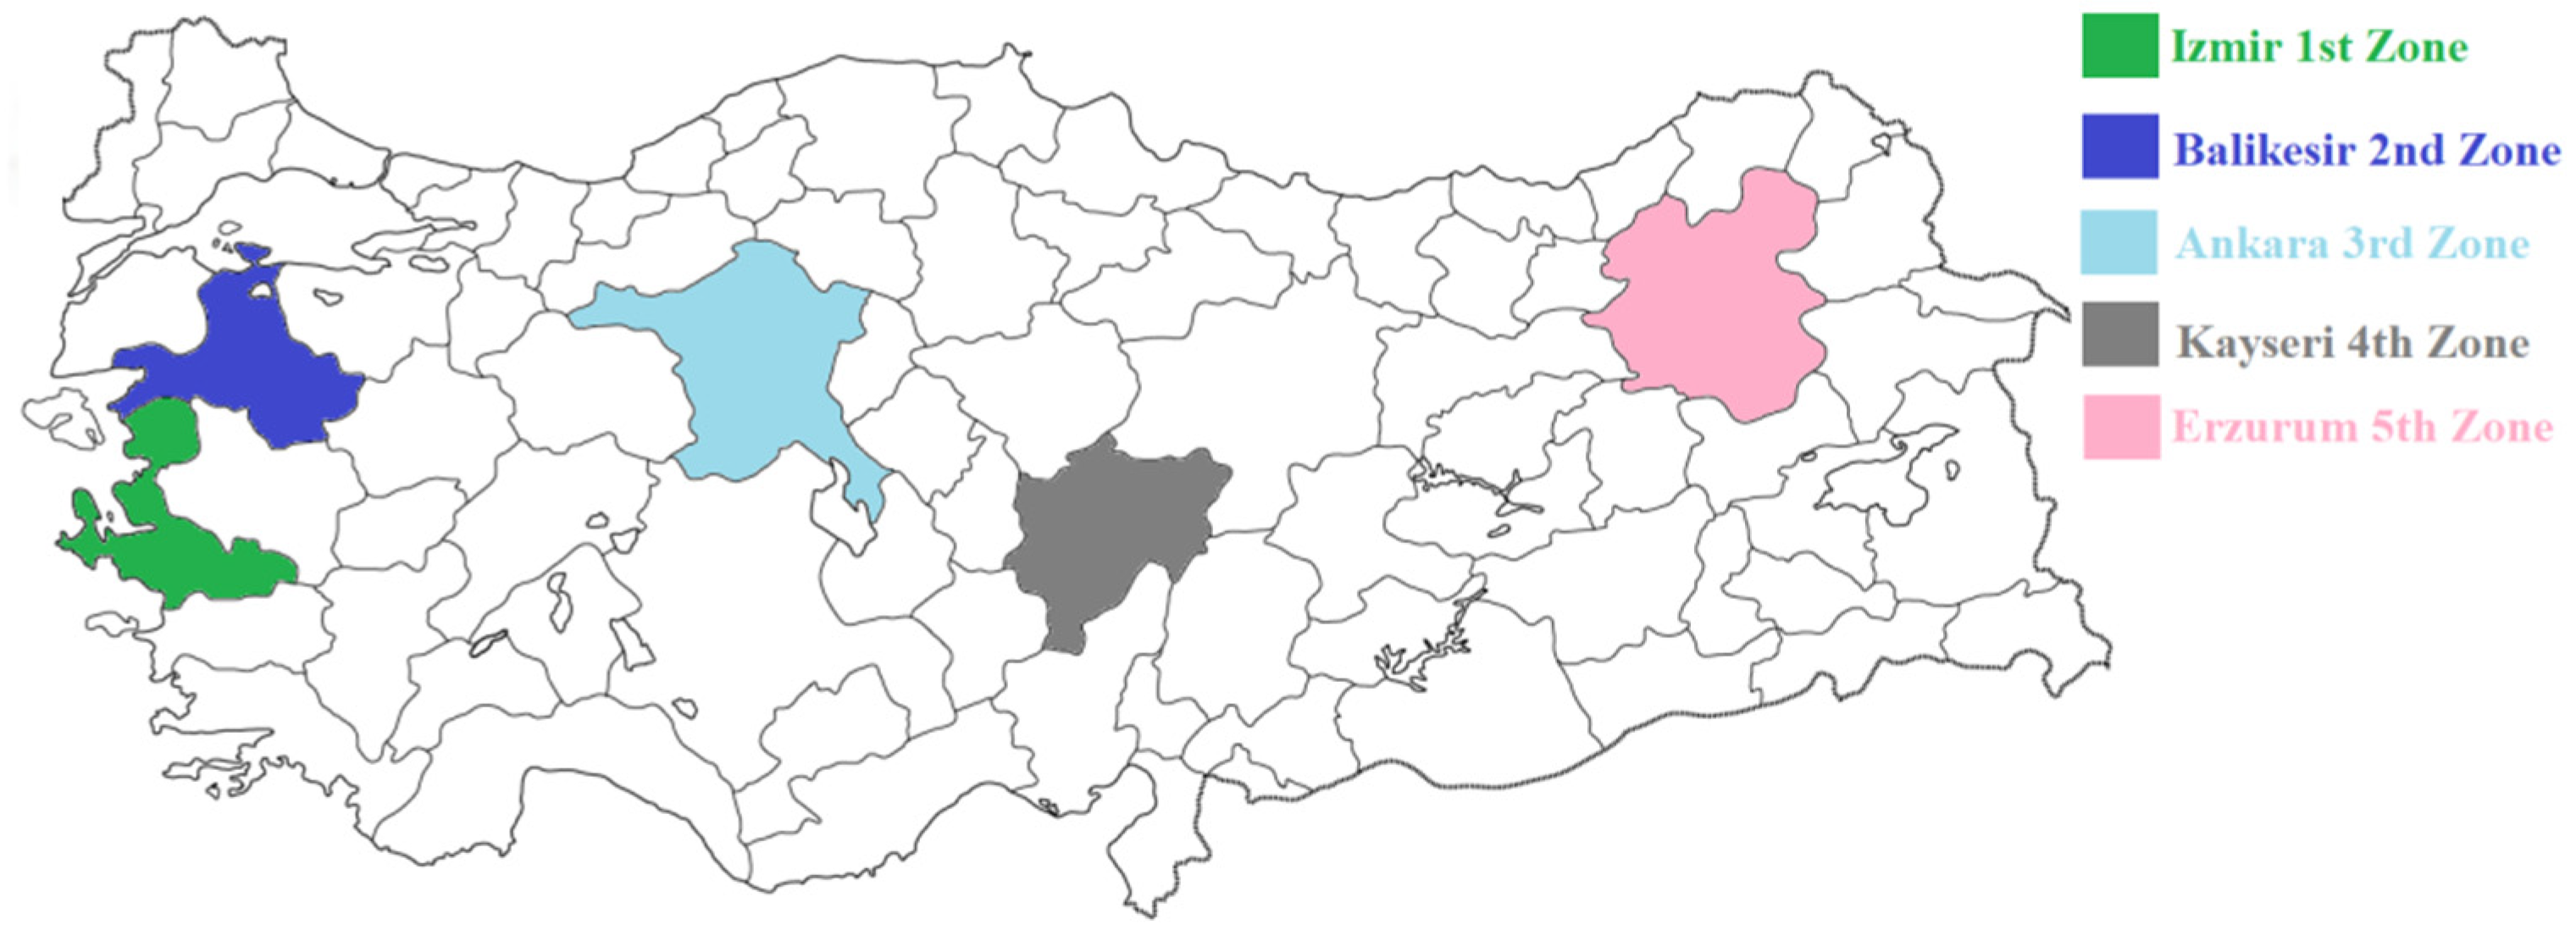
2.6. The Parameters Used in Calculations
3. Results and Discussion
4. Conclusions
Author Contributions
Funding
Informed Consent Statement
Conflicts of Interest
Nomenclature
| HDD | Heating degree-day |
| CDD | Cooling degree-day |
| T | Temperature (°C, K) |
| x | Insulation thickness (m) |
| Re | Reynold number |
| V | Air velocity (m/s) |
| l | Length (m) |
| ʋ | Kinematic viscosity (m2/s) |
| Nu | Nusselt number |
| Pr | Prandtl number |
| Gr | Grashof number |
| Ra | Raleigh number |
| ρ | Gravitational acceleration (9.81 m/s2) |
| ε | Emissivity |
| σ | Stefan-Boltzmann constant |
| (5.670 × 10⁻⁸ W⋅m−2⋅K−4) | |
| h | Heat transfer coefficient |
| Pv | Partial vapour pressure (Pa) |
| λ | Conduction heat transfer coefficient (W/m K) |
| q | Heat loss (W/m2) |
| U | Overall heat transfer coefficient (W/m2 °C) |
| β | Coefficient of valume expansion (1/K) |
| R | Thermal resistance (m2 K/W) |
| η | Heating system efficiency (%) |
| C | Cost ($) |
| COP | Cooling performance coefficient |
| XPS | Extruded Polystyrene |
| PWF | Present Worth Factor |
| i | Interest rate (%) |
| g | Inflation rate (%) |
| N | Life (year) |
| E | Annual energy load (kWh/m2) |
| r | Interest rate |
| Hu | Lower heating value (J/kg, J/m3, J/kWh) |
| Ω | Surface vapor permeability coefficient (kg/m2 h mmSS) |
| φ | Relative humidity (%) |
| µ | The water vapor diffusion resistance factor |
References
- Özer, N.; Özgünler, S.A. Yapılarda yaygın kullanılan ısı yalıtım malzemelerinin performans özelliklerinin duvar kesitleri üzerinde değerlendirilmesi. Uludağ Univ. J. Fac. Eng. 2019, 24, 25–48. [Google Scholar]
- Ziapour, B.M.; Rahimi, M.; Gendeshmin, M.Y. Thermoeconomic analysis for determining optimal insulation thickness for new composite prefabricated wall block as an external wall member in buildings. J. Build. Eng. 2020, 31, 101354. [Google Scholar] [CrossRef]
- Cuce, E.; Cuce, P.M.; Wood, C.J.; Riffat, S.B. Optimizing insulation thickness and analysing environmental impactsof aerogel-based thermal superinsulation in buildings. Energy Build. 2014, 77, 28–39. [Google Scholar] [CrossRef]
- Yamankaradeniz, N. Minimization of thermal insulation thickness taking into account condensation on external walls. Adv. Mech. Eng. 2015, 7, 1687814015604803. [Google Scholar] [CrossRef] [Green Version]
- Kaya, S.; Oğuz, M.E. Tesisat yalıtımında uygun malzeme seçimi. In Proceedings of the Ulusal Tesisat Kongresi Ve Sergisi (TESKON), Yalıtım Semineri, Izmir, Turkey, 8–11 April 2015; pp. 2483–2496. [Google Scholar]
- Ibrahim, M.; Biwole, P.H.; Achard, P.; Wurtz, E.; Ansart, G. Building envelope with a new aerogel-based insulating rendering: Experimental and numerical study, cost analysis, and thickness optimization. Appl. Energy 2015, 159, 490–501. [Google Scholar] [CrossRef]
- Dlimi, M.; Iken, O.; Agounoun, R.; Zoubir, A.; Kadiri, I.; Sbai, K. Energy performance and thickness optimization of hemp wool insulation and air cavity layers integrated in Moroccan building walls. Sustain. Prod. Consum. 2019, 20, 273–288. [Google Scholar] [CrossRef]
- Evangelisti, L.; Guattari, C.; Gori, P.; Bianchi, F. Heat transfer study of external convective and radiative coefficients for building applications. Energy Build. 2017, 151, 429–438. [Google Scholar] [CrossRef]
- Huang, H.; Zhou, Y.; Huang, R.; Wu, H.; Sun, Y.; Huang, G.; Xu, T. Optimum insulation thicknesses and energy conservation of building thermal insulation materials in Chinese zone of humid subtropical climate. Sustain. Cities Soc. 2020, 52, 101840. [Google Scholar] [CrossRef]
- Kurekci, N.A. Determination of optimum insulation thickness for building walls by using heating and cooling degree-day values of all Turkey’s provincial centers. Energy Build. 2016, 118, 197–213. [Google Scholar] [CrossRef]
- Tükel, M.; Tunçbilek, E.; Komerska, A.; Keskin, G.A.; Arıcı, M. Reclassification of climatic zones for building thermal regulations based on thermoeconomic analysis: A case study of Turkey. Energy Build. 2021, 246, 111121. [Google Scholar] [CrossRef]
- Ozel, M. Thermal, economical and environmental analysis of insulated building walls in a cold climate. Energy Convers. Manag. 2013, 76, 674–684. [Google Scholar] [CrossRef]
- Dombayci, A.Ö.; Gölcü, M.; Pancar, Y. Optimization of insulation thickness for external walls using different energy-sources. Appl. Energy 2006, 83, 921–928. [Google Scholar] [CrossRef]
- Alghoul, S.K.; Gwesha, A.O.; Naas, A.M. The effect of electricity price on saving energy transmitted from external building walls. Energy Res. J. 2016, 7, 1–9. [Google Scholar] [CrossRef] [Green Version]
- Uygunoğlu, T.; Keçebaş, A. LCC analysis for energy-saving in residential buildings with different types of construction masonry blocks. Energy Build. 2011, 43, 2077–2085. [Google Scholar] [CrossRef]
- Lopez-Arce, P.; Altamirano-Medina, H.; Berry, J.; Rovas, D.; Sarce, F.; Hodgson, S. Building moisture diagnosis: Processing, assessing and representation of environmental data for root cause analysis of mould growth. Build. Simul. 2020, 13, 999–1008. [Google Scholar] [CrossRef]
- Boroń, J.; Marszałek, K. Distribution of the temperature factor in terms of building envelope protection against mould growth. Technol. Trans. Civ. Eng. 2015, 1-B, 3–16. [Google Scholar] [CrossRef]
- Wang, R.; Ge, H.; Baril, D. Moisture-safe attic design in extremely cold climate: Hygrothermal simulations. Build. Environ. 2020, 182, 107166. [Google Scholar] [CrossRef]
- Cho, H.M.; Yang, S.; Wi, S.; Chang, S.J.; Kim, S. Hygrothermal and energy retrofit planning of masonry façade historic building used as museum and office: A cultural properties case study. Energy 2020, 201, 117607. [Google Scholar] [CrossRef]
- Arısoy, A. Nem alma sistemlerinde nem kazancının hesabı, IV. In Proceedings of the Ulusal Tesisat Mühendisliği Kongresi Ve Sergisi(TESKON), Izmir, Turkey, 4–7 November 1999; pp. 621–631. [Google Scholar]
- Kon, O.; Caner, I.; Arda, S. Investigation of using hemp as a thermal insulation material in the building envelope in terms of thermal comfort. In Proceedings of the 12th International Exergy, Energy and Environment Symposium (IEEES-12), Doha, Qatar, 20–24 December 2020; pp. 1–4. [Google Scholar]
- Lewandowski, M.W.; Lewandowska-Iwaniak, W. The external walls of a passive building: A classification and description of their thermal and optical properties. Energy Build. 2014, 69, 93–102. [Google Scholar] [CrossRef]
- Saafi, K.; Daouas, N. Energy and cost efficiency of phase change materials integrated in building envelopes under Tunisia Mediterranean climate. Energy 2019, 187, 115987. [Google Scholar] [CrossRef]
- Bruno, R.; Bevilacqua, P.; Ferraro, V.; Arcuri, N. Reflective thermal insulation in non-ventilated air-gaps: Experimentalmand theoretical evaluations on the global heat transfer coefficient. Energy Build. 2021, 236, 110769. [Google Scholar] [CrossRef]
- Mirsadeghi, M.; Cóstola, D.; Blocken, B.; Hensen, J.L.M. Review of external convective heat transfer coefficient models in building energy simulation programs: Implementation and uncertainty. Appl. Therm. Eng. 2013, 56, 134–151. [Google Scholar] [CrossRef]
- Joudi, A.; Svedung, H.; Bales, C.; Rönnelid, M. Highly reflective coatings for interior and exterior steel cladding and the energy efficiency of buildings. Appl. Energy 2011, 88, 4655–4666. [Google Scholar] [CrossRef]
- Evangelisti, L.; Guattari, C.; Asdrubali, F. On the sky temperature models and their influence on buildings energy performance: A critical review. Energy Build. 2019, 183, 607–662. [Google Scholar] [CrossRef]
- Li, M.; Jiang, Y.; Coimbra, C.F.M. On the determination of atmospheric longwave irradiance under all-sky conditions. Sol. Energy 2017, 144, 40–48. [Google Scholar] [CrossRef]
- Kon, O.; Caner, İ. Investigation of buildings with optimum insulation thickness depending on different external wall types and insulation materials in terms of mold and moisture risk. In Proceedings of the TÜBA World Conference on Energy Science and Technology (TÜBA WCEST—2021), Ankara, Turkey, 8–12 August 2021; pp. 92–93. [Google Scholar]
- Aydin, N.; Biyikoğlu, A. Determination of optimum insulation thickness by life cycle cost analysis for residential buildings in Turkey. Sci. Technol. Built Environ. 2021, 27, 2–13. [Google Scholar] [CrossRef]
- TS 825; Thermal Insulation Requirements for Buildings. Turkish Standard: Ankara, Turkey, 2013.
- Attia, S.; Shadmanfar, N.; Ricci, F. Developing two benchmark models for nearly zero energy schools. Appled Energy 2020, 263, 114614. [Google Scholar] [CrossRef] [Green Version]
- Cengel, Y.; Ghafar, A. Heat and Mass Transfer: Fundamentals and Applications; McGraw-Hill Higher Education: New York, NY, USA, 2014. [Google Scholar]
- Çengel, A.Y.; Boles, M.A.; Kanoğlu, M. An Engineering Approach Thermodynamics; McGraw-Hill Education: New York, NY, USA, 2019. [Google Scholar]
- Climate & Weather Datas. Available online: https://www.timeanddate.com (accessed on 1 October 2021).
- Degree Days Calculated Accurately for Locations Worldwide. Available online: https://www.degreedays.net (accessed on 2 October 2021).


| City | Dry Bulb Temperature (°C) | Relative Humidity (%) | Wind Speed (m/s) | Dew Point Temperature (°C) | Minimum Dry Bulb Temperature (°C) |
|---|---|---|---|---|---|
| Izmir | 17 | 61 | 3.61 | 9.4 | −8.2 |
| Balikesir | 15 | 66 | 1.94 | 8.7 | −10.5 |
| Ankara | 12 | 63 | 2.22 | 5.2 | −24.9 |
| Kayseri | 11 | 62 | 1.94 | 4.0 | −32.5 |
| Erzurum | 6 | 68 | 2.78 | 0.6 | −36.0 |
| City | Climate Zone | HDD19 | CDD22 |
|---|---|---|---|
| Izmir | 1 | 1630 | 721 |
| Balikesir | 2 | 2148 | 468 |
| Ankara | 3 | 3181 | 278 |
| Kayseri | 4 | 3299 | 266 |
| Erzurum | 5 | 4869 | 145 |
| Fuels | Cost | Lower Heating Value | Efficiency (%) |
|---|---|---|---|
| Heating | |||
| Natural Gas (NG) | 0.327 $/m3 | 34.518 kJ/m3 | 93 |
| Coal | 0.205 $/kg | 29.288 kJ/kg | 65 |
| Electricity | 0.121 $/kWh | 3.595 kJ/kWh | 99 |
| Cooling | |||
| Electricity | 0.121 $/kWh | --- | 2.5 (COP) |
| Insulation Materials | Heat Conduction Coefficient (W/m K) | Cost ($/m3) | |
| Hemp Wool | 0.040 | 100 | |
| Aerojel Blanket | 0.014 | 730 | |
| Extruded Polystyrene (XPS) | 0.035 | 110 | |
| Financial Values | |||
| Interest Rate (%) | 20.5 | ||
| İnflation Rate (%) | 17.1 | ||
| Wall Materials | ||
|---|---|---|
| Materials | Heat Conduction Coefficient (W/m K) | Thickness (m) |
| Block Bims 1 (650 kg/m3) | 0.238 | 0.135 |
| Block Bims 2 (550 kg/m3) | 0.214 | 0.150 |
| Block Bims 3 (500 kg/m3) | 0.199 | 0.190 |
| Block Bims 4 (400 kg/m3) | 0.150 | 0.250 |
| Hollow Brick (1000 kg/m3) | 0.450 | 0.135 |
| Aerated Concrete (500 kg/m3) | 0.150 | 0.150 |
| Cement Mortar Exterior Plaster (2000 kg/m3) | 1.600 | 0.030 |
| Lime Mortar Cement Mortar İnterior Plaster (1800 kg/m3) | 1.000 | 0.020 |
| Construction Materials | The Water Vapor Diffusion Resistance Factor (µ) |
|---|---|
| Hemp Wool | 1 |
| Aerogel Blanket | 5 |
| Extruded Polystyrene (XPS) | 80 |
| Block Bims-1 | 5 |
| Block Bims-2 | 5 |
| Block Bims-3 | 5 |
| Block Bims-4 | 5 |
| Hollow Brick | 5 |
| Aerated Concrete | 5 |
| Cement Mortar Exterior Plaster | 15 |
| Lime Mortar Cement Mortar İnterior Plaster | 15 |
| Wall Material | Hemp Wool-NG | Hemp Wool-Coal | Hemp Wool-Electricity | Aerogel Blanket-NG | Aerogel Blanket-Coal | Aerogel Blanket- Electricity | XPS-NG | XPS-Coal | XPS-Electricity |
|---|---|---|---|---|---|---|---|---|---|
| İzmir | |||||||||
| Block Bims-1 | 0.056 | 0.058 | 0.107 | 0.008 | 0.009 | 0.019 | 0.051 | 0.052 | 0.096 |
| Block Bims-2 | 0.051 | 0.053 | 0.102 | 0.006 | 0.007 | 0.018 | 0.046 | 0.048 | 0.091 |
| Block Bims-3 | 0.041 | 0.043 | 0.092 | 0.003 | 0.004 | 0.014 | 0.037 | 0.039 | 0.083 |
| Block Bims-4 | 0.013 | 0.014 | 0.063 | 0.000 | 0.000 | 0.004 | 0.013 | 0.014 | 0.058 |
| Hollow Birck | 0.067 | 0.069 | 0.118 | 0.012 | 0.012 | 0.023 | 0.060 | 0.062 | 0.105 |
| Aerated Concrete | 0.039 | 0.041 | 0.090 | 0.002 | 0.003 | 0.013 | 0.036 | 0.037 | 0.081 |
| Balikesir | |||||||||
| Block Bims-1 | 0.059 | 0.061 | 0.121 | 0.009 | 0.009 | 0.022 | 0.053 | 0.055 | 0.109 |
| Block Bims-2 | 0.054 | 0.056 | 0.116 | 0.007 | 0.008 | 0.021 | 0.049 | 0.051 | 0.104 |
| Block Bims-3 | 0.044 | 0.046 | 0.106 | 0.003 | 0.004 | 0.017 | 0.040 | 0.042 | 0.095 |
| Block Bims-4 | 0.015 | 0.017 | 0.077 | 0.000 | 0.000 | 0.007 | 0.015 | 0.017 | 0.070 |
| Hollow Birck | 0.070 | 0.072 | 0.132 | 0.013 | 0.013 | 0.026 | 0.063 | 0.065 | 0.118 |
| Aerated Concrete | 0.042 | 0.044 | 0.104 | 0.003 | 0.003 | 0.016 | 0.038 | 0.038 | 0.094 |
| Ankara | |||||||||
| Block Bims-1 | 0.072 | 0.074 | 0.150 | 0.012 | 0.012 | 0.029 | 0.064 | 0.067 | 0.135 |
| Block Bims-2 | 0.066 | 0.069 | 0.145 | 0.010 | 0.010 | 0.027 | 0.060 | 0.062 | 0.130 |
| Block Bims-3 | 0.056 | 0.059 | 0.134 | 0.006 | 0.007 | 0.023 | 0.051 | 0.053 | 0.121 |
| Block Bims-4 | 0.028 | 0.030 | 0.106 | 0.000 | 0.000 | 0.013 | 0.026 | 0.028 | 0.096 |
| Hollow Birck | 0.082 | 0.085 | 0.161 | 0.015 | 0.016 | 0.032 | 0.074 | 0.076 | 0.143 |
| Aerated Concrete | 0.054 | 0.057 | 0.133 | 0.006 | 0.006 | 0.023 | 0.049 | 0.052 | 0.119 |
| Kayseri | |||||||||
| Block Bims-1 | 0.073 | 0.076 | 0.153 | 0.012 | 0.012 | 0.029 | 0.066 | 0.068 | 0.137 |
| Block Bims-2 | 0.068 | 0.070 | 0.148 | 0.010 | 0.011 | 0.028 | 0.061 | 0.063 | 0.133 |
| Block Bims-3 | 0.058 | 0.060 | 0.138 | 0.006 | 0.007 | 0.023 | 0.052 | 0.055 | 0.124 |
| Block Bims-4 | 0.029 | 0.032 | 0.109 | 0.000 | 0.000 | 0.014 | 0.027 | 0.030 | 0.099 |
| Hollow Birck | 0.084 | 0.086 | 0.164 | 0.016 | 0.016 | 0.033 | 0.075 | 0.077 | 0.147 |
| Aerated Concrete | 0.056 | 0.058 | 0.136 | 0.006 | 0.006 | 0.023 | 0.051 | 0.053 | 0.122 |
| Erzurum | |||||||||
| Block Bims-1 | 0.092 | 0.096 | 0.192 | 0.016 | 0.017 | 0.038 | 0.083 | 0.086 | 0.171 |
| Block Bims-2 | 0.087 | 0.090 | 0.186 | 0.014 | 0.015 | 0.036 | 0.078 | 0.081 | 0.167 |
| Block Bims-3 | 0.077 | 0.080 | 0.176 | 0.011 | 0.011 | 0.032 | 0.069 | 0.072 | 0.158 |
| Block Bims-4 | 0.048 | 0.052 | 0.148 | 0.000 | 0.000 | 0.022 | 0.044 | 0.047 | 0.133 |
| Hollow Birck | 0.103 | 0.106 | 0.202 | 0.020 | 0.021 | 0.042 | 0.092 | 0.095 | 0.181 |
| Aerated Concrete | 0.075 | 0.078 | 0.174 | 0.010 | 0.011 | 0.032 | 0.068 | 0.071 | 0.160 |
Publisher’s Note: MDPI stays neutral with regard to jurisdictional claims in published maps and institutional affiliations. |
© 2022 by the authors. Licensee MDPI, Basel, Switzerland. This article is an open access article distributed under the terms and conditions of the Creative Commons Attribution (CC BY) license (https://creativecommons.org/licenses/by/4.0/).
Share and Cite
Kon, O.; Caner, İ. The Effect of External Wall Insulation on Mold and Moisture on the Buildings. Buildings 2022, 12, 521. https://doi.org/10.3390/buildings12050521
Kon O, Caner İ. The Effect of External Wall Insulation on Mold and Moisture on the Buildings. Buildings. 2022; 12(5):521. https://doi.org/10.3390/buildings12050521
Chicago/Turabian StyleKon, Okan, and İsmail Caner. 2022. "The Effect of External Wall Insulation on Mold and Moisture on the Buildings" Buildings 12, no. 5: 521. https://doi.org/10.3390/buildings12050521