
Experimental and Numerical Evaluation of Mechanically Stabilized Earth Wall with Deformed Steel Bars Embedded in Tire Shred-Sand Mixture

 , , ,
, , ,  and
and
Abstract
:1. Introduction
2. Methods
2.1. Experimental Work
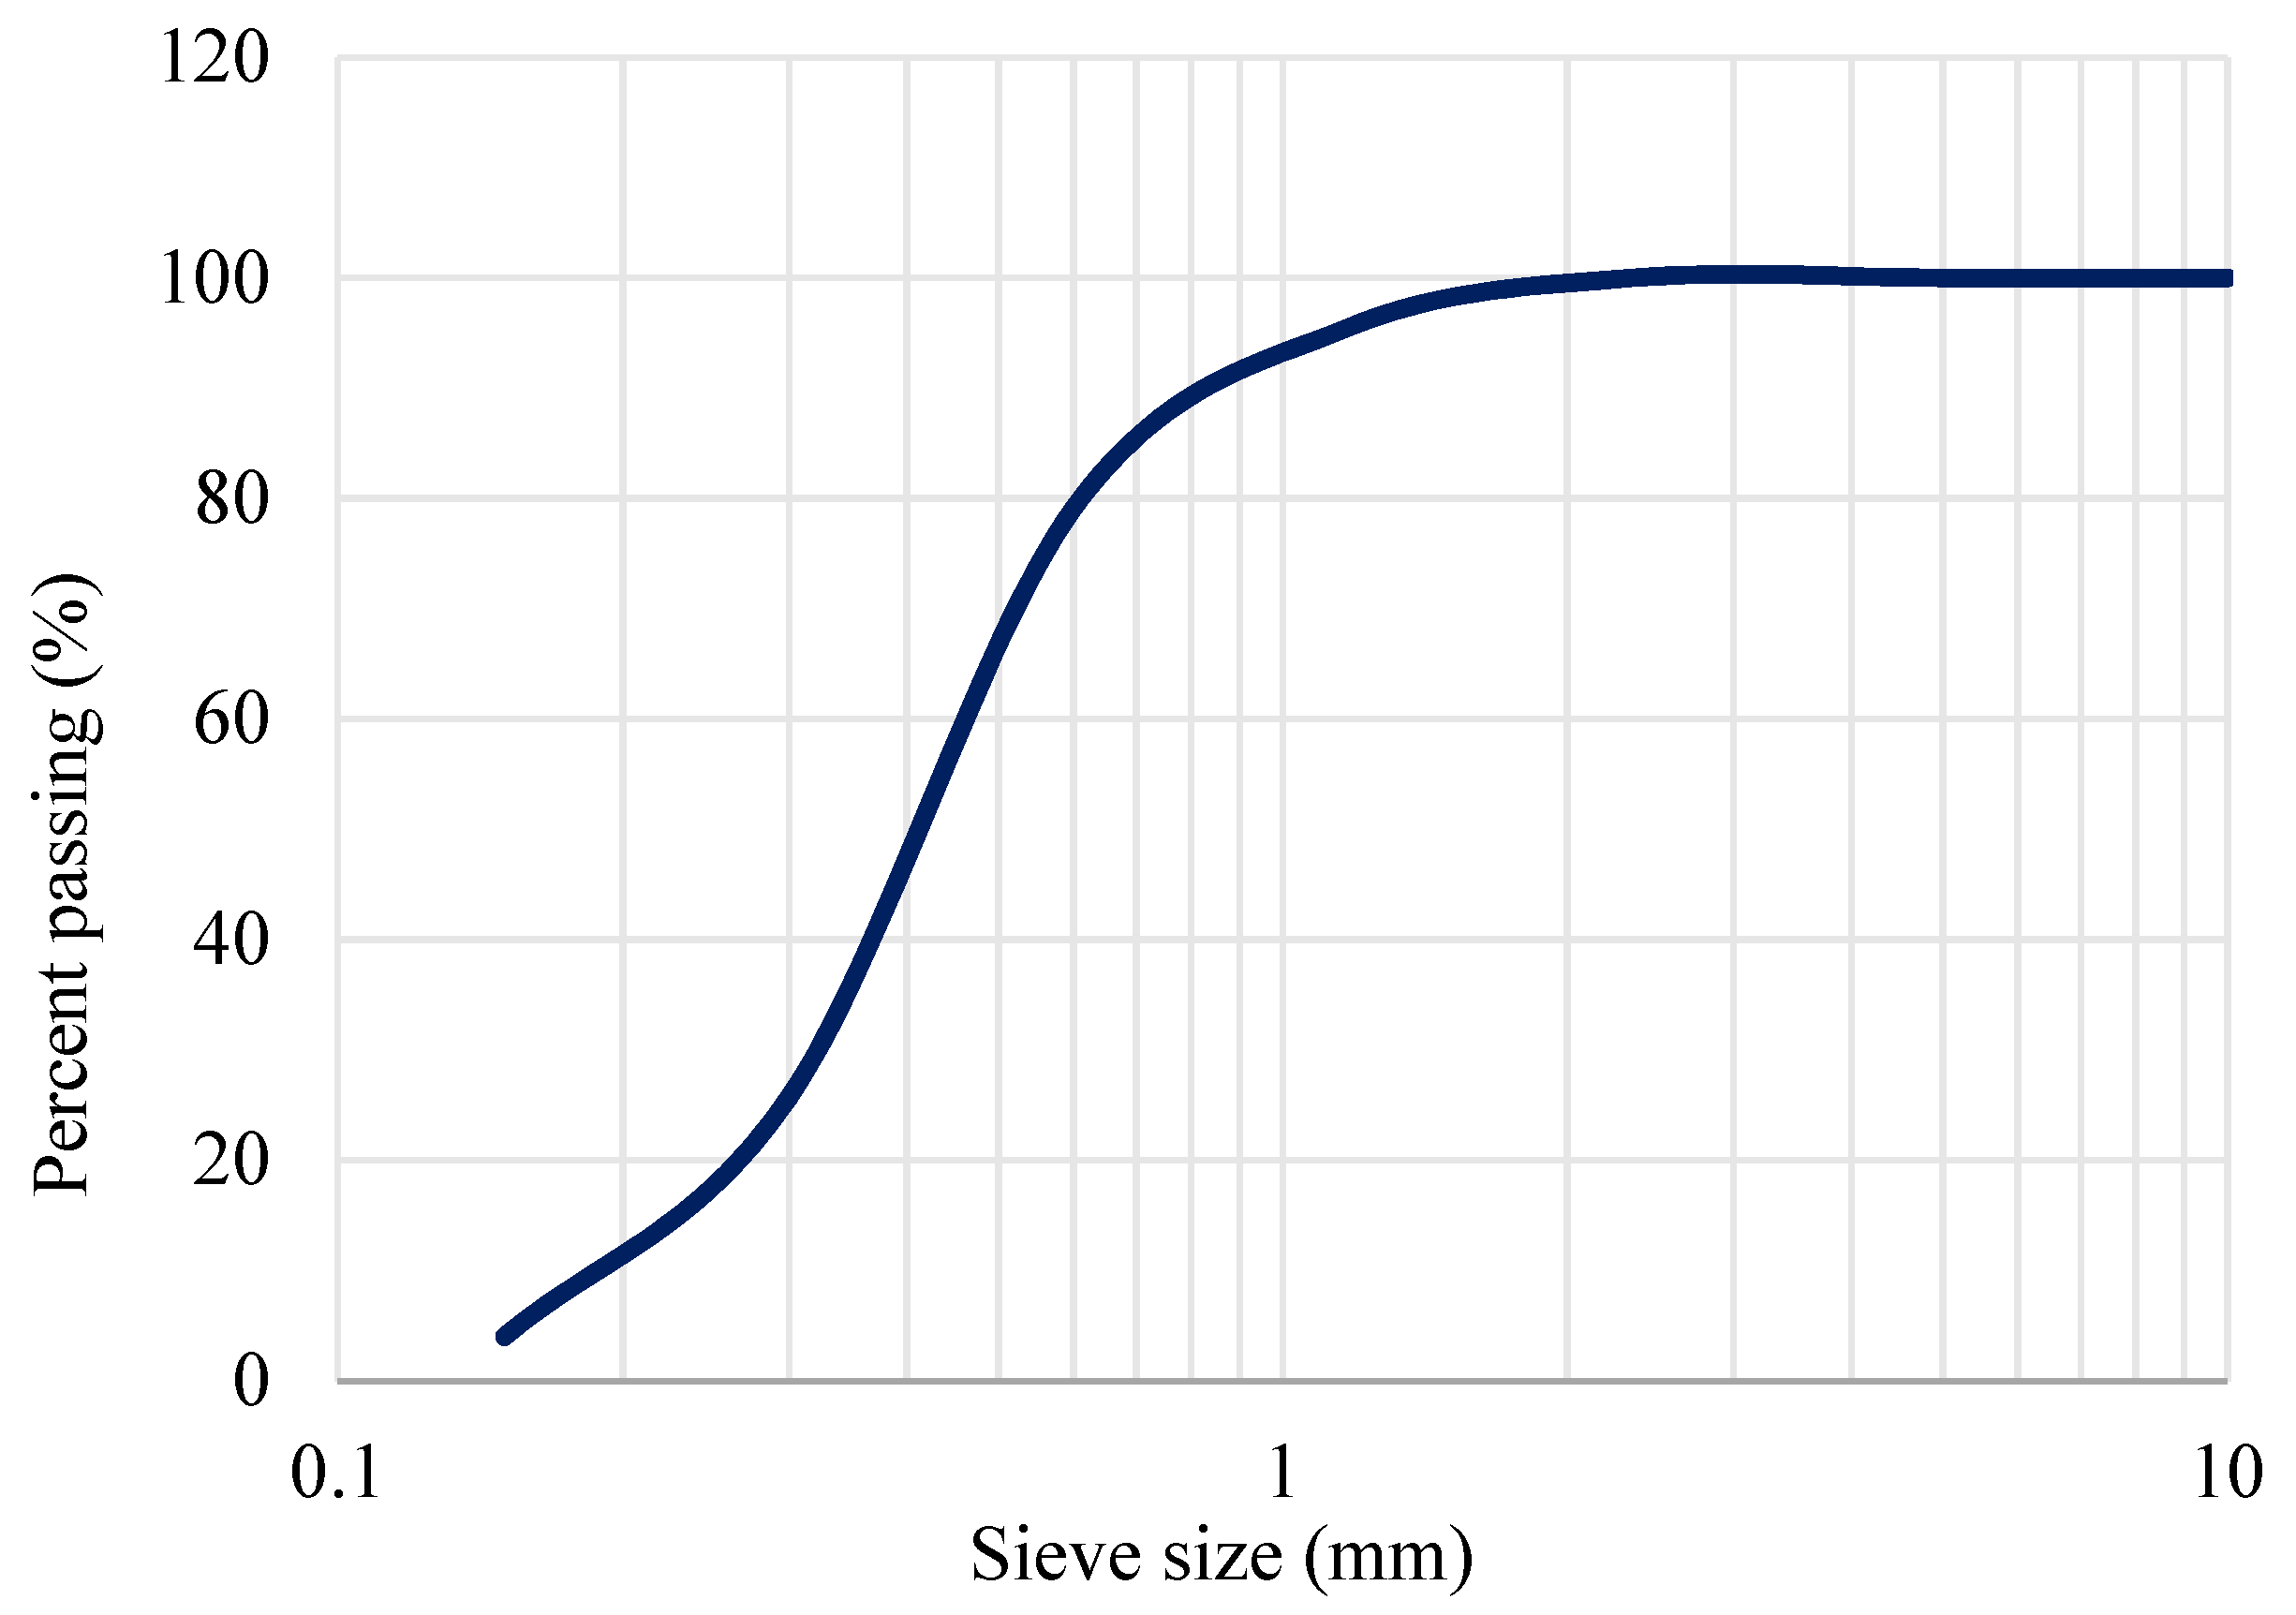
2.1.1. Materials Used
The Investigated Sand
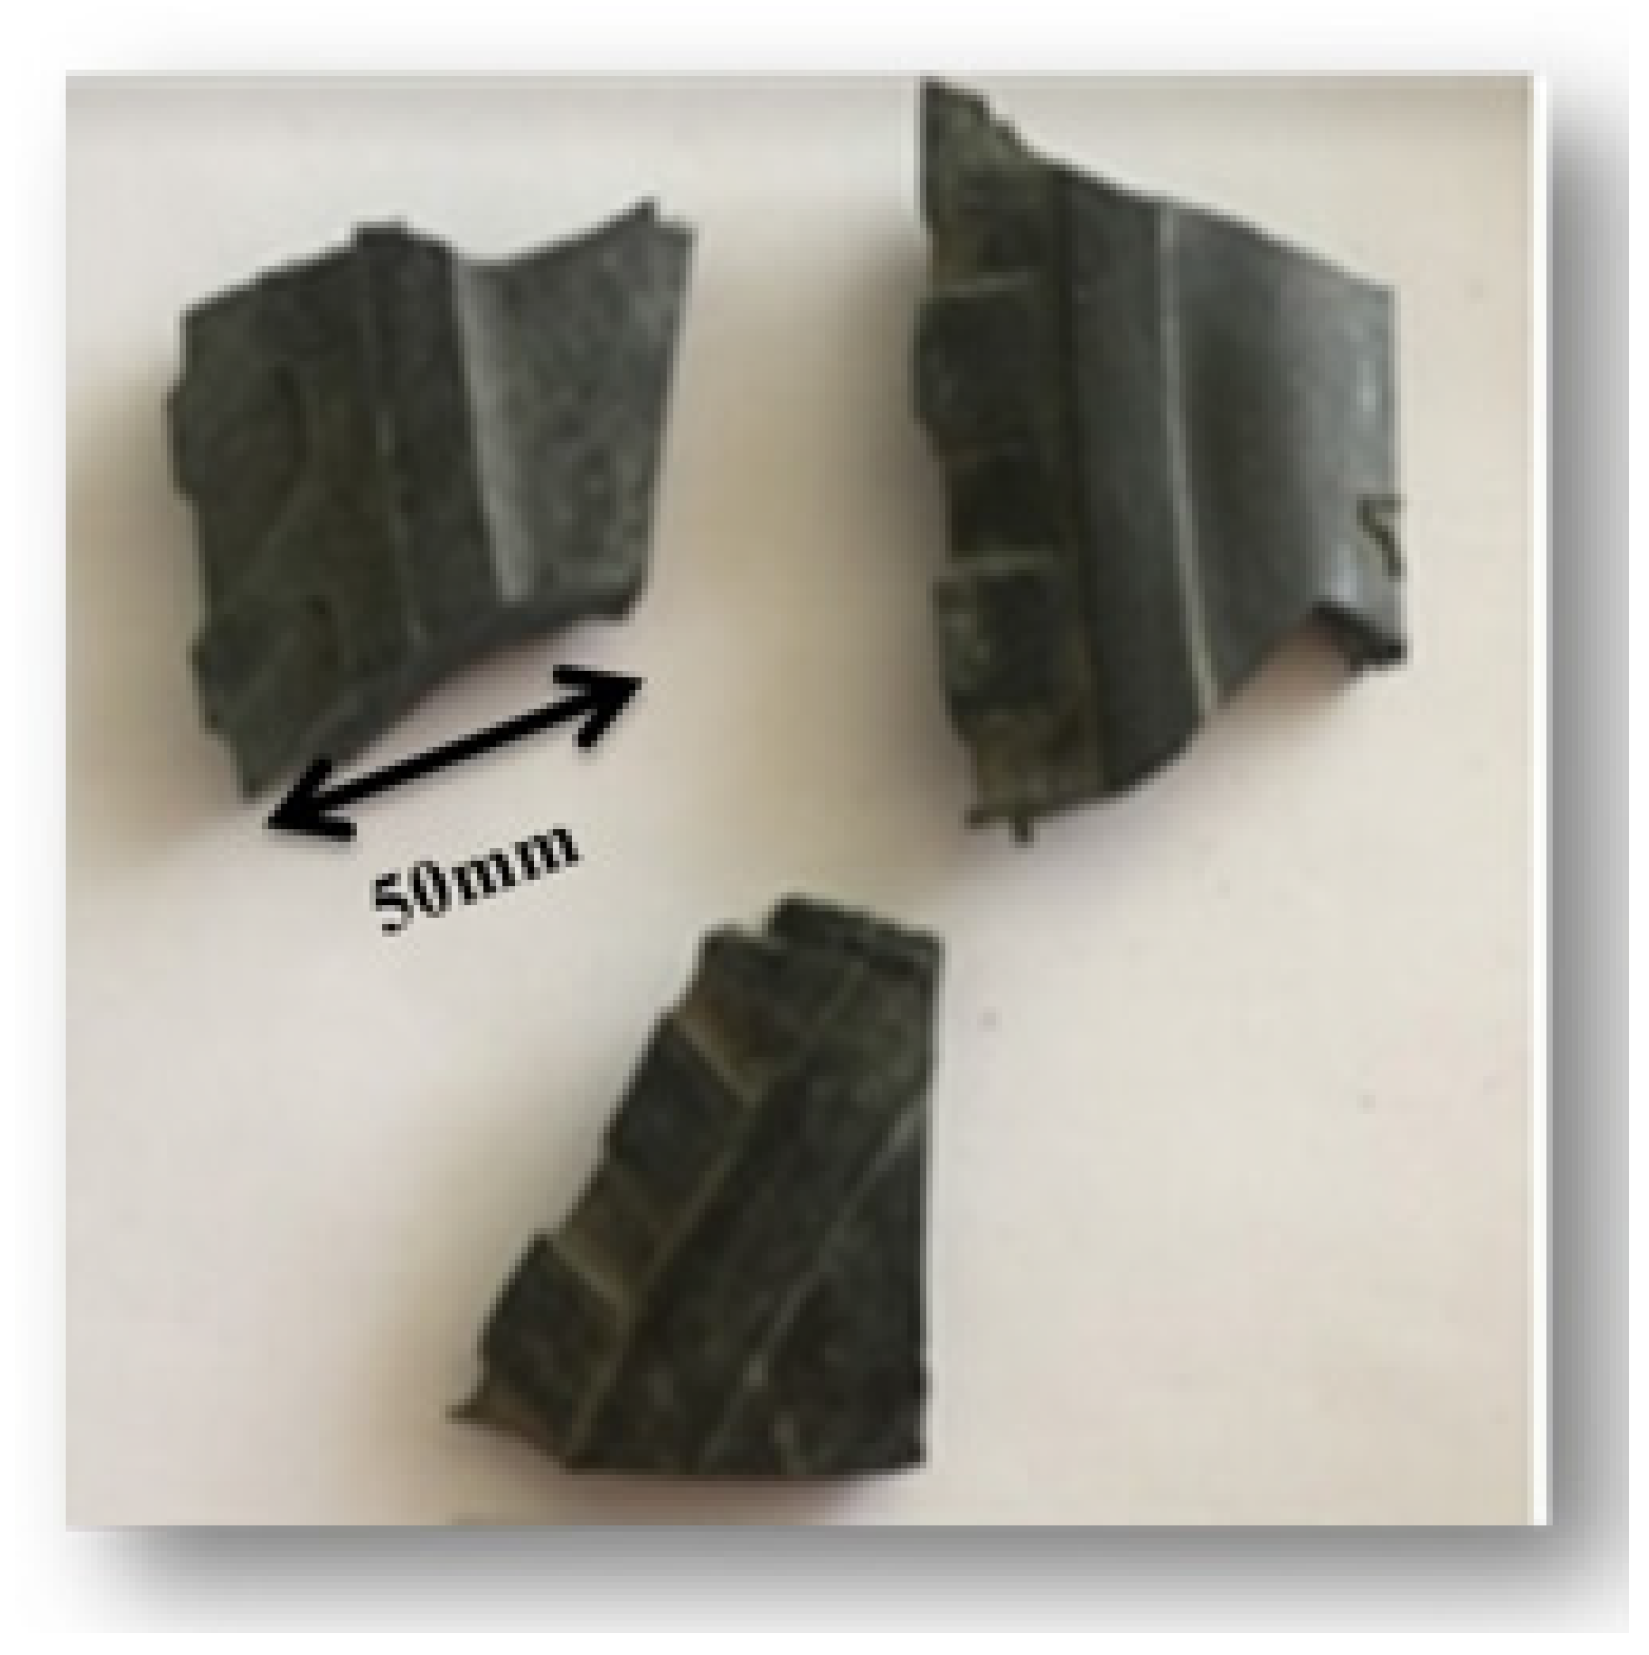
Tire Shreds
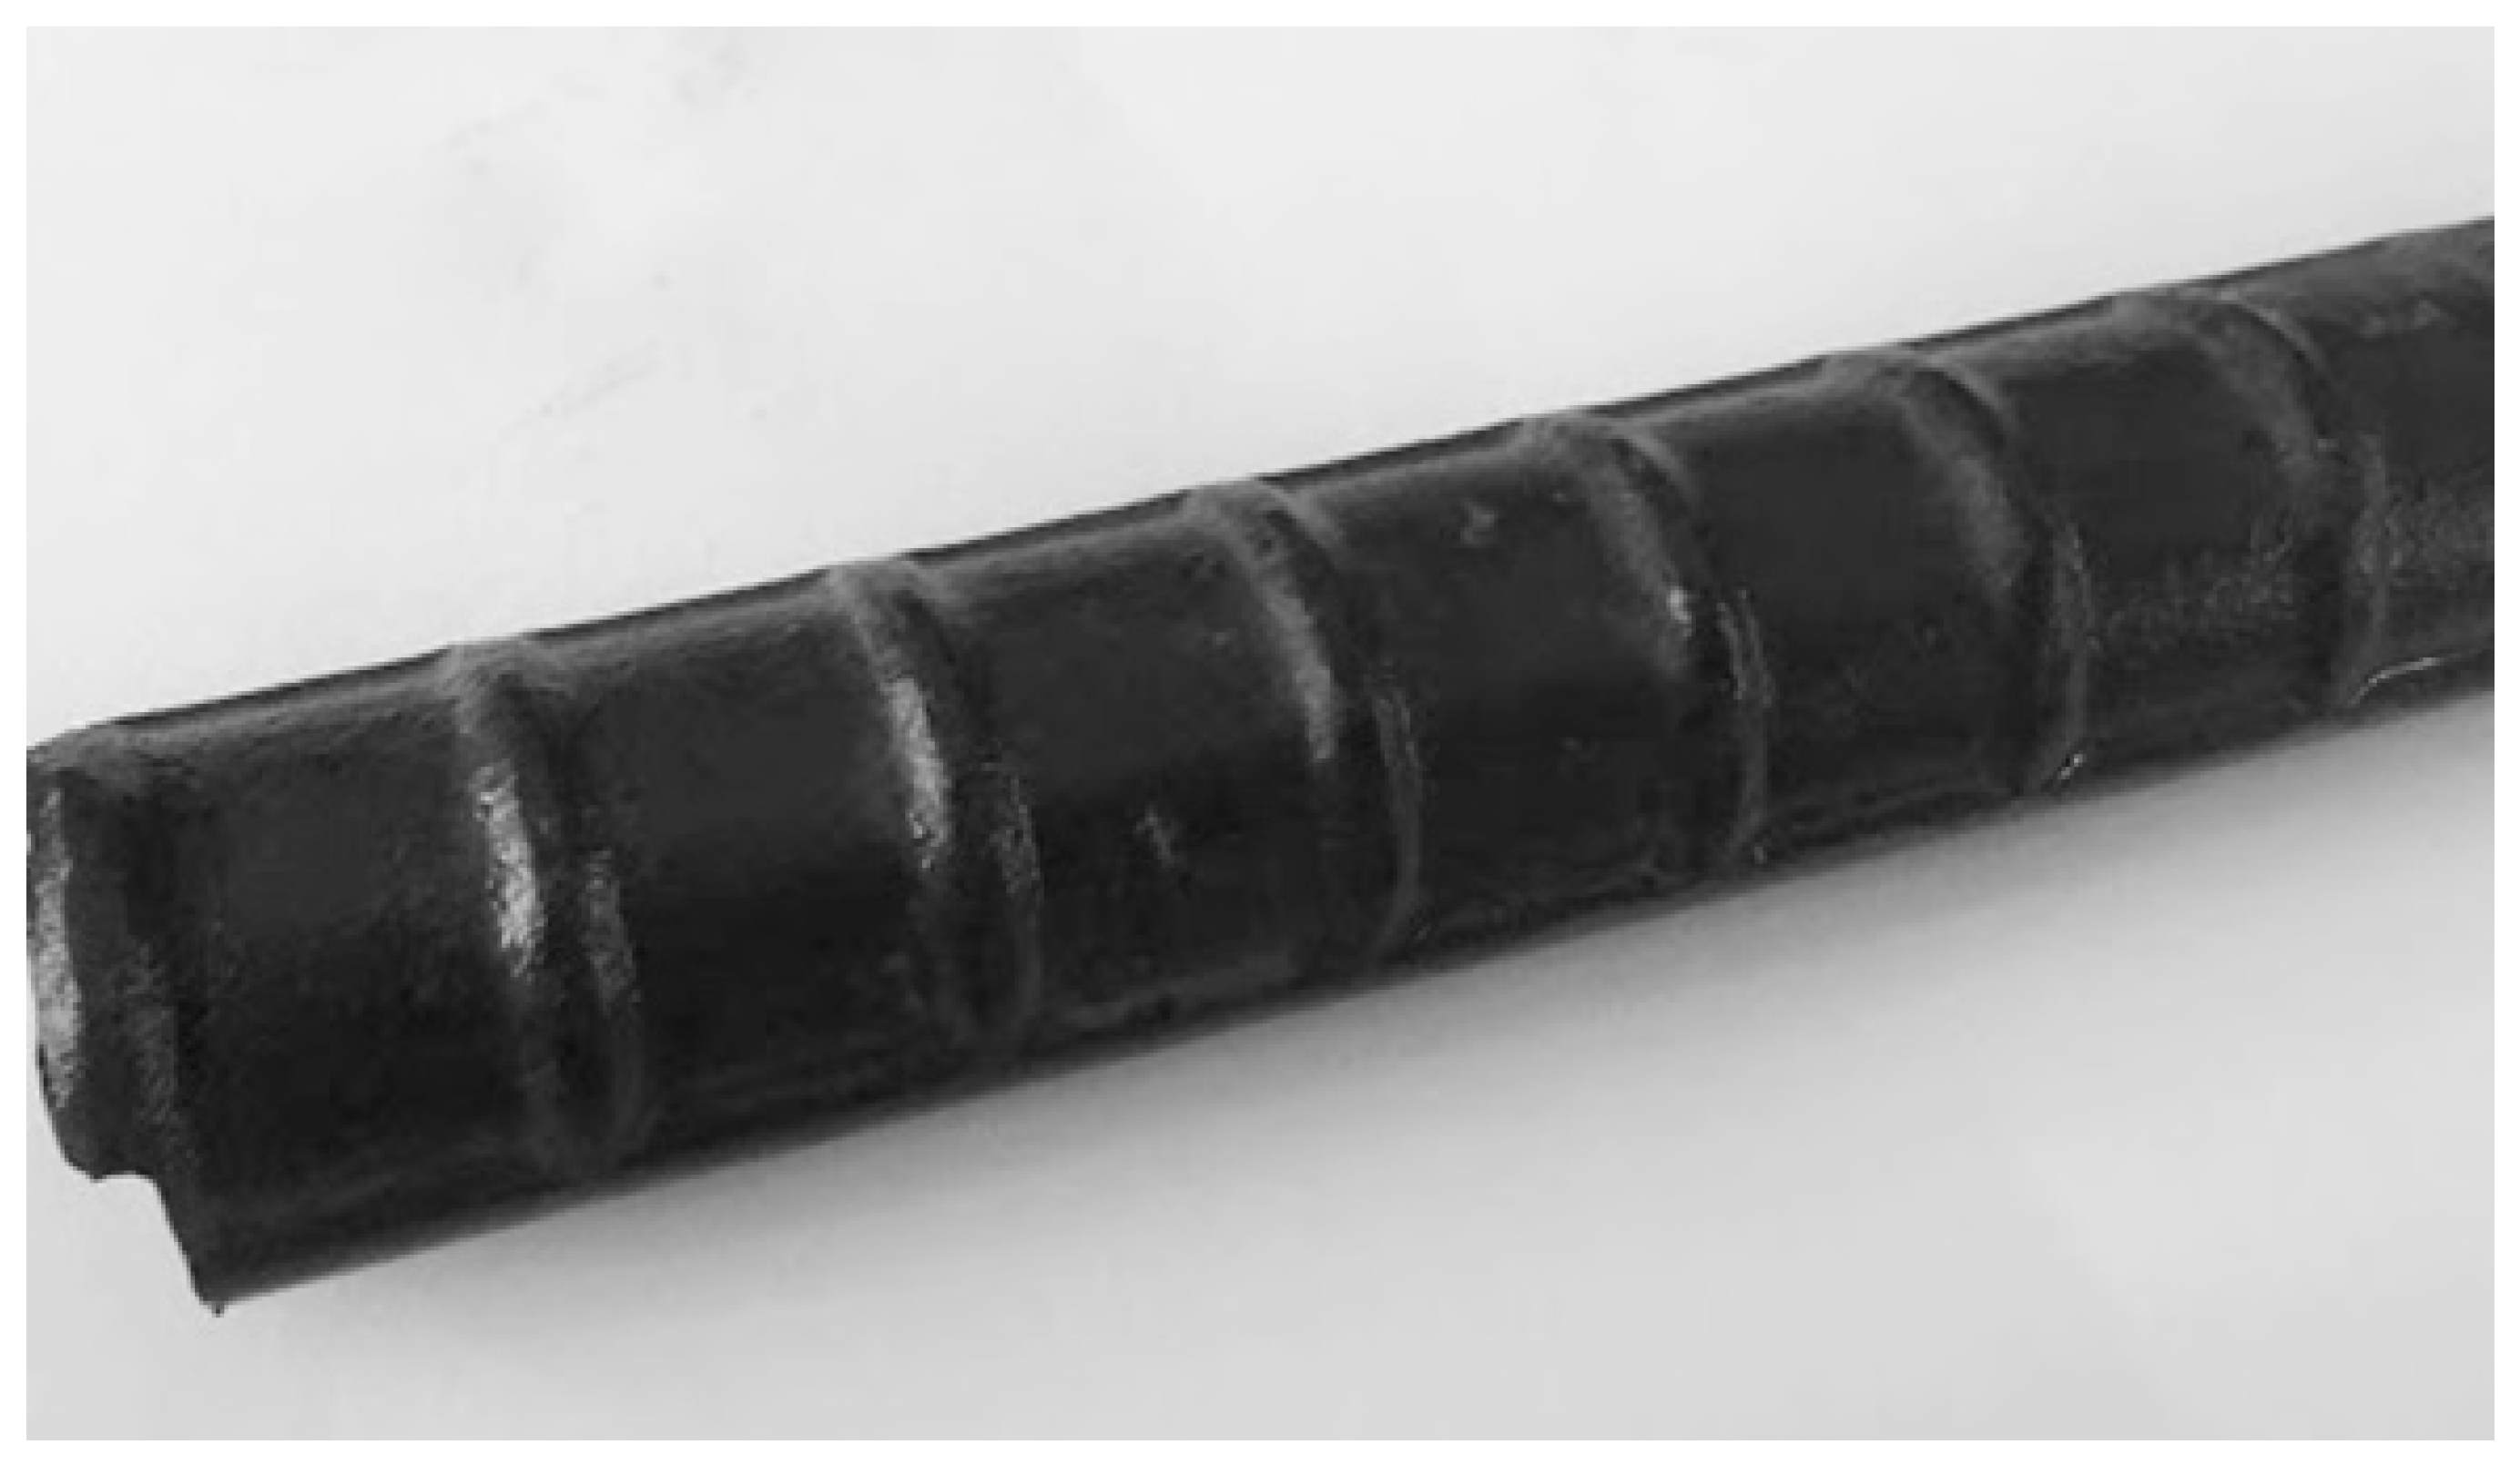
2.1.2. Deformed Steel Bars
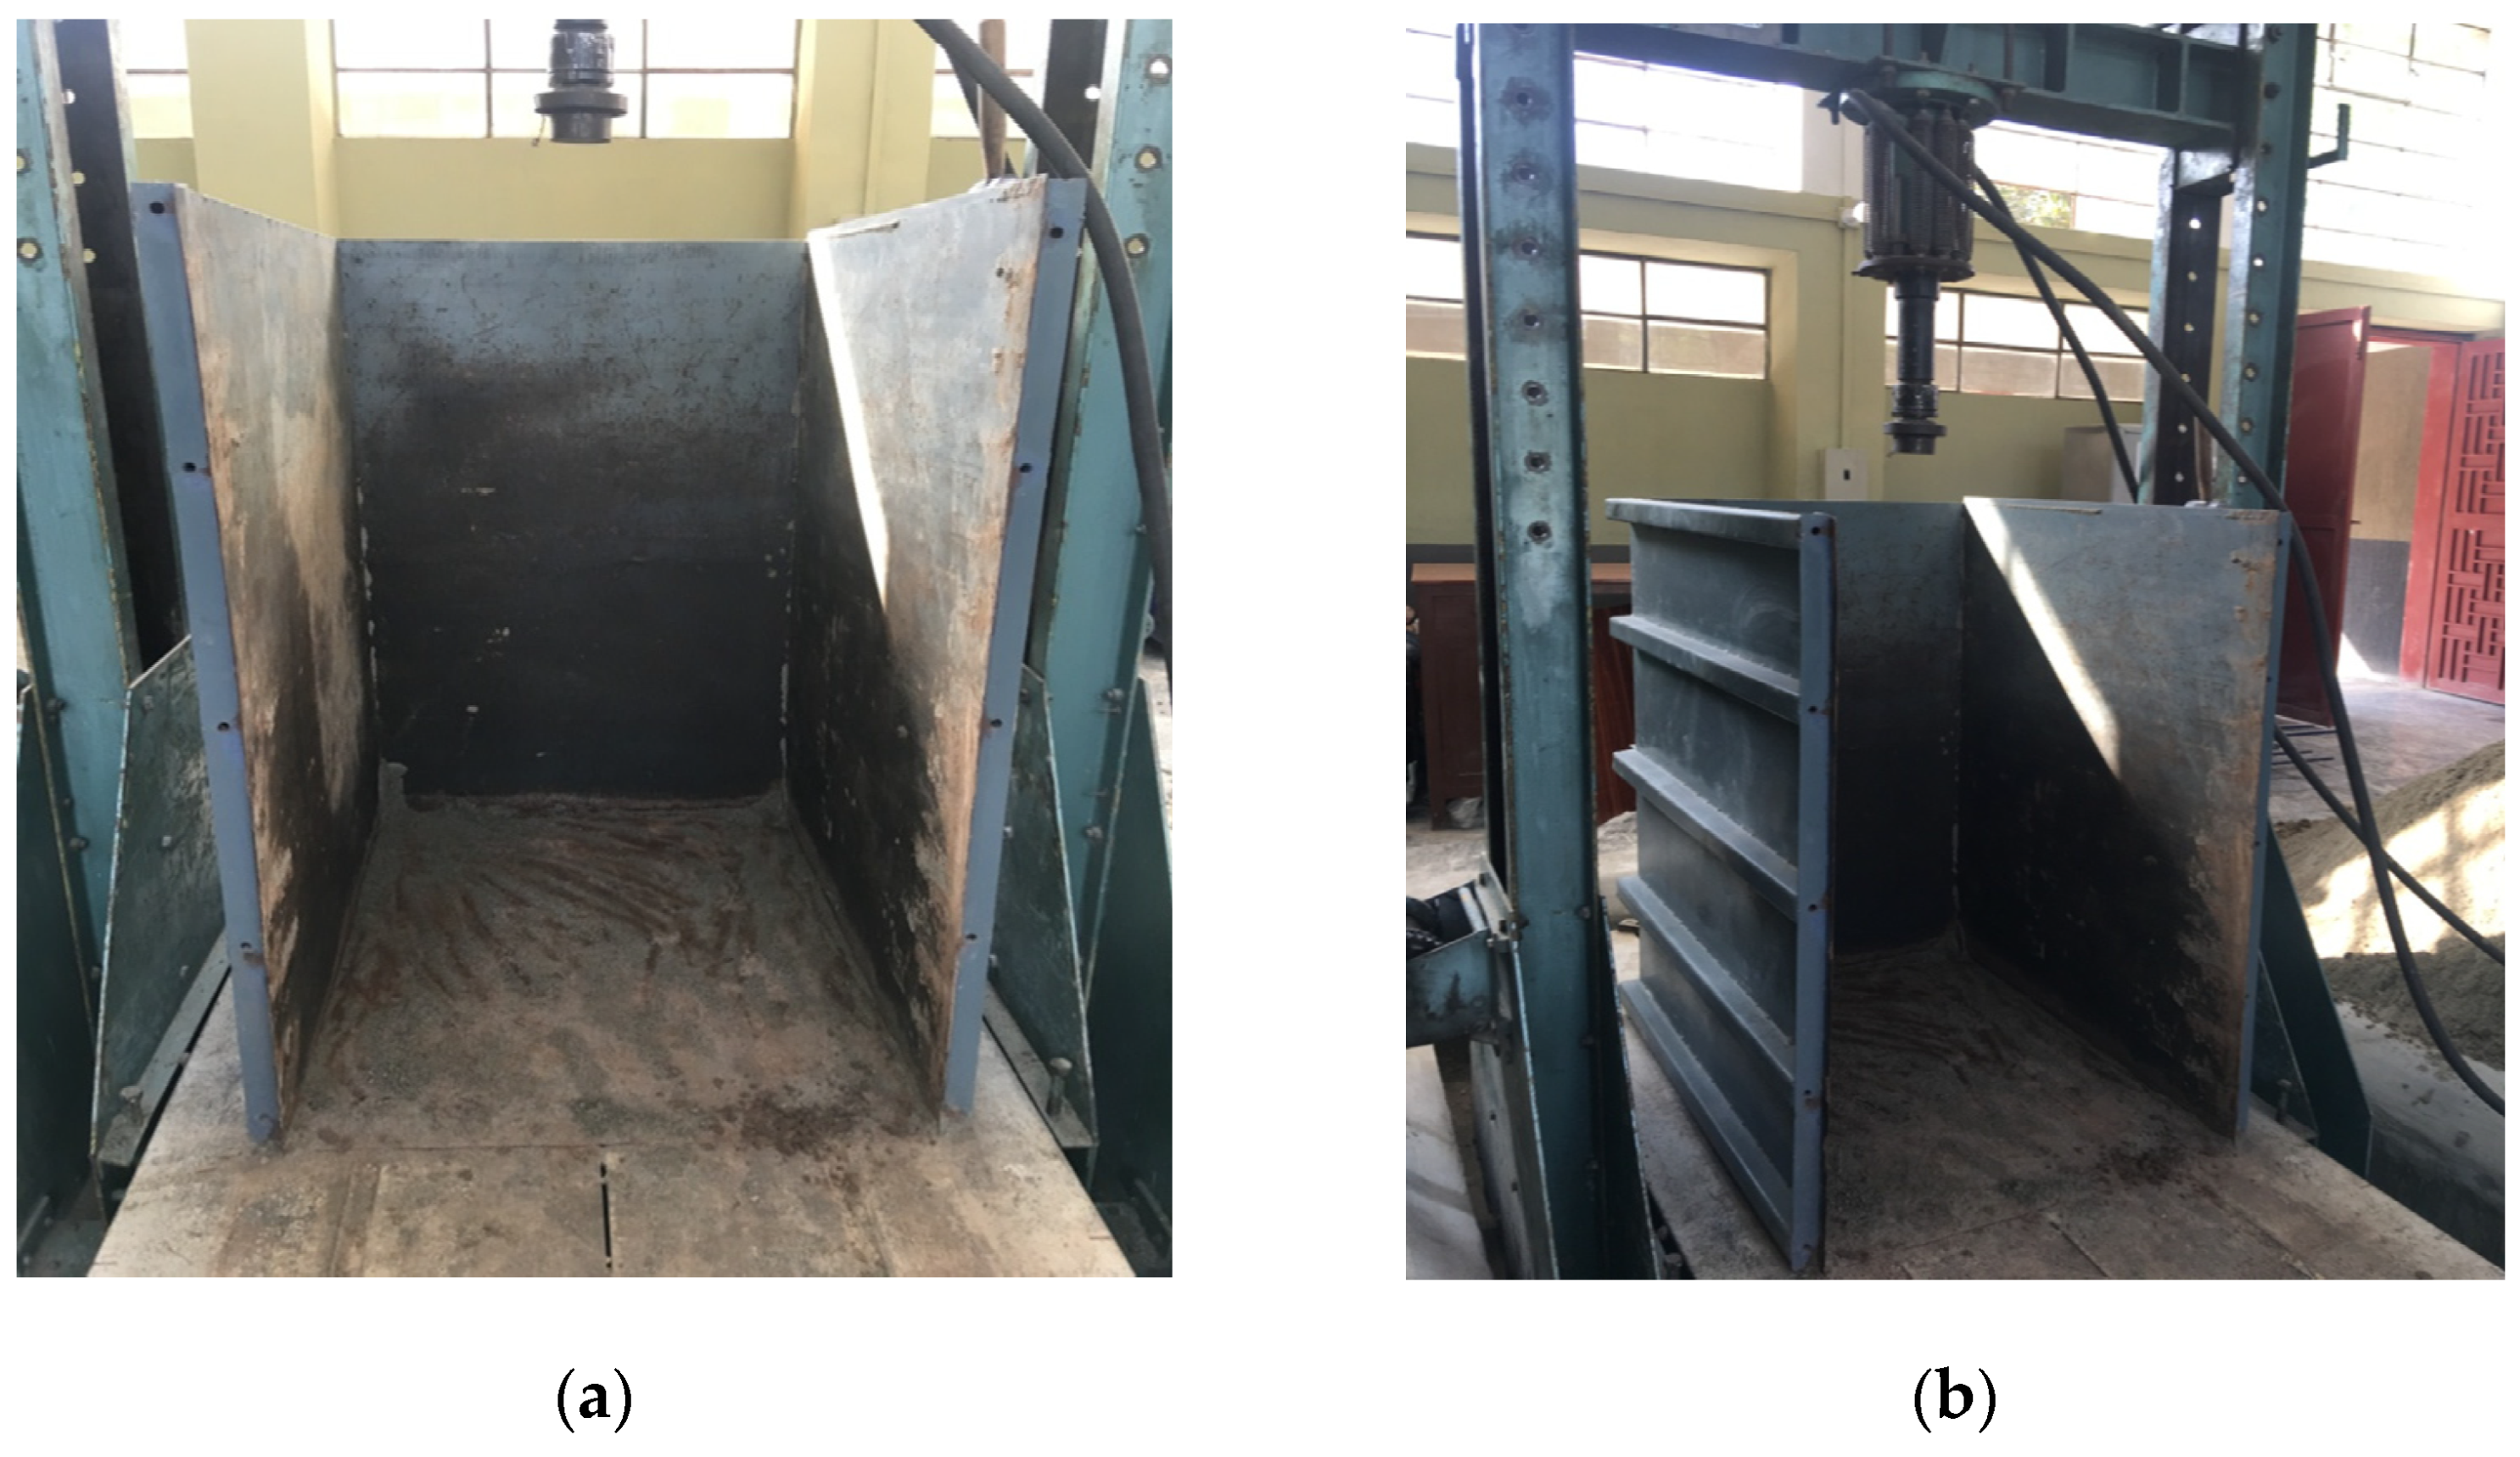
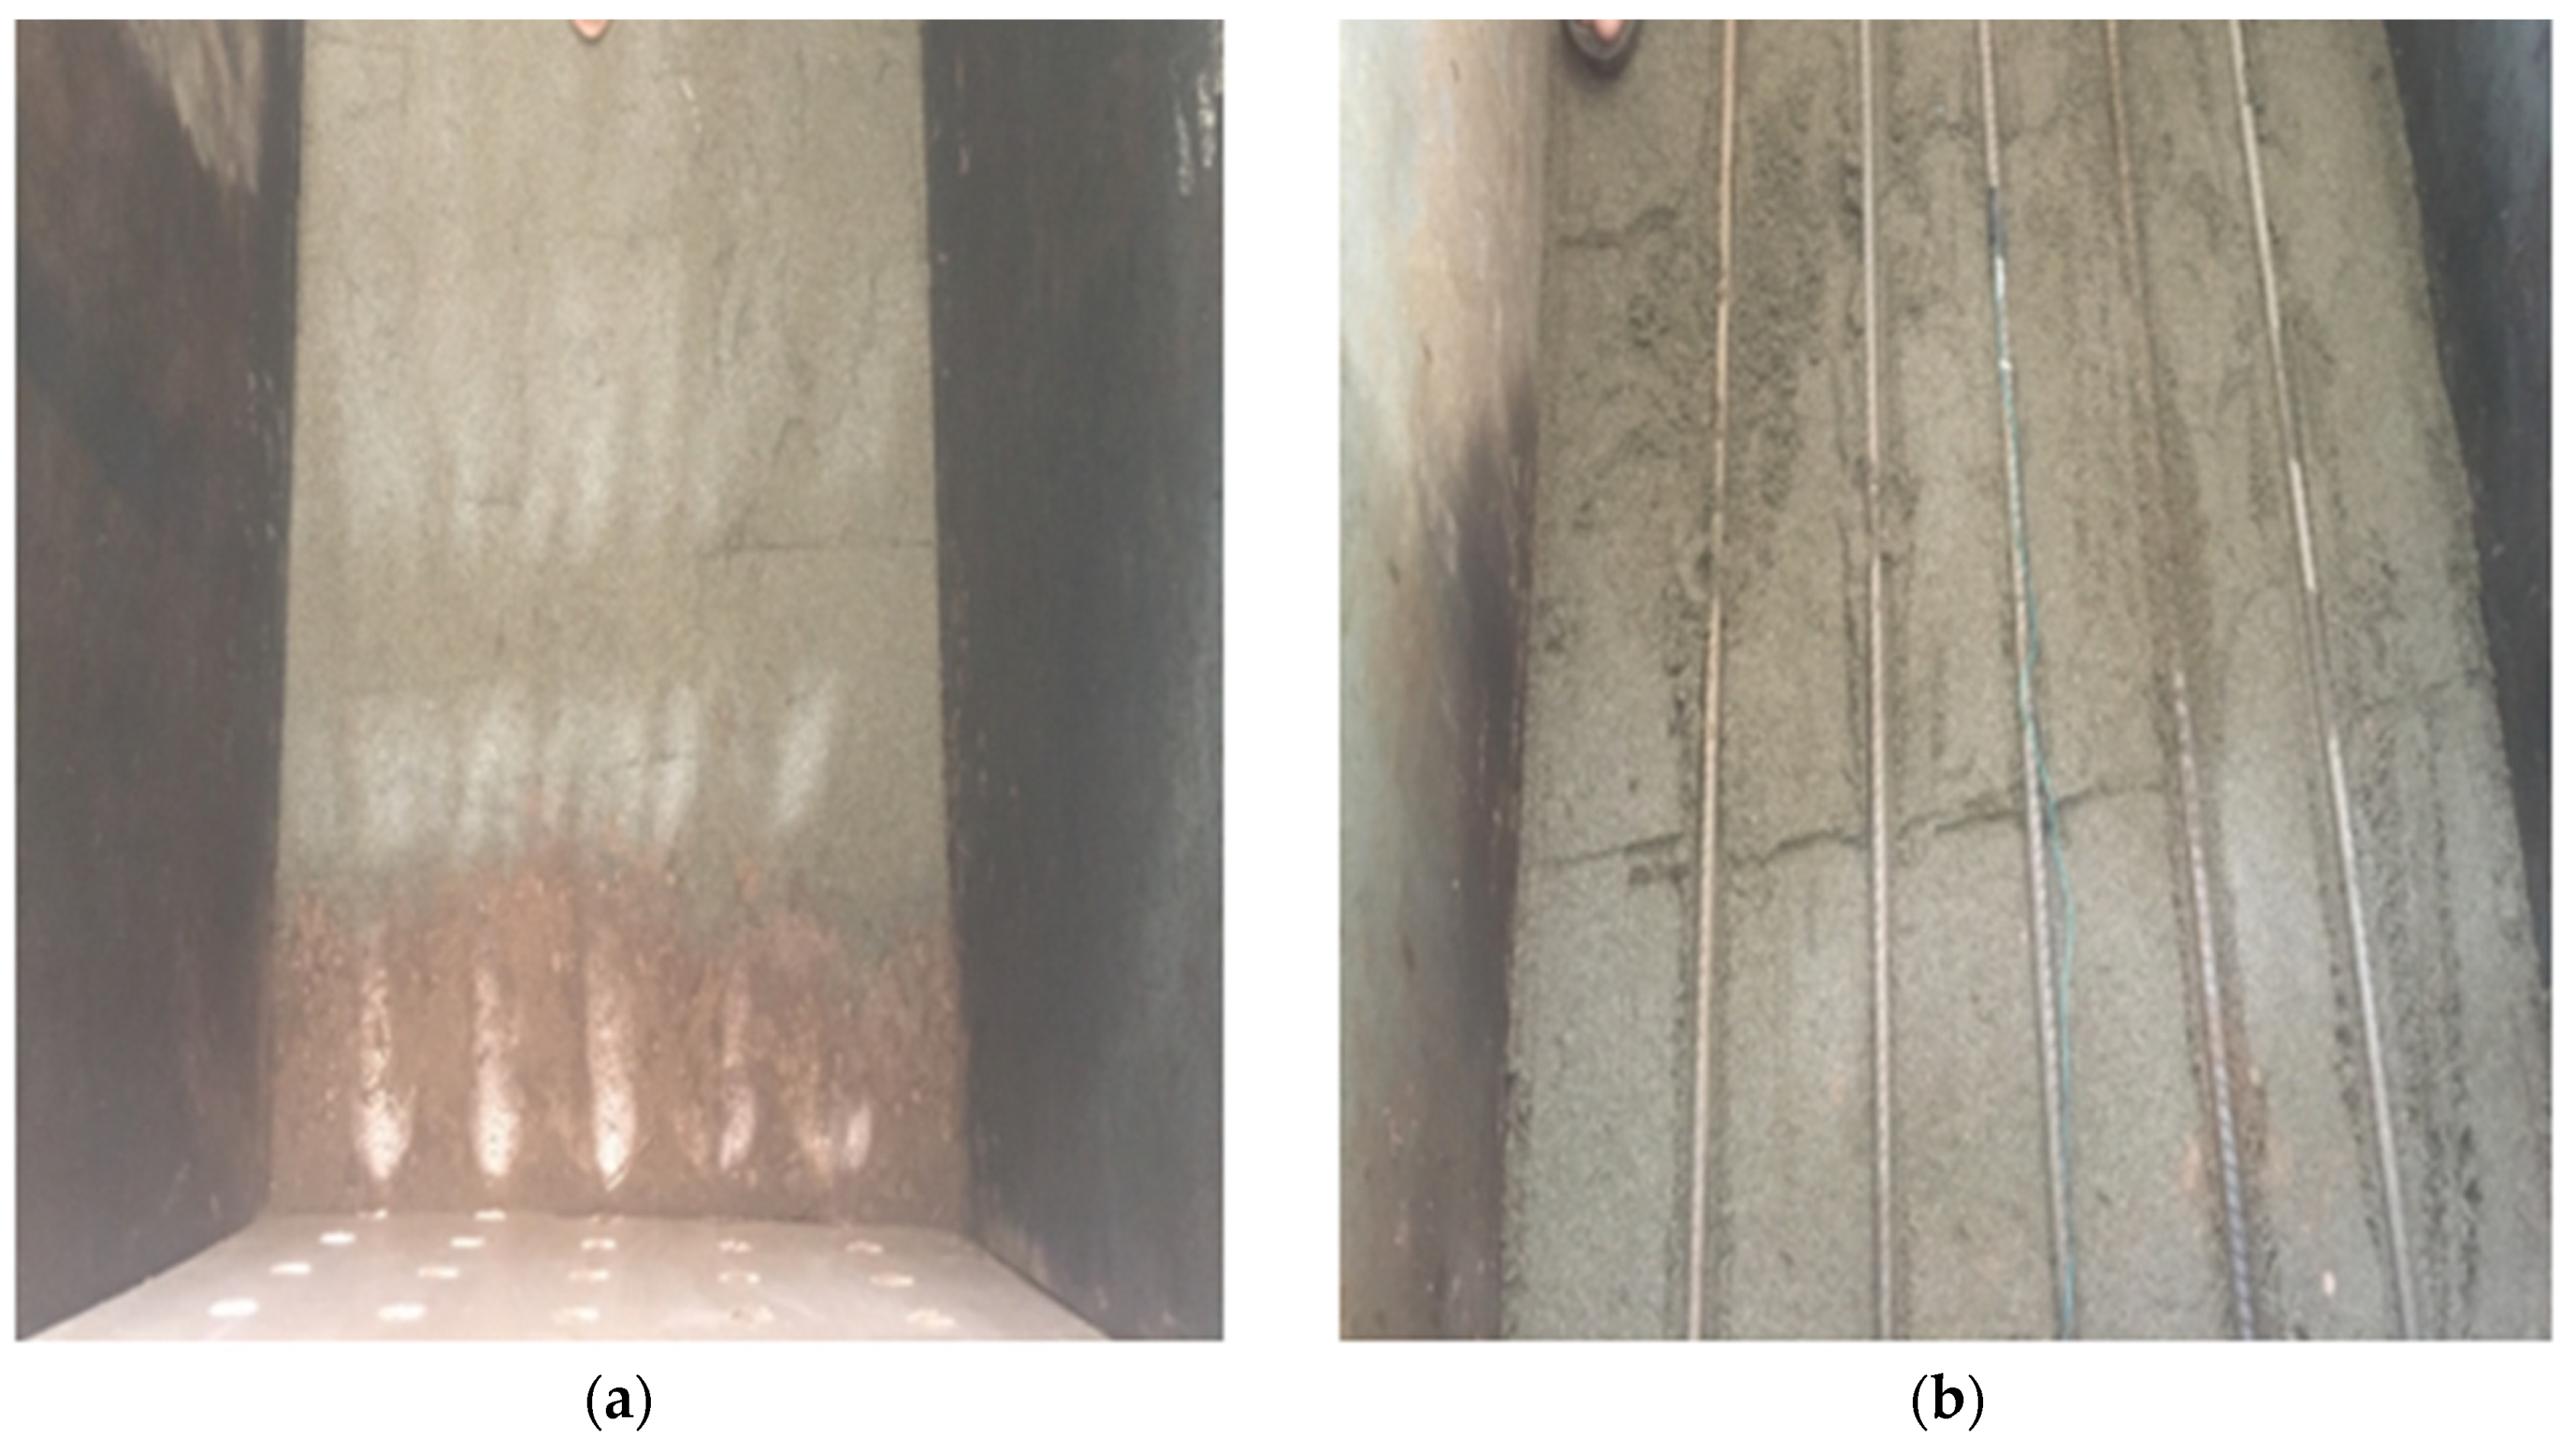
2.1.3. Physical Setup and Test Procedure
2.1.4. Backfilling of MSE Wall
2.1.5. Instrumentation of the Model
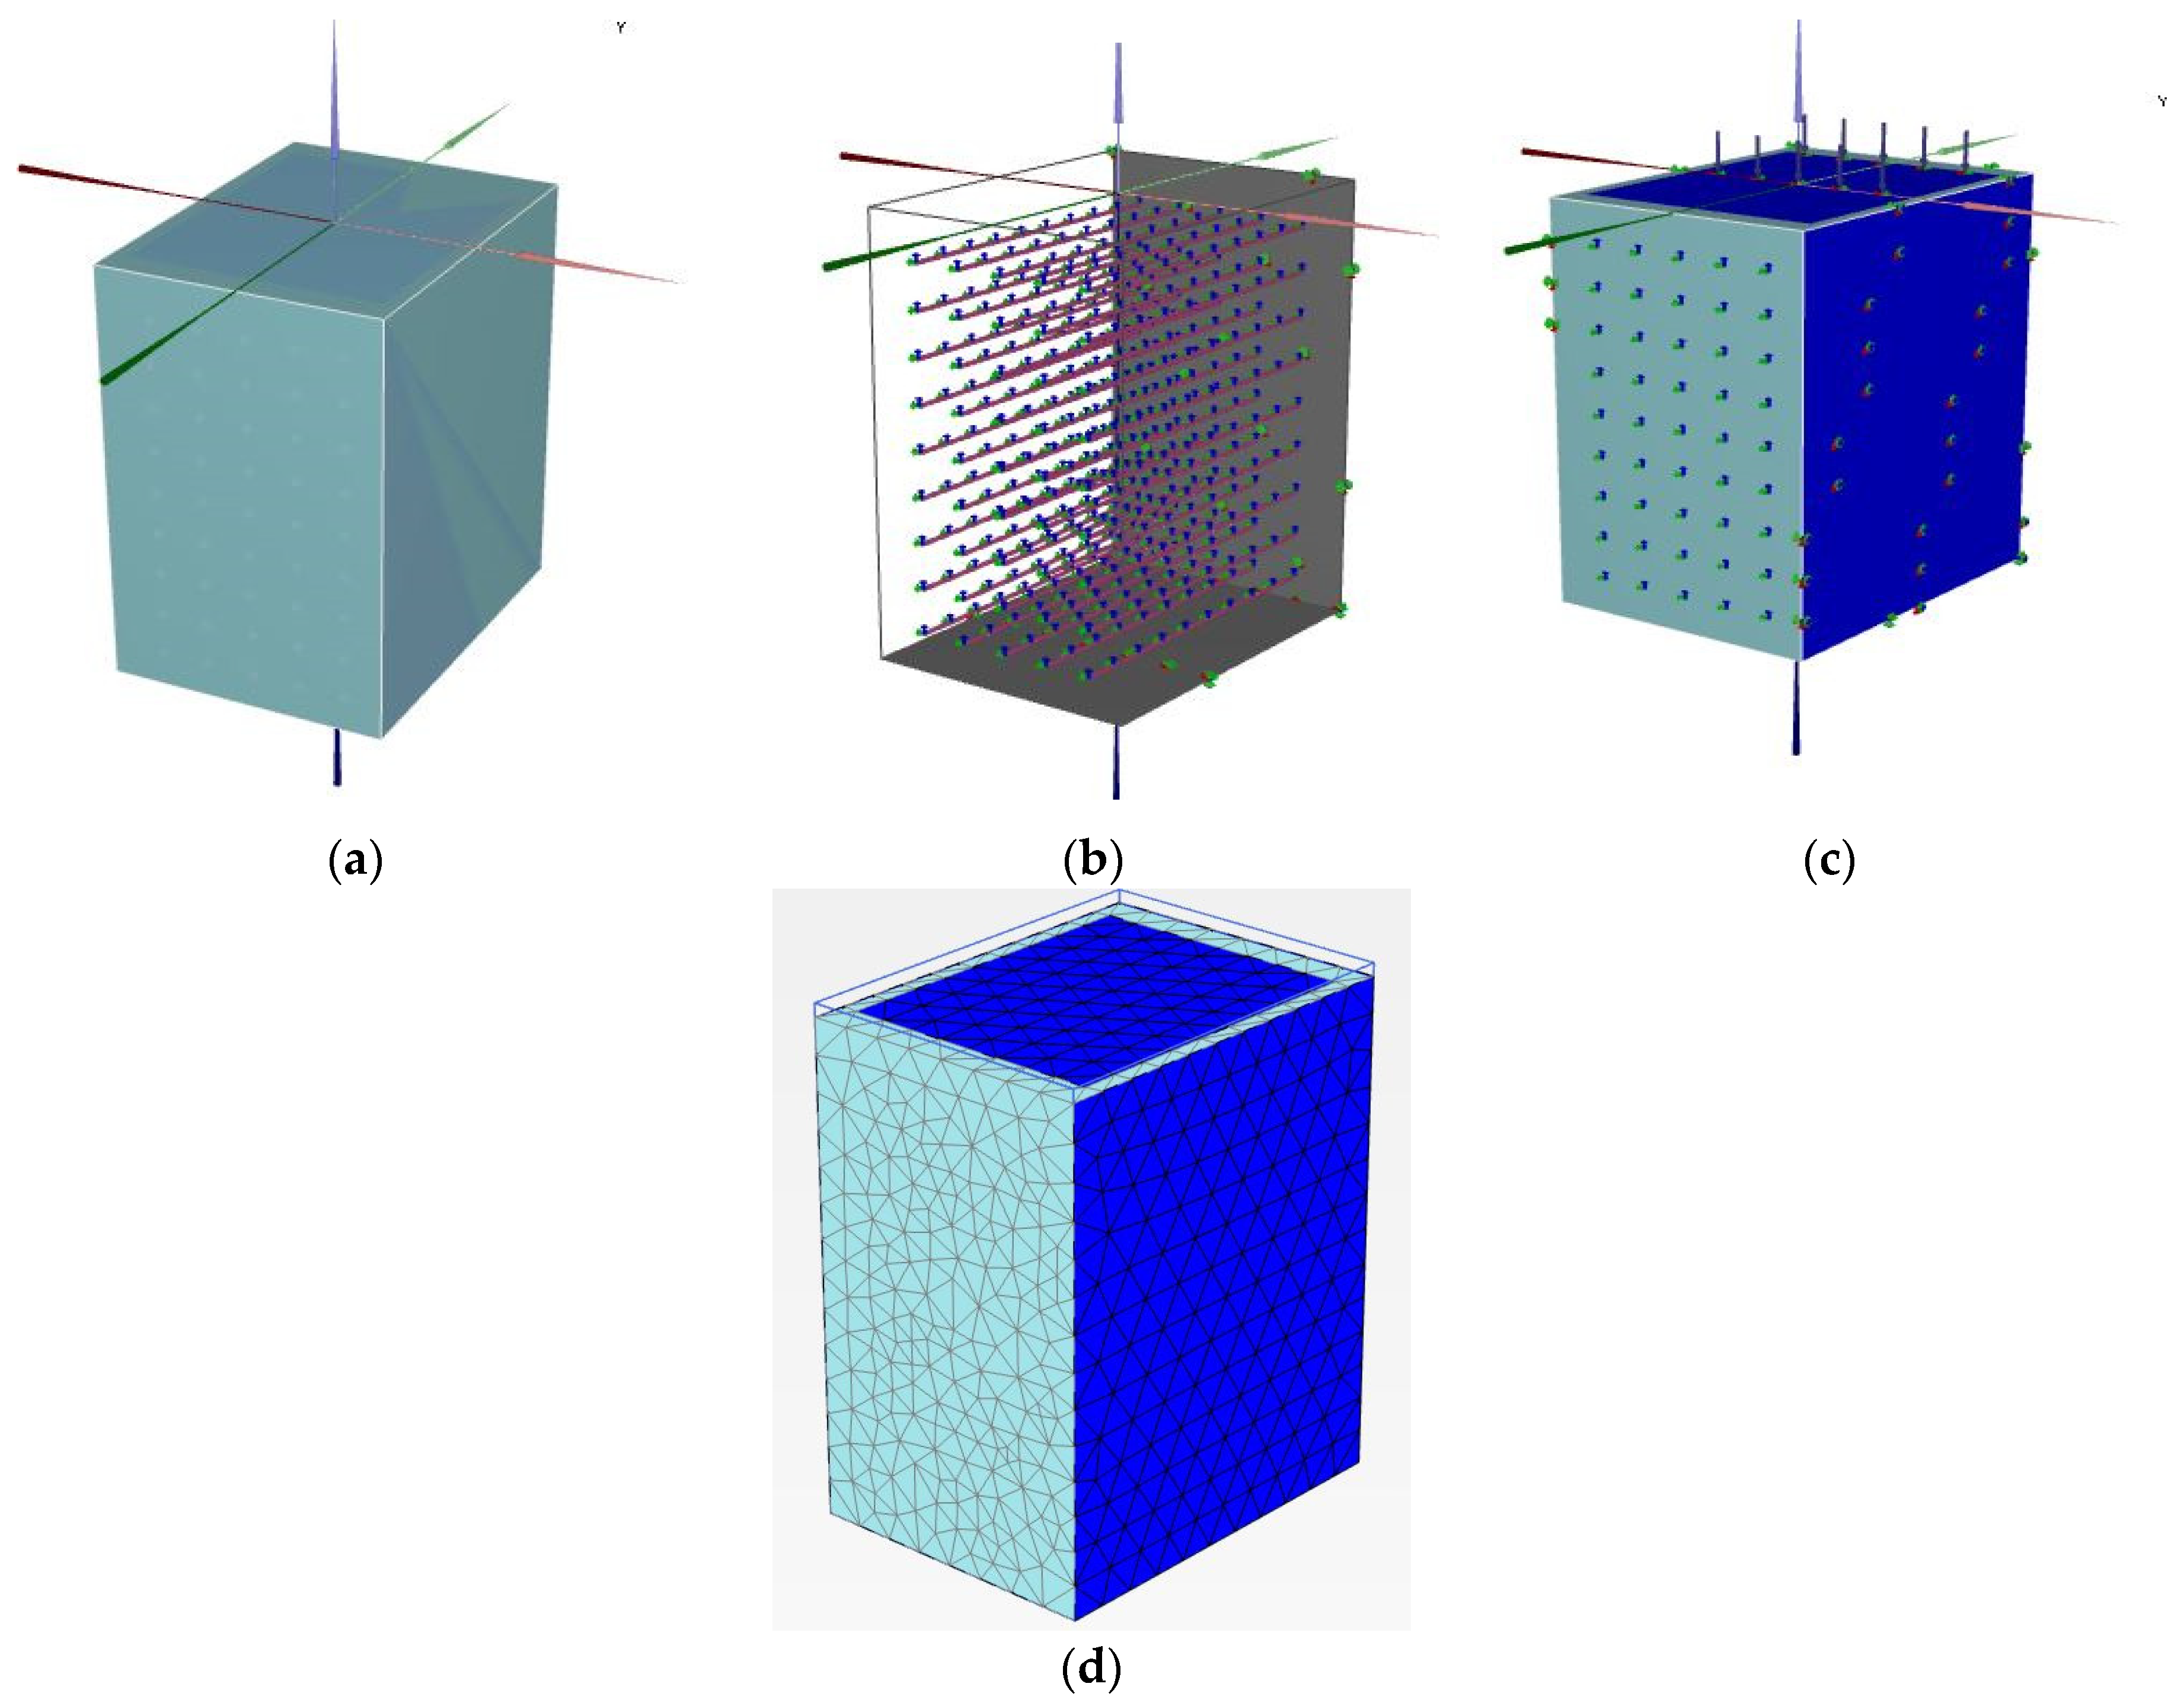
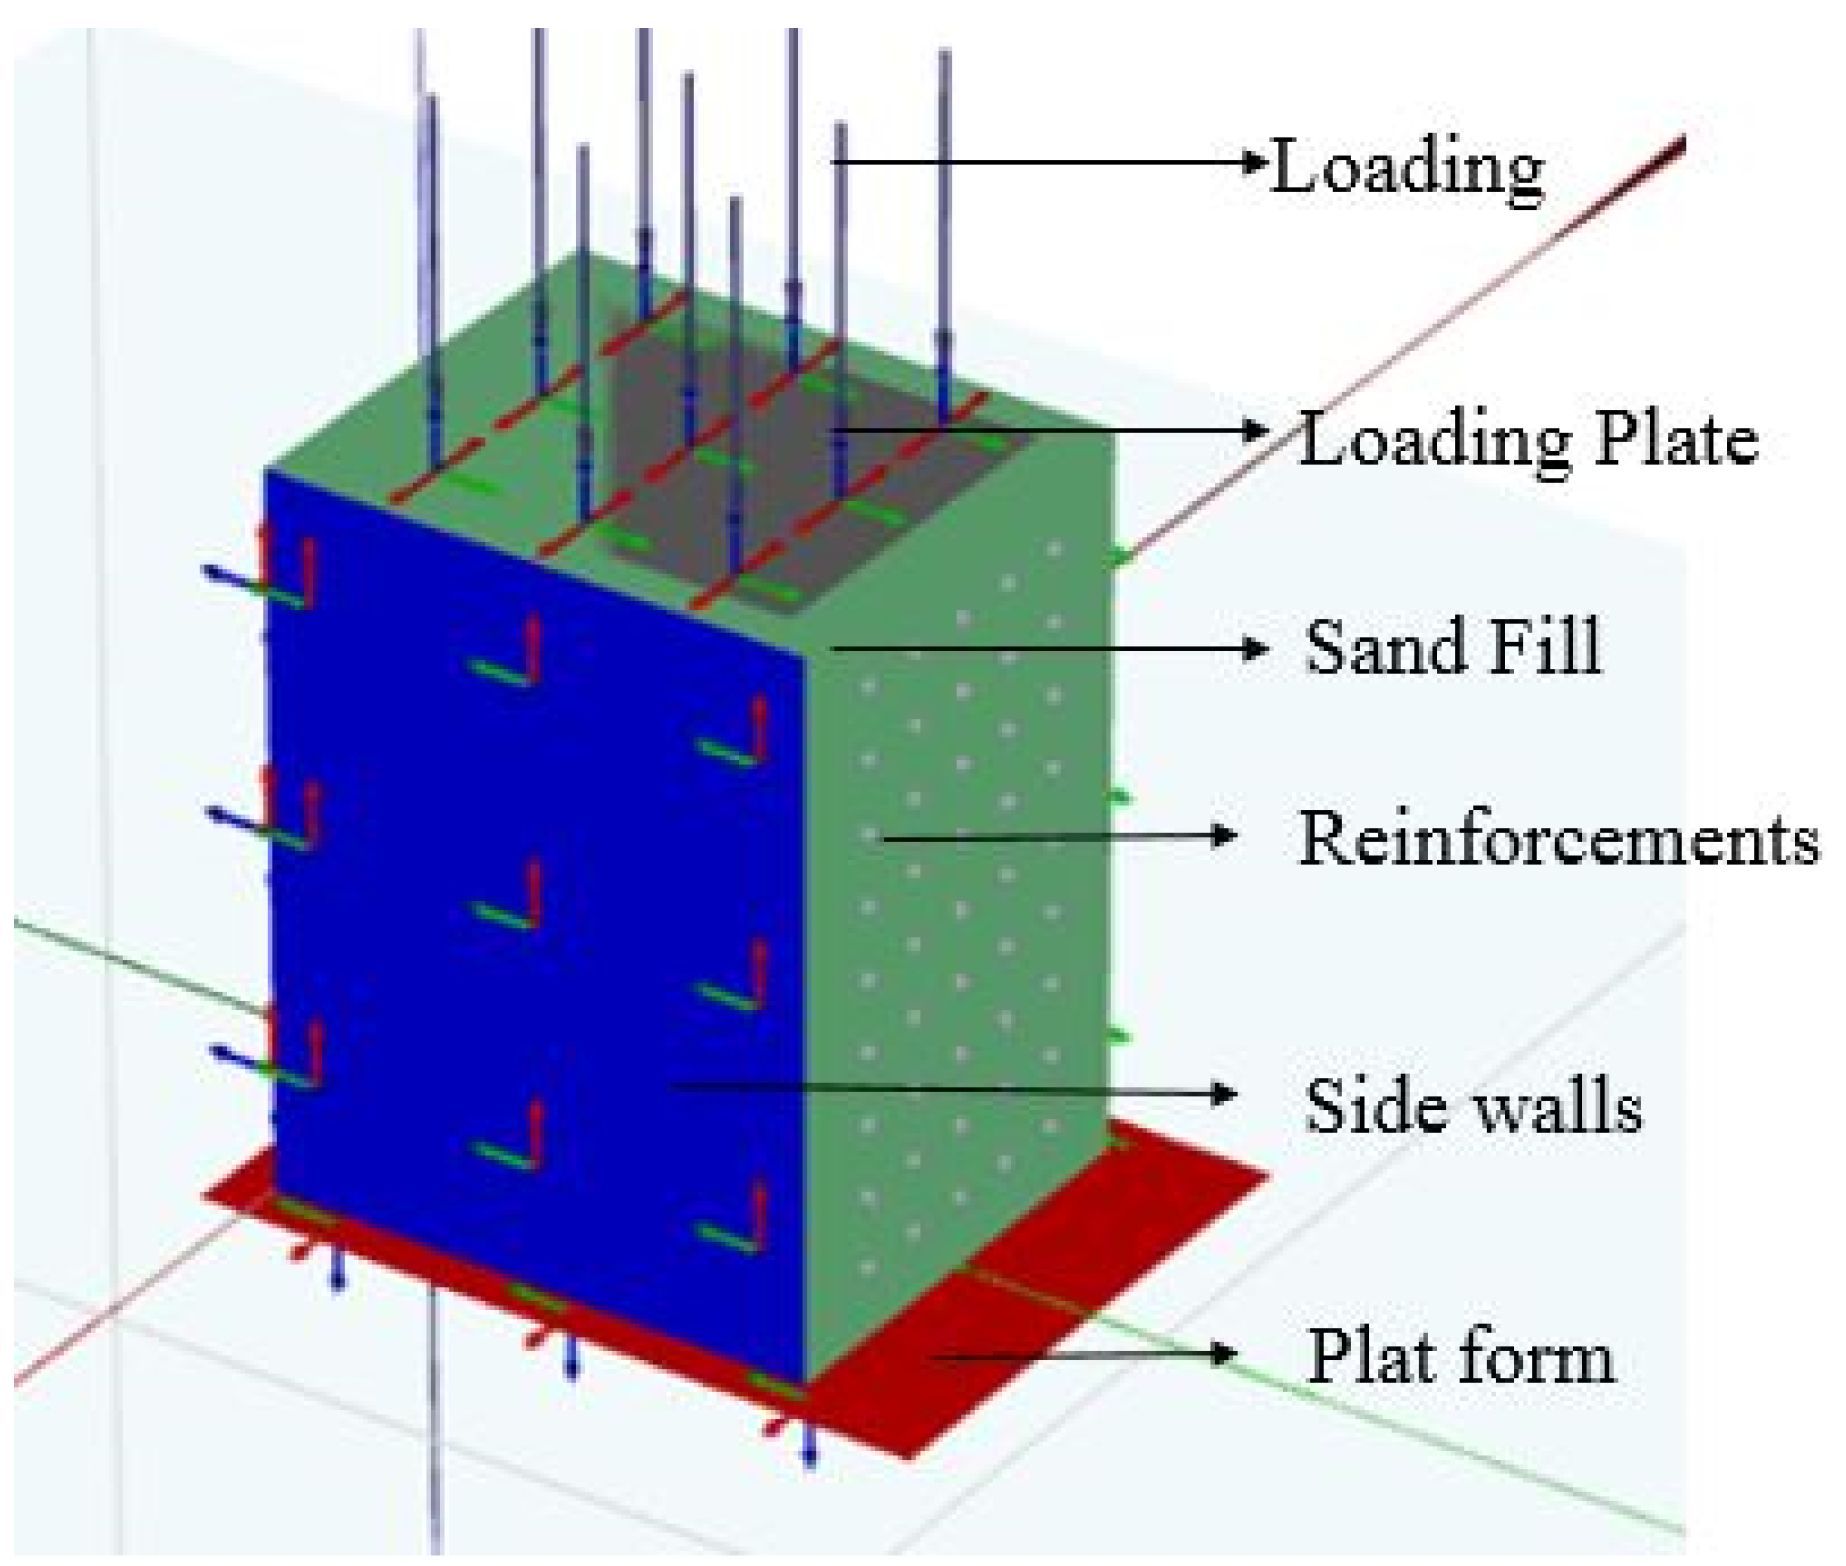
2.2. Numerical Modeling
2.2.1. The Parameters of the Model
2.2.2. Material Properties and Specifications
3. Results and Discussion
3.1. Experimental Model Results
3.2. Numerical Model Results
3.3. Comparison between Numerical and Experimental Model
4. Conclusions and Future Prospects
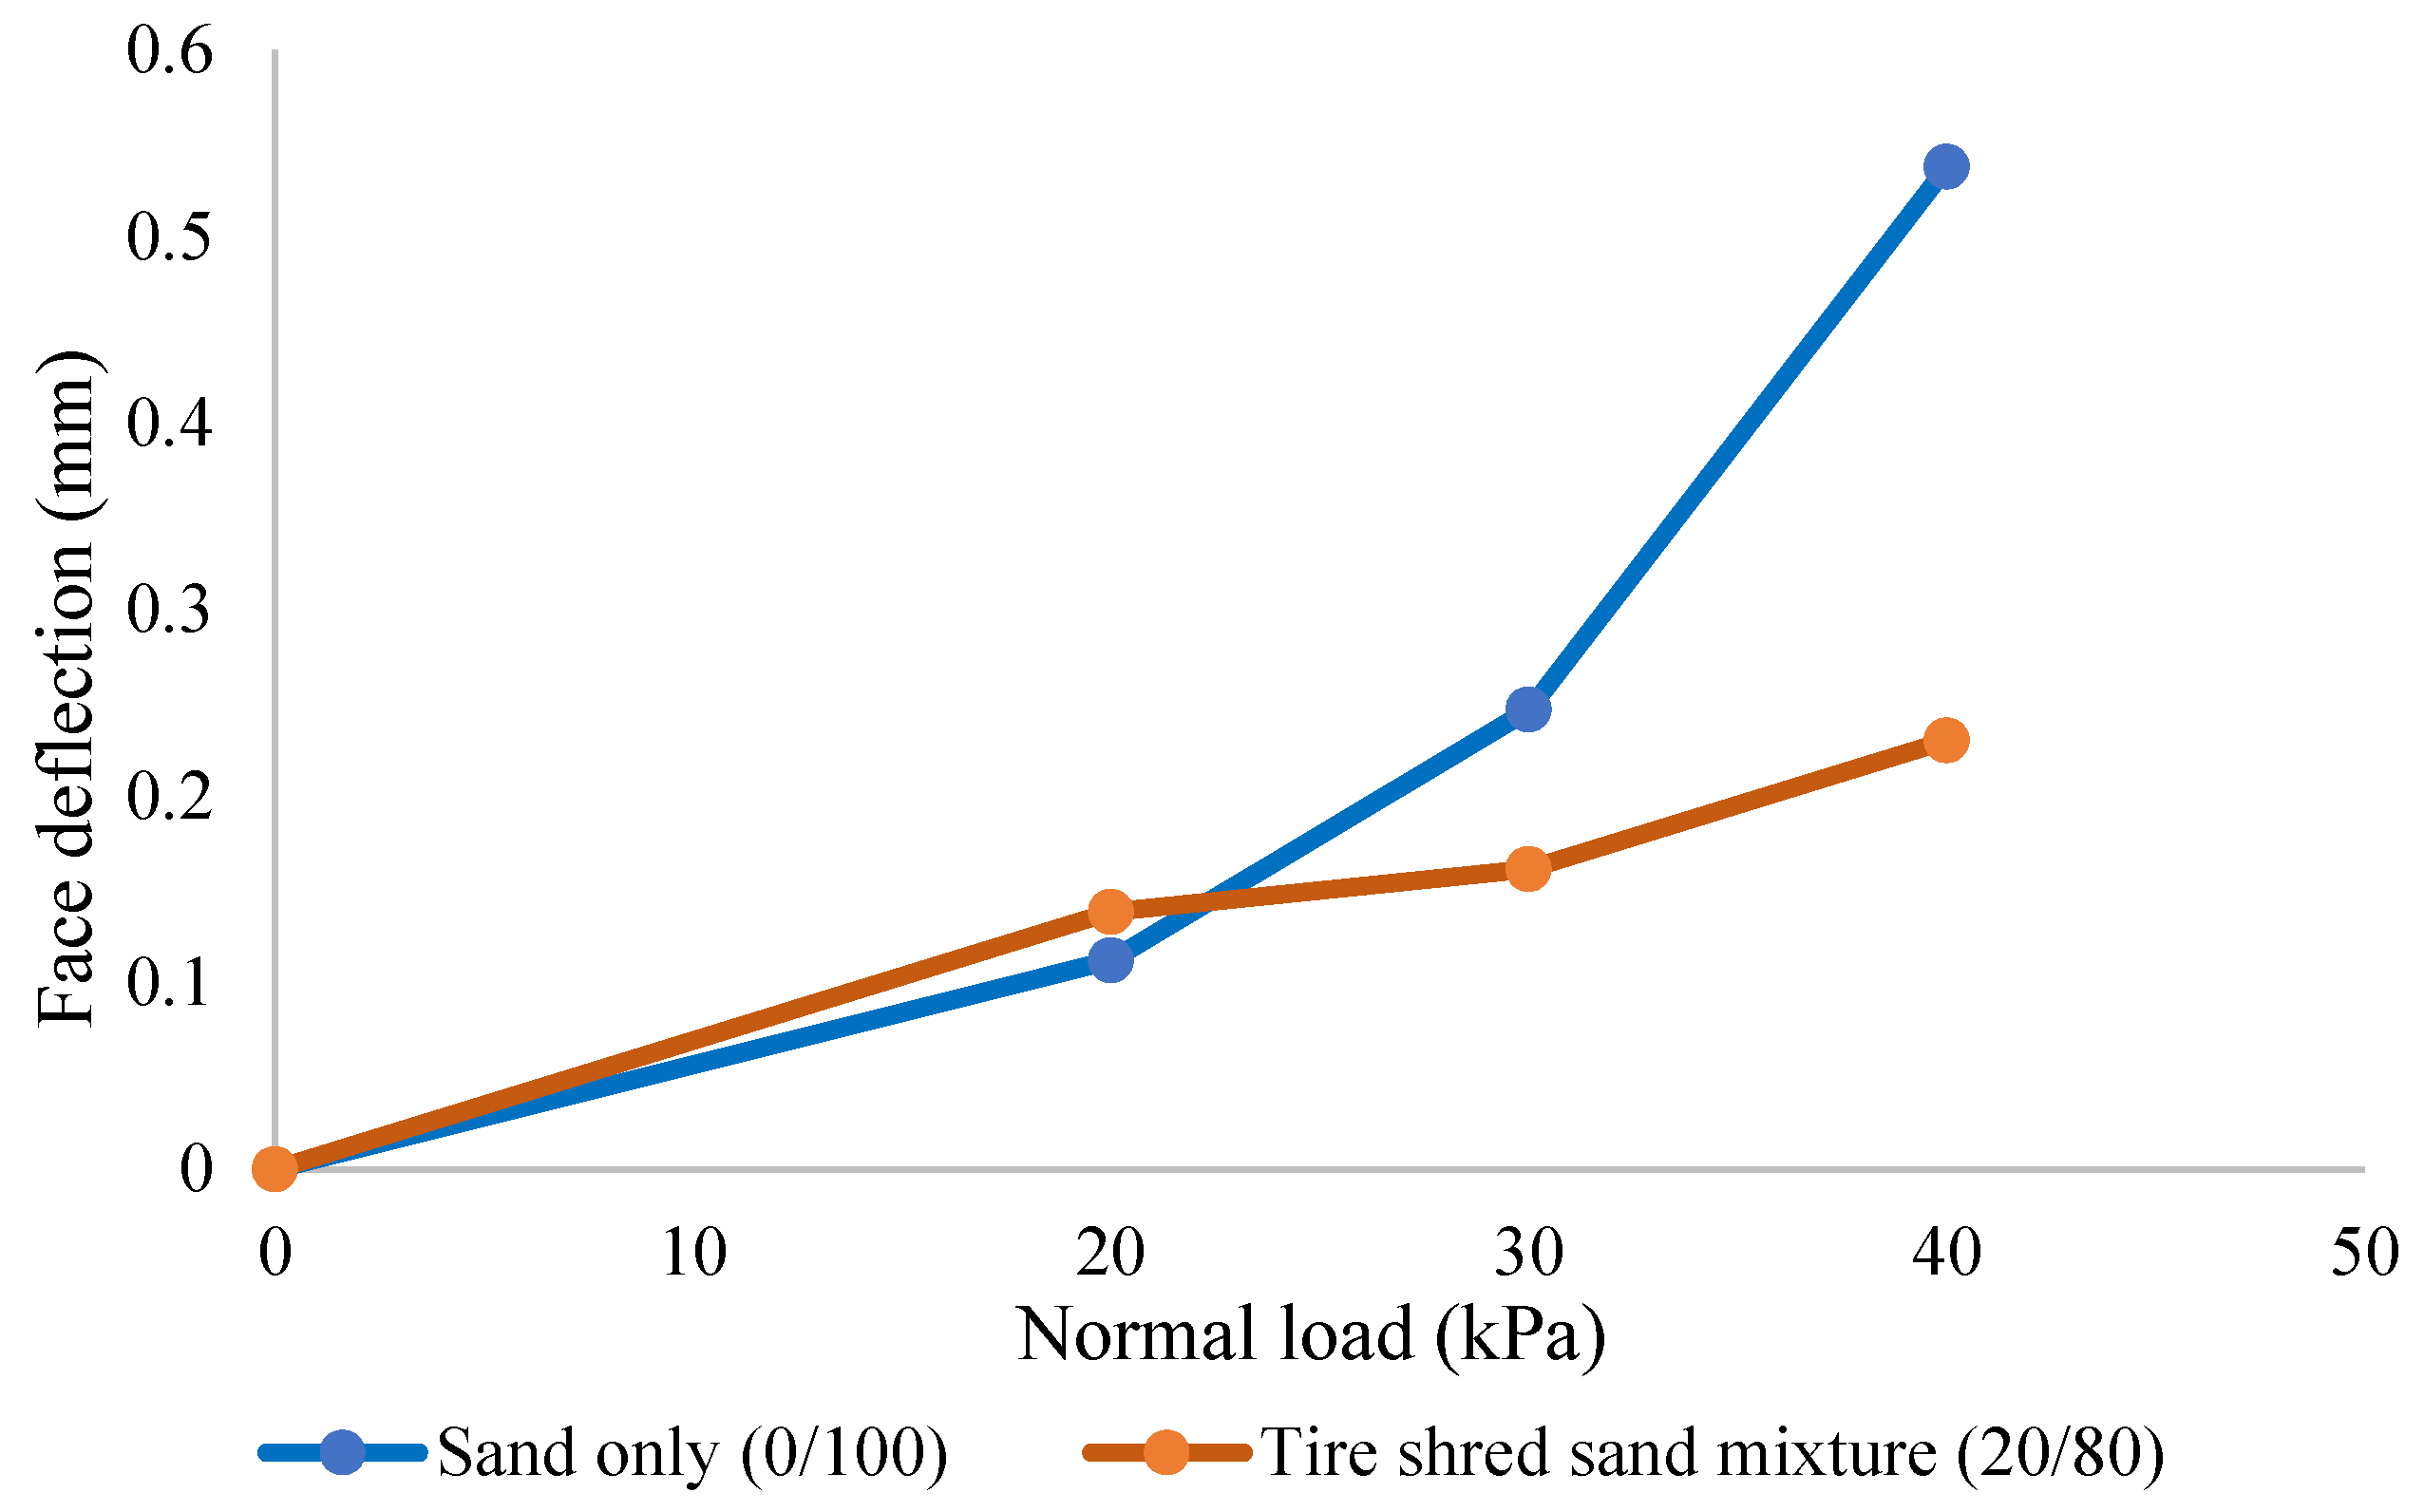
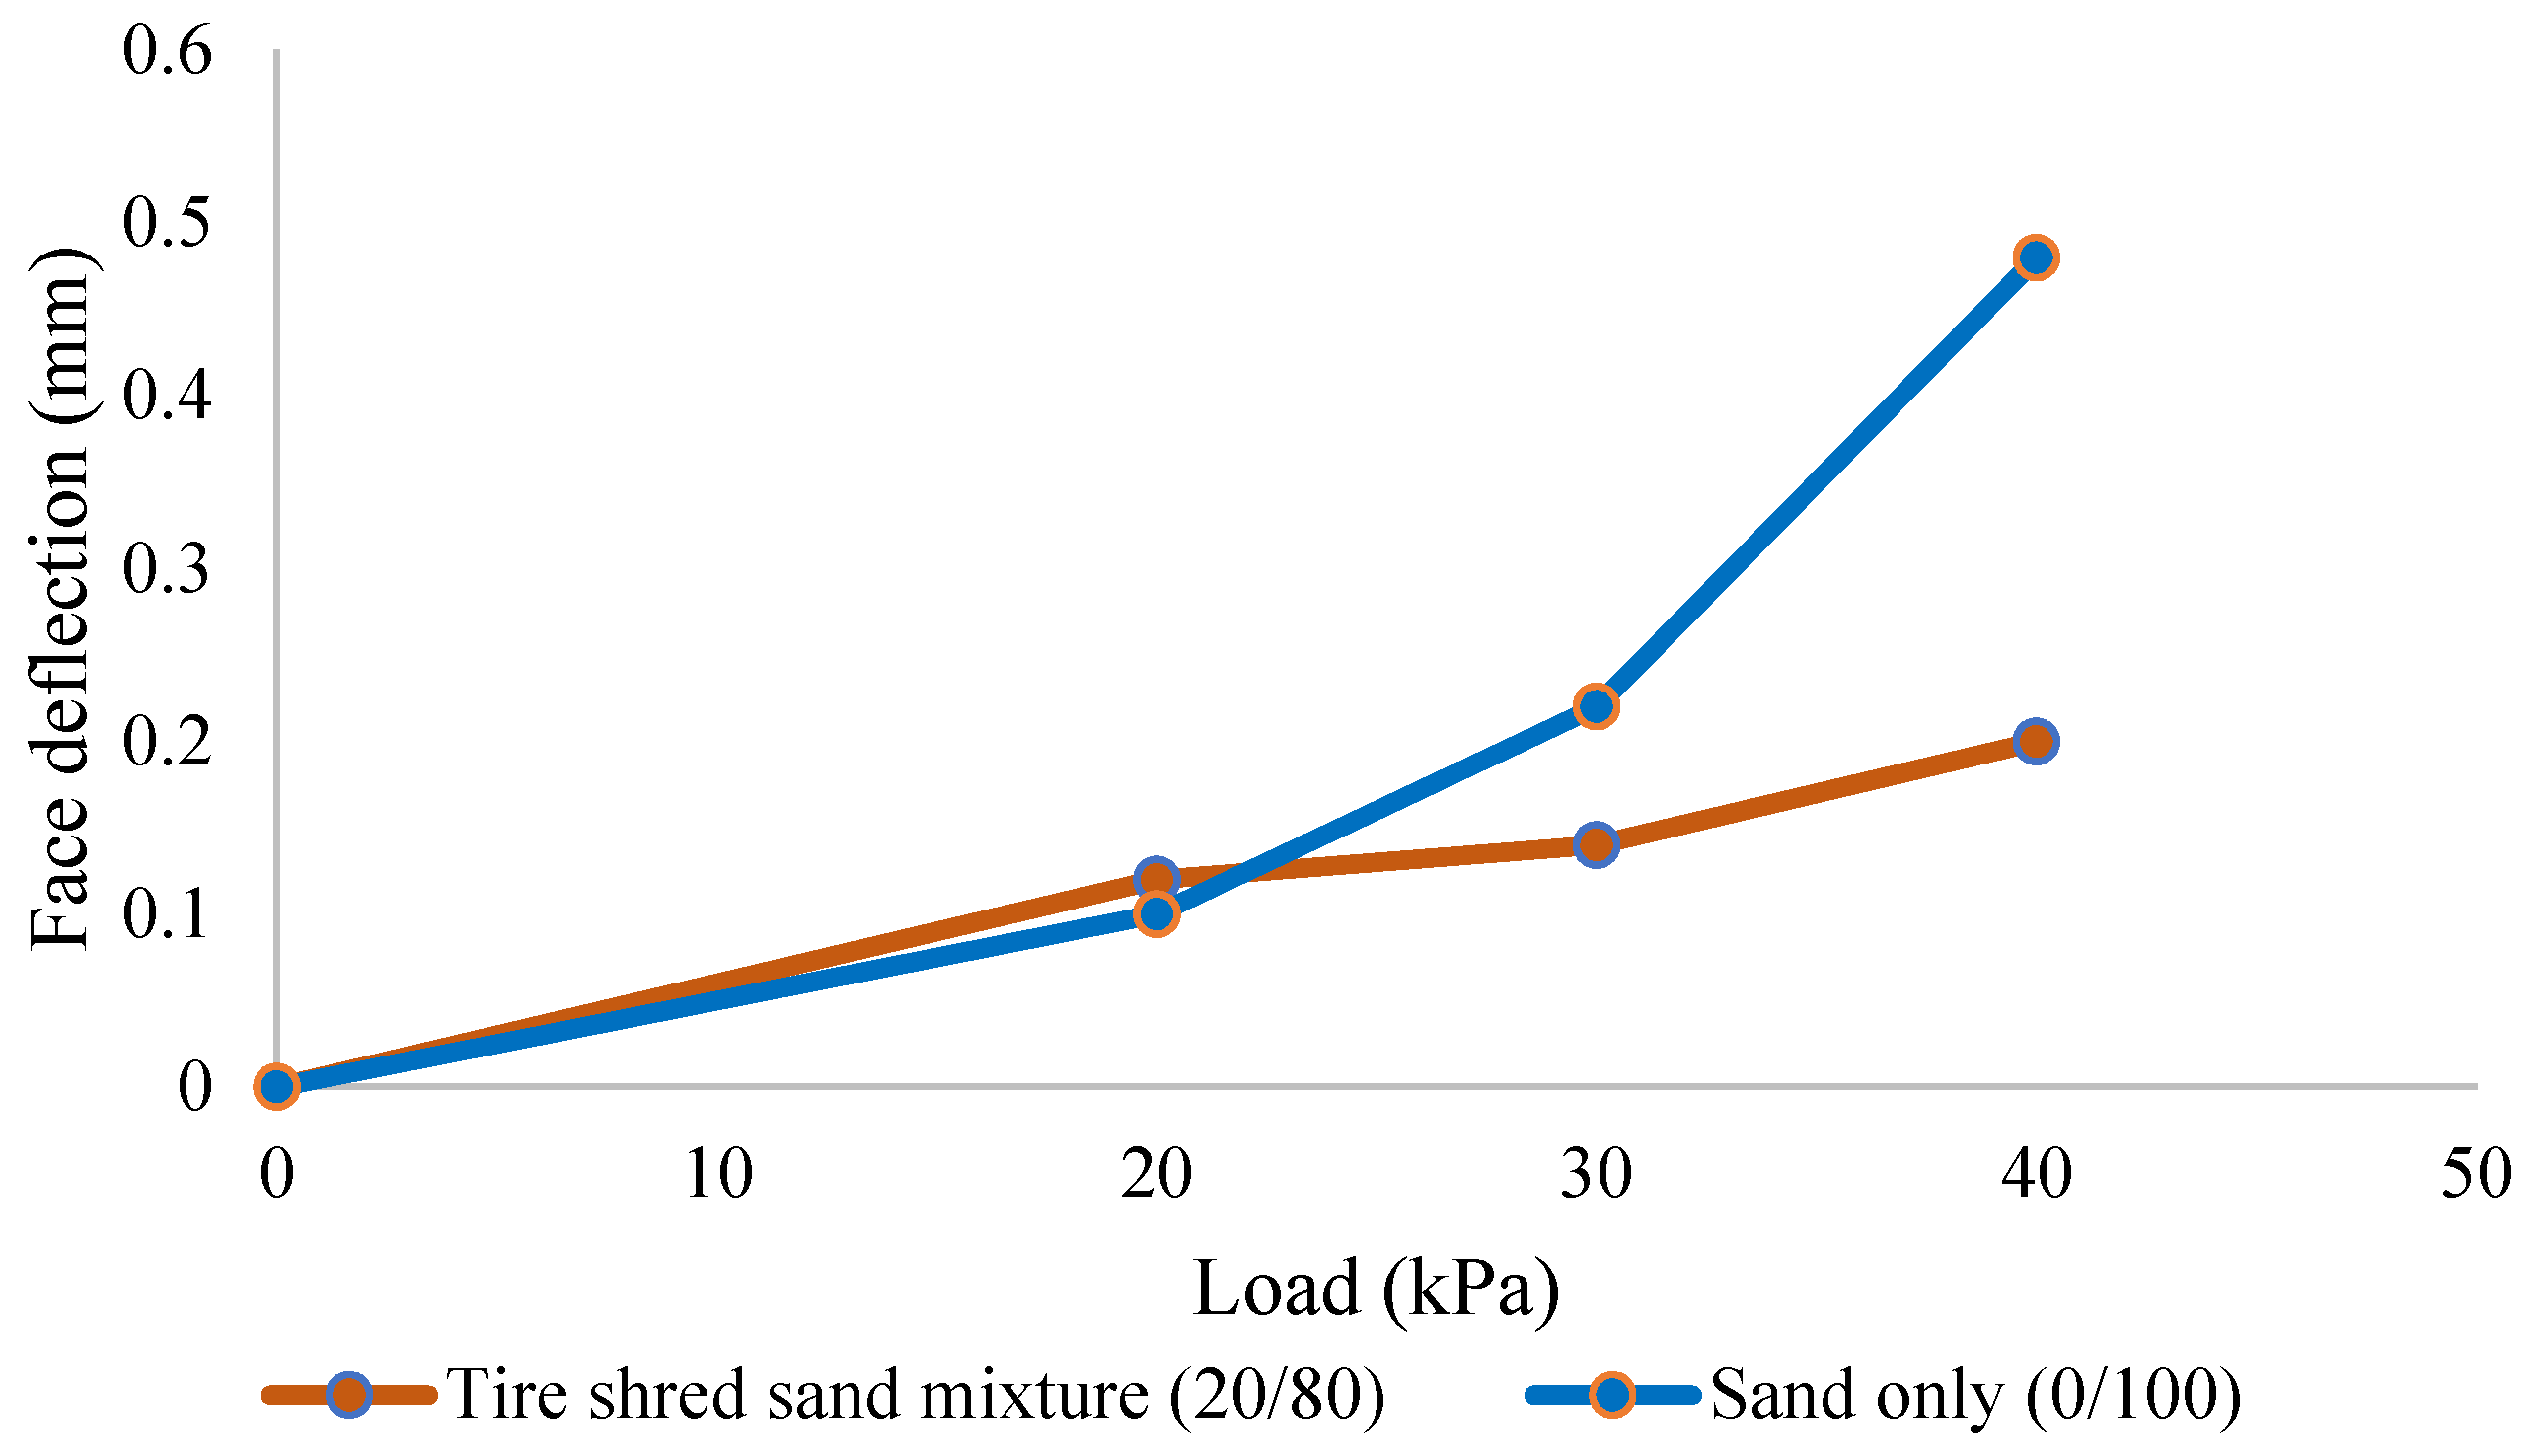
- From the results of the large-scale model, the face deflection observed at 20 kPa observed in the sand only and in tire-shred, the sand mixture is relatively the same; at 30 kPa and 40 kPa, the tire shred-sand mixture with reinforcement gave 36% and 58% reduction in deflection as compared to sand with the reinforcement. This is because of the lightweight properties of the mixture, which results in less overburden pressure resulting in lower deflection.
- The vertical settlement observed in the large-scale model, the tire shred-sand mixture at 20 kPa and 30 kPa, shows higher settlement than sand, i.e., a 33% rise in the settlement was noted. At 40%, this difference rises to 36% due to the sand minimum void ratio compared to tire shred-sand mixture, and due to increased density, their compressibility was consistently lower than that of tire shred-sand mixture with reinforcement.
- The experimental values observed were 12% higher than that of numerical. In the case of sand, the percent difference between numerical and experimental values is only 12%. In the case of tire shreds, this difference seems to be 15% for the same conditions.
- For vertical settlement in experimental and numerical values, the difference for sand was found to be 5%, which is in the acceptable range for a peak load of 40 kPa but 0% in case of a tire, shreds for the same load and conditions.
Author Contributions
Funding
Institutional Review Board Statement
Informed Consent Statement
Data Availability Statement
Conflicts of Interest
References
- Ren, F.-F.; Hao, Q.; Wang, G. Numerical Comparison on Deformation Characteristics of the Shored Mechanically Stabilized Earth Wall between Reduced-Scale and Full-Scale Models. Soil Mech. Found. Eng. 2019, 56, 302–308. [Google Scholar] [CrossRef]
- Bathurst, R.J. Developments in MSE Wall Research and Design. In Proceedings of the International Congress and Exhibition “Sustainable Civil Infrastructures”, Cairo, Egypt, 10–15 November 2019; Springer: Berlin/Heidelberg, Germany, 2019; pp. 22–50. [Google Scholar]
- Rajagopal, G.; Thiyyakkandi, S. Effect of reinforcement stiffness on response of back-to-back MSE wall upon infiltration. Geosynth. Int. 2022, 1–12. [Google Scholar] [CrossRef]
- Won, M.-S.; Langcuyan, C.P. A 3D numerical analysis of the compaction effects on the behavior of panel-type MSE walls. Open Geosci. 2020, 12, 1704–1724. [Google Scholar] [CrossRef]
- Chesner, W.; Collins, R.; Mackay, M. User Guidelines for Waste and Byproduct Materials in Pavement Construction (Publication No. FHWA-RD-97-148); Federal Highway Administration, US Department of Transportation: Washington, DC, USA, 1998.
- Stark, T.D.; Handy, R.; Lustig, M. MSE Wall Global Stability and Lesson Learned. In Geo-Congress 2019: Embankments, Dams, and Slopes; American Society of Civil Engineers: Reston, VA, USA, 2019. [Google Scholar]
- Rahmeyer, M.J. Developing More Efficient Mechanically Stabilized Earth (MSE) Wall Reinforcements. Master’s Thesis, Utah State University, Logan, UT, USA, May 2016. [Google Scholar]
- Berg, R.R.; Samtani, N.C.; Christopher, B.R. Design of Mechanically Stabilized Earth Walls and Reinforced Soil Slopes–Volume II; U.S. Department of Transportation. Federal Highway Administration: Washington, DC, USA, 2009.
- Elias, V. Mechanically Stabilized Earth Walls and Reinforced Soil Slopes: Design and Construction Guidelines (Updated Version); U.S. Federal Highway Administration: Washington, DC, USA, 2001.
- Officials, T. Standard Specifications for Highway Bridges; AASHTO: Washington, DC, USA, 2002. [Google Scholar]
- Soong, T.; Koerner, R. Geosynthetic Reinforced and Geocomposite Drained Retaining Walls Utilizing Low Permeability Backfill Soils; GRI Report No. 24; Geosynthetic Research Institute, Drexel University: Pittsburg, KS, USA, 1999. [Google Scholar]
- Hossain, M.S.; Kibria, G.; Khan, M.S.; Hossain, J.; Taufiq, T. Effects of Backfill Soil on Excessive Movement of MSE Wall. J. Perform. Constr. Facil. 2012, 26, 793–802. [Google Scholar] [CrossRef]
- Allen, T.M.; Bathurst, R.J. Geosynthetic reinforcement stiffness characterization for MSE wall design. Geosynth. Int. 2019, 26, 592–610. [Google Scholar] [CrossRef]
- Langcuyan, C.P. A 3D Numerical Analysis on the Effects of Continuous and Discrete Reinforcement’s Arrangement in MSE Walls. Open Geosci. 2017, 12, 23–25. [Google Scholar]
- Sabri, M.M.S.; Vatin, N.I.; Alsaffar, K.A.M. Soil Injection Technology Using an Expandable Polyurethane Resin: A Review. Polymer 2021, 13, 3666. [Google Scholar] [CrossRef]
- Sabri, M.M.; Shashkin, K.G. The mechanical properties of the expandable polyurethane resin based on its volumetric expansion nature. Mag. Civ. Eng. 2020, 98, 9811. [Google Scholar]
- Korneeva, E.; Mohanad, M.S.S.; Babanina, A.; Zaytsev, E.; Poberezhskii, S. Operational characteristics of limestone and methods to increase its strength. E3S Web Conf. 2019, 91, 02028. [Google Scholar] [CrossRef]
- Sabri, M.M.; Shashkin, K.G. Improvement of the soil deformation modulus using an expandable polyurethane resin. Mag. Civ. Eng. 2018, 83, 222–234. [Google Scholar]
- Sabri, M.; Korneeva, E. Strengthening the historical constructions made of limestone by treating with silicic acid based material. In Proceedings of the MATEC Web of Conferences, Warsaw, Poland, 5–7 October 2018; Volume 245, p. 01005. [Google Scholar]
- Rai, P.; Pei, H.; Meng, F.; Ahmad, M. Utilization of Marble Powder and Magnesium Phosphate Cement for Improving the Engineering Characteristics of Soil. Int. J. Geosynth. Ground Eng. 2020, 6, 1–13. [Google Scholar] [CrossRef]
- Rai, P.; Qiu, W.; Pei, H.; Chen, J.; Ai, X.; Liu, Y.; Ahmad, M. Effect of Fly Ash and Cement on the Engineering Characteristic of Stabilized Subgrade Soil: An Experimental Study. Geofluids 2021, 2021, 1368194. [Google Scholar] [CrossRef]
- Sabbà, M.; Tesoro, M.; Falcicchio, C.; Foti, D. Rammed Earth with Straw Fibers and Earth Mortar: Mix Design and Mechanical Characteristics Determination. Fibers 2021, 9, 30. [Google Scholar] [CrossRef]
- Khan, B.J.; Ahmad, I.; Nasir, H.; Abdullah, A.; Gohar, Q.K. Shear Strength and Pull-Out Response of Tire Shred-Sand Mixture Reinforced with Deformed Steel Bars. Adv. Civ. Eng. 2020, 2020, 5185093. [Google Scholar] [CrossRef]
- Khan, B.J.; Ahmad, I.; Jameel, H. Evaluation of pull out behavior of plain and deformed steel bars in tire shred –sand mixture using large scale model. Eng. Sci. Technol. Int. J. 2021, 26, 101010. [Google Scholar] [CrossRef]
- Reddy, S.B.; Kumar, D.P.; Krishna, A.M. Evaluation of the Optimum Mixing Ratio of a Sand-Tire Chips Mixture for Geoengineering Applications. J. Mater. Civ. Eng. 2016, 28, 06015007. [Google Scholar] [CrossRef]
- dos Santos, R.G. Tire waste management: An overview from chemical compounding to the pyrolysis-derived fuels. J. Mater. Cycles Waste Manag. 2020, 22, 628–641. [Google Scholar] [CrossRef]
- Boominathan, A.; Banerjee, S. Engineering properties of sand–rubber tire shred mixtures. Int. J. Geotech. Eng. 2019, 15, 1061–1077. [Google Scholar] [CrossRef]
- Hajiazizi, M.; Mirnaghizadeh, M.; Nasiri, M. Experimental Study of Waste Tire-Reinforced Sand Slope. Int. J. Min. Geo. Eng. 2019, 53, 183–191. [Google Scholar]
- Tajabadipour, M.; Marandi, M. Effect of Rubber Tire Chips-Sand Mixtures on Performance of Geosynthetic Reinforced Earth Walls. Period. Polytech. Civ. Eng. 2016, 61, 322–334. [Google Scholar] [CrossRef]
- Tajabadipour, M.; Dehghani, M.; Kalantari, B.; Lajevardi, S. Laboratory pullout investigation for evaluate feasibility use of scrap tire as reinforcement element in mechanically stabilized earth walls. J. Clean. Prod. 2019, 237, 117726. [Google Scholar] [CrossRef]
- Li, W.; Kwok, C.; Senetakis, K. Effects of inclusion of granulated rubber tires on the mechanical behaviour of a compressive sand. Can. Geotech. J. 2020, 57, 763–769. [Google Scholar] [CrossRef]
- Abichou, T.; Tawfiq, K.; Edil, T.B.; Benson, C.H. Behavior of a Soil-Tire Shreds Backfill for Modular Block-Wall. In Proceedings of the Recycled Materials in Geotechnics, Baltimore, MA, USA, 19–21 October 2004; pp. 162–172. [Google Scholar]
- Salgado, R.; Yoon, S.; Siddiki, N.Z. Construction of Tire Shreds Test Embankment. In Construction of Tire Shreds Test Embankment; Indiana Department of Transportation and Purdue University: West Lafayette, Indiana, 2003. [Google Scholar]
- Ahmadi, H.; Bezuijen, A. Full-scale mechanically stabilized earth (MSE) walls under strip footing load. Geotext. Geomembr. 2018, 46, 297–311. [Google Scholar] [CrossRef]
- Yu, Y.; Bathurst, R.J.; Allen, T.M.; Nelson, R. Physical and numerical modelling of a geogrid-reinforced incremental concrete panel retaining wall. Can. Geotech. J. 2016, 53, 1883–1901. [Google Scholar] [CrossRef]
- Ee, O.C. Influence of Metallic Strip Reinforcement Length and Retained Soil Properties on the Reinforced Earth Walls Stability. Malays. J. Civ. Eng. 2021, 33, 17280. [Google Scholar]
- Kong, S.-M.; Oh, D.-W.; Lee, S.-Y.; Jung, H.-S.; Lee, Y.-J. Analysis of reinforced retaining wall failure based on reinforcement length. Int. J. Geo. Eng. 2021, 12, 1–14. [Google Scholar] [CrossRef]
- Pratap, U.; Azhar; Choudhary, A.K. Numerical Analysis of Geocell-Reinforced Embankment Using PLAXIS 3D. In Advances in Geo-Science and Geo-Structures; Springer: Berlin/Heidelberg, Germany, 2022; pp. 283–292. [Google Scholar]
- Skejić, A.; Kapor, M.; Medić, S.; Čerimagić, Đ. 3D Numerical Study of Sidewall Friction Influence on Small Scale Reinforced Earth Wall Behavior. In Proceedings of the International Symposium on Innovative and Interdisciplinary Applications of Advanced Technologies, Teslić, Bosnia and Herzegovina, 25–28 May 2017; Springer: Berlin/Heidelberg, Germany, 2017; pp. 449–457. [Google Scholar]
- ASTM-D422; STANDARD Test Method for Particle-Size Analysis of Soils. American Society for Testing Materials Philadelphia: West Conshohocken, PA, USA, 1985.
- Berney, E.S.; Smith, D.M. Mechanical and Physical Properties of ASTM C33 Sand; Final Report; U.S. Army Engineer Research and Development Center: Vicksburg, MS, USA, 2008. [Google Scholar]
- ASTM–D6270–08; Standard Practice for the Use of Scrap Tires in Civil Engineering Applications. ASTM: West Conshohocken, PA, USA, 1998.
- Humphrey, D.N.; Sandford, T.C. Tire Chips as Lightweight Subgrade Fill and Retaining Wall Backfill. In Proceedings of the Symposium on Recovery and Effective reuse of Discarded Materials and By-Products for Construction of Highway Facilities, Denver, CO, USA, 19–22 October 1993. [Google Scholar]
- Ahmed, I. Laboratory Study on Properties of Rubber-Soils; Final Report; Indiana Department of Transportation and Purdue University: West Lafayette, Indiana, 1993. [Google Scholar]
- Amanta, A.S.; Dasaka, S.M. Evaluation of Engineering Properties of Sand–Tire Chips Mix. Indian Geotech. J. 2021, 52, 1–11. [Google Scholar] [CrossRef]
- Damians, I.P.; Bathurst, R.J.; Olivella, S.; Lloret, A.; Josa, A. 3D modelling of strip reinforced MSE walls. Acta Geotech. 2021, 16, 711–730. [Google Scholar] [CrossRef]
- Reshma, P.R.; Gangaputhiran, S. Numerical Modelling of Mechanically Stabilized Earth Walls for Slope Protection. In Geohazard Mitigation; Springer: Berlin/Heidelberg, Germany, 2021; pp. 261–270. [Google Scholar]
- Han, J.; Liu, D.; Guan, Y.; Chen, Y.; Li, T.; Jia, D.; Yan, F.; Jia, P.; Zhao, Y. Study on shear behavior and damage constitutive model of tendon-grout interface. Constr. Build. Mater. 2022, 320, 126223. [Google Scholar] [CrossRef]
- Brinkgreve, R.; Engin, E.; Swolfs, W. Plaxis 3D. Reference Manual; Bentley Geotechnical Engineering: Exton, PA, USA, 2013. [Google Scholar]
- Tahsin, A.; El-Sherbiny, R.; Salem, A. Verification of a three dimensional numerical model for A mechanically stabilized EARTH wall. J. Al-Azhar Univ. Eng. Sect. 2020, 15, 513–526. [Google Scholar] [CrossRef]
- Baral, P.; Bergado, D.T.; Duangkhae, S. The use of polymeric and metallic geogrid on a full-scale MSE wall/embankment on hard foundation: A comparison of field data with simulation. Int. J. Geo-Eng. 2016, 7, 116. [Google Scholar] [CrossRef] [Green Version]
- Abdelouhab, A.; Dias, D.; Freitag, N. Numerical analysis of the behaviour of mechanically stabilized earth walls reinforced with different types of strips. Geotext. Geomembr. 2011, 29, 116–129. [Google Scholar] [CrossRef]
- Reddy, S.B.; Krishna, A.M. Recycled Tire Chips Mixed with Sand as Lightweight Backfill Material in Retaining Wall Applications: An Experimental Investigation. Int. J. Geosynth. Ground Eng. 2015, 1, 1–11. [Google Scholar] [CrossRef] [Green Version]
- Anvari, S.M.; Shooshpasha, I.; Kutanaei, S.S. Effect of granulated rubber on shear strength of fine-grained sand. J. Rock Mech. Geotech. Eng. 2017, 9, 936–944. [Google Scholar] [CrossRef]
- Pasha, S.M.K.; Hazarika, H.; Yoshimoto, N. Physical and mechanical properties of Gravel-Tire Chips Mixture (GTCM). Geosynth. Int. 2019, 26, 92–110. [Google Scholar] [CrossRef]


| Material | Description | Type | Value |
|---|---|---|---|
| Tire Shred-Sand Mixture | Unit Weight, ϒw (kN/m3) | Unsaturated | 19 |
| Unit Weight, ϒw (kN/m3) | Saturated | 19 | |
| Poisson Ratio, υ | - | 0.35 | |
| e | Initial | 0.5 | |
| E (MPa) | - | 7.143 | |
| c (kN/m2) | - | 0.54 | |
| Rint | - | 0.67 | |
| Phi (Degree) | - | 39 | |
| Only Sand | Unit Weight, ϒw (kN/m3) | Unsaturated | 23 |
| Unit Weight, ϒw (kN/m3) | Saturated | 23 | |
| Poisson Ratio, υ | - | 0.35 | |
| e | Initial | 0.5 | |
| E (MPa) | - | 10 | |
| c (kN/m2) | - | 0.1 | |
| Rint | - | 0.67 | |
| Phi (Degree) | - | 32 |
| Deformed Steel Bars Act as Embedded Piles | |
|---|---|
| E (GPa) | 200 |
| Unit weight (ϒ), kN/m3 | 78.5 |
| Diameter (m) | 0.01 |
| Ttop max (kN/m) | 1 |
| Ttop Bottom (kN/m) | 1 |
| Vertical Spacing, Sv (m) | 0.15 |
| Horizontal Spacing, Sh (m) | 0.15 |
| Box Properties | |
|---|---|
| E (GPa) | 200 |
| Unit weight (ϒ), kN/m3 | 78.5 |
| Thickness (mm) | 2 |
| Load (kPa) | Descriptive Case | Max. Top Face Deflection (mm) | Max. Settlement (mm) |
|---|---|---|---|
| 0 | Sand with Reinforcement | 0 | 0 |
| 20 | 0.112 | 2 | |
| 30 | 0.246 | 3.0 | |
| 40 | 0.537 | 3.8 | |
| 0 | Tire Shred-sand Mixture with reinforcement | 0 | 0 |
| 20 | 0.138 | 3 | |
| 30 | 0.161 | 4.50 | |
| 40 | 0.230 | 6 |
| Description | Load (kPa) | Deflection (mm) | Settlement (mm) |
|---|---|---|---|
| Tire shred-sand mix with reinforcement | 0 | 0 | 0 |
| 20 | 0.12 | 4 | |
| 30 | 0.14 | 5 | |
| 40 | 0.2 | 6 | |
| 60 | 0.36 | 8.5 | |
| 80 | 0.48 | 11 | |
| 100 | 0.9 | 13 | |
| 200 | 2.4 | 24 | |
| 300 | 4.8 | 34 | |
| 300 and above | fails | fails | |
| Only sand with reinforcement | 0 | 0 | 0 |
| 20 | 0.1 | 2.4 | |
| 30 | 0.22 | 3.2 | |
| 40 | 0.48 | 4 | |
| 60 | 1.6 | 6 | |
| 80 | 2.75 | 9 | |
| 100 and above | fails | fails |
| Description | Loads (kPa) | Face Deflection (mm) | Vertical Settlement (mm) | ||
|---|---|---|---|---|---|
| Numerical | Experimental | Numerical | Experimental | ||
| Tire shred-sand mix with reinforcement | 0 | 0 | 0 | 0 | 0 |
| 20 | 0.12 | 0.138 | 4 | 3 | |
| 30 | 0.14 | 0.161 | 5 | 4.5 | |
| 40 | 0.2 | 0.23 | 6 | 6 | |
| 60 | 0.36 | - | 8.5 | - | |
| 80 | 0.48 | - | 11 | - | |
| 100 | 0.9 | - | 13 | - | |
| 200 | 2.4 | - | 24 | - | |
| 300 | 4.8 | - | 34 | - | |
| 300 and above | fails | ||||
| Only sand with reinforcement | 0 | 0 | 0 | 0 | 0 |
| 20 | 0.1 | 0.112 | 2.4 | 2 | |
| 30 | 0.22 | 0.246 | 3.2 | 3 | |
| 40 | 0.48 | 0.537 | 4 | 3.8 | |
| 60 | 1.6 | - | 6 | - | |
| 80 | 2.75 | - | 9 | - | |
| 100 and above | fails | - | fails | - | |
Publisher’s Note: MDPI stays neutral with regard to jurisdictional claims in published maps and institutional affiliations. |
© 2022 by the authors. Licensee MDPI, Basel, Switzerland. This article is an open access article distributed under the terms and conditions of the Creative Commons Attribution (CC BY) license (https://creativecommons.org/licenses/by/4.0/).
Share and Cite
Khan, B.J.; Ahmad, M.; Sabri, M.M.S.; Ahmad, I.; Zamin, B.; Niekurzak, M. Experimental and Numerical Evaluation of Mechanically Stabilized Earth Wall with Deformed Steel Bars Embedded in Tire Shred-Sand Mixture. Buildings 2022, 12, 548. https://doi.org/10.3390/buildings12050548
Khan BJ, Ahmad M, Sabri MMS, Ahmad I, Zamin B, Niekurzak M. Experimental and Numerical Evaluation of Mechanically Stabilized Earth Wall with Deformed Steel Bars Embedded in Tire Shred-Sand Mixture. Buildings. 2022; 12(5):548. https://doi.org/10.3390/buildings12050548
Chicago/Turabian StyleKhan, Beenish Jehan, Mahmood Ahmad, Mohanad Muayad Sabri Sabri, Irshad Ahmad, Bakht Zamin, and Mariusz Niekurzak. 2022. "Experimental and Numerical Evaluation of Mechanically Stabilized Earth Wall with Deformed Steel Bars Embedded in Tire Shred-Sand Mixture" Buildings 12, no. 5: 548. https://doi.org/10.3390/buildings12050548