Article

Failure Modes of Reinforced Concrete Beams Strengthened in Flexure with Externally Bonded Aramid Fiber-Reinforced Polymer Sheets under Impact Loading

Graduate School, Muroran Institute of Technology, Muroran 050-8585, Japan
*
Author to whom correspondence should be addressed.
Buildings 2022, 12(5), 584; https://doi.org/10.3390/buildings12050584
Submission received: 15 March 2022 / Revised: 28 April 2022 / Accepted: 29 April 2022 / Published: 1 May 2022
(This article belongs to the Section Building Structures)

Abstract

:
This paper focuses on the aramid fiber-reinforced polymer (AFRP) sheet bonding method to investigate the influences of the sheet volume and input impact energy on the failure modes of strengthened RC beams. The drop-weight impact loading tests were conducted on RC beams strengthened with AFRP sheets. The sheet volume was investigated, varying from 415 to 1660 g/m2. The impact force was generated by dropping a 300 kg steel weight onto the midspan of the beams from different heights (0.5, 1.0, 2.0, 2.5, 3.0, and 3.5 m), and the weight’s drop height was raised until the sheets were debonded or ruptured. As a reference beam, nonstrengthened beams were also evaluated. The following are the findings of this research. (1) In the event of impact loading, the impact resistance capacity of strengthened beams can be enhanced by up to 85% by applying the AFRP sheet bonding method; however, (2) in the case of relatively large impact energy, the impact resistance capacity may not always be remarkable. (3) Depending on the sheet volume, the failure mechanism of the AFRP-strengthened beams was classified into two types: sheet debonding and sheet rupturing. Furthermore, (4) increasing the sheet volume may not improve the debonding of the AFRP sheet of the strengthened beams.

1. Introduction

Traditional methods of strengthening or retrofitting existing concrete structures, such as steel plate bonding, section expansion, and external post-tensioning, have been used. However, these techniques have the disadvantages of increasing the structure’s weight, being difficult to install, and having the reinforcing material corrode, resulting in higher maintenance expenses. Fiber-reinforced polymer (FRP) materials have many outstanding advantages, including corrosion resistance, a high strength-to-weight ratio, and ease of installation. Due to these features, many studies and applications on FRP materials containing carbon, glass, aramid, and basalt fibers have been carried out in civil engineering. These FRP materials were applied to strengthen RC beams in flexure and/or shear under static loadings [1,2,3,4,5,6,7]. Design recommendations for reinforcing concrete structures with externally bonded FRP systems have been developed and are being widely applied [8]. Externally bonded FRP sheets and near-surface mounted FRP bars are employed to reinforce the structure. However, Davood Mostofinejad et al. proposed new strengthening methods based on externally bonded reinforcement (EBR) techniques, which are externally bonded reinforcement in grooves (EBRIG) and externally bonded reinforcement on grooves (EBROG) techniques; these techniques not only improve the load-carrying capacity of RC members but also can postpone debonding of FRP sheets in strengthened beams compared to EBR techniques [9,10,11,12,13].
Currently, worldwide terrorist activities and threats pose a significant challenge to civil infrastructures, necessitating the construction of structures with blast and impact resistance. As a result, FRP materials can be used to strengthen RC constructions against both static and blast and impact loads. However, there are few studies on reinforcing RC structures subjected to blast loading [14,15]. Previous research on FRP-strengthened RC beams against impact loading is also relatively limited [16,17,18,19,20,21,22,23,24,25,26,27,28,29,30]. Kishi et al. [16] examined the impact resistance of RC beams strengthened with FRP sheets. Low-velocity impact loading experiments were conducted on beams strengthened by bonding either AFRP or carbon FRP (CFRP) sheets to the tension-side surfaces, and the findings demonstrated that flexural strengthening using FRP sheets can improve the impact-resistant capacities of such beams. The strengthening effects are equivalent regardless of the sheet materials when the axial stiffness values of sheets are equal. The dynamic behavior of RC beams reinforced with CFRP laminates or steel plates was investigated by Erki and Meier [17]. Impact loading was achieved in their experiments by elevating one end of a simply supported beam and then dropping it from various heights. The results revealed that the RC beams externally strengthened with CFRP laminates act well under impact loading; however, they cannot absorb the same energy as beams externally reinforced with steel plates. To experience both negative and positive moments, Tang and Saadatmanesh [18] conducted drop-weight impact experiments on non-shear-reinforced RC beams strengthened by attaching either CFRP or Kevlar FRP laminates to the top and bottom surfaces of the beams. According to their findings, composite laminates reduce the maximum deflection and considerably improve the capacity of RC beams to resist impact loading. Pham and Hao [19] investigated the impact behaviors of RC beams strengthened by FRP and the contribution of FRP to shear strength. Their investigation used CFRP U-wraps and 45°-angle wraps to strengthen RC beams without stirrups. Their findings, 45°-angle wraps outperform FRP U-wraps in load-carrying capacities and beam deflections when the same amount of FRP is used. In addition, the RC beams’ failure modes shifted from ductile flexure failure under static loading to brittle shear failure under impact loading. Pham and Hao [20] studied the behavior of CFRP-strengthened RC beams under static and impact loads using longitudinal FRP strips and FRP U-wraps. Curved soffits were added to the sections of some of the beams to reduce the stress concentration of the FRP U-wraps and create a confinement effect on the longitudinal FRP strips. Compared to rectangular counterparts strengthened with the same volume of FRP, the results reveal that their modification technique significantly improves load-carrying capacities. Furthermore, in the impact loading tests, all of the beams failed statically in the pure flexural mode and shifted to the shear-flexure mode, while the strengthened beams failed with FRP sheet debonding or/and rupturing. Other studies [21,22,23,24,25,26,27,28,29,30] showed that the impact-resistant capacities of all RC beams are improved after they are strengthened with FRP materials. However, the failure mechanism of the FRP sheet of strengthened beams under impact loading is still unclear.
Although the flexural load-carrying capacity and failure behavior of reinforced RC beams under impact loading has been investigated, FRP volume’s influence on the rupture/debonding of FRP sheets in the strengthened beams has yet to be studied. Furthermore, the effect of the input impact energy on the failure mode of the beam has also not been elucidated. On the other hand, Kishi et al. [31] indicated that the failure mode of flexural strengthened RC beams under static loading depends on the calculated bending moment capacity ratio My/Mu, where My and Mu denote the bending moment at rebar yielding and the ultimate moment capacity of strengthened RC beams, respectively. Flexural compression failure, which is reached when RC beams fail due to sheet debonding after reaching a calculated ultimate compressive state, was reached when My/Mu was greater than 0.70. Furthermore, debonding failure, which is reached when RC beams fail due to sheet debonding before reaching a calculated ultimate compressive state, was reached when My/Mu was less than 0.70. However, this failure mode has not been investigated yet in the case of impact loading. Moreover, in the above studies, the relationship on failure modes of strengthened RC beams strengthened with FRP sheets between static and impact loading cases also has not been clarified yet.
This work focuses on RC beams with stirrups that approach the ultimate state statically and demonstrate flexural failures from this perspective. Low-velocity drop-weight impact loading tests on RC beams strengthened in flexure with AFRP sheets were carried out to evaluate the effects of the sheet volume and weight drop height on the dynamic responses of the beams. Static loading experiments were also used to study the load-carrying capacity, strain distribution, crack distribution, and failure behavior of the beams, with the results being compared to impact loading tests. The main focus of this investigation was the failure mode of RC beams strengthened in flexure with externally bonded AFRP sheets under impact loads. The impact resistance, impact-resistant properties, and failure behavior of the beams were also examined. This research aims to determine the proper AFRP sheet volume when reinforcing RC beams and to predict when the beam will fail based on the input energy impact. According to our prior research [16], if the axial stiffness values of AFRP and CFRP sheets were identical, the impact resistance behaviors of the strengthened beams with both FRP sheets were also similar. Because of its flexibility and ease of installation, the AFRP sheet was chosen for this research.

2. Experimental Overview

Table 1 lists the specimens used in this study. The nominal names of the specimens are shown in this table with a hyphen in the order of the reinforcing material (N: none, A: AFRP), loading type (S: static loading, I: impact loading), and weight drop height Hn (n: drop height in metric units). In Table 1, the actual input energy (Er = 2/2) was estimated based on the weight of the drop (m = 300 kg), and the weight’s measured drop velocity (υ) just before impacting the upper surface of the beam.
The beams’ calculated flexural and shear load capacity was computed using the material parameters of concrete, rebar, and AFRP sheets (Table 2) following the Standard Specification for Concrete Structure [32,33]. Here, the shear load capacity was estimated from formulas in the reference [32,33]. The flexural load capacity is the maximum load value determined from each beam’s calculated load-displacement relationship curve. The calculation procedure of the load-displacement curve will be discussed in Section 3.1.1. According to Table 1, the strengthened RC beams should statically reach the flexure failure mode because the shear-flexural capacity ratio α = Vusc/Pusc of all beams with/without strengthening is more than 2.0.
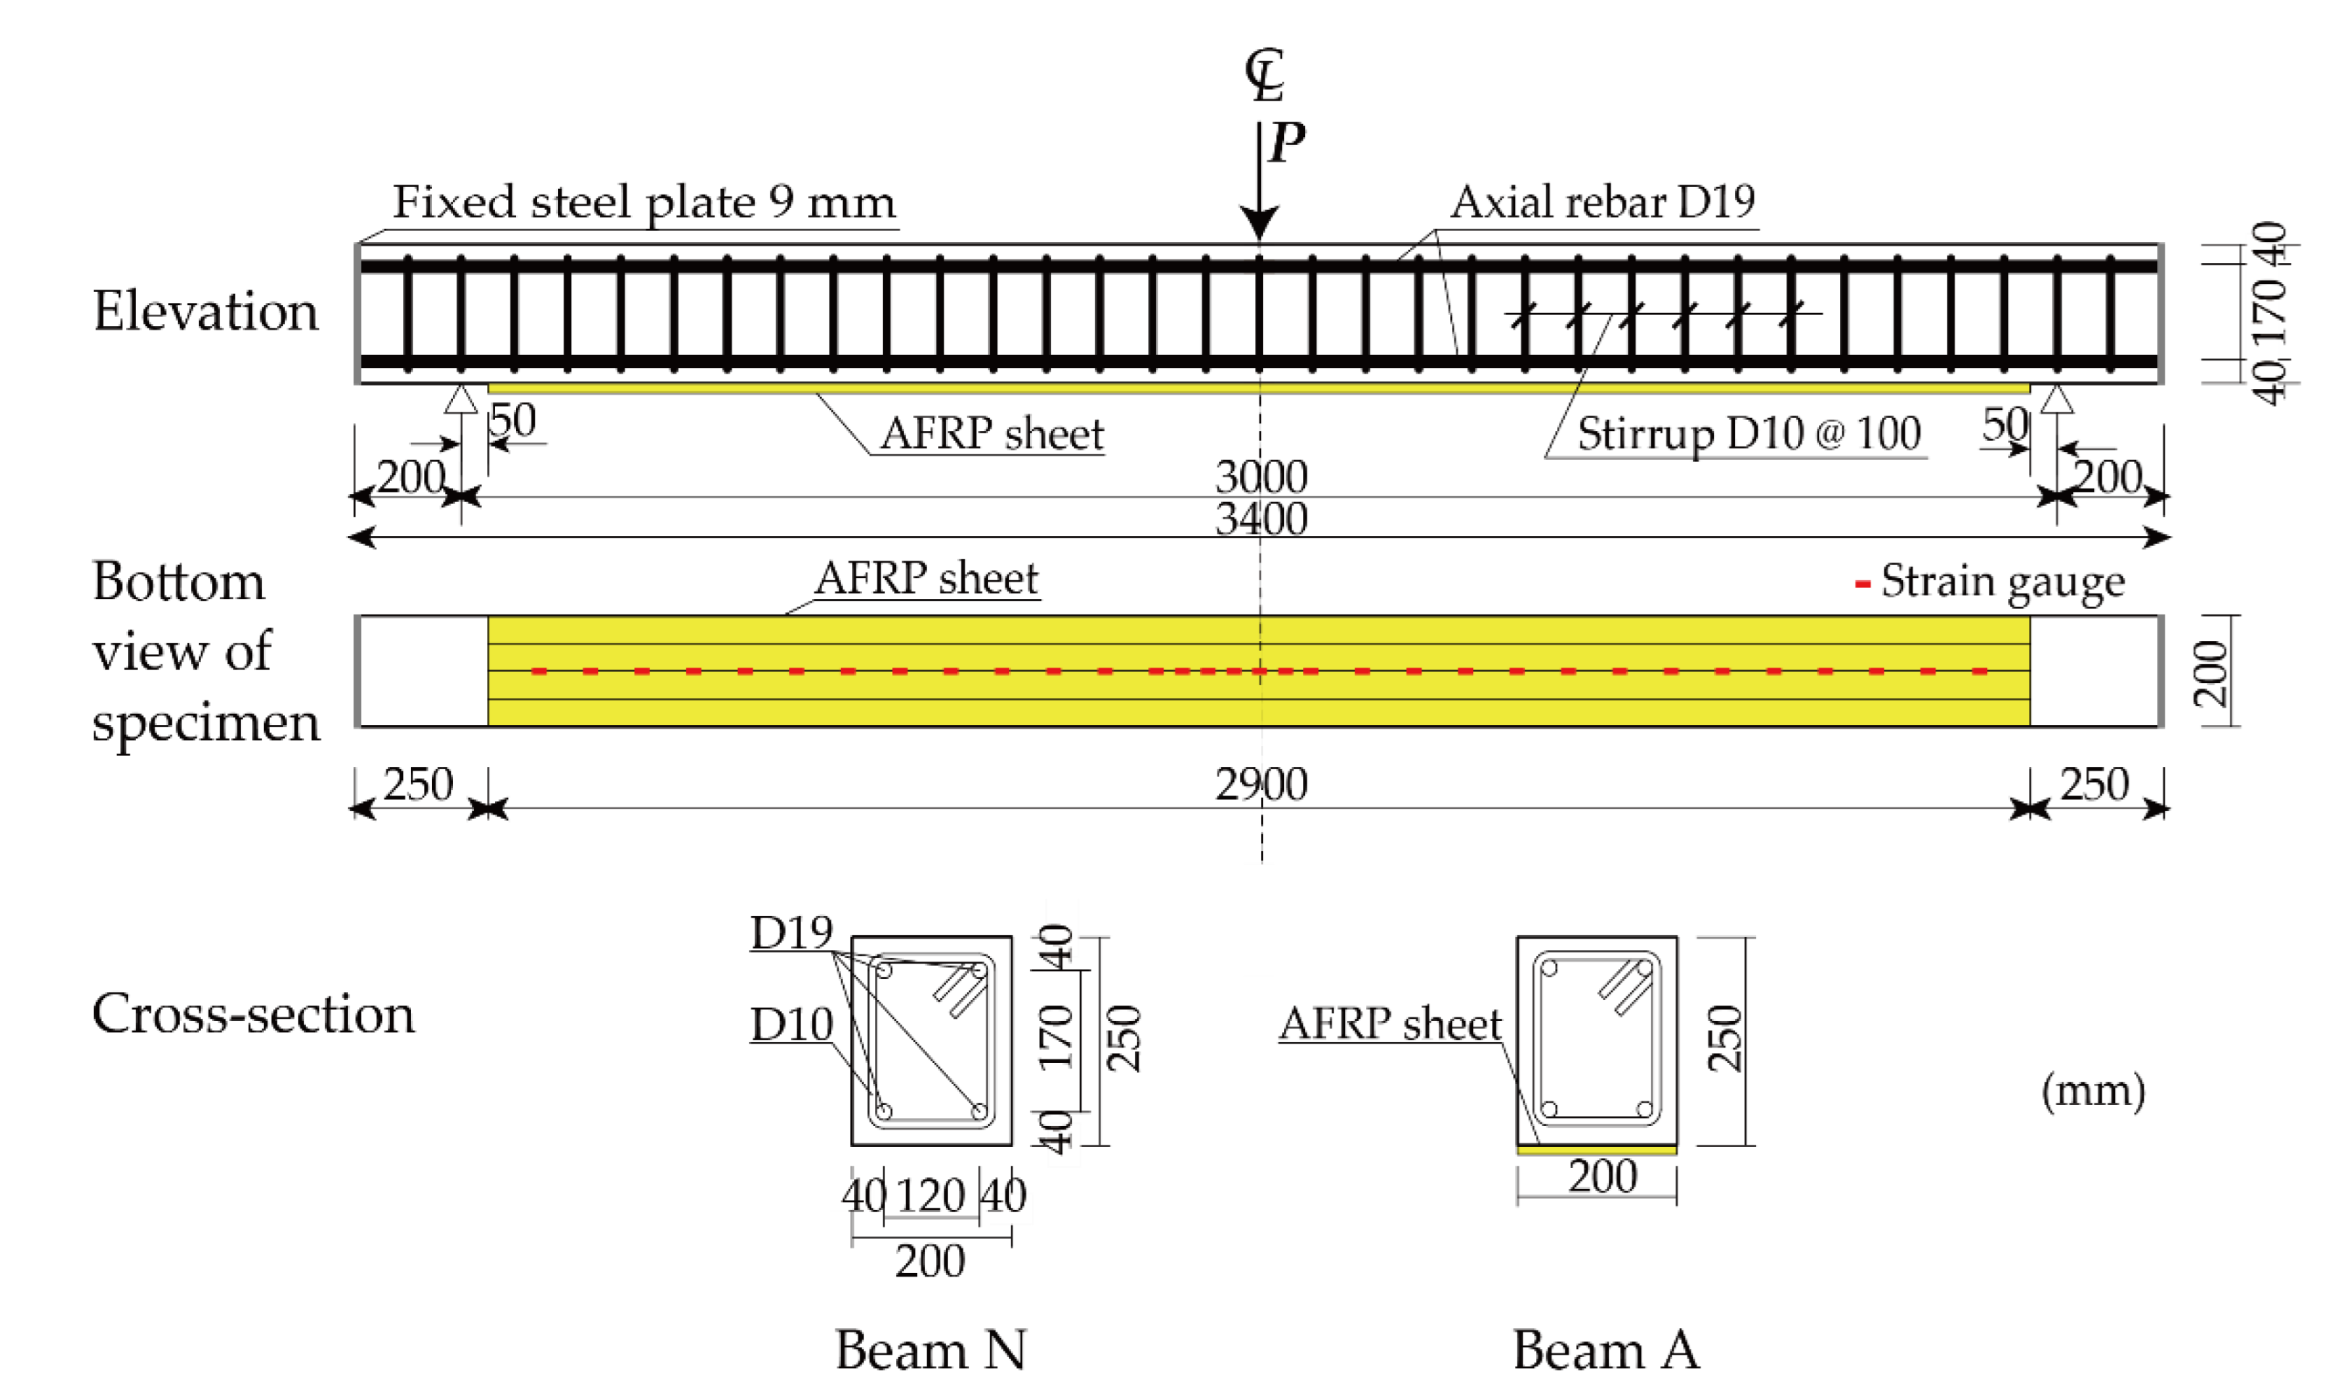
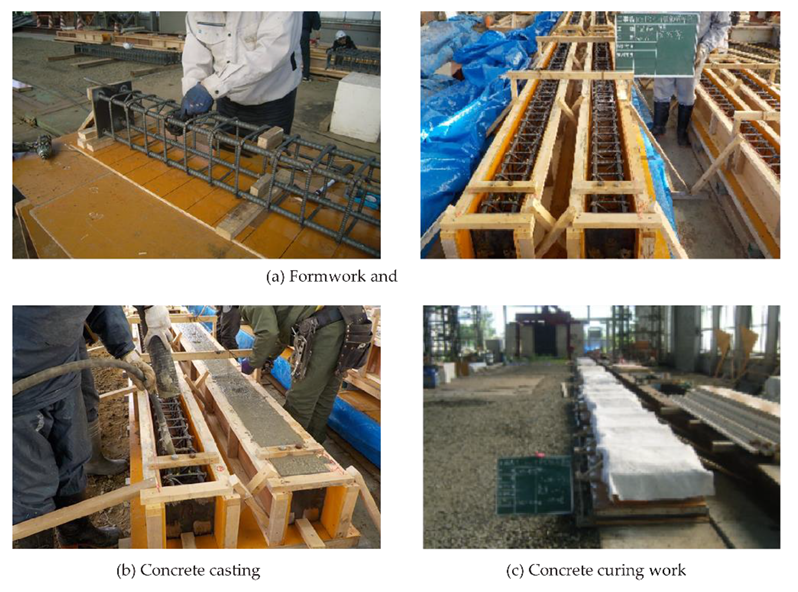
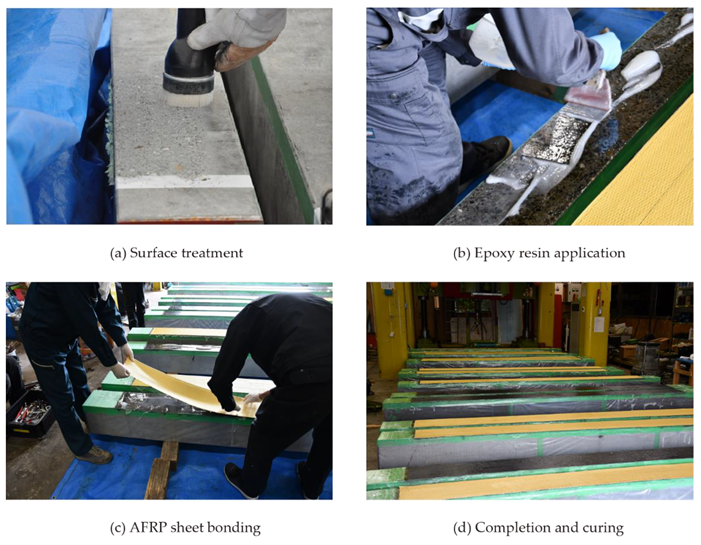
Figure 1 shows the specimen dimensions and the layouts of the rebars and AFRP sheets. The beams were 200 mm wide, 250 mm deep, and 3 m long (clear span), so they all had rectangular cross-sections, which were determined based on the laboratory workspace and the capabilities of the test equipment. Axial rebars with a diameter of 19 mm were welded to the 9 mm thick steel plates at the ends of the beams to ensure full anchorage and reduce the distance between the support point and the free edge, reducing the part’s influence on the beam’s impact response characteristics. Here, two rebars were placed on the upper side, and two rebars were placed on the lower side. Furthermore, the stirrups with diameters of 10 mm, were placed at 100 mm intervals. The ready-mixed concrete was used to cast the beams with a mix proportion table shown in Table 3. The RC beam casting procedure is illustrated in Figure 2. The compressive strength of concrete, the yield strength of the main rebar, and the yield strength of the stirrup are listed in Table 1. The AFRP sheets were bonded to the tension-side surfaces of the beams, leaving 50 mm between the end of each sheet and the support point. The bonded concrete surface was grit-blasted to a depth of approximately 1 mm to improve the bonding capacity, then was cleaned with acetone and coated with primer. The adhesive used to bond the sheet to the concrete substrate is epoxy resin, and its material properties are listed in Table 4. The epoxy resin was cured for at least seven days under conditions of temperature above 20 °C and humidity below 70%. The AFRP sheet bonding procedure was summarized in Figure 3. Each beam was reinforced by bonding a one-ply AFRP sheet with an areal mass of 415 or 830 g/m2 and/or two-ply AFRP sheets with a total amount of 1660 g/m2, where each ply had an areal mass of 830 g/m2. Table 2 lists the material parameters of the AFRP sheets used in this work, as provided by the manufacturer Fibex [34]. Testing based on JIS K 7165 [35] was used to determine these parameters.
Static loading tests were conducted according to the three-point loading test method, as indicated in Figure 4. A loading jig with a width of 100 mm in the span direction was used to surcharge the load at the beam’s midspan, where a hydraulic jack with a capacity of 500 kN was used. For Beam A-S, which was strengthened with an AFRP sheet, the load was applied until the sheet was debonded or ruptured. As for Beam N-S, which was not reinforced with an AFRP sheet, the load gradually increased after the rebar yielded due to the plastic hardening effect of the rebar; therefore, the load was applied until the beam deflected to roughly 90 mm.
The setup for the drop-weight impact loading test is shown in Figure 5. A 300 kg steel weight was dropped from a predefined height onto the midspans of the beams to apply an impact load. The weight was composed of a solid steel cylinder with a length of 1.4 m and a diameter of 200 mm at the striking part, with a 2 mm taper on the impact surface to prevent one-sided contact. The drop heights of the weight were selected as 0.5, 1.0, 2.0, 2.5, 3.0, and 3.5 m by reference to the previous study [16].
The impact force P, total response force R, midspan deflection (hence, deflection) D, and axial strain distribution of the AFRP sheets were all measured during this test. Laser-type linear variable displacement transducers measured beam deflections, including residual deflections following impact loading. A 2000 fps high-speed camera was used to track the dynamic behavior of the beams near the loading point. Each test was followed by a sketch of the crack patterns on one side of the beam.
Both experiments used digital data recorders to amplify and record analog signals from the sensors. For the static loading tests, these analog data were converted into digital data at 0.1 s time intervals and at 0.1 milliseconds (ms) time intervals for the impact loading tests. The time histories of the reaction force R and deflection D for the impact loading tests were also numerically smoothed using the moving rectangular average method with a 0.5 ms window in this study.

3. Experimental Results and Discussions

3.1. Static Loading Tests

3.1.1. Static Load-Deflection Curve

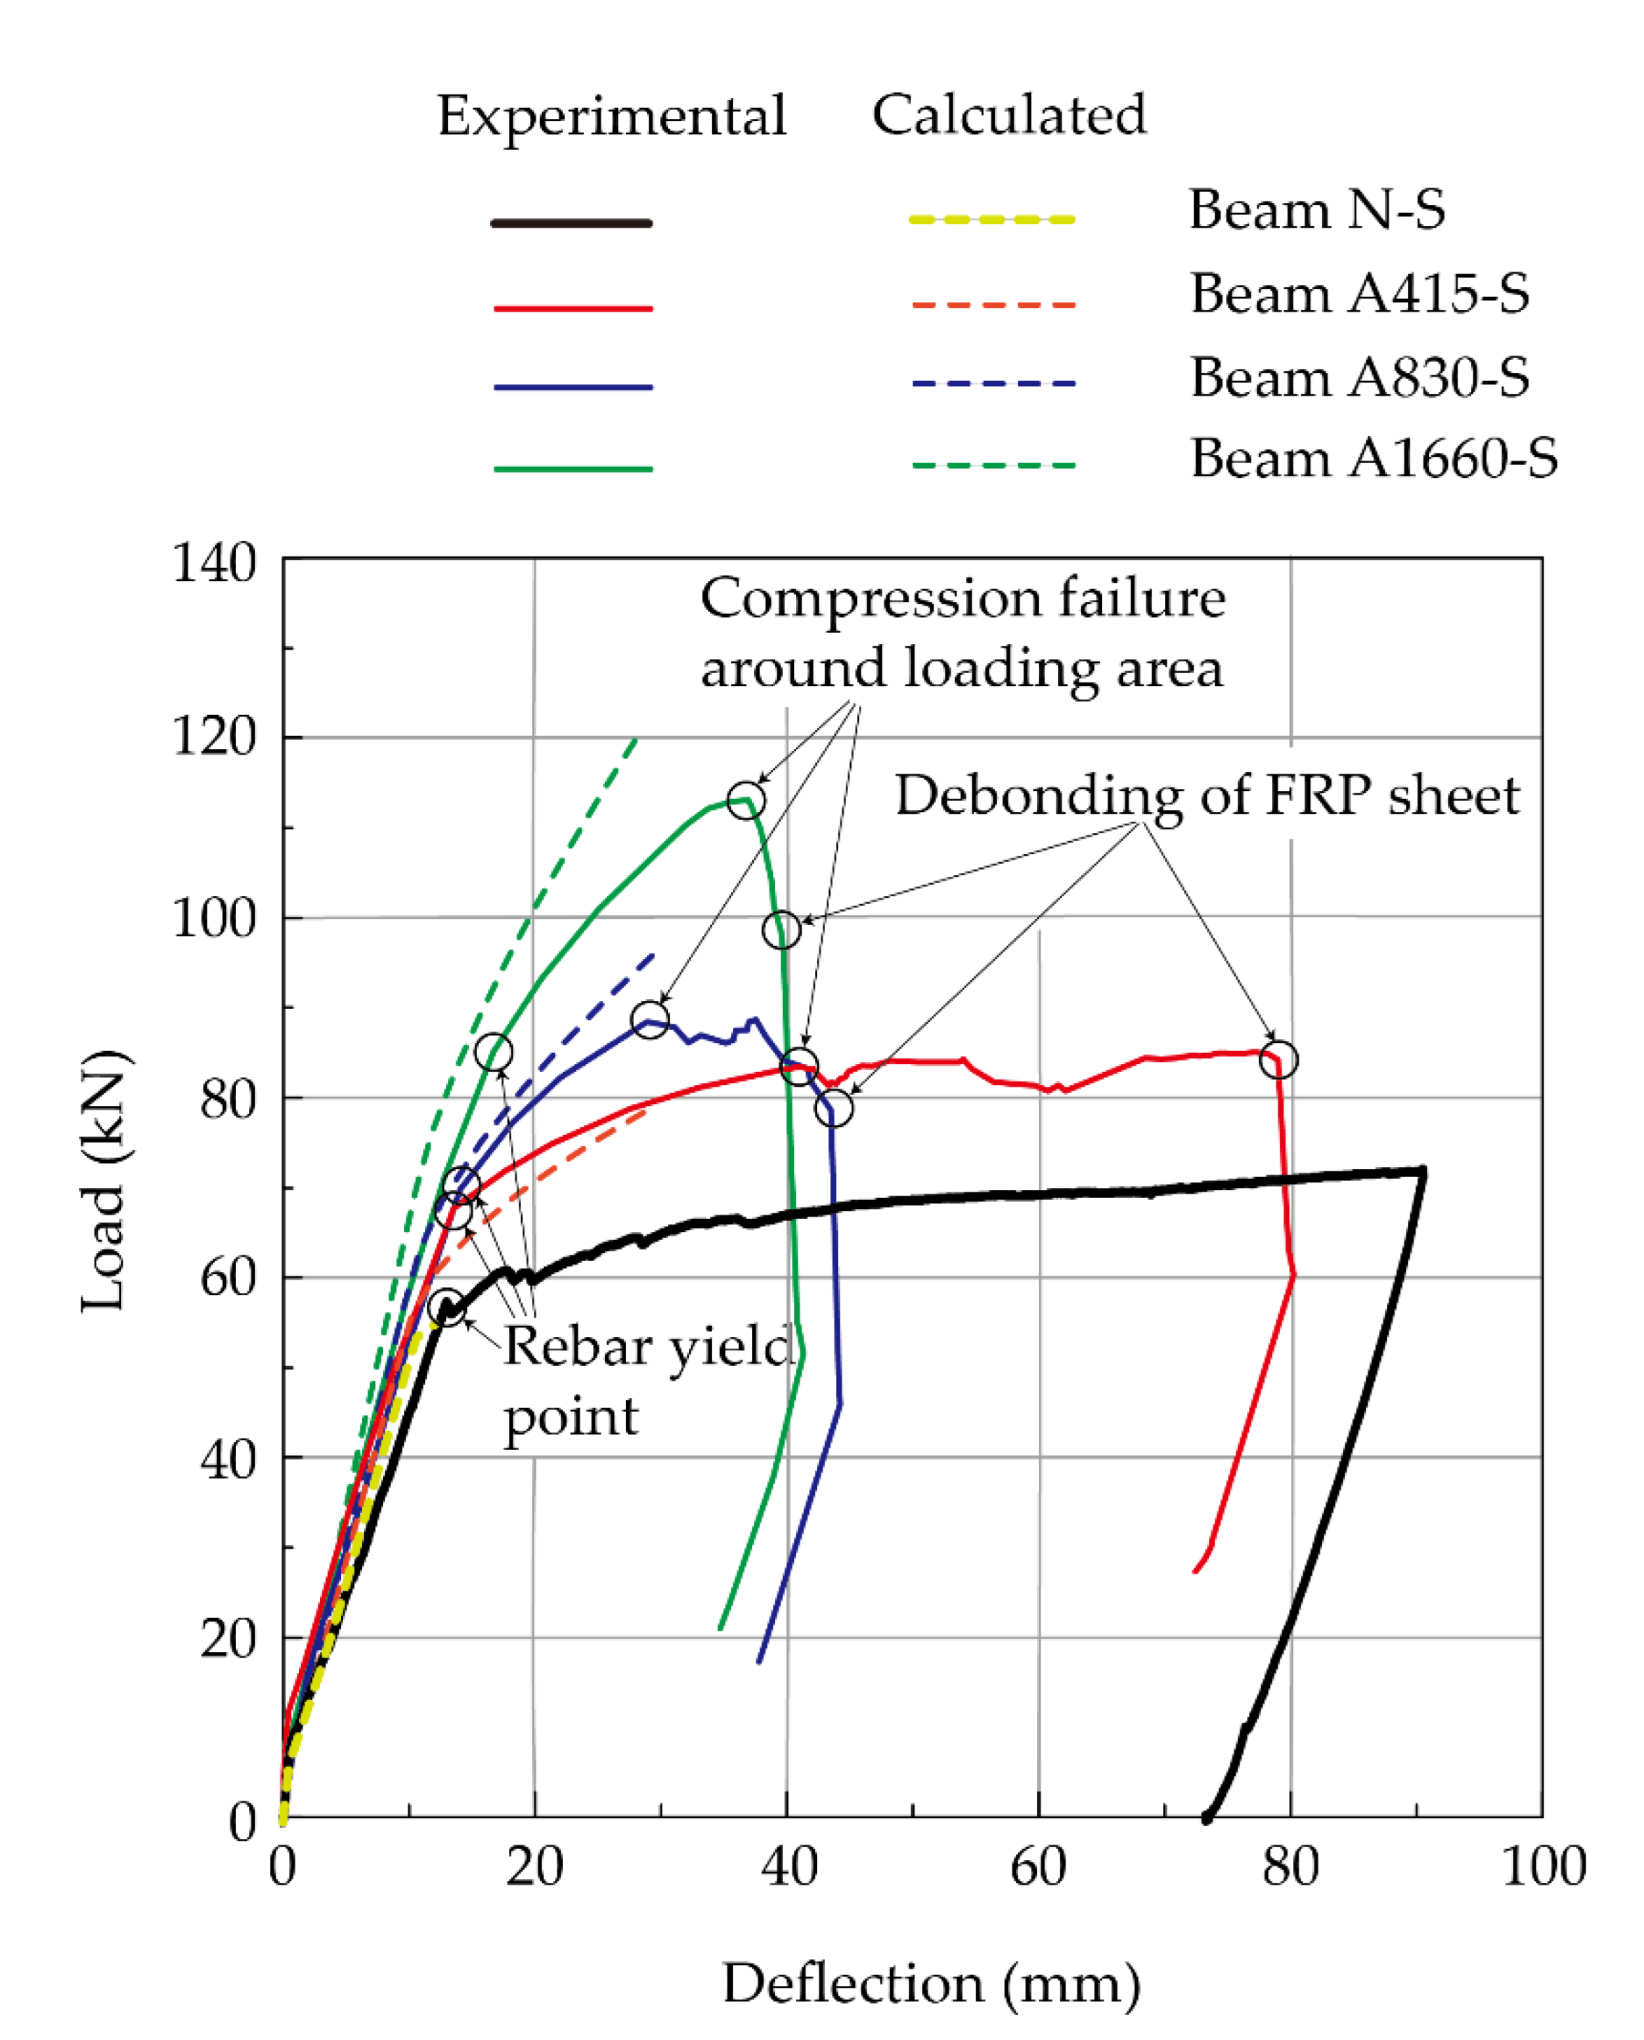
Figure 6 compares the experimental and computed findings of the static load-deflection curves for Beams N-S and A-S. The experimental data are shown in solid lines, while calculated values are shown in dashed lines. The multilayered method [36], based on conventional material strength methodologies, was used to determine the load-deflection curve and axial strain distribution of the AFRP sheets in this study. The following were the methodologies and assumptions used: (1) The concrete and reinforcement, including the FRP sheet, were expected to have a plane section and excellent bonding. (2) The smeared crack technique and (3) layered approach were utilized, (4) and the stress–strain relationship was assumed for each material, as illustrated in Figure 7, based on the Standard Specification for Concrete Structure in Japan [32,33]. (5) For each layer, a continuous stress–strain relationship was assumed.
A cross-section of the beam was separated into horizontal layers within 5 mm thicknesses corresponding to either concrete or reinforcements, as illustrated in Figure 8, to correctly evaluate the relationship between the curvature and bending moment for each strain level. Based on the pre-analysis data, the thickness of each layer was established. By gradually adjusting the lower strain and taking the resultant force equilibrium of all layers, the neutral axis and lower fiber strain corresponding to the arbitrary upper fiber strain of the cross-section were obtained. The associated curvature and sectional bending moment can be calculated using these upper and lower fiber strains. The upper fiber compression strain of the concrete might be computed by repeating the previous techniques from zero to the ultimate state (εcu = 0.35%) for these relationships. As a result, for each loading step, the curve distribution of the beam along the span corresponded to the bending moment diagram. Finally, the midspan deflection was determined by calculating the moment at the midspan of the simply supported beam subjected to curvature distribution using Mohr’s integral technique.
Table 5 shows the experimental and calculated results at the main rebar yield and maximum load for Beams N-S, A415-S, A830-S, and A1660-S. Here, the yield load was determined from the second inflection point of each load-displacement relationship curve in Figure 6. For Beam N-S, the maximum load was evaluated using the midspan deflection at 40 mm because the load monotonically increased due to the rebar’s plastic hardening effect. The experimental results show that the yielding load and maximum load of Beams A-S increased by 1.2 to 1.5 times and 1.3 to 1.7 times, respectively, compared with Beam N-S. Furthermore, the calculated results showed that Beam N-S reached the ultimate state immediately after the rebar yielded due to the upper fiber strain reaching the ultimate compressive state with εcu = 0.35%, whereas Beam A-S reached the ultimate state with the sheet debonding failure mode over the calculated deflection at the ultimate state.
From Figure 6, by comparing the experimental and the calculated results for Beam A415-S, it can be seen that the calculated result roughly corresponded to the experimental result until the beam reached the calculated ultimate state. It was assumed that the FPR material was completely bonded to the concrete. Furthermore, in the experiment, the load did not decrease even after reaching the calculated deflection at the ultimate state, meaning that the load-carrying capacity of the beam was significantly improved due to the strengthening effect of the AFRP sheet. The beam failed because the AFRP sheet debonded at a displacement of about 80 mm after reaching compressive failure around the loading area.
Regarding Beams A830-S and A1660-S, the measured maximum load is less than the calculated one (Table 5). For Beams A830-S and A1660-S, it was confirmed that the sheet was gradually debonded after the rebar yielded and/or before the rebar yielded, respectively (Figure 6). Here, the sheet was debonded due to the peeling action of the tips of the critical diagonal cracks developed at the lower concrete cover of the beam near the loading area. Thus, when the FRP sheet volume is relatively large, the sheets tend to debond earlier than calculated.
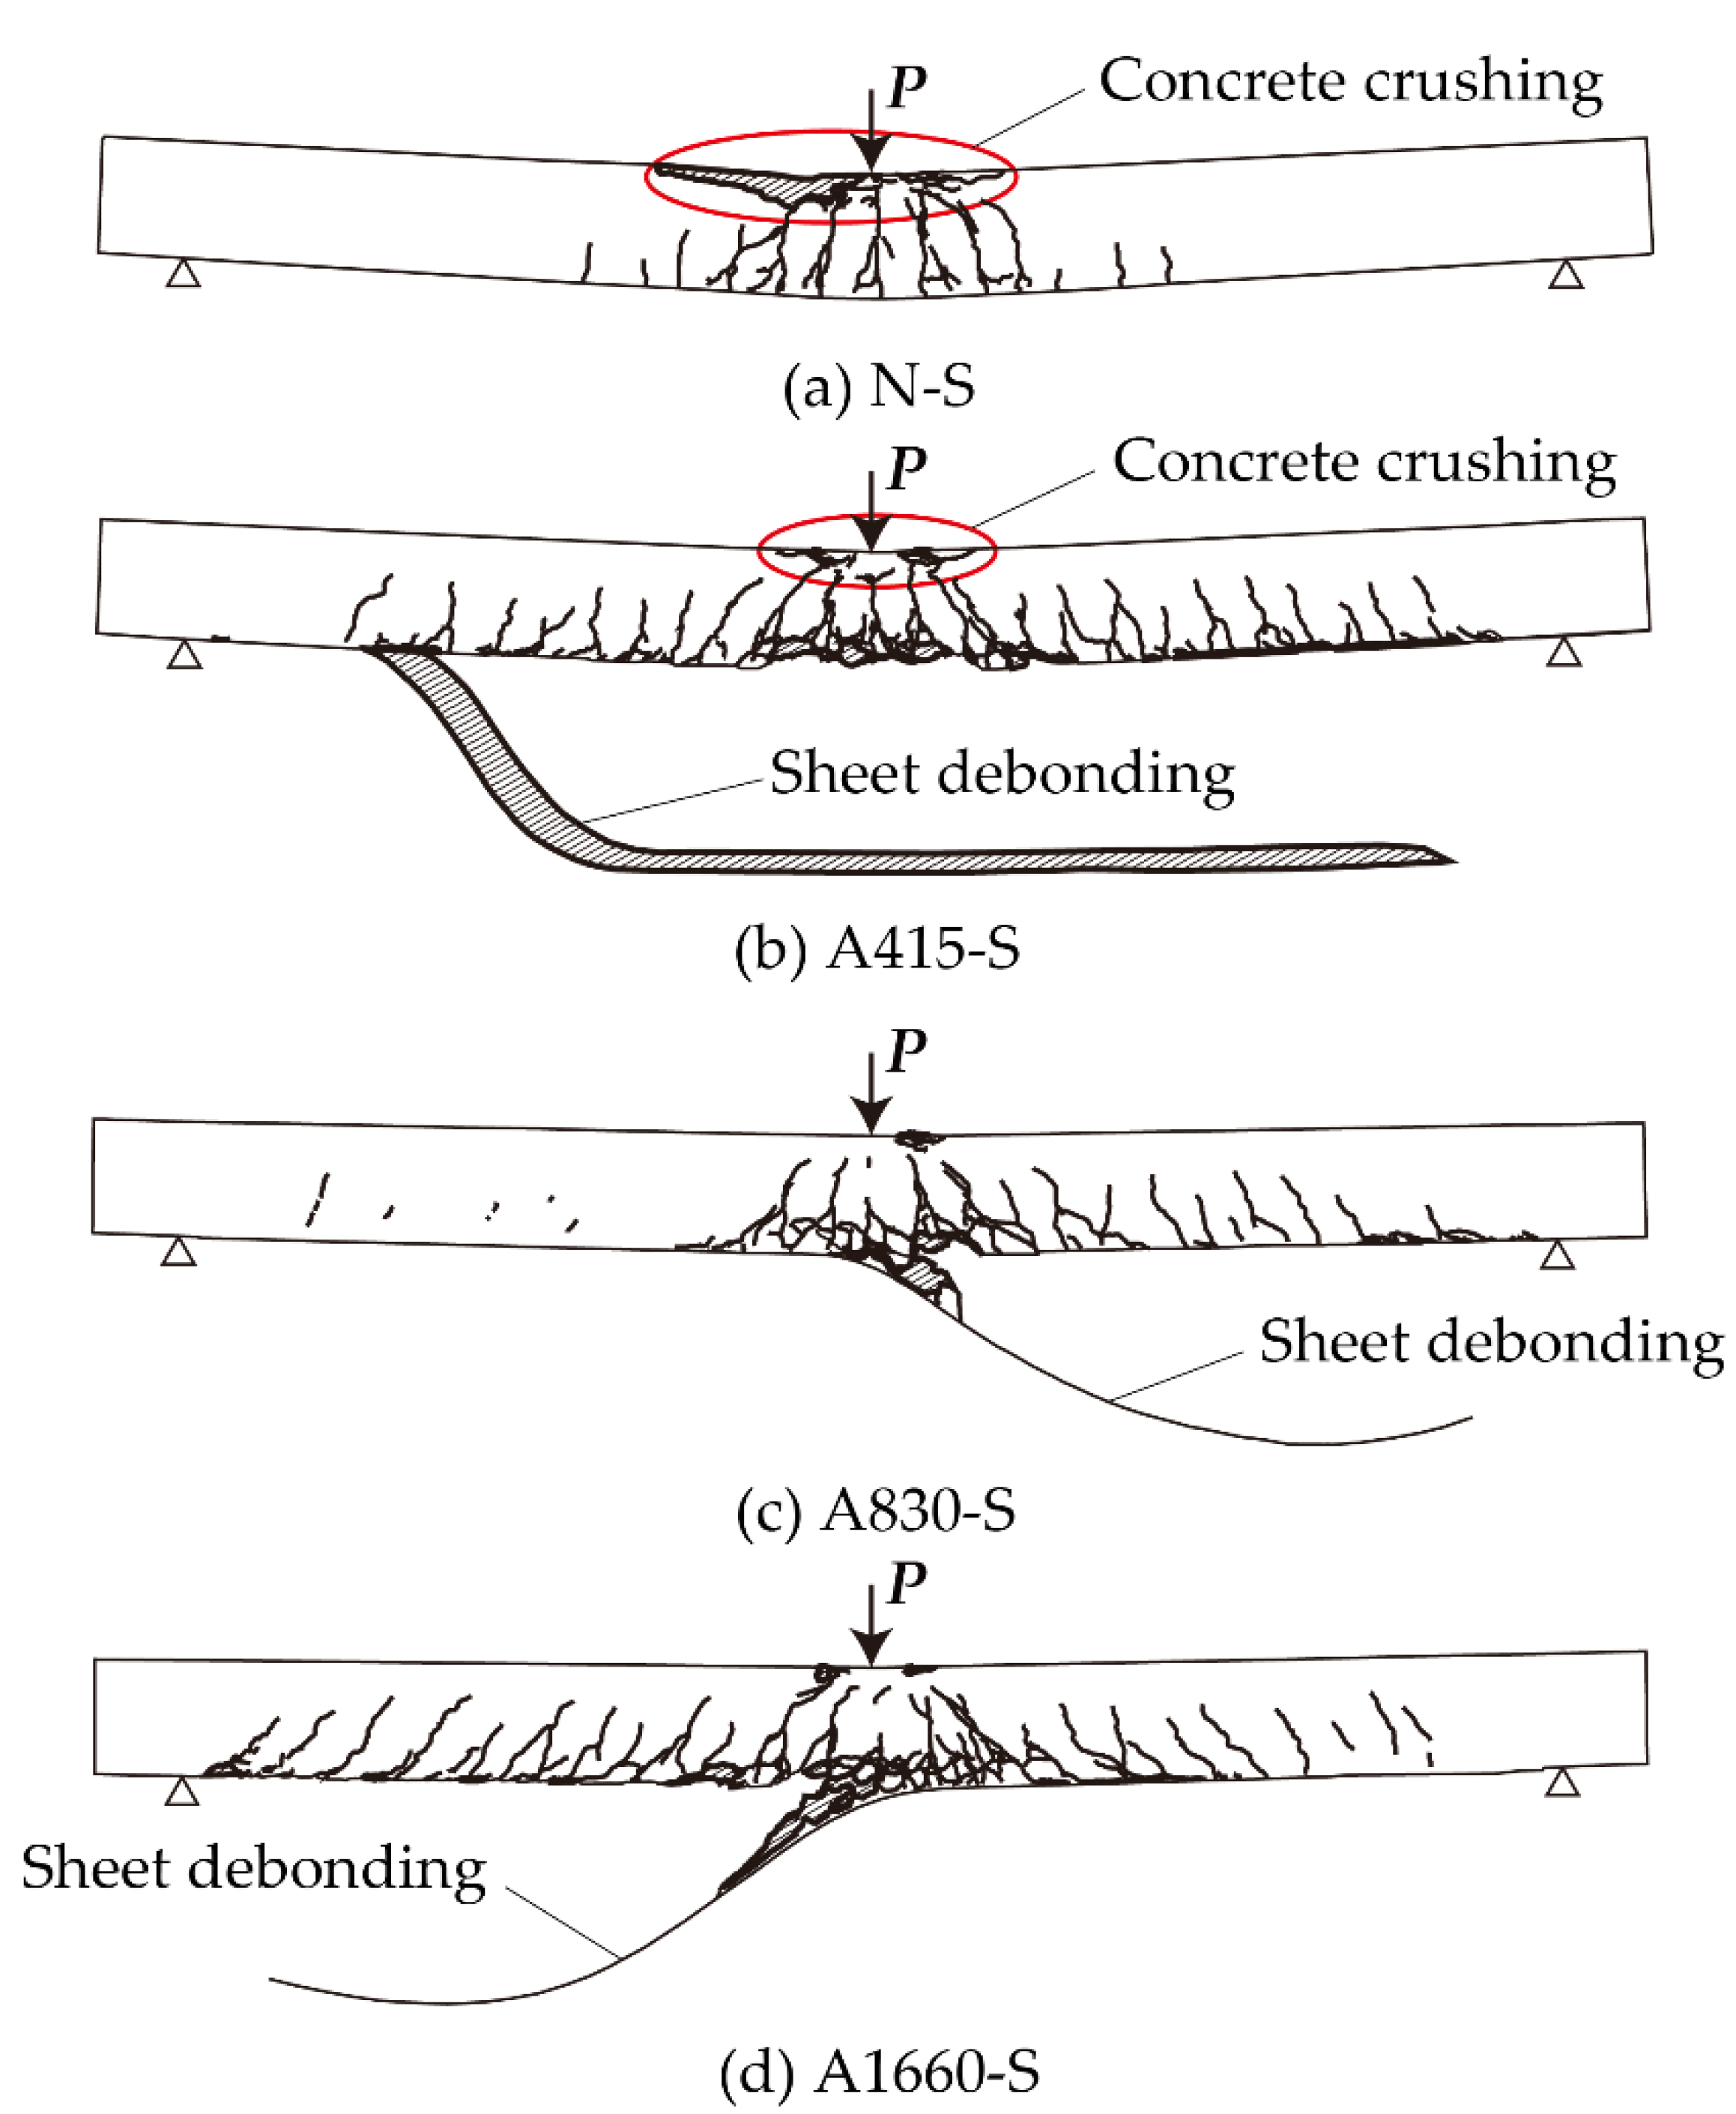
The failure modes of these experimental results have the same tendency as the previous research [31]. Beam A415-S was classified as “Flexural compression failure,” where it reached the ultimate state due to the debonding of the sheet after the upper concrete cover was crushed. Beams A830-S and A1660-S were classified as “Debonding failure,” where they reached the ultimate state due to the sheet debonding without upper concrete crushing.

3.1.2. Strain Distribution of the AFRP Sheet

Figure 9 compares the calculated and experimental axial strain distributions of the AFRP sheet for Beams A415/A830/A1660-S at the calculated ultimate state, which corresponds to the calculated deflection at the ultimate state. Assuming perfect bonding between the AFRP sheet and concrete, the calculated results were estimated based on the multilayered method [36], as mentioned above. From the calculated results, it was found that the central triangular area, including the loading point, corresponded to the main rebar yield area. The slope of the strain distribution curve at each half span of the beam dramatically increased approximately 500 mm away from the midspan because the rebars were yielded at this area (the triangular area including the loading point). The strain distribution linearly increased toward the midspan point, corresponding with the increase in the bending moment.
From the figure, in the case of Beam A415-S, although a few points in the experimental strain distribution were greater than the calculated ones, those approximately better correspond from the loading point to both ends of support points to each other. In other words, it can be confirmed that the AFRP sheet and concrete were perfectly bonded to each other until reaching the calculated ultimate state.
In the case of Beams A830/A1660-S, the experimental strain distributions were approximately uniform, approximately 500 mm near the loading point, and the strains were smaller than those of the calculated ones, implying a tendency of sheet debonding. In addition, although the experimental strain results were slightly larger than the calculated results in the main rebar yield area, it was concluded that debonding of the sheet had not completely occurred.

3.1.3. Crack Patterns for Beams after Static Loading Tests

Figure 10 compares the crack patterns of Beams N-S and Am-S (m: index of mass per areal unit of FRP sheet bonded for each beam, m = 415, 830, and 1660) after the static loading tests. Flexural cracks occurred from the lower concrete cover around the loading point toward the loading point for all beams, as shown in the figure.
Beam N-S developed numerous flexural cracks around the loading area, the upper concrete cover near the loading point was severely damaged, and the beam was permanently deformed near this location. Beam N-S failed with flexural failure mode. Compared to Beam N-S, flexural cracks in Beam Am-S were more widely distributed throughout the beam, and the beams were not permanently deformed due to the strengthening effect of AFRP sheets. However, Beam A415-S was the most damaged strengthened beam because the upper concrete cover was crushed around the loading point. While Beam A830/1660-S’s upper concrete cover was not crushed around the loading area, its damage was less than Beam A415-S. Flexural cracks in Beam A830-S were mainly observed on the beam’s right side, and Beam A830-S was less deformed than Beam A1660-S. It could be because the sheet of Beam A1660-S was more debonded than that of Beam A830-S. Due to the peeling action of the tips of the crucial diagonal cracks created at the lower concrete cover of the beam near the loading area, the sheet was debonded. All the strengthened beams failed due to sheet debonding with flexural failure mode.
Because the sheets debonded from the lower concrete coverings around the loading point (Figure 11), the bonding strength between the sheet and concrete may have been more significant than the concrete’s tensile strength.

3.2. Drop-Weight Impact Tests

3.2.1. Time Histories of the Impact Force, Reaction Force, and Deflection

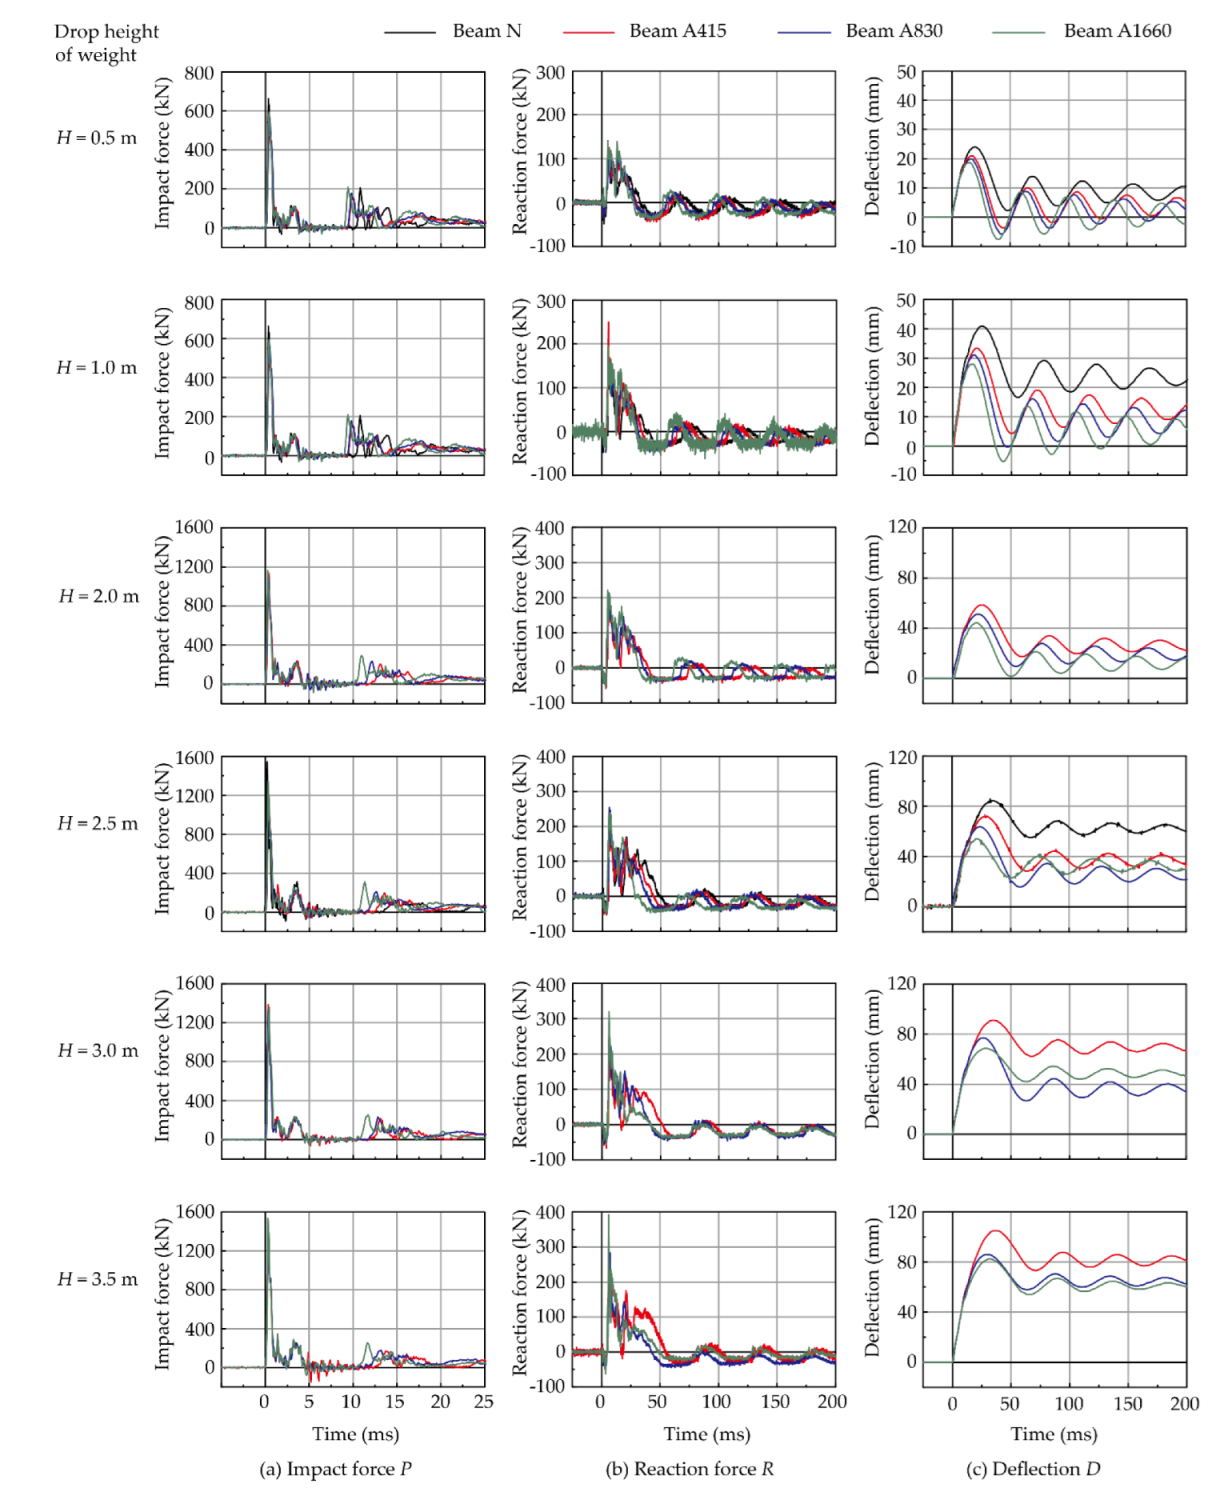
The time histories of the impact force P, response force R, and deflection D of the RC beams reinforced and unreinforced with AFRP sheets in flexure under impact loading are shown in Figure 12. Table 6 summarizes the maximum impact force, reaction force, deflection, and residual deflection of all the tested beams. In this table, the actual input impact energy is taken, as shown in Table 1.
Figure 12a demonstrates the time history of the impact force P in 25 ms intervals from the start of the impact. It can be seen that the responses of all beams with/without strengthening had similar time histories, regardless of the sheet volume or drop height of the weight. First, at the start of the impact, the time history showed the first peak with a triangular shape, high amplitude, and short duration (approximately 1 ms). Second, the triangular-shaped second peak with lower amplitude was excited. Table 6 showed that regardless of the beam (with/without strengthening with FRP sheets), the maximum impact force increased with the increasing drop height. However, the maximum impact force increased with increasing flexural stiffness at the same set drop height. Tang and Saadatmanesh [18] previously reported this result.
Figure 12b shows the time histories of the reaction force R in 200 ms time intervals from the beginning of impact. It can be observed that the responses of all beams (with/without strengthening) had similar time histories regardless of the sheet volume and/or weight drop height. At the beginning of the impact, a negative reaction force was excited with a magnitude of ~50 kN for the tightening force. This means that the cross beams at the support points were tightened to prevent the rebound of the beam before taking zero balance of the amplifier device. This phenomenon was also reported in previous studies (Kishi et al. [16], Pham and Hao [20], Cotsovos [21]).
The first triangular-shaped peak was excited with high amplitude and a short period. Following that, the following triangular-shaped peaks were excited with lower amplitudes. Due to the increased bending stiffness of the strengthened beams, the primary response tended to be prolonged with increasing drop height, and it had a shorter time duration with increasing sheet volume at the same drop height. The time history after the primary response showed damped sinusoidal shapes due to the beam vibrating at a low frequency after unloading.
Table 6 shows that the maximum reaction force increased as the drop height increased for the nonstrengthened and strengthened RC beams. The forces on the reinforced RC beams at the same drop height increased as the sheet volume rose.
Figure 12c shows the time histories of deflection D in the first 200 ms from the beginning of impact. Half-sine waveforms can be recognized in the primary responses. The deflection was restrained after the main response, and the beams showed damped free vibration with low frequency. As the drop height H was increased, the beam’s maximum/residual deflection tended to increase.
The nonstrengthened beams had greater maximum/residual deflections than the strengthened ones for the drop heights H = 0.5, 1.0, and 2.5 m, as shown by the time histories of the beams.
The maximum and residual deflections of the reinforced beams decreased by about 15 to 35% and 40 to 60 %, respectively, compared to the nonstrengthened beams for the drop height H = 2.5 m, as shown in Table 6. As a result, these deflections could be significantly enhanced by bonding FRP sheets to the tension-side surfaces of the beams. Regarding Beam A1660, the maximum deflection was minimum among the strengthened beams, but the residual deflection was greater than that of Beam A830. This might be due to the sheet debonding after the beam reached the maximum deflection.
The maximum/residual deflections of the strengthened beams decreased with increasing sheet volume for drop heights H = 3.0 and 3.5 m. However, for the drop height H = 3.0 m, the residual deflection of Beam A1660 was greater than that of Beam A830 (Table 6). This could be because the sheet of Beam A1660 was debonded entirely, whereas the sheet of Beam A830 was partially debonded after the beams reached their maximum deflection.
Thus, it was clarified that the impact resistance of the RC beams strengthened with externally bonded AFRP sheets was improved, corresponding to the sheet volume. Furthermore, the larger the sheet volume, the more apparent the sheet debonding. This corresponds to the above-mentioned tendency of the calculated static bending moment ratio value My/Mu. Furthermore, this means that the larger the sheet volume, the smaller the My/Mu value, resulting in a larger main rebar yield area and easier debonding sheets.

3.2.2. Crack Patterns of the RC Beams

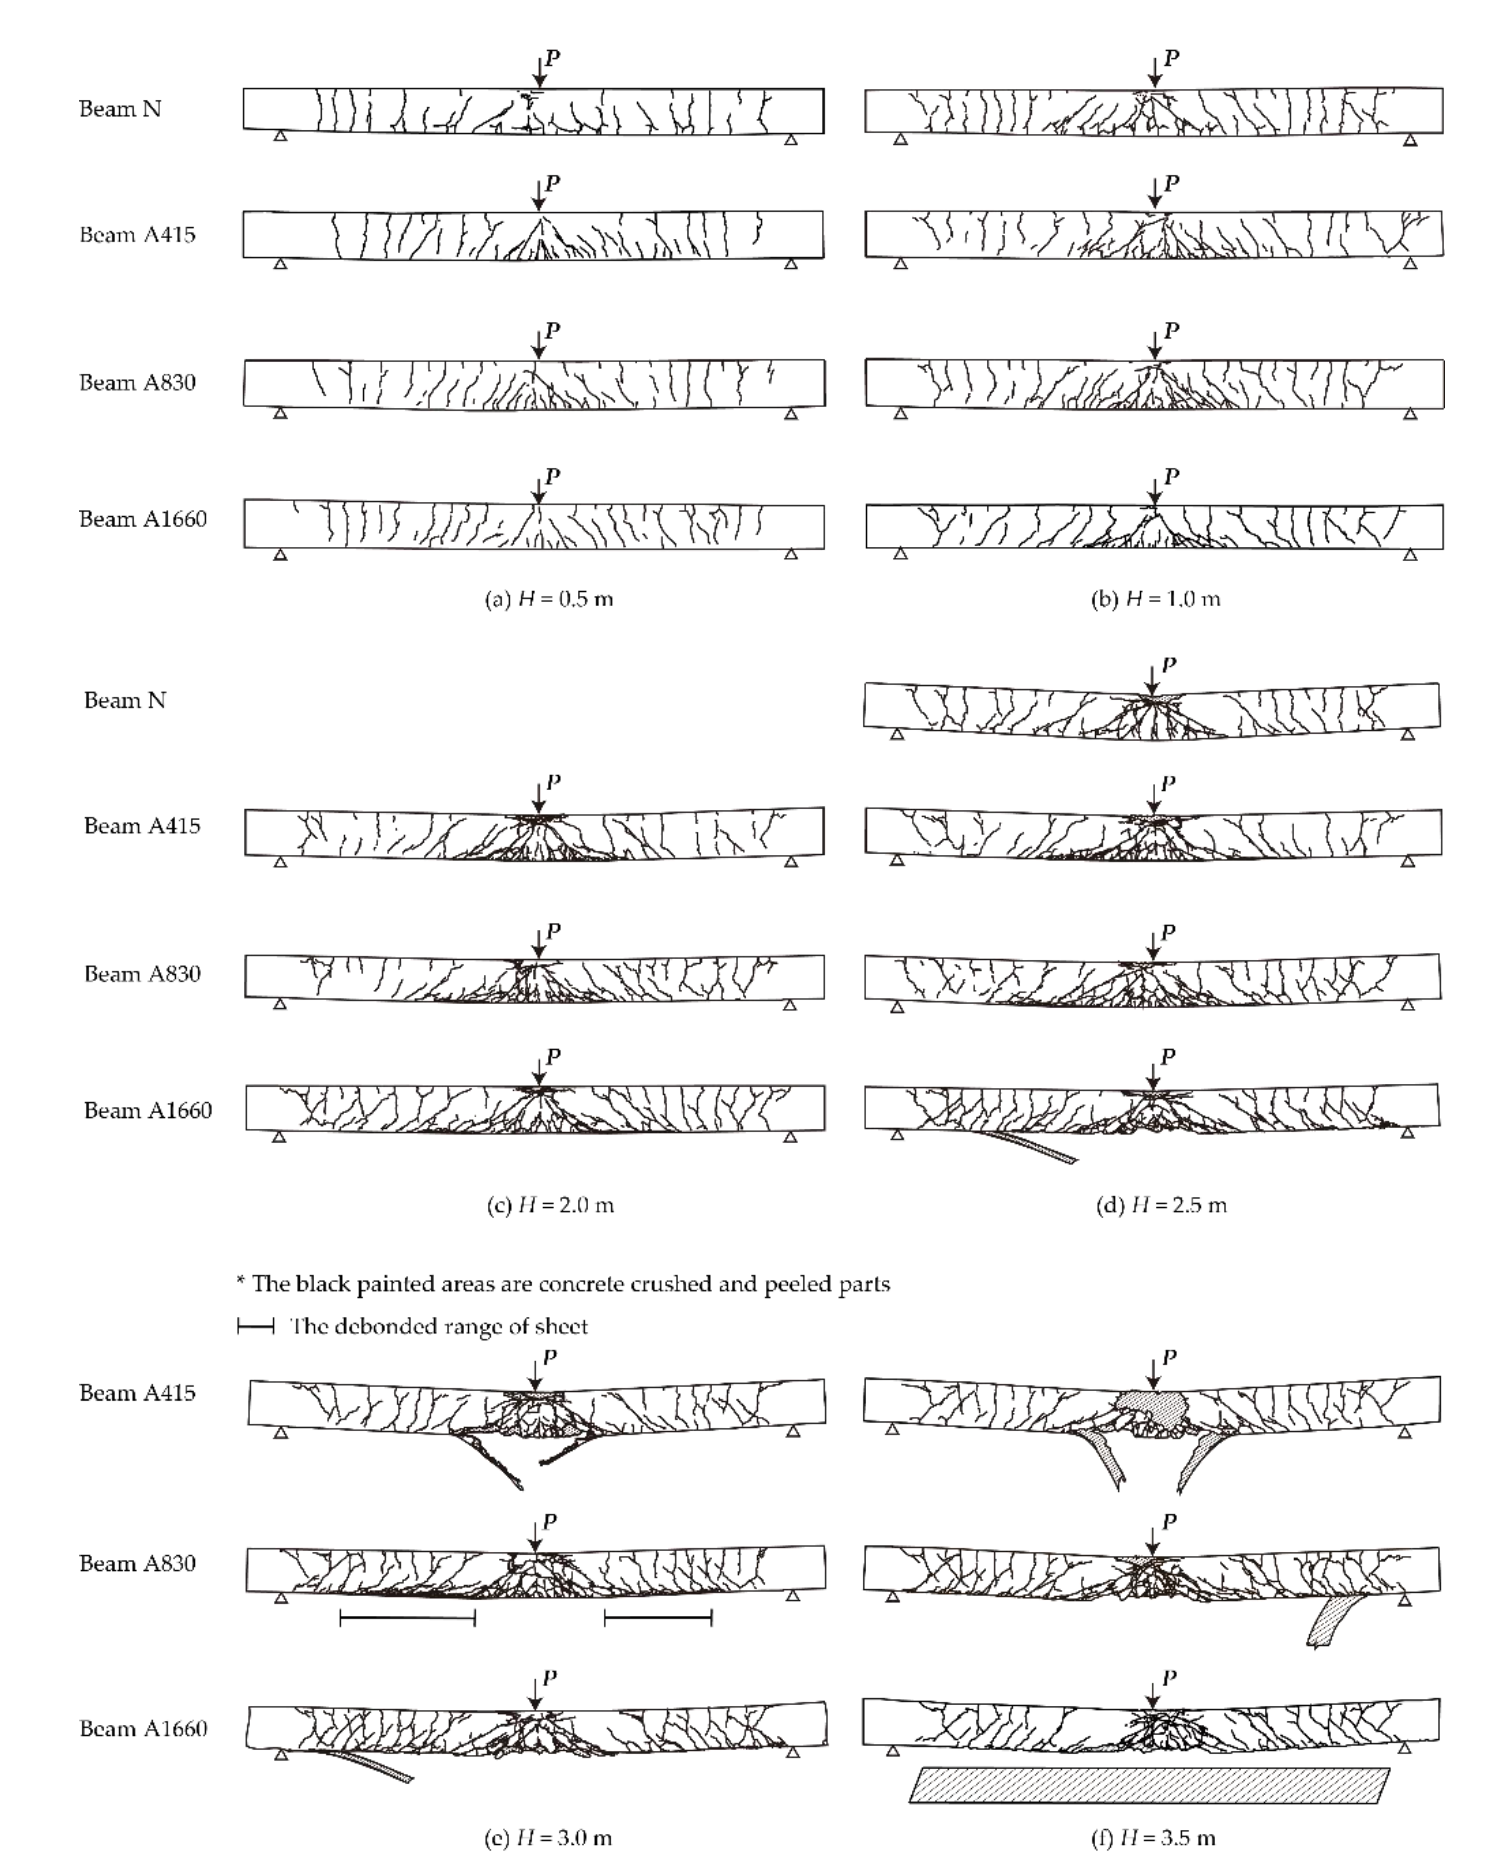
Figure 13 shows crack distributions for all the RC beams with/without strengthening after the impact loading tests.
Both the lower and top concrete covers developed flexural cracks, which progressed throughout the whole span of the beams. In all cases, diagonal cracks appeared near the loading areas. The characteristics of these events were remarkably different from those of the static loading cases (Figure 10). The flexural waves traveling toward the support points of the fixed beams at the start of impact may be responsible for the development of crack patterns from the upper concrete layer.
The upper concrete cover near the loading point of the beams might be crushed at the drop heights H = 0.5, 1.0, and 2.0 m. As the drop height was increased, the damage tended to grow. However, the strengthened beams at these heights did not achieve the ultimate state since no sheet debonding and/or fractures were observed.
Because the residual displacement exceeded 2% of the beam’s pure span at the drop height H = 2.5 m, Beam N attained the ultimate state in the flexural–shear failure mode. The sheet debonded with a peeling action of the tip of the diagonal crack accompanying the flexural–shear failure mode, but only Beam A1660, which had the highest sheet volume among the strengthened beams, achieved the ultimate state. The next part delves into this phenomenon.
In this experiment, the strengthened beams were tested at the drop heights of 0.5, 1.0, 2.0, 2.5, 3.0, and 3.5 m. For Beam N, experiments were conducted at drop heights of 0.5, 1.0, and 2.5 m due to the limited number of specimens. On the other hand, at a drop height of 2.5 m, the residual deflection of Beam N was 62 mm (Table 6), which was more than 2% of the clear span (60 mm). This result shows that Beam N reached the ultimate state and did not conduct any further tests at higher drop heights in Beam N.
The following findings suggest that (1) all strengthened RC beams attained the ultimate state at drop heights H = 3.0 and 3.5 m. However, as the drop height was raised, the damage increased, and (2) the two failure types of the beams were observed. Sheet rupturing caused Beam A415to fail, while sheet debonding caused Beam A830/1660 to fail.
These findings show that (1) RC beams with/without FRP sheets attained the ultimate state in the flexural–shear failure mode under impact loading, and (2) the failure mode of the strengthened beams depends on the mass per unit area of the sheet and can be classified into two types: sheet rupturing and sheet debonding. Furthermore, (3) when the input impact energy was less than or equal to 5.85 kJ (equivalent to a drop height H = 2.0 m), the flexural strengthened RC beams did not fail. They may fail when the drop height is H ≥ 2.5 m for Beam A1660 and H ≥ 3.0 m for Beam A415/830.

3.2.3. Strain Distribution of the AFRP Sheet and the Crack Pattern near the Loading Point

Figure 14 shows a temporal transition in the axial strain distribution of the AFRP sheet and the distribution of cracks on the side near the loading point of Beams A415/830/1660 at the set drop height H = 3.0 m.
According to the figure, several diagonal cracks developed from both sides of the beams at time t = 0.5 ms after the start of impact, and there were no flexural cracks yet for Beams A830/1660. However, in the case of Beam A415, no cracks were found. The tensile strain was distributed throughout the beams’ midspan area, while compressive strain was generated on both outer sides of the loading point. The compressive strain may have developed due to the formation of the fixed ends. It was confirmed that the strain propagated toward both support points with time. The strain of the sheet below the loading point was ~0.5% for Beam A415 and ~0.25% for Beam A830/1660.
At time t = 1.0 ms, all diagonal cracks had reached the edges of the lower concrete cover, and flexural cracks had formed in Beams A830/1660. Beam A415 had several diagonal cracks, but they had not yet reached the lower concrete cover’s edges. Both positive and negative strains moved toward both support points for all beams. Furthermore, the tensile strain of Beams A830/1660 near the loading area was evenly distributed because the beam tended to be equi-bending. This suggests that the deformation curvatures are similar in this area.
At time t = 1.5 to 5.0 ms, several new diagonal cracks formed in Beam A415, and all the diagonal cracks reached the edges of the lower concrete cover. According to the strain distributions, the compressive strain propagated to the support points on both sides, and all beams shifted from the fixed state to the simply supported state. Furthermore, the strains in Beams A830/A1660 were almost parabolically distributed across the entire span, whereas the strains in Beam A415 were triangularly distributed near the loading point. These differences in strain distribution shapes between Beam A415 and Beam A830/1660 could be related to the sheet’s failure modes.
New diagonal and flexural cracks developed in the midspan areas of all beams at time t = 7.5 to 10 ms. Additionally, compressive failures were observed near the loading points for Beams A830/1660 at the upper concrete covers. Beam A415 had a distributed strain of about 1.5% at the midspan, and the gradients of the strain distribution near the loading point were significantly different from those near the support point. In contrast, tensile strains of about 1% were evenly distributed near the loading point for Beams A830/1660, and diagonal cracks were distributed over a wide area. This is evidence of sheet debonding caused by the peeling action of the tips of the diagonal cracks toward the support points, as confirmed by high-speed camera photographs.
At time t = 15 ms, for Beam A415, the strain of the FRP sheet was recorded over 2% just below the loading point, and it can be confirmed that the sheet ruptured from the high-speed camera photograph. As for Beam A830, the strain was distributed with more than 0.5% in an area of ~0.75 m on both sides at the loading point. In this area, the gradient of the strain distribution was different from that near the support point, indicating that the main rebar was in a plastic state over a wide range. It can also be confirmed that (1) the maximum strain reached almost 1.5% just below the loading point, so it was close to the ultimate strain of the sheet. Furthermore, (2) the FRP sheet of the beam tended to debond toward the support points under the peeling action of the tips of the diagonal cracks. For Beam A1660, a uniform strain distribution with more than 0.5% was exhibited in an area of 1 m on both sides of the loading point, indicating that the main rebars yielded in a wider region than in the case of Beam A830. The maximum strain around the loading point reached approximately 1%, which was slightly smaller than that at time t = 10 ms. From the high-speed camera photograph, it can be confirmed that the FRP sheet also tended to debond due to the peeling action of the tips of the diagonal cracks toward the support points. At time t = 20 ms, for Beam A1660, the sheet at the right side of the beam debonded due to the peeling action of the tips of the diagonal cracks. As for Beam A830, at time t = 30 ms, a uniform strain distribution was observed in the whole span except in the regions of ~0.5 m from both supporting points, and it can be seen that the sheet tended to be partially peeled off.
From these results, for Beam A415, the sheet ruptured in ~15 ms because the upper concrete cover at the loading area was significantly crushed, and the beam was deformed in a V-shape in the midspan. However, for Beams A830/1660, the main rebar tended to be in a plastic state over a wide area due to the large sheet volume and small static bending moment capacity ratio My/Mu. In addition, since the angle of the diagonal cracks was shallow and the peeling action of the tips of the diagonal cracks was significant, it had a tendency to debond the sheet.

3.2.4. Relationship between the Maximum Response Values and Impact Energy

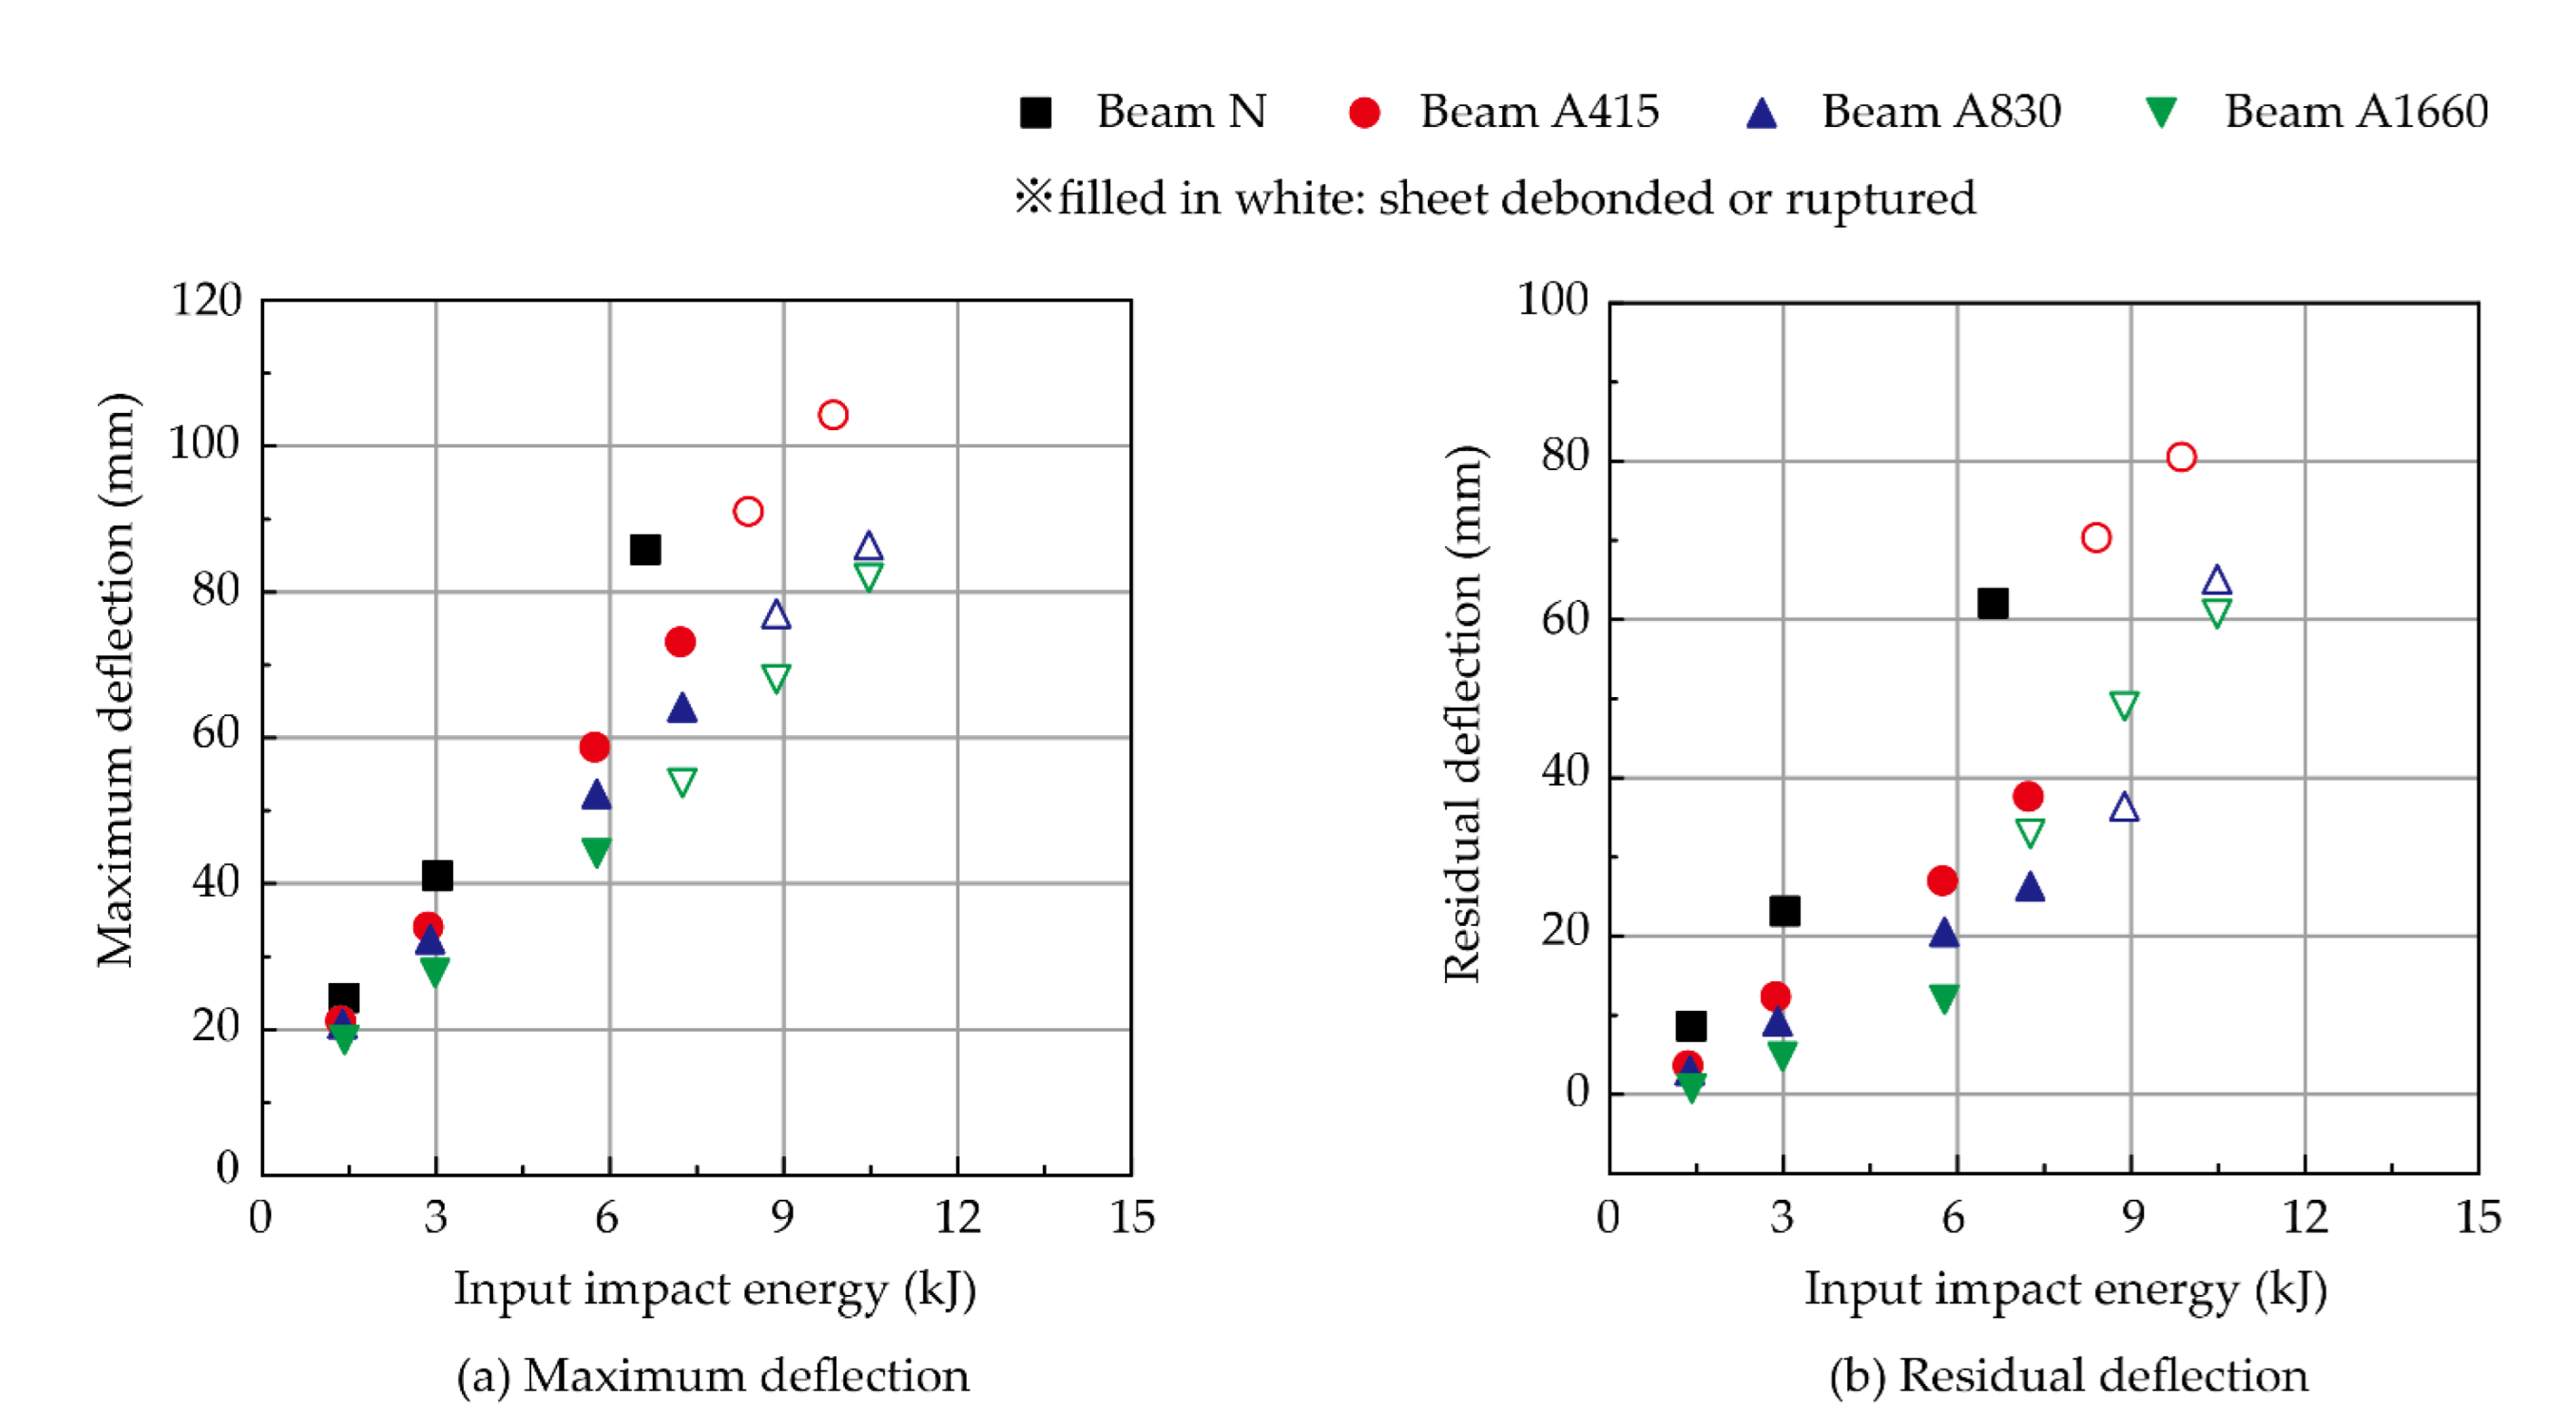
Figure 15a,b show the relationships between the maximum/residual deflection and actual input impact energy of the RC beams under impact loading. It can be observed that the maximum/residual deflection tended to linearly increase with the input impact energy for each beam except for the strengthened beams, which failed with the sheet debonding or rupturing. The slope of the strengthened beams was smaller than that of the nonstrengthened beams, and it decreased with increasing the sheet volume. Thus, the maximum and residual deflections of the strengthened beams may be restrained at about 15 to 35% and 40 to 85%, respectively, compared with those of the nonstrengthened beams at the same input impact energy (Table 6).

3.2.5. Failure Modes of the RC Beams Strengthened in Flexure

Table 7 shows a list of the failure modes of the flexurally strengthened RC beams under the static and impact loading tests. The calculated bending moment capacity ratio My/Mu, which was used as an index to predict the failure modes under static loading, is also shown.
As described above, in the static loading case, the failure mode can be estimated from the calculated bending moment capacity ratio My/Mu, as reported in the previous study [31], which is in good agreement with the experimental results of all the flexurally strengthened RC beams considered here. In addition, when the failure mode of the strengthened beam with FRP sheets under static loading was estimated as “flexural compression failure,” it was confirmed that the failure mode under impact loading was “sheet rupturing.” However, when the failure mode of the beam was estimated as “debonding failure” under static loading, the failure mode was “sheet debonding” under impact loading. The “sheet rupturing” failure might have been caused by the V-shaped deformation of the beam due to the small yield area of the main rebar and the compressive failure of the upper concrete cover. By comparing the three beams strengthened with different sheet volumes, only Beam A1660 reached the ultimate state with the sheet debonding at the drop height H = 2.5 m. Thus, the impact resistance may not necessarily be improved by increasing the sheet volume.
A comparison of the crack patterns of the beams between the static load and impact load cases shows that (1) In the static load case, the crack patterns of beams consist only of flexural cracks developing from the lower concrete covers, and all beams failed with the flexural failure mode regardless of with/without strengthening. (2) In the impact load case, the crack patterns of beams include flexural cracks developing from both the lower and upper concrete covers and diagonal cracks developing around the loading point; All reinforced/unreinforced beams failed with flexural–shear failure mode. Therefore, (3) the failure mode of the RC beams changed from flexural failure when subjected to static loads to flexural–shear failure when subjected to impact loads regardless of whether the RC beams were strengthened with AFRP sheets.

4. Conclusions

This research focused on the impact resistance method of enhancing existing RC structures with FRP materials. Static- and drop-weight impact loading experiments were conducted using the sheet volume and impact velocity of the weight as factors to examine the improvement of impact-resistant beams and/or to predict the failure modes of the RC beams strengthened with AFRP sheets. The impact loading tests were carried out using a single loading method on each beam and increasing the weight drop height until the sheets were debonded and/or ruptured. Three types of AFRP sheets with varied volumes were tested, and the sheets were externally bonded to the bottom surfaces of the RC beams to evaluate the flexural strengthening effect of the beams using FRP materials. The following is a summary of the findings:
  • From the static loading test results, the failure mode of the strengthened RC beams with AFRP sheets was classified into two types as in the previous research [31]: flexural compression failure and debonding failure. Therefore, based on the calculated bending moment capacity ratio My/Mu, the failure mode of strengthened RC beams can be predicted.
  • From the impact loading test results, the maximum and residual displacement of the strengthened beams can be restrained by up to 35% and 85%, respectively, compared with nonstrengthened beams.
  • The maximum/residual displacement of the RC beams with/without AFRP sheets linearly increased with the input impact energy.
  • The failure mode of the strengthened RC beams under impact loading was classified into two types depending on the sheet volume: sheet rupturing and sheet debonding. The former corresponds to the flexural compression failure mode, while the latter corresponds to the debonding failure mode under static loading.
  • The failure mode of RC beams changed from flexural failure under static loading to flexural–shear failure when under impact loading, regardless of whether the RC beams were strengthened with the AFRP sheets.
  • The debonding of the AFRP sheet of the strengthened RC beams might not be improved by increasing the sheet volume, regardless of the case of static or impact loading.
  • When the input impact energy was greater than or equal to 7.33 kJ (corresponding to the drop height H = 2.5 m), the tested strengthened beams failed through sheet debonding and/or rupturing.

Author Contributions

L.H.S.: Investigation, Data curation, Visualization, Writing-Original draft preparation. M.K.: Funding acquisition, Conceptualization, Project administration, Supervision, Writing-Reviewing and Editing. T.K.: Investigation, Data curation, Visualization, Formal analysis, Writing-Reviewing and Editing. N.K.: Conceptualization, Supervision, Resources, Writing-Reviewing and Editing. All authors have read and agreed to the published version of the manuscript.

Funding

JSPS KAKENHI Grant Number JP17K06527 funded this research.

Data Availability Statement

The raw/processed data required to reproduce these findings cannot be shared because it is also part of an ongoing study.

Acknowledgments

AFRP sheet and adhesive were provided by Fibex, Co. Ltd. (Kidderminster, UK) and Sumitomo Rubber Industries, Ltd. (Kobe, Hyogo, Japan), respectively.

Conflicts of Interest

The authors declare that they have no known competing financial interests or personal relationships that could appear to have influenced the work described in this paper.

References

  1. Ahmed, E.; Sobuz, H.R.; Sutan, N.M. Flexural Performance of CFRP Strengthened RC Beams with Different Degrees of Strengthening Schemes. Int. J. Phys. Sci. 2011, 6, 2229–2238. [Google Scholar]
  2. Attari, N.; Amziane, S.; Chemrouk, M. Flexural Strengthening of Concrete Beams Using CFRP, GFRP and Hybrid FRP Sheets. Constr. Build. Mater. 2012, 37, 746–757. [Google Scholar] [CrossRef]
  3. More, R.U.; Kulkarni, D.B. Flexural Behavioural Study on RC Beam with Externally Bonded Aramid Fiber Reinforced Polymer. Int. J. Res. Eng. Technol. July 2014, 3, 316–321. [Google Scholar]
  4. Chen, W.; Pham, T.M.; Sichembe, H.; Chen, L.; Hao, H. Experimental Study of Flexural Behaviour of RC Beams Strengthened by Longitudinal and U-Shaped Basalt FRP Sheet. Compos. Part B Eng. 2018, 134, 114–126. [Google Scholar] [CrossRef] [Green Version]
  5. Raval, C.; Shah, S.; Machhi, C. Experimental Study on Shear Behaviour of RC Beam Strengthened by AFRP Sheet. Int. J. Res. Writ. 2020, 3, 62–68. [Google Scholar]
  6. Madotto, R.; Van Engelen, N.C.; Das, S.; Russo, G.; Pauletta, M. Shear and Flexural Strengthening of RC Beams Using BFRP Fabrics. Eng. Struct. 2021, 229, 111606. [Google Scholar] [CrossRef]
  7. Panahi, M.; Zareei, S.A.; Izadi, A. Flexural Strengthening of Reinforced Concrete Beams through Externally Bonded FRP Sheets and near Surface Mounted FRP Bars. Case Stud. Constr. Mater. 2021, 15, e00601. [Google Scholar] [CrossRef]
  8. American Concrete Institute. ACI Committee 440 Guide for the Design and Construction of Externally Bonded FRP Systems for Strengthening Concrete Structures; American Concrete Institute: Farmington Hills, MI, USA, 2017; ISBN 978-1-945487-59-0. [Google Scholar]
  9. Mostofinejad, D.; Mahmoudabadi, E. Grooving as Alternative Method of Surface Preparation to Postpone Debonding of FRP Laminates in Concrete Beams. J. Compos. Constr. 2010, 14, 804–811. [Google Scholar] [CrossRef]
  10. Mostofinejad, D.; Shameli, M. Performance of EBROG Method under Multilayer FRP Sheets for Flexural Strengthening of Concrete Beams. Procedia Eng. 2011, 14, 3176–3182. [Google Scholar] [CrossRef] [Green Version]
  11. Mostofinejad, D.; Tabatabaei Kashani, A. Experimental Study on Effect of EBR and EBROG Methods on Debonding of FRP Sheets Used for Shear Strengthening of RC Beams. Compos. Part B Eng. 2013, 45, 1704–1713. [Google Scholar] [CrossRef]
  12. Mostofinejad, D.; Shameli, S.M. Externally Bonded Reinforcement in Grooves (EBRIG) Technique to Postpone Debonding of FRP Sheets in Strengthened Concrete Beams. Constr. Build. Mater. 2013, 38, 751–758. [Google Scholar] [CrossRef]
  13. Mostofinejad, D.; Hosseini, S.A.; Razavi, S.B. Influence of Different Bonding and Wrapping Techniques on Performance of Beams Strengthened in Shear Using CFRP Reinforcement. Constr. Build. Mater. 2016, 116, 310–320. [Google Scholar] [CrossRef]
  14. Buchan, P.A.; Chen, J.-F. Blast Resistance of FRP Composites and Polymer Strengthened Concrete and Masonry Structures—A State-of-the-Art Review. Compos. Part B Eng. 2007, 38, 509–522. [Google Scholar] [CrossRef]
  15. Muszynski, L.; Purcell, M. Composite Reinforcement to Strengthen Existing Concrete Structures against Air Blast. J. Compos. Constr. 2003, 7, 93–97. [Google Scholar] [CrossRef]
  16. Kishi, N.; Komuro, M.; Kawarai, T.; Mikami, H. Low-Velocity Impact Load Testing of RC Beams Strengthened in Flexure with Bonded FRP Sheets. J. Compos. Constr. 2020, 24, 04020036. [Google Scholar] [CrossRef]
  17. Erki, M.A.; Meier, U. Impact Loading of Concrete Beams Externally Strengthened with CFRP Laminates. J. Compos. Constr. 1999, 3, 117–124. [Google Scholar] [CrossRef]
  18. Tang, T.; Saadatmanesh, H. Behavior of Concrete Beams Strengthened with Fiber-Reinforced Polymer Laminates under Impact Loading. J. Compos. Constr. 2003, 7, 209–218. [Google Scholar] [CrossRef]
  19. Pham, T.; Hao, H. Impact Behavior of FRP-Strengthened RC Beams without Stirrups. J. Compos. Constr. 2016, 20, 04016011. [Google Scholar] [CrossRef]
  20. Pham, T.; Hao, H. Behavior of Fiber-Reinforced Polymer-Strengthened Reinforced Concrete Beams under Static and Impact Loads. Int. J. Prot. Struct. 2016, 8, 3–24. [Google Scholar] [CrossRef]
  21. Cotsovos, D. A Simplified Approach for Assessing the Load-Carrying Capacity of Reinforced Concrete Beams under Concentrated Load Applied at High Rates. Int. J. Impact Eng. 2010, 37, 907–917. [Google Scholar] [CrossRef]
  22. Hamed, E.; Rabinovitch, O. Dynamic Behavior of Reinforced Concrete Beams Strengthened with Composite Materials. J. Compos. Constr. 2005, 9, 429–440. [Google Scholar] [CrossRef]
  23. Goldston, M.; Remennikov, A.; Sheikh, M. Experimental Investigation of the Behaviour of Concrete Beams Reinforced with GFRP Bars under Static and Impact Loading. Eng. Struct. 2016, 113, 220–232. [Google Scholar] [CrossRef] [Green Version]
  24. Rabinovitch, O. Dynamic Debonding in Concrete Beams Strengthened with Composite Materials. Int. J. Solids Struct. 2012, 49, 3641–3658. [Google Scholar] [CrossRef] [Green Version]
  25. Pham, T.; Hao, H. Review of Concrete Structures Strengthened with FRP Against Impact Loading. Structures 2016, 7, 59–70. [Google Scholar] [CrossRef] [Green Version]
  26. Tang, T.; Saadatmanesh, H. Analytical and Experimental Studies of Fiber-Reinforced Polymer-Strengthened Concrete Beams under Impact Loading. ACI Struct. J. 2005, 102, 139–149. [Google Scholar]
  27. Zhan, T.; Wang, Z.; Ning, J. Failure Behaviors of Reinforced Concrete Beams Subjected to High Impact Loading. Sixth Int. Conf. Eng. Fail. Anal. 2015, 56, 233–243. [Google Scholar] [CrossRef]
  28. White Timothy, W.; Soudki Khaled, A.; Erki, M.-A. Response of RC Beams Strengthened with CFRP Laminates and Subjected to a High Rate of Loading. J. Compos. Constr. 2001, 5, 153–162. [Google Scholar] [CrossRef]
  29. Wang, W. Flexural Behaviour of FFRP Wrapped CFRC Beams under Static and Impact Loadings. Int. J. Impact Eng. 2017, 111, 46–54. [Google Scholar] [CrossRef]
  30. Liu, Y.; Jiang, Z.; Wen, H.M. Predicting Impact Induced Delamination of FRP Laminates. Int. J. Impact Eng. 2019, 137, 103436. [Google Scholar] [CrossRef]
  31. Kishi, N.; Mikami, H.; Matsuoka, K.G.; Kurihashi, Y. Failure Behavior of Flexural Strengthened RC Beams with AFRP Sheet. In FRPRCS-5: Fibre-Reinforced Plastics for Reinforced Concrete Structures Volume 1; Thomas Telford Publishing: London, UK, 2001; pp. 87–95. ISBN 978-0-7277-3647-5. [Google Scholar]
  32. JSCE (Japan Society of Civil Engineers). Standard Specification for Concrete Structures-2007 Design; JSCE: Tokyo, Japan, 2007; ISBN 978-4-8106-0752-9. [Google Scholar]
  33. JSCE (Japan Society of Civil Engineers). Standard Specification for Concrete Structures-2017 Design in Japanese; JSCE: Tokyo, Japan, 2018; ISBN 978-4-8106-0777-2. [Google Scholar]
  34. Fibex. Material Properties for Unidirectional AFRP Sheets; Fibex: Tokyo, Japan, 2014. [Google Scholar]
  35. JIS K 7165; Plastics—Determination of Tensile Properties—Part 5.Test Conditions for Unidirectional Fibre-Reinforced Plastic Composites. Japanese Standards Association: Tokyo, Japan, 2008.
  36. Kaklauskas, G.; Bacinskas, D.; Šitnkus, R. Deflection Estimates of Reinforced Concrete Beams by Different Methods. Statyba 1999, 5, 258–264. [Google Scholar] [CrossRef] [Green Version]
Figure 1. Specimen dimensions and layouts of the rebars and AFRP sheets.
Buildings 12 00584 g001
Figure 2. RC beam casting procedure.
Buildings 12 00584 g002
Figure 3. AFRP sheet bonding procedure.
Buildings 12 00584 g003
Figure 4. View of the test setup for static loading.
Buildings 12 00584 g004
Figure 5. View of the test setup for drop-weight impact loading.
Buildings 12 00584 g005
Figure 6. Comparison of the load-deflection relationship for the beams under static loading.
Buildings 12 00584 g006
Figure 7. Stress–strain relation of each material.
Buildings 12 00584 g007
Figure 8. Calculation of the load-deflection curve.
Buildings 12 00584 g008
Figure 9. Comparisons between the calculated and experimental results on the axial strain distribution of the AFRP sheet at the calculated ultimate state.
Buildings 12 00584 g009
Figure 10. Crack distribution of the beams after static loading tests.
Buildings 12 00584 g010
Figure 11. Close-up photo of the debonded sheet together with concrete for the beams.
Buildings 12 00584 g011
Figure 12. Time history of the dynamic responses of the beams.
Buildings 12 00584 g012
Figure 13. Crack distribution of each beam after the impact loading test.
Buildings 12 00584 g013
Figure 14. Temporal transition of the strain distribution of the AFRP material and crack patterns near the loading point for drop height H = 3.0 m.
Buildings 12 00584 g014
Figure 15. Relationships between maximum/residual deflection and input impact energy.
Buildings 12 00584 g015
Table 1. List of specimens.
SpecimenSet
Drop Height
H (m)
Measured Drop Velocity
v (m/s)
Actual Input Energy
Er (kJ)
Compressive Strength of Concrete
f’c (MPa)
Yield Strength of Main Rebar
fy (MPa)
Yield Strength of Stirrup
fsy (MPa)
Calculated Flexural Load Capacity
Pusc (kN)
Calculated Shear Load Capacity
Vusc (kN)
Shear-Flexural Capacity Ratio
α
N-S---32.438246255.03295.98
A415-S33.737140281.02993.69
A830-S99.92.99
A1660-S126.12.37
N-I-H0.50.53.191.5334.339437354.12845.25
A415-I-H0.53.131.4674.73.80
A830-I-H0.53.131.46102.22.78
A1660-I-H0.53.161.49125.22.27
N-I-H1.01.04.583.1534.339437354.12845.25
A415-I-H1.04.452.9774.73.80
A830-I-H1.04.452.97102.22.78
A1660-I-H1.04.513.06125.22.27
A415-I-H2.02.06.245.8533.737140281.02993.69
A830-I-H2.099.92.99
A1660-I-H2.0126.12.37
N-I-H2.52.56.706.7432.438246255.03295.98
A415-I-H2.56.997.3333.737140281.02993.69
A830-I-H2.599.92.99
A1660-I-H2.5126.12.37
A415-I-H3.03.07.538.5033.737140281.02993.69
A830-I-H3.07.728.9599.92.99
A1660-I-H3.0126.12.37
A415-I-H3.53.58.159.9734.339437374.732843.80
A830-I-H3.58.3910.55102.22.78
A1660-I-H3.5125.22.27
Table 2. Material properties of the AFRP sheets.
Mass per
Unit Area
(g/m2)
Thickness
(mm)
Tensile
Strength
(GPa)
Elastic
Modulus
Ef (Gpa)
Failure
Strain
εfu (%)
4150.2862.061181.75
8300.5722.061181.75
Table 3. Concrete mix proportion table.
W/C
(%)
S/a
(%)
Unit Weight (kg/m3)
Water
W
Cement
C
Fine Aggregate
S
Coarse Aggregate
G
Admixture
Ad
52.443.015429481210642.940
Note: The concrete used to cast the RC beams is ready-mixed concrete, with a nominal strength of 24 MPa, a slump of 12 cm, a maximum coarse aggregate size of 25 mm, and an air amount of 4.5%.
Table 4. Material properties of epoxy resin.
Bending Strength
(MPa)
Compressive Strength
(MPa)
Tensile Shear Strength
(MPa)
Adhesive Strength
(MPa)
4035101.5
Table 5. Calculated and experimental results of the beams in the static tests.
SpecimenRebar Yield Load (kN)Maximum Load (kN)
ExperimentalCalculatedExperimentalCalculated
1N-S57.053.366.755.0
2A415-S67.855.684.881.0
3A830-S71.560.188.899.9
4A1660-S85.569.2112.7126.1
Table 6. Maximum dynamic response values of the RC beams under impact loading.
SpecimenSet
Drop Height
H (m)
Actual
Input Energy
Er (kJ)
Maximum
Impact Force Pmax (kN)
Maximum
Reaction Force Rmax (kN)
Maximum
Deflection
Dmax (mm)
Residual
Deflection Dres (mm)
N-I-H0.50.51.5366310624.08.5
A415-I-H0.51.4648713020.93.9
A830-I-H0.51.4658713520.02.5
A1660-I-H0.51.4959514118.81.1
N-I-H1.01.03.1594822940.923.0
A415-I-H1.02.9786925033.812.2
A830-I-H1.02.9777117831.68.7
A1660-I-H1.03.0686319628.05.1
A415-I-H2.02.05.85113820958.626.9
A830-I-H2.0110321351.720.0
A1660-I-H2.0116522244.512.4
N-I-H2.52.56.74154225185.962.0
A415-I-H2.57.33116521473.137.5
A830-I-H2.5114725465.226.4
A1660-I-H2.5134623954.233.3
A415-I-H3.03.08.50138721591.170.3
A830-I-H3.08.95132422476.635.9
A1660-I-H3.0135632068.549.4
A415-I-H3.53.59.971428331104.480.5
A830-I-H3.510.55124632386.064.6
A1660-I-H3.5153739382.561.1
Table 7. List of the failure modes of each beam strengthened in flexure.
SpecimenMass per Unit Area of Sheet (g/m2)Static Calculated Bending Moment Capacity Ratio My/MuFailure Mode in the Case of Static LoadingFailure Mode in the Case of Impact Loading
H = 0.5 (m)H = 1.0 (m)H = 2.0 (m)H = 2.5 (m)H = 3.0 (m)H = 3.5 (m)
A4154150.69Flexural compression failure----RuptureRupture
A8308300.59Debonding failure----Partial debondingDebonding
A166016600.55Debonding failure---DebondingDebondingComplete debonding
Publisher’s Note: MDPI stays neutral with regard to jurisdictional claims in published maps and institutional affiliations.