Article

Study on the Effect of Vegetation Coverage on Urban Cooling and Energy Conservation: A Case Study of a Typical Hilly City, Chenzhou, China

School of Architecture and Art, Central South University, Changsha 410083, China
*
Author to whom correspondence should be addressed.
Buildings 2022, 12(5), 640; https://doi.org/10.3390/buildings12050640
Submission received: 7 March 2022 / Revised: 6 May 2022 / Accepted: 6 May 2022 / Published: 11 May 2022
(This article belongs to the Special Issue Buildings Art, Sustainability, and Durability)

Abstract

:
Urban vegetation coverage is a core index in urban planning, which has been confirmed to be an effective indicator for the urban thermal environment. Through the urban thermal environment, this study aims to further quantify the impact of vegetation coverage on urban energy consumption. Chenzhou, a typical hilly city, was selected as the study object for its diversified vegetation coverages. Remote sensing technology and correlation and regression models were employed in this study. Firstly, the data of land surface temperature and vegetation coverage were calculated with remote sensing technology, followed by data analysis with the correlation and regression models. Then, employing the “λ-T” model, a statistical model corresponding to urban temperature and energy, this study clarified the impact of temperature on urban energy consumption. Finally, through urban temperature, this study analyzed the impact of urban greening coverage on urban energy consumption. This study shows that when the temperature ranges from 22 °C to 28.9 °C, every 10% of additional vegetation coverage will reduce the air conditioning energy demands by 5.5%, and when the temperature is between 28.9 °C and 37 °C, every 10% of additional vegetation coverage will reduce the mean air conditioning energy demands by 2.4%.

1. Introduction

With the center of gravity shifting regarding urbanization, the urbanization of Southeast Asian and African countries has accelerated [1,2,3], which has also brought many urban problems [4,5]. The most intuitive spatial phenomenon of urbanization is that artificial space replaces the vegetation space [6,7], which creates an urban heat island, posing a threat to human thermal comfort, health and energy consumption [8]. Many studies have discussed the impact of urban vegetation coverage on the thermal environment [9,10], but the problem of how the impact of vegetation coverage on the thermal environment will affect urban energy consumption demand has been ignored.
At present, the research regarding the impact of urban vegetation coverage on the thermal environment is mainly conducted in the following three ways. First, field measurement is commonly used; for example, Hardin et al. [11] studied the effects of the leaf area index (LAI) on the intensity of the urban heat island in Terre Haute, Indiana, USA, using ASTER thermal infrared images. It was found that the surface temperature would be decreased by 1.2 °C with each increase of LAI. Second, remote sensing is used to analyze the impact of large-scale greening on the thermal environment, by which Hermosilla et al. have published many relevant works on urban vegetation coverage from aerial images [12,13,14]. In terms of urban vegetation coverage and the thermal environment, Wilson [15] discussed the relationship between land surface temperature and vegetation with remote sensing images. Using Landsat Thematic Mapper (TM) data, Wen [16] studied the relevance between land surface temperature, normalized difference vegetation index (NDVI) and vegetation coverage, which found that vegetation coverage was stronger than NDVI regarding the correlation with surface temperature. Extracting the surface temperatures of 18 mega-cities in Asia and classifying the heat islands from the perspective of land types, Tran [17] revealed the influence of land types on urban heat island effects. Although identifying plants by remote sensing can judge the vegetation type and vegetation growth and so on, it cannot clarify the micro-spatial characteristics such as plant spatial combination and height. Therefore, the simulation method is used as the third way to study the impact of greening on the thermal environment on the micro scale. For instance, with the support of Envi-met, Jian Jun et al. [18] simulated the air temperature and radiation temperature of residential areas with and without trees and pointed out that, in Hunan Province, trees can reduce the surrounding air temperature and radiation temperature by 0.49 °C and 17.7 °C, respectively.
Although there are many documents regarding the impact of urban greening on the thermal environment [19,20,21], only a few filed studies and simulation studies have discussed the impact of greening on energy conservation at the micro scale [22,23], and there is no study revealing the impact of general urban vegetation coverage on the energy savings of a whole city, which is the innovation of this study.
Based on the impact of vegetation coverage on temperature, this study aims to further clarify the impact of vegetation coverage on energy conservation of the whole city with the help of the “λ-T” model, which is a statistical model for analyzing urban temperature and urban energy demand.

2. Materials and Methods

2.1. Framework of this Study

Four steps were conducted to explore the relationship between vegetation coverage and energy conservation. Firstly, the effect of vegetation coverage on land surface temperature was revealed. Based on the method of remote sensing inversion, the study obtained the corresponding data of vegetation coverage and land surface temperature, which were later analyzed by the correlation and regression models. Secondly, the literature on temperature and energy consumption was reviewed, and the coupling of temperature and energy consumption was concluded. Thirdly, based on the above three steps, this paper quantified the effect of vegetation coverage on urban energy conservation. The abstract picture of this study is shown as Figure 1.

2.2. Data and Methods

2.2.1. Data Resources

Landsat 8 is a remote sensing satellite with a thermal infrared sensor (TIRS), whose spectral band is 10.30–12.50 μm and spatial resolution is 30 m [24]. The spatial resolution of 30 m is suitable for macro-scale city study. Data of Landsat 8 can be obtained from the geospatial data cloud platform developed by the Scientific Data Center of the Chinese Academy of Sciences [25].

2.2.2. Inversion of Surface Temperature and Vegetation Coverage

Envi software was applied to the inversion of surface temperature and vegetation coverage of Chenzhou [26], which includes two steps. The first step is to obtain the land surface’s radiation by estimating the effect of vapor, oxygen, carbon dioxide and other fine particles in the atmosphere and dispersing the effect in the total thermal radiation obtained from the thermal infrared sensor [27]. The second step is to transform the land surface’s radiation into the corresponding temperature and vegetation coverage indexes.
This study selected the TIRS image covering the main district of the city of Chenzhou, Hunan, China on 23 July 2016, which was a high-temperature day. The inversion of surface temperature utilized the radiation transfer equation algorithm. The formula for the radiation transfer equation is shown as Formula (1) [28]:
L s e n s o r = [ ε B ( T s ) + ( 1 ε ) L ] τ + L
In the formula, Lsensor is the radiance brightness value received by the sensor on the height of the sensor. τ is the atmospheric transmission rate. ε is the surface reflectivity. L is the atmosphere down radiation brightness, L is the atmosphere up radiation brightness. B ( T s ) is the black body radiation brightness in the case of temperature T s [29]. On the NASA official website [30], this study calculated atmospheric correction parameter [31], shown as Figure 2. The image imaging time was 23 July 2016, 02:57, and the coordinates were 25°78′ N,113°02′ E. The three parameters of that moment were τ = 0.48, L = 4.56, L = 6.72, which were obtained with the help of atmospheric correction parameter calculation.
Then, with the inverse function of the Planck formula (2), this paper calculated the land surface temperature and vegetation coverage, where K 1 and K 2 are constants: K 1 = 1321.08, K 2 = 774.89.
T s = K 2 ln ( K 1 B ( T s ) + 1 )
With the support of radiation transport equation, Envi performed the land surface temperature and vegetation coverage of Chenzhou on 23 July 2016.

3. Data Collection and Data Integration

Chenzhou is a typical hilly city with diversified vegetation coverages; therefore, it was selected as the study object. According to the regulatory detailed planning of the city of Chenzhou, Chenzhou is divided into 27 districts, some of which has been compiled for more than 10 years. As a result of the development and construction over the years, 26 areas of regulatory detailed planning districts have developed into typical built-up areas, which means that the canopies of these 26 areas have the characteristics of an urban canopy. The 26 areas are Baiping district (No. 1), Eastern Xiameiqiao district (No. 2), Western Xiameiqiao district (No. 3), Sipuzhuang district (No. 4), Beihuling district (No. 5), Alpine Back district (No. 6), Luoxianpu district (No. 7), Eastern Luoxianling district (No. 8), Old City district (No. 9), Longquan district (No. 10), Sanlitan A-E district (No. 11), Sanlitan H district (No. 12), Dongwan district (No. 13), Chuandong district (No. 14), Chengqianling A-24 district (No. 15), Jiuzitang district (No. 16), Lishushan district (No. 17), Wuguang district (No. 18), Changchong district (No. 19), Xiangnan International Logistics Park (No. 20), Huaishunan district (No. 21), Xiangnan Style Garden (No. 22), Baishui district (No. 23), South part of the Donghe Formation (No. 24), Guanshan Residential district (No. 25) and Xiaojiachong Residential district (No. 26). In the following context, the name of the block is replaced by the numbers. The distribution of these 26 districts is shown as Figure 3.
With the support of a geographic information system (GIS), the boundary lines of these 26 blocks were put into a GIS, converting the ranges of 26 blocks into Shp files that were compatible with Envi software.
With Envi software, this research extracted the vegetation coverage of 26 regulatory detailed planning districts in Chenzhou separately, which are shown as Figure 4, where the legend indicates the vegetation coverage value between 0–1. The mean temperatures of the 26 districts were extracted according to the average temperature of the grids within its boundary. The average surface temperatures of the 26 districts are shown in Figure 5, where the legend indicates the land surface temperature value between 0–1.
The average land surface temperature (ST) and vegetation coverage (VC) of the 26 districts are listed in Table 1.
Then, using the Pearson correlation method, this study analyzed the correlation between surface temperature and vegetation coverage of these 26 districts and investigated whether there was an intrinsic correlation between them. The analysis showed that the Pearson correlation coefficient between the 26 groups of data was −0.892, whose absolute value was higher than 0.8, indicating that there was a very high negative correlation between surface temperature and vegetation coverage [32]. The Pearson correlation analysis results are shown in Table 2.
To further explore the impacts of vegetation coverage on energy consumption, it is necessary to understand the effect of vegetation coverage on surface temperature. Therefore, the linear model regression analysis, quadratic model regression analysis, compound model regression analysis, logarithmic model regression analysis, cubic function model regression analysis, S model regression analysis, inverse model regression analysis, power model regression analysis, exponential distribution model regression analysis and growth model regression analysis for these 26 groups of data were all conducted. The results of them are shown in Figure 6.
In Figure 6, the inverse model and S function model both fit well from the view of point distribution. Considering the relationship between density and urban functions in urban planning, that is, when the vegetation density is less than 20%, it is allowed only in urban industrial areas, and other functional areas are not allowed. When the vegetation density is between 20% and 30%, it is allowed in commercial, storage and transportation functional areas. When the vegetation density is between 30% and 45%, they are residential area, school and welfare districts. When the vegetation density exceeds 50%, it consists of all kinds of parks and botanical gardens. Therefore, in the district of 20% vegetation coverage, most of the surface materials are iron and glass, which are more sensitive to thermal reaction. In the case of 20% to 50% vegetation coverage, most of the surface materials are cement and asphalt, and the thermal response is moderate. In areas above 50%, construction activities will be highly restricted in its district, and the surface materials are mainly vegetation and water, which are less sensitive to thermal reaction. From the analysis of thermal sensitivity, the inverse model better reflects the influence of vegetation coverages on land surface temperature in different value ranges. The results show that the relationship between vegetation coverage and surface temperature is the inverse function. Besides, with the increase of vegetation coverage, the impact of vegetation coverage on urban surface temperature is gradually weakened. Although the linear regression model cannot reflect the impact of vegetation coverage on land surface temperature as accurately as inverse regression, the linear regression model shows the general power of vegetation coverage on land surface temperature, which is Y = −9.48X + 36.72. The linear regression model indicates that, in general, every 10% of additional vegetation coverage will reduce the mean land surface temperature by 0.948 °C.
In Figure 6, there is a deviated point, which has been marked in red. The deviated point means the vegetation coverage was low, and the surface temperature was also low, which was inconsistent with the research conclusion. By filed investigation, it was found that this area was a developing area whose vegetation on the surface had not been eradicated for a long time, and a large area of bare soil and water had emerged. Therefore, its vegetation coverage and surface temperature were both relatively lower than expected.

4. Effect on Energy Conservation

Many statistical studies, especially in the energy disciplines, have studied the impacts of temperature on energy consumption, with many fruitful results achieved. In terms of the impact of temperature on energy consumption, there are some representative academic conclusions. For instance, Arthur et al. [33] found the air conditioning load would increase by 3 percentage for the increase of 1 °C, when the temperature above 18 °C in Los Angeles. Li et al. [34] studied the interaction between urban microclimate and air-conditioning load in hot seasons in China and found that there was an S-function relationship between T and λ, where T presented temperature and λ represented the weight of energy demand, which reflects how the temperature affected the air-conditioning load. The function expression is shown in Equation (3), whose corresponding function image is shown in Figure 7.
λ = 1 e x p [ e x p ( T 26 6 ) ]
Figure 7 shows that when the temperature is lower than 22 °C, air conditioning energy consumption is not sensitive to the increase of temperature. When the temperature is between 22 °C and 28.9 °C, the energy consumption becomes sensitive to the change of temperature, within which, each increase of 1 °C will increase the energy consumption by 5.8 percentages. When the temperature is between 28.9 °C and 37 °C, the sensitivity of energy consumption to temperature change will decrease, where each increase of 1 °C will only increase the energy consumption by about 2.5 percentages, which is consistent with the research results of Los Angeles [33]. However, when the temperature is higher than 37 °C, because the cooling equipment is in full operation, the temperature increases have no further impacts on air conditioning energy consumption.
Considering two facts in this research, that every 10% of additional of vegetation coverage will reduce the mean land surface temperature by 0.948 °C and that each increase of 1 °C will increase the air conditioning energy consumption by 5.8 (temperature ranging from 22 °C and 28.9 °C) and 2.5 (temperature ranging from 28.9 °C to 37 °C) percentages, this research further quantifies the impact of vegetation coverage on urban energy consumption as follows. When the temperature ranges from 22 °C to 28.9 °C, every 10% of additional vegetation coverage will reduce the air conditioning energy demands by 5.5%, and when the temperature is between 28.9 °C and 37 °C, every 10% of additional vegetation coverage will reduce the mean air conditioning energy demands by 2.4%.

5. Conclusions

This research obtained two facts. One is that, on average, the land surface temperature will be decreased by 0.948 °C for every 10% of additional vegetation coverage, which is drawn from the regression analysis. The other is that the energy consumption will be increased by about 5.8 and 2.5 percentages for each increase of 1 °C, which is concluded from Figure 7. Combining the two facts, it can be concluded that if temperatures range from 22 °C to 28.9 °C, the air conditioning energy demand will be reduced by 5.5 for every 10% of additional vegetation coverage. While the temperature is increasing to the range of 28.9 °C to 37 °C, every 10% of additional vegetation coverage will reduce the mean air conditioning energy demands by 2.4%.
Since the air conditioning is in full load after the temperature exceeds 37 °C, along with the temperature increase, the air conditioning energy consumption has no room to further increase. Therefore, the numerical relationship between vegetation coverage and urban energy consumption can only be applied to urban canopy temperatures below 37 °C.
The conclusion of this study can predict the overall energy demand of the city according to the vegetation coverage, which is of great significance in urban planning. However, there are some limitations in the research that need to be clarified:
(1)
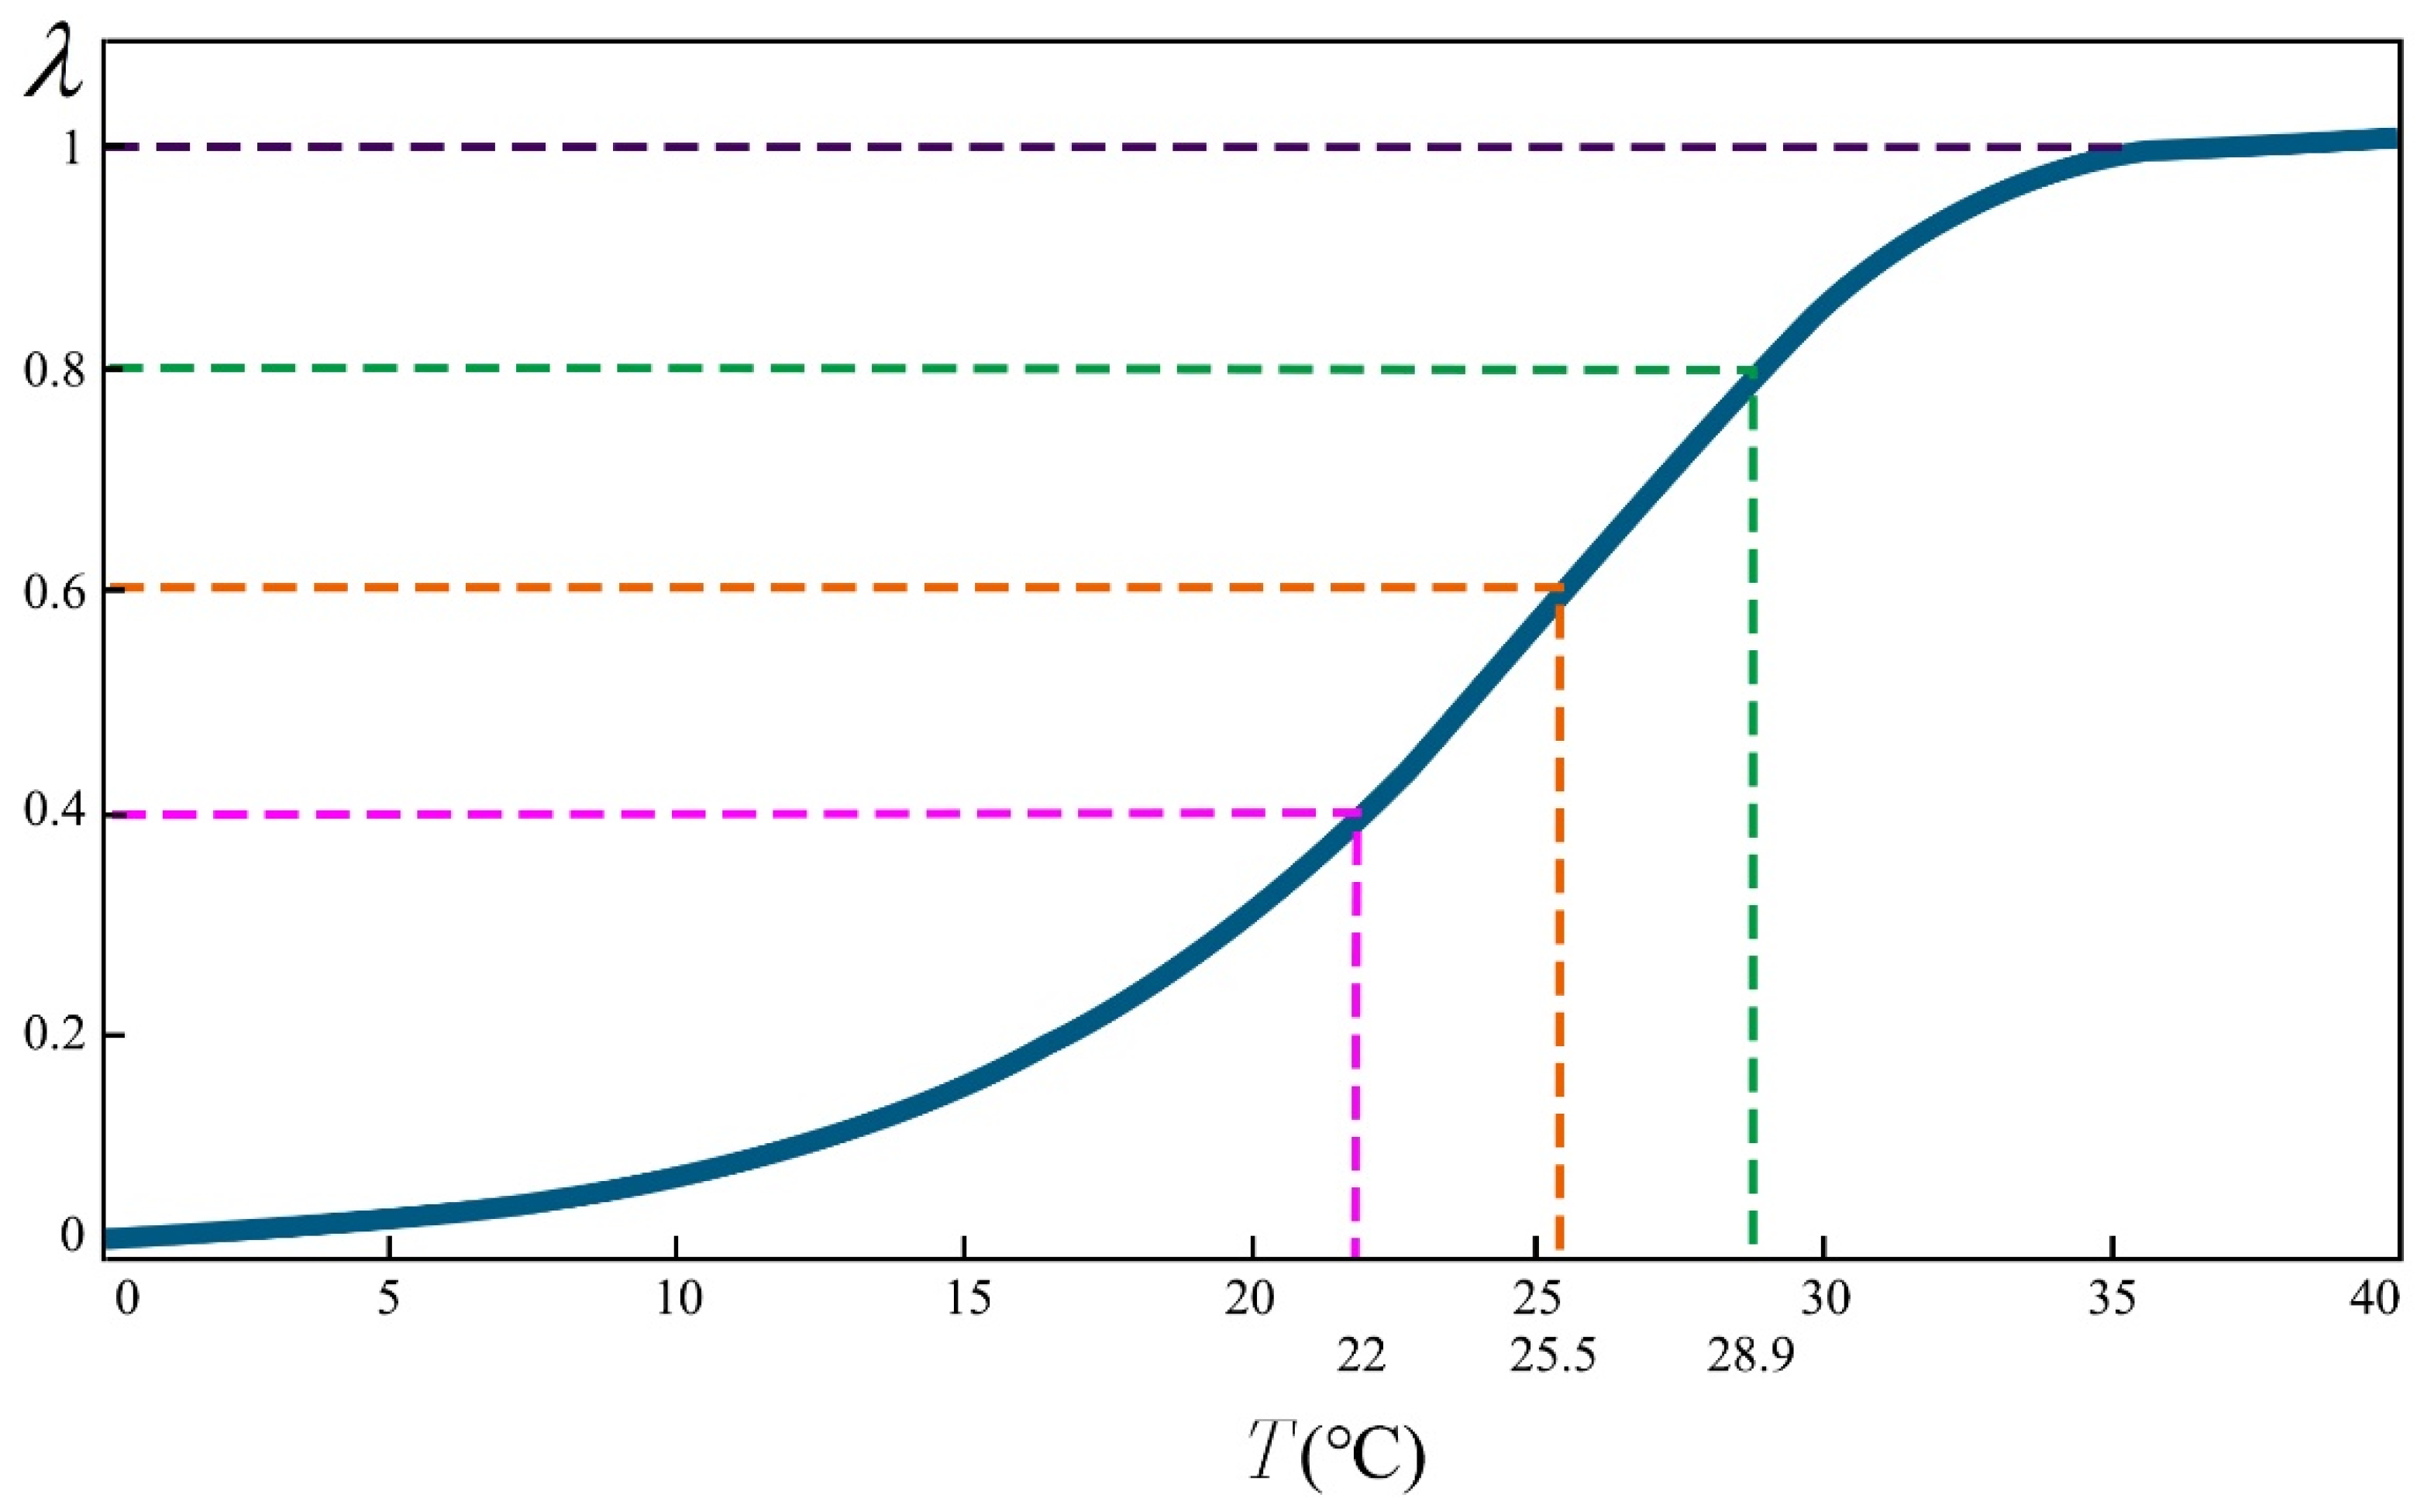
Although there is a close relationship between land surface temperature and the air temperature around the surface, the temperature in the “λ-T” model is not the land surface temperature, which may reduce the accuracy of the conclusion. The follow-up research will be carried out on the topic of land surface temperature and air temperature around the land surface.
(2)
The samples analyzed in this study are 26 districts of the city. More samples will be studied in the follow-up study to strengthen the universality of the conclusions.

Author Contributions

Conceptualization, J.L.; methodology, X.L.; software, X.L.; validation, X.L.; formal analysis, J.W.; investigation X.L.; resources, X.L.; data curation, J.W.; writing—original draft preparation, J.W.; writing—review and editing, X.L.; visualization, X.L.; supervision, J.L.; project administration, X.L. All authors have read and agreed to the published version of the manuscript.

Funding

This research received no external funding.

Institutional Review Board Statement

Not applicable.

Informed Consent Statement

Not applicable.

Data Availability Statement

Data are available upon request.

Acknowledgments

Thanks are given to Hunan Shangjia Green Company for their help in the field experiment.

Conflicts of Interest

The authors declare no conflict of interest.

References

  1. Balsa-Barreiro, J.; Li, Y.; Morales, A. Globalization and the shifting centers of gravity of world’s human dynamics: Implications for sustainability. J. Clean. Prod. 2019, 239, 117923. [Google Scholar] [CrossRef]
  2. Liu, H.; Fang, C.; Miao, Y.; Ma, H.; Zhang, Q.; Zhou, Q. Spatio-temporal evolution of population and urbanization in the countries along the Belt and Road 1950–2050. J. Geogr. Sci. 2018, 28, 919–936. [Google Scholar] [CrossRef] [Green Version]
  3. Hu, Y.; Peng, L.; Li, X.; Yao, X.; Lin, H.; Chi, T. A novel evolution tree for analyzing the global energy consumption structure. Energy 2018, 147, 1177–1187. [Google Scholar] [CrossRef]
  4. Doygun, H.; Alphan, H. Monitoring urbanization of Iskenderun, Turkey, and its negative implications. Environ. Monit. Assess. 2006, 114, 145–155. [Google Scholar] [CrossRef] [PubMed]
  5. Zhang, X.; Han, L.; Wei, H.; Tan, X.; Zhou, W.; Li, W.; Qian, Y. Linking urbanization and air quality together: A review and a perspective on the future sustainable urban development. J. Clean. Prod. 2022, 346, 130988. [Google Scholar] [CrossRef]
  6. Byomkesh, T.; Nakagoshi, N.; Dewan, A.M. Urbanization and green space dynamics in Greater Dhaka, Bangladesh. Landsc. Ecol. Eng. 2012, 8, 45–58. [Google Scholar] [CrossRef]
  7. Yu, Z.; Wang, Y.; Deng, J.; Shen, Z.; Wang, K.; Zhu, J.; Gan, M. Dynamics of hierarchical urban green space patches and implications for management policy. Sensors 2017, 17, 1304. [Google Scholar] [CrossRef] [Green Version]
  8. Kaloustian, N.; Diab, Y. Effects of urbanization on the urban heat island in Beirut. Urban Clim. 2015, 14, 154–165. [Google Scholar] [CrossRef]
  9. Lai, D.; Liu, W.; Gan, T.; Liu, K.; Chen, Q. A review of mitigating strategies to improve the thermal environment and thermal comfort in urban outdoor spaces. Sci. Total Environ. 2019, 661, 337–353. [Google Scholar] [CrossRef]
  10. Yan, H.; Wu, F.; Dong, L. Influence of a large urban park on the local urban thermal environment. Sci. Total Environ. 2018, 622, 882–891. [Google Scholar] [CrossRef]
  11. Hardin, P.J.; Jensen, R.R. The effect of urban leaf area on summertime urban surface kinetic temperatures: A terre haute case study. Urban For. Urban Green. 2007, 6, 63–72. [Google Scholar] [CrossRef]
  12. Hermosilla, T.; Wulder, M.A.; White, J.C.; Coops, N.C.; Hobart, G.W. Disturbance-informed annual land cover classification maps of Canada’s forested ecosystems for a 29-year landsat time series. Can. J. Remote Sens. 2018, 44, 67–87. [Google Scholar] [CrossRef]
  13. Lu, Y.; Coops, N.C.; Hermosilla, T. Estimating urban vegetation fraction across 25 cities in pan-Pacific using Landsat time series data. ISPRS J. Photogramm. Remote Sens. 2017, 126, 11–23. [Google Scholar] [CrossRef]
  14. Hermosilla, T.; Ruiz, L.; Recio, J.; Cambra-López, M. Assessing contextual descriptive features for plot-based classification of urban areas. Landsc. Urban Plan. 2012, 106, 124–137. [Google Scholar] [CrossRef] [Green Version]
  15. Wilson, J.S.; Clay, M.; Martin, E.; Stuckey, D.; Vedder-Risch, K. Evaluating environmental influences of zoning in urban ecosystems with remote sensing. Remote Sens. Environ. 2003, 86, 303–321. [Google Scholar] [CrossRef]
  16. Weng, Q.; Lu, D.; Schubring, J. Estimation of land surface temperature–vegetation abundance relationship for urban heat island studies. Remote Sens. Environ. 2004, 89, 467–483. [Google Scholar] [CrossRef]
  17. Tran, H.; Uchihama, D.; Ochi, S.; Yasuoka, Y. Assessment with satellite data of the urban heat island effects in Asian mega cities. Int. J. Appl. Earth Obs. Geoinf. 2006, 8, 34–48. [Google Scholar] [CrossRef]
  18. Liao, J.; Tan, X.; Li, J. Evaluating the vertical cooling performances of urban vegetation scenarios in a residential environment. J. Build. Eng. 2021, 39, 102313. [Google Scholar] [CrossRef]
  19. Srivanit, M.; Hokao, K. Evaluating the cooling effects of greening for improving the outdoor thermal environment at an institutional campus in the summer. Build. Environ. 2013, 66, 158–172. [Google Scholar] [CrossRef]
  20. Shi, D.; Song, J.; Huang, J.; Zhuang, C.; Guo, R.; Gao, Y. Synergistic cooling effects (SCEs) of urban green-blue spaces on local thermal environment: A case study in Chongqing, China. Sustain. Cities Soc. 2020, 55, 102065. [Google Scholar] [CrossRef]
  21. Cai, Y.; Chen, Y.; Tong, C. Spatiotemporal evolution of urban green space and its impact on the urban thermal environment based on remote sensing data: A case study of Fuzhou City, China. Urban For. Urban Green. 2019, 41, 333–343. [Google Scholar] [CrossRef]
  22. Ko, Y. Trees and vegetation for residential energy conservation: A critical review for evidence-based urban greening in North America. Urban For. Urban Green. 2018, 34, 318–335. [Google Scholar] [CrossRef]
  23. Li, J.; Zheng, B.; Shen, W.; Xiang, Y.; Chen, X.; Qi, Z. Cooling and energy-saving performance of different green wall design: A simulation study of a block. Energies 2019, 12, 2912. [Google Scholar] [CrossRef] [Green Version]
  24. Roy, D.P.; Wulder, M.A.; Loveland, T.R.; Woodcock, C.E.; Allen, R.G.; Anderson, M.C.; Helder, D.; Irons, J.R.; Johnson, D.M.; Kennedy, R. Landsat-8: Science and product vision for terrestrial global change research. Remote Sens. Environ. 2014, 145, 154–172. [Google Scholar] [CrossRef] [Green Version]
  25. Geospatial Data Cloud. Available online: http://www.gscloud.cn (accessed on 15 May 2021).
  26. Li, Y.; Yang, K.; Yang, R. Land Surface Temperature Estimation from Remote Sensing Data—A Case Study in Kun Ming City. In Proceedings of the 2015 23rd International Conference on Geoinformatics, Wuhan, China, 19–21 June 2015; pp. 1–6. [Google Scholar]
  27. Zheng, B.; Li, J.; Chen, X.; Liu, L.; Li, Z. Study on the Efficiency of Cool Island Effect in Urban Channel Water. In Proceedings of the 2018 3rd International Conference on Smart City and Systems Engineering (ICSCSE), Xiamen, China, 29–30 December 2018; pp. 140–145. [Google Scholar]
  28. Sobrino, J.A.; Jiménez-Muñoz, J.C.; Paolini, L. Land surface temperature retrieval from LANDSAT TM 5. Remote Sens. Environ. 2004, 90, 434–440. [Google Scholar] [CrossRef]
  29. Li, H. Detection distance calculation model of flying target and atmospheric influence analysis. Optik 2017, 129, 248–255. [Google Scholar] [CrossRef]
  30. Atmospheric Correction Parameter Calculator. Available online: http://atmcorr.gsfc.nasa.gov/ (accessed on 25 May 2021).
  31. Hadjimitsis, D.G.; Clayton, C.R. The use of an improved atmospheric correction algorithm for removing atmospheric effects from remotely sensed images using an atmosphere–surface simulation and meteorological data. Meteorol. Appl. J. Forecast. Pract. Appl. Train. Tech. Model. 2008, 15, 381–387. [Google Scholar] [CrossRef]
  32. Buytaert, W.; Celleri, R.; Willems, P.; De Bievre, B.; Wyseure, G. Spatial and temporal rainfall variability in mountainous areas: A case study from the south Ecuadorian Andes. J. Hydrol. 2006, 329, 413–421. [Google Scholar] [CrossRef]
  33. Rosenfeld, A.H.; Akbari, H.; Bretz, S.; Fishman, B.L.; Kurn, D.M.; Sailor, D.; Taha, H. Mitigation of urban heat islands: Materials, utility programs, updates. Energy Build. 1995, 22, 255–265. [Google Scholar] [CrossRef]
  34. Li, C.; Zhou, J.; Cao, Y.; Zhong, J.; Liu, Y.; Kang, C.; Tan, Y. Interaction between urban microclimate and electric air-conditioning energy consumption during high temperature season. Appl. Energy 2014, 117, 149–156. [Google Scholar] [CrossRef]
Figure 1. Abstract picture of the study.
Buildings 12 00640 g001
Figure 2. Atmospheric correction parameter calculation.
Buildings 12 00640 g002
Figure 3. The 26 areas with urbanization characteristics.
Buildings 12 00640 g003
Figure 4. Overall map of vegetation coverage in 26 areas.
Buildings 12 00640 g004
Figure 5. Overall map of land surface temperatures in 26 areas.
Buildings 12 00640 g005
Figure 6. Fitting and optimum selection of regression function.
Buildings 12 00640 g006
Figure 7. λ and T model image.
Buildings 12 00640 g007
Table 1. Statistical table of mean temperature and vegetation coverage.
NoST (°C)VCNoST (°C)VCNoST (°C)VC
132.22730.44631036.32740.13961932.50200.4506
234.83950.17741135.38070.12812033.05710.3688
334.73360.29511235.08460.12842131.53790.4849
434.69170.18931333.93710.26182233.65290.2697
535.59060.18421433.20600.32922333.86550.3906
635.73380.13061534.19900.30182433.82030.4010
732.17970.46121631.30970.54572534.00820.3836
833.37030.29601733.81620.33982633.03080.2034
935.49770.16001832.06180.4616
Table 2. Descriptive statistics and correlations.
Descriptive Statistics
MeanStd. DeviationN
Vegetation coverage0.304958810.12778419726
Temperature33.833134691.35845707326
Correlations
Vegetation coverageTemperature
Vegetation coveragePearson Correlation1−0.892
Sig.(2-tailed) 0
N2626
TemperaturePearson Correlation−0.8921
Sig.(2-tailed)0
N2626
Publisher’s Note: MDPI stays neutral with regard to jurisdictional claims in published maps and institutional affiliations.

