Article

Experimental Characterization of Raw Earth Properties for Modeling Their Hygrothermal Behavior

by
Yassine Elias Belarbi
1,
Mohamed Sawadogo
2,
Philippe Poullain
1,
Nabil Issaadi
1,
Ameur El Amine Hamami
2,
Stéphanie Bonnet
1 and
Rafik Belarbi
2,3,*
1
GeM UMR CNRS 6183, Université de Nantes, 52 Rue Michel Ange, CEDEX, F-44606 Saint-Nazaire, France
2
LaSIE UMR 7356 CNRS, La Rochelle Université, Avenue Michel Crépeau, CEDEX 01, F-17042 La Rochelle, France
3
Department of Civil and Building Engineering, Université de Sherbrooke, 2500 Bd de l’Université, Sherbrooke, QC J1K 2R1, Canada
*
Author to whom correspondence should be addressed.
Buildings 2022, 12(5), 648; https://doi.org/10.3390/buildings12050648
Submission received: 31 March 2022 / Revised: 5 May 2022 / Accepted: 9 May 2022 / Published: 12 May 2022
(This article belongs to the Topic Sustainable Building Structures)

Abstract

:
Raw earth is one of the oldest building materials of mankind. Almost a third of the world’s population is living in an earth-based house. However, their use remains low compared to conventional materials such as concrete, steel, and wood. Although these geosourced materials are abundant, recyclable, and have a low environmental footprint, their use is very limited in the construction sector. This can be explained by the lack of data regarding their hygrothermal behavior. In this context, the present work aims to highlight the properties of cob construction material with straw addition. An experimental characterization of hygrothermal and microstructural properties has been carried out. Thermal conductivity, specific heat, sorption isotherms, moisture storage capacity, moisture buffer value (MBV), and water vapor permeability are obtained experimentally. Then, the collected data are used as input parameters of a numerical prediction model to numerically assess the thermal and hygric behavior. Cob is then compared to other more commonly used materials to highlight the benefits of its use within the context of the energetic and environmental transition. Our results will allow better understanding of the behavior of the new geosourced material thanks to experimental and numerical investigation.

1. Introduction

The 19th century marked the beginning of the first Industrial Revolution in the British Empire. During this time, the negative impact of humans on the environment was observed. Overexploitation of various natural resources and the large emission of harmful gases, especially carbon dioxide (CO2), are the main causes of this problem.
The major activity sectors with an important environmental footprint are intensive agriculture, transportation, and industry. However, the building industry remains the sector with the most negative impact on our planet. It represents 44% of the energy consumed in France [1] and is responsible for 37% of the CO2 emission [2] as well as 13 to 30% of the waste produced worldwide [3]. This high environmental footprint is broadly caused by concrete. Concrete is the world’s most used construction material, with 10 billion cubic meters poured per year [4]. Cement is the main component of concrete. It represents 8% of the total CO2 emission [5]. Hence, reducing this impact for both existing and new constructions is one of the major societal issues related to the energy and environmental transition. Actually, several approaches can be studied to address this issue while improving the energy and environmental performance of buildings. In France, the new thermal and environmental regulation (RE2020) [6] requires (i) constructing hermetic buildings with high thermal insulation, (ii) establishing harmonious relationships between the building and its environment, (iii) creating a comfortable and healthy environment for its users, and (iv) preserving natural resources by optimizing their use and by polluting less. To sum up, reducing the carbon footprint of buildings, pursuing the improvement of their energy performance, and ensuring their coolness during hot summers are the major objectives of the RE2020. Thus, one of the approaches that has been considered to achieve these objectives is developing less energy-intensive, more energy-efficient, and environment-friendly materials by using geosourced materials.
Raw earth has been used since the beginning of the sedentarization of mankind around 15,000 BC. However, it was not popular until the 9th millennium when raw earth was used to build cities, particularly in Mesopotamia. Besides, the establishment of cities at that time was not only based on the need to settle near waterways. It was also based on the availability and the quality of raw earth [7]. This material is known to be abundant and reusable. Additionally, raw earth behaves as a thermal and hygrometric regulator, allowing a very comfortable atmosphere during all seasons [8]. However, the growth of the concrete industry has led to lesser use of raw earth, even though almost one third of the world’s population lives in a raw earth house [9]. This marginalization is due to the lack of awareness of this material’s properties.
There are several construction methods related to raw earth. We can notably find compressed earth block (CEB), rammed earth, wattle and daub, and adobe. Compressed earth blocks (CEB) are a type of adobe brick, made in presses that compress wet, powdered earth. Rammed earth is a process that consists of building monolithic and load-bearing walls of more than 40 cm thickness. The material is compacted in successive layers in a formwork, traditionally made of wood. The loamy earth is worked in a loose state with limited water and may contain stones to increase the mechanical strength. Rammed earth does not contain any fiber. Wattle and daub is a mixture of clay and straw or vegetable fibers. It is only used to fill walls whose structure is wood-framed, or with wooden racks. The adobe construction method is defined by the use of earth bricks that have been air-dried without having been fired in a kiln. A clay soil is used, to which vegetable fibers can be added. The bricks are traditionally hand-molded in a wooden mold and then dried at an indoor air temperature (the bricks are not pressed as for CEB). Within the framework of our study, we are interested in the cob as our construction method. This very old process consists of mixing raw earth with water and sometimes adding vegetable fibers. This mixture is then used in a plastic state and shaped into balls in order to build monolithic walls. This technique has been used for thousands of years in all types of climates. The cob construction method is very resistant to very rainy weather thanks to its porosity. It can even withstand rain for long periods of time [10,11]. Not to mention, it has two major advantages: the effortless construction and the freedom of design compared to other construction methods, such as adobe, compressed earth blocks, or rammed earth, whereas the production of cob requires 18 to 38% of the energy needed for conventional materials. Furthermore, the use of cob reduces the impact of global climate change by 75 to 82% [12]. The term cob comes from England, but we also have the terms of Bauge (France), Lehmweller (Germany), Pahsa (Turkey), Atterati (Italy), and Zabour (Yemen) [13,14,15,16,17].
To the best of our knowledge, except for the few studies presented above, cob building is not well described in the literature [18]. This leads to its low use in current construction. Moreover, its behavior in response to climatic solicitations is rarely modeled. For a remedy, this paper proposes to solve this problem and to overcome the limits of cob building by enriching literature databases. Our aim is to get a better understanding of the behavior of cob mixtures in order to develop its use in our sector. The investigations include microstructure observations, characterization of the compressive strength, thermal conductivity, specific heat, moisture buffer value (MBV), sorption isotherms, water vapor permeability, and numerical simulations. In addition to the experimental characterization, numerical simulation was carried out. The latter is based on the model of Philip and de Vries [19] and the work of [20] and [21]. The aim is to predict the hygrothermal behavior (water content profile, relative humidity, etc.) of the cob. The estimated properties of the cob are compared to those of other materials such as hemp concrete, glass powder concrete, and clay brick. The aim is to position the cob regarding its utilization as a building envelope material. The experimental measured properties are used as input data to feed the numerical modeling proposed.

2. Materials and Methods

2.1. Raw Earth

The material being studied is a soil excavated in the eco-district of Guerande (city located near Nantes, France). This is a local material chosen to reduce the carbon footprint compared to conventional materials. The granulometric analysis is an important tool for soil classification. Based on the NF EN ISO 17892-4 standard [22], the particle size composition of the Guerande soil was determined by wet sieving for the part of the soil larger than 80 μm and by using sedimentation for elements smaller. It was deduced that the studied soil is a sandy loam type. The latter is composed of 8% clay, 47% silt, and 45% sand. It is specified in the literature that the optimal quantity of clay for the cob construction mode is around 20% [14]. Earth-based materials for buildings are often represented using triangular texture diagram [23]. In France, a classification based on the French soil research organization “GEPPA” is often used [24]. Note that in the GEPPA diagram, the top dimension of the silt is 50 μm, which is different from NF EN ISO 17892-4. Indeed, the silt content based on this system is 44% and the sand content is 48%. The average value of raw earth density is 1878 kg·m−3 [25]. Furthermore, the Atterberg limits were reached using the NF EN ISO 17892-12 standard [26]. The plastic limit Wp is 17%, while the liquid limit is Wl 34%. The plasticity index Ip is equal to 17. Finally, the blue methylene value was obtained from the standard NF EN 933-9 and is 1.9 [27].

2.2. Straw

An amount of 3% by mass of vegetable fibers was added in the mix. This rate was previously found in the literature for cob [28,29,30]. The addition of vegetable fibers accelerates the drying process, reduces shrinkage cracks, and improves the cohesion and the ductility of the material [14].
For this purpose, we have valorized a vegetable by-product and integrated it into our material. A by-product means a material that is unavoidably created to produce another desired material [31,32]. Our choice was straw fibers. Straw is a by-product of industrial agriculture, which is made from dry stems of cereal plants, like wheat, barley, spelt, and spurge [33]. For a particle length of 50.8mm, the average density is about 93 kg·m−3 [34]. Contrary to hay, straw is not very nutritious and is therefore less often used for the feeding of livestock. However, straw is used for litter. Chemically speaking, straw is composed mainly of cellulose and lignin, the same main components as wood [35]. In addition, the incorporation of straw fibers improves the hygrothermal properties of the earth because of their low thermal conductivity, between 0.06 and 0.08 W·m−1·K−1 [36]. This value is slightly lower for hay with values ranging from 0.0284 to 0.0605 W·m−1·K−1, obtained, respectively, at a temperature of −17.8 °C and 60.1 °C. Thermal conductivity had been characterized for different initial mean hay temperatures of hay, moisture contents, and bulk densities [37].
The straw fibers were evenly cut to a size of 50 ± 5 mm before manufacturing the earth-based composites. Afterwards, the average water content of the used soil was measured in order to reach the prescribed water content. According to [29,38,39], the water content of the cob should be between 10 and 28%. Thus, average water content of 21% was chosen for our formulation. In accordance with the literature [40,41], a mass percentage of 3% of fibers in relation to the dry mass of raw earth was retained. Besides, to avoid the absorption of water by the straw fibers that reduces the workability of the composite at the fresh state, the straw fibers were immersed in water for 5 min. Then, the fibers were drained for 5 min.

2.3. Mixing

The manufacturing process was carried out with a mixer and a kneading machine as follows:
  • Mixing the raw earth alone for 5 min at 120 rpm
  • Adding water and mixing for 5 min at 120 rpm
  • Adding half the amount of fiber and kneading for 5 min at 120 rpm
  • Adding the remaining fibers and kneading for 5 min at 120 rpm
We then filled hermetic bags with our mixture. We waited for 24 h to make specimens with our cob formulation, giving time for the clay to rehydrate [42]. After that, samples were manufactured with 3D printed molds designed especially for the devices used during our investigation. Prior to the hygrothermal characterization, dry density was measured. The latter has a value of   ρ s = 1654   kg · m 3 . Moreover, compressive strength has been determined with a value of 2.9 ± 0.1 MPa.

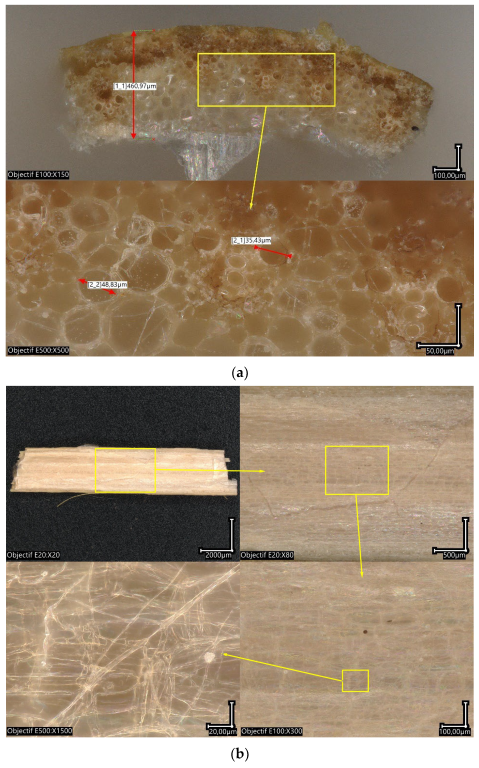
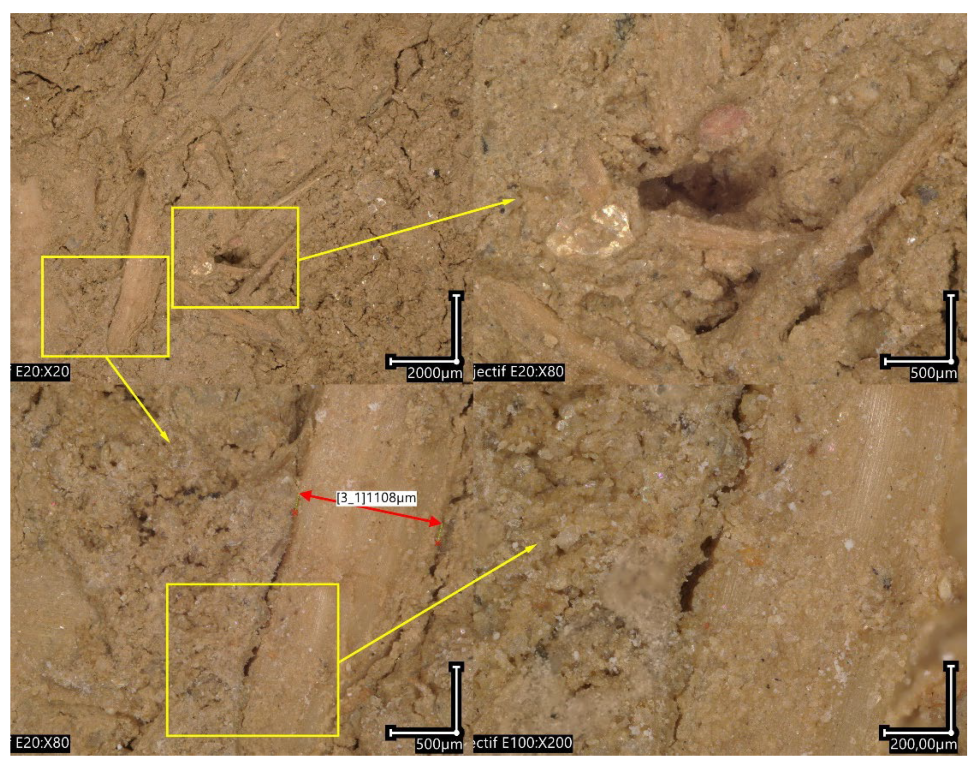
2.4. Microstructure Observations

The microstructure observations have been carried out with the CMOS-based digital microscope VHX 7000 (Keyence) that achieves a typical magnification of ×6000 in the optical wavelength range. Viewed at a resolution of 2880 × 2160 pixels, the physical size of the pixels varies between 0.7 µm and 5 µm depending on the magnification. The following magnifications were used to capture the information: E20 × 20, E20 × 80, E100 × 100, E100 × 300.

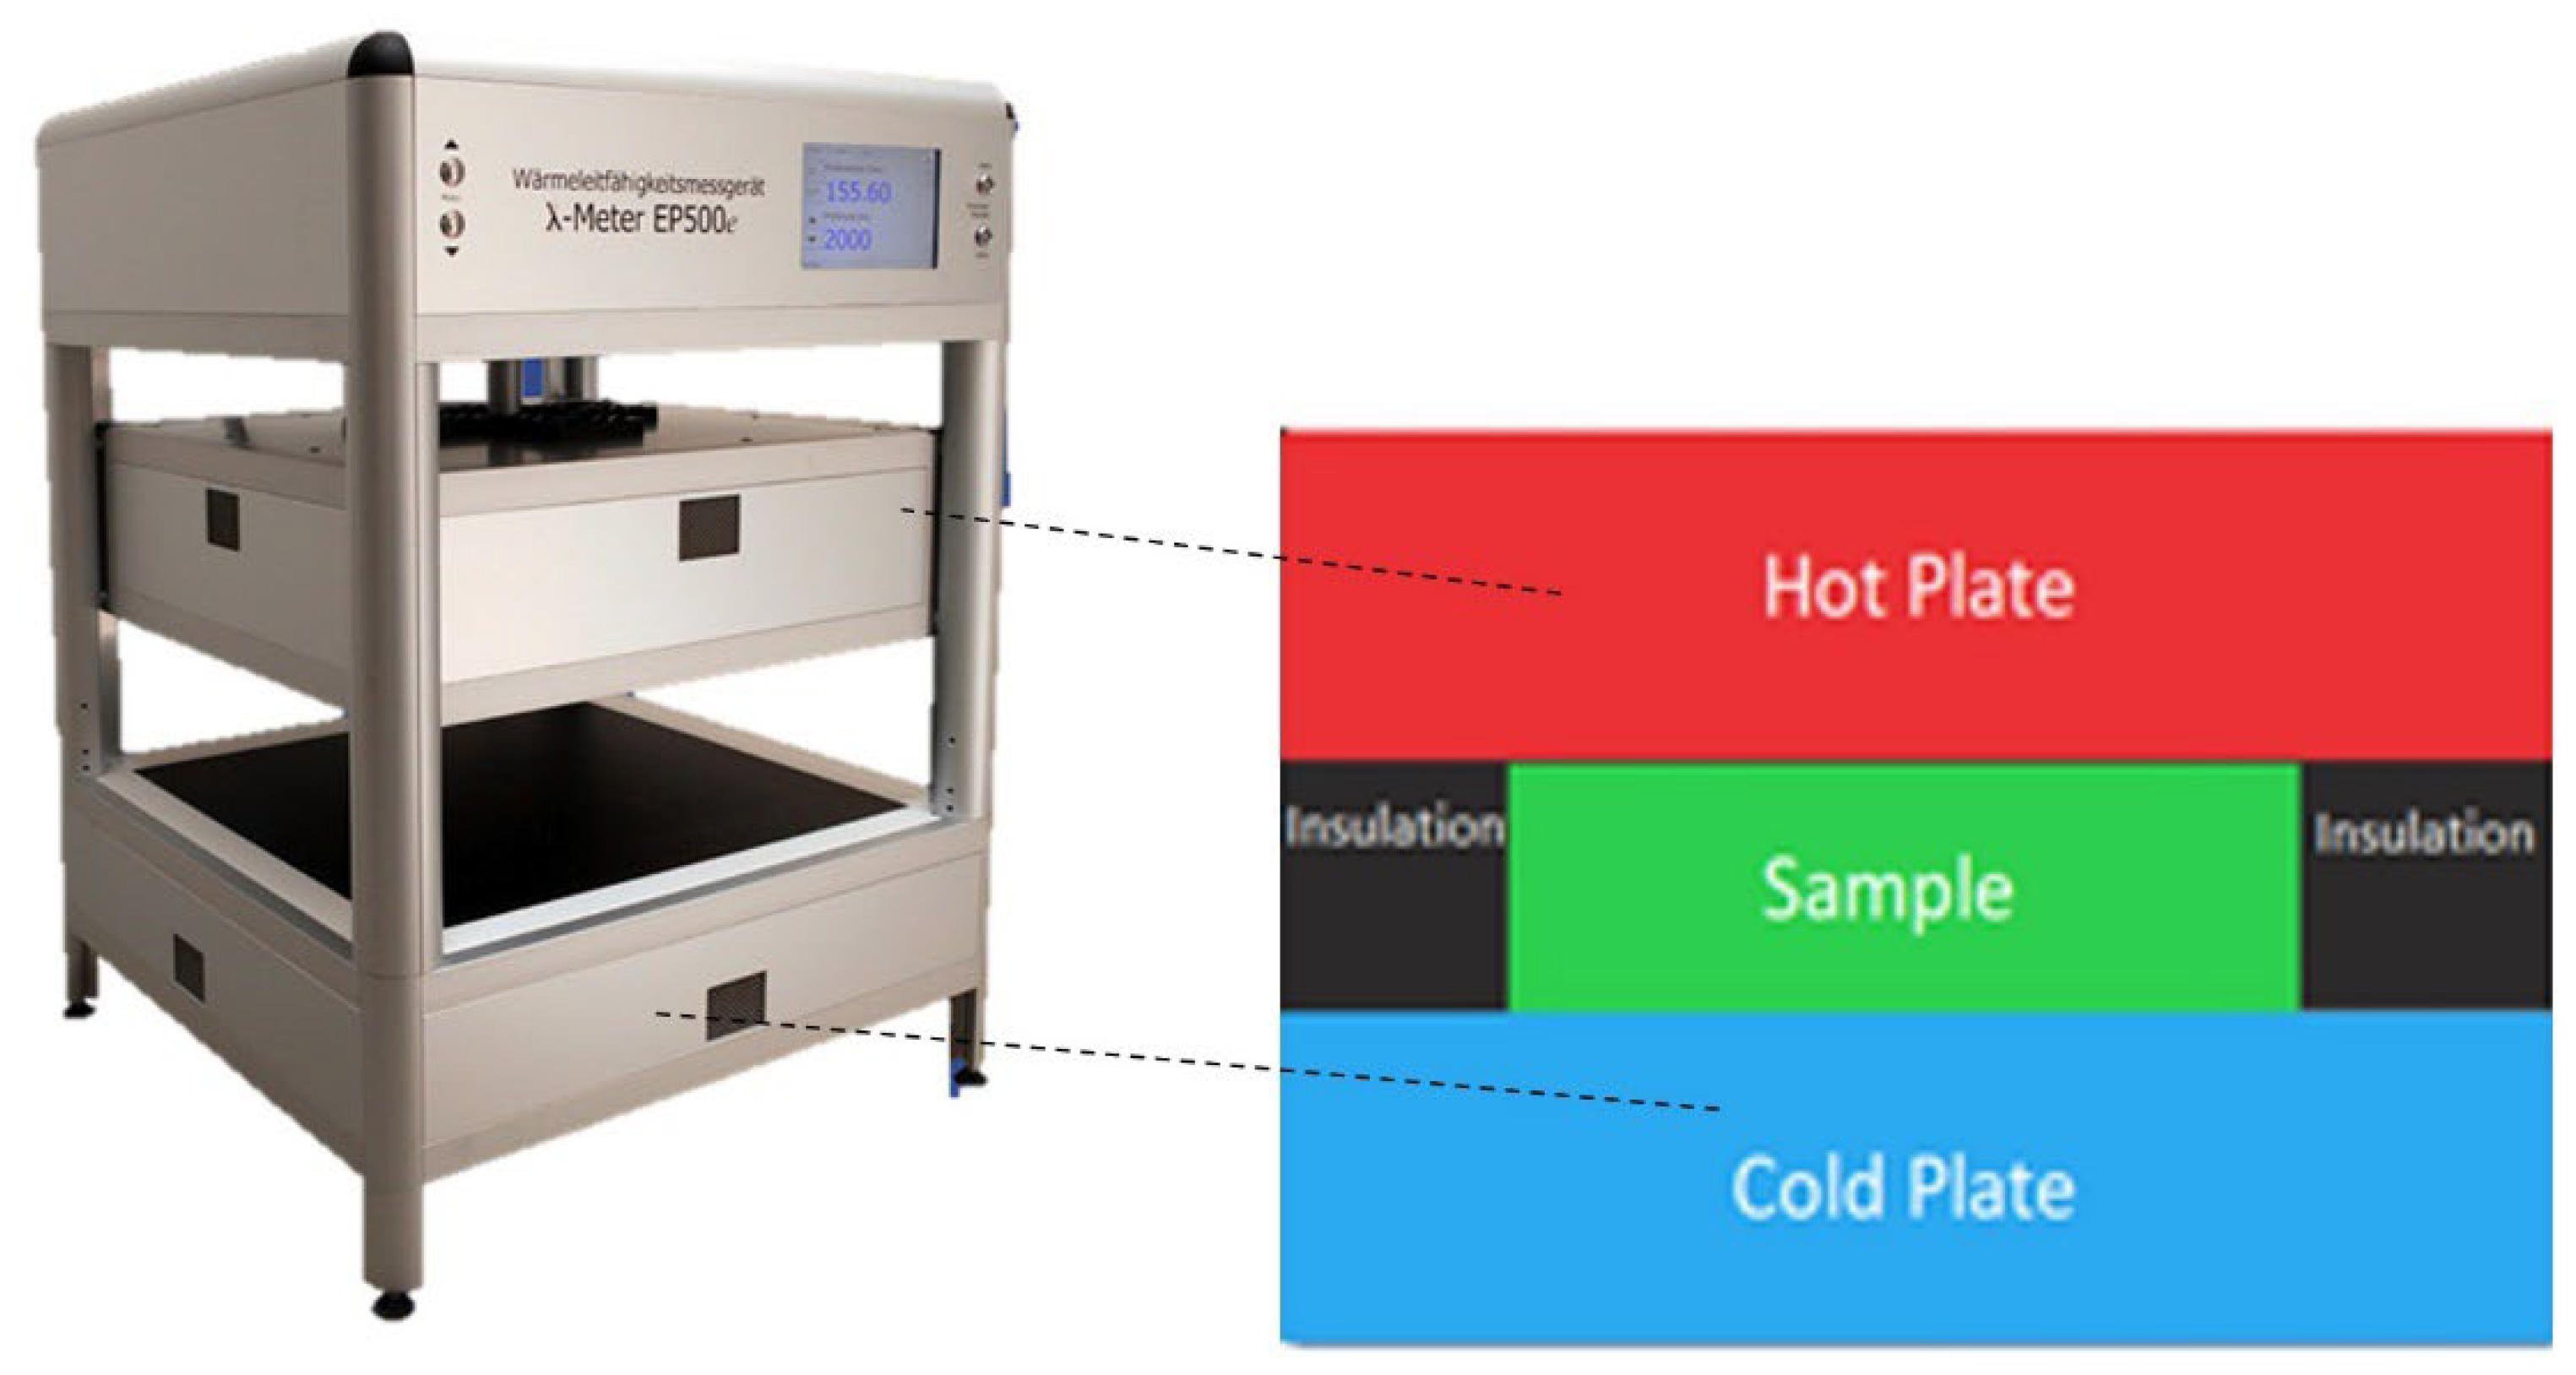
2.5. Thermal Conductivity

Thermal conductivity is a property that has the most significant impact on the thermal performance of a building. It describes the insulation capacity (or conductivity) of a material. The thermal conductivity was measured with the Lambda-meter EP500e device for different temperatures 10 °C, 23 °C, and 40 °C (Figure 1). This device is based on the technique of the guarded hot plate which exploits the Fourier’s law in steady state according to standards [43,44]. The measurements are performed under a temperature gradient of 15 °C by fixing the hot surface of the device at a reference temperature. The parallelepipedal specimens have the following dimensions: 15 × 15 × 3 cm3. They were preconditioned in an oven at 40 °C until the mass was stabilized. Finally, the thermal conductivity was calculated using Fourier’s law with the unidirectional heat flux through the sample. This is equivalent to the electrical heating power.
λ = Q · e Δ T · A = U · I · e Δ T · A
where:
e: thickness of the specimen (m);
A: the surface area perpendicular to the heat flux (m2);
Q: the unidirectional heat flow (W);
ΔT: the temperature gradient (°C);
U·I: electrical heating power (W).

2.6. Specific Heat Capacity

Thermal capacity or specific heat capacity is a property expressing the capacity of a material to store heat. Knowledge of the thermal capacity of materials is essential to complete the thermal characterization. For this, the Calvet calorimeter was used in accordance with the NF EN 821-3 standard [45]. The Calvet calorimeter shown in Figure 2 is a differential device. It is equipped with two 3D thermopiles that respectively surround a measurement cell in which a sample of the studied material is placed and a reference cell containing a thermally inert product. A larger sample size gives more accurate results, which makes the Calvet method more accurate compared to the traditional DSC equipment. The tested samples are cylindrical with a diameter of 1 cm and a length of about 4 cm. Samples were preconditioned in an oven at 40 °C until the mass was stabilized.

2.7. Sorption Isotherms

Adsorption and desorption isotherms of the water vapor were determined. It allows us to evaluate the activity of water at the microscopic scale (modes of fixing of the water molecules at the pore scale). This test indicates the water content of the mass ratio of a material according to the relative humidity (RH). The used device is the “Pro-Umid of SPS” which is based on a gravimetric method. The “SPS Pro-Umid” is fully automated. This device has a gravimetric resolution ranging from 0.1 μg to 10 μg. An internal reference compensates for any drift of the microbalance and offers excellent balance stability, even for long-term measurements (>>24 h). The wide dynamic load range of the microbalances enables accurate and reproducible weighing results at full scale. We measured the isotherms at a temperature of 23 °C with humidity ranging from 0% to 90% of Relative Humidity.

2.8. Moisture Buffer Value (MBV)

The moisture buffering capacity represents the ability of a material to moderate changes in relative humidity in the ambient air. This parameter was measured using the Nordtest method [46]. The principle of the MBV test protocol is to expose the specimens to daily cycles of relative humidity similar to the cycles observed in the building. The samples were then exposed to a cycle of 8 h at 75% RH and 16 h at 33% RH. Prior to measurements, the specimens were pre-conditioned at 23 °C and 50% RH. The dimensions of the cubic specimens are 10 × 10 × 5 cm3. Figure 3 shows a classification of the materials according to their ability to store moisture from the Nordtest project.
Finally, the masses were tracked at the end of each cycle to deduce the MBV from the following equation:
MBV = Δ m A R H m a x R H m i n
In this equation, Δ m is the amplitude of the mass variation during the cycles (g), A is the contact surface between the specimen and the ambient air (m2), RHmax is the relative humidity during the adsorption phase (%), RHmin is the relative humidity during the desorption phase (%).

2.9. Water Vapor Permeability

Water vapor permeability characterizes the ability of a material to transfer moisture under a vapor pressure gradient. The measurements were carried out using the Gravitest® device, which is based on the dry cup method according to ISO 12572 [47]. The cup method consists of applying a relative humidity gradient between two surfaces of a specimen under constant and homogeneous temperature. To do so, the specimen was sealed at the top of a cup containing silica gel. The cup was then placed into a climate chamber with a relative humidity of 50% and a temperature of 23 °C. The mass variation of the specimen was measured until it reached the steady state (constant vapor flux through the specimen) and mass equilibrium during 48 h defined by this criterion:
m t m t + 48   h m t + 48   h 0.1 %
As soon as the vapor flux was stabilized, the latter was calculated. Depending on the boundary conditions of the specimen, permeance to water vapor was deduced. Therefore, the vapor permeability was determined by the assumption that the material is homogeneous. The test was performed on three cylindrical specimens of 8 cm in diameter and 2 cm in thickness.

3. Results and Discussions

3.1. Experimental Characterization

3.1.1. Microstructure Observations

An observation of the cross section of the straw fiber is shown in Figure 4a. It is observed that the microstructure is constituted of multilayers with a tubular structure organized toward the growth of the plant. Many pores are observed at this cross-section. The pore sizes are more or less important with an average diameter of 40 µm. In Figure 4b it appears that the external structure of the straw used in our formulation is smooth with very few irregularities. Figure 5 represents the interface of our material. This shows a good general cohesion of the composite earth/straw. However, in some areas there is poor cohesion between the two materials. This is due to an inter-granular porosity which can be important in case of bad cohesion. This type of porosity could improve the hydric and thermal properties in addition to the intrinsic properties of the straw.

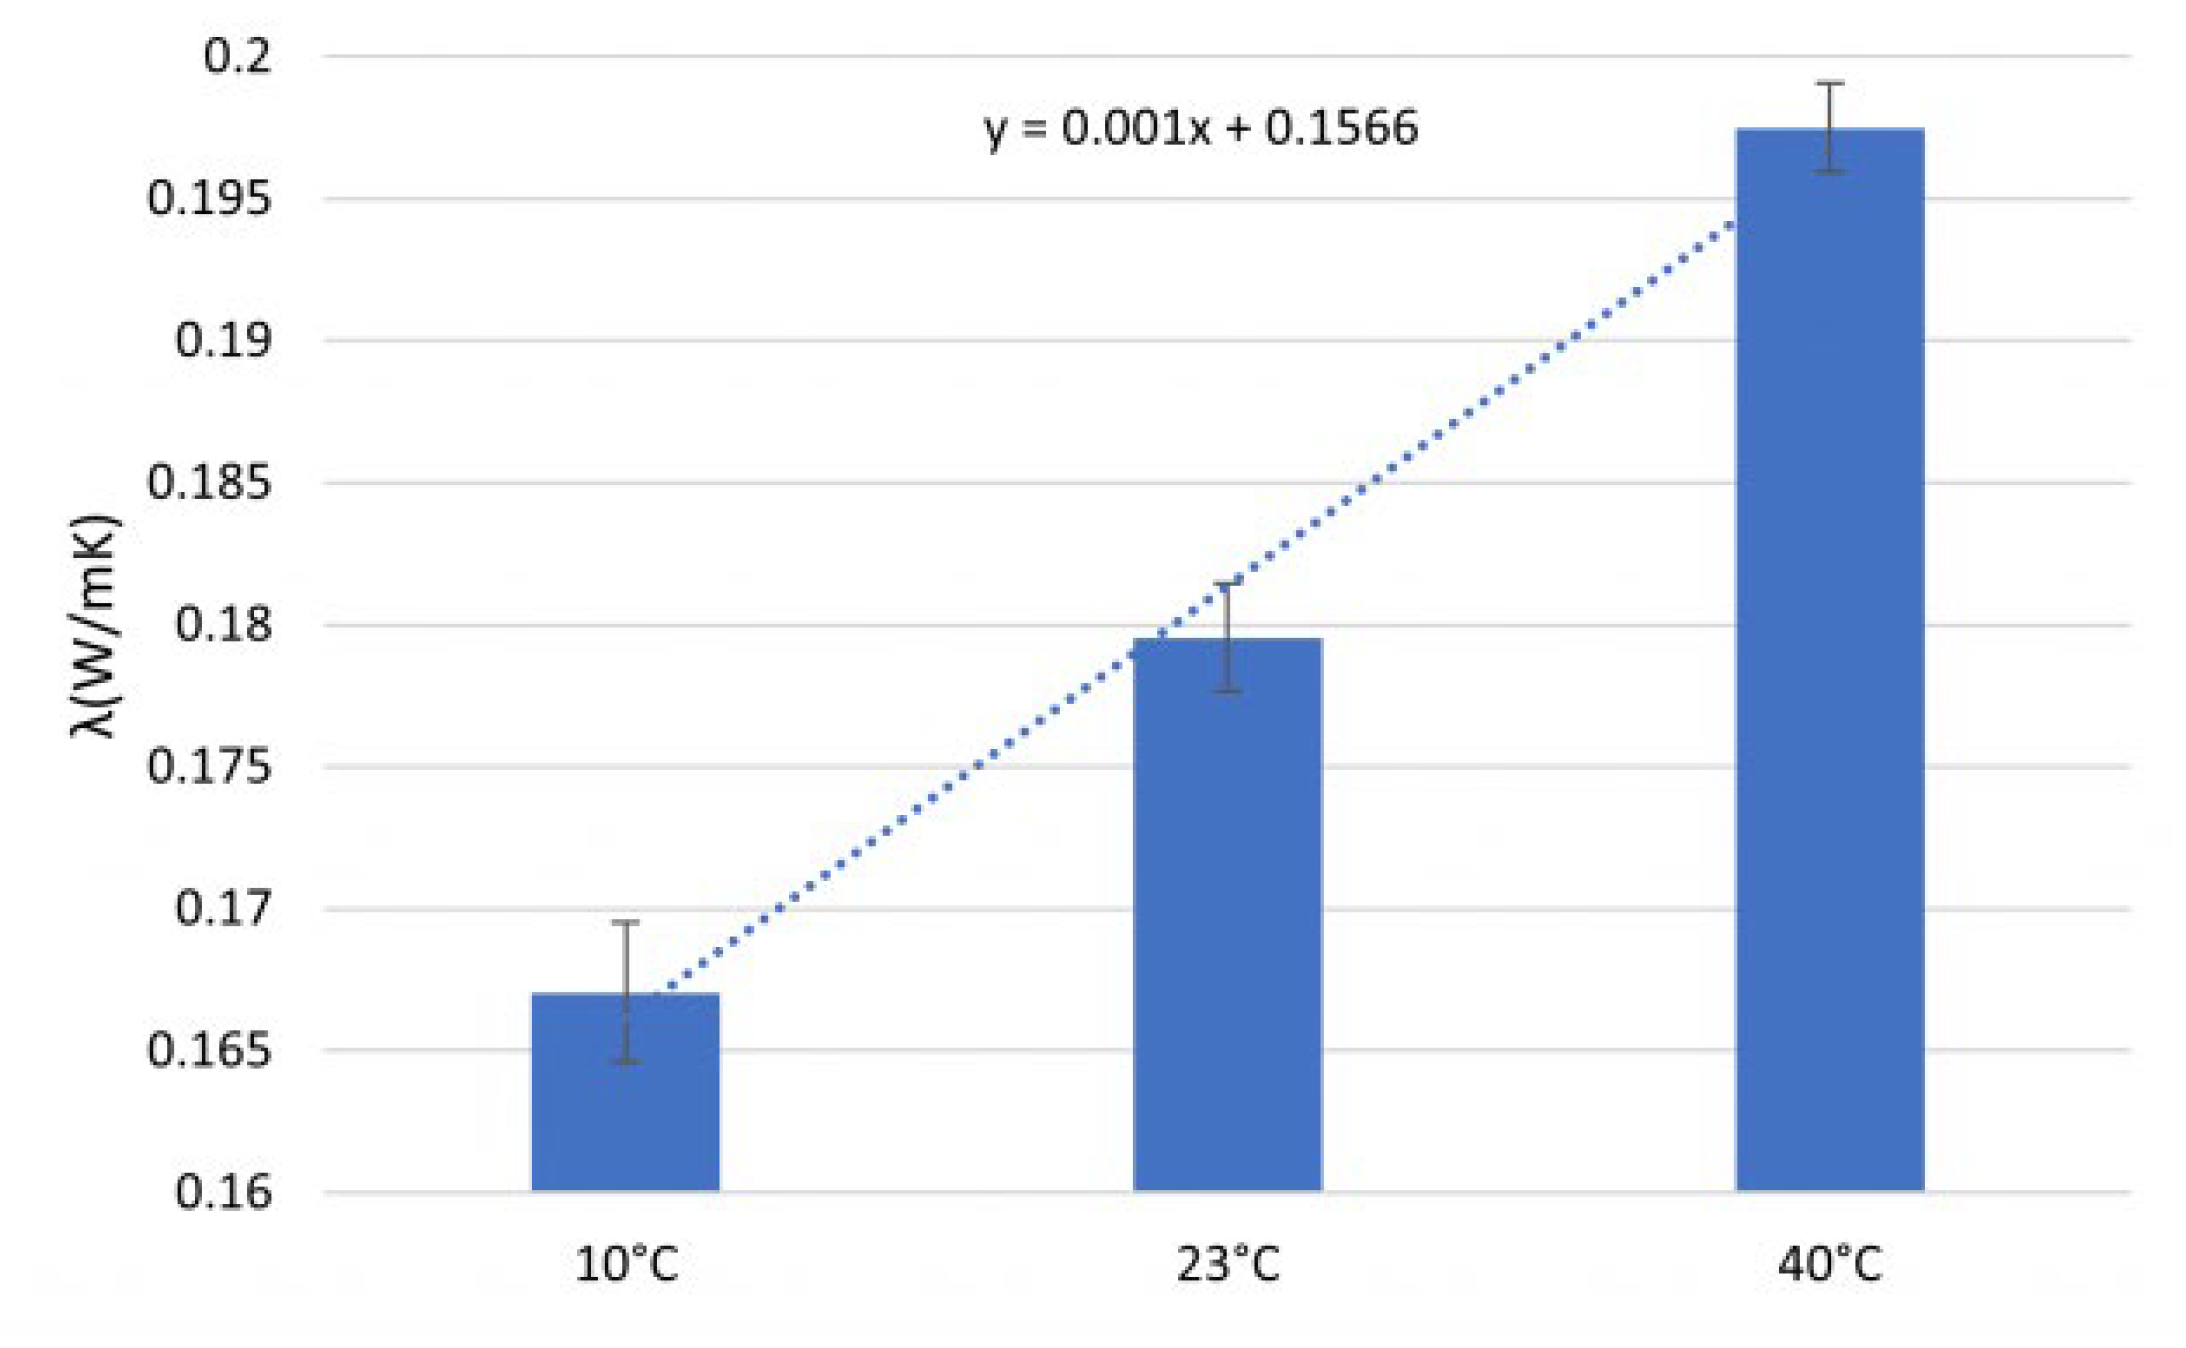
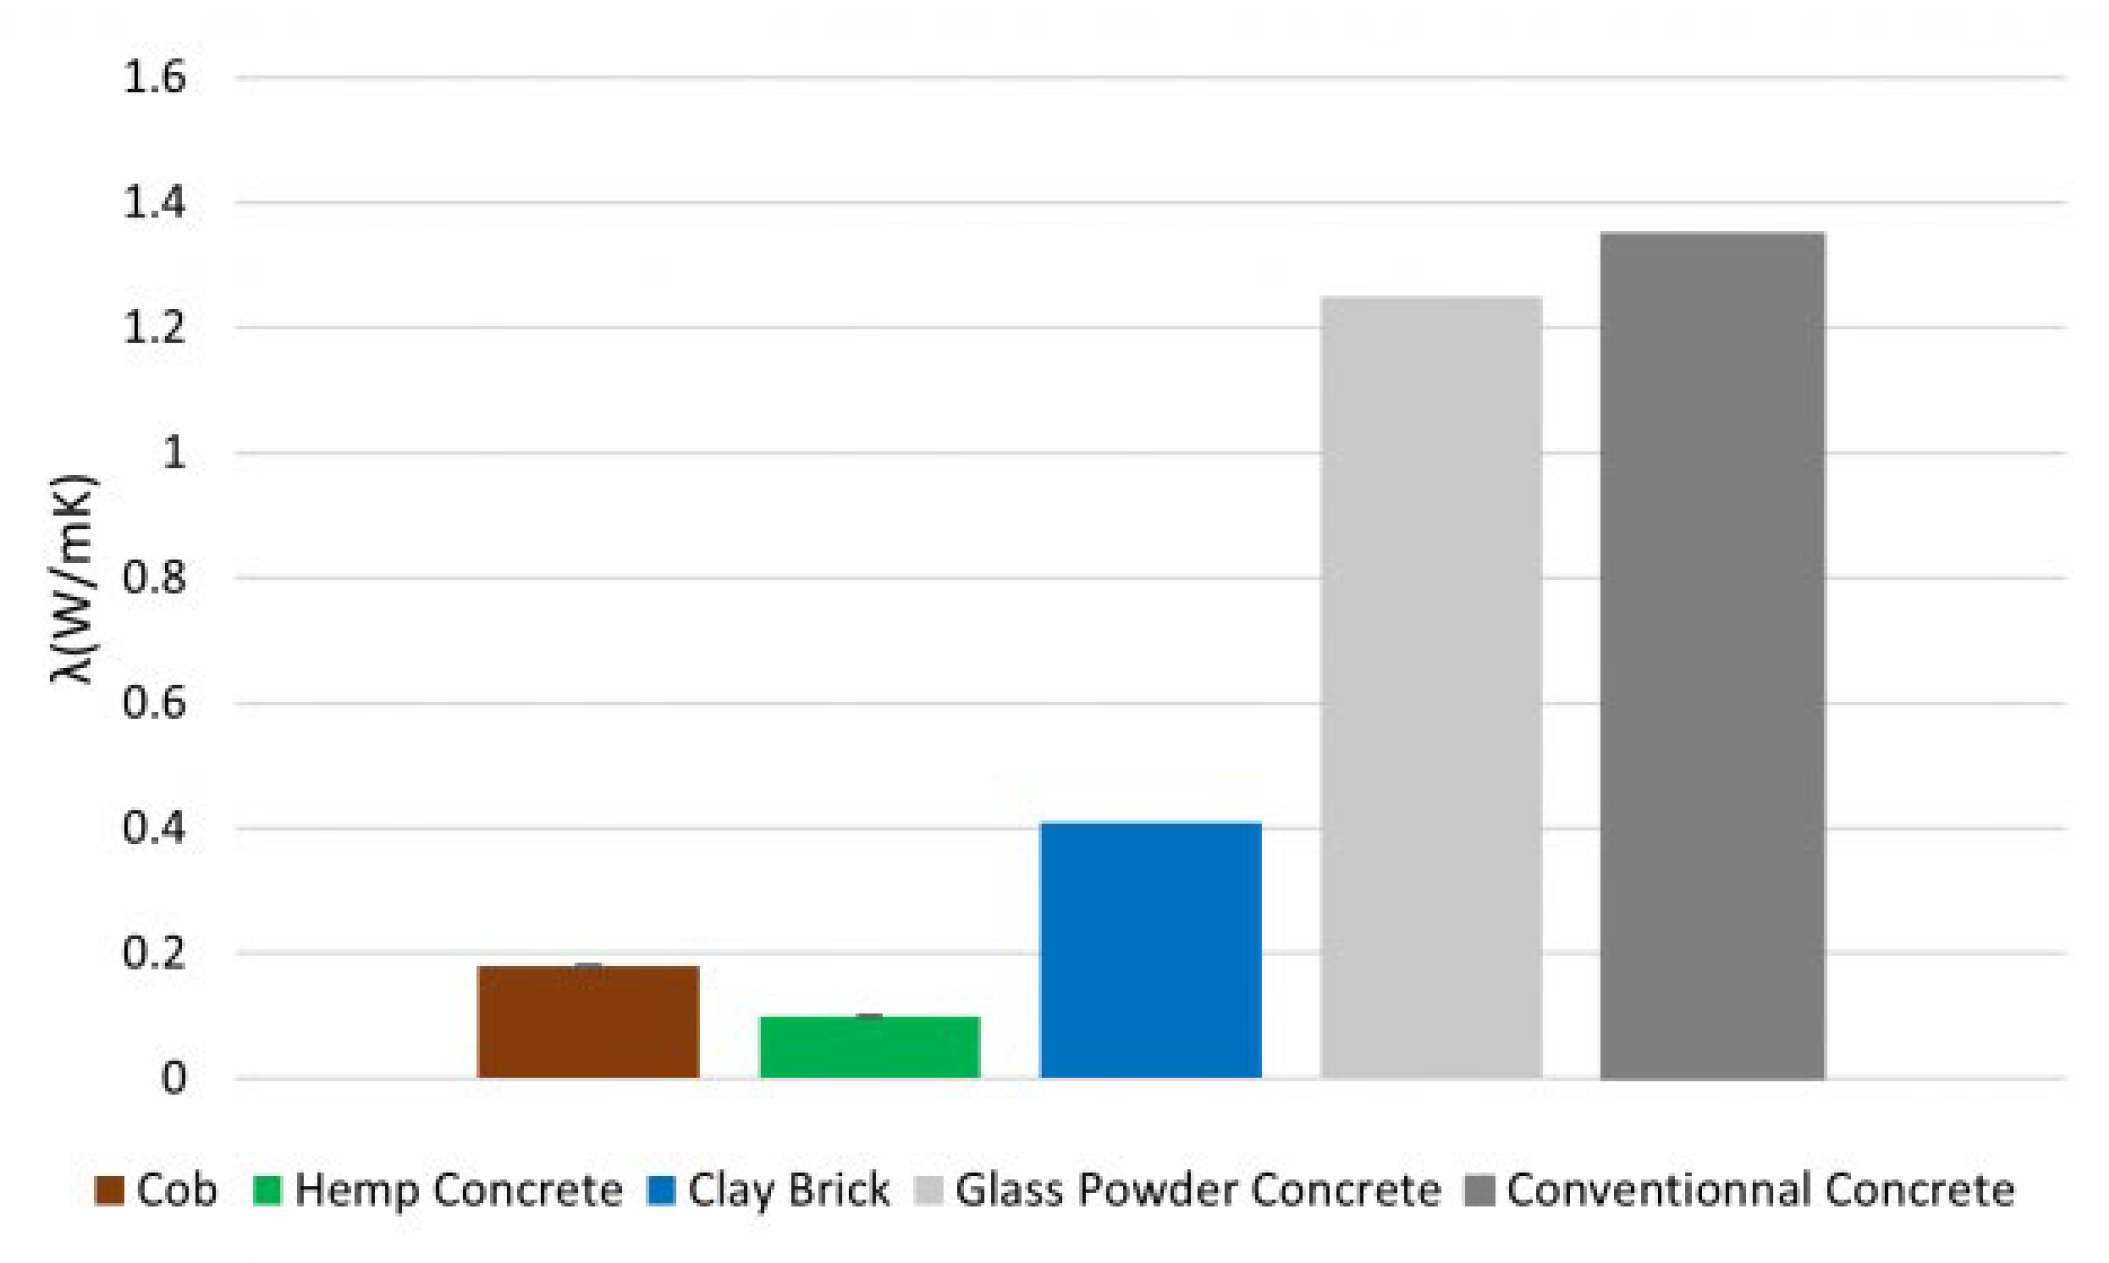
3.1.2. Thermal Conductivity

Thermal conductivity is an important property to characterize the thermal behavior of materials. To ensure good reproducibility of the results, three specimens were tested for our formulation. This property was measured at 3 different temperatures, respectively: 10 °C, 23 °C, and 40 °C. The average thermal conductivities for each temperature and their standard deviations are shown in Figure 6. At a temperature of 23 °C, cob has a thermal conductivity of 0.180 W·m−1·K−1. This value is lower than that of other conventional construction materials, such as cementitious concrete. Indeed, this kind of material can reach a thermal conductivity of 1.20 W·m−1·K−1 [48,49,50]. In Figure 7, the thermal conductivity at 23 °C of cob is compared to other materials:
  • hemp concrete, an insulating material [51],
  • glass powder concrete [52],
  • conventional concrete, structural materials [52],
  • clay brick [53].
The thermal conductivity of cob is close to hemp concrete and clay brick values. Thus, we can consider our formulation of cob a good insulating material for construction. Its thermal conductivity is about 7 times lower than glass powder concrete. Otherwise, the thermal conductivity of conventional concrete is almost 8 times higher than cob. Moreover, the thermal conductivities assessed on cob correspond to the one measured for unfired earth blocks with a mass straw content of 6% (0.14 ± 0.01 W·m−1·K−1). The value is obtained by the same testing method, which is the Guarded Hot Plate GHP [54].

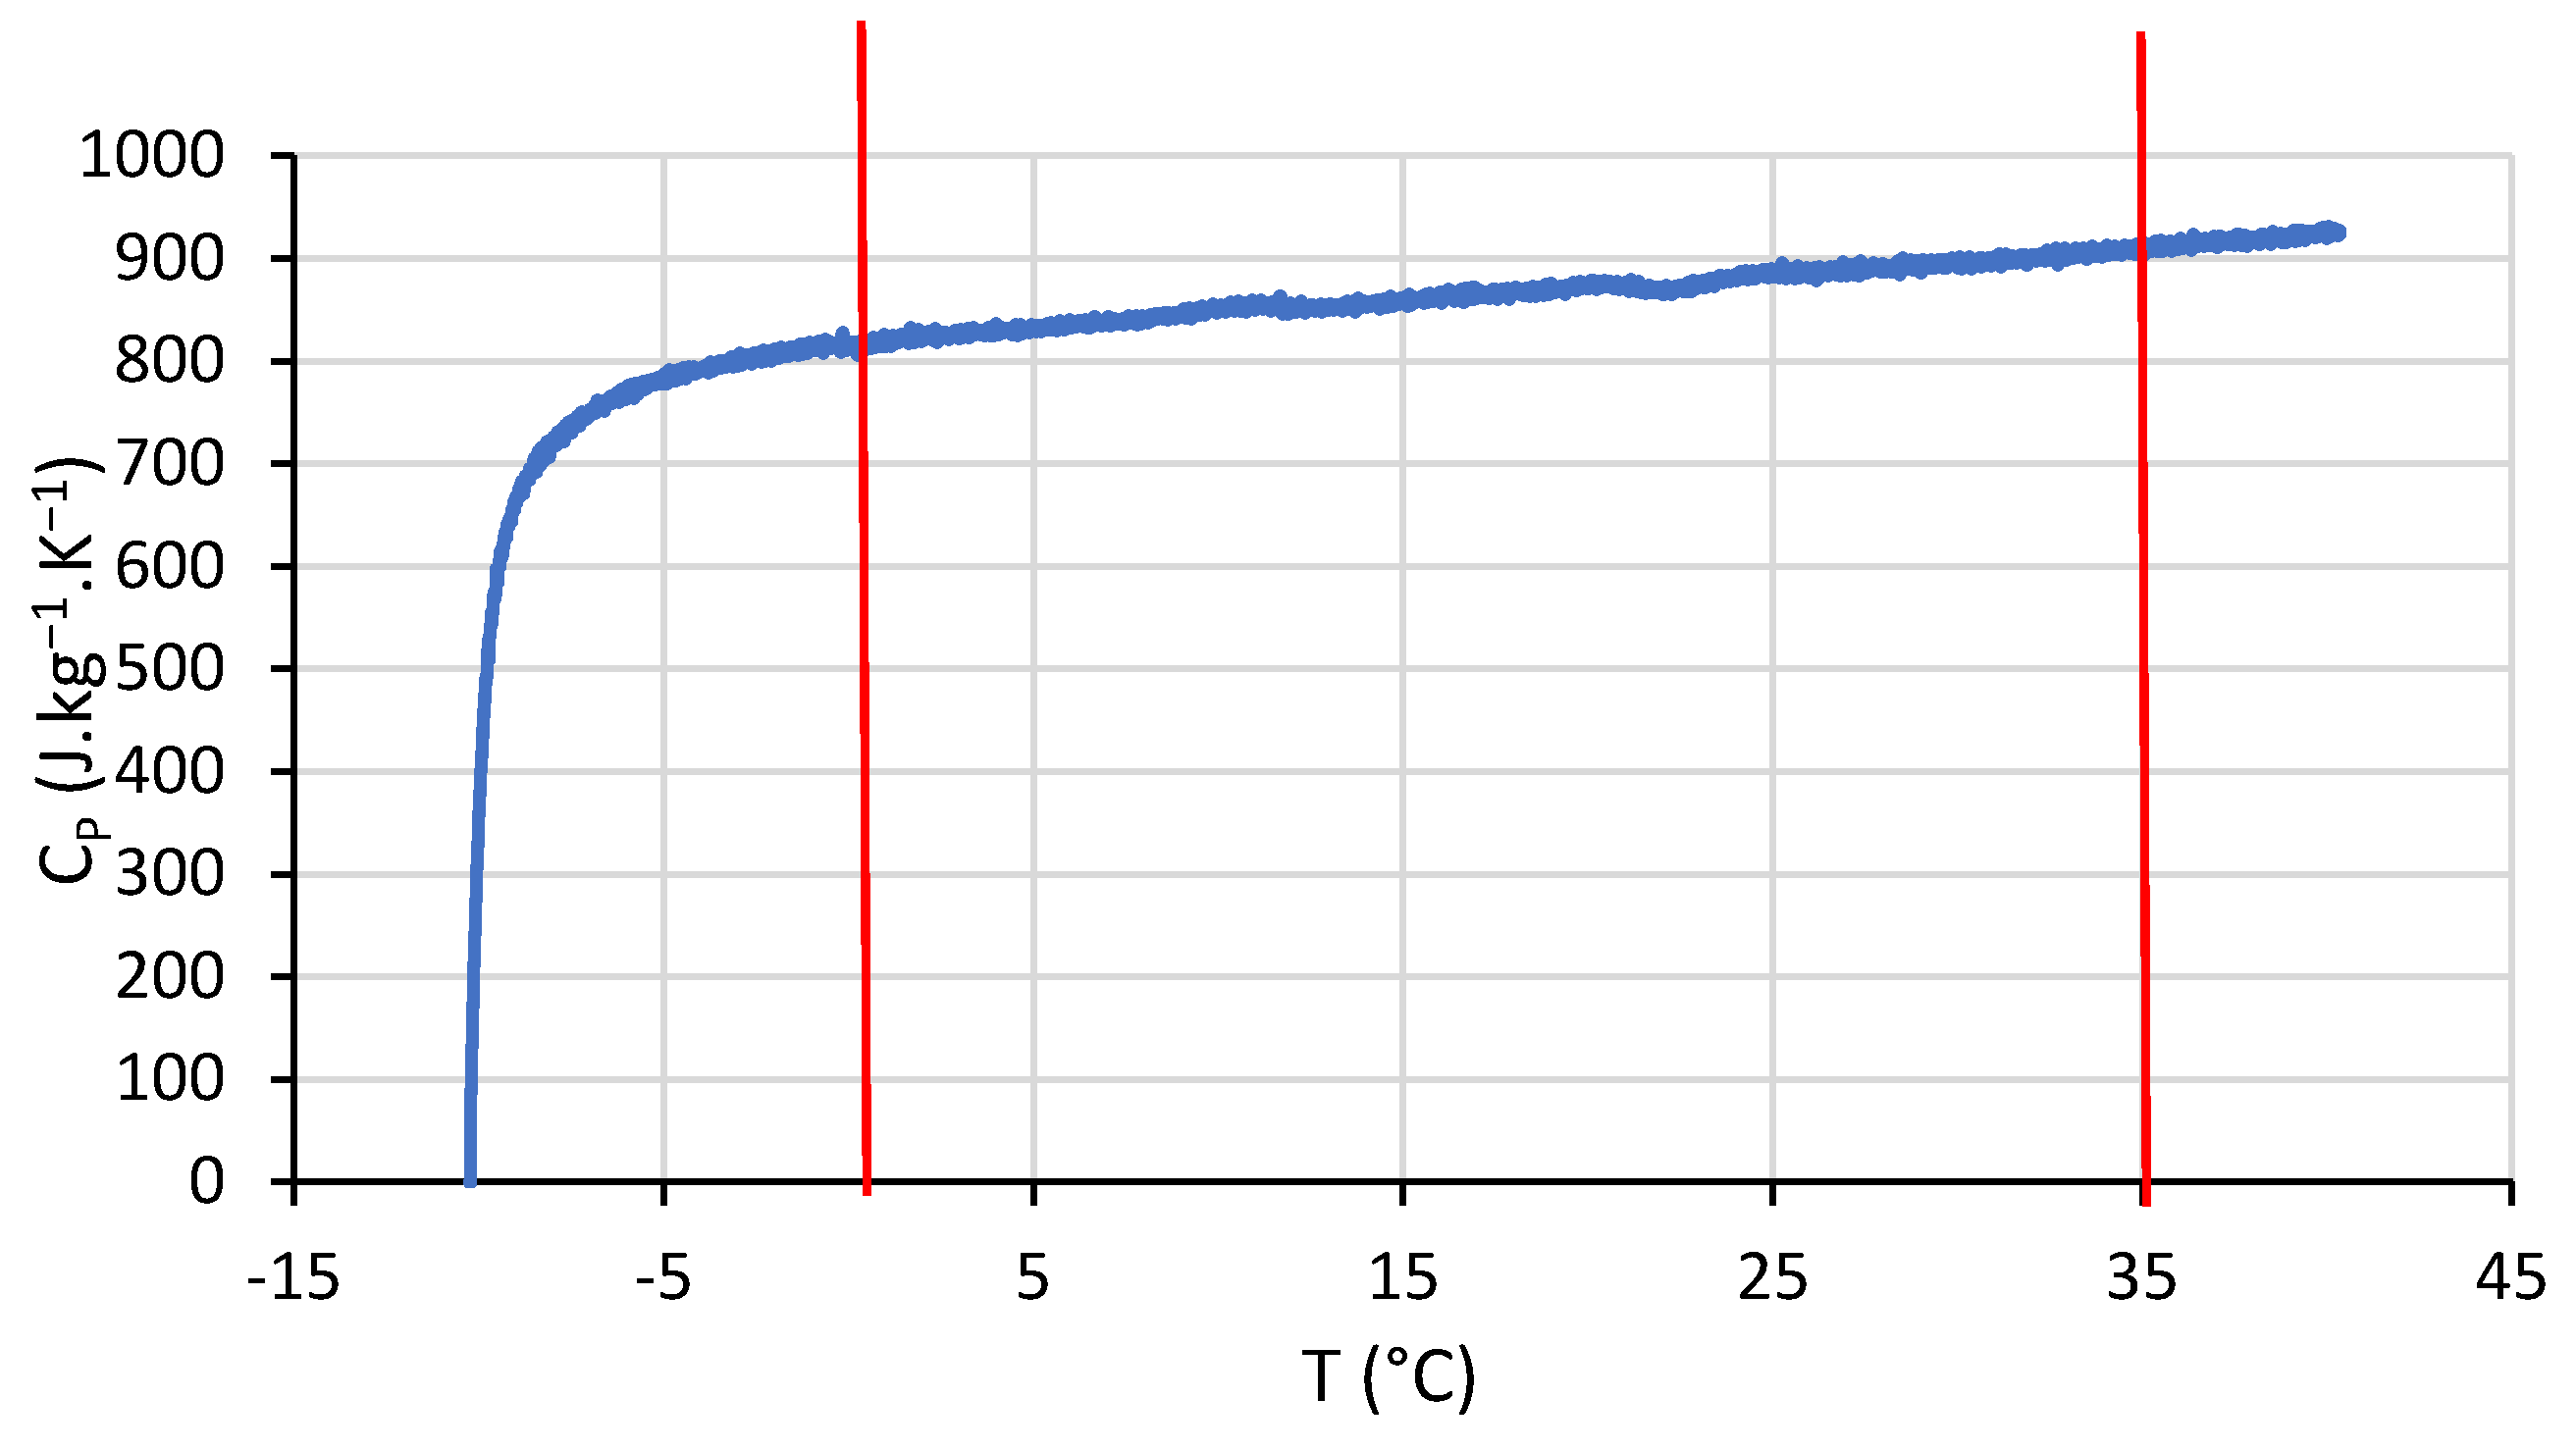
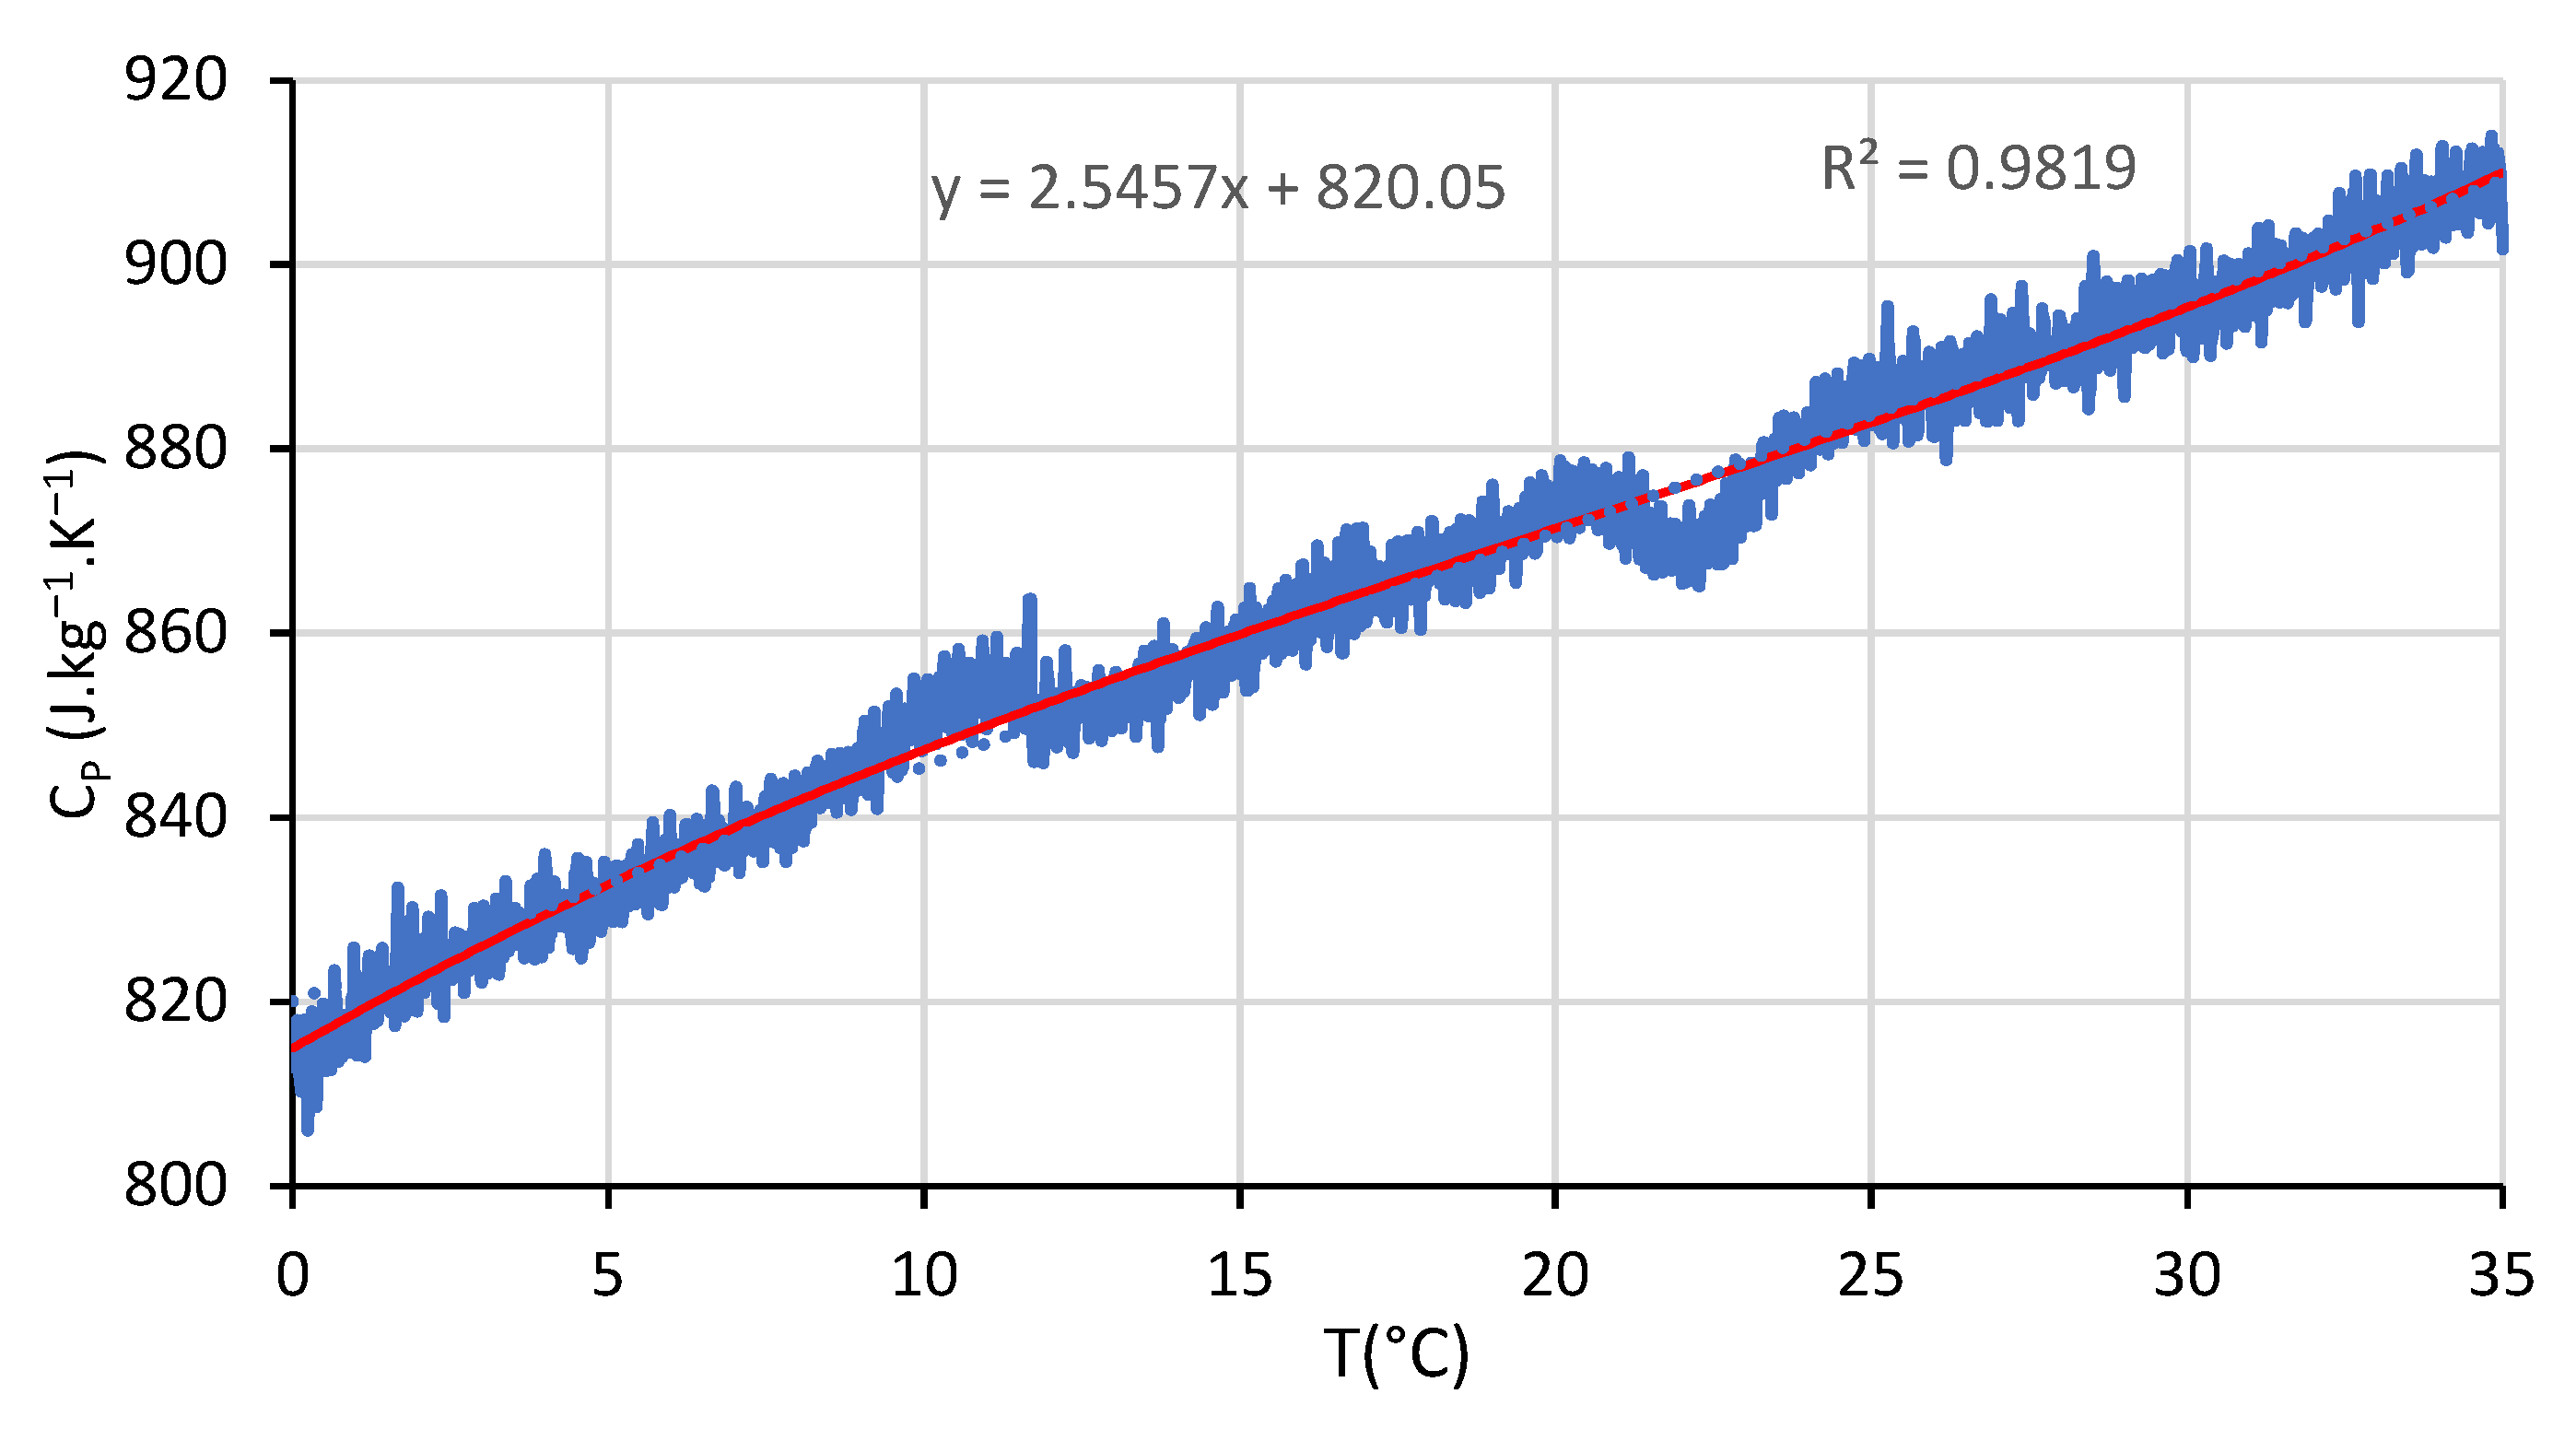
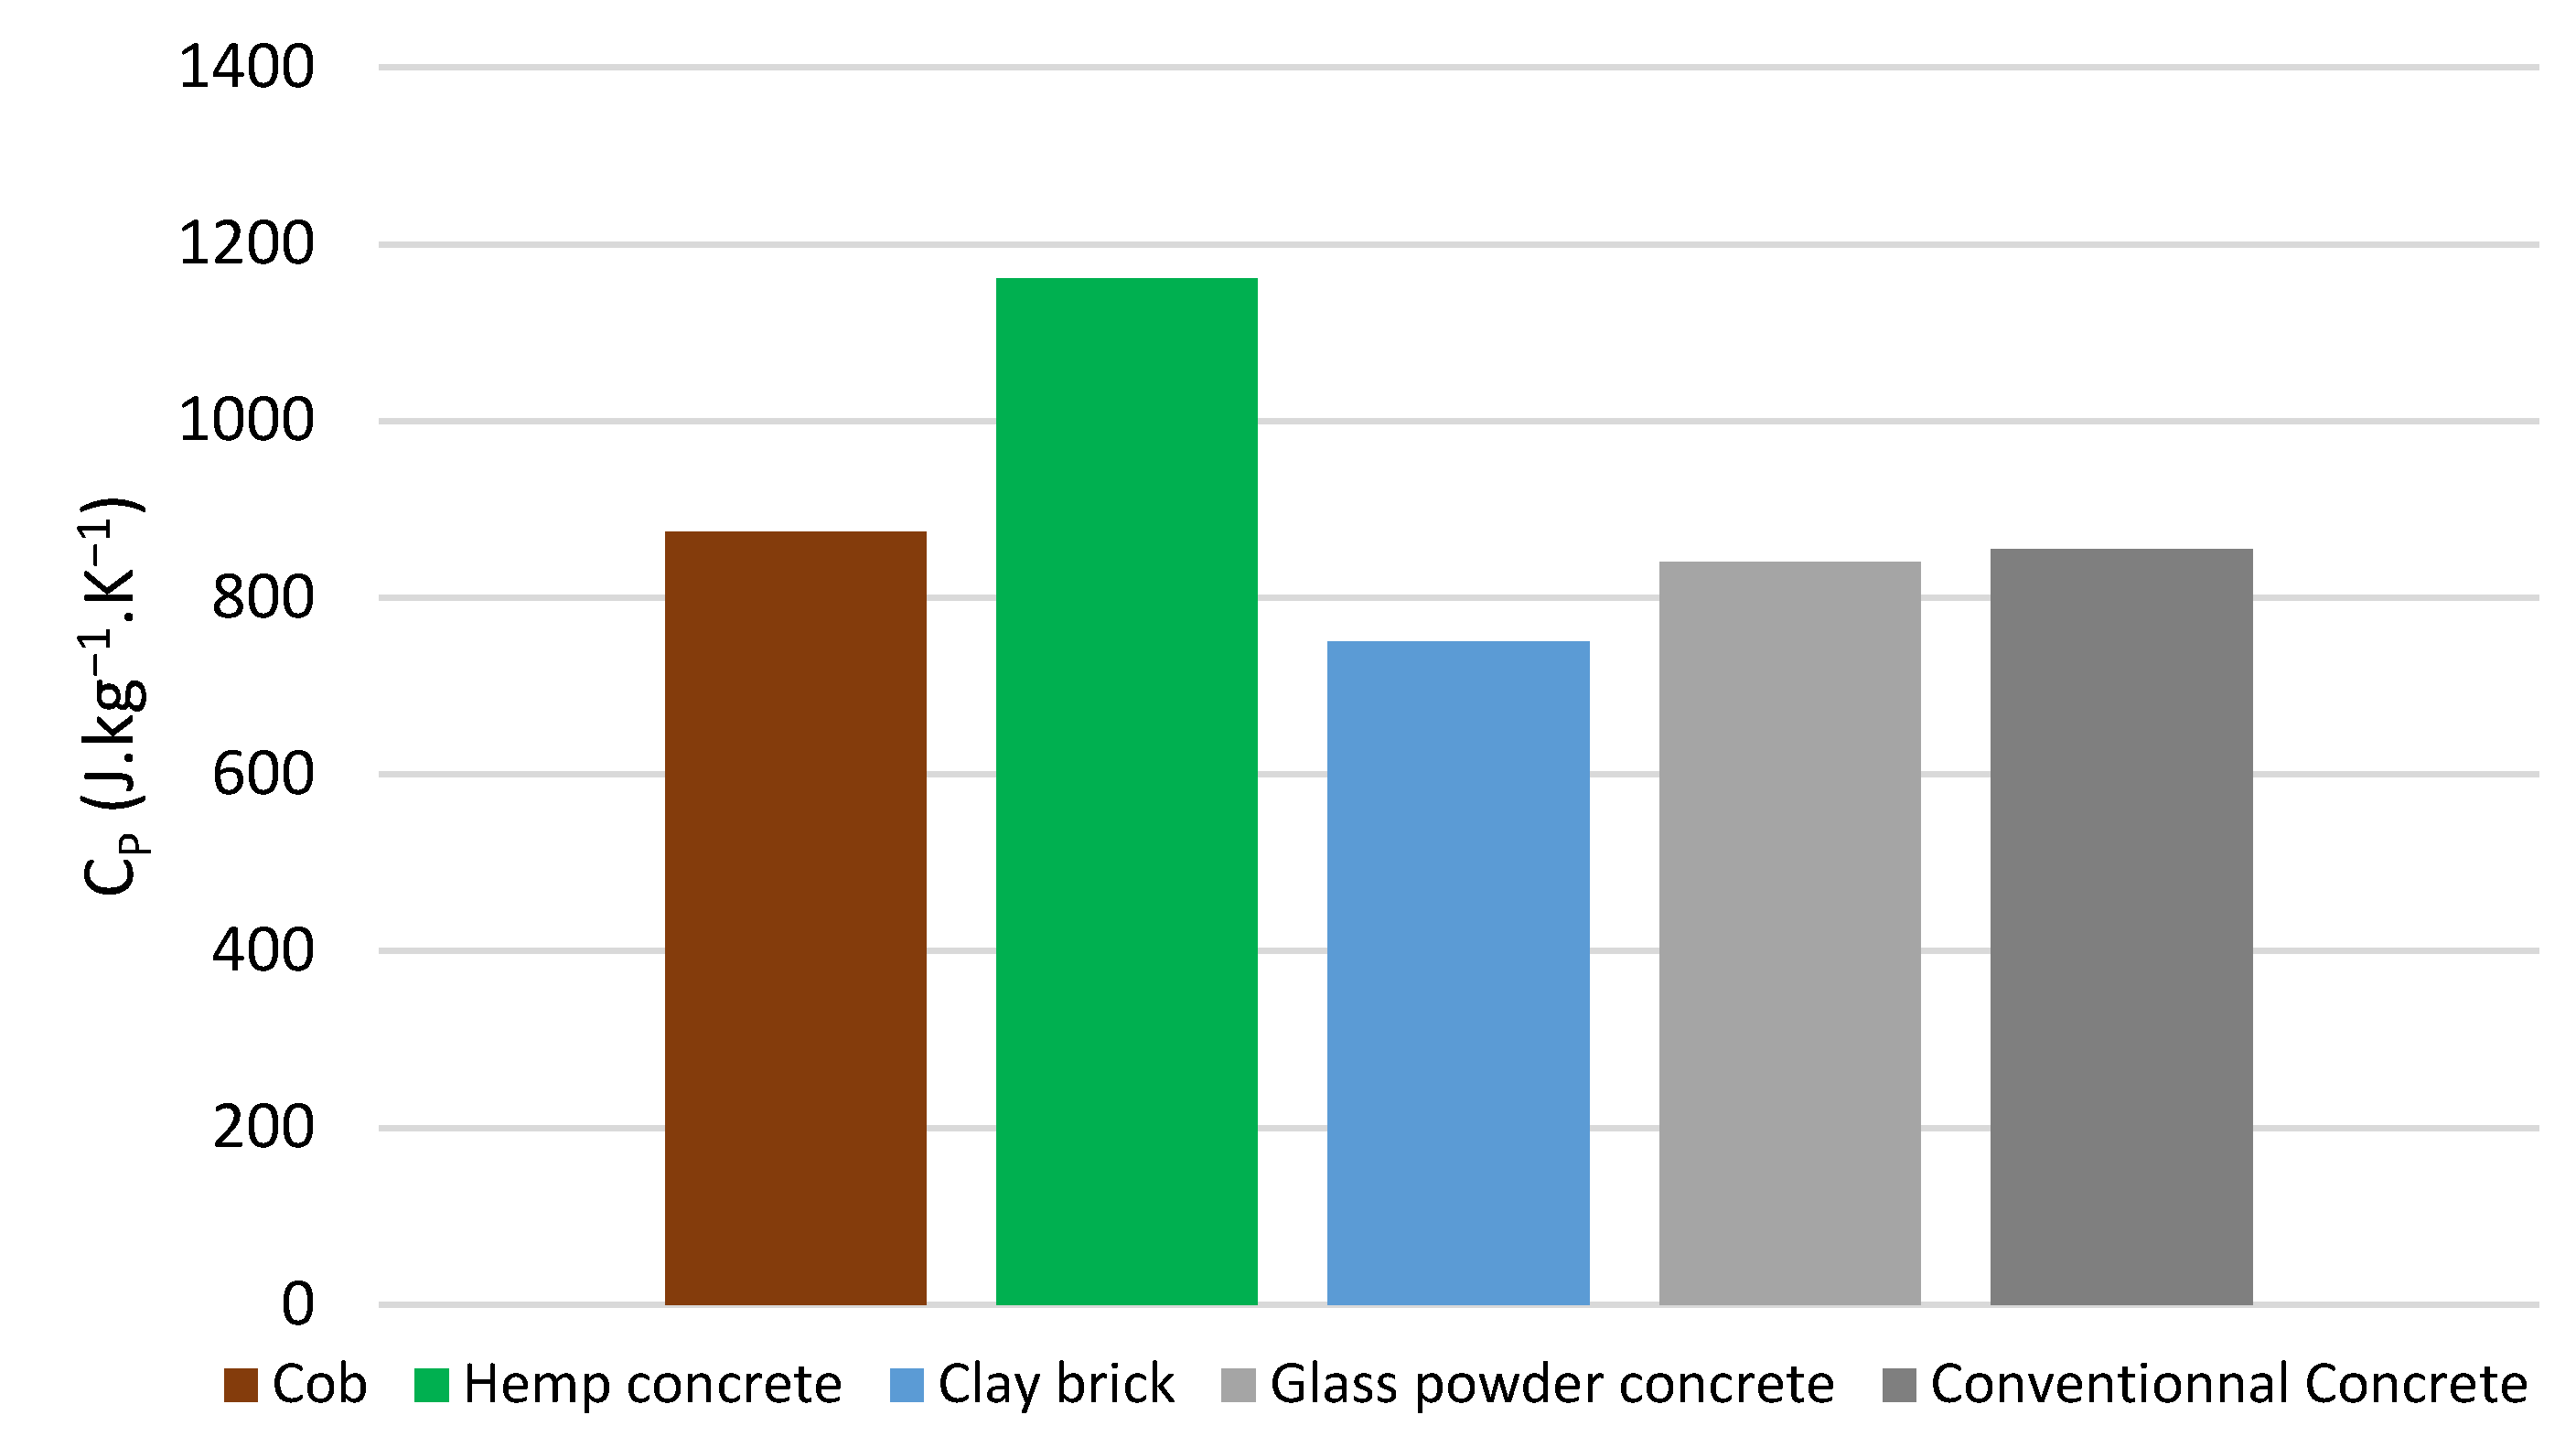
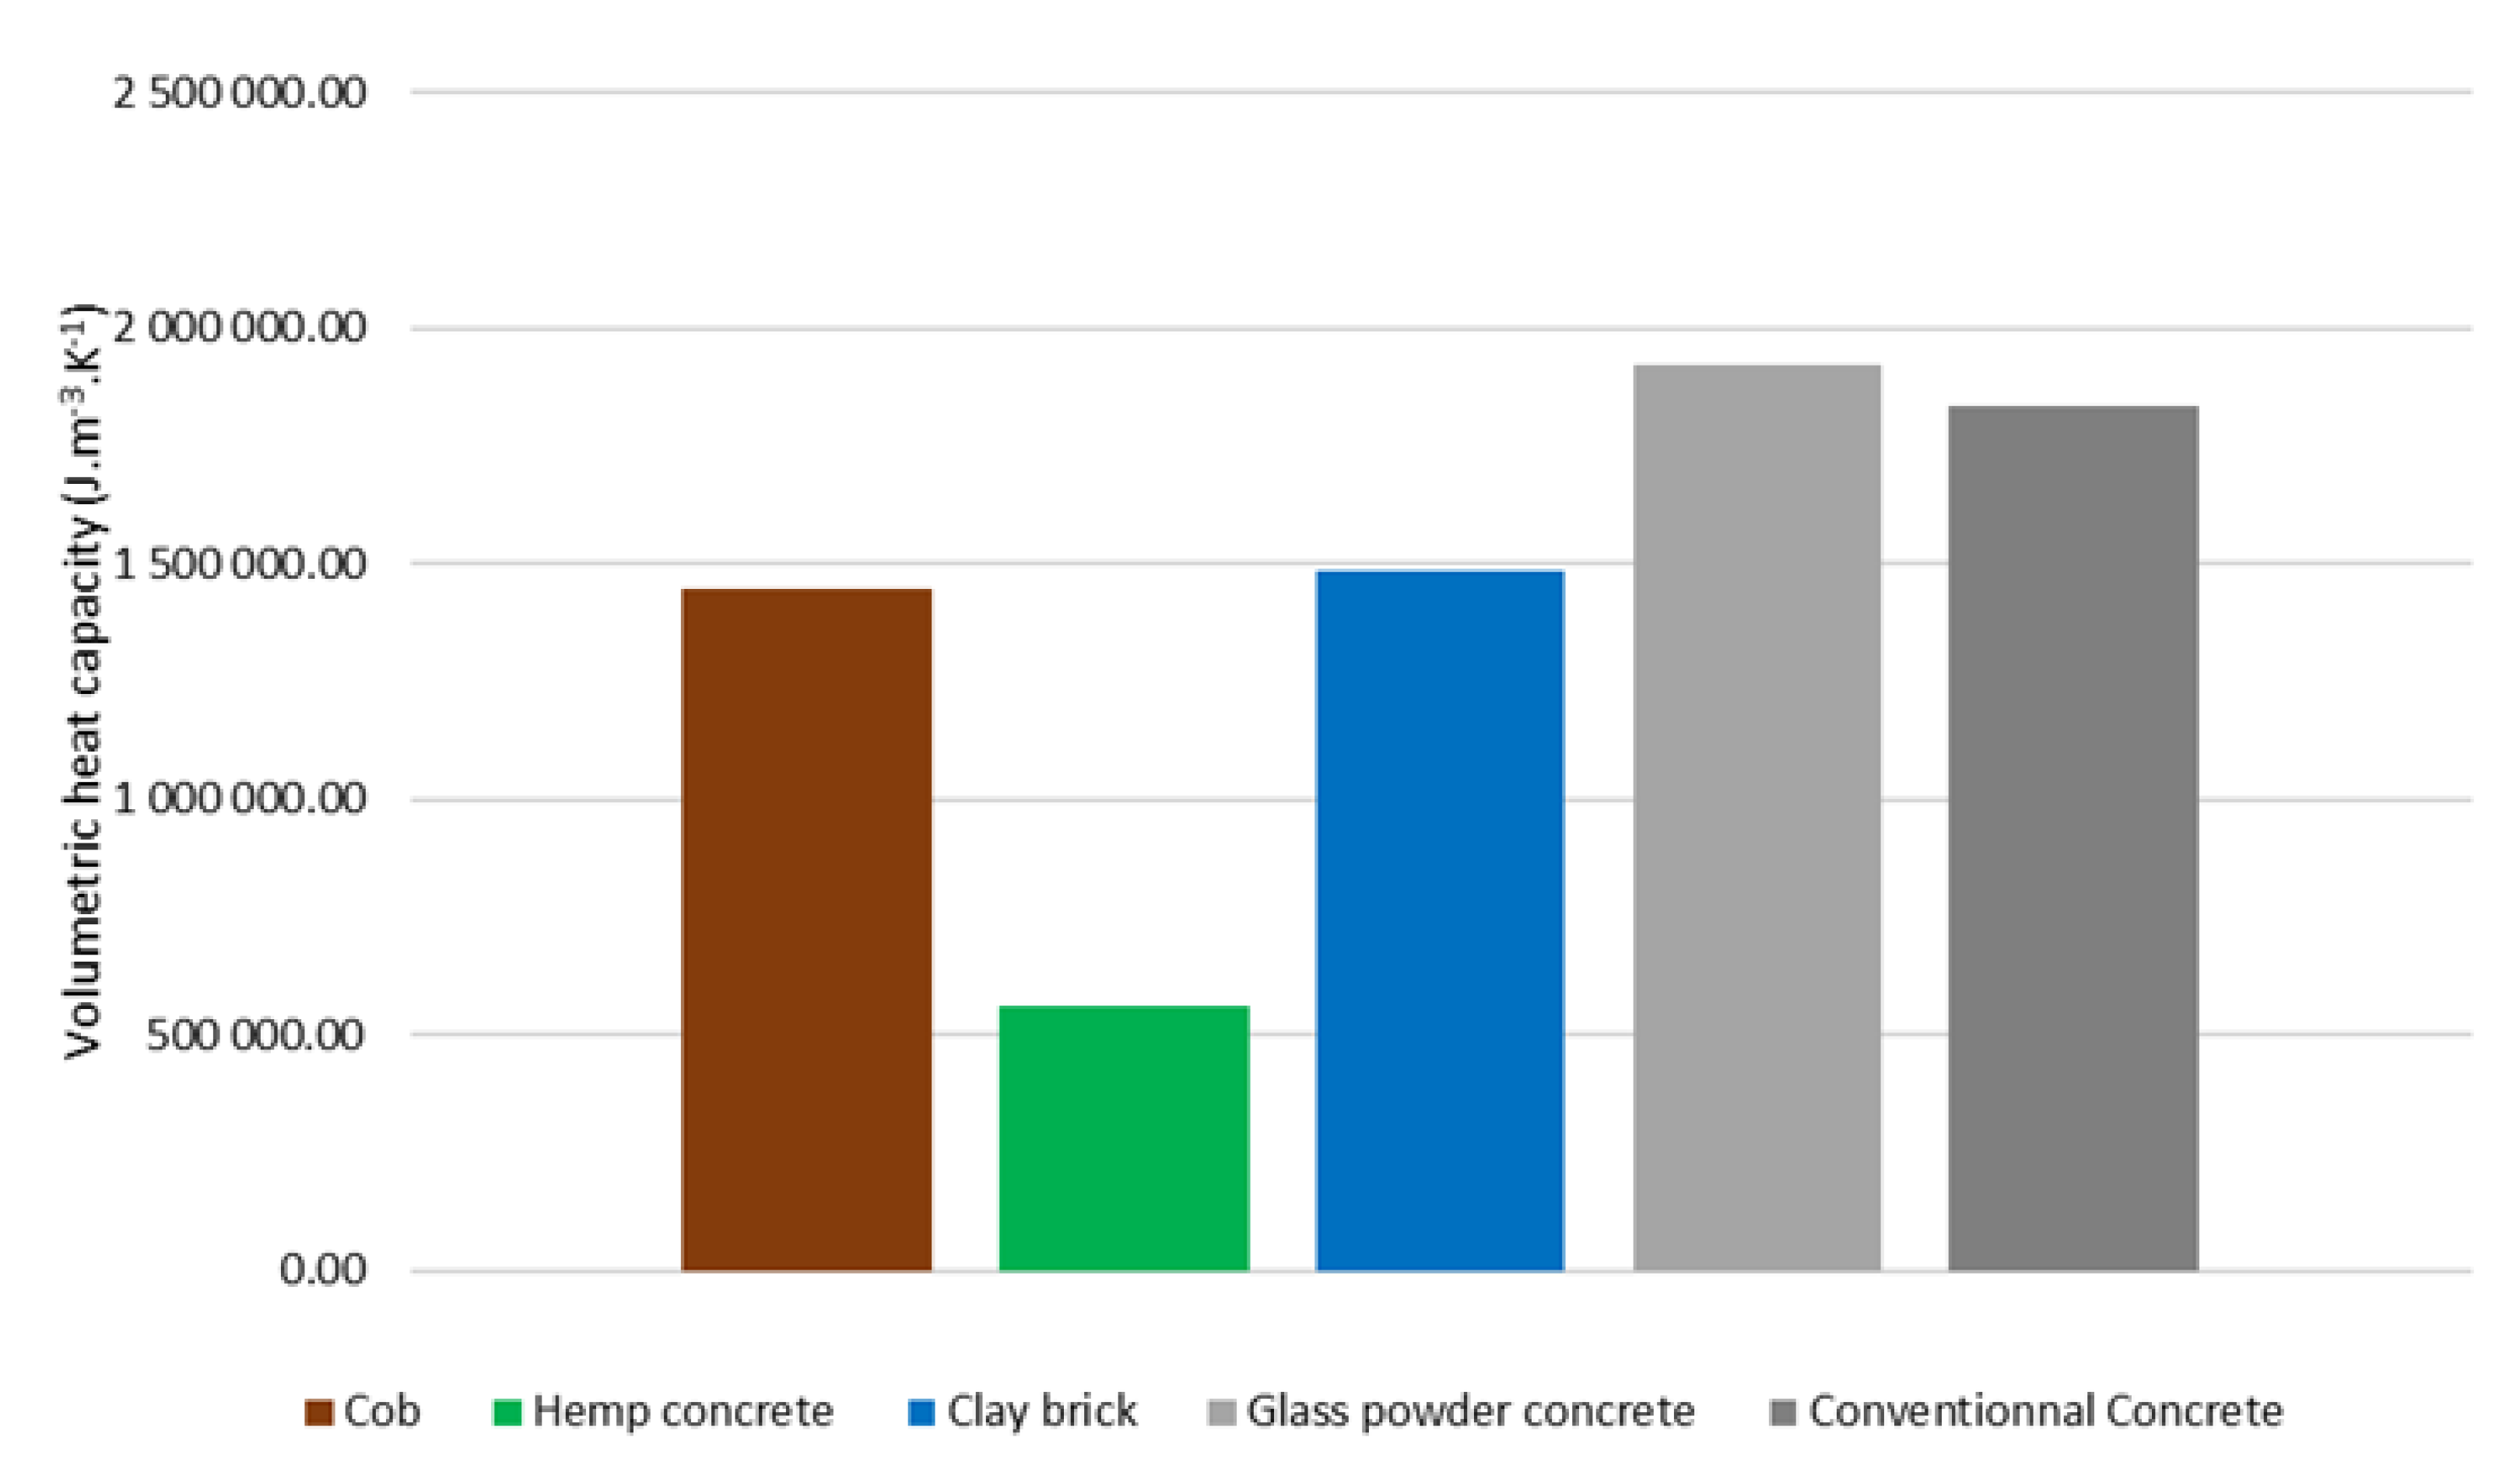
3.1.3. Specific Heat Capacity

The specific heat capacity of cob was measured to quantify its heat storage capacity. It is an essential parameter, as well as the thermal conductivity, to evaluate the decrement factor and the time lag of a wall. Figure 8 presents the evolution of the specific heat capacity as a function of the temperature. The measurement range extended from −10 to 45 °C. Nevertheless, the range exploited is from 0 to 35 °C (Figure 9). This is due to the very strong thermal inertia inside the device. Indeed, this thermal inertia leads to a delay in the transmission of heat, shortening the exploitable range of the data (0 to 35 °C). The specific heat capacity measured for cob is between 800 and 900 J·kg−1·K−1. This value is in accordance with the values found in the literature for raw earth materials (between 800 and 950 J·kg−1·K−1 [55,56]). The cob specific heat capacity at 23 °C was compared to the values of hemp concrete [57], glass powder concrete, conventional concrete, and clay brick. In Figure 10 we can observe that the specific heat of cob is 24% lower than that of hemp concrete, 4% higher than glass powder concrete, and 14% higher than clay brick. Besides, the gap between conventional concrete and cob is significantly lower. The trend remains the same for the volumetric heat capacity (Figure 11) with the exception of hemp concrete, which has seen its value fall significantly due to its low density.
To provide hygrothermal models, it is necessary to represent the evolution of the specific heat capacity as a function of temperature in the form of a polynomial of variable degree. Hence, its evolution as a function of temperature (T) is modeled by the linear function CP(T) = aT + b. The coefficients are adjusted by minimizing the difference with the measured values. The fitted coefficients a, b of the linear function are shown in Figure 10 with a residual close to 1 (0.9819).

3.1.4. Sorption Isotherms

In order to show the advantage of incorporating straw in raw earth, we have measured the adsorption and desorption isotherms at 23 °C on raw earth (RE), straw (S), and raw earth/straw composite (RES). The obtained results are presented in Figure 12.
As can be observed in Figure 12a, the evolution of water content as a function of the relative humidity is showed. It appears that the water content (w) is less significant in the raw earth specimens (RE) compared to the raw earth/straw composite (RES). An increase of about 18% in the maximum water content was noticed in the saturation region after the incorporation of straw in raw earth. This is due to the adsorption capacity of the straw plant (25%), which is one of highest (Figure 12b). By comparing these results with those of other materials (Figure 13a), it is noticed that the glass power and reference concrete have the highest values of water content, that reach 117 and 93 kg·m−3, respectively. Hemp concrete and RES have similar values (between 60 and 80 kg·m−3). In order to better analyze the hygroscopic behavior of the materials, moisture content is plotted in terms of mass ratio (Figure 13b). The maximum mass ratio of the RES and hemp concrete are compared. A higher value for hemp concrete compared to our formulation of raw earth with straw is highlighted. Actually, hemp concrete’s value can reach 12–16% depending on the formulation. Concerning glass powder concrete and conventional concrete, the values of the maximum mass ratio are 4 and 5%, respectively. These values are almost equal to our formulation’s one. Thus, it appears that the hysteresis phenomenon is very significant for comparative materials (Figure 13). For clay brick, the maximum water content reaches a very low value of 0.1%. Moisture storage capacity (Cm) is defined as the slope of isotherms sorption curves. It is expressed by:
C m = w RH  
where w (kg·m−3) is the water content and RH is the relative humidity (%).
The incorporation of plant fibers within raw earth has increased the moisture storage capacity of the RES samples (Figure 14). This value was compared with those of hemp concrete and concrete. Moisture storage capacity of RES specimens is the highest of materials being studied, reaching a value of 203 kg·m−3 at 78% of RH against 151, 117, and 108 kg·m−3 for hemp concrete, glass concrete, and conventional concrete, respectively.
Indeed, the increase observed in the water vapor adsorption capacity of the composite material can improve its hydric properties (hydric buffering capacity and water vapor permeability) as well as its thermal properties (thermal conductivity and specific heat).

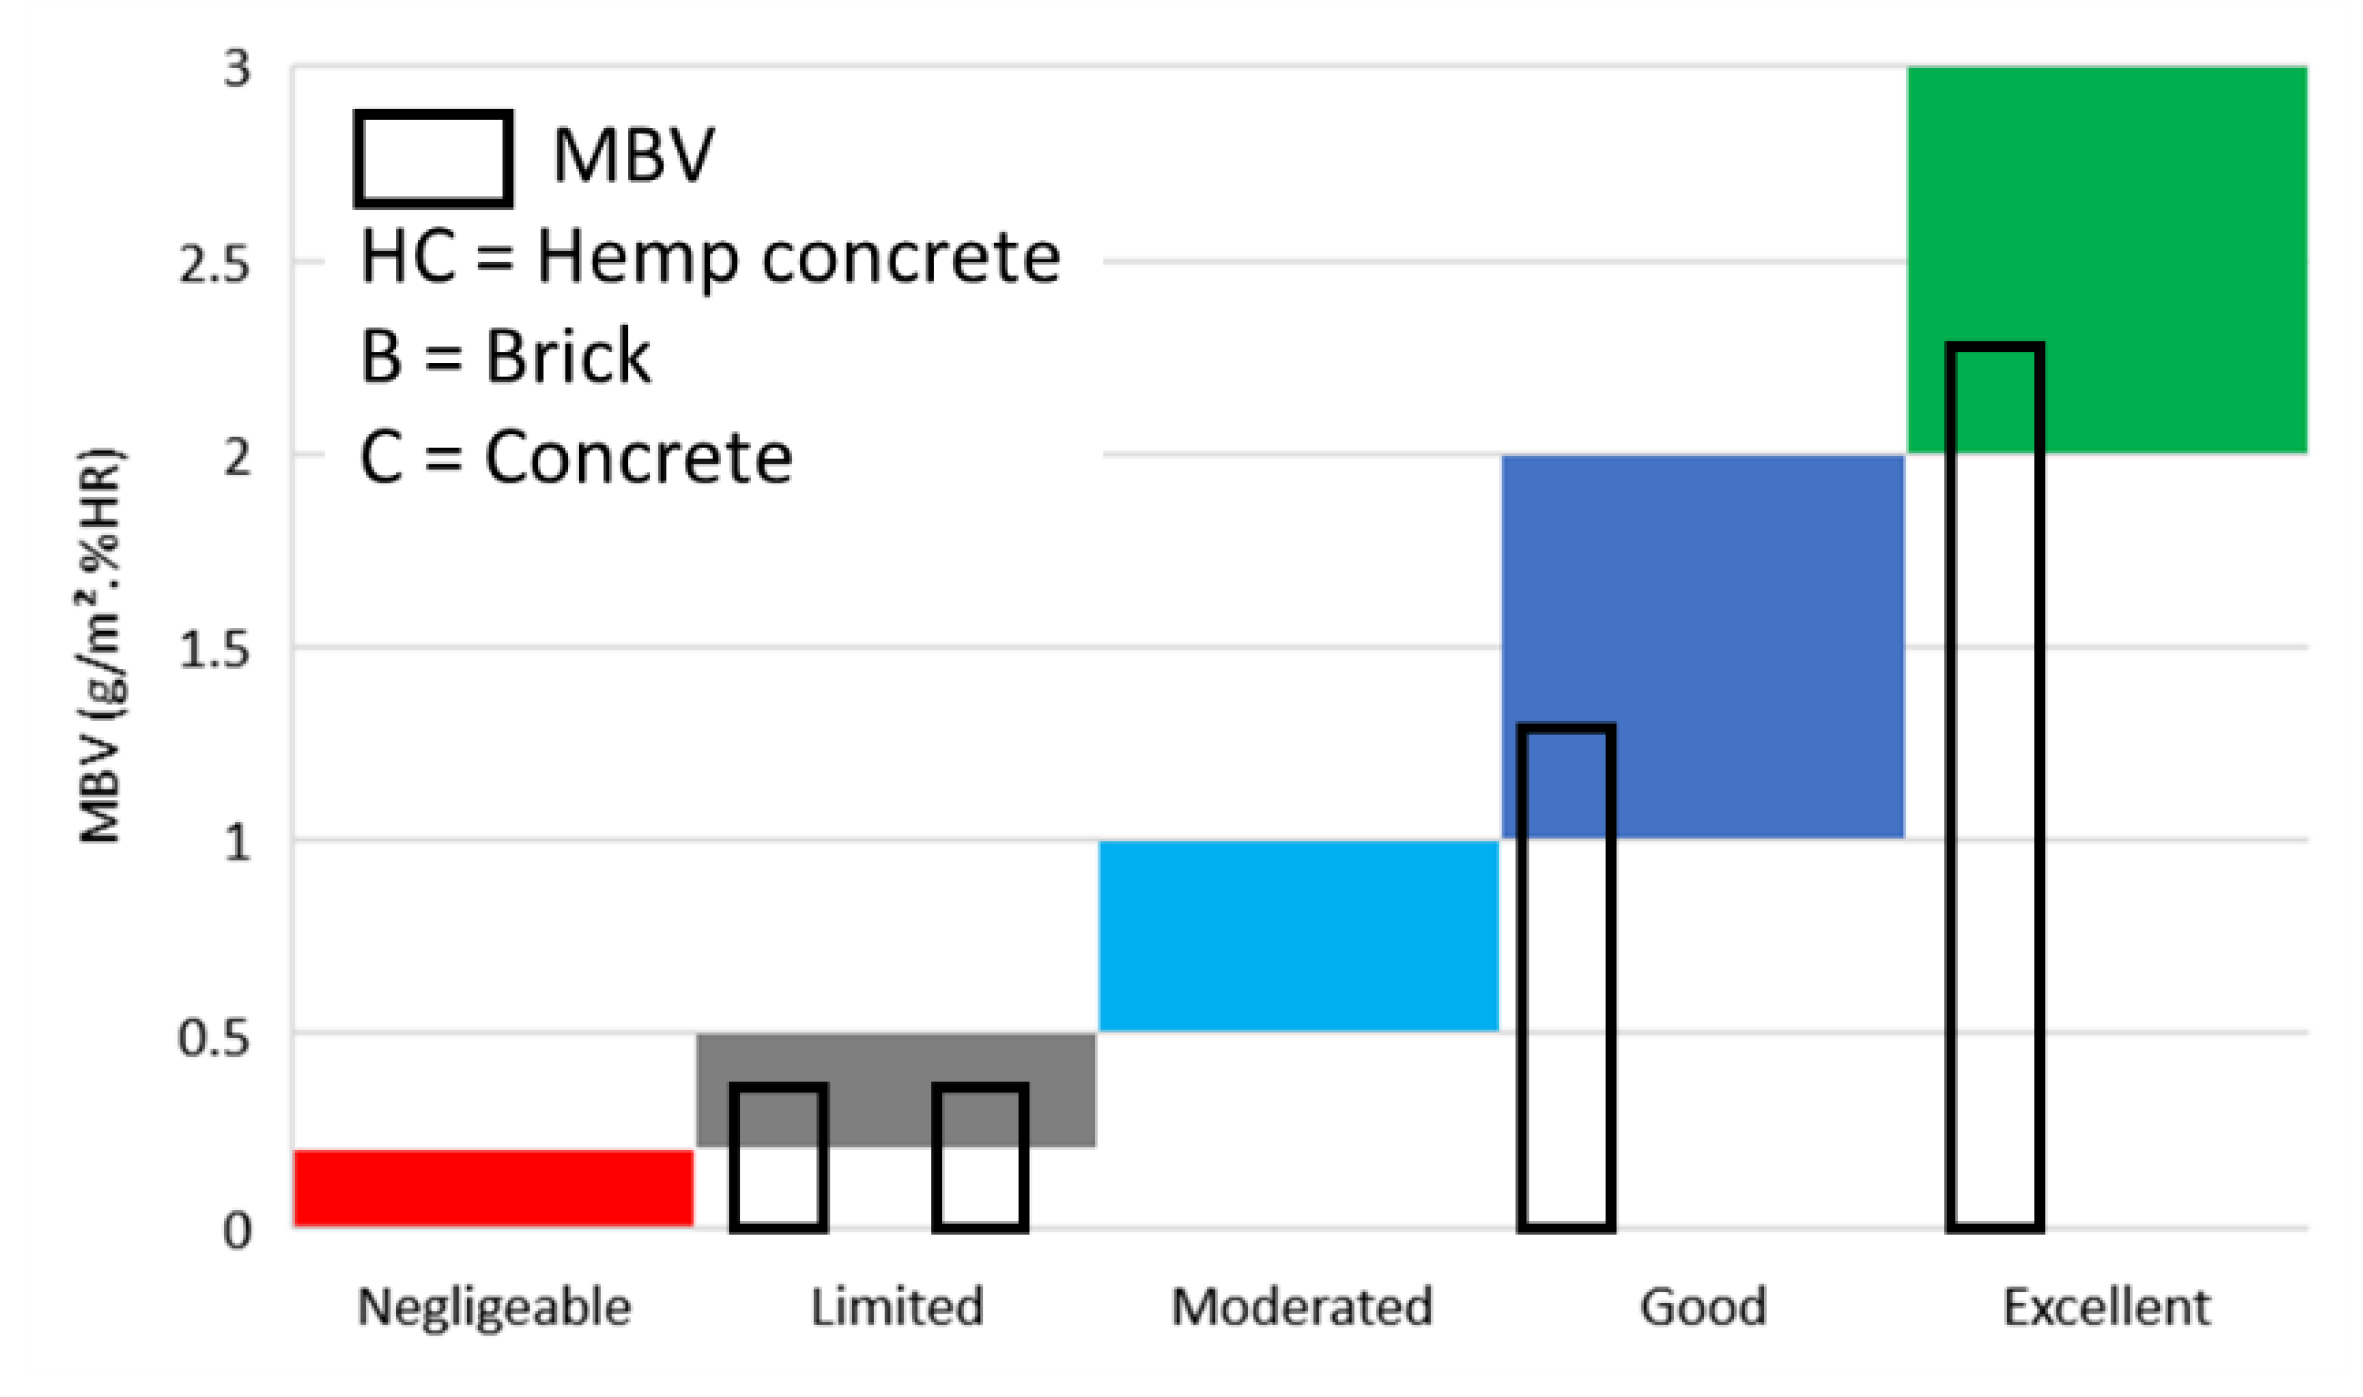
3.1.5. Moisture Buffer Value (MBV)

The MBV is used to estimate the dynamic hygrothermal behavior of the material when it is exposed to an indoor environment. It indicates the average amount of water that is exchanged by adsorption or desorption when the surfaces of the material are subjected to changes in the relative humidity for a given time. The tests were performed on four specimens and the mass change was measured for a week to ensure repeatability of the experiment and calculation of the associated uncertainties.
At the end of the tests, the value of MBV measured for the cob formulation was 1.4 g/(m2·%RH) with associated uncertainty of 0.1. This value is in accordance with the values referenced in the literature. In reference [58], the MBV of raw earth covered values between 1.13 and 3.73 g/(m2·%RH). This wide range is explained by the type of soil and some additions such as lime, cement, or geopolymers (NaOH). Moreover, according to the Nordtest project classification, raw earth with straw addition can be considered a good moisture regulator. MBV is compared with values found for other materials (Figure 15). Hemp concrete has an MBV of 2.27 g/(m2·%RH) which makes it an excellent moisture regulator [51]. Structural materials like concrete or brick have a lower MBV of 0.37 and 0.4 g/(m2·%RH), respectively [59]. Thus, they are considered a limited (or a weak) moisture regulator.

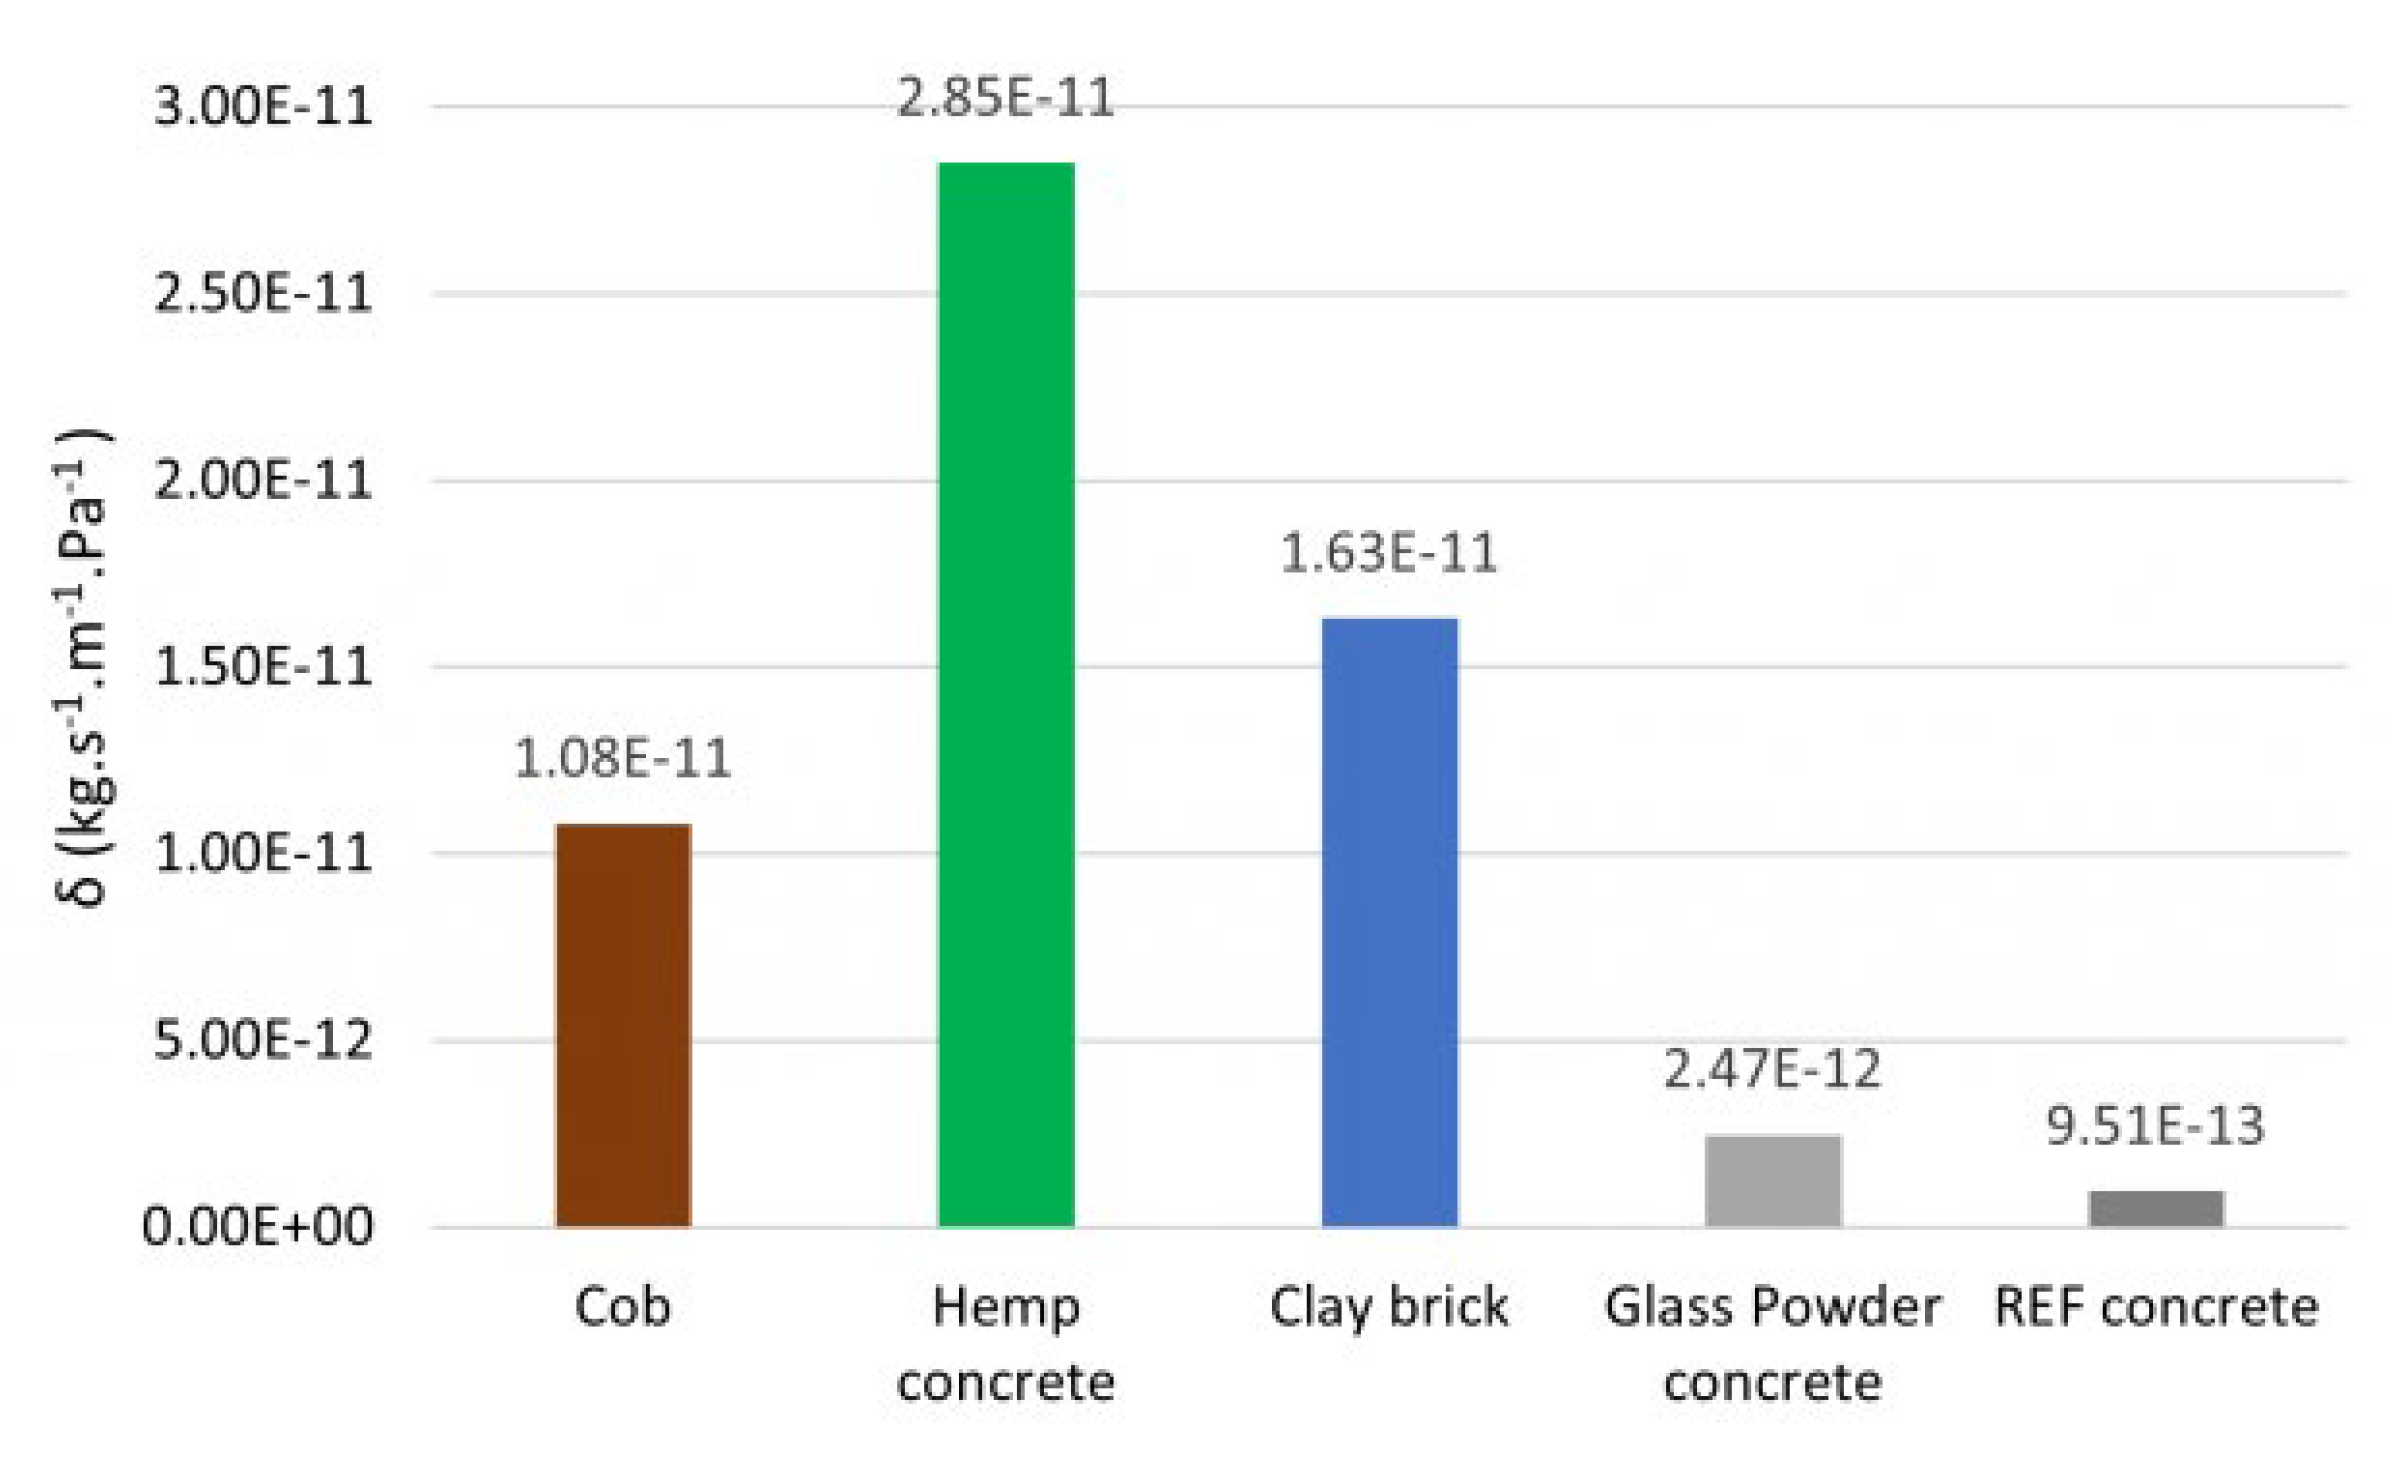
3.1.6. Water Vapor Permeability

Finally, the water vapor permeability was measured on 3 specimens. The average value obtained is δ = 1.08 × 10⁻¹¹ ± 6.5 × 10⁻¹³ kg·s−1·m−1·Pa1. This result is in accordance with values found in the literature. For adobe, the water vapor permeability has a value ranging from 1.0 to 2.7 × 10⁻¹¹ kg·s−1·m−1·Pa−1 [56]. Besides, for adobe with 3% of straw, water vapor permeability was worth 3.8 ± 0.3 × 10⁻¹¹ kg·s−1·m−1·Pa−1 [60]. Our cob formulation value is of the same order of magnitude as hemp concrete (Figure 16). Indeed, the latter is equal to 2.85 × 10⁻¹¹ kg·s−1·m−1·Pa1 [51]. Clay brick water vapor permeability has a value very close to cob, with δ = 1.63 × 10⁻¹¹ kg·s−1·m−1·Pa−1. However, the average value for glass powder concrete is around 2.47 × 10⁻¹² kg·s−1·m−1·Pa−1, which is not of the same order of magnitude. This gap is more important for the concrete. The latter has a water vapor permeability of 9.51 × 10⁻¹³ kg·m−1·s·−1·Pa1 [61]. We can deduce that necessary vapor flux through cob specimens is more important than for concrete specimens. This may be due to a lower porosity or tortuosity of our studied materials.
In addition to water vapor permeability, the water vapour resistance factor ( μ ), which is usually used in the calculation of interstitial condensation (EN ISO 13788 [62]), has been calculated (Equation (5)) at ambient temperature and atmospheric pressure ( p a ).
μ = δ a δ
where δ a = 2 × 10 7 T 0.81   p a is the water vapor diffusion coefficient in the air.
The water vapor resistance factor of the studied materials is presented in Table 1. The tendency is reversed for μ compared to δ . This can be explained by the inversely proportional relationship that links them. Indeed, materials with low value of δ possess a high value μ . Therefore, GPC and REF have the highest water vapor resistance factor due to their low water vapor permeability. The water vapor resistance factor of cob and clay brick are similar to that of bricks and stones. Hemp concrete, which has the lowest μ , due to the high water vapor diffusion, is comparable to materials like platers [63].

3.2. Numerical Simulation

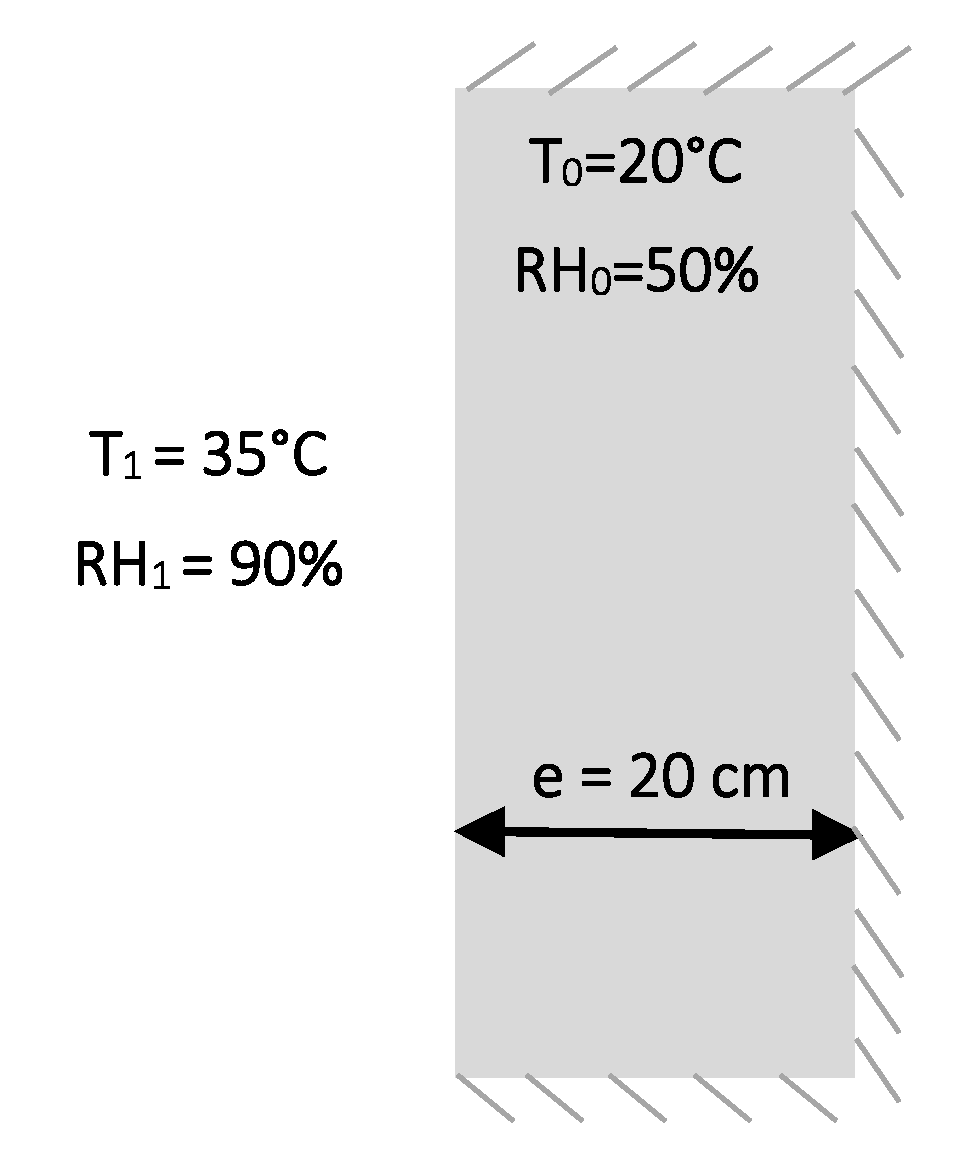
3.2.1. Mathematical Model

In order to analyze the hygrothermal behavior of the Cob and compare it with other materials such hemp concrete and glass powder concrete, a numerical simulation was conducted. The used hygrothermal used is based on the model of Philip and de Vries et al. [19] and the work of Ferroukhi et al. [20] and Remki et al. [21], as mentioned in the introduction. Because of the continuity problem for the water content, we have opted for vapor pressure ( p v ) and temperature as the driving forces for transport. For more details about the model, the reader is referred to [64]. The equations are developed under the following assumptions:
  • Macroscopically homogeneous, isotropic and rigid solid phase;
  • Gas phase at constant and uniform pressure;
  • Thermodynamic equilibrium between all phases present;
  • No chemical reaction between phases;
  • No heat transfer by radiation;
  • No energy dissipation during flow;
  • Wetting heat neglected.
The resulting equations for vapor pressure and temperature are presented as follows:
ρ s C m P v , s a t p v t = d i v k T T k m p v
ρ s C p * T t = d i v λ * T γ p v
p v , s a t = 610.5 · exp 17.269 · T 4717.03 / T 35.85 is the saturation pressure;
k T = k l R ρ l M ln p v P v , s a t + T P v , s a t p v , s a t T (kg·m−1·s−1·K−1) is the liquid water conductivity due to a thermal gradient. With k l the hydraulic liquid conductivity, R ideal gas constant, M the molar mass of water;
k m = δ v + k l R T ρ l M p v (kg·m−1·s−1·Pa−1) represents the total moisture diffusivity coefficient with k v the water vapour permeability;
C p * = C p , s + u · C p , l (J·kg−1·K−1) is the total heat capacity, where C p , s   and C p , l are respectively the dry and liquid specific heat capacity;
λ * = λ + h l k T (W·m−1·K−1) is the effective thermal conductivity with λ the dry thermal conductivity, h l = C p , l T T 0   (J·kg−1) the liquid enthalpy;
Finally, γ = δ v L v + h l k m (W·m−1·Pa−1) where L v   (J·kg−1) is the latent heat of vaporization of liquid water.
The symbols and their units are gathered in the Nomenclature.

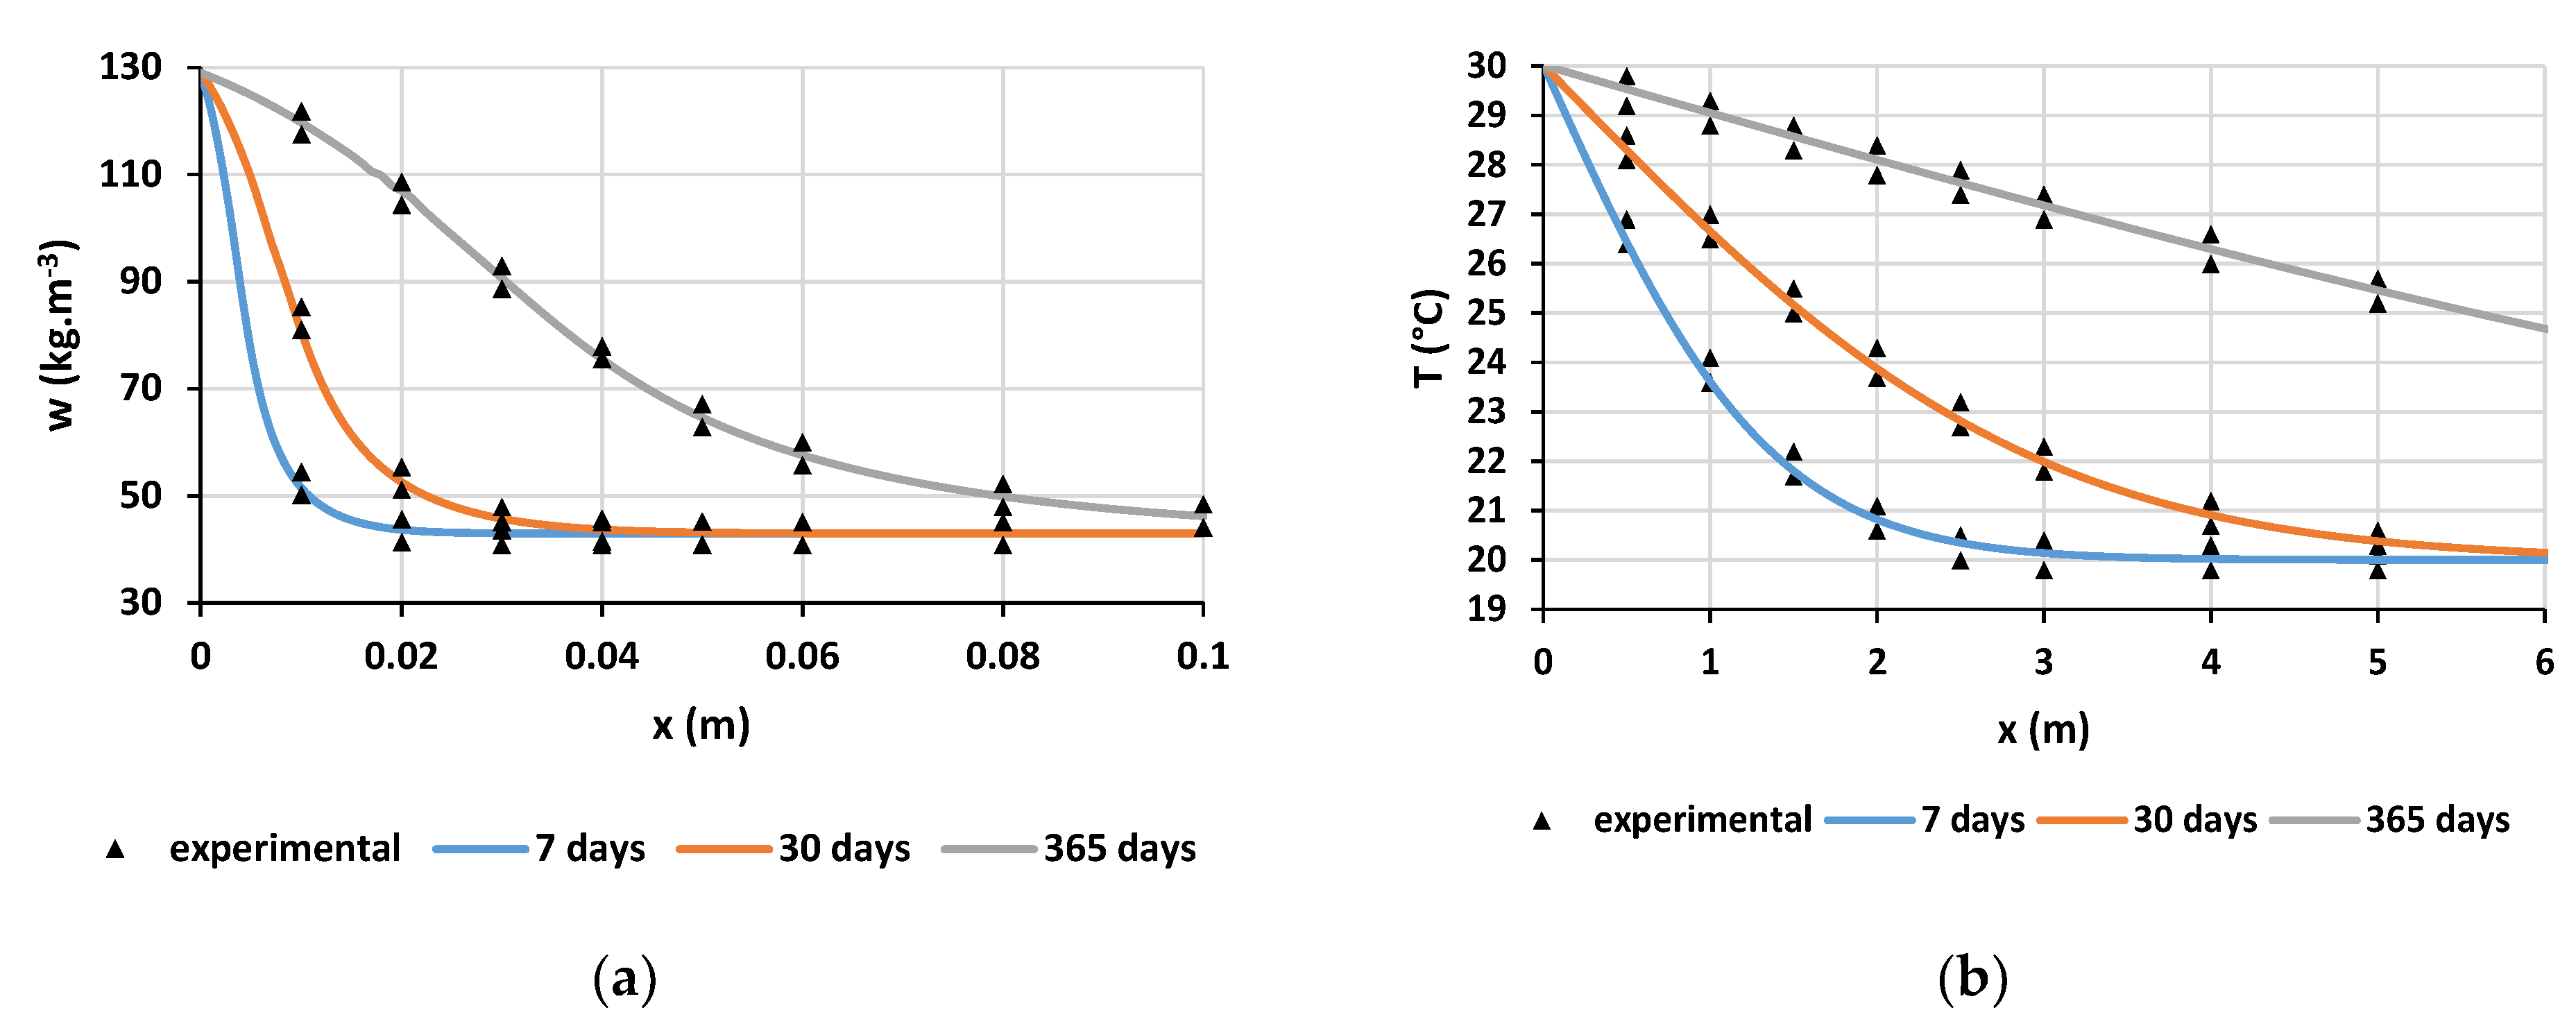
3.2.2. Model Validation
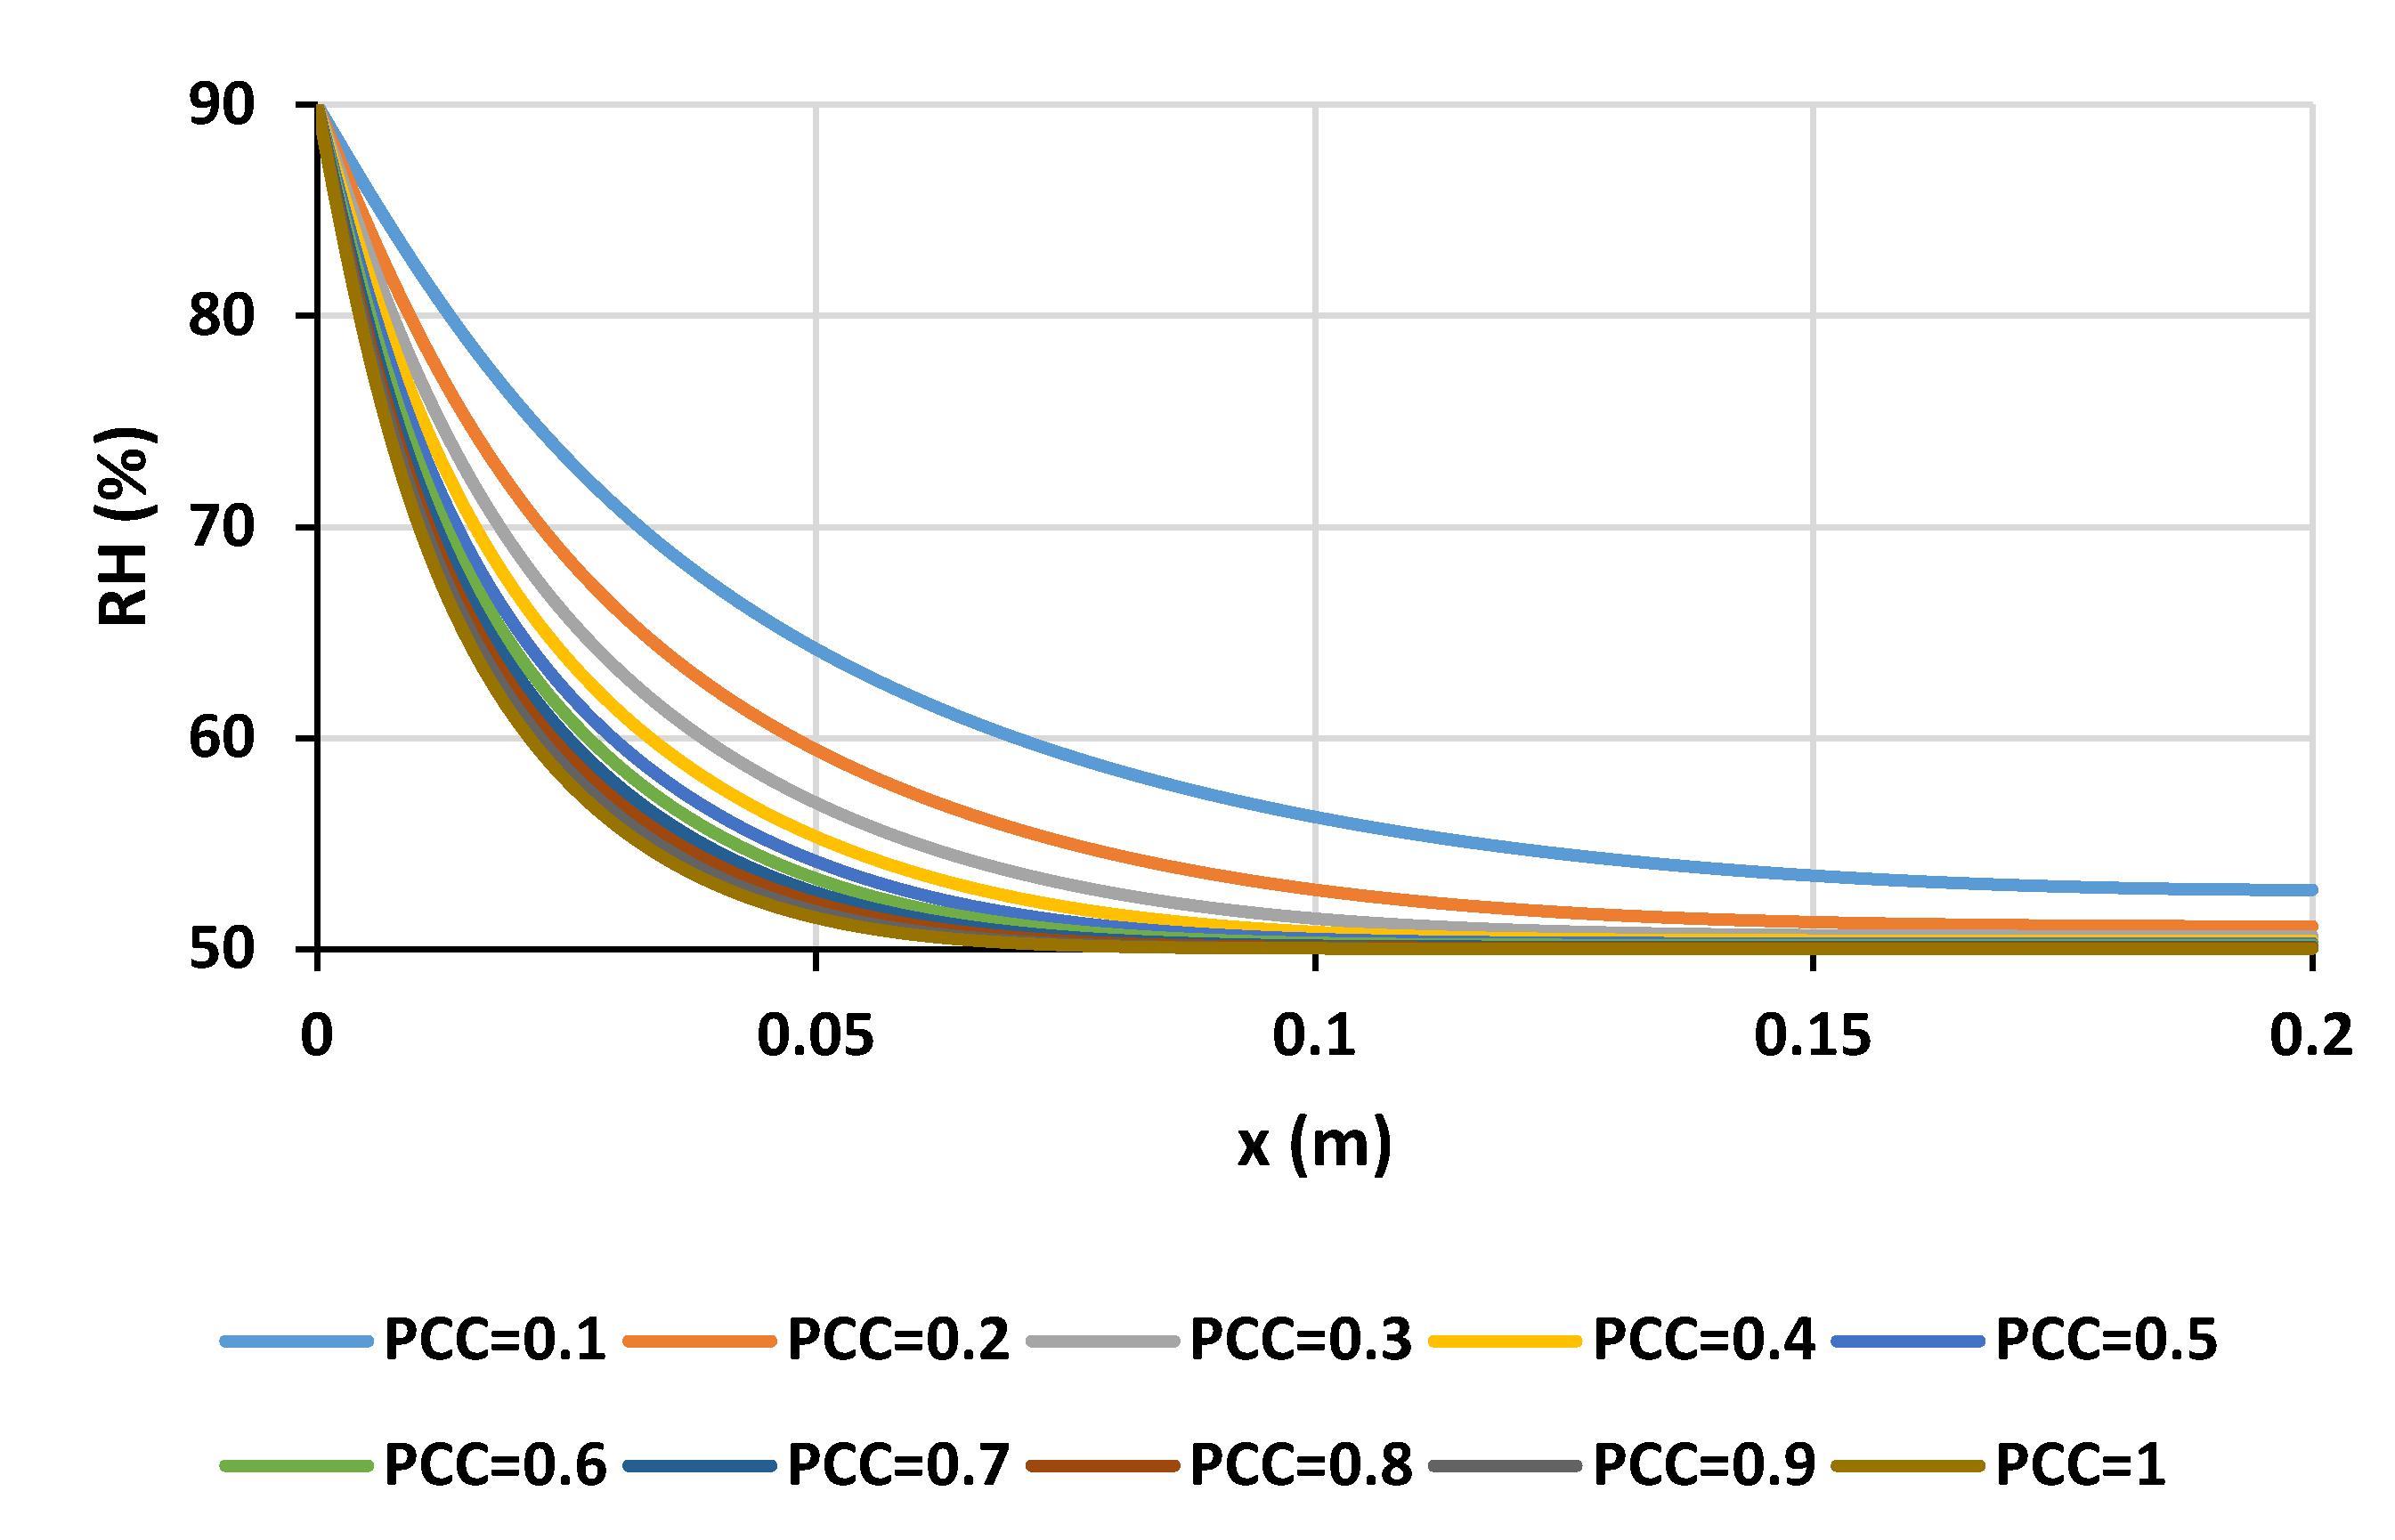
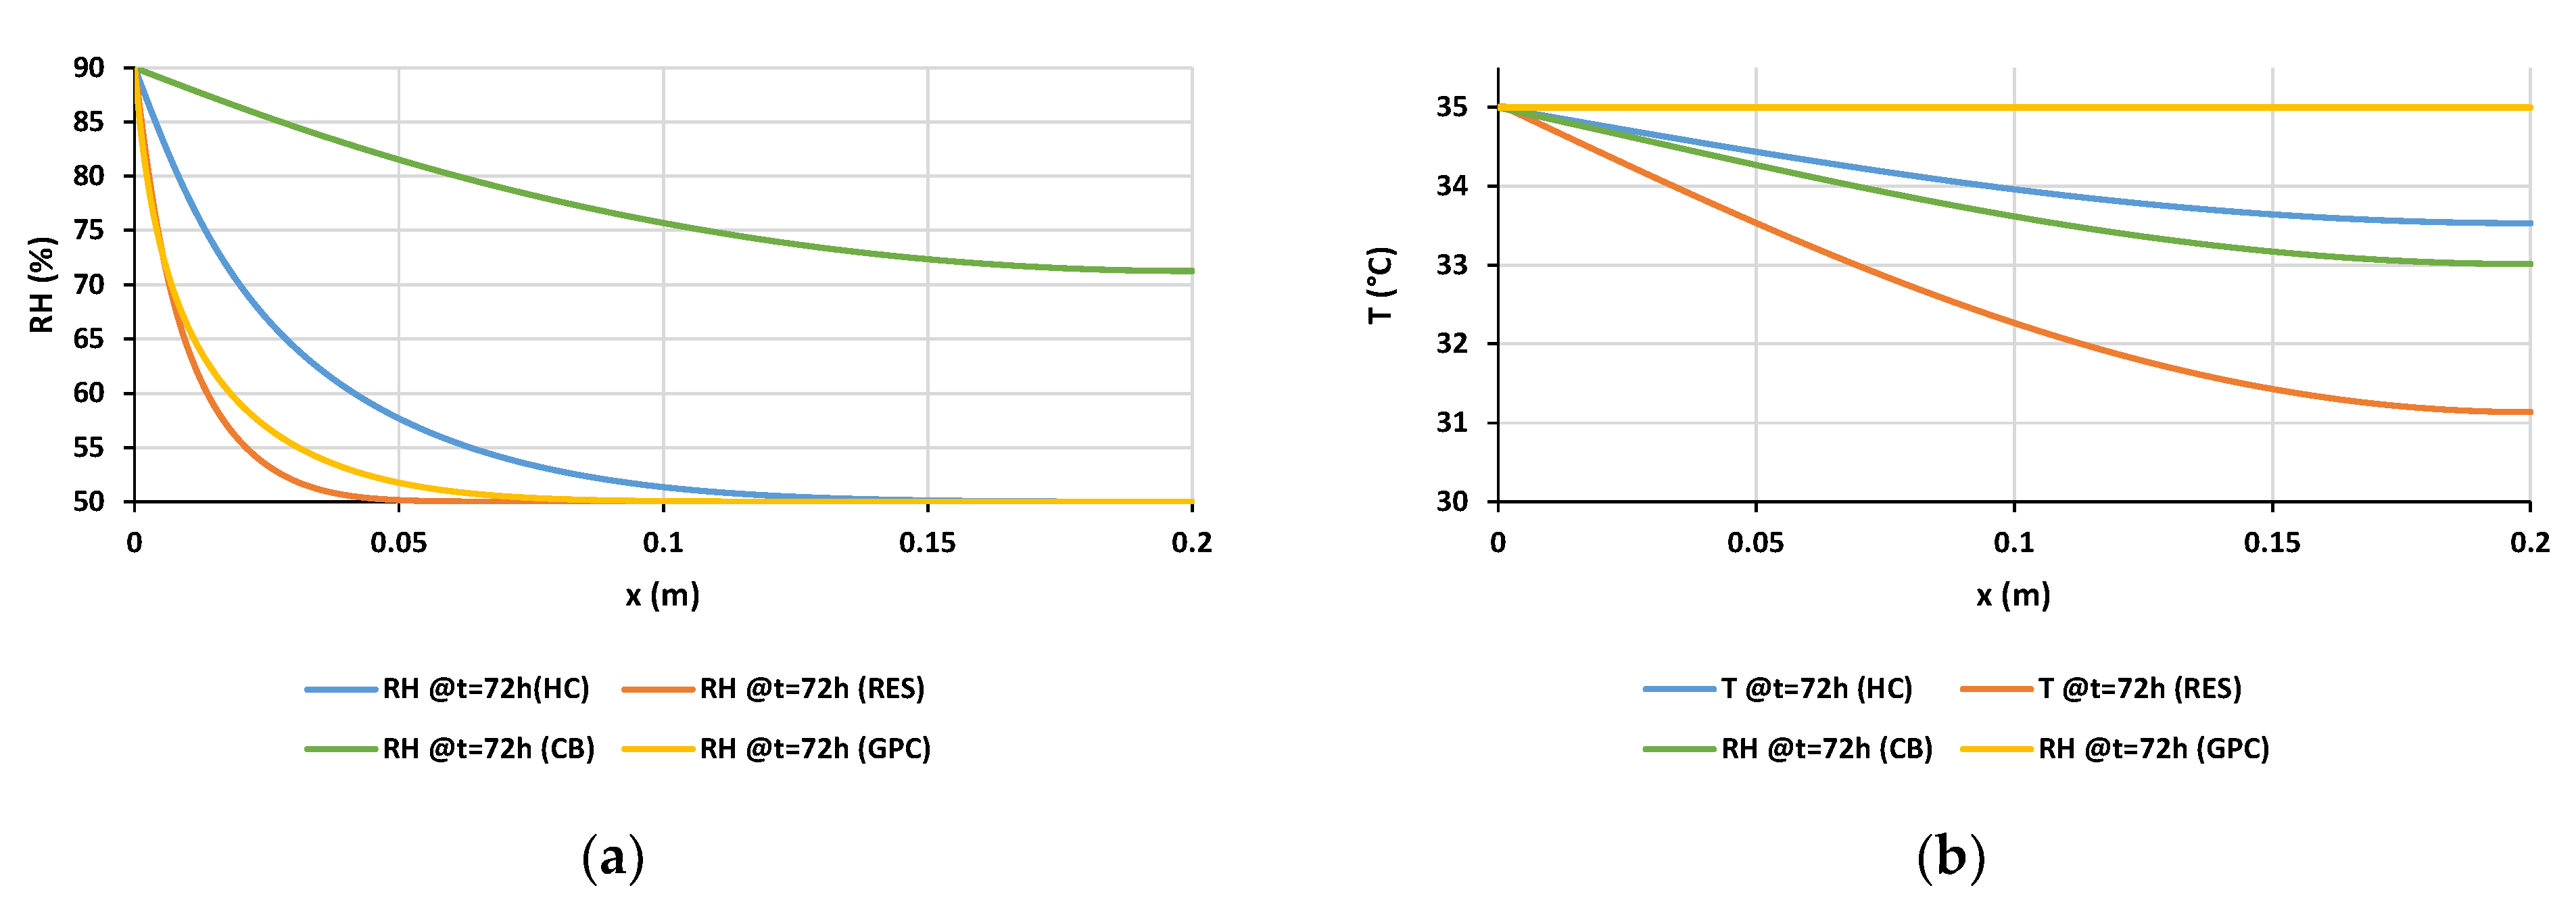
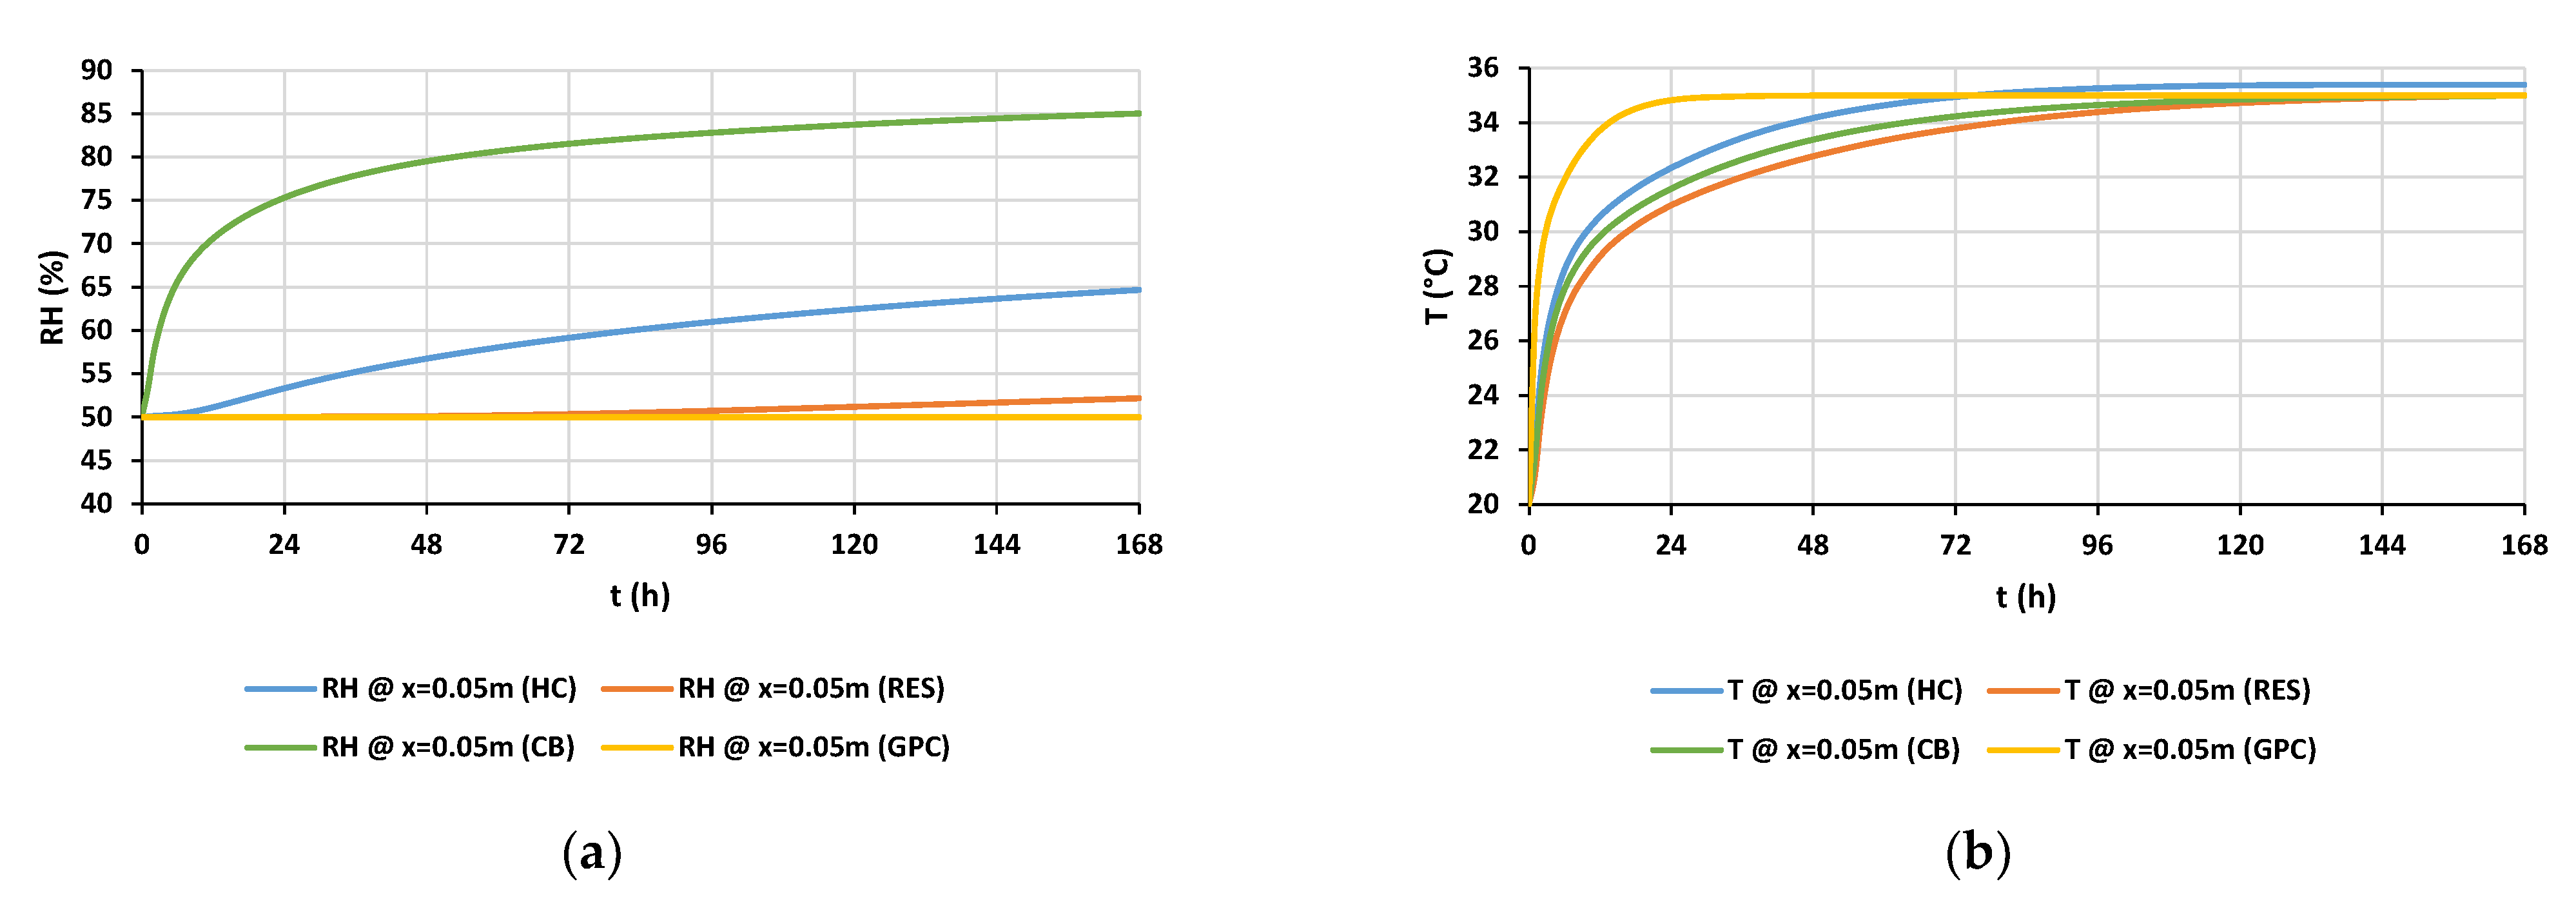
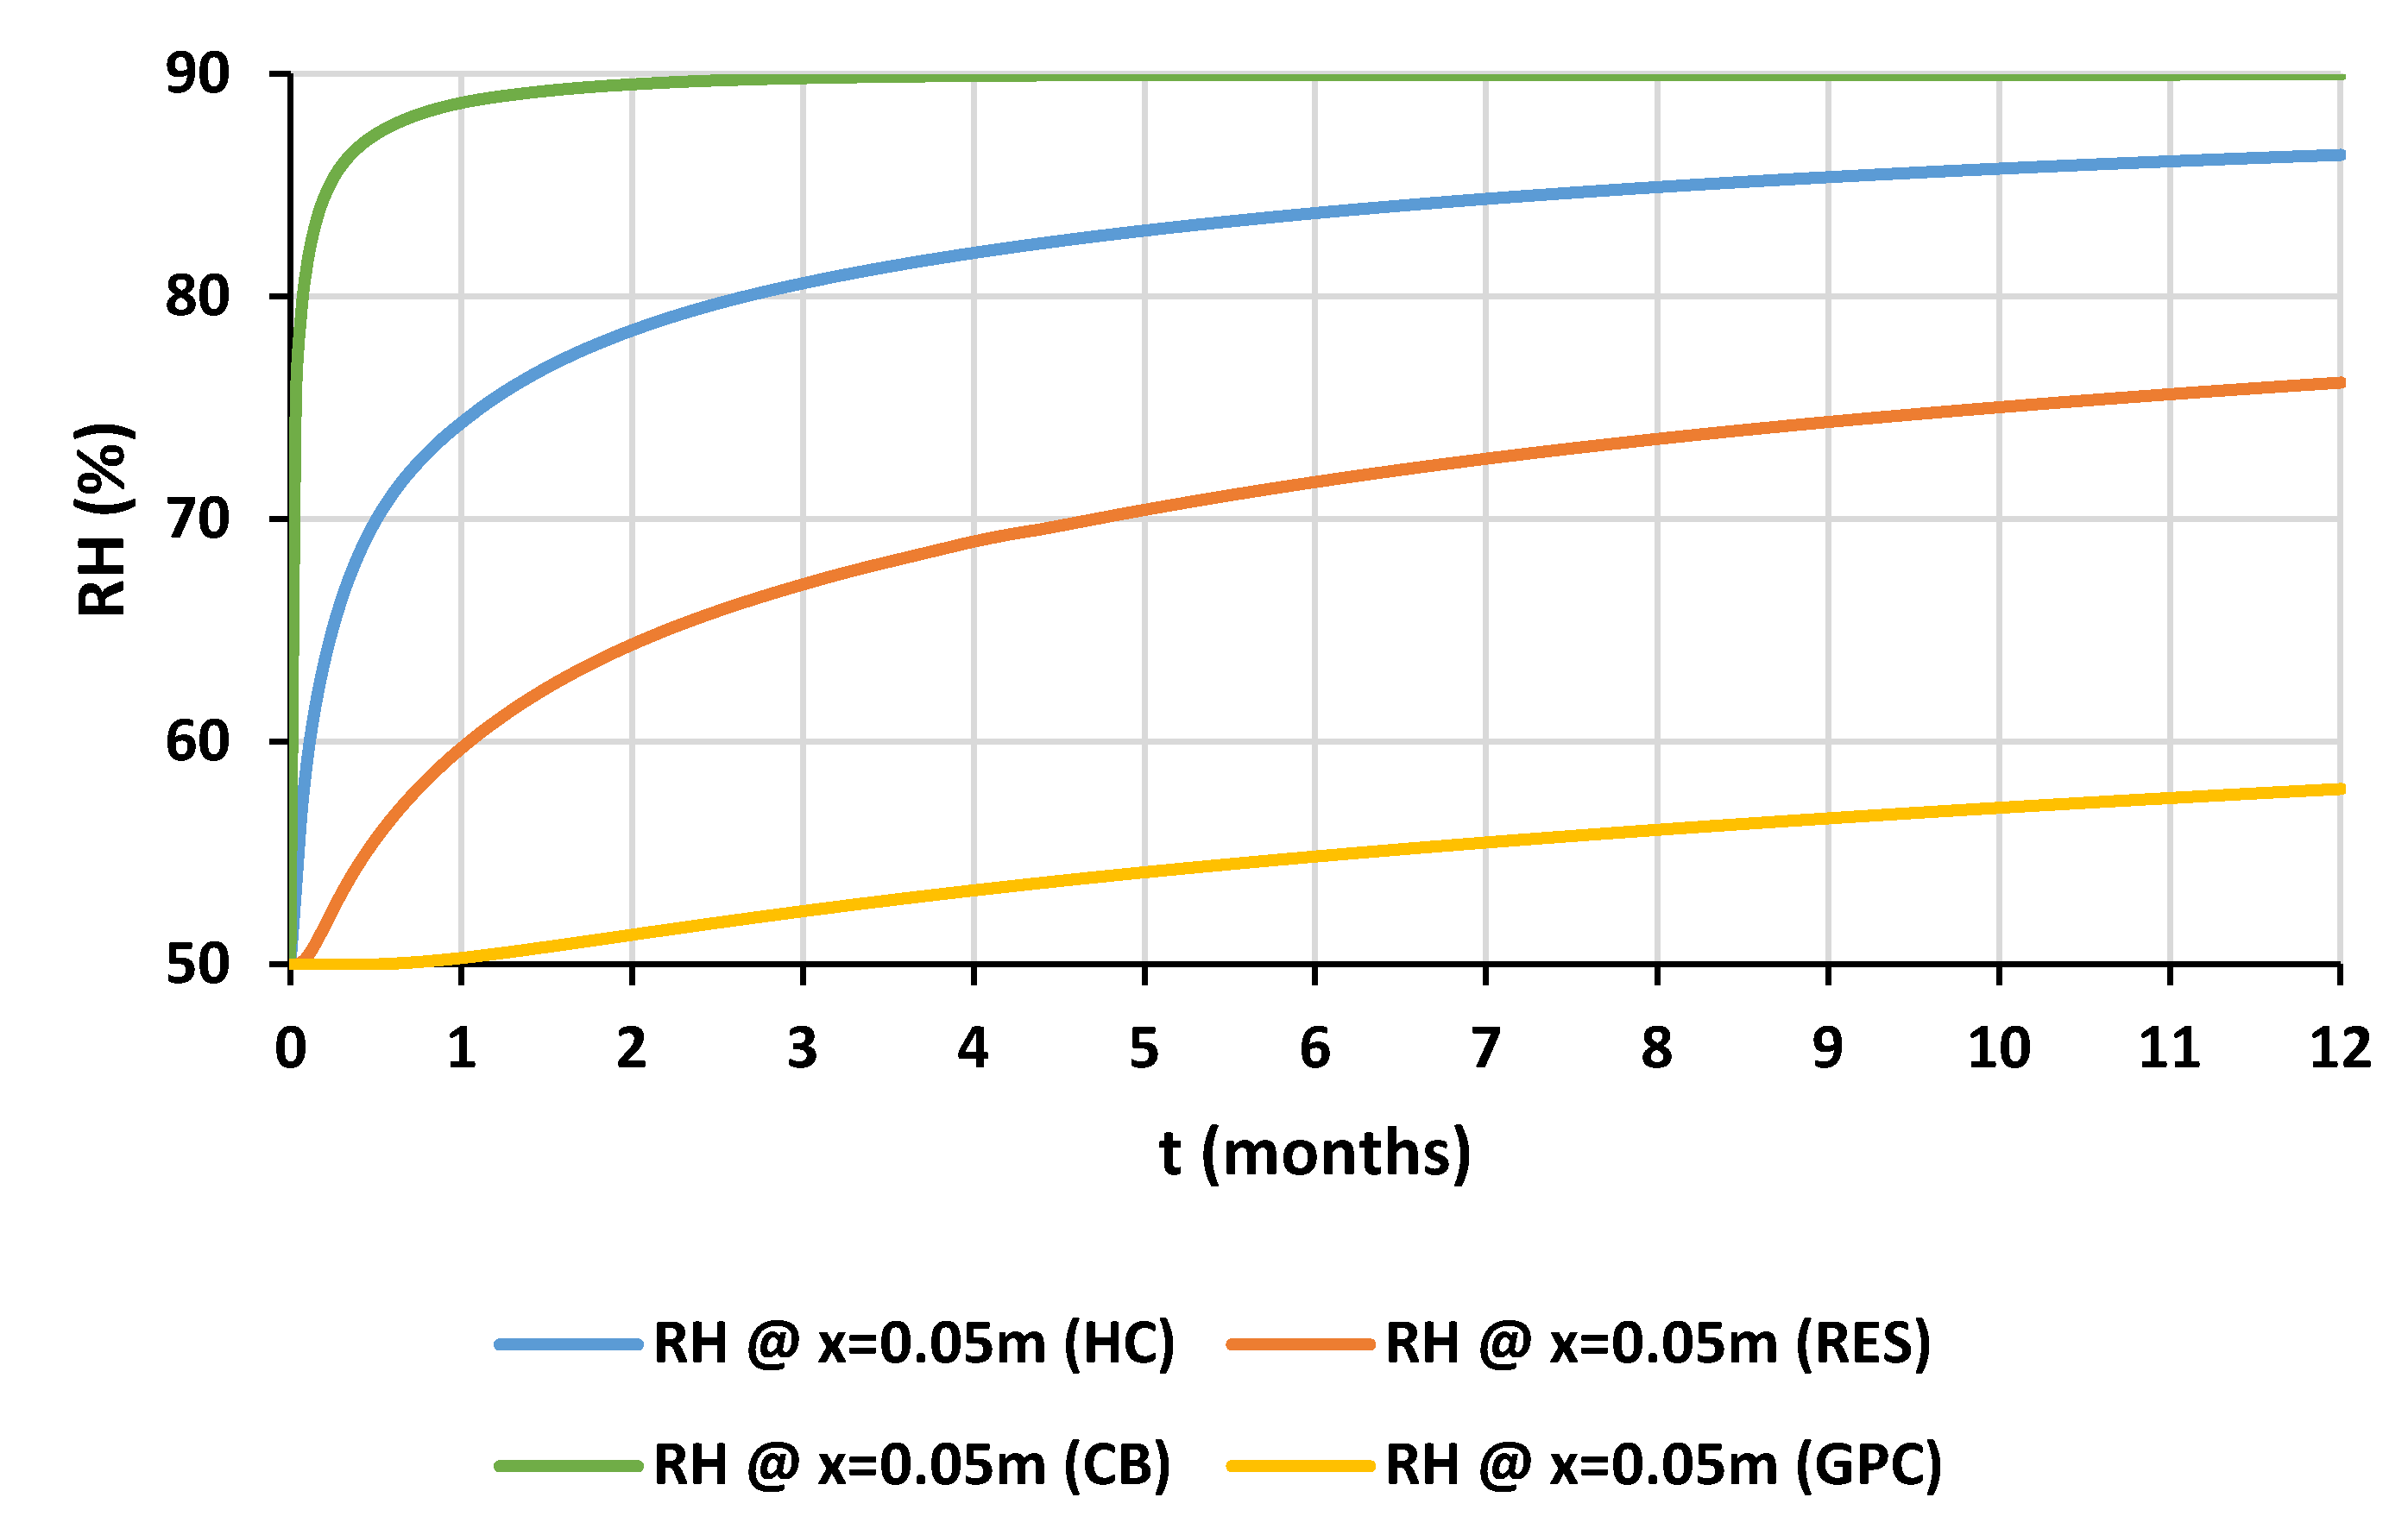
The reference test defined in the EN 15026 standard [65] for the validation of a software calculating moisture transfer by numerical simulation is used to validate the model. The model geometry consists of a single segment for the building component. Its size is large enough to represent a semi-infinite region for the time scale of the simulation. A relative humidity of 50% and a temperature of 20 °C are set as initial conditions, while on the left boundary the relative humidity is set to 95% and the temperature is 30 °C. The time study is performed over a year, with temperature and relative humidity distributions checked at 7, 30, and 365 days.
The temperature and moisture content profile (w) of the numerical simulation and experiments at 7, 40, and 365 days are presented in Figure 17. The results showed a good accordance between numerical simulation and experiments.

3.2.3. Results

The numerical simulations are performed for three different types of walls with 20 cm of thickness made of hemp concrete, RES, and clay brick. The main objective is to compare the hydrothermal behavior of the above-mentioned materials with that of cob. The hygrothermal properties of the materials, which are the input parameters of the model, are presented in Table 2. The water content and the moisture storage capacity of each material are obtained from the sorption isotherms presented in the characterization section.
Initially, the material is in equilibrium with a constant external environment equal to T = 20 °C and RH = 50%. At the time t = 0, the new external climatic conditions are T = 35 °C and RH = 90% at the left side (x = 0 cm) and the other side is assumed to be adiabatic and impermeable (Figure 18 ).
Due to the difficulty of measuring the hydraulic liquid conductivity, the phase change criterion (PCC) method has been used [66]. This parameter represents the ratio between the vapor flux and the total flux and is expressed as follows:
PCC = δ v · P v k l R ρ l M T + δ v · P v , s a t
From this expression, a relation between the PCC and the hydraulic liquid conductivity is established:
k l = 1 PCC 1 δ v · P v R ρ l M T
Figure 19 shows the influence of the PCC on the RH profile inside RES. It is noticed that for PCC values less than 0.6, the influence of PCC is not very important, and the mass transfer is essentially vapor transfer and liquid transfer is negligible. For cellulosic wall, Wang et al. [66] have found that if RH is inferior to 60%, the PCC can be set at 1. In this study, it has been arbitrarily set at 0.8 in order to consider the liquid diffusivity that vanishes when PCC is equal to 1. The determination of the hydraulic conductivity could be the purpose of another study.
The temperature and RH profiles in the wall for the three materials are presented in Figure 20. Based on the RH profile, clay brick is the most conductive material for humidity, followed by hemp concrete, RES, and GPC at the latter position. This result is due to the value of the water vapor diffusivity, which is relatively higher for hemp concrete, moderate for RES and clay brick, and low for GPC. In addition, the moisture storage capacity of clay brick is very low (around 7 kg·m−3) compared to the higher values for hemp concrete (280 kg·m−3) and RES (950 kg·m−3). This low moisture storage capacity of clay brick combined with the moderate water vapor diffusivity explains the rapid diffusion of moisture in clay brick. The high moisture storage capacity of RES and GPC delays the moisture transfer in the wall.
The tendency is inversed for the temperature profile. In fact, Cob had the best insulation properties of the four materials, followed by clay brick and hemp concrete, then comes GBC. It should be mentioned that despite the very high thermal conductivity of GPC compared to HC, the temperature is only about 1 °C at 0.2 m. The same remark is possible for RES, which has a higher thermal conductivity than HC but presents a lower increase of temperature compared to HC.
In order to better describe the dynamic inside the materials, the evolution of RH and T at 5 cm is presented as a function of time (Figure 21). As can be seen, from the temperature curve, the equilibrium is reached after 24 h, 72 h, and 144 h for GPC, HC, RES, and clay brick, respectively. The response to temperature solicitation is very low for RES and clay brick compared to the two other materials, which is explained by higher thermal inertia.
After 168 h, the RH does not reach equilibrium for any of the three materials. The simulations have been therefore extended to one year in order to have more representative effects (Figure 22). After 3 months, the equilibrium is reached for CB. For HC, the equilibrium is almost reached after 1 year. However, for RES and GPC, the equilibrium is far from being reached, with relative higher value for RES in comparison to GPC.
From the numerical simulation, it appeared that RES provides the wall with a good thermal inertia with acceptable moisture regulation ability.

4. Conclusions

In this work, a full hygrothermal characterization of cob raw earth material with 3% of straw was presented. Raw earth materials are known for their good thermal inertia. Nevertheless, their hygrothermal properties are not widely dealt within the literature. As an application, we wanted to model the hygrothermal behavior of a building envelope made of the studied material and to compare its behavior to other conventional materials (clay brick, glass powder concrete) and biosourced materials (hemp concrete). The aim was to highlight the advantages to use the studied material. This work therefore provides results that will extend the databases and complete knowledge of the intrinsic properties of this kind of geosourced materials. Thermal conductivity, specific heat, sorption isotherms, moisture buffer value (MBV), and water vapor permeability were deduced experimentally. Next, the properties were used in a numerical prediction model as input parameters in order to compare cob with other materials used in building sector.
At first it was highlighted that thermal conductivity of the studied formulation is of 0.180 W·m−1·K−1. This value is slightly higher than that of hemp concrete, which is about 0.1 W·m−1·K−1. Compared to conventional material such as concrete, cob thermal conductivity is eight times lower. Regarding specific heat, a value of 875 J·kg−1·K−1 was determined at 23 °C for cob. This value is lower than hemp concrete, which is equal to 1165 J·kg−1·K−1. Concrete has a value close to that of cob with a specific heat of 855 J·kg−1·K−1. Thanks to sorption isotherms, the maximum adsorbed water was measured. Cob and concrete have values almost equal with 4 and 5%, respectively. Hemp concrete has a value between 12 and 16%. This can be explained by the high amount of hemp shives in the material. Furthermore, hysteresis phenomenon appeared to be more important for concrete and hemp concrete, but not for cob. Additionally, it has been highlighted that moisture storage capacity of cob is approximately 7 times lower than hemp concrete values and twice as low as concrete. MBV tests were carried out for cob and compared with hemp concrete and concrete. A MBV of 1.4 g/(m2·%RH) was obtained, which leads us to consider cob as a good moisture regulator. Hemp concrete has a MBV higher than cob’s one. The latter is equal to 2.27 g/(m2·%RH) which defines this material as an excellent moisture regulator. The same statement is not valid for concrete because of this very low MBV that is worth 0.37 g/(m2·%RH). Thus, it is considered as a limited moisture regulator. Finally, water vapor permeability tests were carried out. Cob and hemp concrete have close values with 1.08 × 10⁻¹¹ kg·s−1·m−1·Pa−1 and 2.85 × 10⁻¹¹ kg·s−1·m−1·Pa−1, respectively. Regarding concrete, its water vapor permeability value is much lower with a value of 9.51 × 10⁻¹³ kg·s−1·m−1·Pa−1.
Thanks to the modeling part, it was highlighted that cob is less conductive for humidity compared to hemp concrete and clay brick but more conductive than glass powder concrete. This tendency is inversed for profile temperature. It was noticed that RES provides the wall with higher thermal inertia than other compared materials. Additionally, it has been shown that the kinetics of moisture transfer is slower for RES and glass powder concrete than hemp concrete and clay brick.
In addition to the very interesting hygrothermal properties of cob, it is important to underline that its environmental and carbon footprint is much lower than other material used in this comparison [12], hence the interest to deepen the research on this theme.

Author Contributions

Conceptualization, P.P., N.I., S.B., A.E.A.H. and R.B.; methodology, Y.E.B.; validation, Y.E.B., M.S., P.P., N.I., S.B., A.E.A.H. and R.B.; formal analysis, Y.E.B. and M.S.; investigation, Y.E.B. and M.S.; resources, A.E.A.H. and R.B.; data curation, Y.E.B. and M.S.; writing—original draft preparation, Y.E.B.; writing—review and editing, P.P., N.I., S.B., A.E.A.H. and R.B.; visualization, M.S.; supervision, P.P., N.I. and S.B.; project administration, R.B.; funding acquisition, A.E.A.H. and R.B. All authors have read and agreed to the published version of the manuscript.

Funding

This research received no external funding.

Institutional Review Board Statement

Not applicable.

Informed Consent Statement

Not applicable.

Data Availability Statement

The data presented in this study are available on request from the corresponding author.

Acknowledgments

Authors are grateful to Ferhat Benmahiddine for his precious help. They thank to ADEME and Pays de la Loire region.

Conflicts of Interest

The authors declare no conflict of interest.

Nomenclature

C p Specific heat capacity (J·kg−1·K−1)
RH Relative Humidity (%)
mMass (g)
TTemperature (°C)
uWater content of mass ratio (%)
wWater content (kg·m−3)
C m Moisture storage capacity (%)
pPressure (Pa)
k T Liquid water conductivity due to a thermal gradient (kg·m−1·s−1·K−1)
RIdeal gas constant (J·mol−1·K−1)
MMolar mass of water (g·mol−1)
C p * Total heat capacity (J·kg−1·K−1)
h l Specific liquid enthalpy (J·kg−1)
k l Hydraulic liquid conductivity (kg·s−1·m−1·Pa−1)
k m Total moisture diffusivity coefficient (kg·m−1·s−1·Pa−1)
L v   Latent heat of vaporization of liquid water (J·kg−1)
PCC Phase Change Criterion
Subscripts
ssolid
lliquid
vvapor
satsaturation
Greek Symbols
ρ Density (kg·m−3)
λ Thermal conductivity (W·m−1·K−1)
λ * Effective thermal conductivity (W·m−1·K−1)
δ Water vapor permeability (kg·s−1·m−1·Pa−1)
γ Heat transfer by convection due to the vapor pressure gradient  coefficient (W·m−1·Pa−1)

References

  1. Climat, Air et Energie. Available online: https://librairie.ademe.fr/changement-climatique-et-energie/1725-climat-air-et-energie-9791029712005.html (accessed on 31 March 2022).
  2. The United Nations Environment Programme. Global Alliance for Buildings and Construction. Global Status Report for Buildings and Construction: Towards a Zero-Emissions, Efficient and Resilient Buildings and Construction Sector—Executive Summary; The United Nations Environment Programme: Nairobi, Kenya, 2020. [Google Scholar]
  3. Thongkamsuk, P.; Sudasna, K.; Tondee, T. Waste Generated in High-Rise Buildings Construction: A Current Situation in Thailand. Enrgy Proced. 2017, 138, 411–416. [Google Scholar] [CrossRef]
  4. Meyer, C. Concrete Materials and Sustainable Development in the USA. Struct. Eng. Int. 2004, 14, 203–207. [Google Scholar] [CrossRef]
  5. CSI: Our Agenda for Action. Available online: https://www.wbcsd.org/jlgbe (accessed on 31 March 2022).
  6. Réglementation Environnementale 2020: Réduire l’impact Carbone des Bâtiments Neufs (Dossier RE2020). Available online: http://www.cerema.fr/fr/actualites/RE2020 (accessed on 31 March 2022).
  7. Joffroy, T. Les Architectures de Terre Crue: Des Origines à Nos Jours. In Savoir & Faire: La terre; Jacquet, H., Ed.; Savoir & Faire: Paris, France, 2016; Volume La terre, pp. 333–347. [Google Scholar]
  8. Minke, G. Building with Earth: Design and Technology of A Sustainable Architecture. Available online: https://vdoc.pub/documents/building-with-earth-design-and-technology-of-a-sustainable-architecture-7n3qjrkm93p0 (accessed on 31 March 2022).
  9. Anger, R.; Fontaine, L. Grains de Bâtisseurs: La Matière En Grains, de la Géologie à l’Architecture; CRATerre: Villefontaine, France, 2005. [Google Scholar]
  10. Adams, C.; Lynne, E. Alternative Construction: Contemporary Natural Building Methods; John Wiley & Sons: Hoboken, NJ, USA, 2000. [Google Scholar]
  11. Keefe, L. Earth Building: Methods and Materials, Repair and Conservation; Routledge: Oxfordshire, UK, 2012; ISBN 978-1-134-35017-9. [Google Scholar]
  12. Ben-Alon, L.; Loftness, V.; Harries, K.A.; DiPietro, G.; Hameen, E.C. Cradle to Site Life Cycle Assessment (LCA) of Natural vs. Conventional Building Materials: A Case Study on Cob Earthen Material. Build. Environ. 2019, 160, 106150. [Google Scholar] [CrossRef]
  13. Hamard, E.; Cazacliu, B.; Razakamanantsoa, A.; Morel, J.C. Cob, a Vernacular Earth Construction Process in the Context of Modern Sustainable Building. Build. Environ. 2016, 106, 17. [Google Scholar] [CrossRef]
  14. Niroumand, H.; Zain, M.F.M.; Jamil, M. Various Types of Earth Buildings. Procedia Soc. Behav. Sci. 2013, 89, 226–230. [Google Scholar] [CrossRef] [Green Version]
  15. Evans, I.; Smiley, L.; Smith, M.G. The Hand-Sculpted House: A Philosophical and Practical Guide to Building a Cob Cottage; Chelsea Green Publishing: Chelsea, VT, USA, 2002. [Google Scholar]
  16. Ben-Alon, L.; Loftness, V.; Harries, K.A.; Hameen, E.C.; Bridges, M. Integrating Earthen Building Materials And Methods Into Mainstream Construction. J. Green Build. 2020, 15, 87–106. [Google Scholar] [CrossRef]
  17. Watson, L.; McCabe, K. The Cob Building Technique. Past, Present and Future. Inf. Constr. 2011, 63, 59. [Google Scholar] [CrossRef] [Green Version]
  18. Fabbri, A.; Morel, J.C.; Aubert, J.-E.; Bui, Q.-B.; Gallipoli, D.; Ventura, A.; Reddy, V.B.V.; Hamard, E.; Pelé-Peltier, A.; Abhilash, H.N. An Overview of the Remaining Challenges of the RILEM TC 274-TCE, Testing and Characterisation of Earth-Based Building Materials and Elements. RILEM Tech. Lett. 2021, 6, 150–157. [Google Scholar] [CrossRef]
  19. Moisture Movement in Porous Materials under Temperature Gradients. Eos Trans. Am. Geophys. Union 1957, 38, 222–232. [CrossRef]
  20. Ferroukhi, Y.; Djedjig, R.; Limam, K.; Belarbi, R. Hygrothermal Behavior Modeling of the Hygroscopic Envelopes of Buildings: A Dynamic Co-Simulation Approach. Build. Simul. 2016, 9, 501–512. [Google Scholar] [CrossRef]
  21. Remki, B.; Abahri, K.; Tahlaiti, M.; Belarbi, R. Hygrothermal Transfer in Wood Drying under the Atmospheric Pressure Gradient. Int. J. Therm. Sci. 2012, 57, 135–141. [Google Scholar] [CrossRef]
  22. NF EN ISO 17892-4. Available online: https://www.boutique.afnor.org/fr-fr/norme/nf-en-iso-178924/reconnaissance-et-essais-geotechniques-essais-de-laboratoire-sur-les-sols-p/fa166662/80069 (accessed on 31 March 2022).
  23. Rojat, F.; Hamard, E.; Fabbri, A.; Carnus, B.; McGregor, F. Towards an Easy Decision Tool to Assess Soil Suitability for Earth Building. Constr. Build. Mater. 2020, 257, 28. [Google Scholar] [CrossRef]
  24. Baize, D. Guide Des Analyses En Pédologie, 3rd ed.; Éditions Quae: Versailles, France, 2018. [Google Scholar]
  25. Barnaure, M.; Bonnet, S.; Poullain, P. Earth Buildings with Local Materials: Assessing the Variability of Properties Measured Using Non-Destructive Methods. Constr. Build. Mater. 2021, 281, 122613. [Google Scholar] [CrossRef]
  26. NF EN ISO 17892-12. Available online: https://www.boutique.afnor.org/fr-fr/norme/nf-en-iso-1789212/reconnaissance-et-essais-geotechniques-essais-de-laboratoire-sur-les-sols-p/fa187930/84021 (accessed on 31 March 2022).
  27. NF EN 933-9+A1. Available online: https://www.boutique.afnor.org/fr-fr/norme/nf-en-9339-a1/essais-pour-determiner-les-caracteristiques-geometriques-des-granulats-part/fa181706/41426 (accessed on 31 March 2022).
  28. Snell, C.; Callahan, T. Building Green: A Complete How-to Guide to Alternative Building Methods: Earth Plaster, Straw Bale, Cordwood, Cob, Living Roofs; Sterling Publishing Company, Inc.: New York, NY, USA, 2009. [Google Scholar]
  29. Phung, T.A. Formulation et Caractérisation d’un Composite Terre-Fibres Végétales: La Bauge. Ph.D. Thesis, Normandie Université, Caen, France, 2018. [Google Scholar]
  30. Engineering Properties of Cob as a Building Material. Available online: https://scialert.net/abstract/?doi=jas.2006.1882.1885 (accessed on 31 March 2022).
  31. Behim, M.; Cyr, M.; Clastres, P. Physical and Chemical Effects of El Hadjar Slag Used as an Additive in Cement-Based Materials. Eur. J. Environ. Civ. Eng. 2011, 15, 1413–1432. [Google Scholar] [CrossRef]
  32. Hwang, C.; Lin, C. Strength Development of Blended Blast-furnace Slag-cement Mortars. J. Chin. Inst. Eng. 1986, 9, 233–239. [Google Scholar] [CrossRef]
  33. Spezzani, L. Valorisation Énergétique Des Cultures Intermédiaires et Coproduits Agricoles; ValBiom: Gembloux, Belgium, 2014. [Google Scholar]
  34. Lam, P.S.W.; Sokhansanj, S.; Bi, X.; Lim, J.; Naimi, L.; Hoque, M.; Mani, S.; Womac, A.; Ye, X.; Narayan, S. Bulk Density of Wet and Dry Wheat Straw and Switchgrass Particles. Appl. Eng. Agric. 2008, 24, 351–358. [Google Scholar] [CrossRef]
  35. Koh, C.H.; Kraniotis, D. A Review of Material Properties and Performance of Straw Bale as Building Material. Constr Build Mater. 2020, 259, 120385. [Google Scholar] [CrossRef]
  36. Costes, J.-P.; Evrard, A.; Biot, B.; Keutgen, G.; Daras, A.; Dubois, S.; Lebeau, F.; Courard, L. Thermal Conductivity of Straw Bales: Full Size Measurements Considering the Direction of the Heat Flow. Buildings 2017, 7, 11. [Google Scholar] [CrossRef] [Green Version]
  37. Opoku, A.; Tabil, L.G.; Crerar, B.; Shaw, M.D. Thermal Conductivity and Thermal Diffusivity of Timothy Hay. Can. Biosyst. Eng. 2006, 48, 3. [Google Scholar]
  38. Quagliarini, E.; Stazi, A.; Pasqualini, E.; Fratalocchi, E. Cob Construction in Italy: Some Lessons from the Past. Sustainability 2010, 2, 3291–3308. [Google Scholar] [CrossRef] [Green Version]
  39. Kouakou, C.; Morel, J.-C. Strength and Elasto-Plastic Properties of Non-Industrial Building Materials Manufactured with Clay as a Natural Binder. Appl. Clay Sci. 2009, 44, 27–34. [Google Scholar] [CrossRef]
  40. Sangma, S.; Tripura, D.D. Compressive and Shear Strength of Cob Wallettes Reinforced with Bamboo and Steel Mesh. Proc. Inst. Civil. Eng.—Struct. Build 2021, 1–15. [Google Scholar] [CrossRef]
  41. Rizza, M.S.; Böttger, H. Effect of Straw Length and Quantity on Mechanical Properties of Cob. In Proceedings of the 16th International Conference on Non-Conventional Materials and Technologies, Winnipeg, MB, Canada, 10–13 August 2015. [Google Scholar]
  42. Réseau Terre. Guides des Bonnes Pratiques Pour la Construction en Terre Crue. Available online: https://reseauterre.hypotheses.org/748#:~:text=Les%20guides%20des%20bonnes%20pratiques,usage%2C%20de%20p%C3%A9rennit%C3%A9%2C%20etc (accessed on 31 March 2022).
  43. CSTB NF EN 12664. Available online: http://evaluation.cstb.fr/fr/essais/methode/nf-en-12664/ (accessed on 31 March 2022).
  44. NF EN 12667. Available online: https://www.boutique.afnor.org/fr-fr/norme/nf-en-12667/performance-thermique-des-materiaux-et-produits-pour-le-batiment-determinat/fa045167/18796 (accessed on 31 March 2022).
  45. NF EN 821-3. Available online: https://m.boutique.afnor.org/fr-fr/norme/nf-en-8213/ceramiques-techniques-avancees-ceramiques-monolithiques-proprietes-thermoph/fa113314/24983 (accessed on 31 March 2022).
  46. Rode, C.; Peuhkuri, R.; Time, B.; Svennberg, K.; Ojanen, T. Moisture Buffer Value of Building Materials. Heat-Air-Moisture Transp. Meas. Build. Mater. 2007, 4, 33–44. [Google Scholar] [CrossRef] [Green Version]
  47. NF EN 12572-2. Available online: https://www.boutique.afnor.org/fr-fr/norme/nf-en-125722/structures-artificielles-descalade-partie-2-exigences-de-securite-et-method/fa182518/58638 (accessed on 31 March 2022).
  48. Liu, M.Y.J.; Alengaram, U.J.; Jumaat, M.Z.; Mo, K.H. Evaluation of Thermal Conductivity, Mechanical and Transport Properties of Lightweight Aggregate Foamed Geopolymer Concrete. Energy Build. 2014, 72, 238–245. [Google Scholar] [CrossRef]
  49. Trechsel, H.R. Moisture Analysis and Condensation Control. In Building Envelopes; ASTM: West Conshohocken, PA, USA, 2001. [Google Scholar]
  50. Asadi, I.; Shafigh, P.; Abu Hassan, Z.F.; Mahyuddin, N.B. Thermal Conductivity of Concrete—A Review. J. Build. Eng. 2018, 20, 81–93. [Google Scholar] [CrossRef]
  51. Benmahiddine, F.; Bennai, F.; Cherif, R.; Belarbi, R.; Tahakourt, A.; Abahri, K. Experimental Investigation on the Influence of Immersion/Drying Cycles on the Hygrothermal and Mechanical Properties of Hemp Concrete. J. Build. Eng. 2020, 32, 101758. [Google Scholar] [CrossRef]
  52. Boukhelf, F.; Trabelsi, A.; Belarbi, R.; Bachir Bouiadjra, M. Experimental and Numerical Modelling of Hygrothermal Transfer: Application on Building Energy Performance. Energy Build. 2022, 254, 111633. [Google Scholar] [CrossRef]
  53. Allam, R.; Nabil, I.; Belarbi, R.; El-Meligy, M.; Altahrany, A. Hygrothermal Behavior for a Clay Brick Wall. Heat Mass Transf. 2018, 54, 1579–1591. [Google Scholar] [CrossRef]
  54. Laborel-Préneron, A.; Aubert, J.E.; Magniont, C.; Bertron, A. Influence of Straw Content on the Mechanical and Thermal Properties of Bio-Based Earth Composites. Acad. J. Civ. Eng. 2015, 33, 517–522. [Google Scholar] [CrossRef]
  55. Medjelekh, D.; Ulmet, L.; Dubois, F. Characterization of Hygrothermal Transfers in the Unfired Earth. Energy Procedia 2017, 139, 487–492. [Google Scholar] [CrossRef]
  56. Cagnon, H.; Aubert, J.E.; Coutand, M.; Magniont, C. Hygrothermal Properties of Earth Bricks. Energy Build. 2014, 80, 208–217. [Google Scholar] [CrossRef]
  57. Bennai, F.; Ferroukhi, M.Y.; Benmahiddine, F.; Belarbi, R.; Nouviaire, A. Assessment of Hygrothermal Performance of Hemp Concrete Compared to Conventional Building Materials at Overall Building Scale. Constr. Build. Mater. 2022, 316, 126007. [Google Scholar] [CrossRef]
  58. McGregor, F.; Heath, A.; Fodde, E.; Shea, A. Conditions Affecting the Moisture Buffering Measurement Performed on Compressed Earth Blocks. Build. Environ. 2014, 75, 11–18. [Google Scholar] [CrossRef] [Green Version]
  59. Rode, C.; Peuhkuri, R.H.; Mortensen, L.H.; Hansen, K.K.; Time, B.; Gustavsen, A.; Ojanen, T.; Ahonen, J.; Svennberg, K.; Arfvidsson, J. Moisture Buffering of Building Materials. Ph.D. Thesis, Technical University of Denmark, Department of Civil Engineering, Kongens Lyngby, Denmark, December 2005. [Google Scholar]
  60. Laborel-Préneron, A.; Magniont, C.; Aubert, J.-E. Hygrothermal Properties of Unfired Earth Bricks: Effect of Barley Straw, Hemp Shiv and Corn Cob Addition. Energy Build. 2018, 178, 265–278. [Google Scholar] [CrossRef]
  61. Boukhelf, F.; Cherif, R.; Trabelsi, A.; Belarbi, R.; Bachir Bouiadjra, M. On the Hygrothermal Behavior of Concrete Containing Glass Powder and Silica Fume. J. Clean. Prod. 2021, 318, 128647. [Google Scholar] [CrossRef]
  62. EN ISO 13788:2012—Hygrothermal Performance of Building Components and Building Elements—Internal Surface Temperature to Avoid Critical Surface Humidity and Interstitial Condensation—Calculation Methods (ISO 13788:2012). Available online: https://standards.iteh.ai/catalog/standards/cen/a22bcdec-871a-464e-a5f2-fc717b608aeb/en-iso-13788-2012 (accessed on 3 May 2022).
  63. Togkalidou, T.; Karoglou, M.; Bakolas, A.; Giakoumaki, A.; Moropoulou, A. Correlation of Water Vapor Permeability with Microstructure Characteristics of Building Materials Using Robust Chemometrics. Transport. Porous Media 2013, 99, 273–295. [Google Scholar] [CrossRef]
  64. Benmahiddine, F.; Belarbi, R.; Berger, J.; Bennai, F.; Tahakourt, A. Accelerated Aging Effects on the Hygrothermal Behaviour of Hemp Concrete: Experimental and Numerical Investigations. Energies 2021, 14, 7005. [Google Scholar] [CrossRef]
  65. NF EN 15026. Available online: https://www.boutique.afnor.org/fr-fr/norme/nf-en-15026/performance-hygrothermique-des-composants-et-parois-de-batiments-evaluation/fa119083/31029 (accessed on 31 March 2022).
  66. Wang, X.; Jin, X.; Yin, Y.; Shi, X.; Zhou, X. A Transient Heat and Moisture Transfer Model for Building Materials Based on Phase Change Criterion under Isothermal and Non-Isothermal Conditions. Energy 2021, 224, 120112. [Google Scholar] [CrossRef]
Figure 1. Picture and scheme of the Lambda-meter EP500e.
Buildings 12 00648 g001
Figure 2. Image of the BT 2.15 Calvet calorimeter.
Buildings 12 00648 g002
Figure 3. Nordtest project classification of materials versus Moisture Buffer Value.
Buildings 12 00648 g003
Figure 4. Cross section (a) and longitudinal (b) microsopic observations of a straw fiber.
Buildings 12 00648 g004
Figure 5. Microscopic observation of the composite raw earth/straw.
Buildings 12 00648 g005
Figure 6. Cob samples’ thermal conductivity at different temperatures.
Buildings 12 00648 g006
Figure 7. Comparison of thermal conductivity of different materials.
Buildings 12 00648 g007
Figure 8. Specific heat capacity cob as a function of temperature.
Buildings 12 00648 g008
Figure 9. Specific heat capacity of cob in the range temperature exploited and linear fitting.
Buildings 12 00648 g009
Figure 10. Comparison of cob’s specific heat with different materials.
Buildings 12 00648 g010
Figure 11. Comparison of cob’s volumetric heat capacity with different materials.
Buildings 12 00648 g011
Figure 12. Sorption isotherms of raw earth (RE), raw earth/straw composite (RES) (a) and straw (S) (b); the lower curve for each formulation corresponds to the adsorption isotherm, while the upper curve corresponds to the desorption isotherm.
Buildings 12 00648 g012
Figure 13. Comparison of sorption isotherms of concrete, glass powder concrete, hemp concrete, clay brick, and raw earth/straw (RES) in terms of water content (a) and mass ratio (b).
Buildings 12 00648 g013
Figure 14. Moisture storage capacity of raw earth, raw earth/straw (a), and straw (b).
Buildings 12 00648 g014
Figure 15. Comparison of cob MBV with other materials.
Buildings 12 00648 g015
Figure 16. Comparison of water vapor permeability of concrete, glass powder concrete, hemp concrete, clay brick, and raw earth/straw (RES).
Buildings 12 00648 g016
Figure 17. Comparison of the water content (a) and temperature profiles (b) obtained numerically (continuous lines) with those of the EN 15026 standard (triangles).
Buildings 12 00648 g017
Figure 18. Boundary conditions of the comparison case study.
Buildings 12 00648 g018
Figure 19. Influence of PCC on the RH profile inside RES.
Buildings 12 00648 g019
Figure 20. Relative humidity (a) and temperature profiles (b) inside the materials (hemp concrete, cob, and GPC) after 72 h.
Buildings 12 00648 g020
Figure 21. Temporal evolution of RH (a) and temperature (b) at 0.05 m for HC, cob, and GPC.
Buildings 12 00648 g021
Figure 22. Yearly simulation of the evolution of RH and T at x = 0.05 m for HC, cob, and GPC.
Buildings 12 00648 g022
Table 1. Water vapor resistance factor of concrete, glass powder concrete, hemp concrete, clay brick, and cob.
MaterialsWater Vapor Resistance Factor
Cob18.52
Hemp concrete7.02
Clay brick12.27
Glass powder concrete80.97
REF concrete210.30
Table 2. Hygrothermal properties of the studied materials.
MaterialsThermal Conductivity (W·m−1·K−1)Water Vapor Permeability
(kg·s−1·m−1·Pa−1)
Heat Capacity (J·kg−1·K−1)Dry Density
(kg·m−3)
Hemp concrete
[56,63]
0.12.85× 10−111150484.56
Clay brick
[53]
0.411.63× 10−117501980
Glass powder concrete
[52]
1.29 + 0.607 · w/10003.38 × 10−11 · exp(−5.998 · RH)8502290
RES0.181.08 × 10−118701654
Publisher’s Note: MDPI stays neutral with regard to jurisdictional claims in published maps and institutional affiliations.

