1. Introduction
Composite steel–concrete beams are primarily composed of steel beam, slab, and shear connector components [
1], as shown in
Figure 1a. The typical slabs also include reinforced concrete (RC) slabs and composite slabs. In the composite slabs, the open-trough steel decks, clip-pan steel decks, and streel-bar truss decks are generally selected (see
Figure 1b–d) [
2]. To date, composite steel–concrete beams have been widely used in industrial and residential constructions, with the typical concrete strength in the range of 20–40 MPa [
3]. In this context, composite steel–concrete beams are potential structural members to use recycled aggregate concrete (RAC). Due to the residual mortar adhered to the surface of recycled coarse aggregate (RCA), RAC exhibits inferior mechanical properties to natural aggregate concrete (NAC); however, it is feasible to obtain RAC with a compressive strength of 20–40 MPa [
4,
5,
6,
7]. Current studies on the ultimate behavior of composite beams have demonstrated that composite beams using 100% RAC can have a flexural behavior that is similar to composite beams using NAC [
8], with a 1.0% decrement in the flexural strength and 5.5% decrement in the flexural stiffness.
In addition to the ultimate behavior of composite beams, their serviceability should be concentrated because RAC exhibits 27.6–77.0% higher shrinkage and 23.0–120.0% higher creep deformation than NAC [
9,
10,
11,
12,
13]. It is also worth mentioning that the time-dependent behavior is not adequately considered, even for composite steel–NAC beams, in current international standards as their spans are traditionally limited. Increasingly larger spans are specified for composite beams, and the effects of long-term shrinkage and creep on the time-dependent behavior of composite steel–concrete beams are significant. To date, the investigations into the time-dependent behavior of composite steel–NAC beams have primarily focused on (a) the effects of long-term shrinkage and creep and (b) the degree of shear connection on the time-dependent behavior of composite beams.
Significant effects of shrinkage and creep on the time-dependent behavior of composite beams have been reported. Researchers recorded additional deflection (
δcs) due to shrinkage and creep effects, accounting for 1.2–4.0 times the instantaneous deflection (
δinst) [
14,
15,
16,
17], which was higher than the values recommended by international specifications. Sequentially, Wright et al. [
18] proposed a prediction method to calculate the additional shrinkage curvature of composite beams. Ranzi et al. [
19], Reginato et al. [
20], Erkmen et al. [
21], and Xiang et al. [
22] quantified the effects of shrinkage and creep on the long-term deflection of composite beams and proposed methods for predicting long-term deflection. The above investigations on composite beams used uniform shrinkage and creep models; that is, the relative humidity inside concrete slabs was considered to be identical to the ambient relative humidity. This assumption is believed to be acceptable for composite beams using solid RC slabs, as shown in
Figure 2a, where moisture can diffuse on the RC slabs from both the top and bottom surfaces. However, the distribution of the relative humidity of the composite beams with composite slabs is nonuniform throughout the thickness of their slabs due to the impermeable surface of their slabs (
Figure 2b), correspondingly leading to nonuniform shrinkage and creep deformations. Al-deen et al. [
23] measured the distribution of the relative humidity over the thickness of composite slabs, and the relative humidity at the bottom surface was at a high level even after 124 days. Ranzi et al. [
24] compared the time-dependent deflection of composite beams using nonuniform and uniform shrinkage distributions and highlighted that nonuniform shrinkage models should be used in the routine design procedures. Recently, they measured the shrinkage distributions in the solid slabs and composite slabs using RCA and proposed nonuniform relative humidity and corresponding shrinkage models for composite slabs with RCA [
2,
25,
26,
27,
28,
29].
In actual practice, the partial shear connection is generally selected for composite beams, and the time-dependent flexural stiffness decreases over time due to the slip between the steel beam and slab [
30,
31]. Al-deen et al. reported an increment of 34.8–58.2% in the additional slip due to shrinkage and creep effects compared with the slip under instantaneous loading [
23]. A remarkable difference ranging from −30% to +90% between the predicted and measured data was noticed when the influence of the additional slip was not considered. Oehlers et al. [
32] proposed a calculation method for the flexural stiffness of composite beams considering the strength and ductility of shear connectors. Liu et al. [
33] proposed a method for calculating the shear-slip strain difference of steel–concrete composite beams based on the elastic theory. Nie et al. [
34] proposed a design method to predict flexural stiffness considering the slip effects. Fu et al. [
35] proposed a stiffness calculation method for the partial shear connections of composite beams based on experimental and theoretical analysis. Yuan et al. [
36] adopts the numerical analysis method to put forward a simplified formula of the stiffness reduction coefficient of composite beams. The flexural stiffness decreased while the time-dependent slip increased with the incorporation of RCA. In both cases, including the composite beams using RC slabs (uniform shrinkage and creep distributions) and those using composite slabs (nonuniform shrinkage and creep distributions), the influence of the degree of shear connection on the time-dependent behavior of the composite steel–RAC beams should be quantified.
To sum up, scholars have focused on the long-term performance of composite beams using RC slabs via experimental and finite element (FE) modeling. However, the influence of nonuniform shrinkage and creep on the long-term behavior has yet to be quantified for composite beams with composite slabs. Furthermore, no study has investigated the long-term performance of steel–RAC beams, which hinders the structural application of RAC.
In this context, the long-term performance of steel–RAC beams was studied according to the RCA replacement ratio and composite floor type (uniform shrinkage/nonuniform shrinkage). This study aimed to quantify the combined effects of the cracking, shrinkage, creep, and degree of shear connection of concrete on the time-dependent behavior of composite steel–RAC beams and propose their routine design procedures. To this end, FE models of the time-dependent behavior of the composite beams were established using Abaqus software. The shrinkage effect was simulated by applying a temperature field to the concrete slabs, and the creep effect was predicted by the age-adjusted effective modulus method (AEMM). The FE models were benchmarked against available time-dependent flexural and push-out test results from full-scale composite beams with RC or composite slabs. A parametric study was further conducted to quantify the influence magnitude of the various factors on the time-dependent behavior of composite steel–RAC beams. The design procedures for estimating the long-term deflection of composite beams were proposed and evaluated by the numerical data. The research content of this paper fills the gap in the long-term performance of steel–RAC beams, and further promotes the structural application of RAC.
2. Establishing FE Models
The FE models of the time-dependent behavior of composite steel–concrete beams were proposed using Abaqus software, as shown in
Figure 3. The FE model included a steel beam component, a concrete slab component, profiled steel decking in the composite slab, reinforcements, and shear connectors. A temperature field was determined and applied to the concrete slab to simulate the long-term shrinkage effect, and the AEMM was employed to reflect the creep effect.
2.1. Materials
2.1.1. Steel
For the serviceability behavior of composite beams, the steel components were generally in the elastic stage [
16,
23]. However, for the case that the composite beams with large spans suffered high loads, the whole stress–strain relationship of the steel components was included in the FE models.
Profiled Steel Decks
The profiled steel decks were generally produced with a thickness of 0.5–1.2 mm and exhibited a similar yield and ultimate strength. In this case, the elastic–perfectly plastic model was selected for the profiled steel decks, as shown in
Figure 4.
Steel Beam, Reinforcements, and Shear Connectors
The elastoplastic stress–strain (
σ–
ε) model suggested by Katwal et al. [
37] was used for the steel beam, reinforcements, and shear connectors, as shown in
Figure 5. Equation (1) expresses the specific relations:
where
Es is the elastic modulus of steel;
fy and
fu represent the yield and ultimate strength of steel, respectively;
εy indicates the strain under the yield strength;
εp and
εu stand for the corresponding strains under the plastic strength and ultimate strength, respectively, and can be calculated by Equations (2) and (3):
where
p is the hardening index and
Ep indicates the elastic modulus in the plastic stage:
2.1.2. Concrete
The concrete damaged plasticity (CDP) model was specified for natural concrete and RAC. The primary parameters included the elastic modulus (
Ec), the dilation angle (
ψ), the flow potential eccentricity (
e), the ratio of the compressive strength under biaxial loading to the uniaxial compressive strength (
fb0/
f′
c), the ratio of the second stress invariant on the tensile meridian to that on the compressive meridian (
Kc), the viscous parameter (
u), and the stress–strain curves of concrete under tension and compression. Mainly,
ψ was usually in the range of 30°–45°, and this study selected a value of 35°; we also used the default values of
e,
fb0/
f′
c, and
Kc equaling 0.1, 1.16, and 0.667, respectively, and assigned a value of 0.005 to the viscous parameter. These five parameters follow those recommended by Katwal et al. [
37] to predict the flexural behavior of composite beams. As the composite beams suffered both immediate and long-term loads, the short- and long-term material models are introduced in the following sections.
Short-Term Properties
The elastic modulus of NAC (
Ec,NAC) was calculated using the EC2 specification [
38], as shown in Equation (6):
where
fcm is the compressive strength of concrete cylinders.
For the elastic modulus of RAC (
Ec,RAC), the modified model considering the influences of the RCA replacement ratio and the residual mortar content (
CRM) was introduced:
where
CRM generally ranged from 30% to 50% [
39]; according to [
2], a
CRM of 40% was specified for RAC when it was unknown.
- 2.
Compressive Stress–Strain Relationship
Figure 6 demonstrates that both RAC and NAC exhibit a similar compressive stress–strain relationship. Thus, this work uses the unified model proposed by Xiao et al. [
40], including the effect of the RCA replacement ratio, as expressed in Equation (8):
where
x and
y are the relative stress and strain, respectively, defined as Equations (9) and (10):
where
σc and
εc are the compressive stress and strain, respectively; and
fcm and
εcm indicate the compressive strength and the corresponding peak strain, respectively. Coefficients
a and
b represent the curve shape in the ascending and descending stages, including the influence of the RCA replacement ratio:
- 3.
Tensile Stress–Strain Relationship
According to
Figure 6, both RAC and NAC exhibit a similar tensile stress–strain relationship. Hence, this study employs the unified model proposed by Xiao et al. [
40], including the effect of the RCA replacement ratio, as expressed in Equation (13):
where
x and
y are the relative stress and strain, respectively, defined as Equations (14) and (15):
where
σt and
εt are the tensile stress and strain, respectively; and
ft and
εt0 denote the tensile strength and the corresponding strain, respectively. The coefficient
c represents the curve shape, including the influence of the RCA replacement ratio:
Long-Term Properties
Figure 7 illustrates the concrete strain over time, and the total long-term strain (
εc,tot) of concrete comprises the instantaneous strain (
εi), the shrinkage strain (
εsh), and the creep strain (
εcr):
where
t (days) is the calculated time of concrete,
t0 (days) indicates the time of the first loading, and
ts denotes the curing period of concrete (days).
For the concrete subjected to a lower stress state, linear creep deformation is expected with instantaneous deformation via the creep coefficient
φ(
t,
t0):
The models of the shrinkage deformation and the creep coefficient were introduced into the FE models, as described below.
The total shrinkage is composed of the autogenous and drying shrinkage, i.e.,
εsh =
εsh,au+
εsh,dry. According to EC 2 [
38], the autogenous shrinkage model was introduced into NAC, as expressed in Equation (19):
where
(
t) is the autogenous shrinkage at day
t, and
(∞) indicates the final autogenous shrinkage calculated using the characteristic concrete strength at day 28, i.e.,
fck:
For the autogenous shrinkage model of RAC, a reduction coefficient factor (
κsh,au) was introduced into that of NAC, and the detailed model can be obtained from a previous study [
2]:
This study uses the drying shrinkage models listed in EC2 [
38] for NAC, as given by Equation (22):
where
(
t) indicates the drying shrinkage at day
t,
βsh,dry(
t,
ts) is the coefficient of the rate of shrinkage over time,
κsh,dry represents a coefficient depending on the notional size of the cross-section (
h0), and
denotes the nominal unrestrained drying shrinkage:
For the drying shrinkage of RAC, our previous studies considered the combined effects of the RCA replacement ratio, the residual mortar content, and the strength of the parent concrete and proposed two coefficients:
κsh,a, considering the influences of the RCA replacement ratio and the residual mortar content, and
κsh,f, taking the effect of the strength of the parent concrete into account:
- 3.
Creep Coefficient Model
This work utilized the creep coefficient model according to EC2 [
38], as described in Equations (25)–(27):
where
φ(
t,
t0) is the creep coefficient,
φ0 indicates the notional creep coefficient,
βc(
t,
t0) denotes a coefficient that describes the development of creep with time after loading,
φRH represents a factor allowing for the effect of relative humidity on the notional creep coefficient,
β(
fcm) is a factor allowing for the effect of the strength of concrete on the notional creep coefficient,
βc(
t0) stands for a factor allowing for the effect of the period of loading on the notional creep coefficient, and
βH is a coefficient depending on the relative humidity and the notional member size.
For the creep coefficient model of RAC, this work considers the combined effects of the RCA replacement ratio, the residual mortar content, and the strength of the parent concrete. It proposes two coefficients:
KRCA, considering the influences of the RCA replacement ratio and the residual mortar content, and
KRC, regarding the impact of the strength of the parent concrete [
13]:
2.2. Model of Shrinkage and Creep Distribution in Composite Slabs
2.2.1. Model of Shrinkage Distribution through Slab Thickness
According to the slab types, various shrinkage distributions through the slab thickness, namely the uniform shrinkage distribution in the RC slabs and the nonuniform shrinkage distribution in the composite slabs, were obtained in the composite beams.
Figure 8 depicts the shrinkage models we proposed for NAC and RAC slabs.
Equation (29) is designed for composite beams using RC slabs:
where
t is the calculated days,
y indicates the distance from the reference axis, and
r denotes the RCA replacement ratio.
(
t,
ts) is the total shrinkage calculated using the notional size of the cross-section according to EC2 [
38]; for example, for the solid slab,
h0 =
h, and Equation (30) calculates
(
t,
ts) as:
Equations (21) and (24) also calculate (t) and (t,ts), respectively.
Equations (31) and (32) are also used for the composite beams with composite slabs:
where the function
f (
y,
r) considers the linear influence of the RCA replacement ratio on the shrinkage distribution:
It is worth noting that the shrinkage distribution model of RAC slabs can degenerate to that of NAC slabs when
r equals zero, coinciding with those reported in the literature [
25,
26,
27].
2.2.2. Creep Coefficient Distribution through Slab Thickness
The long-term creep deformation is reasonably assumed to linearly change with the instantaneous deformation when the stress state is under 40–50% of the concrete strength [
38]. To further consider the aging effects of creep, we multiplied the creep coefficient
φ(
t,
t0) by the aging coefficient
χ(
t,
t0). This study used a specified value of 0.65 as recommended in [
41]:
In other words, Equation (34) calculates the effective modulus,
Ee(
t,
t0), which is consistent with the AEMM:
The ambient relative humidity was used to calculate the creep coefficient for the composite beams using RC slabs. In contrast, a nonuniform relative humidity distribution was expected for the composite beams using composite slabs, so a nonuniform creep coefficient distribution was obtained. This study specified the ambient relative humidity on the top surface of the composite slabs but used a relative humidity of 90% on the bottom surface of the composite slabs.
2.3. Element Type and Mesh Discretization
The FE model utilized three types of elements, as shown in
Figure 3. The solid C3D8R element was used to simulate the concrete component, the steel beam component, the shear studs, and the loading plates; the shear S4R element was employed to simulate the profiled steel deck; and the truss T3D2 element was utilized to model the reinforcements.
Two types of structured and sweep mesh discretization methods were used. For the loading plates, the web and bottom flange of the steel beam were discretized using the structured method, with a maximum element size of 20 mm. The top flange of the steel beam, the shear studs, the concrete, and the profiled steel decks were discretized using the sweep method. To obtain regulated elements and further improve the convergency efficiency, we used the medial axis algorithm to refine the zone near the shear studs and the advancing front algorithm to refine the other zones. The maximum element size of the flange of the steel beam was 10 mm, and the element size of the profiled steel decks and concrete was in the range of 20–40 mm; an approximate size of 4 mm was selected for the shear studs and their nearby profiled steel decks and concrete. An element size of 20–40 mm was also used for the reinforcements to coordinate with the concrete slabs.
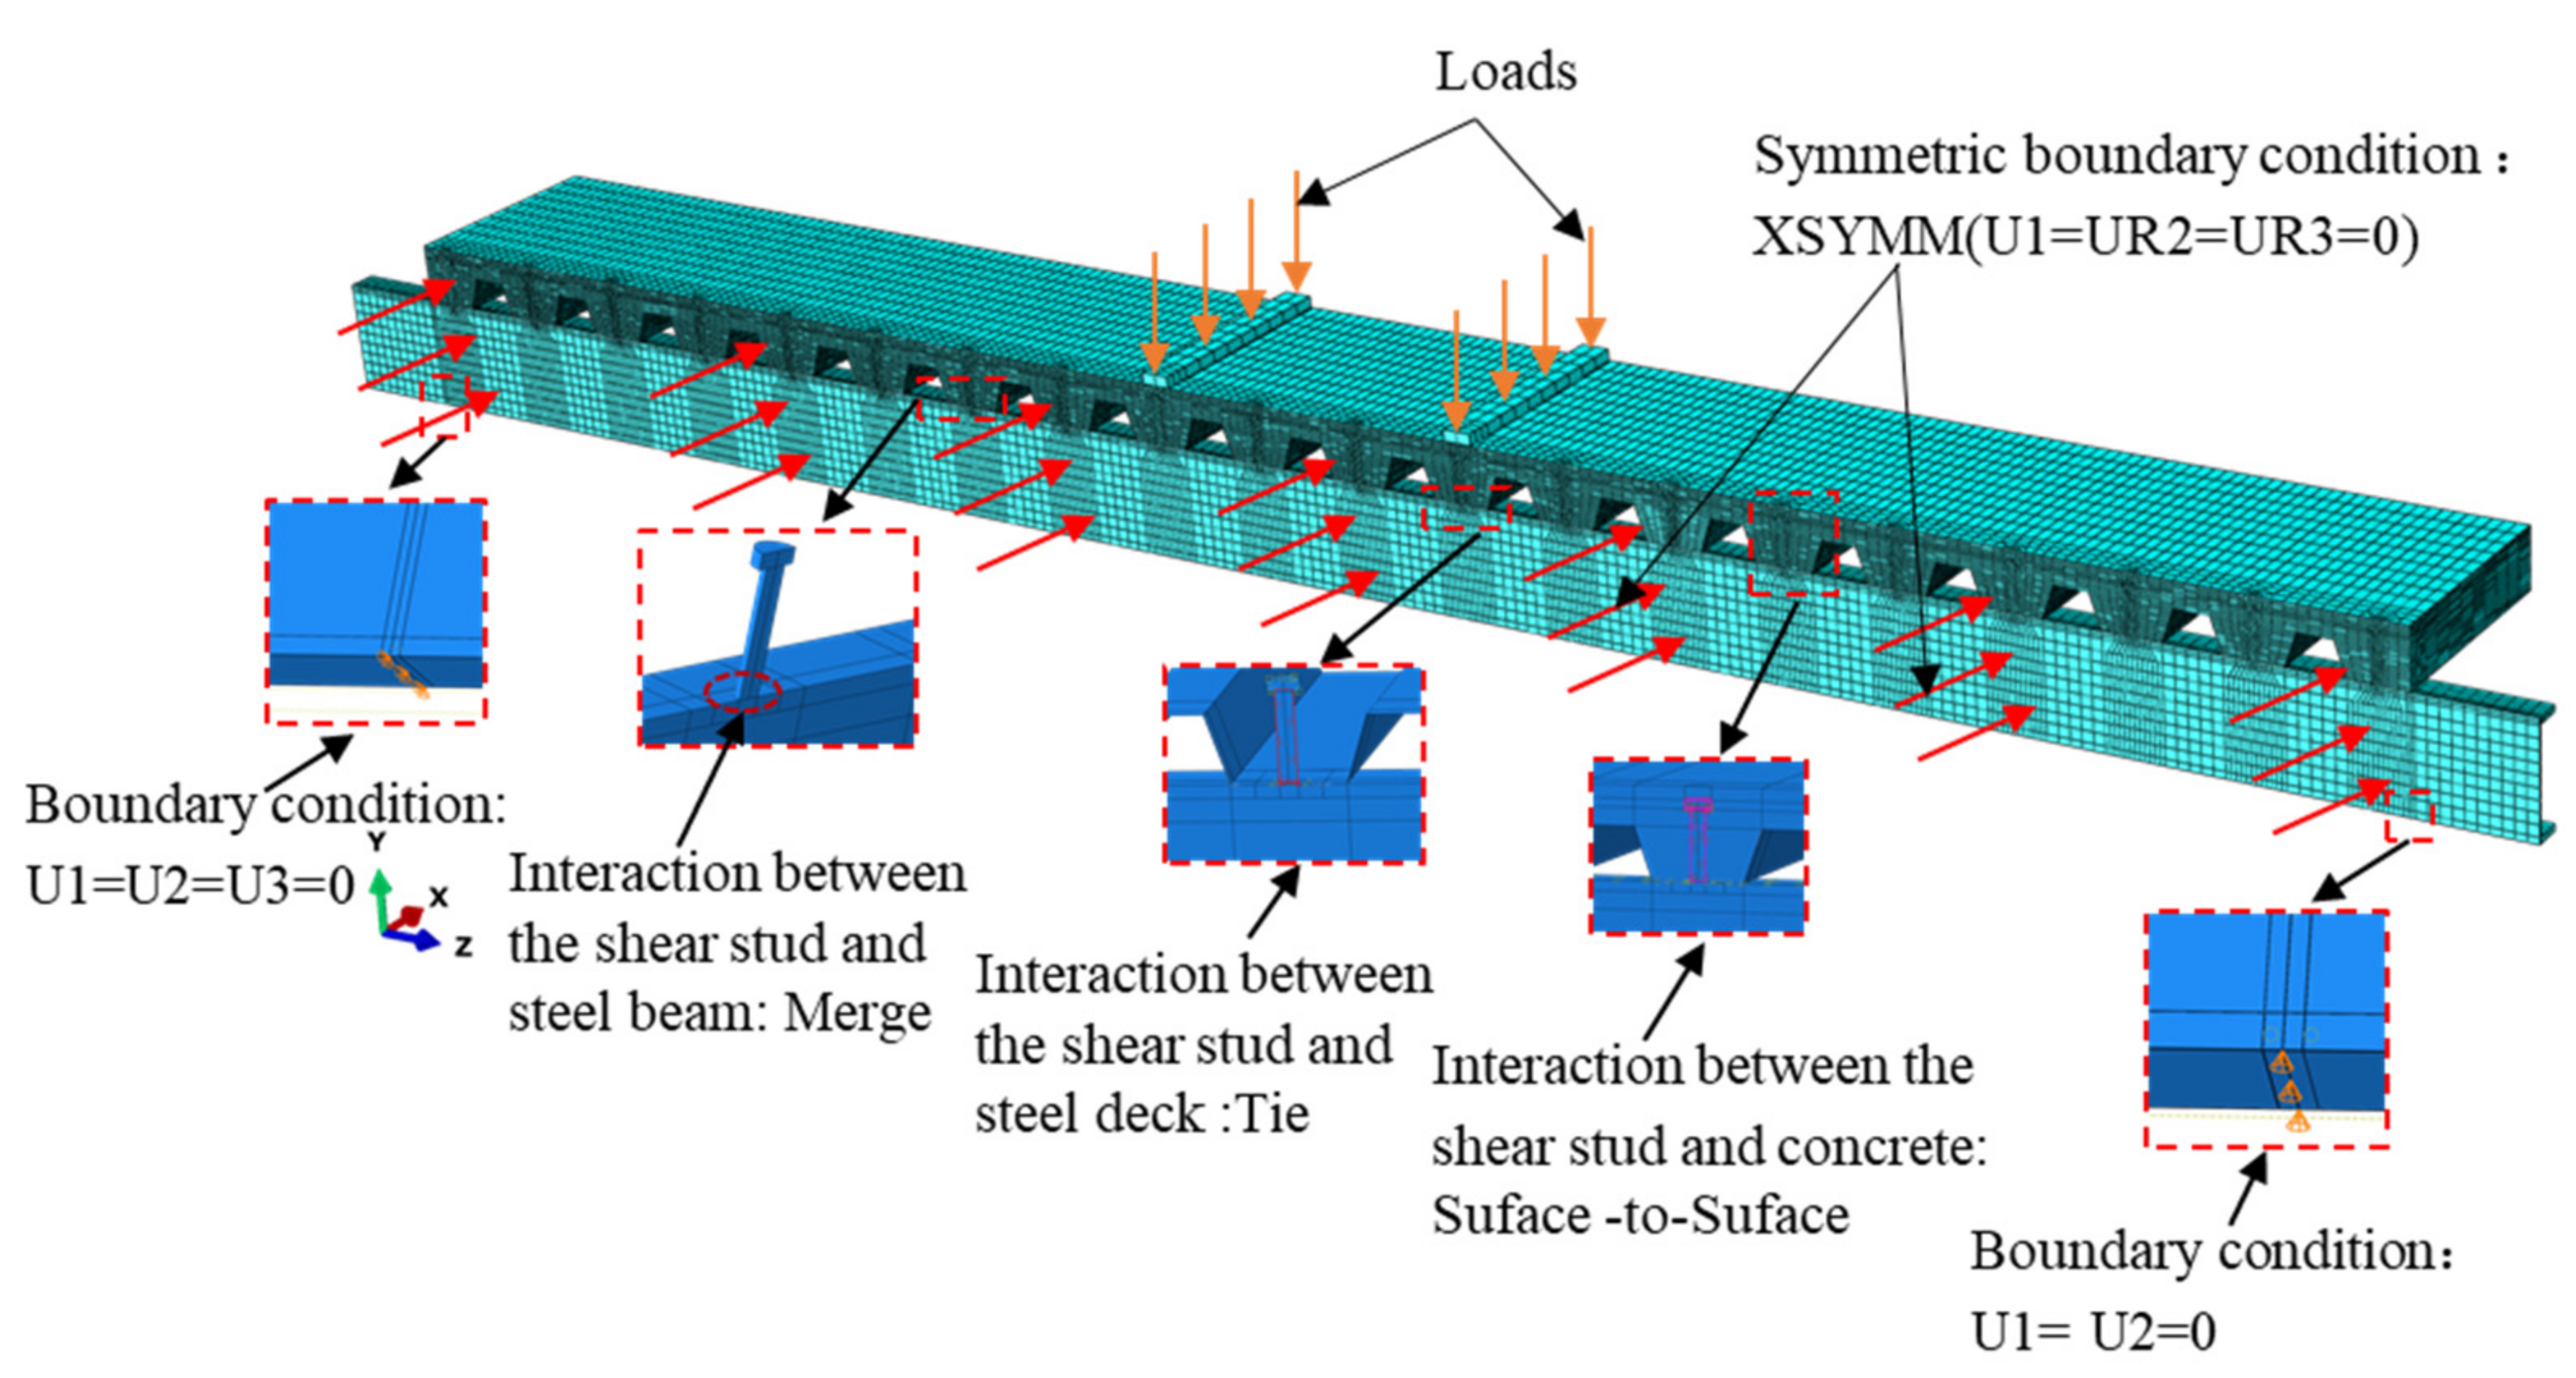
2.4. Boundary Conditions and Interaction Properties
The semi-model of the composite beams was established to enhance the computing efficiency, and the XSYMM symmetric boundary condition was adopted for the symmetric surface, as shown in
Figure 9. The support conditions, i.e., the pined or roller support, were determined according to the corresponding test conditions. For the pined supports, the bottom of the steel beam was restrained in all three directions of
x,
y, and
z while for the roller supports, the bottom of the steel beam was restrained in the two directions of
x and
y.
The surface–surface interactions were used to simulate the behavior of the bonding between the shear studs and the concrete and between the concrete and the profiled steel decks.
Table 1 presents the settings of the master and slave surfaces in the FE models. To better simulate the slip between the composite slabs and steel beams, the composite slab and steel beam were modeled in surface–surface interactions. The normal behavior of the interfacial surface was considered the
hard interaction while a friction factor was used for the tangential behavior of the interfacial surface [
42]. Katwal et al. [
37] investigated the influence of the friction factor on the flexural behavior of composite beams and reported that a friction coefficient of 0.01 could provide reasonable predictions; thus, this study uses a friction factor of 0.01.
The shear studs and the steel beam were merged to simulate the weld. The profiled steel deck was tied with the shear studs and the loading plate with the concrete. The reinforcements were also embedded in the concrete solids.
2.5. Analysis Procedures
The process of the long-term test was usually divided into two stages, as illustrated in
Figure 10. Stage I represents the applications of the instantaneous loading on the composite beams, and Stage II indicates the time-dependent evolution of the composite beams under the effects of the sustained external loading and internal shrinkage. This study simulated the long-term behavior of the composite beams by the thermal–mechanical modeling. Indeed, the thermal field simulated the shrinkage effect, and the combined effects of the instantaneous loading and creep were simulated using the AEMM.
Stage I: The instantaneous performance of the composite beams under the short-term loading was modeled, and the mechanical properties of the concrete at time t0 were adopted.
Stage II: The influence of the shrinkage distribution was first modeled by the temperature variation in the concrete component with an expansion coefficient of 10 µε/°C. The sustained loading was substantially applied to the composite beams considering the shrinkage effects caused by the applied thermal field and the creep effect using the AEMM. The specific process is as follows:
The shrinkage model of Equations (19)–(24) was used to obtain the time-varying value of the concrete shrinkage strain. The coefficient of the expansion of a concrete material as a function of temperature is defined in Abaqus. Using the principle of material shrinkage under cooling, the shrinkage strain of concrete is equal to the shrinkage strain under cooling, and the relationship between concrete shrinkage and temperature is established, and then the relationship between temperature and time is established. The AEMM method was used to obtain the model of the change in the elastic modulus of concrete with time. Based on the variation relationship between temperature and time, the variation model of the concrete elastic modulus with time can be transformed into a variation model with temperature. In Abaqus, the temperature-dependent data is used as input to the model of the change of the elastic modulus of concrete with time. By cooling the concrete according to the demand, the simulation of concrete shrinkage and creep deformation can be realized.
4. Parametric Study and Design Procedures
The time-dependent behavior of the composite steel–RAC beams was significantly influenced by various factors, so their influence magnitude was quantified using the verified FE models. Furthermore, the design procedures were proposed to predict the time-dependent deflection of composite steel–RAC beams, accounting for the combined effects of uniform (nonuniform) shrinkage, uniform (nonuniform) creep, concrete cracking, and the degree of the shear connection.
4.1. Parametric Study
4.1.1. Parameter Selection
This parametric study selected a simply supported condition for the composite beams. The strength of the concrete was set at 30 MPa, and the reinforcements, with a diameter of 12 mm, were placed at a 200 mm spacing in the longitudinal and transverse directions. The varied parameters included the RCA replacement ratio, the steel decking type, the depth of the slab (
h), the beam span-to-depth ratio (
L/H), the long-term loading (
q), and the ambient relative humidity (
RH).
Table 4 lists the parameters and their ranges.
4.1.2. Influence of the RCA Replacement Ratio
Figure 15 delineates the influence of the RCA replacement ratio on the time-dependent deflection of the composite beams, where the composite slabs (using the open-trough steel deck and the clip-pan steel deck) and the RC slabs are considered. The span of the composite beams, the sustained loading, and the relative humidity are 8000 mm, 0.2
qu, and 50%, respectively. The long-term deflection of the composite beams was enlarged with an increase in the RCA replacement ratio, irrespective of the steel deck types. The long-term deflection of the composite beams with the open-trough steel deck increased by 9.9% and 16.1% when using 50% and 100% RCA, respectively, compared with the reference composite beams with natural coarse aggregate. In fact, the long-term shrinkage and creep deformation rose while the elastic modulus decreased with the incorporation of the RCA into the concrete; both led to an increase in the long-term deflection of the composite beams.
Figure 16 summarizes the influence of the RCA replacement ratio on the long-term deflection of composite beams with different degrees of shear connection, and in this parametric study, the degree of shear connection ranged from 0.29 to 0.75, which was consistent with values used in practical structures. Clearly, the mid-span deflection of the composite beams increased by 2.2–9.9% and 3.5–17.2% for an RCA replacement ratio of 50% and 100%, respectively, compared to those of the composite beams with NAC.
Furthermore, the long-term deflections of the composite beams due to the shrinkage and creep effects accounted for a remarkable proportion of the total deflection. For an RCA replacement ratio of 0%, 50%, and 100%, the proportion of the shrinkage and creep deflection (δcs) in the total deflection (δtot) ranged from 21.6% to 59.7%, 24.1% to 61.5%, and 25.3% to 63.0%, respectively. Thus, a slightly larger proportion was obtained as the RCA replacement ratio rose, indicating that the design of the long-term deflection of composite steel–RAC beams should be taken into further consideration.
4.1.3. Influence of the Slab Type
The slab types affected the shrinkage and creep distributions: uniform shrinkage and creep for the RC slabs and nonuniform shrinkage and creep for the composite slabs.
Figure 17 demonstrates the influence of the slab types on the time-dependent behavior of the composite beams, and the selected slabs included the RC slab and the composite slab. Both beams were under a sustained loading of 0.2
qu and relative humidity of 50% for 50 years. The long-term additional deflection of the composite beams due to the shrinkage and creep effects was more prominent for the RC slab than the composite slab, irrespective of the RCA replacement ratio. Specifically, the long-term additional deflection of the composite beams with the RC slabs increased by 4.5%, 6.6%, and 10.3% compared to that of the composite beams with the composite slabs at an RCA replacement ratio of 0%, 50%, and 100%, respectively, mainly because less humidity distribution was observed for the composite beams with the RC slabs than the composite slabs. Indeed, larger shrinkage-induced force and more considerable creep-induced deformation were expected in the composite beams using the RC slabs. In such a case, for the routine design of composite steel–RAC beams, different shrinkage and creep models should be specified according to the selected slab types: uniform shrinkage and creep for the RC slabs and nonuniform shrinkage and creep for the composite slabs.
4.1.4. Influence of the Slab Depth
Figure 18 shows the variation in the long-term deflection of the composite beams with the depth of the slab. The depth of the slab was 120, 135, and 150 mm for both the open-trough composite slabs and the clip-pan composite slabs. The long-term deflection of the composite beams rose with an increase in the depth of the slab, irrespective of the RCA replacement ratio. For instance, the long-term deflection of the composite beams declined by 6.7% and 13.2% at a slab depth of 135 and 150 mm, respectively, compared to a slab depth of 120 mm for the composite beams with a 100% RCA replacement ratio and open-trough composite slabs. In fact, increasing the depth of the slab enlarged the flexural stiffness but reduced the long-term (shrinkage and creep) deformations, so a smaller deflection of the composite beams was expected.
4.1.5. Influence of the Beam Span-to-Depth Ratio
Figure 19 presents the influence of the beam span-to-depth ratio on the long-term deflection of the composite beams, and the beam span-to-depth ratio was selected to be 9.43, 14.15, and 18.87. Both open-trough composite slabs and clip-pan composite slabs were used. The long-term deflection of the composite beams enlarged with an increase in the beam span-to-depth ratio, irrespective of the RCA replacement ratio. Moreover, nonlinear correlations were obtained for the influence of the beam span-to-depth ratio on the long-term deflection of the composite beams. For example, the long-term deflection of the composite beams using 100% RCA and the open-trough composite slabs with a span-to-depth ratio of 18.87 was 2.57 and 9.77 times that of the composite beams with a span-to-depth ratio of 14.15 and 9.43, respectively, because an increase in the beam span-to-depth ratio reduced the flexural stiffness, enlarging the instantaneous, creep-induced, and shrinkage-induced deflections.
4.1.6. Influence of the Long-Term Load Level
Figure 20 illustrates the influence of the sustained loading on the long-term deflection of the composite beams, and the selected loading level was 0.1
qu, 0.2
qu, and 0.3
qu. As expected, the long-term deflection of the composite beams enlarged with an increase in the sustained loading level. The long-term deflection of the composite beams with 100% RCA and the open-trough composite slabs increased by 58.2% and 119.2% at a sustained loading level of 0.2
qu and 0.3
qu, respectively, compared to a sustained loading of 0.1
qu because a higher degree of concrete cracking occurred, enlarging the instantaneous and creep-induced deflections.
4.1.7. Influence of the Relative Humidity
Figure 21 delineates the impact of the ambient relative humidity on the long-term deflection of the composite beams. To this end, the relative humidity of the composite beams with both the open-trough composite slabs and the clip-pan composite slabs ranged from 30% to 70%. The long-term deflection of the composite beams rose with an increase in the relative humidity. The long-term deflection of the composite beams with 100% RCA and the open-trough composite slabs declined by 1.5% and 11.0% at a relative humidity of 50% and 70%, respectively, compared to a relative humidity of 30% since the long-term shrinkage and creep decreased with an increase in the relative humidity, thereby reducing the additional deflection simultaneously.
4.2. Design Procedures
From the parametric study, one can conclude that the RCA replacement ratio, the slab type, the size of the composite beam, the long-term loading, and the ambient relative humidity could affect the time-dependent behavior of composite beams. However, no design procedures are available to predict the time-dependent behavior of composite beams.
The long-term deflection (
δtot) of composite beams is composed of instantaneous deflection (
δinst), deflection due to the creep effect (
δcr), and deflection due to the shrinkage effect (
δsh) as follows:
Generally, the instantaneous and creep deflections are calculated following the elastic analysis principle, using a reduced stiffness (
B) to consider the influence of the slip, and employing the effective modulus method to account for the creep effect. For example, the instantaneous and creep deflections of a simply supported composite beam under a uniformly distributed loading (
q) is calculated by:
where
q is the long-term loading,
L indicates the span of the composite beams, and
B represents the reduced stiffness considering the slip effect in the composite beams with the partial shear connection.
Some international specifications have been recommended for shrinkage deflection, including the shrinkage deformation of concrete, e.g., 150 × 10
–6 or 200 × 10
–6 for GB 50017 [
43] and 300 × 10
–6 for EC 4 [
44]. It is worth noting that only the uniform shrinkage distribution was included while the nonuniform shrinkage distribution due to the impermeable steel deck was neglected. In this manner, the deflection due to shrinkage was presented through the shrinkage curvature (
ξsh):
As shown in
Figure 22,
εsh is the shrinkage deformation at the centroidal axis of the floor slab; it is the uniform shrinkage for the RC slab and is estimated by the nonuniform shrinkage model for the composite slab;
Acf denotes the cross-sectional area of the floor slab;
dsh represents the distance between the centroidal axial of the slab and the centroidal axial of the composite beams; and
Esh indicates the elastic modulus of the concrete considering the shrinkage effect and is calculated according to EC 4 [
44], as expressed in Equation (38):
For the composite beams with the RC slabs, φ is the creep coefficient calculated using the ambient relative humidity. In contrast, for the composite beams with the composite slabs, φ is the equivalent creep coefficient using the average of the ambient relative humidity and the humidity at the bottom surface of the composite slabs. It is worth mentioning that the shrinkage effect is considered via the external action instead of the internal action.
Equations (35)–(38) calculated the deflections of the composite beams.
Figure 23 compares the calculated and numerical deflections of the composite beams at different RCA replacement ratios. It is evident that the design procedures this study proposed could reasonably predict the long-term deflection of composite beams. The mean value of the calculated/numerical long-term deflection of the composite beams was 98.6%, 97.1%, and 96.1% at an RCA replacement ratio of 0%, 50%, and 100%, respectively. The standard deviation of the calculated/numerical long-term deflection of the composite beams was 0.191, 0.198, and 0.194 at an RCA replacement ratio of 0%, 50%, and 100%, respectively.


