
Finite Element Modelling of Bolt Shear Connections in Prefabricated Steel Lightweight Aggregate–Concrete Composite Beams


Abstract
:1. Introduction
2. FE Modelling
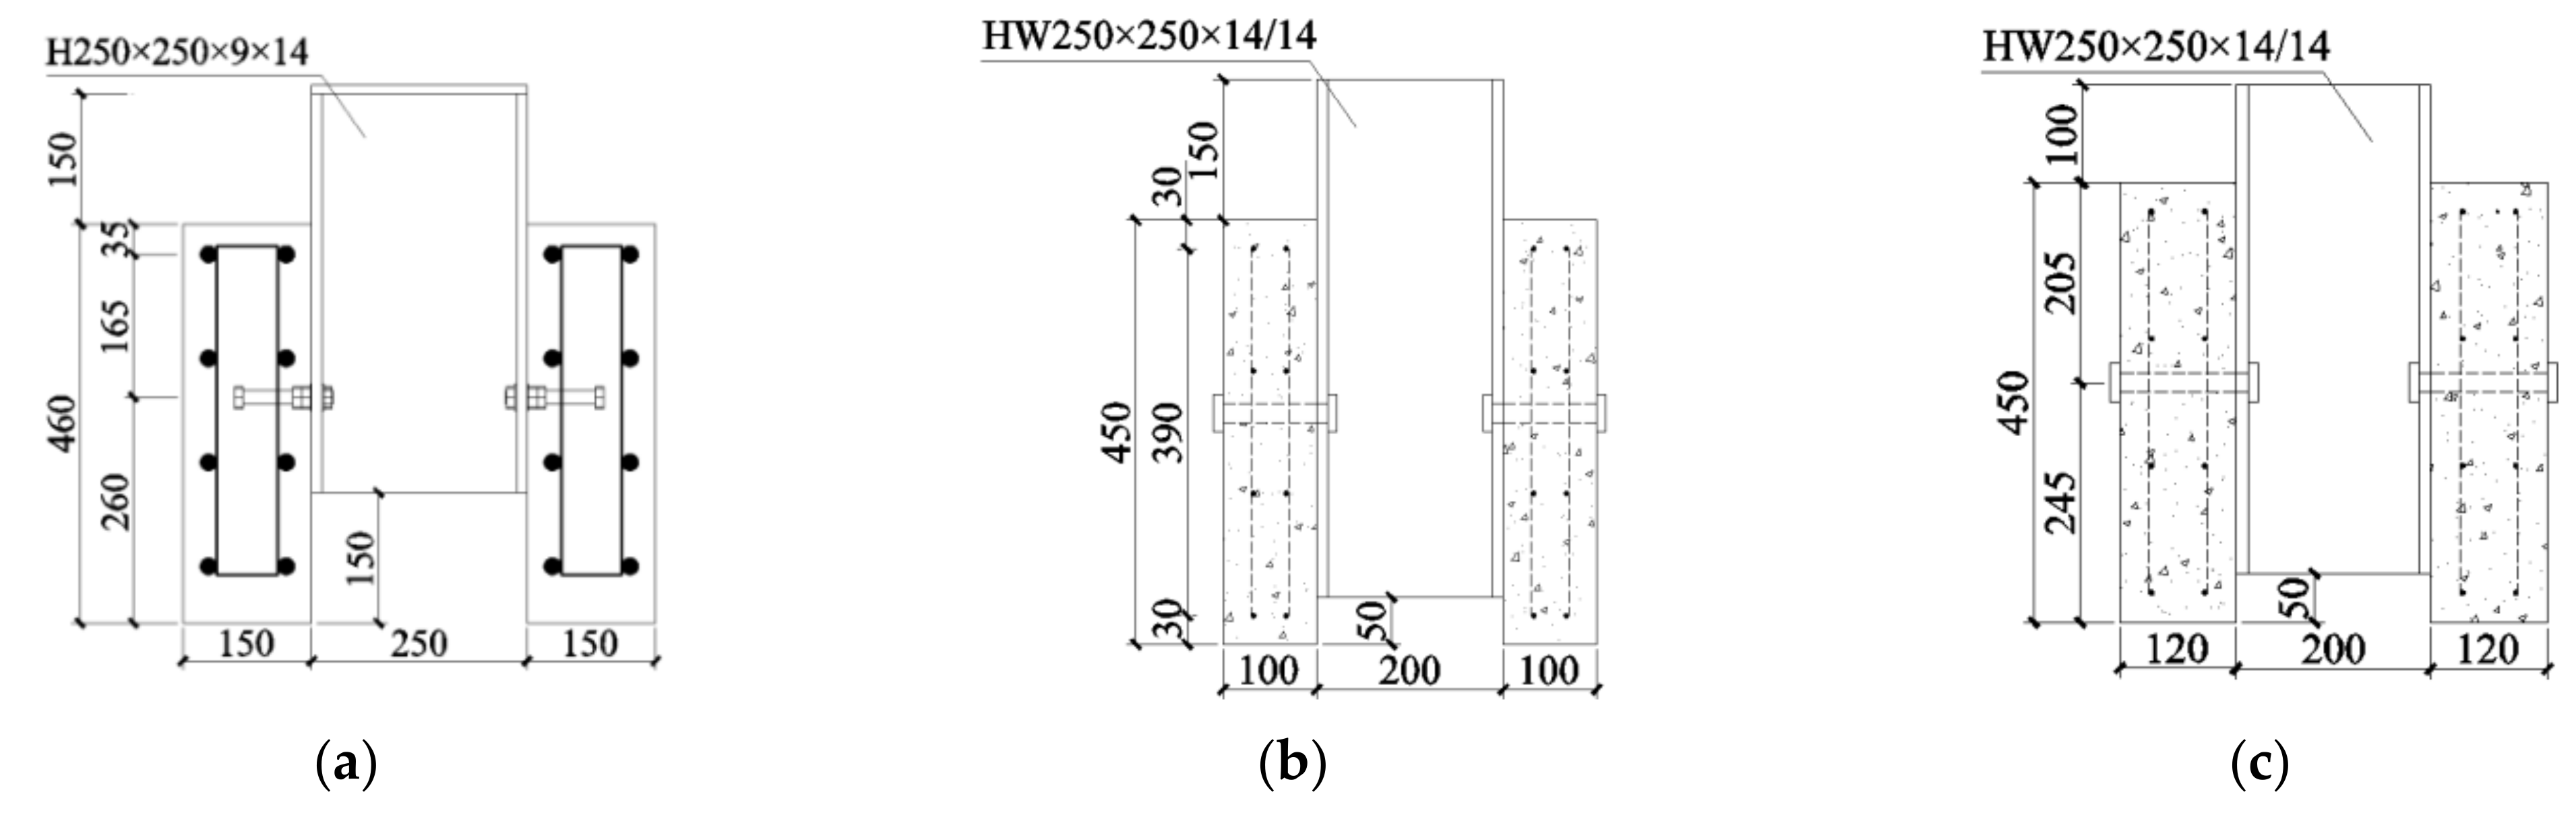
2.1. Model Geometry
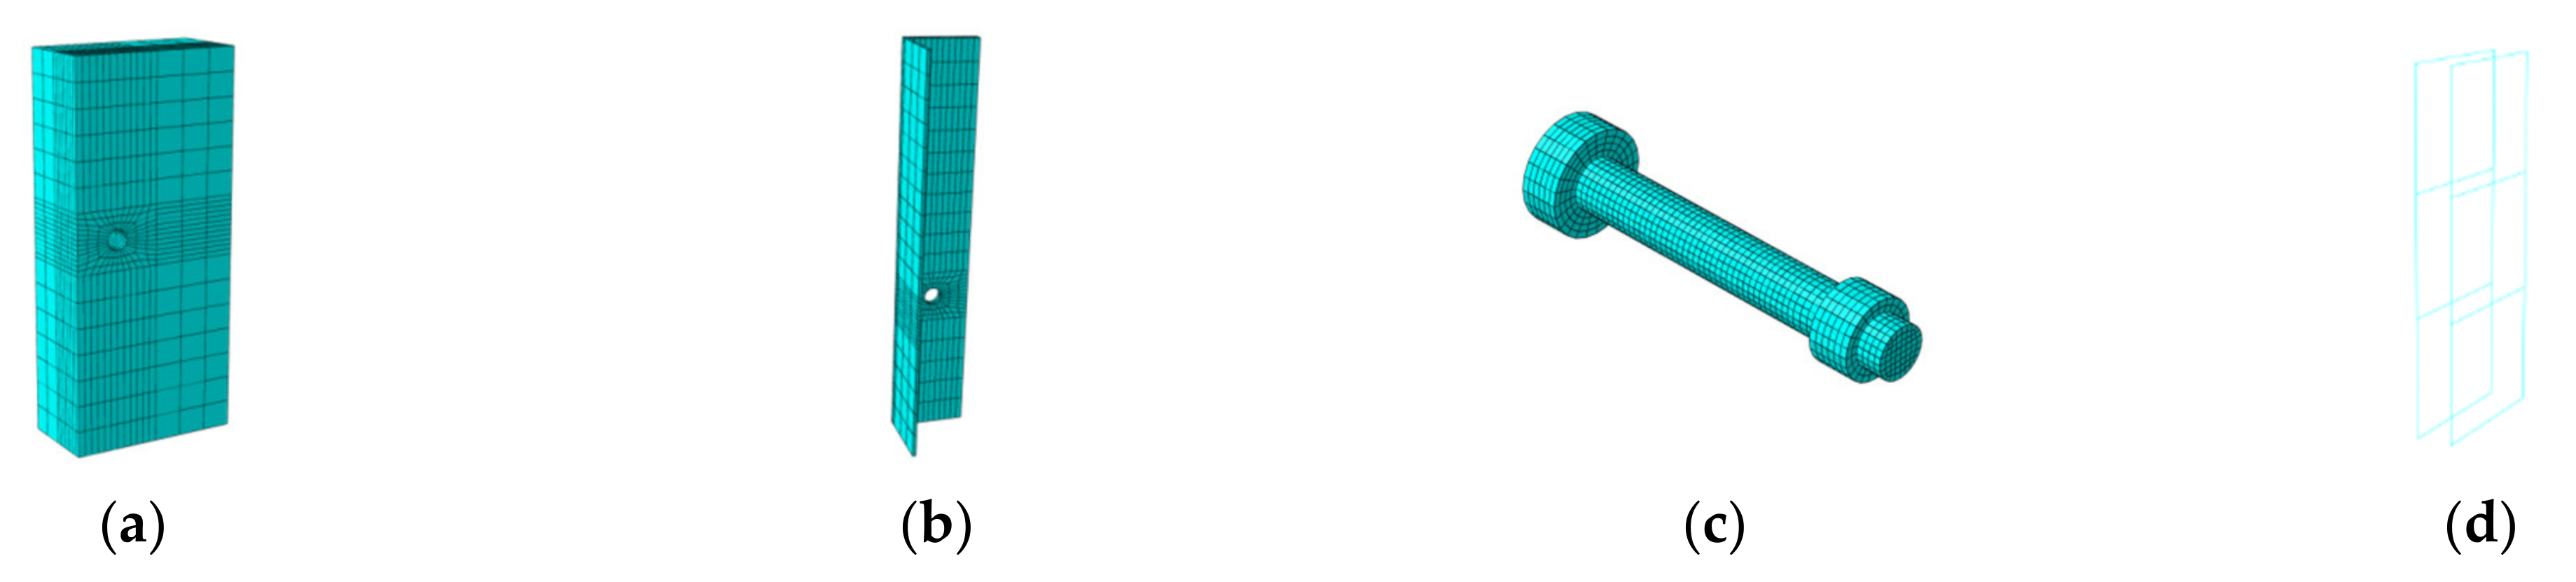
2.2. FE Type and Mesh
2.3. Material Properties
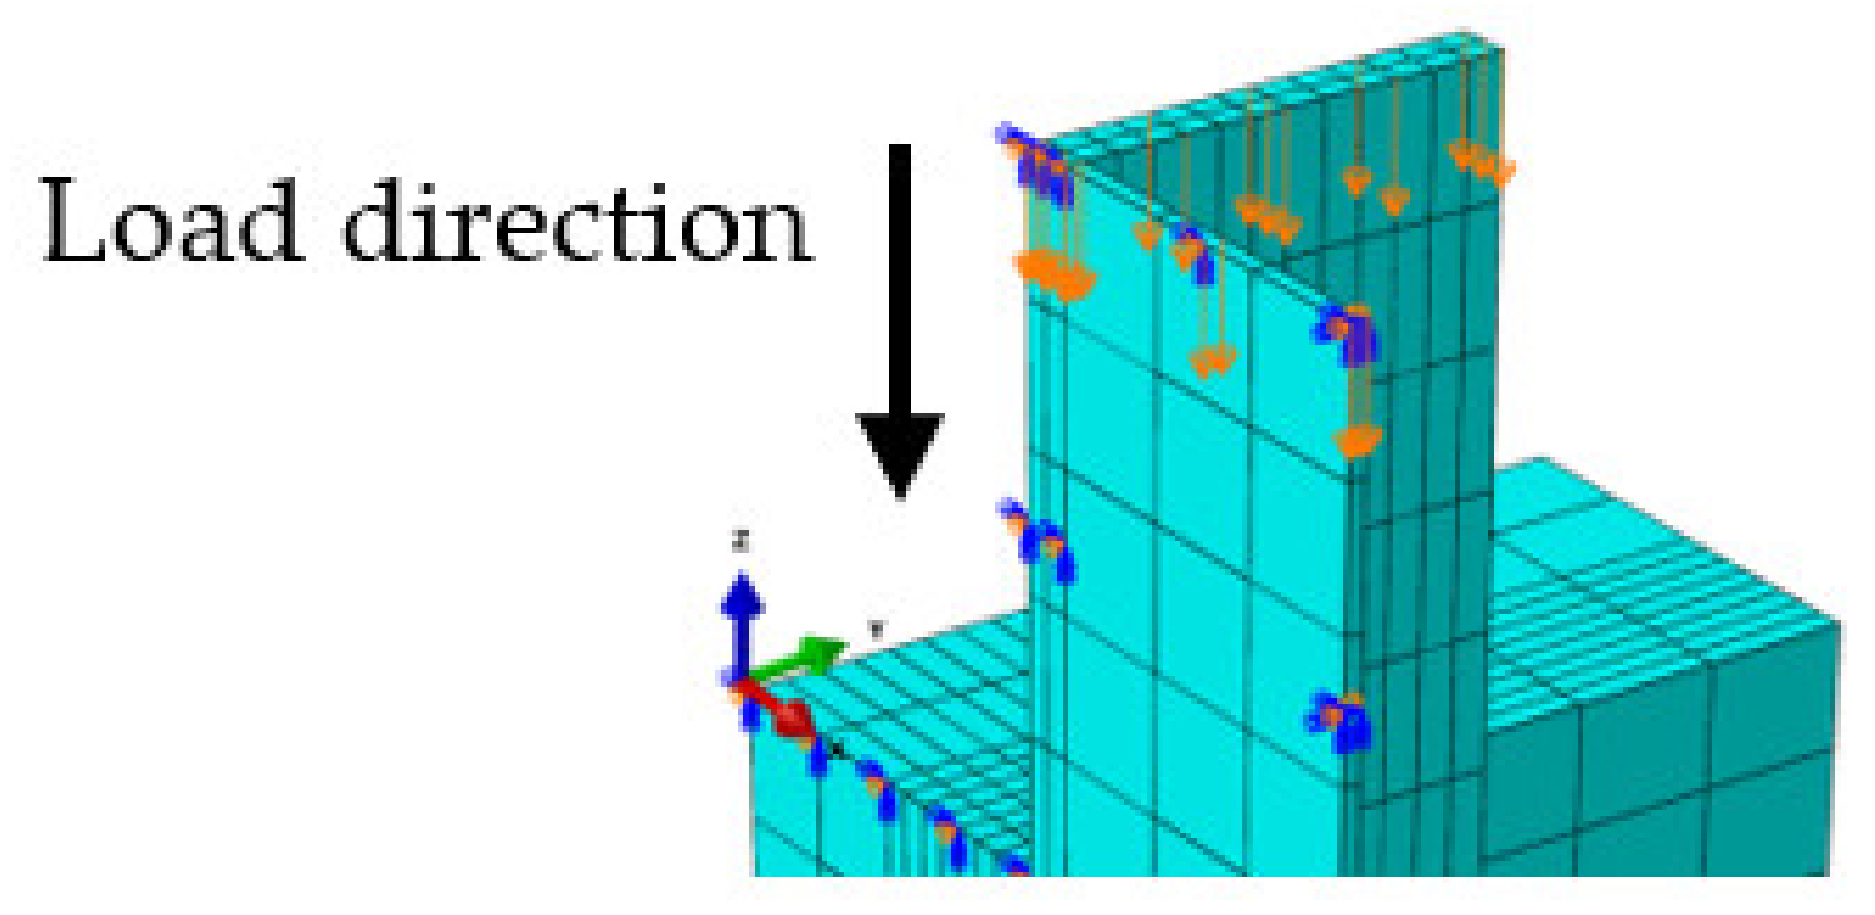
2.4. Boundary and Loading Conditions
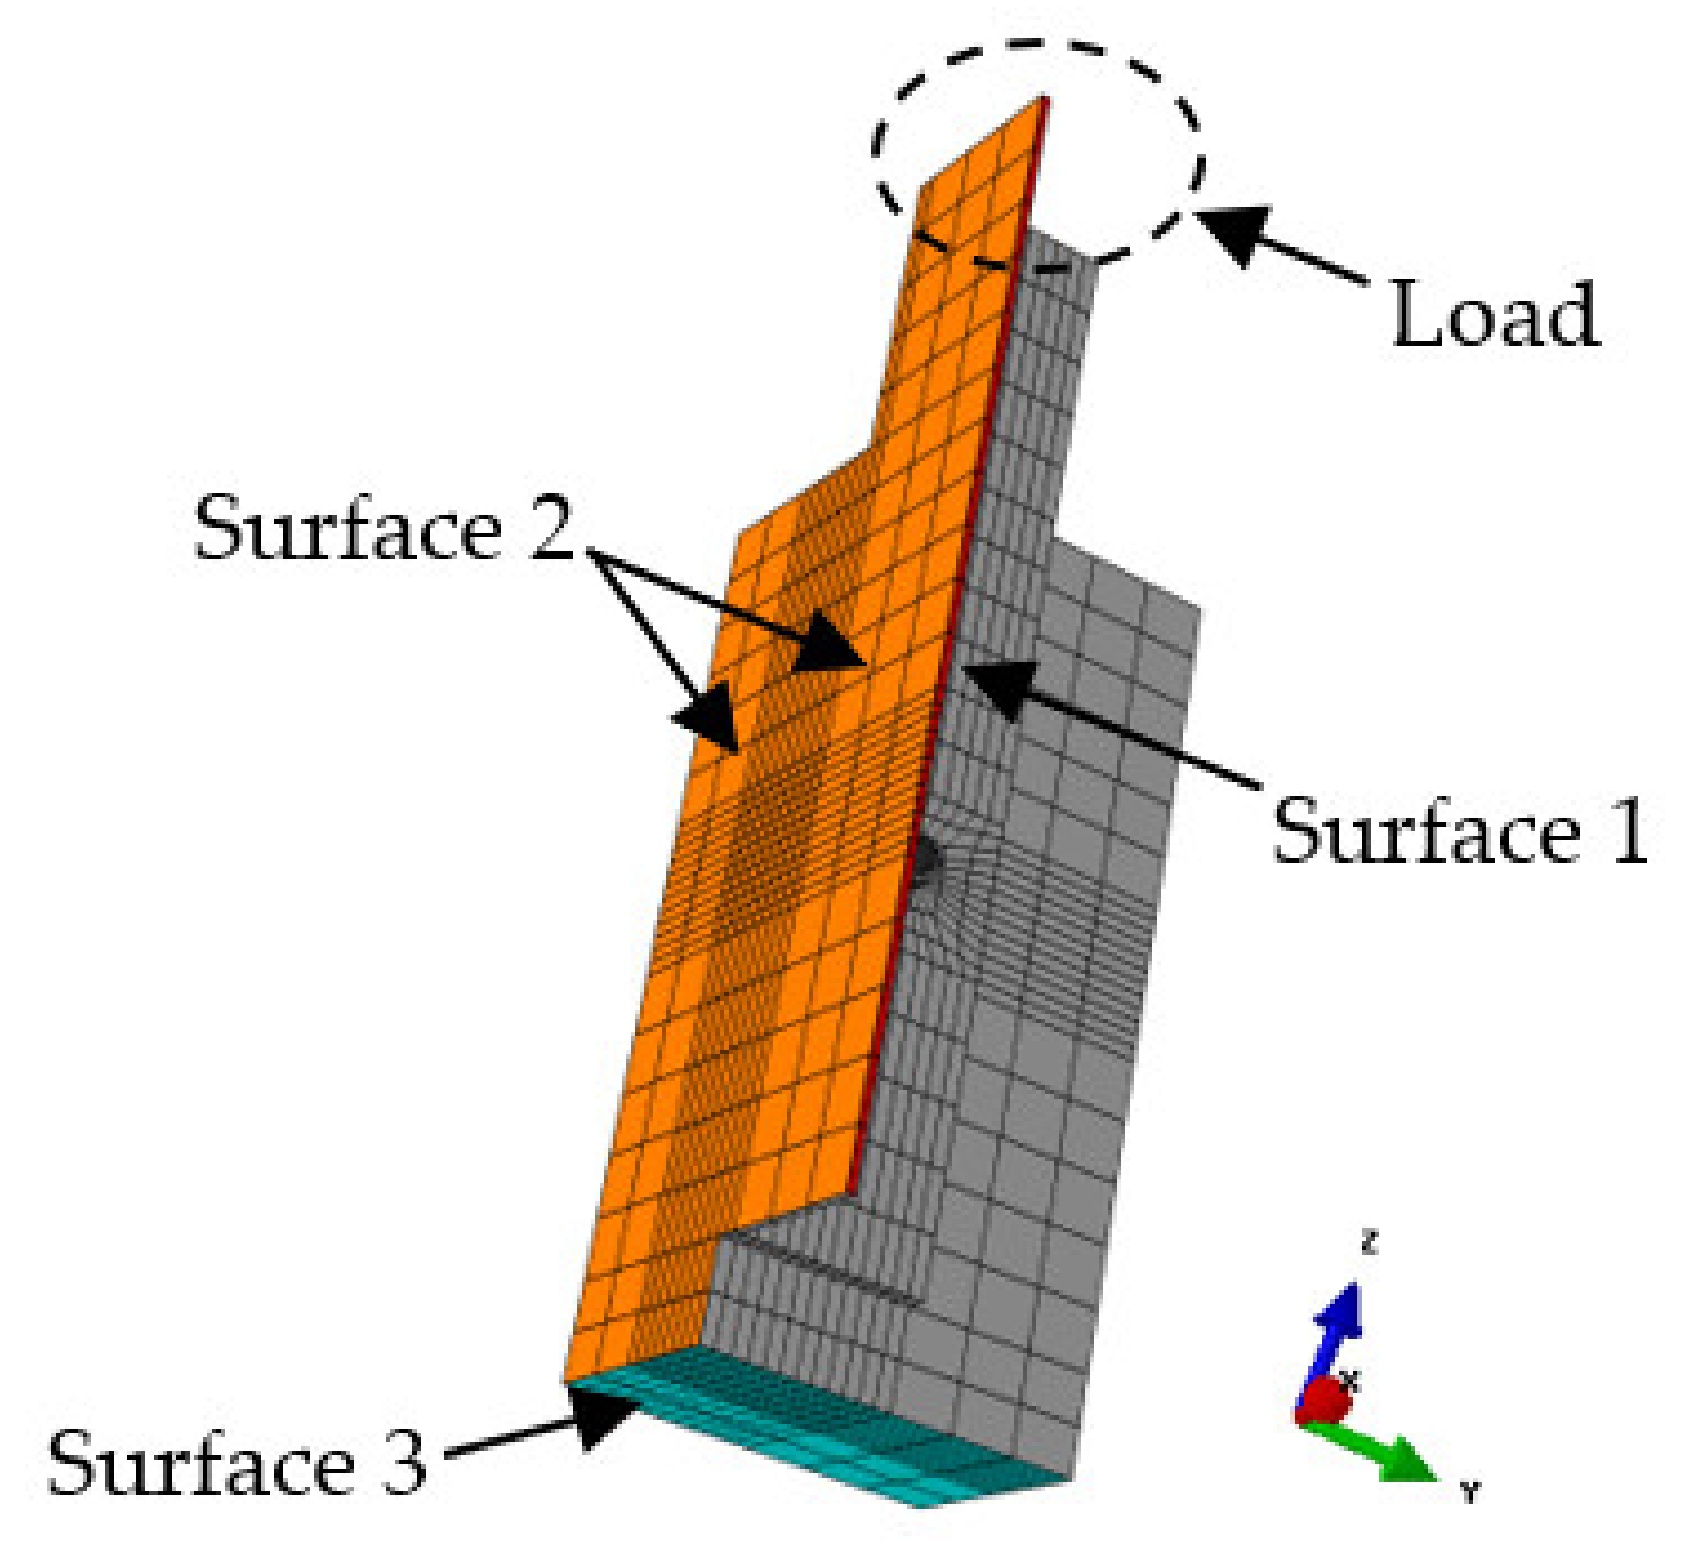
2.5. Interaction and Constraint Conditions
3. Calibration and Validation of FE Model
3.1. Calibration of FE Model
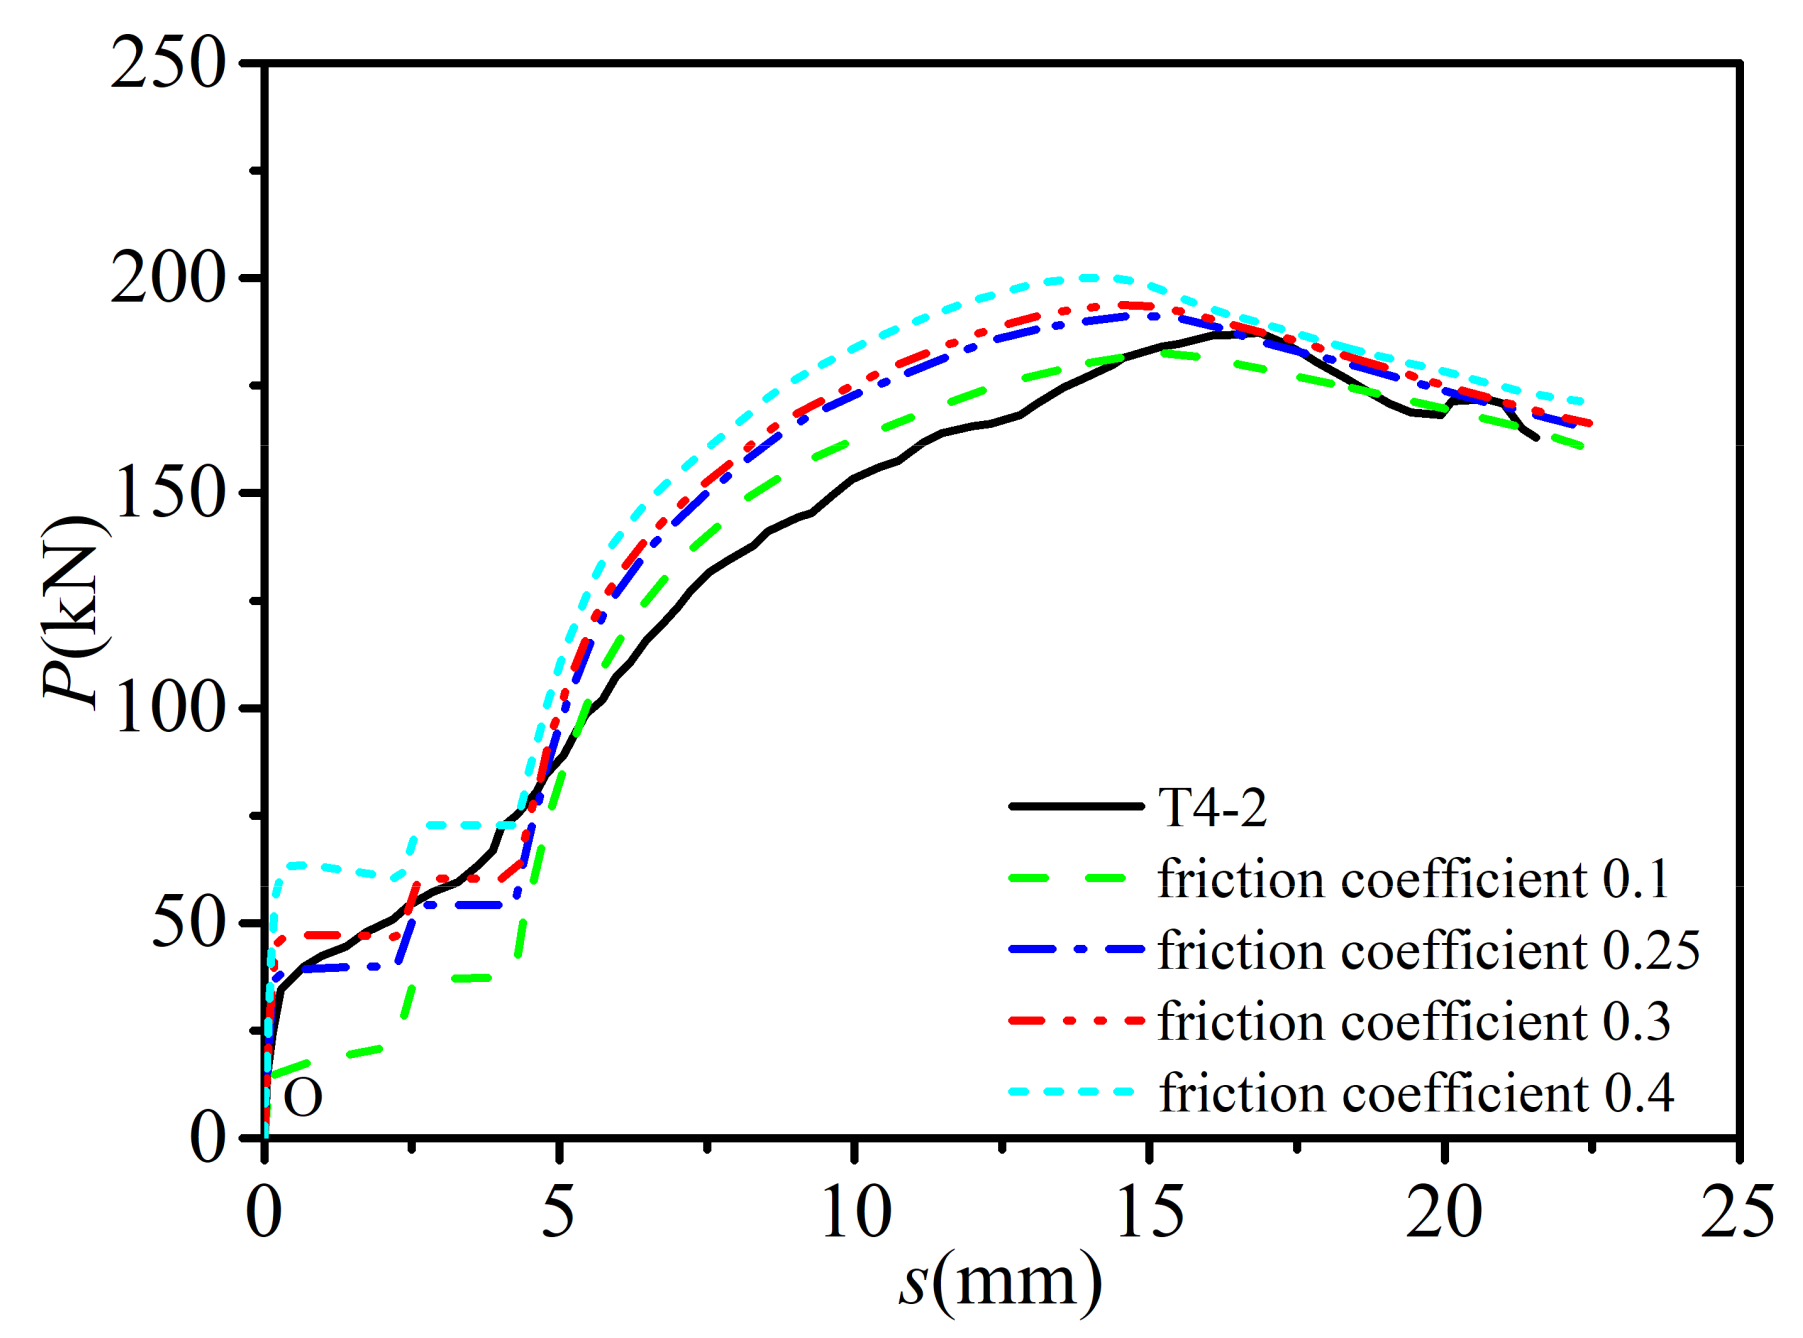
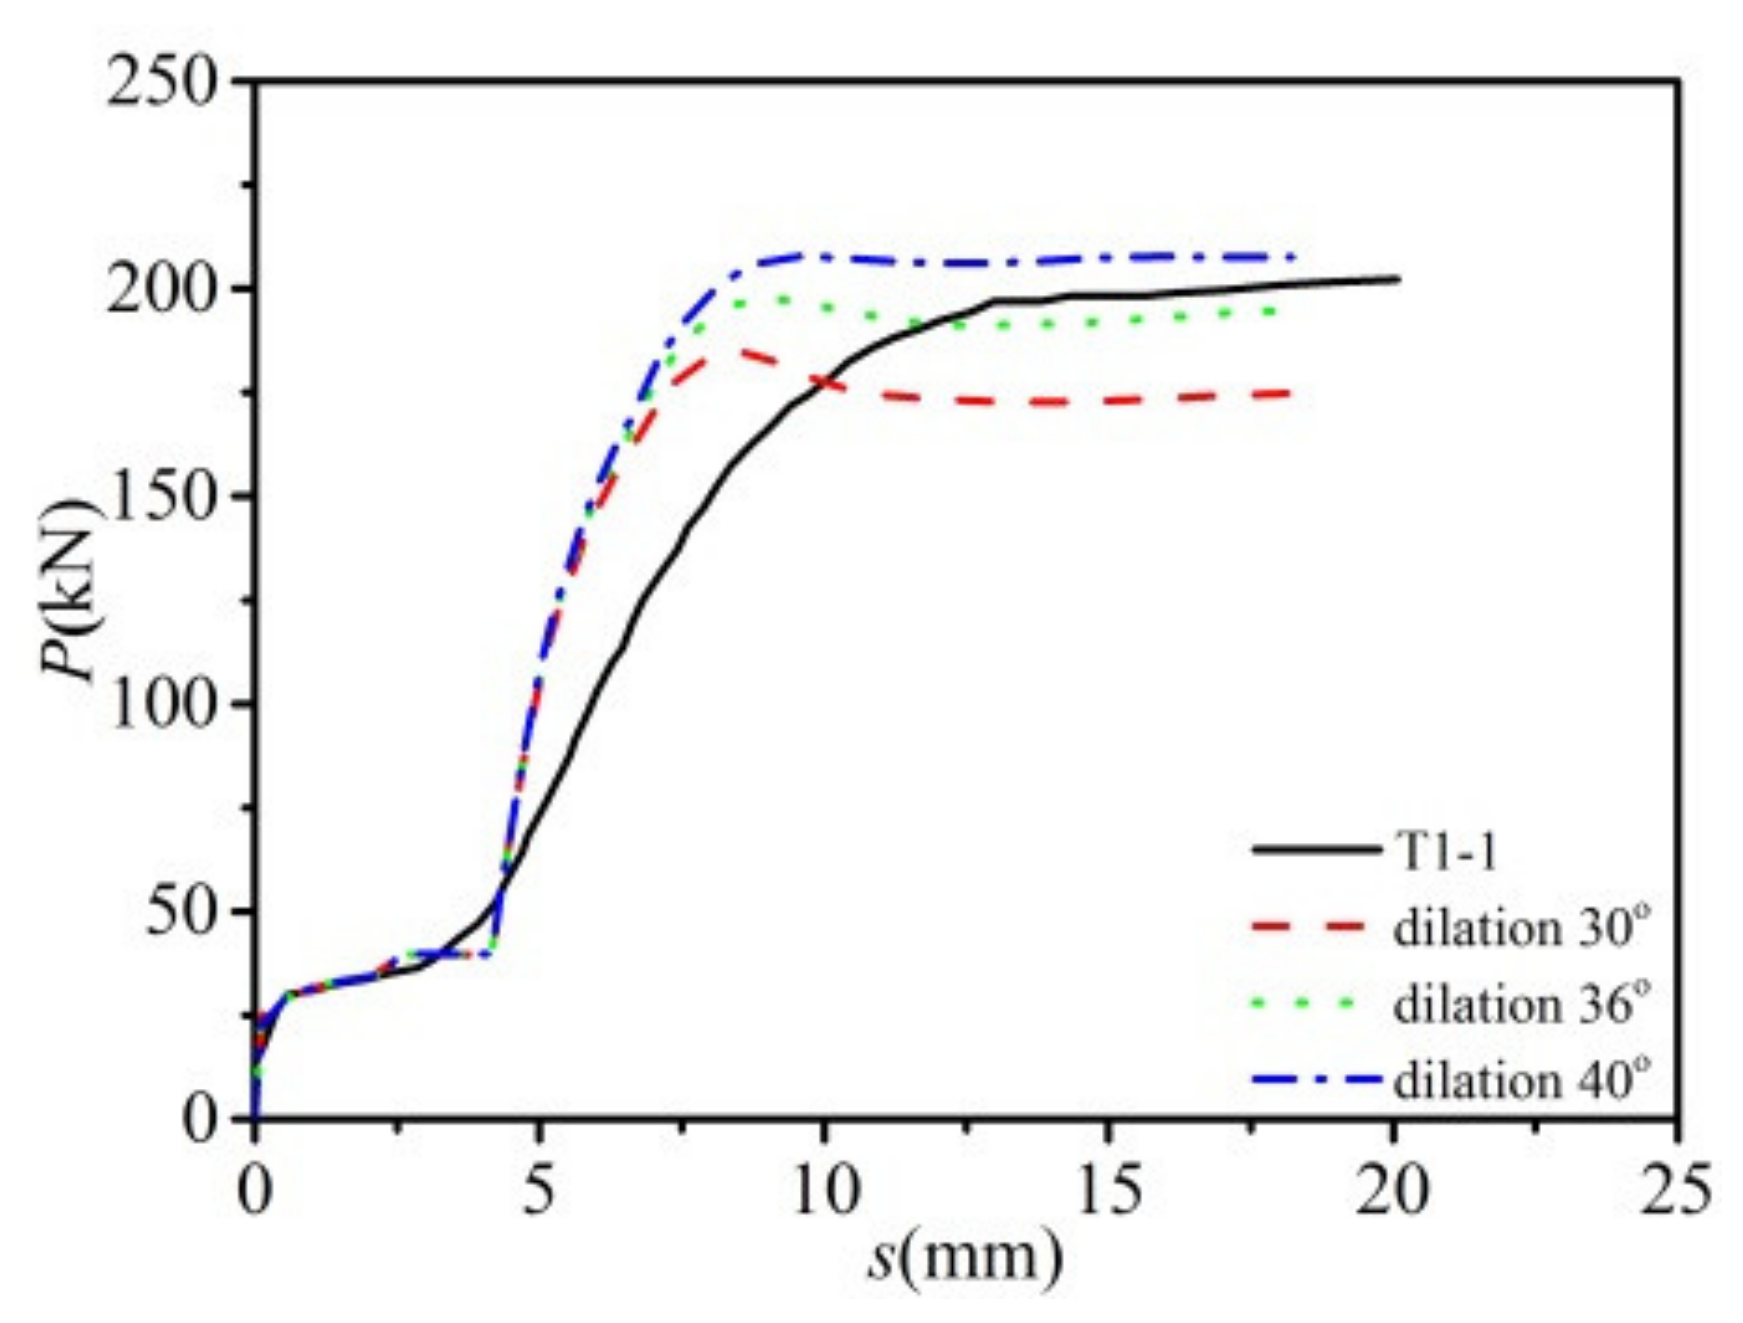
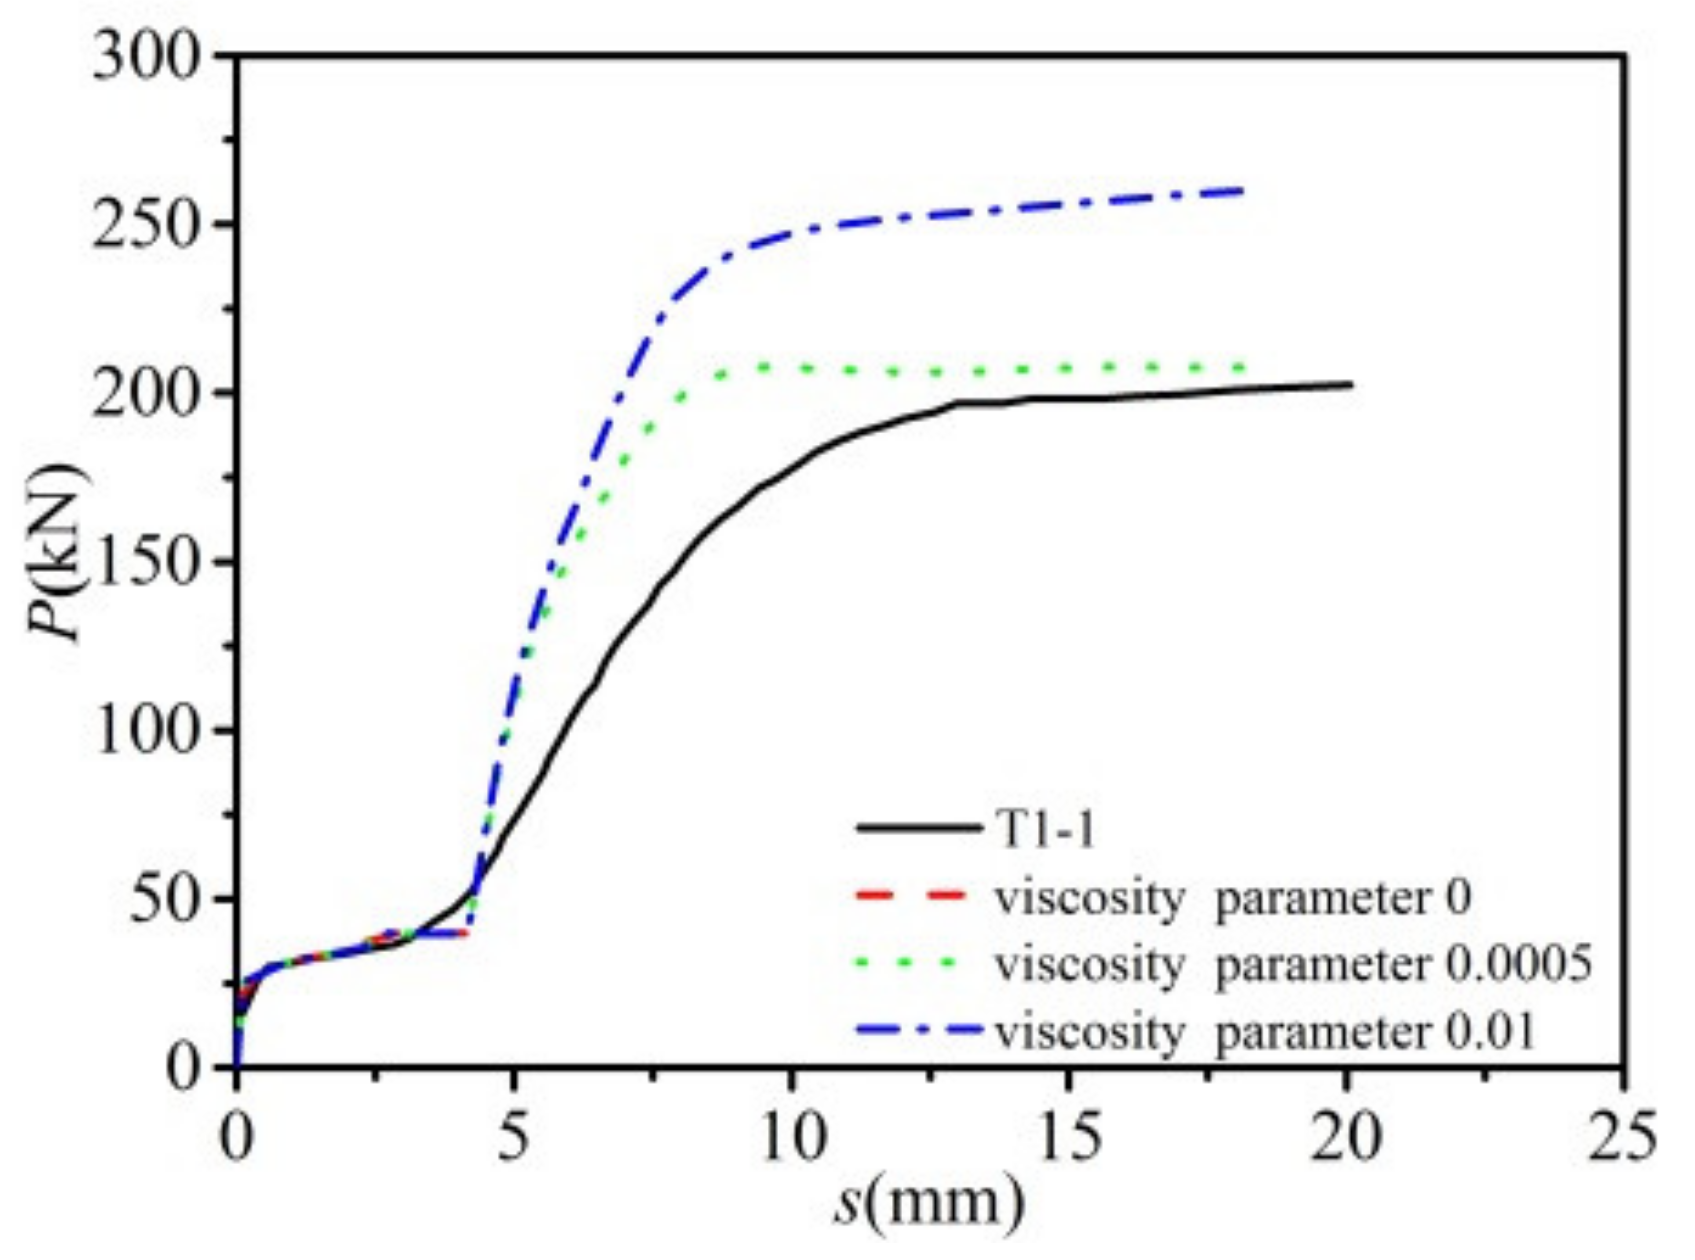
3.2. Effect of Key Plastic CDP Parameters
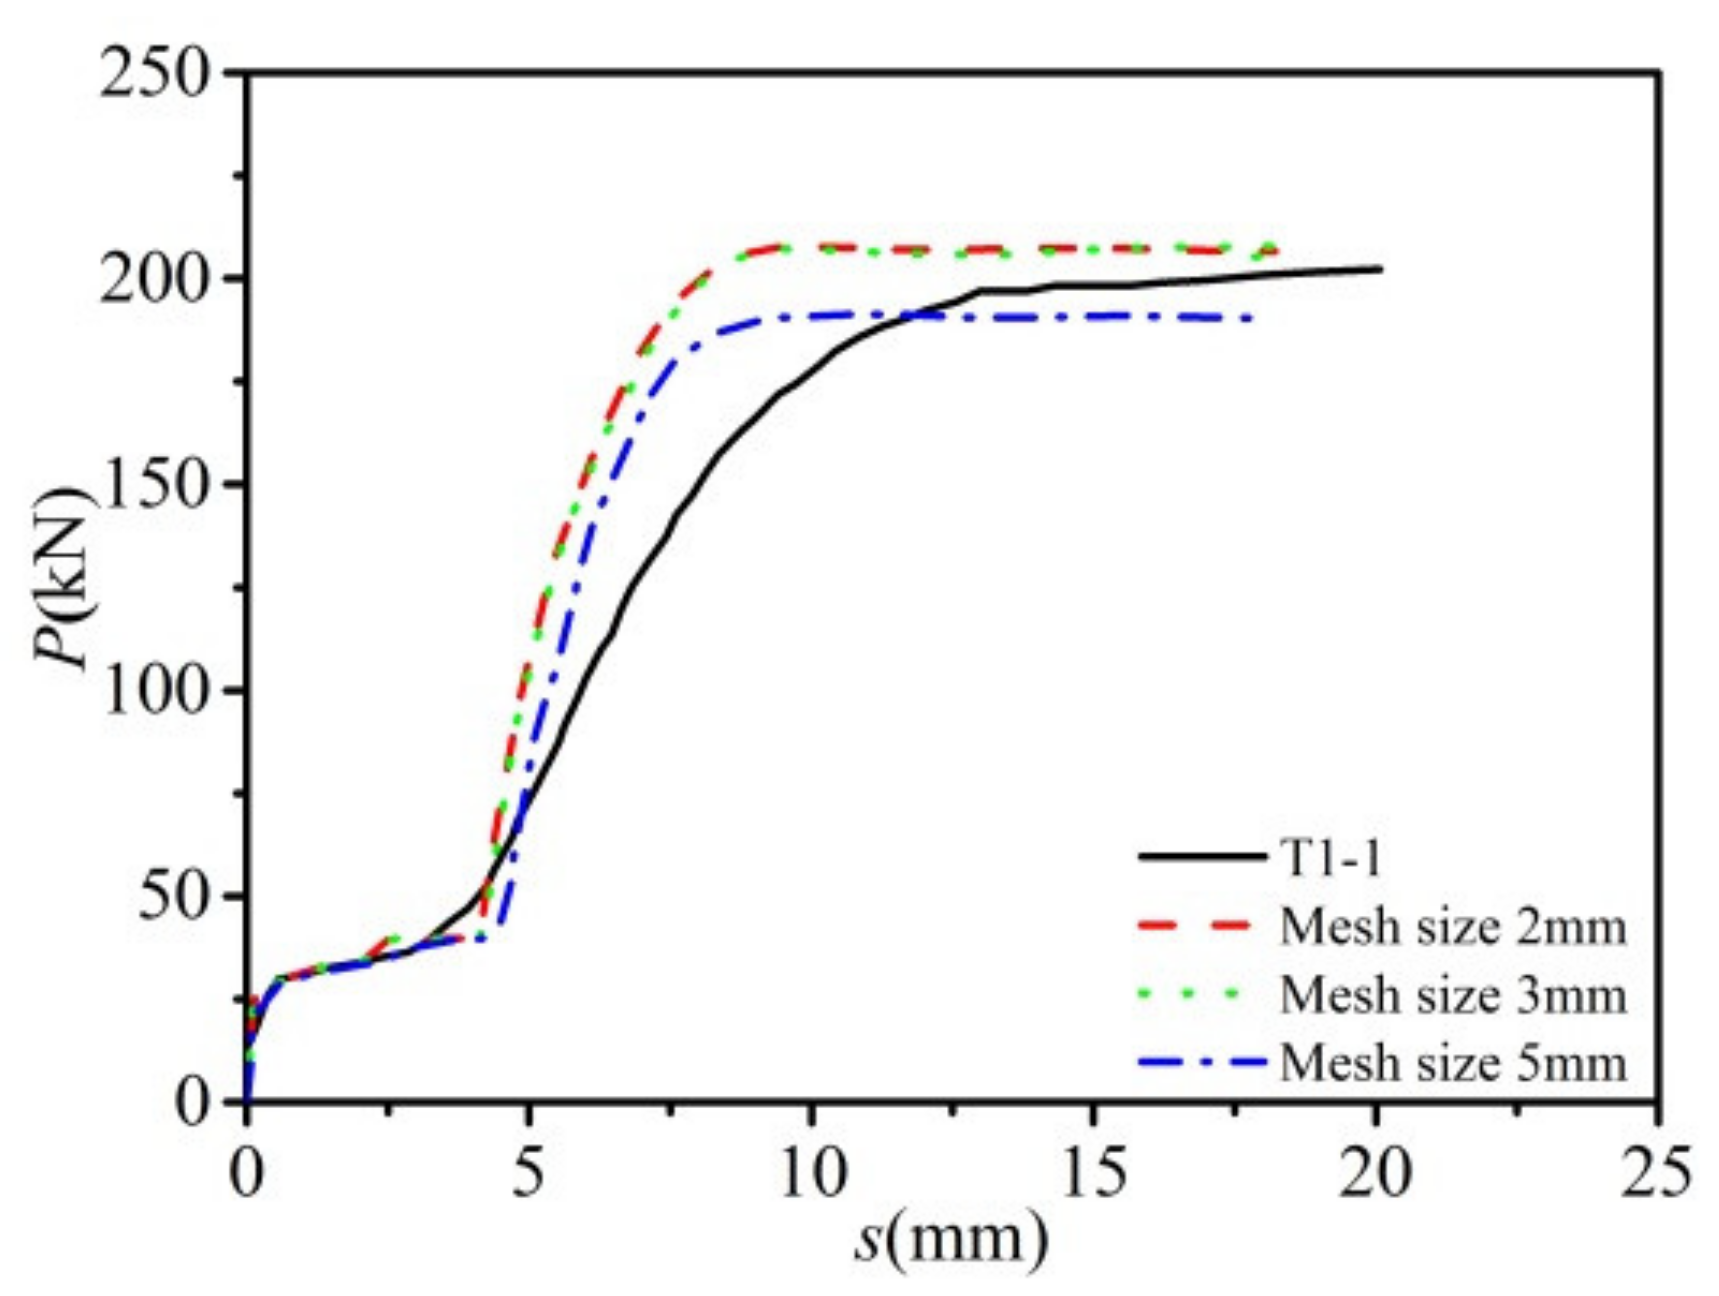
3.3. Effect of Mesh Dependency
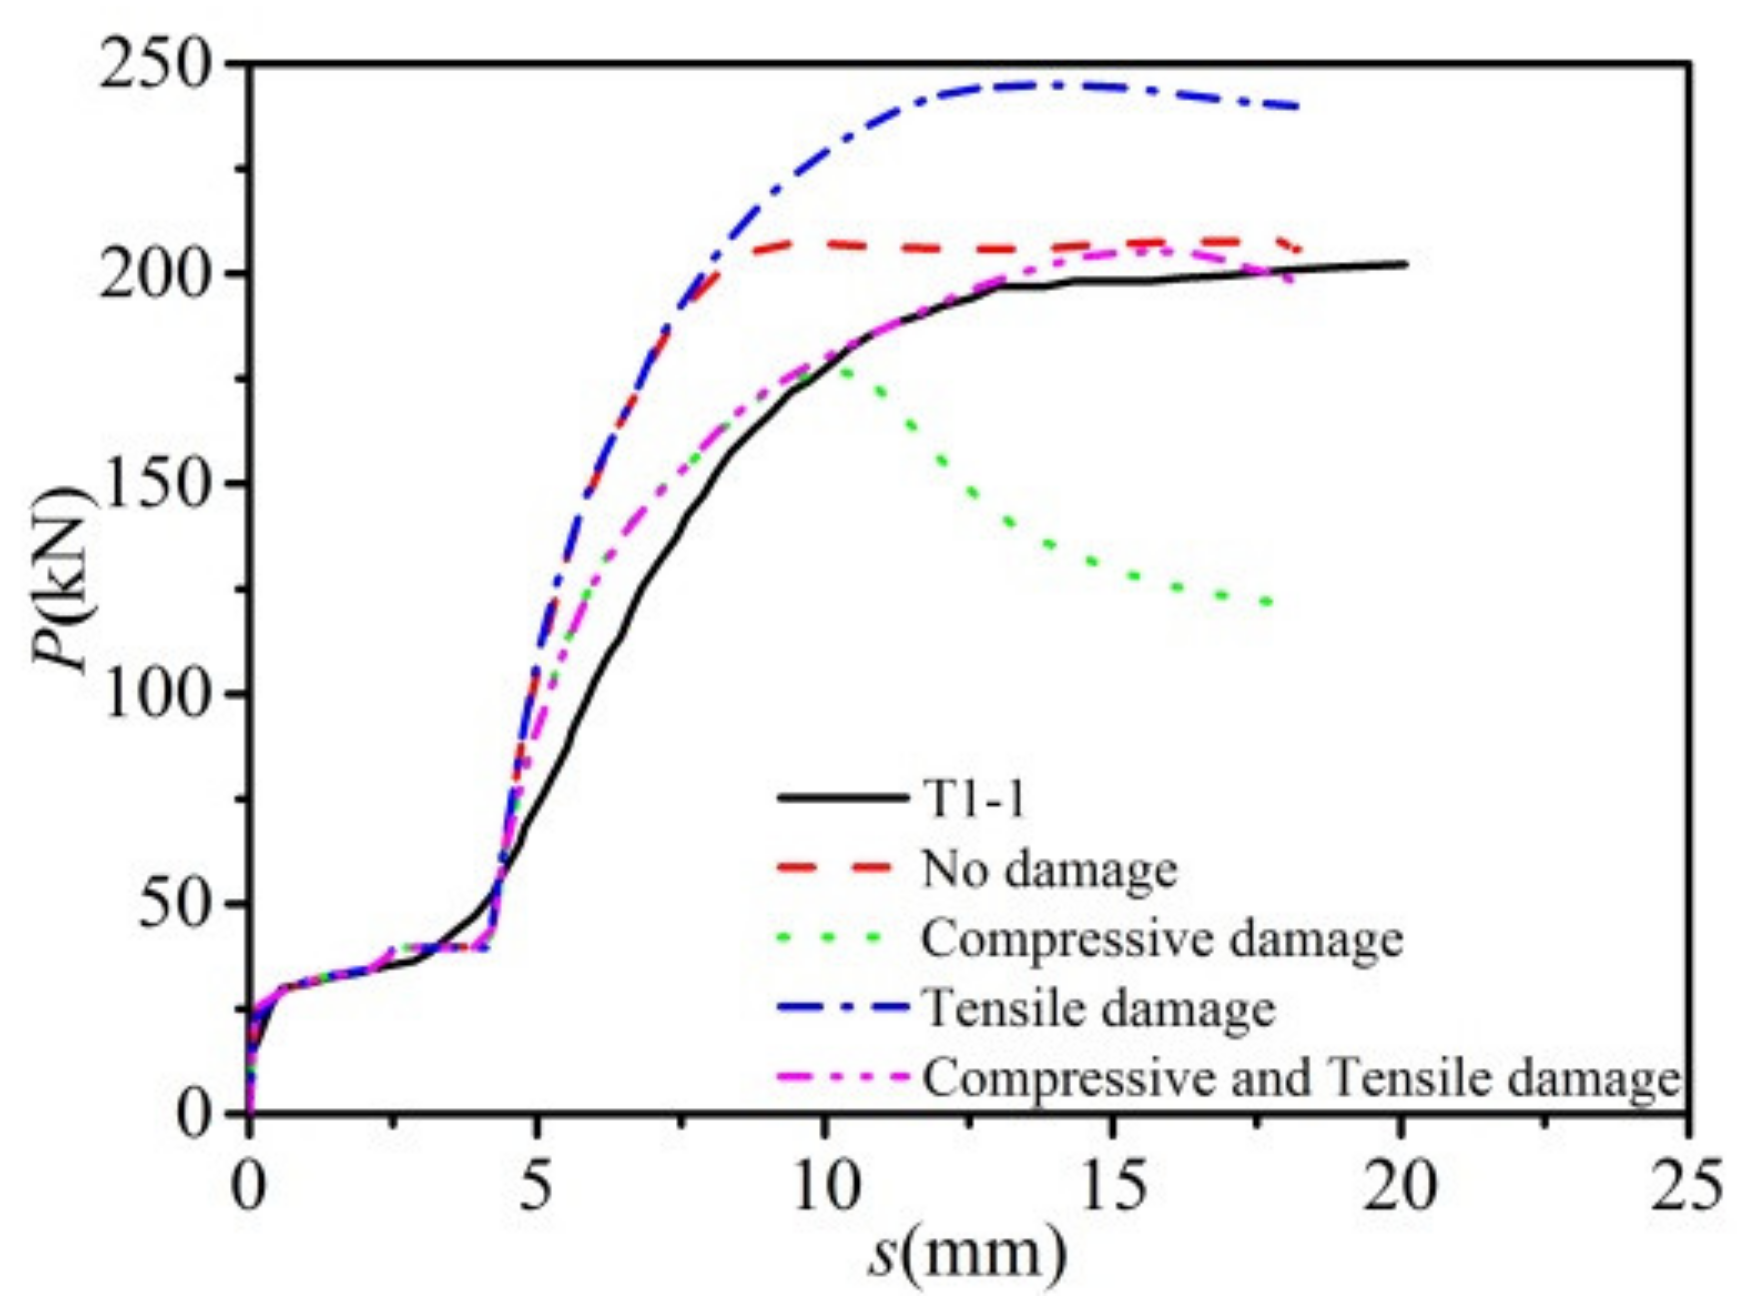
3.4. Effect of Damage Variables
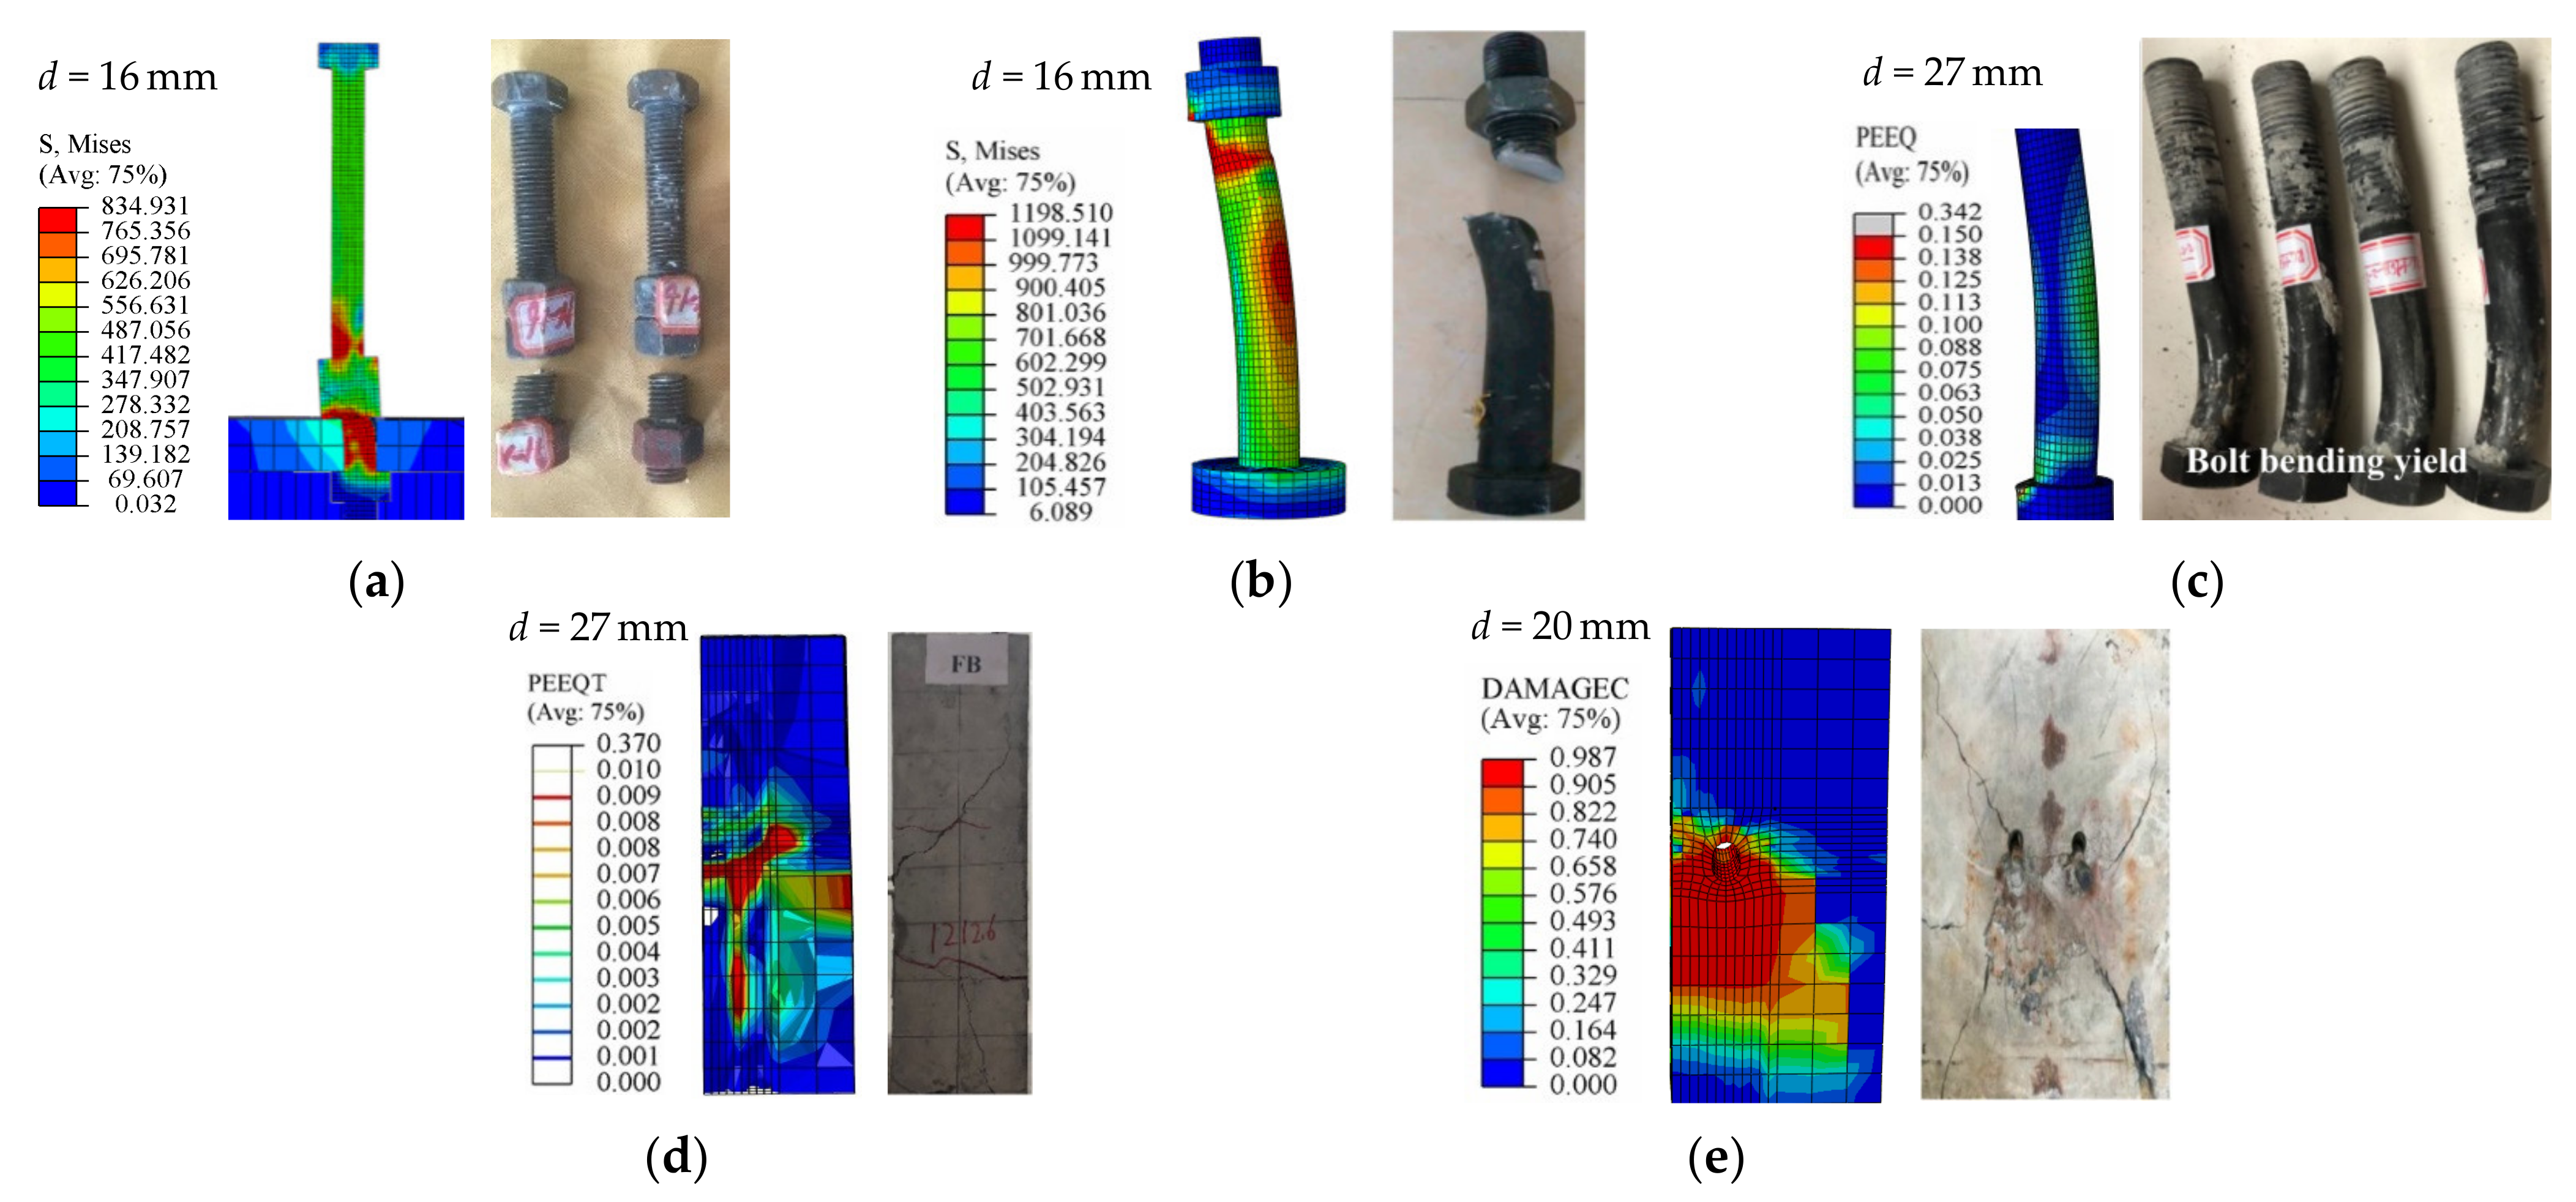
3.5. Verification of FE Modelling
4. Shear Behavior of Bolted Connector in LAC
4.1. FE Modelling
4.2. Results and Discussion
4.3. Parametric Study
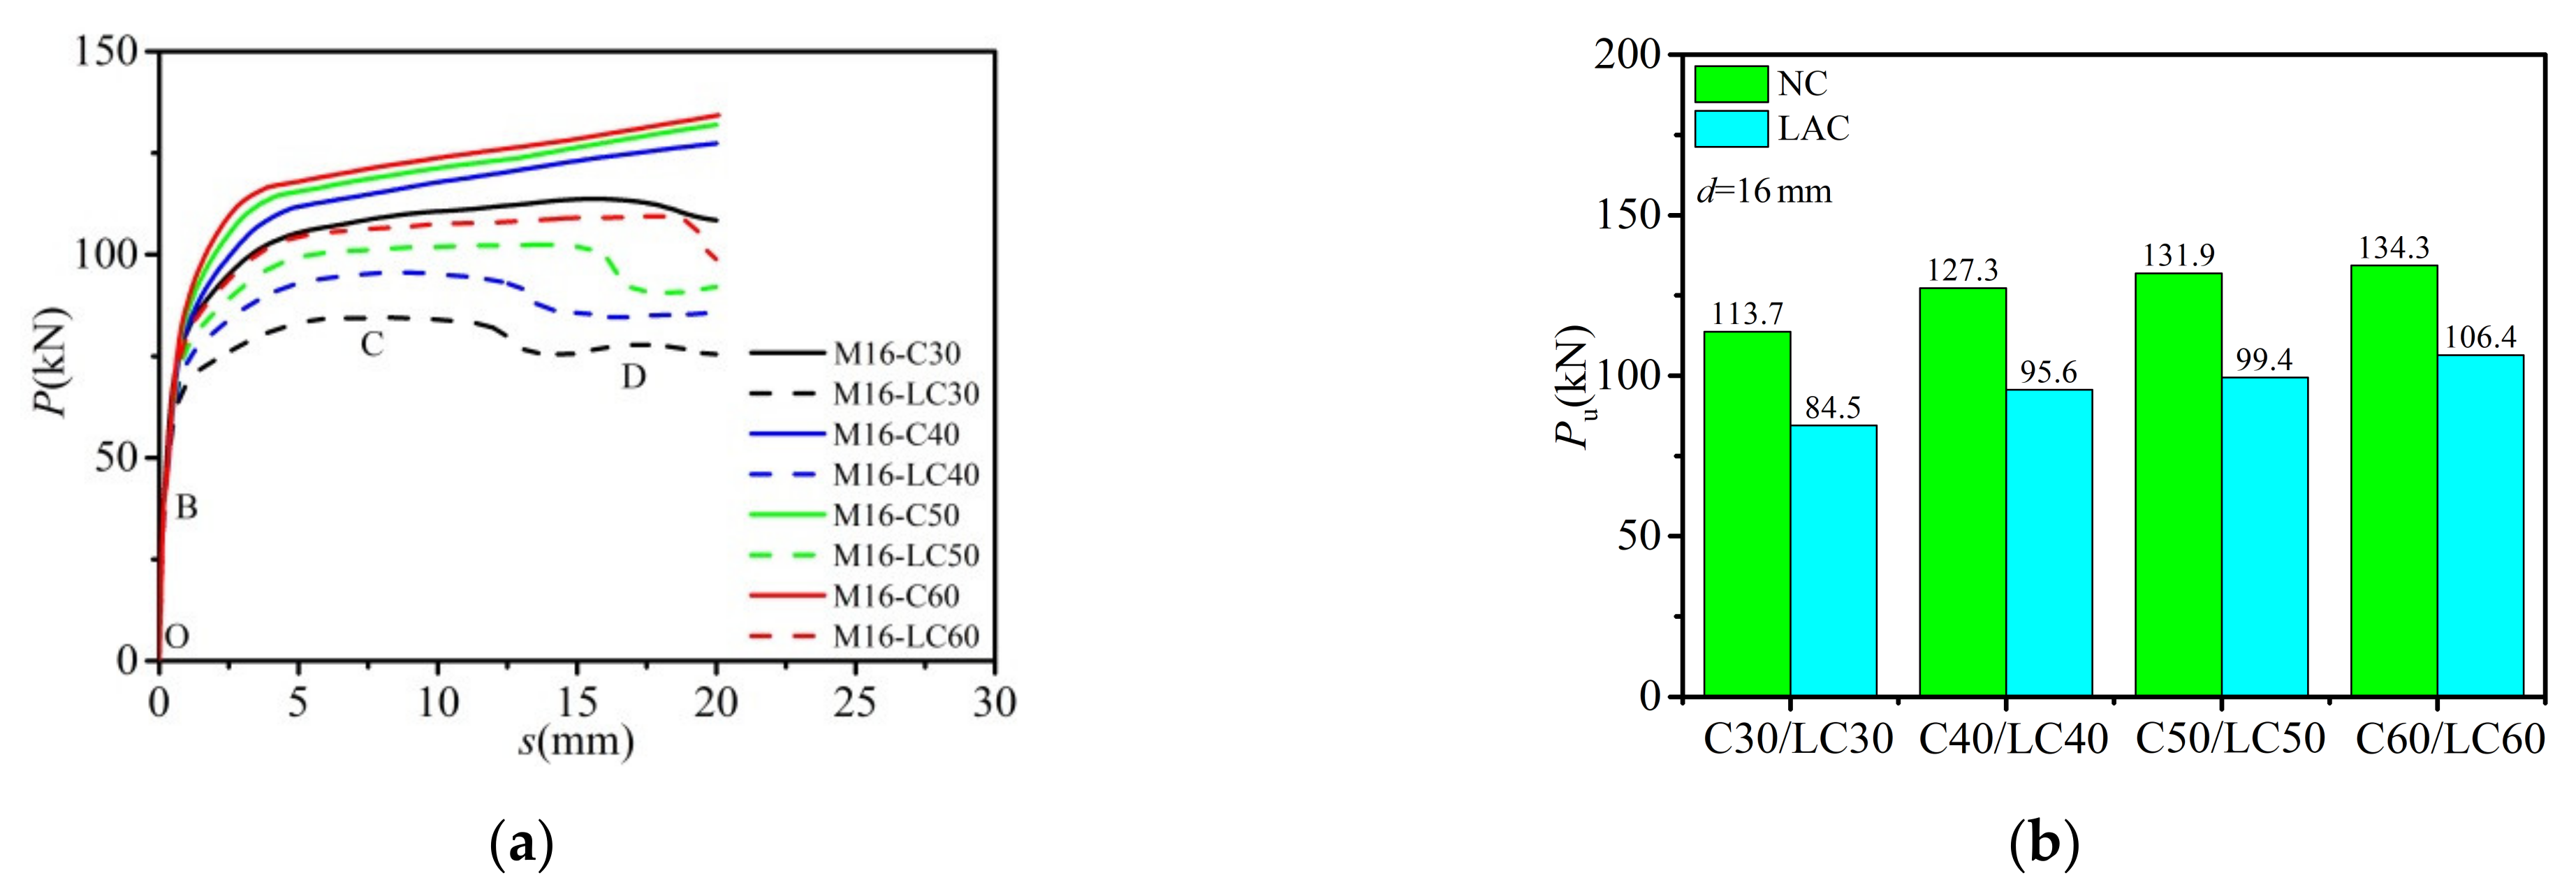
4.3.1. Effect of Concrete Strength
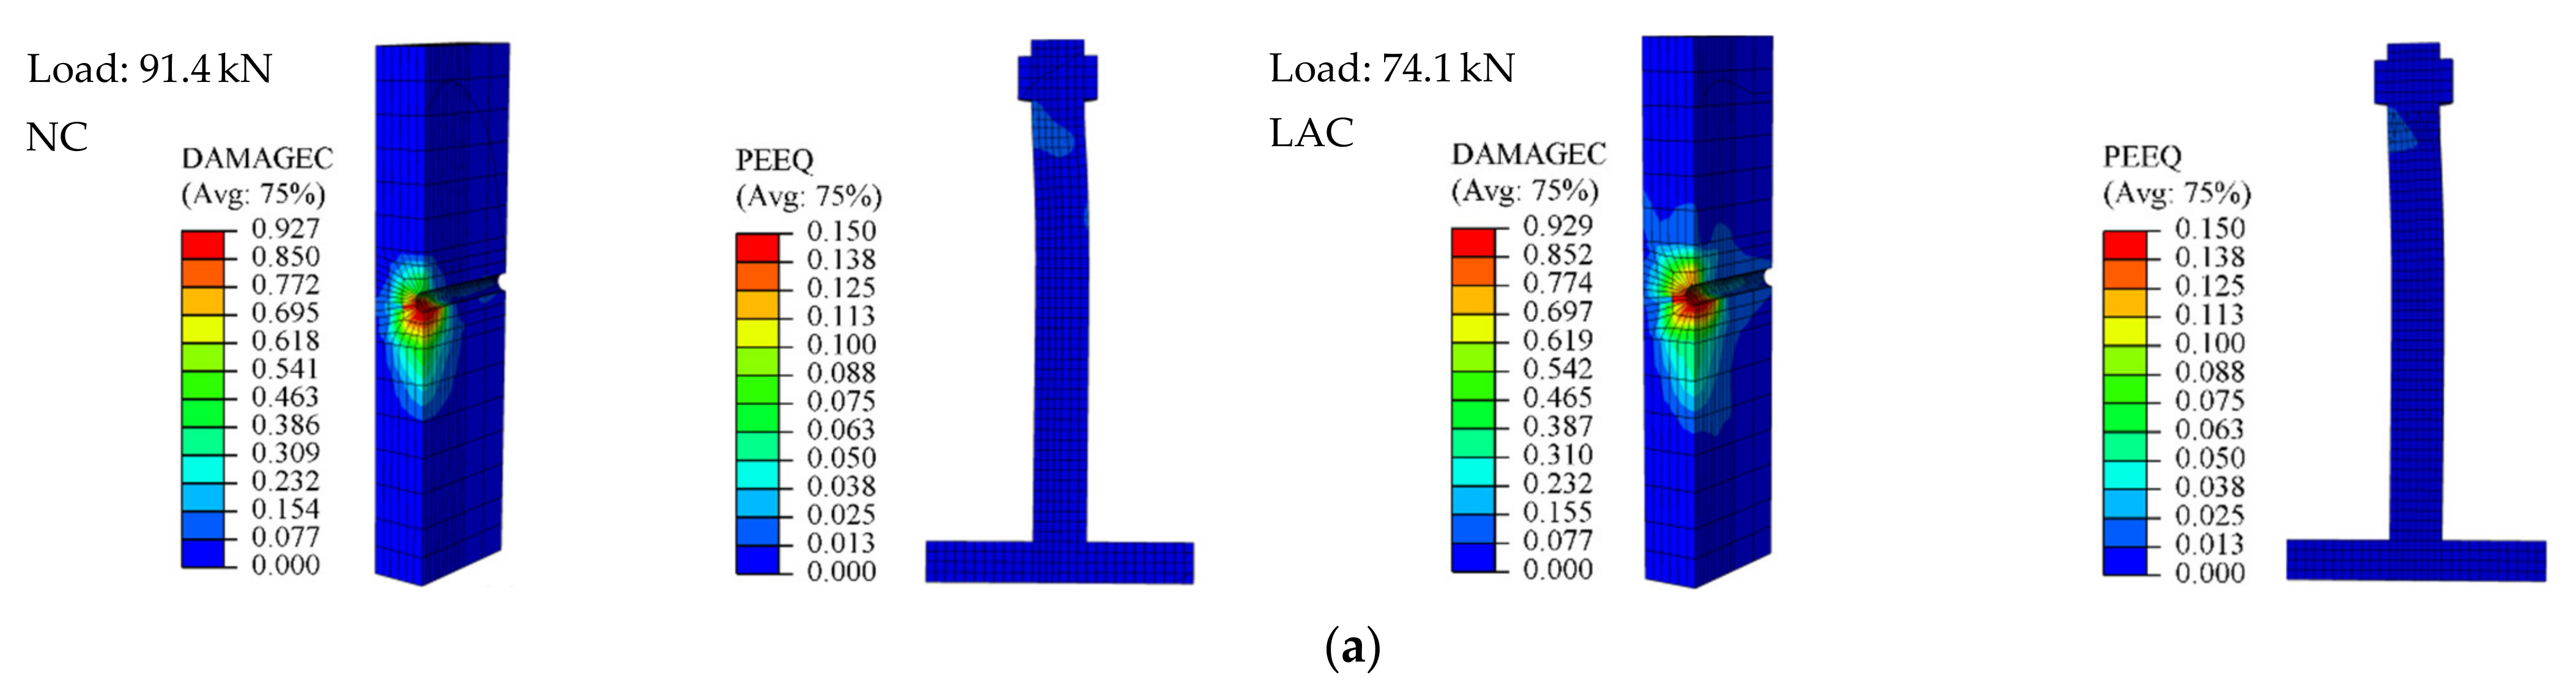
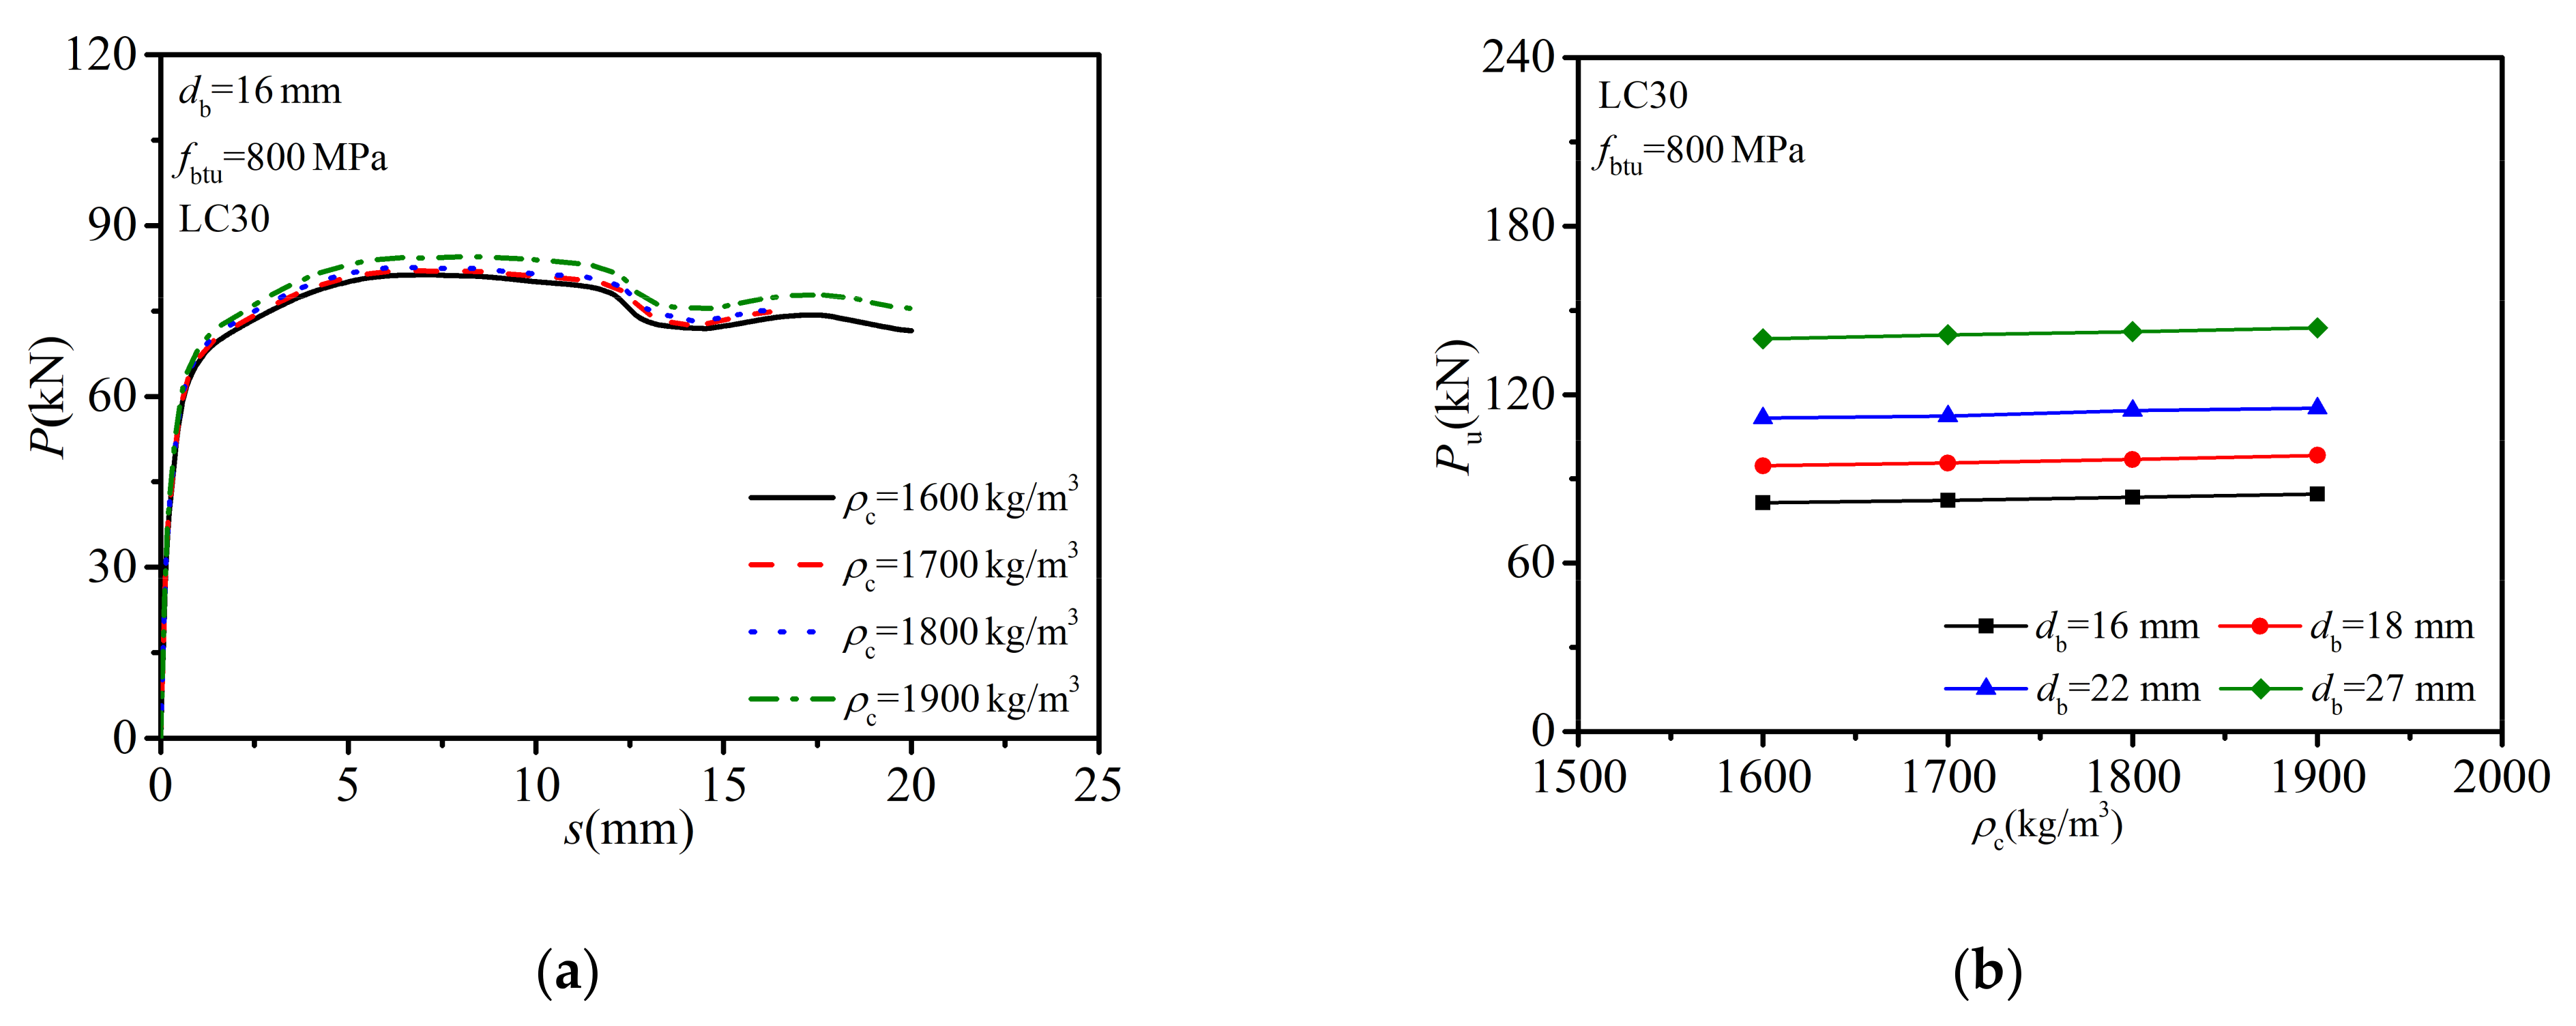
4.3.2. Effect of Concrete Density
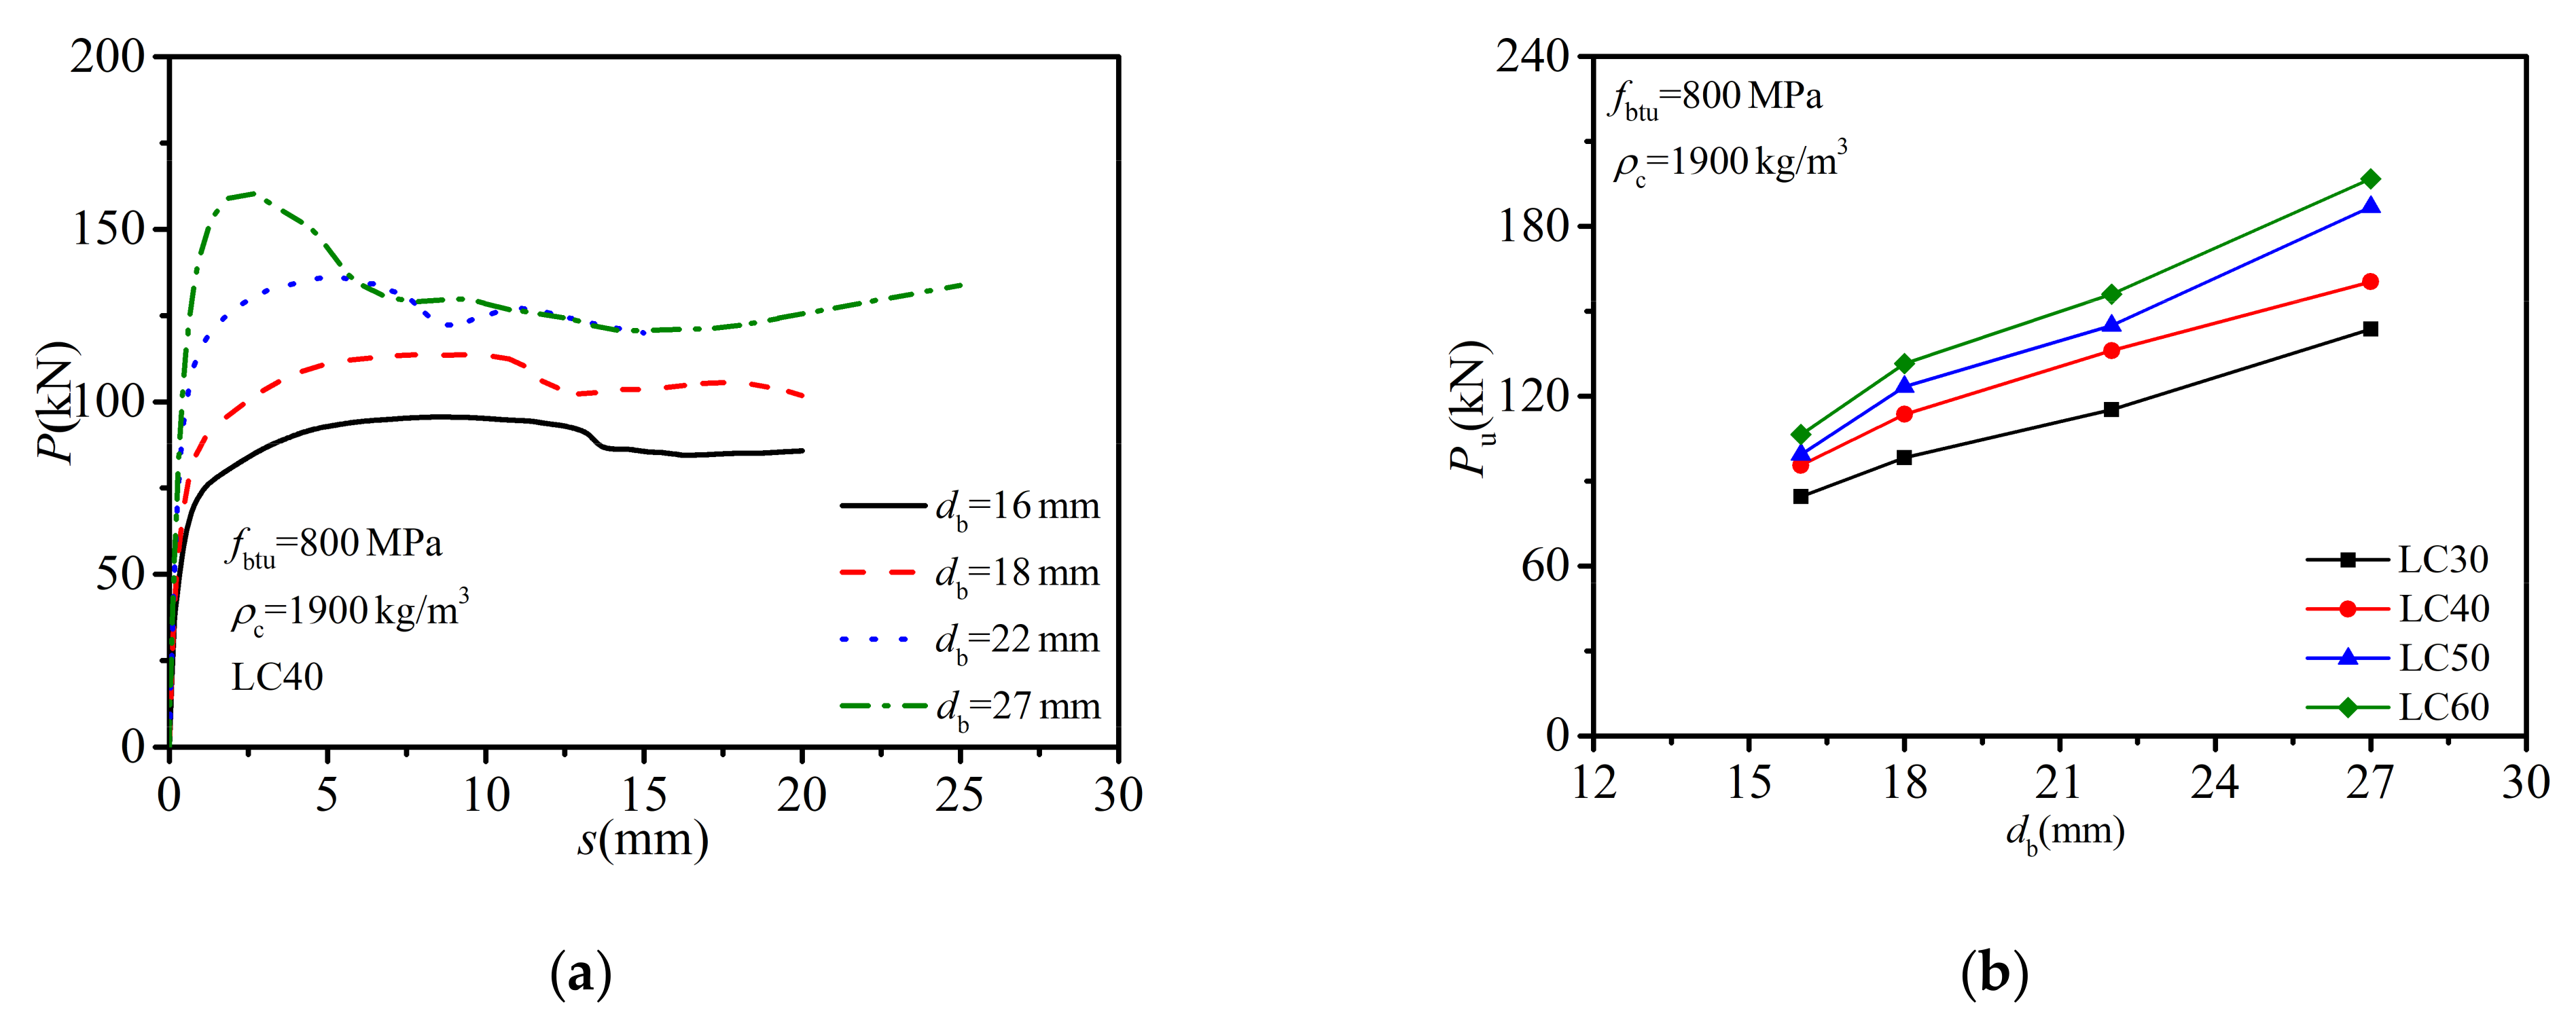
4.3.3. Effect of Bolt Diameter
4.3.4. Effect of Bolt Tensile Strength
5. Design Recommendations
6. Conclusions
- The developed 3D FE modelling considering both the compressive and tensile damage resembled the push-off tests reasonably well for basic shear performance, such as the shear carrying capacity, load–slip relationship, and failure modes.
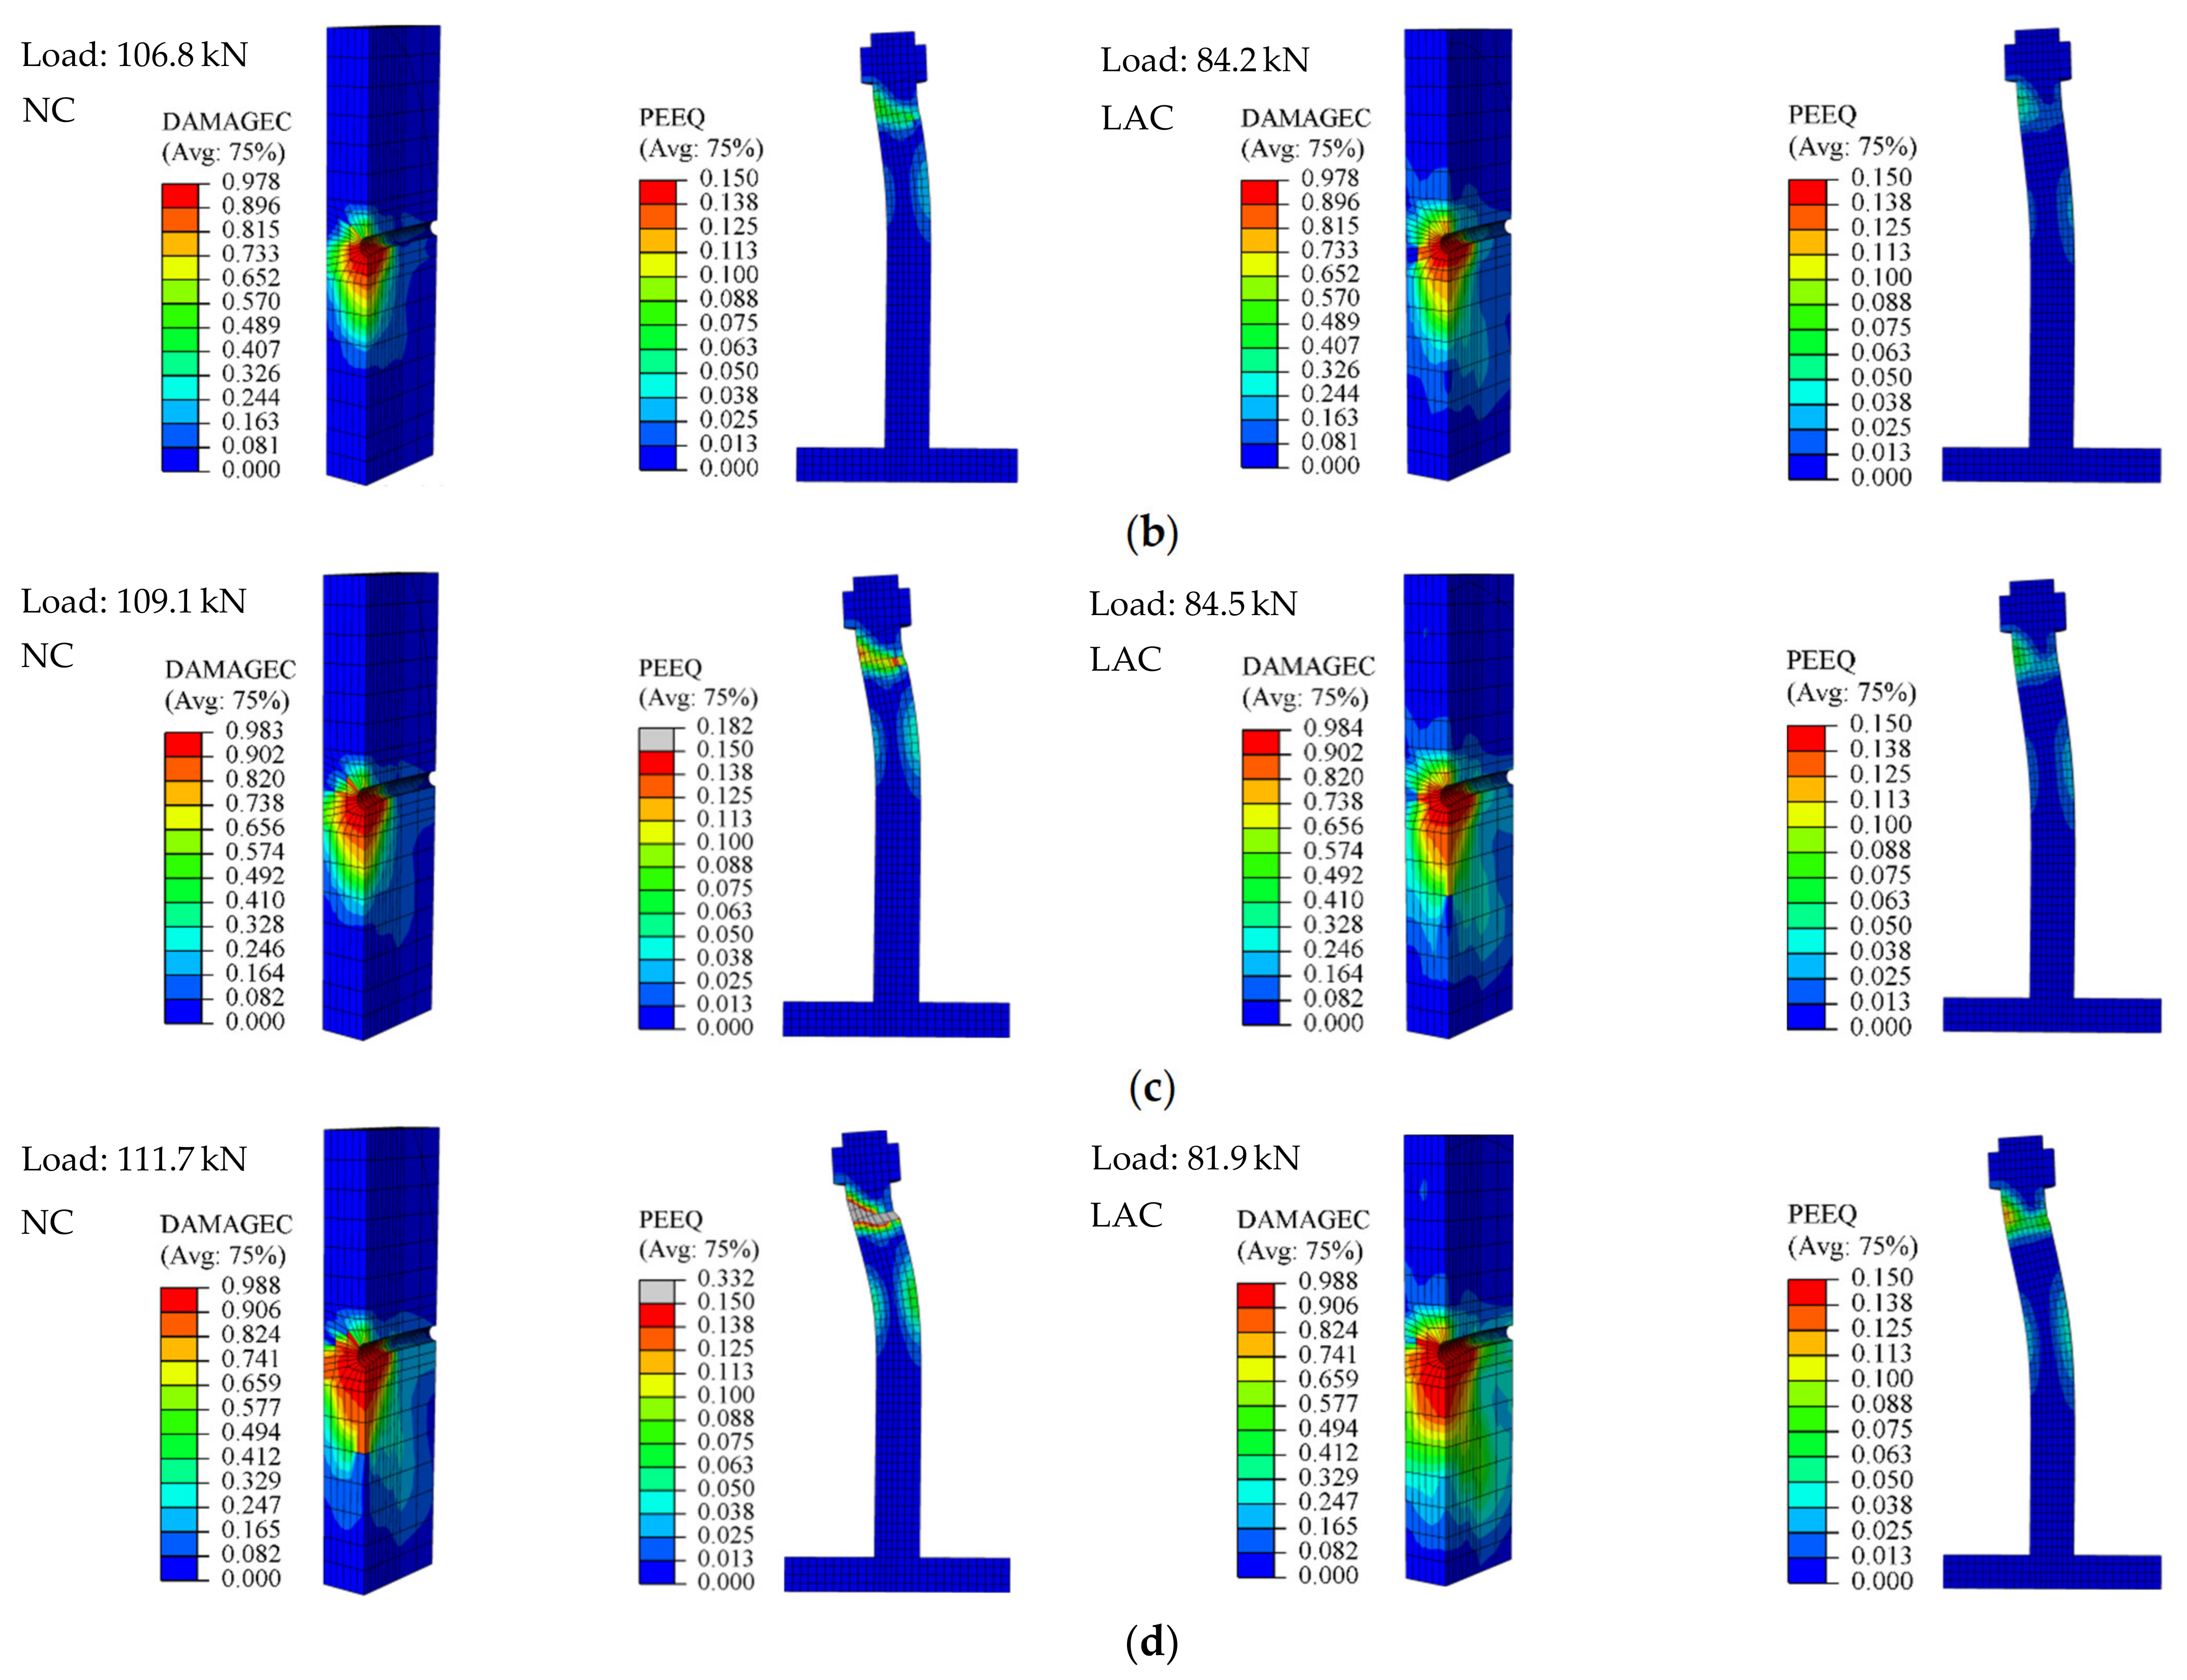
- The cracks created in the LAC slab appeared earlier and were more numerous than those in the NC slab, and the connector deformation that occurred in the LAC slab was smaller than that in the NC slab.
- The evolution of the load–slip response of the bolt connection embedded in LAC slab was similar to that of the bolt connection embedded in NC slab. The shear strength of the bolted connector embedded in the LAC slab was usually lower than that of the bolted connector embedded in the NC slab.
- The shear resistance of the bolted connector embedded in the LAC slab increased with an increase in the concrete strength, bolt diameter, and bolt tensile strength. The shear strength of the bolt connection was not materially influenced by concrete density.
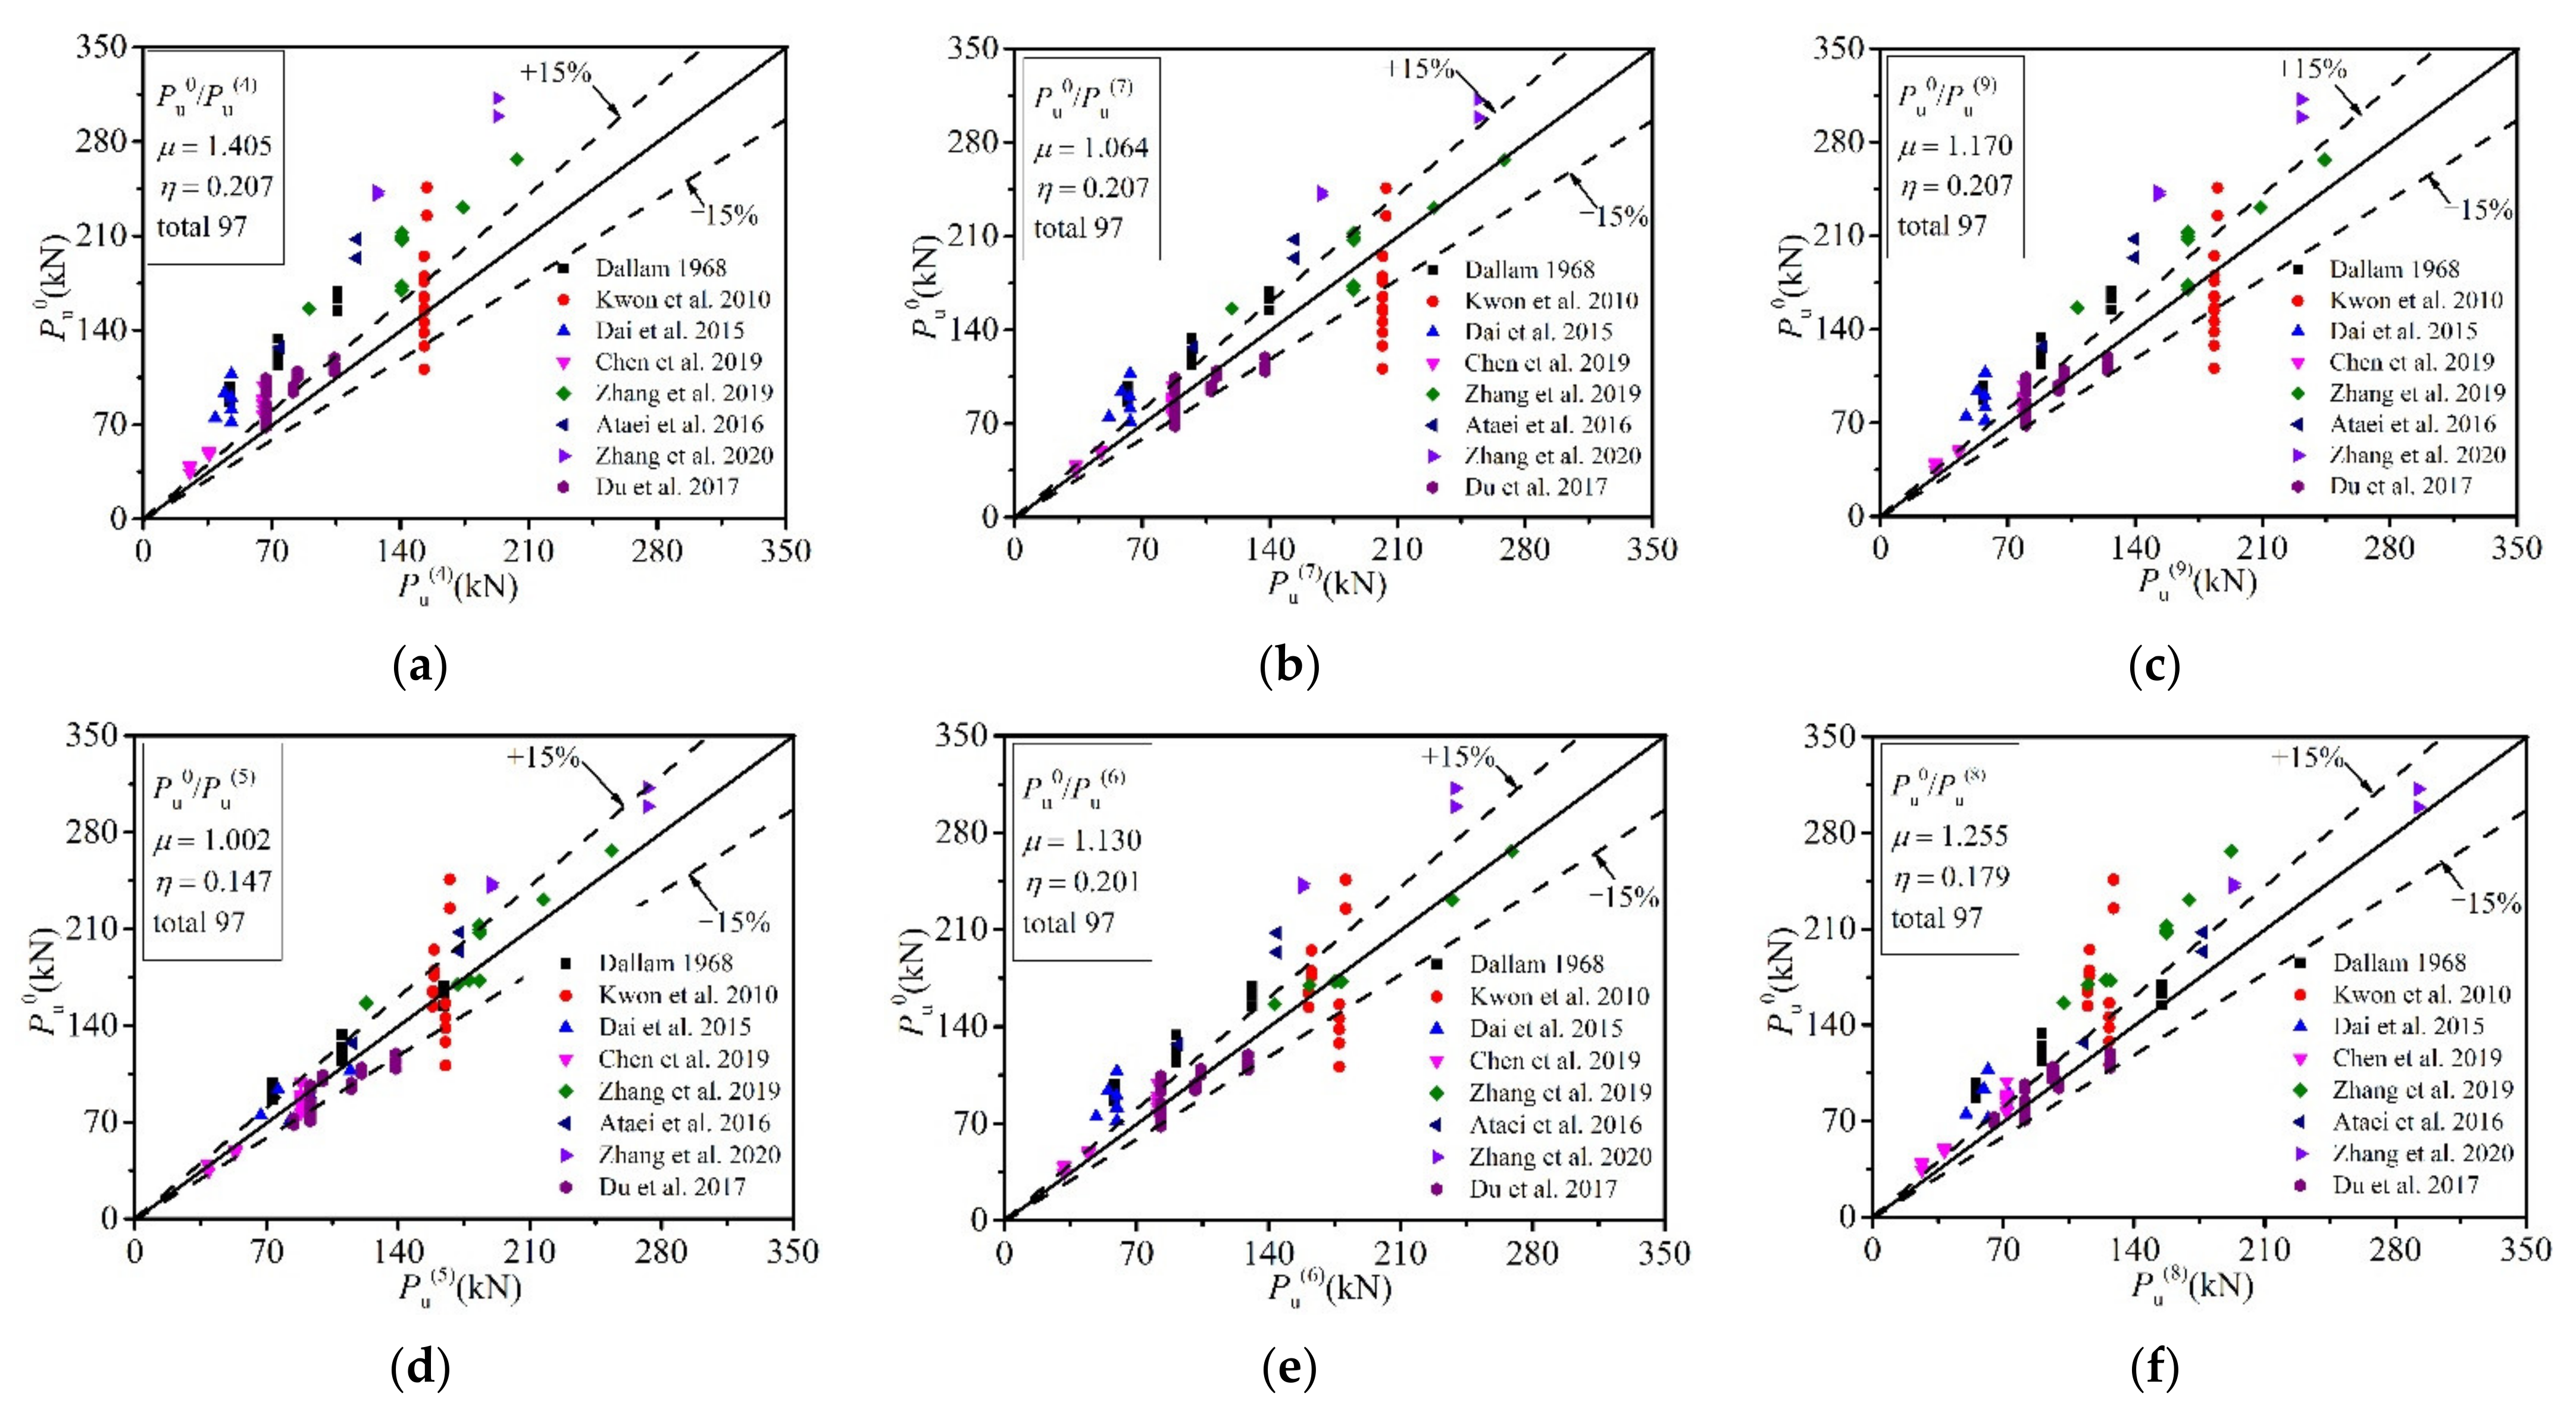
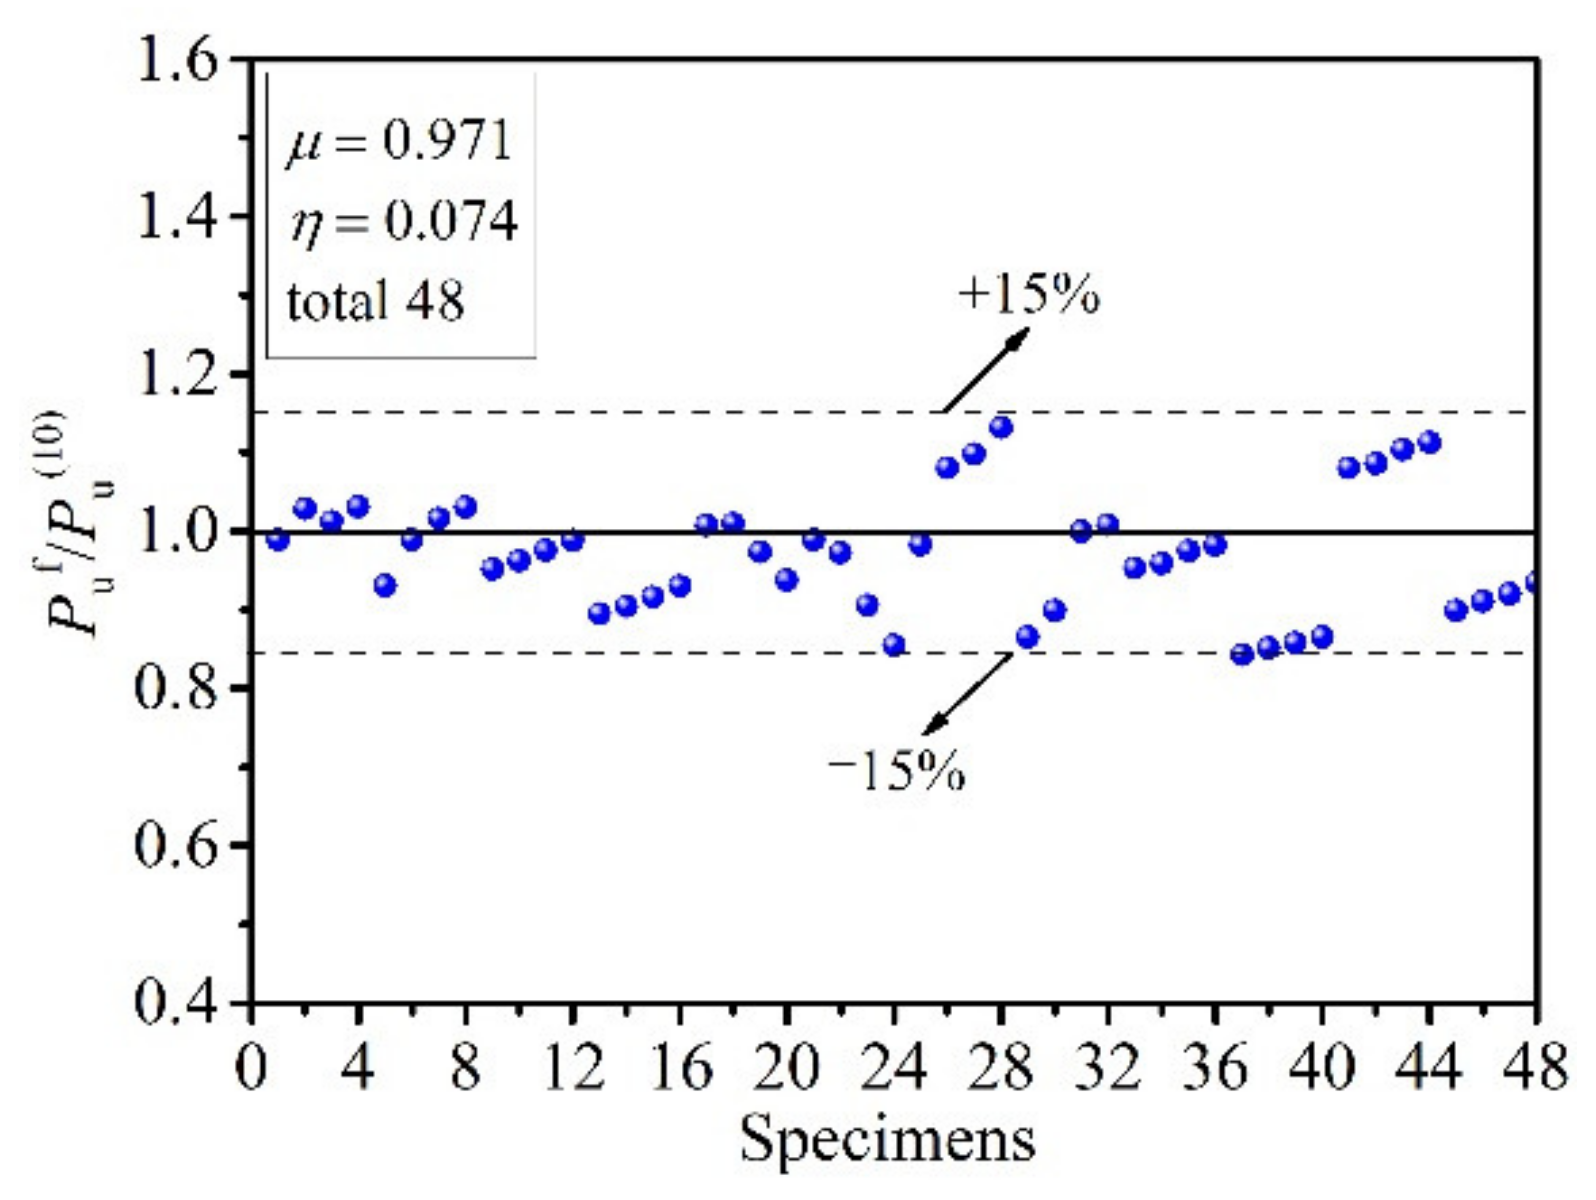
- Based upon the extensive parametric studies and the comparison of existing design formulae, an empirical formula was developed for the shear strength prediction of the bolt connectors embedded in LAC. Moreover, good agreement was observed between the numerical analysis results and the predictions.
Author Contributions
Funding
Institutional Review Board Statement
Informed Consent Statement
Data Availability Statement
Conflicts of Interest
References
- Wang, W.; Zhang, X.D.; Zhou, X.L.; Zhang, B.; Chen, J.; Li, C.H. Experimental study on shear performance of an advanced bolted connection in steel-concrete composite beams. Case Stud. Constr. Mater. 2022, 16, e01037. [Google Scholar] [CrossRef]
- Fang, Z.; Fang, S.; Liu, F. Experimental and Numerical study on the shear performance of short stud shear connectors in steel-UHPC composite beams. Buildings 2022, 12, 418. [Google Scholar] [CrossRef]
- Wang, W.; Zhang, X.D.; Ding, F.X.; Zhou, X.L. Finite element analysis on shear behavior of high-strength bolted connectors under inverse push-off loading. Energies 2021, 14, 479. [Google Scholar] [CrossRef]
- Ollgaard, J.G.; Slutter, R.G.; Fisher, J.W. Shear strength of stud connectors in lightweight and normal-weight concrete. AISC Eng. J. 1971, 8, 55–64. [Google Scholar]
- Lam, D.; El-Lobody, E. Behavior of headed stud shear connectors in composite beam. J. Struct. Eng. 2005, 131, 96–107. [Google Scholar] [CrossRef]
- Lam, D. Capacities of headed stud shear connectors in composite steel beams with precast hollowcore slabs. J. Constr. Steel Res. 2007, 63, 1160–1174. [Google Scholar] [CrossRef]
- Saleh, S.M.; Majeed, F.H. Shear strength of headed stud connectors in self-compacting concrete with recycled coarse aggregate. Buildings 2022, 12, 505. [Google Scholar] [CrossRef]
- Ahn, J.H.; Lee, C.G.; Won, J.H.; Kim, S.H. Shear resistance of the perfobond-rib shear connector depending on concrete strength and rib arrangement. J. Constr. Steel Res. 2010, 66, 1295–1307. [Google Scholar] [CrossRef]
- Dallam, L.N. High strength bolt shear connectors-pushout tests. ACI J. 1968, 65, 767–769. [Google Scholar]
- Dedic, D.J.; Klaiber, F.W. High-strength bolts as shear connectors in rehabilitation work. Concr. Int. 1984, 6, 41–46. [Google Scholar]
- Kwon, G.; Engelhardt, M.D.; Klingner, R.E. Behavior of post-installed shear connectors under static and fatigue loading. J. Constr. Steel Res. 2010, 66, 532–541. [Google Scholar] [CrossRef]
- Kwon, G.; Engelhardt, M.D.; Klingner, R.E. Experimental behavior of bridge beams retrofitted with postinstalled shear connectors. J. Bridge Eng. 2011, 16, 536–545. [Google Scholar] [CrossRef]
- Pavlović, M.; Marković, Z.; Veljković, M.; Budevac, D. Bolted shear connectors vs. headed studs behaviour in push-out tests. J. Constr. Steel Res. 2013, 88, 134–149. [Google Scholar] [CrossRef]
- Dai, X.H.; Lam, D.; Saveri, E. Effect of concrete strength and stud collar size to shear capacity of demountable shear connectors. J. Struct. Eng. 2015, 141, 4015025. [Google Scholar] [CrossRef]
- Suwaed, A.S.H.; Karavasilis, T.L. Novel demountable shear connector for accelerated disassembly, repair, or replacement of precast steel-concrete composite bridges. J. Bridge Eng. 2017, 22, 04017052. [Google Scholar] [CrossRef] [Green Version]
- Yang, F.; Liu, Y.Q.; Jiang, Z.B.; Xin, H.H. Shear performance of a novel demountable steel-concrete bolted connector under static push-out tests. Eng. Struct. 2018, 160, 133–146. [Google Scholar] [CrossRef]
- Hosseini, S.M.; Mashiri, F.; Mirza, O. Parametric study of innovative bolted shear connectors using 3D finite element modelling. J. Constr. Steel Res. 2021, 179, 106565. [Google Scholar] [CrossRef]
- Chen, J.; Wang, W.; Ding, F.X.; Xiang, P.; Yu, Y.J.; Liu, X.M.; Xu, F.; Yang, C.Q.; Long, S.G. Behavior of an advanced bolted shear connector in prefabricated steel-concrete composite beams. Materials 2019, 12, 2958. [Google Scholar] [CrossRef] [Green Version]
- Zhang, Y.J.; Chen, B.C.; Liu, A.R.; Pi, Y.L.; Zhang, J.P.; Wang, Y.; Zhong, L.C. Experimental study on shear behavior of high strength bolt connection in prefabricated steel-concrete composite beam. Compos. Part B Eng. 2019, 159, 481–489. [Google Scholar] [CrossRef]
- Liu, X.P.; Bradford, M.A.; Chen, Q.J.; Ban, H.Y. Finite element modelling of steel-concrete composite beams with high-strength friction-grip bolt shear connectors. Finite Elem. Anal. Des. 2016, 108, 54–65. [Google Scholar] [CrossRef]
- Ataei, A.; Bradford, M.A.; Liu, X.P. Experimental study of flush end plate beam-to-column composite joints with precast slabs and deconstructable bolted shear connectors. Structures 2016, 7, 43–58. [Google Scholar] [CrossRef]
- Ataei, A.; Zeynalian, M. A study on structural performance of deconstructable bolted shear connectors in composite beams. Structures 2021, 29, 519–533. [Google Scholar] [CrossRef]
- Ataei, A.; Bradford, M.A.; Liu, X.P. Experimental study of composite beams having a precast geopolymer concrete slab and deconstructable bolted shear connectors. Eng. Struct. 2016, 114, 1–13. [Google Scholar] [CrossRef]
- Liu, X.P.; Bradford, M.A.; Lee, M.S.S. Behavior of high-strength friction-grip bolted shear connectors in sustainable composite beams. J. Struct. Eng. 2015, 141, 04014149. [Google Scholar] [CrossRef]
- Liu, X.P.; Bradford, M.A.; Ataei, A. Flexural performance of innovative sustainable composite steel-concrete beams. Eng. Struct. 2017, 130, 282–296. [Google Scholar] [CrossRef]
- Zhang, Y.J.; Liu, A.R.; Chen, B.C.; Zhang, J.P.; Pi, L.Y.; Bradford, M.A. Experimental and numerical study of shear connection in composite beams of steel and steel-fibre reinforced concrete. Eng. Struct. 2020, 215, 110707. [Google Scholar] [CrossRef]
- Fang, Z.C.; Liang, W.B.; Fang, H.Z.; Jiang, H.B.; Wang, S.D. Experimental investigation on shear behavior of high-strength friction-grip bolt shear connectors in steel-precast UHPC composite structures subjected to static loading. Eng. Struct. 2021, 244, 112777. [Google Scholar] [CrossRef]
- Yang, T.; Liu, S.Y.; Qin, B.X.; Liu, Y.Q. Experimental study on multi-bolt shear connectors of prefabricated steel-concrete composite beams. J. Constr. Steel Res. 2020, 173, 106260. [Google Scholar] [CrossRef]
- Wang, W.; Zhang, X.D.; Zhou, X.L.; Wu, L.; Zhu, H.J. Study on shear behavior of multi-bolt connectors for prefabricated steel-concrete composite beams. Front. Mater. 2021, 8, 625425. [Google Scholar] [CrossRef]
- Li, X.; Zheng, X.Y.; Ashraf, M.; Li, H.T. Experimental study on the longitudinal shear bond behavior of lightweight aggregate concrete-closed profiled steel sheeting composite slabs. Constr. Build. Mater. 2017, 156, 599–610. [Google Scholar] [CrossRef]
- Ahmed, I.M.; Tsavdaridis, K.D. Shear connection of prefabricated slabs with LWC–Part1: Experimental and analytical studies. J. Constr. Steel Res. 2020, 169, 106016. [Google Scholar] [CrossRef]
- Li, S.P.; Chen, W.J.; Zhang, Y.B. Flexural behavior of precast, prestressed, lightweight aggregate concrete-conventional concrete composite beams. Constr. Build. Mater. 2021, 274, 121926. [Google Scholar] [CrossRef]
- Abaqus [Computer Software]; SIMULIA: Providence, RI, USA, 2016.
- Ding, F.X.; Ying, X.Y.; Zhou, L.C.; Yu, Z.W. Unified calculation method and its application in determining the uniaxial mechanical properties of concrete. Front. Archit. Civ. Eng. China 2011, 5, 381–393. [Google Scholar] [CrossRef]
- Ding, F.X.; Ying, X.Y.; Yu, Z.W. Unified calculation method of uniaxial mechanical properties of lightweight aggregate concrete. J. Cent. South. Univ. (Sci. Technol.) 2010, 41, 1973–1979. (In Chinese) [Google Scholar]
- Ding, F.X.; Wu, X.; Xiang, P.; Yu, Z.W. New damage ratio strength criterion for concrete and lightweight aggregate concrete. ACI Struct. J. 2021, 118, 165–178. [Google Scholar] [CrossRef]
- Loh, H.Y.; Uy, B.; Bradford, M.A. The effects of partial shear connection in composite flush end plate joints Part II-Analytical study and design appraisal. J. Constr. Steel Res. 2006, 62, 391–412. [Google Scholar] [CrossRef]
- Santos, L.R.D.; Cardoso, H.D.S.; Caldas, R.B.; Grilo, L.F. Finite element model for bolted shear connectors in concrete-filled steel tubular columns. Eng. Struct. 2020, 203, 109863. [Google Scholar] [CrossRef]
- Shi, G.; Shi, Y.; Wang, Y.; Bradford, M.A. Numerical simulation of steel pretensioned bolted end-plate connections of different types and details. Eng. Struct. 2008, 30, 2677–2686. [Google Scholar] [CrossRef]
- Du, H.; Zhang, B.; Hu, X.M.; Kou, L.X.; Xia, Y. Experimental study on shear behavior of bolt connectors in steel-concrete composite beams. J. Build. Struct. 2017, 38, 308–314. (In Chinese) [Google Scholar]


| Ref. | Specimen | Pretension (kN) | Hole Diameter (mm) | Bolt Diameter (mm) | Compressive Strength of Concrete (MPa) | Pu0 (kN) | Puf (kN) | Puf/Pu0 |
|---|---|---|---|---|---|---|---|---|
| [18] | T1-10-01 | 30 | - | 10 | 33.7 | 45.1 | 36.2 | 0.803 |
| T1-10-02 | 30 | - | 10 | 33.7 | 39.2 | 36.2 | 0.923 | |
| T1-12-01 | 45 | - | 12 | 33.7 | 45.4 | 46.9 | 1.033 | |
| T1-12-02 | 45 | - | 12 | 33.7 | 49.1 | 46.9 | 0.955 | |
| T1-16-01 | 80 | - | 16 | 33.7 | 98.8 | 94.6 | 0.957 | |
| T1-16-02 | 80 | - | 16 | 33.7 | 89.8 | 94.6 | 1.053 | |
| [19] | T1-1 | 80 | 24 | 20 | 50 | 207.0 | 209.4 | 1.012 |
| T1-2 | 100 | 24 | 20 | 50 | 207.5 | 214.2 | 1.032 | |
| T1-3 | 120 | 24 | 20 | 50 | 207.5 | 212.6 | 1.025 | |
| T1-4 | 155 | 24 | 20 | 50 | 212.5 | 210.1 | 0.989 | |
| T2-1 | 155 | 20 | 16 | 50 | 156.3 | 147.6 | 0.944 | |
| T2-2 | 155 | 26 | 22 | 50 | 231.3 | 208.7 | 0.902 | |
| T2-3 | 155 | 28 | 24 | 50 | 266.8 | 230.6 | 0.864 | |
| T3-1 | 155 | 22 | 20 | 50 | 209.2 | 207.8 | 0.993 | |
| T3-2 | 155 | 26 | 20 | 50 | 172.5 | 207.9 | 1.205 | |
| T4-1 | 155 | 24 | 20 | 40 | 169.8 | 178.5 | 1.051 | |
| T4-2 | 155 | 24 | 20 | 45 | 172.8 | 193.7 | 1.121 | |
| [26] | NC-M22-G8.8-γ-1 | 130 | 25 | 22 | 58.8 | 243.1 | 237.4 | 0.977 |
| NC-M22-G8.8-γ-2 | 130 | 25 | 22 | 58.8 | 240.5 | 237.4 | 0.987 | |
| NC-M27-G8.8-γ-1 | 200 | 30 | 27 | 58.8 | 298.8 | 290.7 | 0.973 | |
| NC-M27-G8.8-γ-2 | 200 | 30 | 27 | 58.8 | 312.1 | 290.7 | 0.931 | |
| Mean (µ) | 0.987 | |||||||
| Coefficient of variation (η) | 0.087 | |||||||
| Variable | Range of Variable |
|---|---|
| compressive cubic strength (fcu) | fcu = 22.8, 30.5, 36.8, 43.8 (MPa) |
| Concrete density (ρc) | ρc = 1600, 1700, 1800, 1900 (kg/m3) |
| Bolt diameter (db) | db = 16, 18, 22, 27 (mm) |
| Bolt tensile strength (fbtu) | fbtu = 800, 900, 1000, 1200 (MPa) |
Publisher’s Note: MDPI stays neutral with regard to jurisdictional claims in published maps and institutional affiliations. |
© 2022 by the authors. Licensee MDPI, Basel, Switzerland. This article is an open access article distributed under the terms and conditions of the Creative Commons Attribution (CC BY) license (https://creativecommons.org/licenses/by/4.0/).
Share and Cite
Wang, W.; Zhang, X.; Ren, Y.; Bai, F.; Li, C.; Li, Z. Finite Element Modelling of Bolt Shear Connections in Prefabricated Steel Lightweight Aggregate–Concrete Composite Beams. Buildings 2022, 12, 758. https://doi.org/10.3390/buildings12060758
Wang W, Zhang X, Ren Y, Bai F, Li C, Li Z. Finite Element Modelling of Bolt Shear Connections in Prefabricated Steel Lightweight Aggregate–Concrete Composite Beams. Buildings. 2022; 12(6):758. https://doi.org/10.3390/buildings12060758
Chicago/Turabian StyleWang, Wei, Xiedong Zhang, Yu Ren, Fanglong Bai, Chaohui Li, and Zhiguo Li. 2022. "Finite Element Modelling of Bolt Shear Connections in Prefabricated Steel Lightweight Aggregate–Concrete Composite Beams" Buildings 12, no. 6: 758. https://doi.org/10.3390/buildings12060758
APA StyleWang, W., Zhang, X., Ren, Y., Bai, F., Li, C., & Li, Z. (2022). Finite Element Modelling of Bolt Shear Connections in Prefabricated Steel Lightweight Aggregate–Concrete Composite Beams. Buildings, 12(6), 758. https://doi.org/10.3390/buildings12060758