Article

Evaluation of Mixed-Mode Ventilation Thermal Performance and Energy Saving Potential from Retrofitting a Beijing Office Building

1
Beijing Key Lab of Heating, Gas Supply, Ventilating and Air Conditioning Engineering, Beijing University of Civil Engineering and Architecture, Beijing 100044, China
2
Key Laboratory of Petroleum Engineering, China University of Petroleum, Beijing 102249, China
*
Author to whom correspondence should be addressed.
Buildings 2022, 12(6), 793; https://doi.org/10.3390/buildings12060793
Submission received: 8 May 2022 / Revised: 4 June 2022 / Accepted: 7 June 2022 / Published: 9 June 2022
(This article belongs to the Section Building Energy, Physics, Environment, and Systems)

Abstract

:
Mixed-mode cooling can effectively reduce the energy consumption of building cooling while satisfying the thermal comfort of occupancy and indoor air quality requirements. This paper predicted the thermal performance and energy-saving potential of an existing Beijing office building (in continental climates) operated in a mixed-mode from April to October. For the natural ventilation mode, the results predicted by simulation were validated with the results of experiments conducted in October 2021 and April 2022. Occupancy thermal comfort of the mixed-mode building was predicted using Predicted Mean Vote (PMV) and adaptive comfort models. The predictions demonstrated acceptable satisfactory thermal comfort for the occupancy. The results showed that the mixed-mode building’s annual cooling energy use is reduced by around 45% compared to the air-conditioned building. In addition, the building’s indoor temperature and velocity distributions were predicted using a Computational Fluid Dynamics (CFD) simulation. The validation showed a satisfactory agreement between CFD simulation and measurement data. It is found from CFD results that cross-ventilation can provide thermal comfort for the occupancy while improving fresh air requirements. The suggested that operational strategies of mixed-mode cooling can be used in office buildings in continental climates. Retrofitting the existing office building can bring a significant amount of energy saving.

1. Introduction

Buildings and their related activities are one of the key contributors to energy consumption and greenhouse gas emissions. For example, in China, the energy consumed in the building sector accounted for 27.4% of the country’s total energy consumption [1] and associated greenhouse gas emissions in 2017. According to the China Building Energy Use 2018 report, in 2016, China’s public and commercial buildings accounted for 31% of total building energy use, with a total floor area of 11.7 billion m2 [2]. In China, the energy used by space cooling in buildings reached around 400 TWh in 2017, approximately 8% of total electricity demand and associated carbon emissions in the building sector [3]. Natural ventilation can reduce the cooling energy demand by mechanical ventilated and conditioned buildings with improved indoor air quality and thermal comfort [4] and effectively prevent the viral spread of epidemic diseases such as COVID-19 [5]. According to a study [6], for marine climates, up to around 63–72% of energy could be reduced by applying natural ventilation with the manual or automatic control of operable windows for buildings with or without thermal mass. However, for hot and dry climates, applications of mixed-mode cooling strategies can provide nearly up to 48% of energy savings for buildings with thermal mass [6]. Mixed-mode cooling refers to a hybrid approach to space conditioning that uses a combination of natural ventilation and mechanical systems that include air distribution equipment and refrigeration equipment for cooling [7]. mixed-mode cooling can be defined as three types, i.e., concurrent, change-over, and zoned according to whether the natural ventilation and mechanical cooling operate in the same or different areas and/or at the same or different times [7]. Among them, the change-over design strategies (same space, different times) are becoming increasingly popular in practice. In this mode, the building changes over between natural ventilation and air conditioning on a seasonal or daily basis [7]. This strategy requires building automation systems to determine the operating mode based on the outdoor temperature, indoor temperature, and occupancy.
Many researchers studied the change-over mixed-mode buildings in terms of system feasibility, operating strategies, energy-saving potentials, and thermal performance, including indoor air quality or the thermal comfort of occupancy [8,9,10,11,12,13,14,15,16,17,18,19,20,21,22,23,24,25]. Ezzeldin and Rees [21] simulated the performance of various mixed-mode ventilation and other low-energy cooling systems for a prototype office building with different levels of internal heat gain operated in four representative arid climates. The simulation results show that, with the aid of low-energy cooling technologies such as radiant, evaporative, and ground-coupled cooling, the proposed hybrid approaches can provide satisfactory indoor thermal comfort and save around 50% of the chiller’s energy use compared to conventional VAV systems. Emmerich [22] conducted simulations to predict and compare the energy and indoor environmental performance of natural and hybrid ventilation alternatives in a five-story office building in five US representative climates. They found that the hybrid system saved significant fan energy and reduced cooling loads in all climates but often resulted in higher heating loads. Jia et al. [24] conducted a field study to compare the applicability of Fanger’s Predicted Mean Vote (PMV) and Predicted Percentage of Dissatisfied (PPD) model and the adaptive model in a mixed-mode office building in Tianjin, China. They found that the adaptive model is more applicable to a mixed-mode building that has the potential to be used in mid-latitude temperate regions, if well designed. Luo et al. [25] undertook a field study to examine occupants’ thermal comfort perceptions in a mixed-mode office building in subtropical climates. They found that the adaptive model is more suitable for mixed-mode buildings compared to the PMV model.
In the literature, most of the research on the natural ventilation or mixed-mode ventilation of commercial building focus on the climatic regions of Europe and the USA. Only a few studies are concerned about the commercial buildings in Beijing, China, with continental climates (warm and hot summer). Tong et al. found that Beijing shows the most promising energy-saving potential in the application of natural ventilation due to its most significant total square footage of office buildings if air quality is improved [26]. Chen et al. calculated the energy-saving potentials of the world’s 60 largest cities using building energy simulation. They found that Beijing, China’s capital city, has 2651 natural ventilation hours [27]. According to the “urban management development plan of Beijing in the 14th five-year period” released recently, over 7.5 million square meters of existing commercial buildings are undergoing retrofits in 2022 by implementing energy-saving and sustainable energy technologies [28]. However, the literature lacks sufficient knowledge and understanding of the operating mode, thermal performance, and energy-saving potential of mixed-mode cooling applied to the commercial office building in continental climates. The possibility of retrofitting existing commercial office buildings with mixed-mode ventilation system has not been well recognised due to concerns about occupant satisfaction, air quality, and energy-saving potential.
This paper addresses the thermal and energy performance evaluation of a mixed-mode office building with a high thermal mass located in Beijing with continental climates. The objectives of this study were to assess the feasibility and energy-saving potential of incorporating passive natural ventilation into the active mechanical cooling system. The findings provide guidance for controlling the operation of mixed-mode buildings in continental climates.

2. Methods

Figure 1 demonstrates the research method used to accomplish the paper’s goals. First, the study analysed the climate conditions of Beijing for the non-heating season using the Chinese Standard Weather Database (CSWD) to evaluate the overall feasibility of using free cooling outside (In the winter season of Beijing, space heating of the studied building utilises district central gas-fired boilers and radiators rather than a VAV system. Therefore, we only considered the non-heating season in this paper). Secondly, building thermal simulation was carried out in DesignBuilder 7.0 [29] to predict the effect of mixed-mode cooling strategies on the thermal performance of the building. The multi-zone airflow network model was used for the natural ventilation calculation. A simple HVAC model was used for modelling the mechanical ventilation and cooling equipment performance regardless of the detailed HVAC system. The simulation obtained zone nodal temperatures and fresh air flow rates of the building operating under a typical natural ventilation mode (usually in April and October) and a mixed cooling mode (commonly in July and August). The predicted nodal air temperatures were validated with the experimental results of average zone air temperatures on an hourly basis for several successive days in April, May, and October from 2021 to 2022. Moreover, occupancy thermal comfort criteria based on PMV and adaptive models were predicted by the building thermal simulation. In addition to the thermal analysis, we used CFD simulation to show the distributions of air temperature and velocity and evaluate if natural ventilation can provide thermal comfort for indoor spaces. Finally, based on the building thermal simulation, the study estimated the energy saving of the mixed-mode building by comparing the energy use of the mixed-mode to that of the mechanical cooling mode.

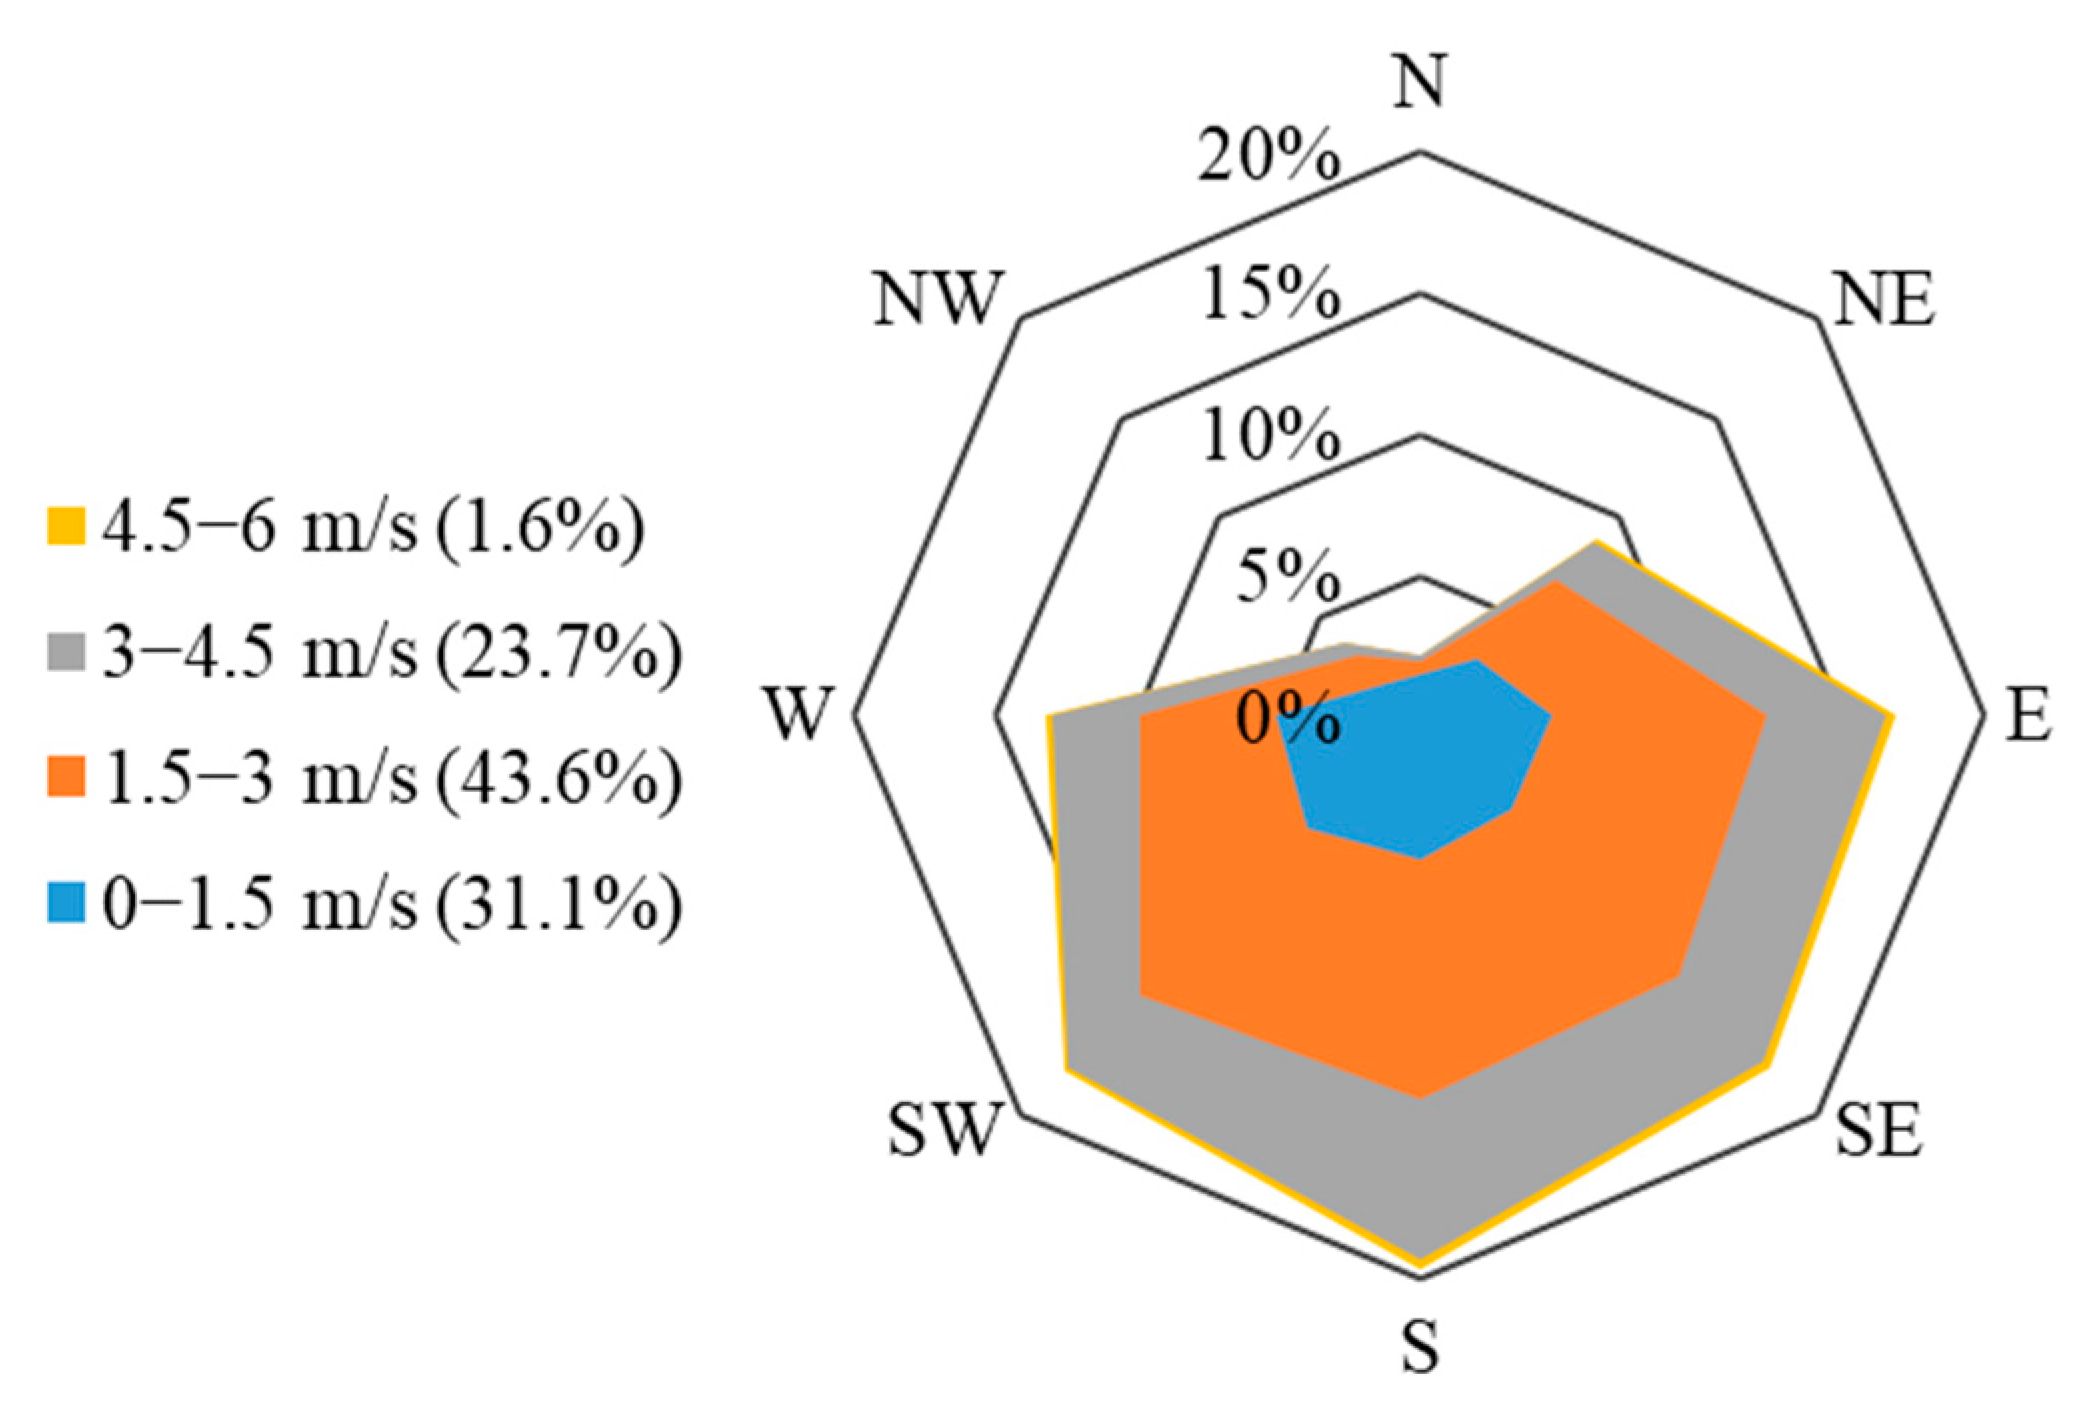
2.1. Climate Analysis

The potential for applying natural ventilation strategies relies heavily on local climatic conditions including air temperature, humidity, and wind conditions. Beijing’s climatic conditions were studied using the hourly Chinese Standard Weather Data (CSWD) [30] developed in 2005.
Figure 2 plots the city’s hourly temperature and moisture content on a psychrometric chart adopting the standard ANSI/ASHRAE 55 [31] comfort envelope as the criteria for defining acceptable indoor thermal comfort conditions. There are 863 h when the climate conditions are enclosed within the comfort zones. Most of the year, the city’s ambient conditions exceed the acceptable temperature upper band (27 °C–28 °C) and humidity ratio (12 g/kg). During the working days from 8:00 to 19:00, there are 718 h when the ambient temperature lies above 28 °C and 1107 h when the temperature is below 27 °C but above the humidity of 12 g/kg. For hot and humid conditions, effective natural ventilation cooling can be obtained by promoting air motion. It produces a cooling effect on the human body by increasing the rate of sweat evaporation and giving the psychological sense of cooling. The zone for natural ventilation cooling is defined by a minimum air velocity to effect comfort, usually at least 0.2 m/s or by a maximum indoor comfortable air velocity (For sedentary activity, it is usually about 0.82 m/s; for walking activity, it is usually about 1.6 m/s). These air movements will produce a feeling of comfort equivalent to a temperature reduction of 2.5 °C for sedentary activity and 3.7 °C for walking activity [32]. The top of the natural ventilation cooling zone is lower than the maximum humidity ratio of 12 g/kg because air conditioning or dehumidification is needed above the level. There are 165 h satisfying the demand specified by the criteria. Thus, by considering the comfort zone and natural ventilation cooling zone, it is estimated that 1028 h in total can be suitable for natural ventilation.
It is demonstrated that a specific time of the year can be suitable for natural ventilation, frequently in temperate spring/autumn seasons (April–May, September–October) and even in the hot/humid summer season (June–August).
Climate wind speed and direction were analysed from April to October according to the criteria mentioned above, i.e., the favourable range of outdoor temperature is 19 °C–31.7 °C, and the humidity ratio is below 12 g/kg for potential natural ventilation. Figure 3 plots the wind rose indicating frequency distributions of the associated wind direction and speed. South is the predominant wind direction, followed by the southwest, southeast, and east directions. The longest spoke shows that the wind blew from the south at speeds between 0–1.5 m/s (blue) about 31% of the time, 1.5–3 m/s (bright orange) about 43.6% of the time, and 3–4.5 m/s about 23.7% of the time.

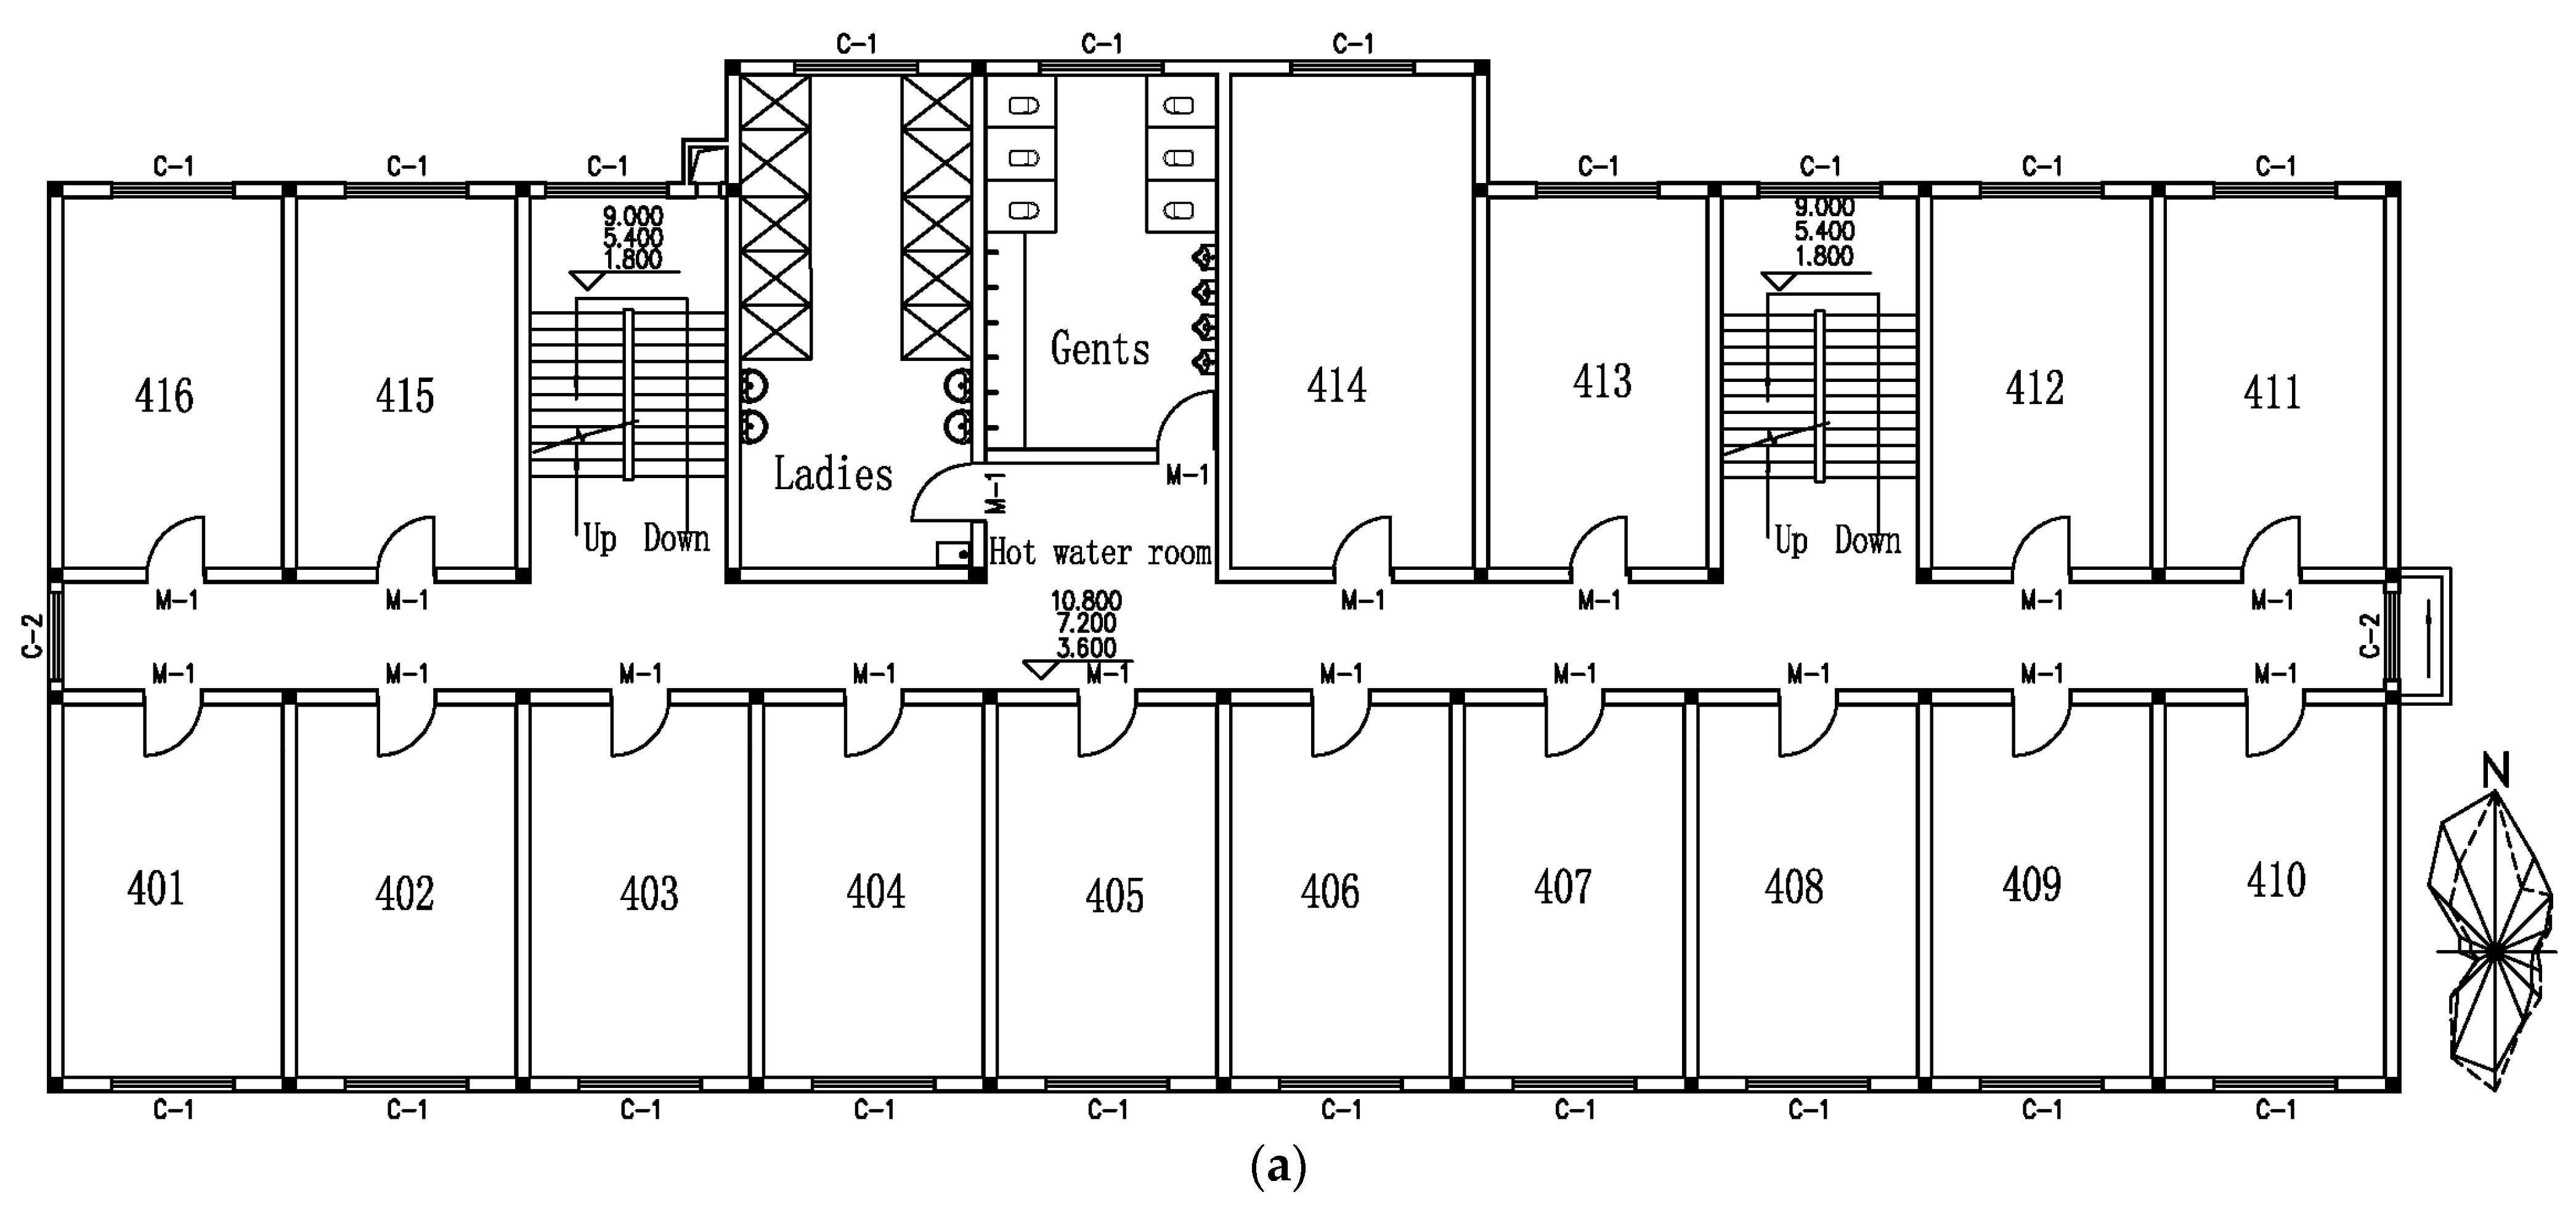
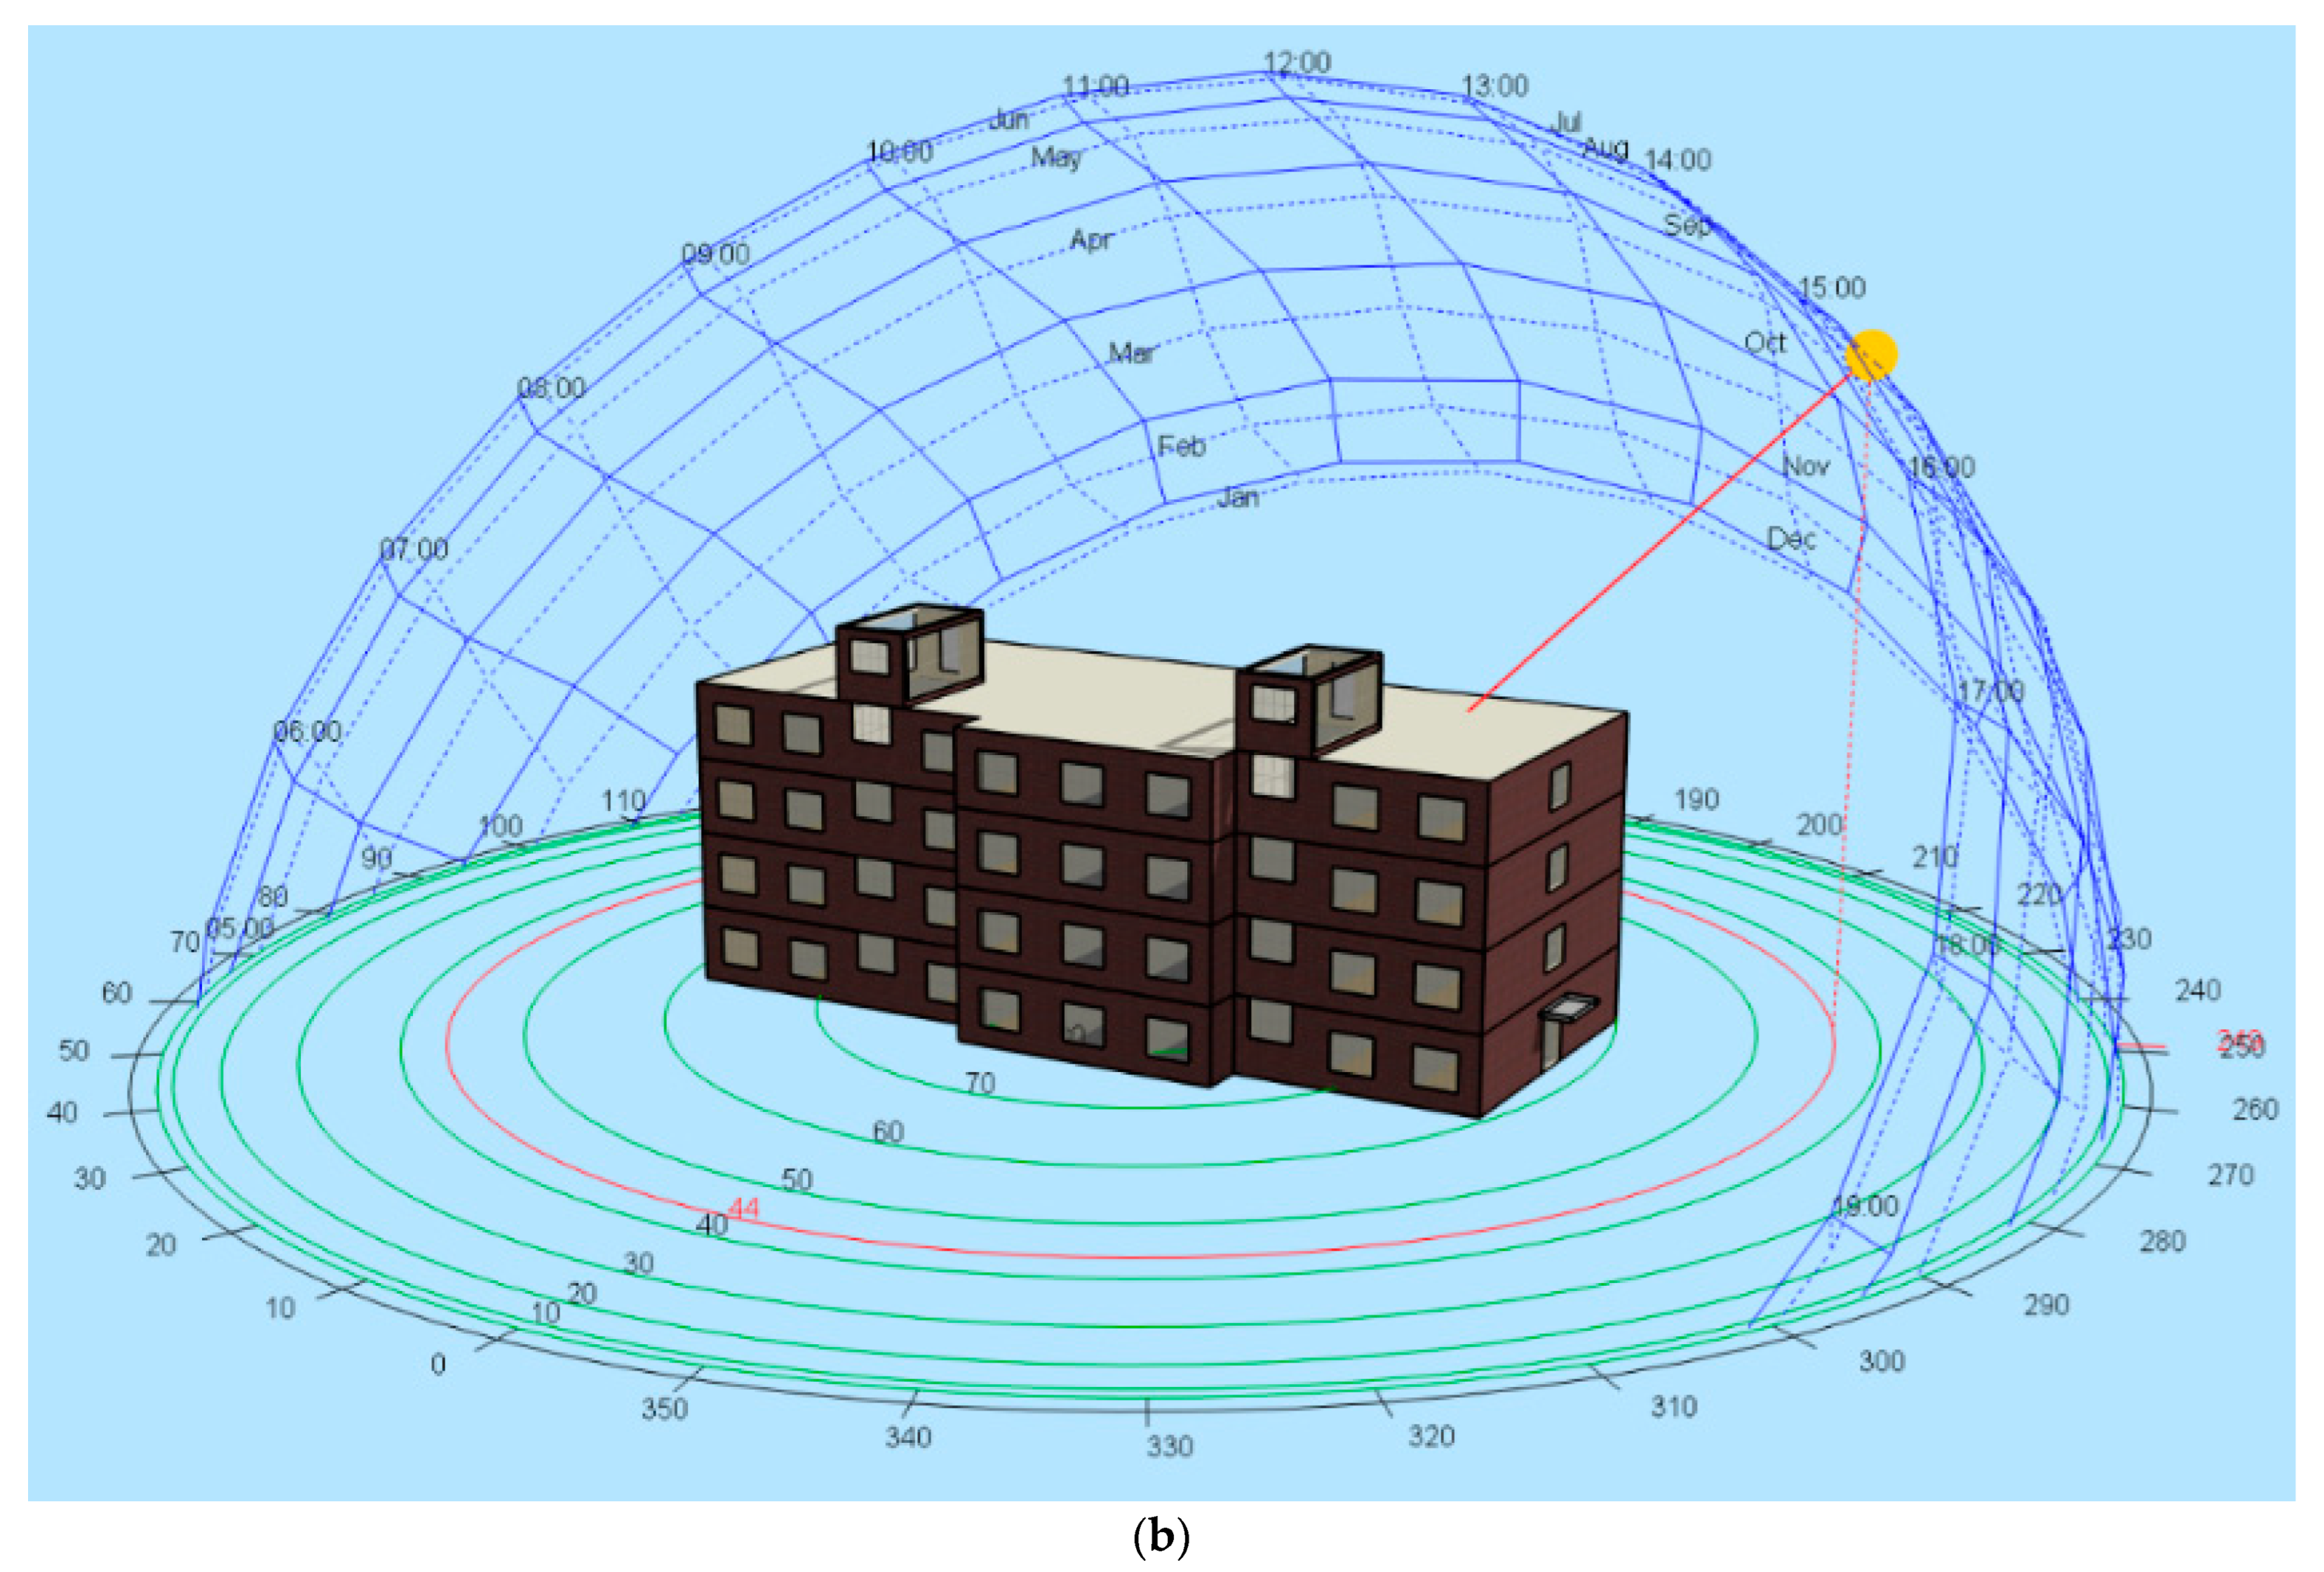
2.2. Building Thermal Modelling

2.2.1. Natural Ventilation Model

The performance of air distribution through the building spaces was predicted by a multi-zone airflow network model, which solves the mass, energy, and concentration equations for each zone to obtain the solution for this study case. The airflow mass balance applied to each zone in a building for a transient problem is given by [18]:
M i t = ρ i V i t + V i ρ t = m i , j + m i
where Mi is the mass of the air in zone i [kg]; t is the time [s]; ρ is the density [kg/m3]; Vi is the volume of zone i [m3]; mi,j is the airflow rate [kg/s] between zone i and zone j; and mi is the airflow rate [kg/s] for non-flow processes that could add or remove significant quantities of air from the zone, usually sources and sinks specified as boundary conditions.
The multi-zone airflow network model consists of a set of nodes connected by airflow components through linkages. The airflow through an airflow component, such as windows, doors, and structural leakage, is usually driven by pressure differences between connected zones. The airflow rate from zone i to zone j, mi,j, can be approximated as follows [33]:
m i , j = C ρ Δ P i , j μ = C ρ P i P j μ = C ρ μ ( P s , i P s , j + ρ v i 2 ρ v j 2 2 + ρ g z i ρ g z j )
where C is the flow coefficient of the flow path that depends on the size of the opening or crack. ΔPi,j [Pa] is the total pressure difference between nodes i and j. The total pressure difference includes the static pressure difference (ΔPs), dynamic pressure difference (ΔρV2/2), and stack pressure difference (ρgz) from zone i to zone j. The static pressure on the building surface due to wind is calculated as follows:
P s = 0.5 C p ρ a v z 2
where ρa is the ambient air density; Cp represents the wind pressure coefficient at a given position on the surface deriving from a database [34], which provides a satisfactory approximation for the basic design purpose; vz is the mean wind velocity at height z, which is defined as the following expression [35]:
v z = v m e t ( δ m e t z m e t ) α m e t ( z δ ) α
where vmet is the wind speed measured at the meteorological station; zmet is the height above ground of the wind speed sensor at the meteorological station; δmet and δ represent the wind speed profile boundary layer thickness at the meteorological station and the site location; and αmet and α represent the wind speed profile exponent at the meteorological station and the site location. The typical values for α and δ are 0.14 and 270 m, respectively, for an open field considering the surrounding terrain at the meteorological station and the site.

2.2.2. Building Constructions and Internal Gains

This paper studied an office building consisting of four stories sited in a rural area of Beijing city. The rural area is in the Huangcun town of Daxing District (urban heat island effect does not affect the study area). The total floor area of the building is 4088 m2, and each storey is 3.6 m in height. The geometry model of the building was created in DesignBuilder based on the architectural floor plans as presented in Figure 4. The high thermal mass building constructions include external walls, a roof, floor, and external windows. Their individual U-values were calculated automatically based on the given material types, thickness, and thermal properties, which are summarised in Table 1.
The office building is operated according to the typical working schedule, 8:00–19:00 on weekdays. Table 2 provides details of internal gains including occupancy density, lighting power, and computer/office equipment loads for different types of rooms, which follow the office-type building routines. The infiltration through the building envelope was set to zero to differentiate with the natural ventilation through opening windows. The minimum fresh air rate was 10 L/s per person for the occupied times, which lived up to the requirement of 30 m3/h per person according to the China National Standard “Design Code for Heating Ventilation and Air Conditioning of Civil Buildings (GB 50736-2012)” [36].

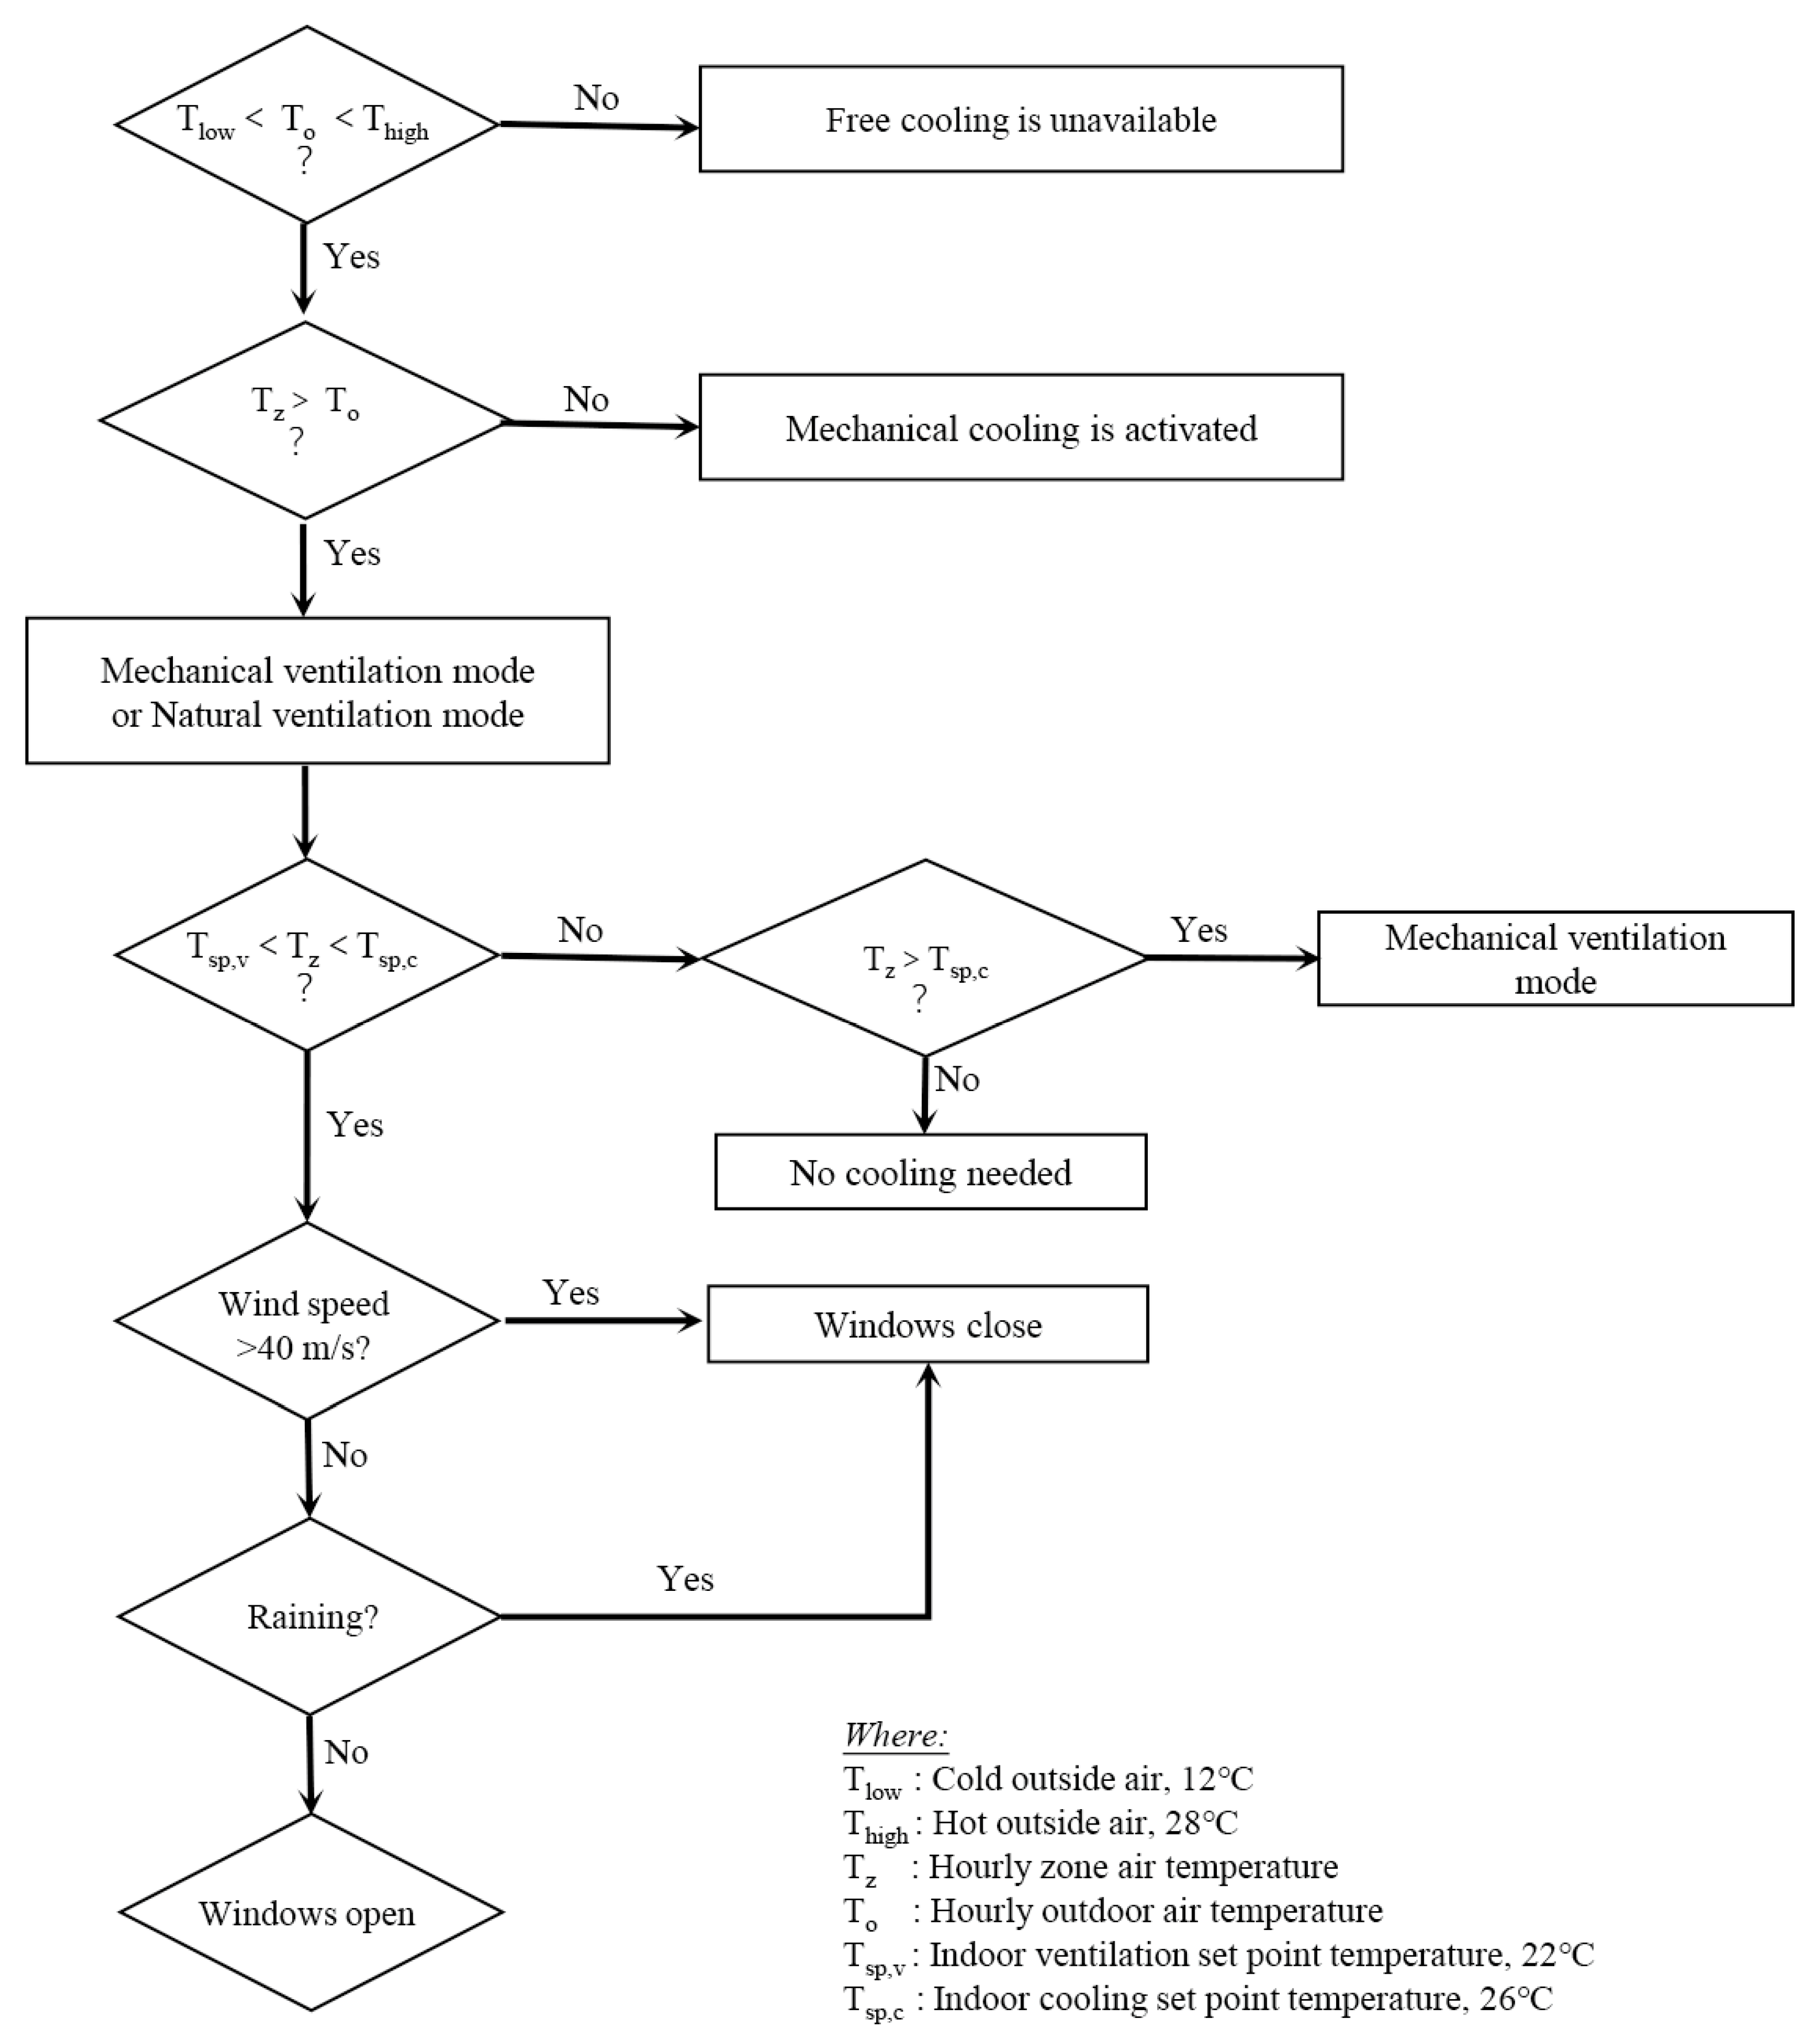
2.2.3. Mixed-Mode Cooling Operation Modes

The change-over mixed-mode combines natural ventilation, mechanical ventilation, and mechanical cooling into one hybrid ventilation that determines the mode of operating depending on the outdoor temperature, indoor temperature, and setpoints for natural ventilation and cooling. Figure 5 presents the operating modes and the associated control strategies of the mixed-mode ventilated building. The natural ventilation mode is only available when the outdoor temperatures are within 12 to 28 °C. Meanwhile, the zone air temperature should be higher than the ventilation setpoint temperature, i.e., 22 °C, and lower than the cooling setpoint temperature, i.e., 26 °C. When the zone air temperature gets more elevated than the cooling setpoint during working hours from 8:00 to 19:00, the mechanical ventilation is activated. In this mode, mechanical fans deliver outdoor air to the indoor spaces. When the outdoor temperature reaches above 26 °C and gets higher than zone air temperature simultaneously, the mechanical cooling turns on to provide active cooling for building spaces.

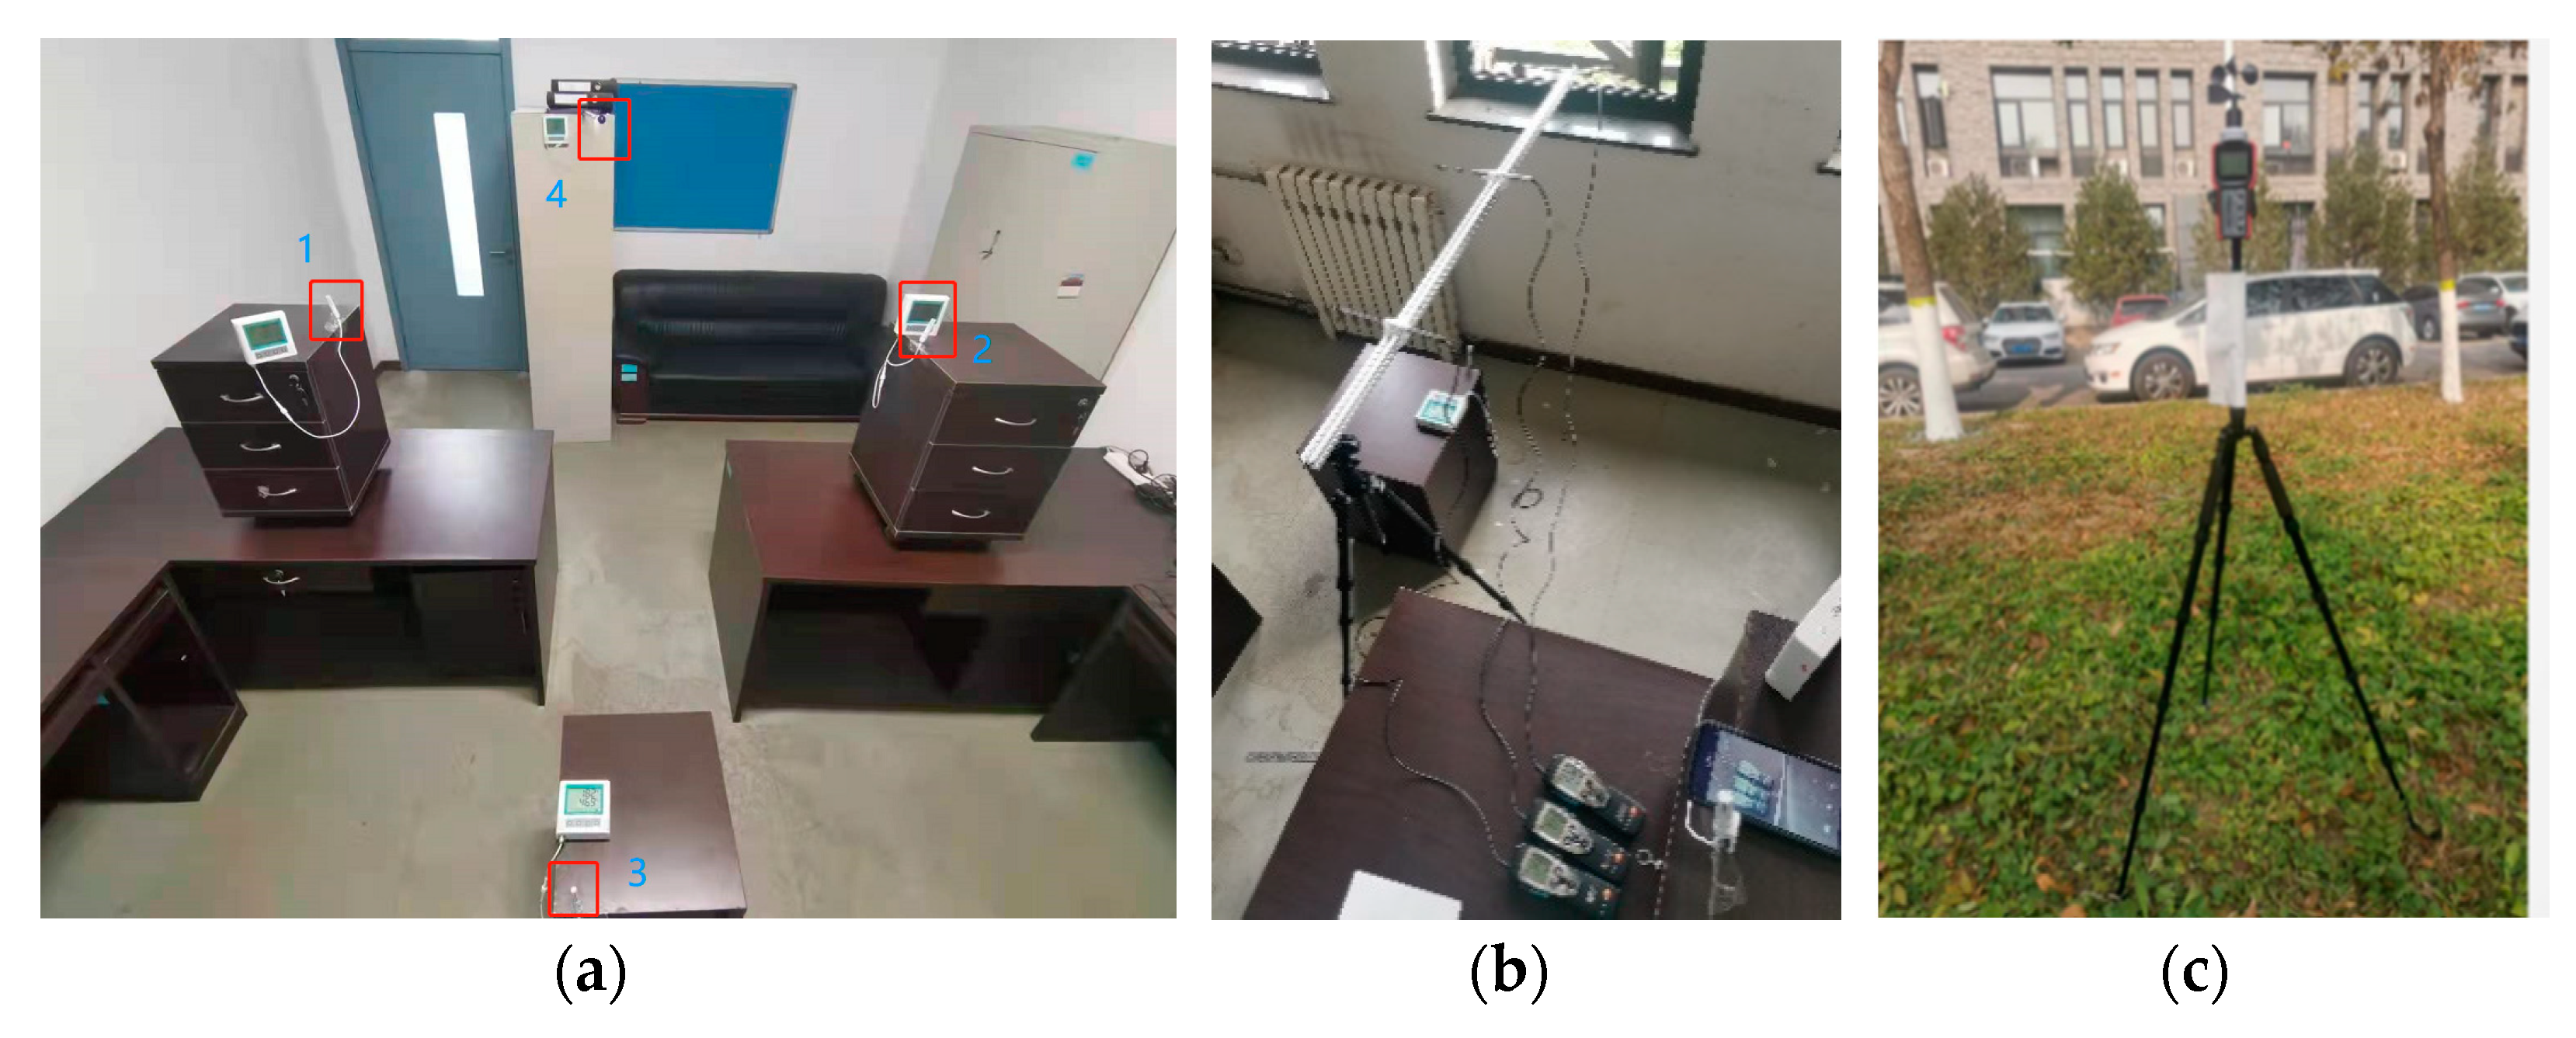
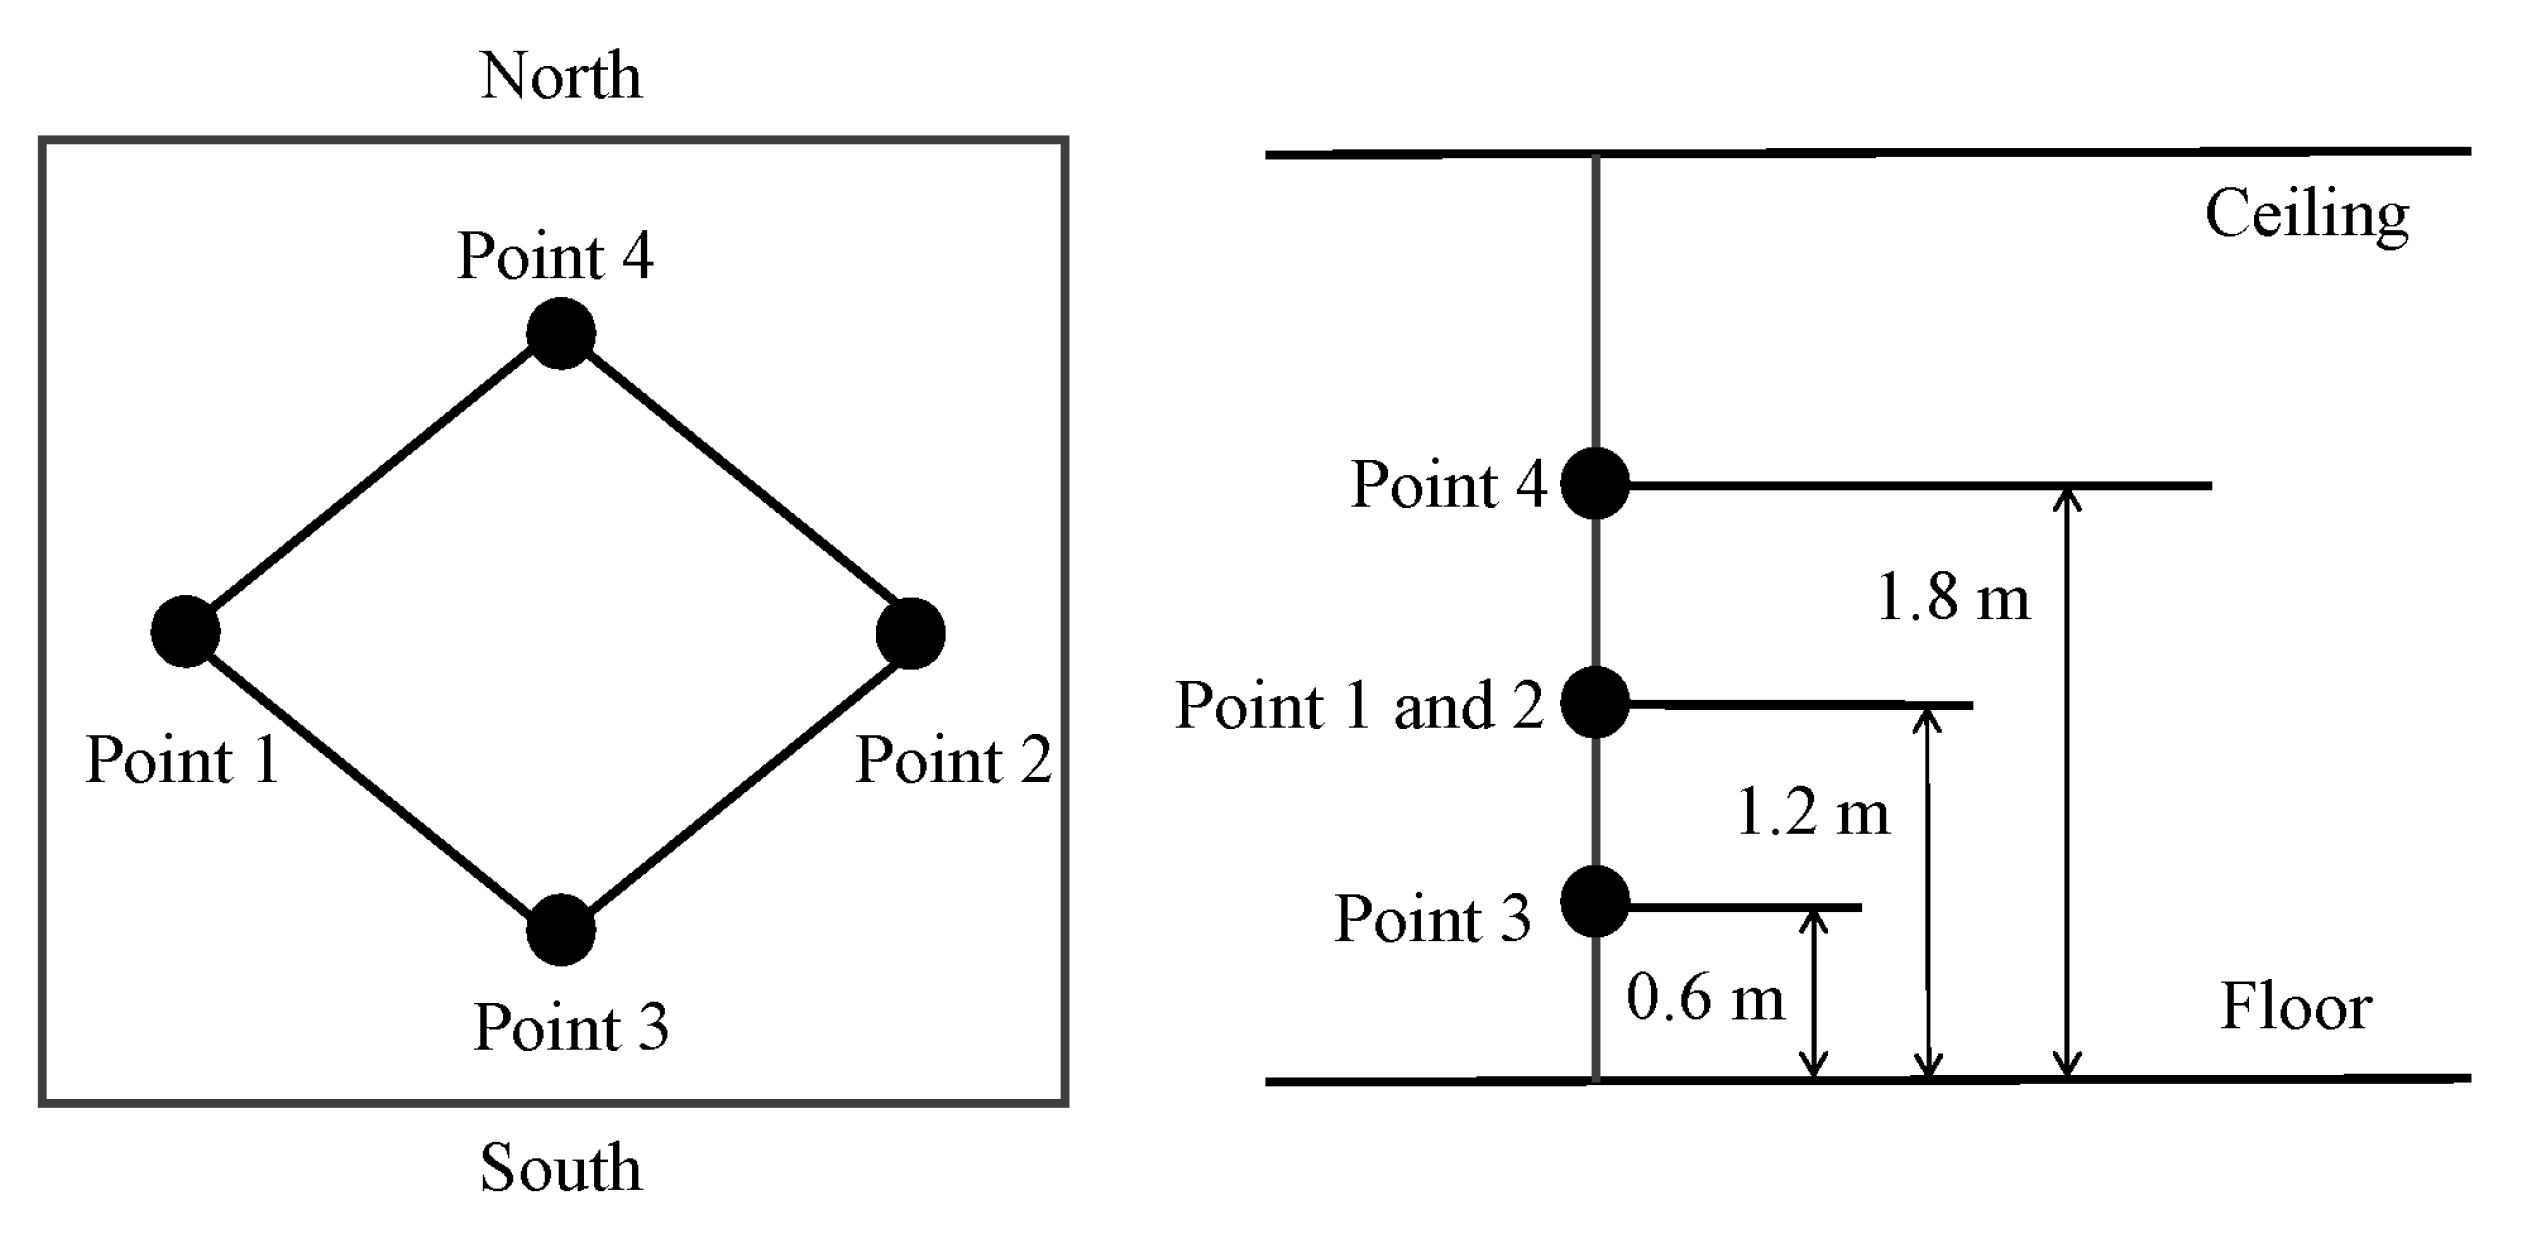
2.3. Experimental Apparatus and Measurement Methods

Our research team conducted a series of experiments to validate the simulation results of the natural ventilation model. A typical room (number 403) on the top floor in the south of building was selected to undertake the experiments (the room was assessed with permission). During summer, the south-facing rooms on the top floor tend to experience overheating than the north-facing rooms due to much higher solar gain. The testing period dated from 26 to 31 October 2021 and 30 April to 6 May 2022. During this period, the external windows of the building were always open with 30% of the opening area. Indoor air temperatures and relative humidity in certain locations of the room were measured on an hourly basis to compare with the simulation results.
As specified in Figure 6a, four measuring sensors of indoor temperature and humidity (Jianda Renke) were arranged mainly in the area where occupancies often move. There are two measuring points were located 1.2 m above floor level. Other measuring points were placed 0.6 m and 1.8 m above floor level, respectively (Figure 7). As shown in Figure 6b, three anemometers (Testo-425) were placed in the vertical plane of the opening window. The first one was located 0 m from the south façade. The other two kept 0.6 m and 1.2 m distances from the south façade. Meanwhile, a meteorological station (YIGU-QXM) placed in an open field shown in Figure 6c was used to continuously measure and record hourly outdoor air parameters, including outdoor air temperature, relative humidity, atmospheric pressure, wind speed, wind direction, and solar irradiance. The weather station’s sensors were located at 20 m from the building and 1.6 m above the ground level.
The recorded hourly meteorological data were then imported into the simulation model as outdoor environmental data to predict the indoor thermal environment. Table 3 summarises the measuring apparatus we used in this study, accompanied by the measuring range and the associated accuracy.

2.4. CFD Numerical Method

The CFD numerical method was used to evaluate the effectiveness of the natural ventilation, interior temperature, and velocity distributions. Natural ventilation is a typical turbulent flow problem. Therefore, as one of the most widely used turbulence models, the standard k-ε turbulence model (RANS family of models) was used to predict the distribution of air velocity, pressure, and temperature throughout the building space. DesignBuilder CFD module was chosen to perform the numerical calculation.
The model geometry generated in the previous thermal simulation was further used to undertake the CFD analysis. Computations were performed for the grid spacing from 0.1 to 0.3 m. The three grid sizes gave similar CFD results. Thus, 0.2 m grid spacing was chosen as the model’s computational domain considering the computation accuracy and calculation time. Figure 8 presents the meshed geometries for the computational domains including all rooms on the top floor and room No. 403 in the south direction on the same floor. The rooms in the south direction obtain a higher solar gain than those in the north direction during summer. Wall and window temperatures determined by the thermal simulation were imported into the CFD module as the boundary conditions.

3. Results and Discussion

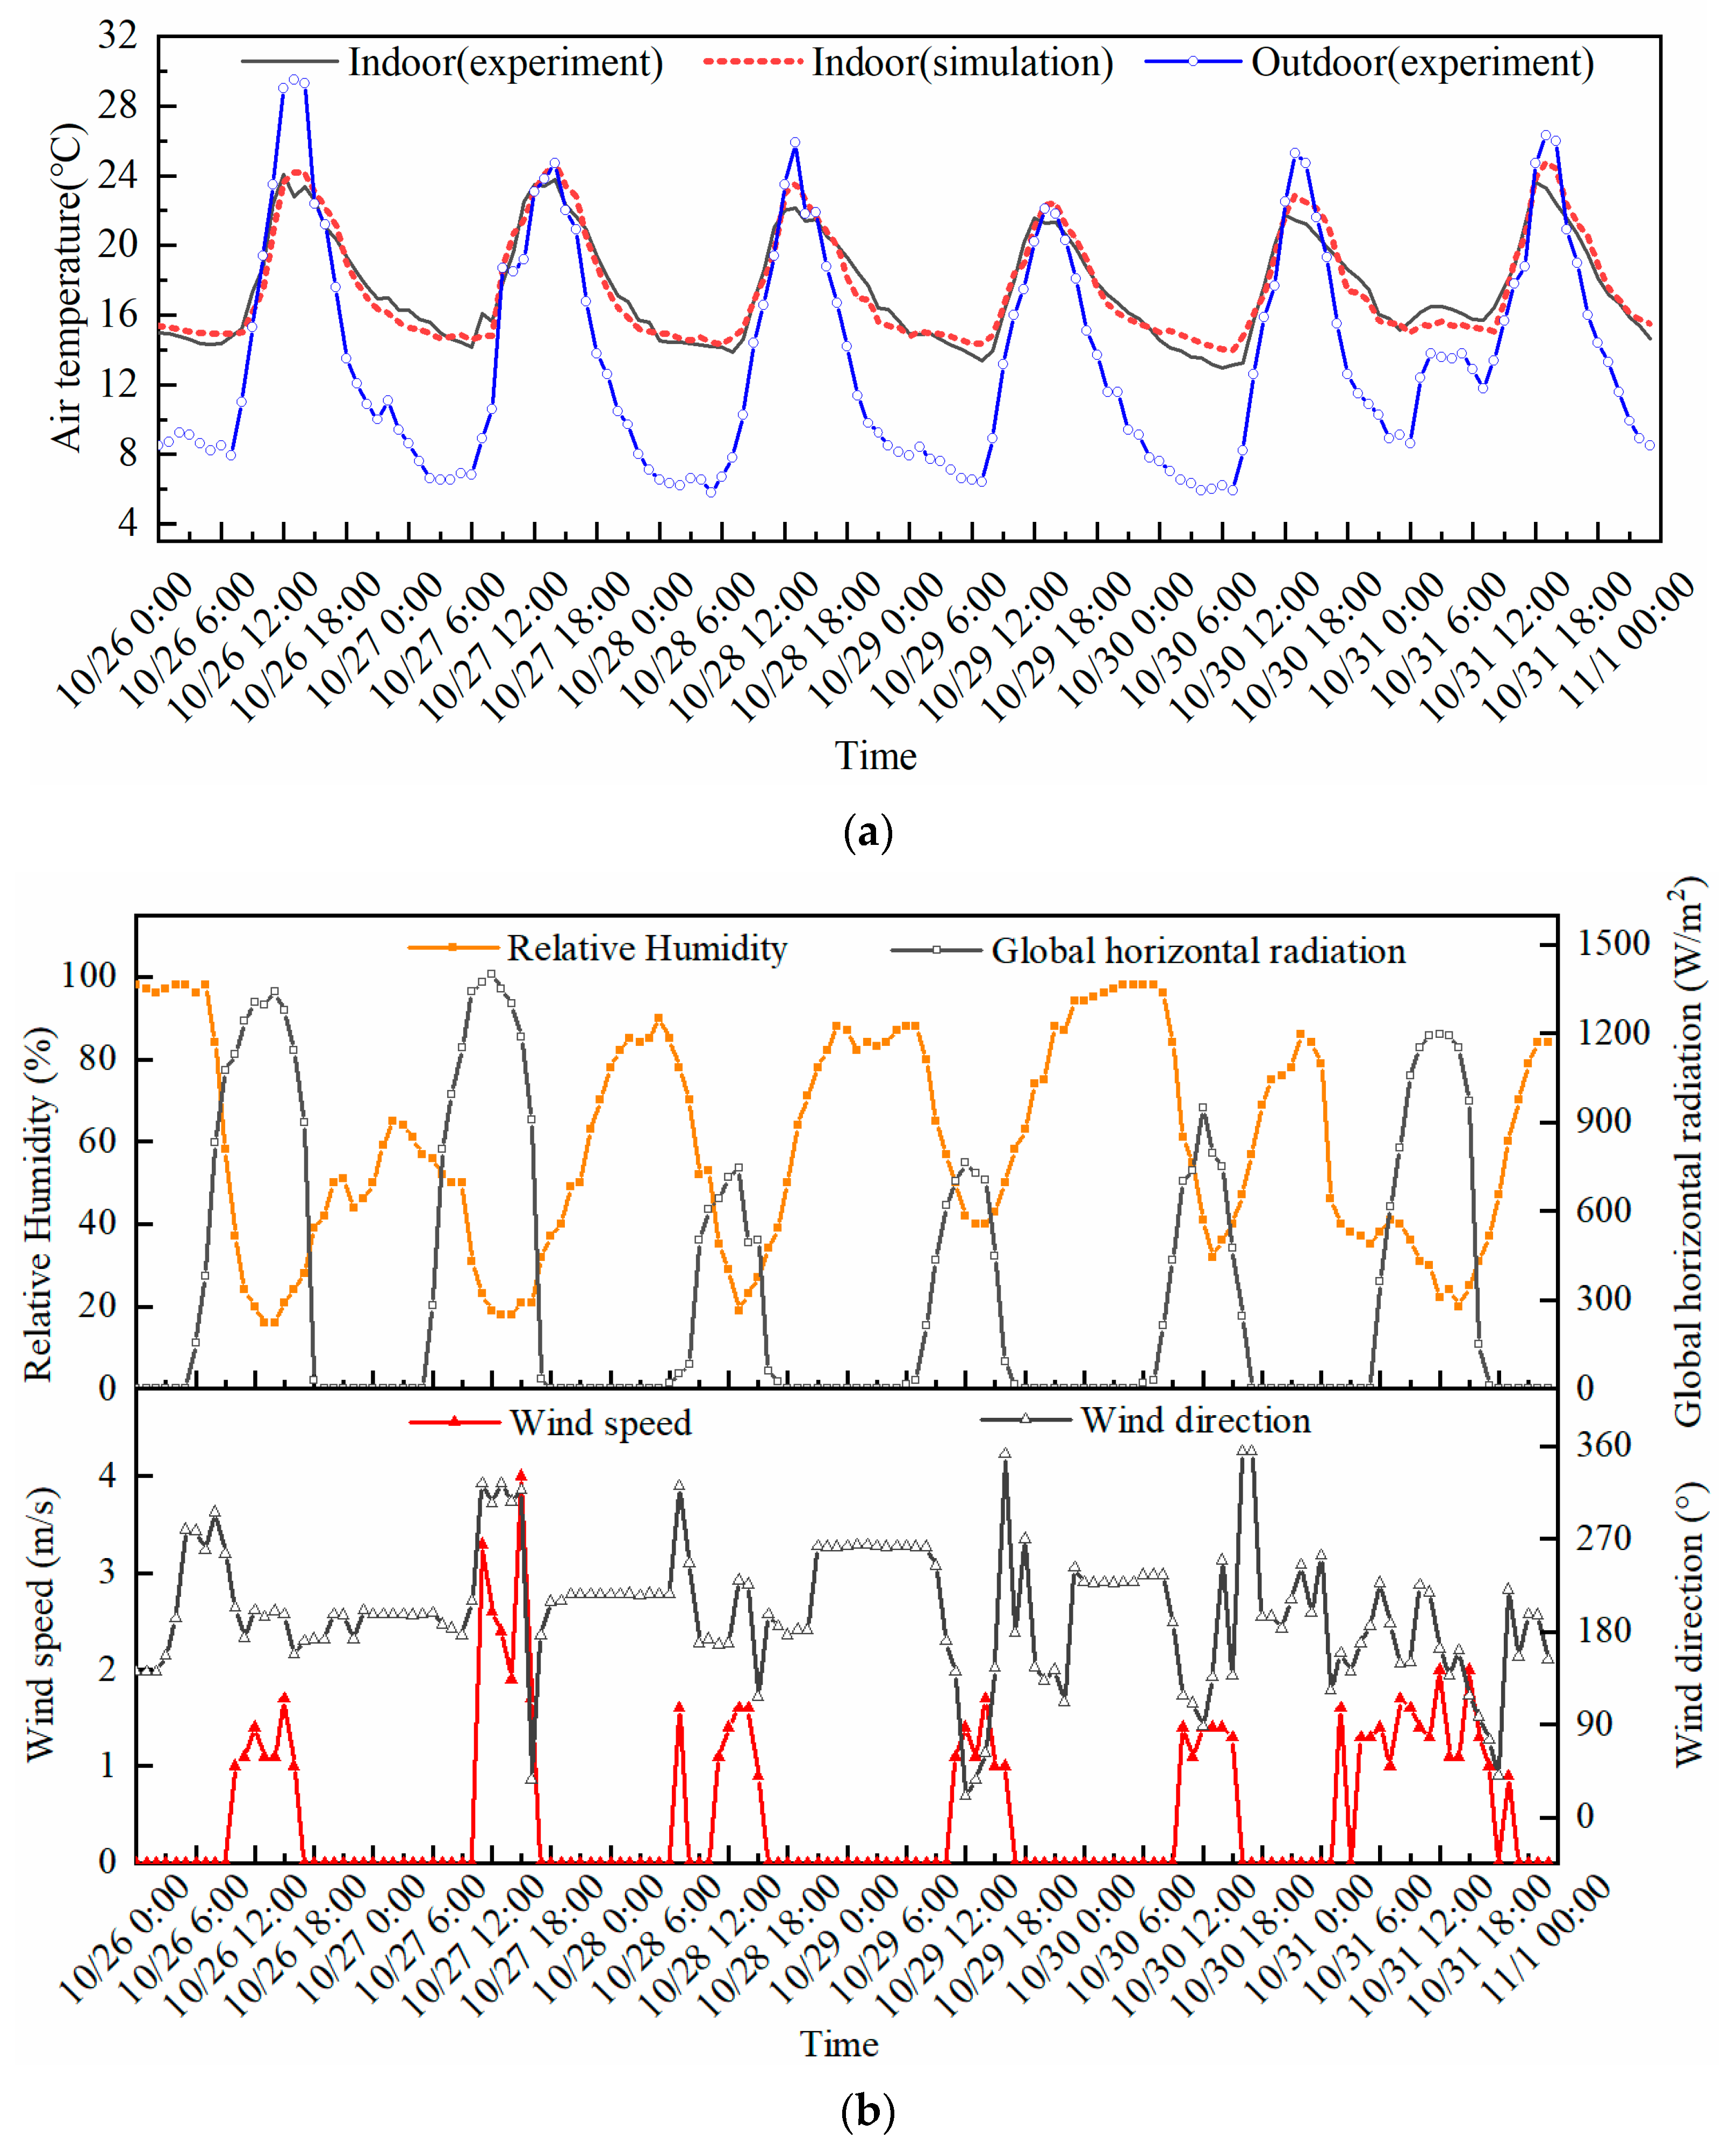
3.1. Validation of Natural Ventilation Model

Series of experiments were undertaken consistently for two periods in April, May, and October to validate the simulation results of the natural ventilation model. One period was from 30 April to 6 May 2022. The other one was dated from 26 to 31 October 2021. As shown in Figure 9 and Figure 10, indoor air temperatures were compared between the experimental and simulation results under periodic variations of outdoor air parameters.
It is noticed that air temperatures obtained by the experiment and simulation present a similar trend for the studied periods when outdoor air conditions varied periodically. In Figure 9 and Figure 10, the discrepancies between them were found to be within 9.7% and 11.24%, with an average of 3.43% and 4.0%, respectively, which are lower than the maximum difference of 25% suggested in the ASHARE handbook of fundamentals [35]. The results showed that the credibility of the natural ventilation model is good enough to predict the effects of natural ventilation on the building’s indoor thermal environment.

3.2. Thermal Performance Analysis of Mixed Cooling Mode

Room No. 403 was chosen to carry out the hourly simulation from April to October. Figure 11 shows the predicted temperature, ventilation rate, cooling load, and associated wind conditions for three days in April. During the spring season in Beijing, outdoor air temperature was cool enough to provide free cooling for the room (Free cooling was available when the indoor air temperature was higher than 22 °C but lower than 26 °C. Meanwhile, the operation schedule of mechanical ventilation coincided with the occupancy schedule for that period). Figure 11a shows that mechanical ventilation has sufficient capacity to meet the cooling load from 8:00 a.m. to 9:00 a.m. at the rate of 1.5 ac/h. After 9:00 a.m., the mechanical ventilation mode changed to natural ventilation induced by wind and stack pressures due to the temperature control strategies and ventilation schedule time. Cool air blowing from the operable window delivered sufficient cooling to maintain the indoor temperature at the cooling setpoint temperature (26 °C). The window opening factor is shown in the Figure 11b.
The thermal simulation was undertaken for the August in the summer season for three days. Figure 12 depicts the predicted temperature, ventilation, and load profiles on an hourly basis. Due to the mixed-mode cooling strategy, internal air temperature can be controlled within 24 °C–26 °C. From 8:00 a.m. to 12:00 p.m., mechanical ventilation was turned on to provide free cooling for the space when the outdoor air temperature was lower than the cooling setpoint temperature. After 8:00 a.m., the mechanical ventilation rate increased rapidly to a maximum of 15 ac/h for best use of outdoor free cooling (economiser mode). Then at noon, mechanical ventilation switched to the VAV cooling mode with a constant ventilation rate of 2 ac/h. Then the VAV operated continuously until 19:00 p.m. Natural ventilation was turned on between 19:00 p.m. and 7:00 a.m. to deliver night cooling for the space, which was able to reduce the cooling requirements the following day.
Figure 13 plots the simulation results for three days in October. The natural ventilation reduced the indoor temperatures below 26 °C.

3.3. Thermal Comfort Criteria

In many previous studies [23,24,37,38,39], the PMV model and adaptive model as described in CIBSE Guide [40], EN 15251 [41], and ASHRAE Standard55 [31] were compared to analyse the thermal comfort of mixed-mode buildings. The adaptive comfort model offered in EN 15251 is more suitable for studying thermal comfort in rooms with natural ventilation, while the PMV model is more appropriate for use in air conditioning systems [23,25,38].
The study analysed hourly predicted results using the PMV model and adaptive model according to different operating modes. As shown in Figure 14a, the hourly PMV data were all distributed within [−1, 1], while all the hourly PPD data were within 27% for the months from April to October, which complies with the requirement of the second thermal comfort category specified in the China National Standard “Design Code for Heating Ventilation and Air Conditioning of Civil Buildings (GB 50736-2012)” [36].
Based on the adaptive model specified in EN 15251, Figure 15 depicts the distribution of the hourly indoor operative temperature with a varied daily mean outdoor temperature for the natural ventilation mode. The upper and lower limits of the indoor temperature are indicated in the graph as well. We noticed that around 92% of the total hourly indoor operative temperature data fall into the limitation of the third category of adaptive thermal comfort.
The thermal comfort indices of this study were compared to that of mixed-mode office building located under similar climate condition [24]. Similar distributions of PMV were found for both studies with a similar climate topology [24]. As demonstrated in Figure 14b, in the air conditioning mode, the PMV data in both studies were distributed in [0, 1]. In the natural ventilation mode, PMV was distributed mainly in [−0.5, 1].

3.4. CFD Simulation Results and Validation

Figure 16 shows the validation of indoor air velocity distributions between the CFD simulated and experimental results. For the different wind directions (southeast, south, and w–southwest), indoor air velocity showed similar falling trends along the distance from the south façade. The simulated and experimental results were in good agreement, with a maximum discrepancy of 18.03% and an average error of 9.05%, showing that the CFD simulation model can provide accurate prediction results for indoor air velocity distribution.
Figure 17 illustrates the simulated indoor air velocity and temperature distributions for the most occurring wind direction (180°) during the study period. The display slice of CFD results was placed in the vertical section of the opening window. The results noticed different flow patterns for the conditions with the internal door closing and opening. Cross-ventilation occurred for the situation with doors opening, resulting in increased air velocity compared against the conditions with the door closing. The velocity was increased from 0.06 to 0.19 m/s at a monitor point located in the middle of the display slice for the length direction and 1.2 m for the height direction. Meanwhile, the indoor air temperature was reduced because of velocity rise. The temperature at the monitor point fell from 26.75 to 24.47 °C.
Figure 18 displays the temperature and velocity distributions at the 1.2 m height for the top floor of the naturally ventilated building for the conditions of closing and opening internal doors. The boundary conditions of walls, windows temperatures, and airflow rates through the openings were output directly from the thermal simulation at 16:00 on 27 October.
It can be noticed the south-facing rooms have a higher internal temperature than the north-facing rooms, whether doors are closed or opened. Cross-ventilation occurred for the conditions with doors opened. From the velocity contour, we observed that the outdoor air blows from the opening windows in the south to the north through the common corridor. The air temperature in the south rooms kept almost the same temperature between 23.87 °C–24.35 °C, a little lower than the air temperature conditions (24.89 °C–25.84 °C) with doors closing. The indoor air velocity was increased by the cross-ventilation from 0.06 to 0.24 m/s approximately, which meets the comfort requirement for indoor occupancy.
Predicted indoor temperatures on top floor were around 1 °C higher than that on the ground, first, and second floors due to the buoyancy effect. Therefore, the top floor was selected as the studied case. Other floors’ CFD results are not provided here.

3.5. Energy Use Assessment

The paper also predicted the hourly cooling electricity consumption for the building operated under the mixed-mode cooling scenario from April to October. A simple HVAC model (VAV template was selected) in DesignBuilder was used to calculate the energy consumption of the cooling system based on the system load and seasonal energy efficiency without considering the complexity of a detailed HVAC. The simulation results were compared to that operated in a mechanical cooling scenario, in which the cooling setpoint temperature remains the same. The cooling system seasonal coefficient of performance (COP) was defined as 3.2 in each zone that was used to calculate the electricity consumption of the cooling system required to meet the cooling demand. The COP value includes the effect of all the energy consumption associated with the cooling system such as the fan and pump energy, chiller inefficiency, control equipment, etc. The monthly cooling electricity use for the two operation scenarios was accumulated using the hourly results that were plotted in Figure 19. The percentages of energy savings by the mixed-mode were indicated in the graph. It shows that the mixed-mode system can save the greatest amount of cooling electricity for the months including April, May, September, and October due to the availability of natural ventilation. The percentage of saving ranged from 27.8% to 81.0% for the months from May to September. For the hottest month in Beijing, the lowest amount of energy saving was 27.8%. Nearly 95–98% of cooling electricity can be cut for April and October, only allowing the mechanical cooling system to operate for a few hours on rare hot occasions. Fan power was required for mechanical ventilation when outdoor wind conditions did not meet the demand for natural ventilation. For the annual period from April to October, almost 45.4% of cooling electricity can be reduced totally by the proposed mixed cooling mode compared against the mechanical cooling mode.

3.6. Limitation of This Study

The feasibility of applying natural ventilation to commercial buildings depends on various factors including outdoor climate temperature, wind conditions, outdoor air pollution, outdoor noise level, building’s thermal mass, and occupancy density. However, indoor CO2 concentrations and air pollution of the mixed-mode building have not been investigated here. Due to the limitation of instruments, thermal comfort criteria of the mixed-mode building were merely evaluated by modelling. There is a gap between the modelling and experimental results. On-site thermal comfort monitoring will be investigated in future studies. Additionally, this study focuses on a high thermal mass office building located in a rural area of Beijing with continental climates. The feasibility of applying mixed-mode office buildings to different thermal mass, surrounding climate conditions, and location areas (urban and suburban areas) will be considered in the future. Moreover, the dynamic performance of a detailed HVAC system will be further studied.

4. Concluding Remarks

This paper predicted the dynamic thermal performance of an existing office building in Beijing operating under changeover mixed cooling mode. The climatic conditions of Beijing were analysed beforehand to justify the feasibility of natural ventilation for the region. Dynamic thermal simulation was undertaken to predict the fresh air flow rate of natural ventilation by a multi-zone airflow network model, which was validated with on-site experimental results. The experiments were carried out to test outdoor weather data and indoor air parameters of a typical building room over two separate periods of 6 days in October 2021 and April 2022. The study compared the real indoor air temperatures to the predicted indoor air temperatures deriving from the building thermal simulation with the actual weather data. Thermal comfort criteria based on PMV and adaptive comfort models were assessed using the results of building thermal simulation. In addition to thermal simulation, CFD numerical simulation was conducted to predict the distributions of indoor air temperature and velocity for the natural ventilated building. Experiments were undertaken to validate the distribution of indoor air velocity. Eventually, the energy-saving potential of the mixed-mode building was evaluated for the annual period from April to October by comparing it to the case operated in the mechanical cooling mode. The following conclusions can be drawn from the study:
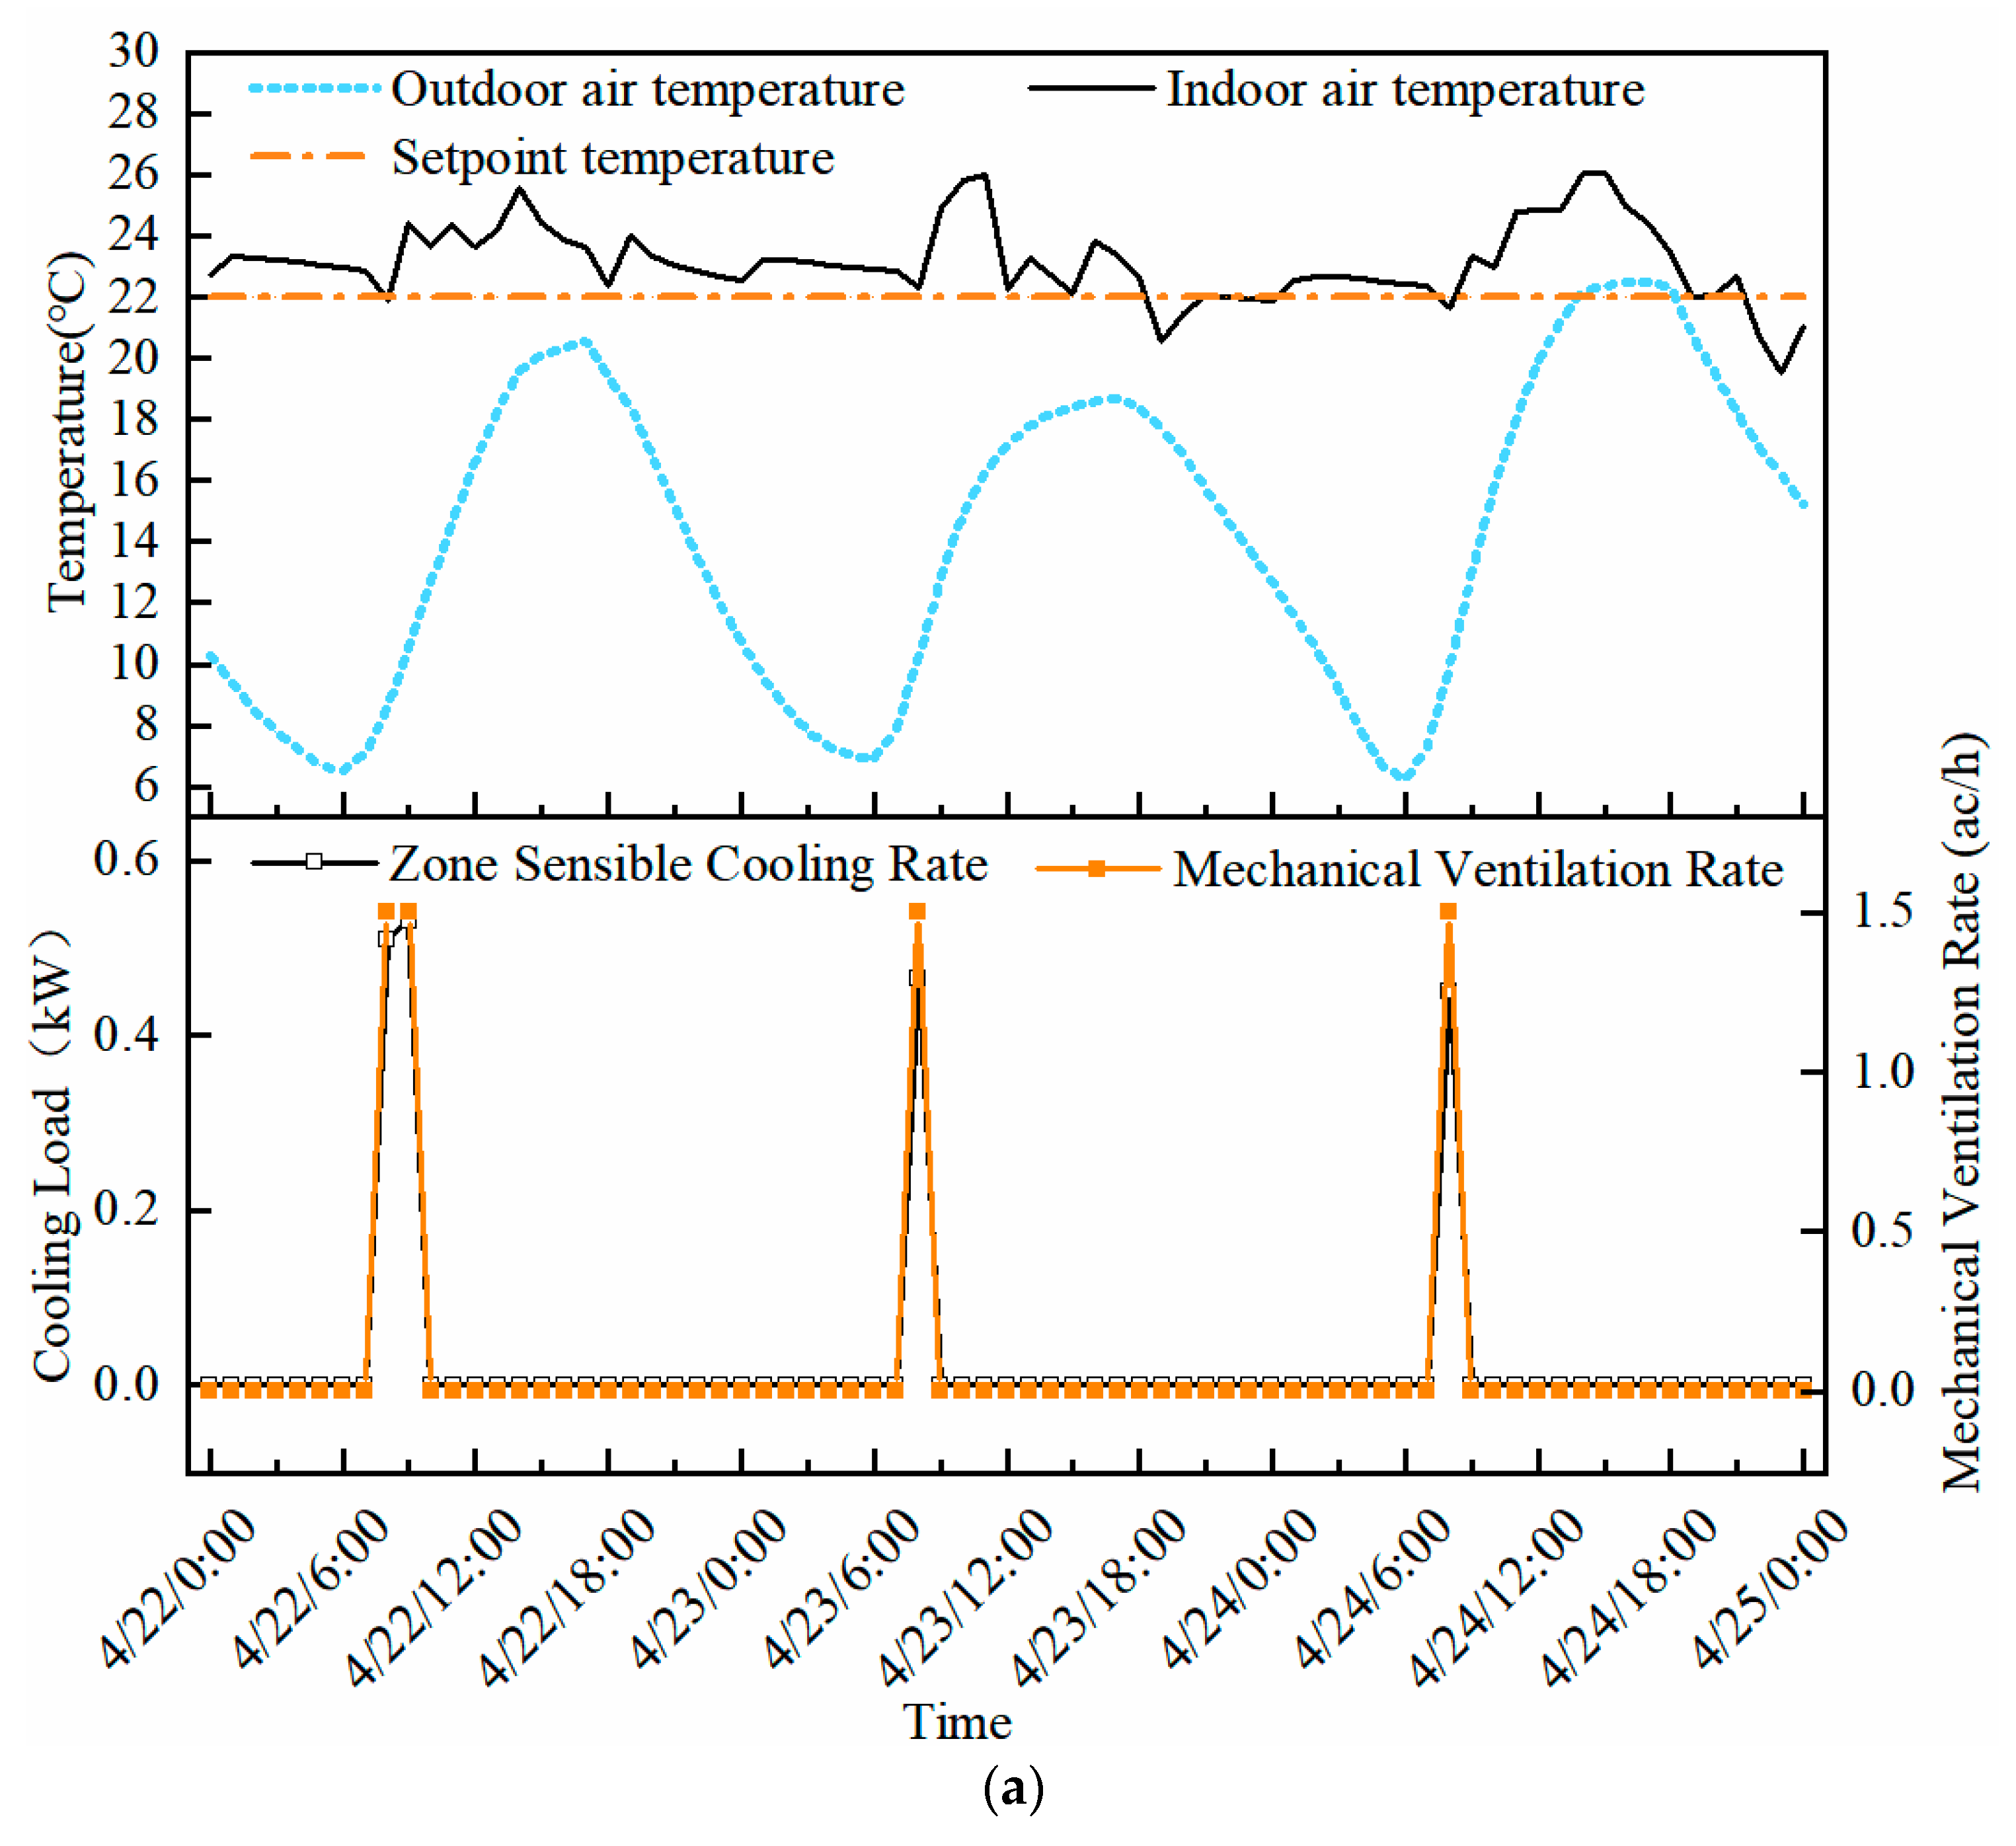
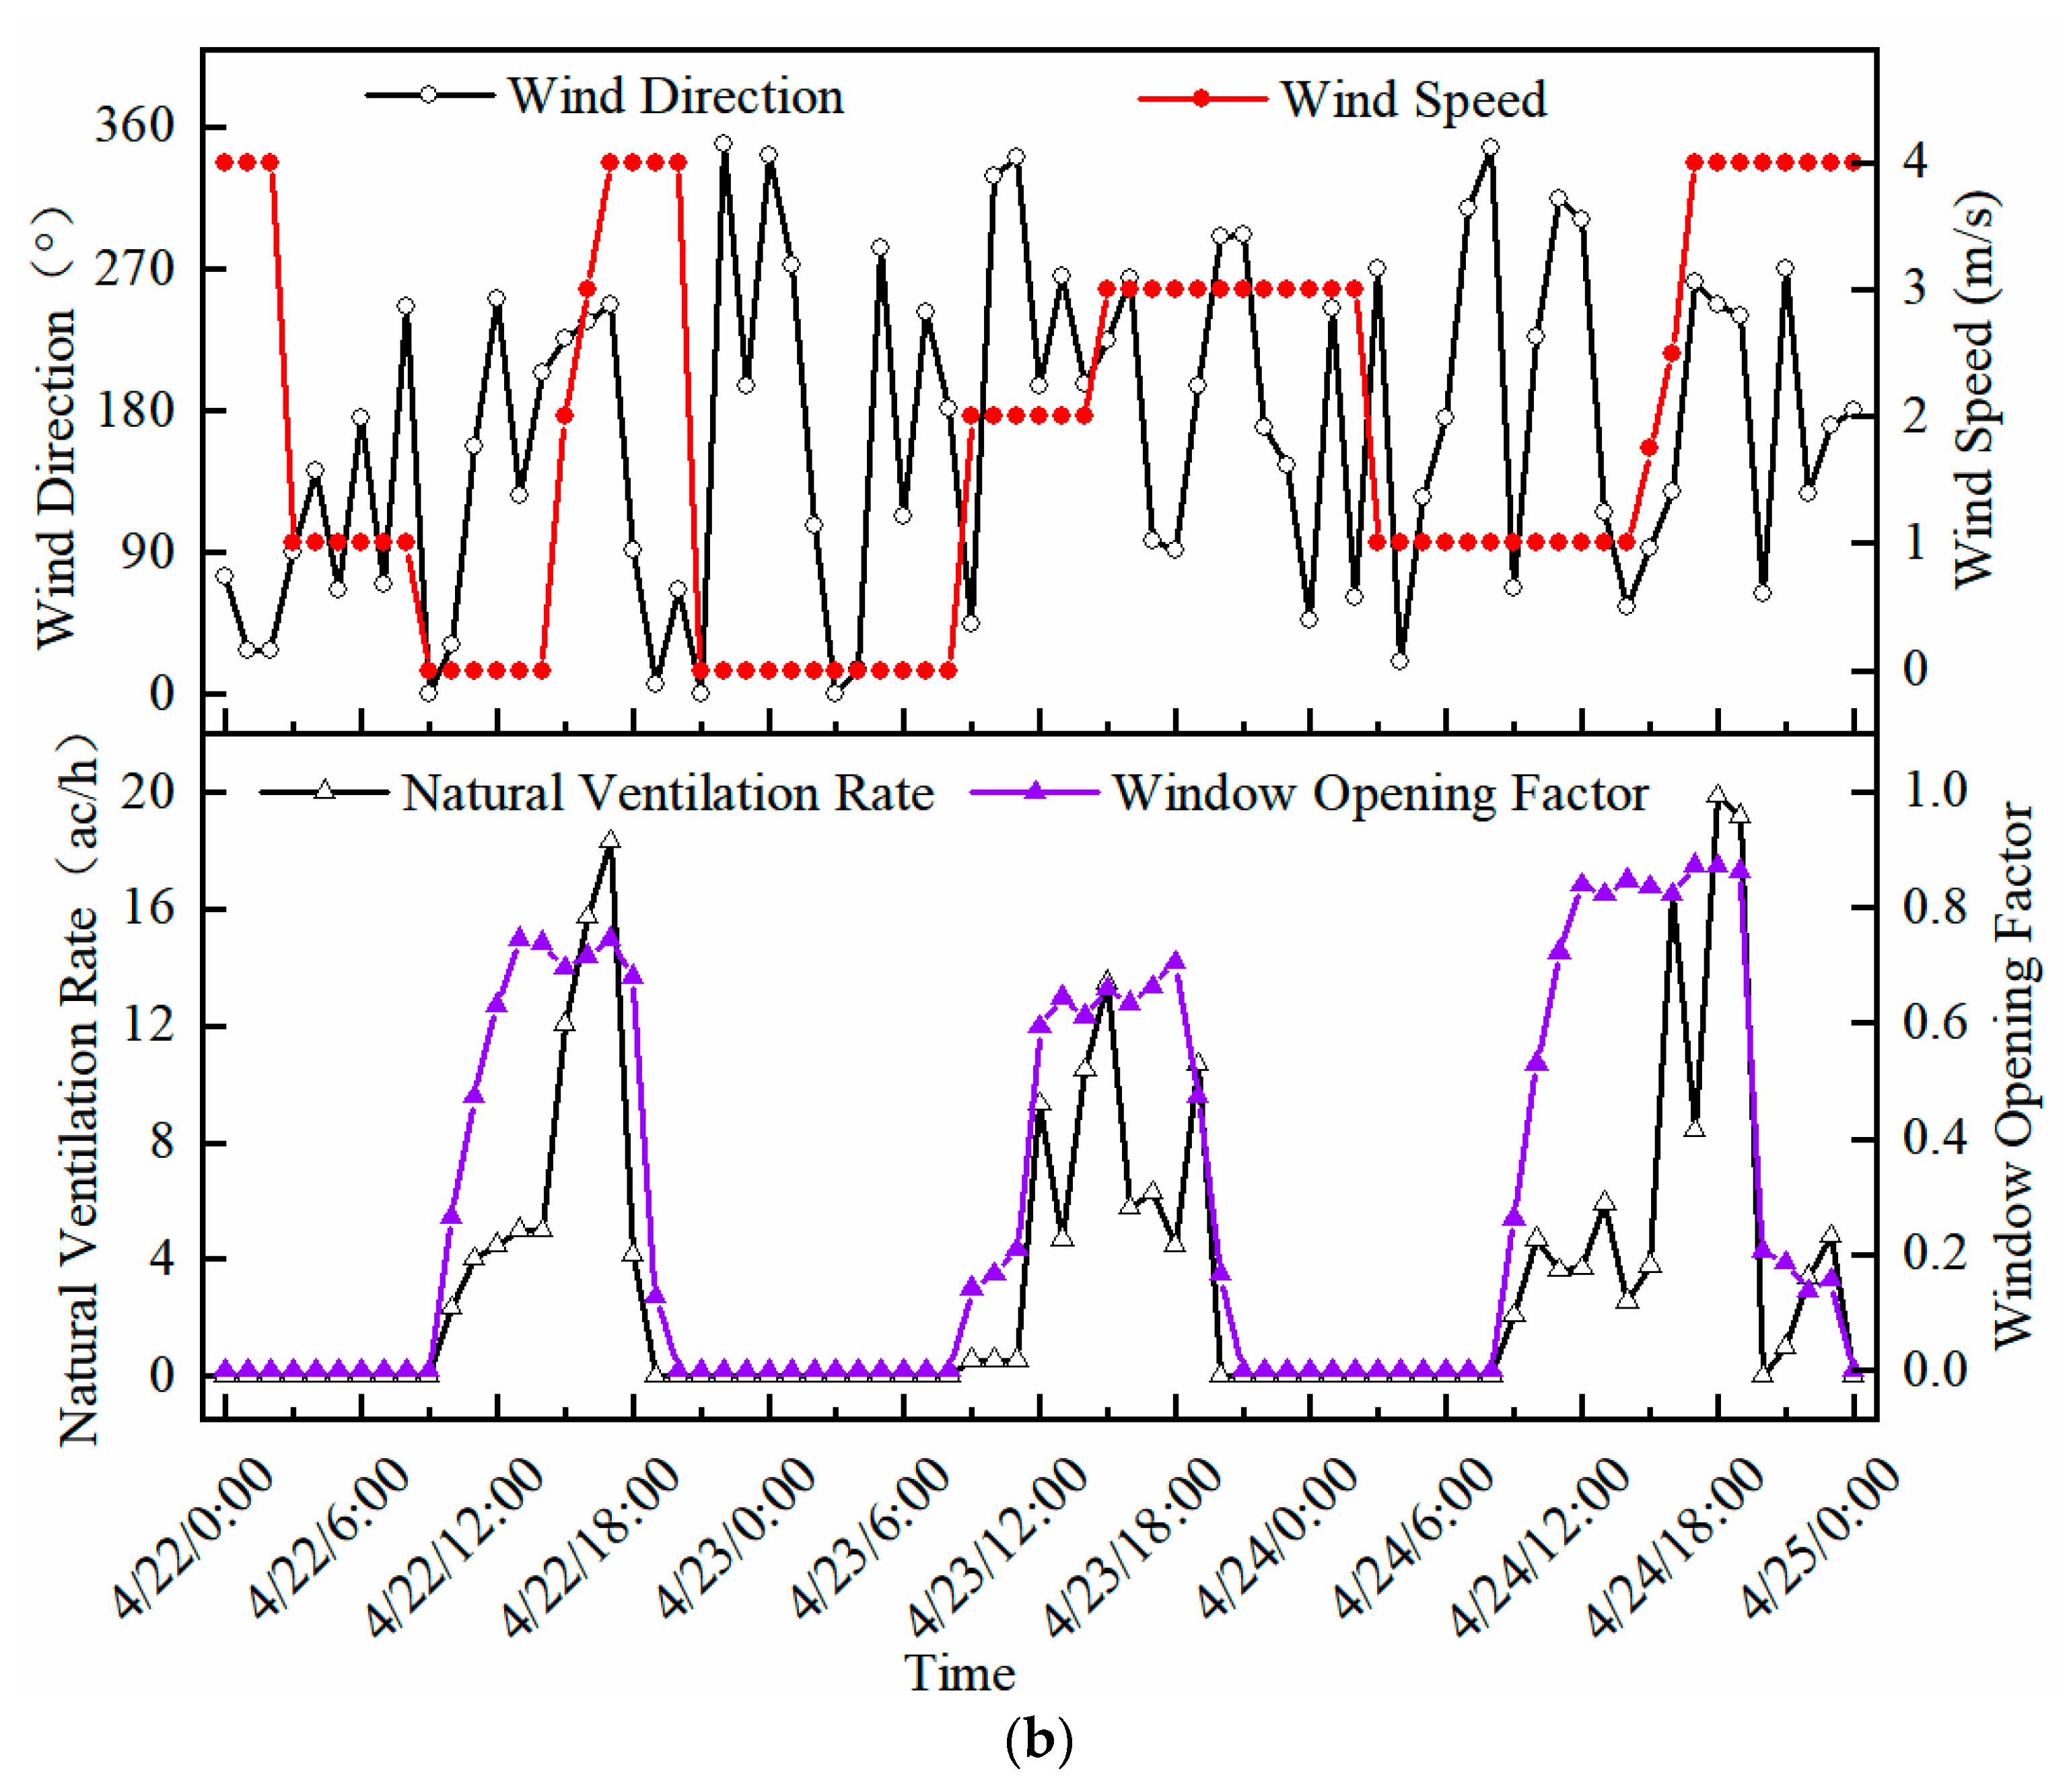
  • For most of days in April, the indoor comfort temperature of the office building can be satisfied with natural ventilation and occasional mechanical ventilation. The mechanical ventilation was only required to operate for one or two hours in the early morning to reduce the indoor air temperature. Then from 10:00 to 18:00, fresh air blowing from the operable window of the room was able to provide sufficient cooling to maintain the indoor cooling setpoint temperature.
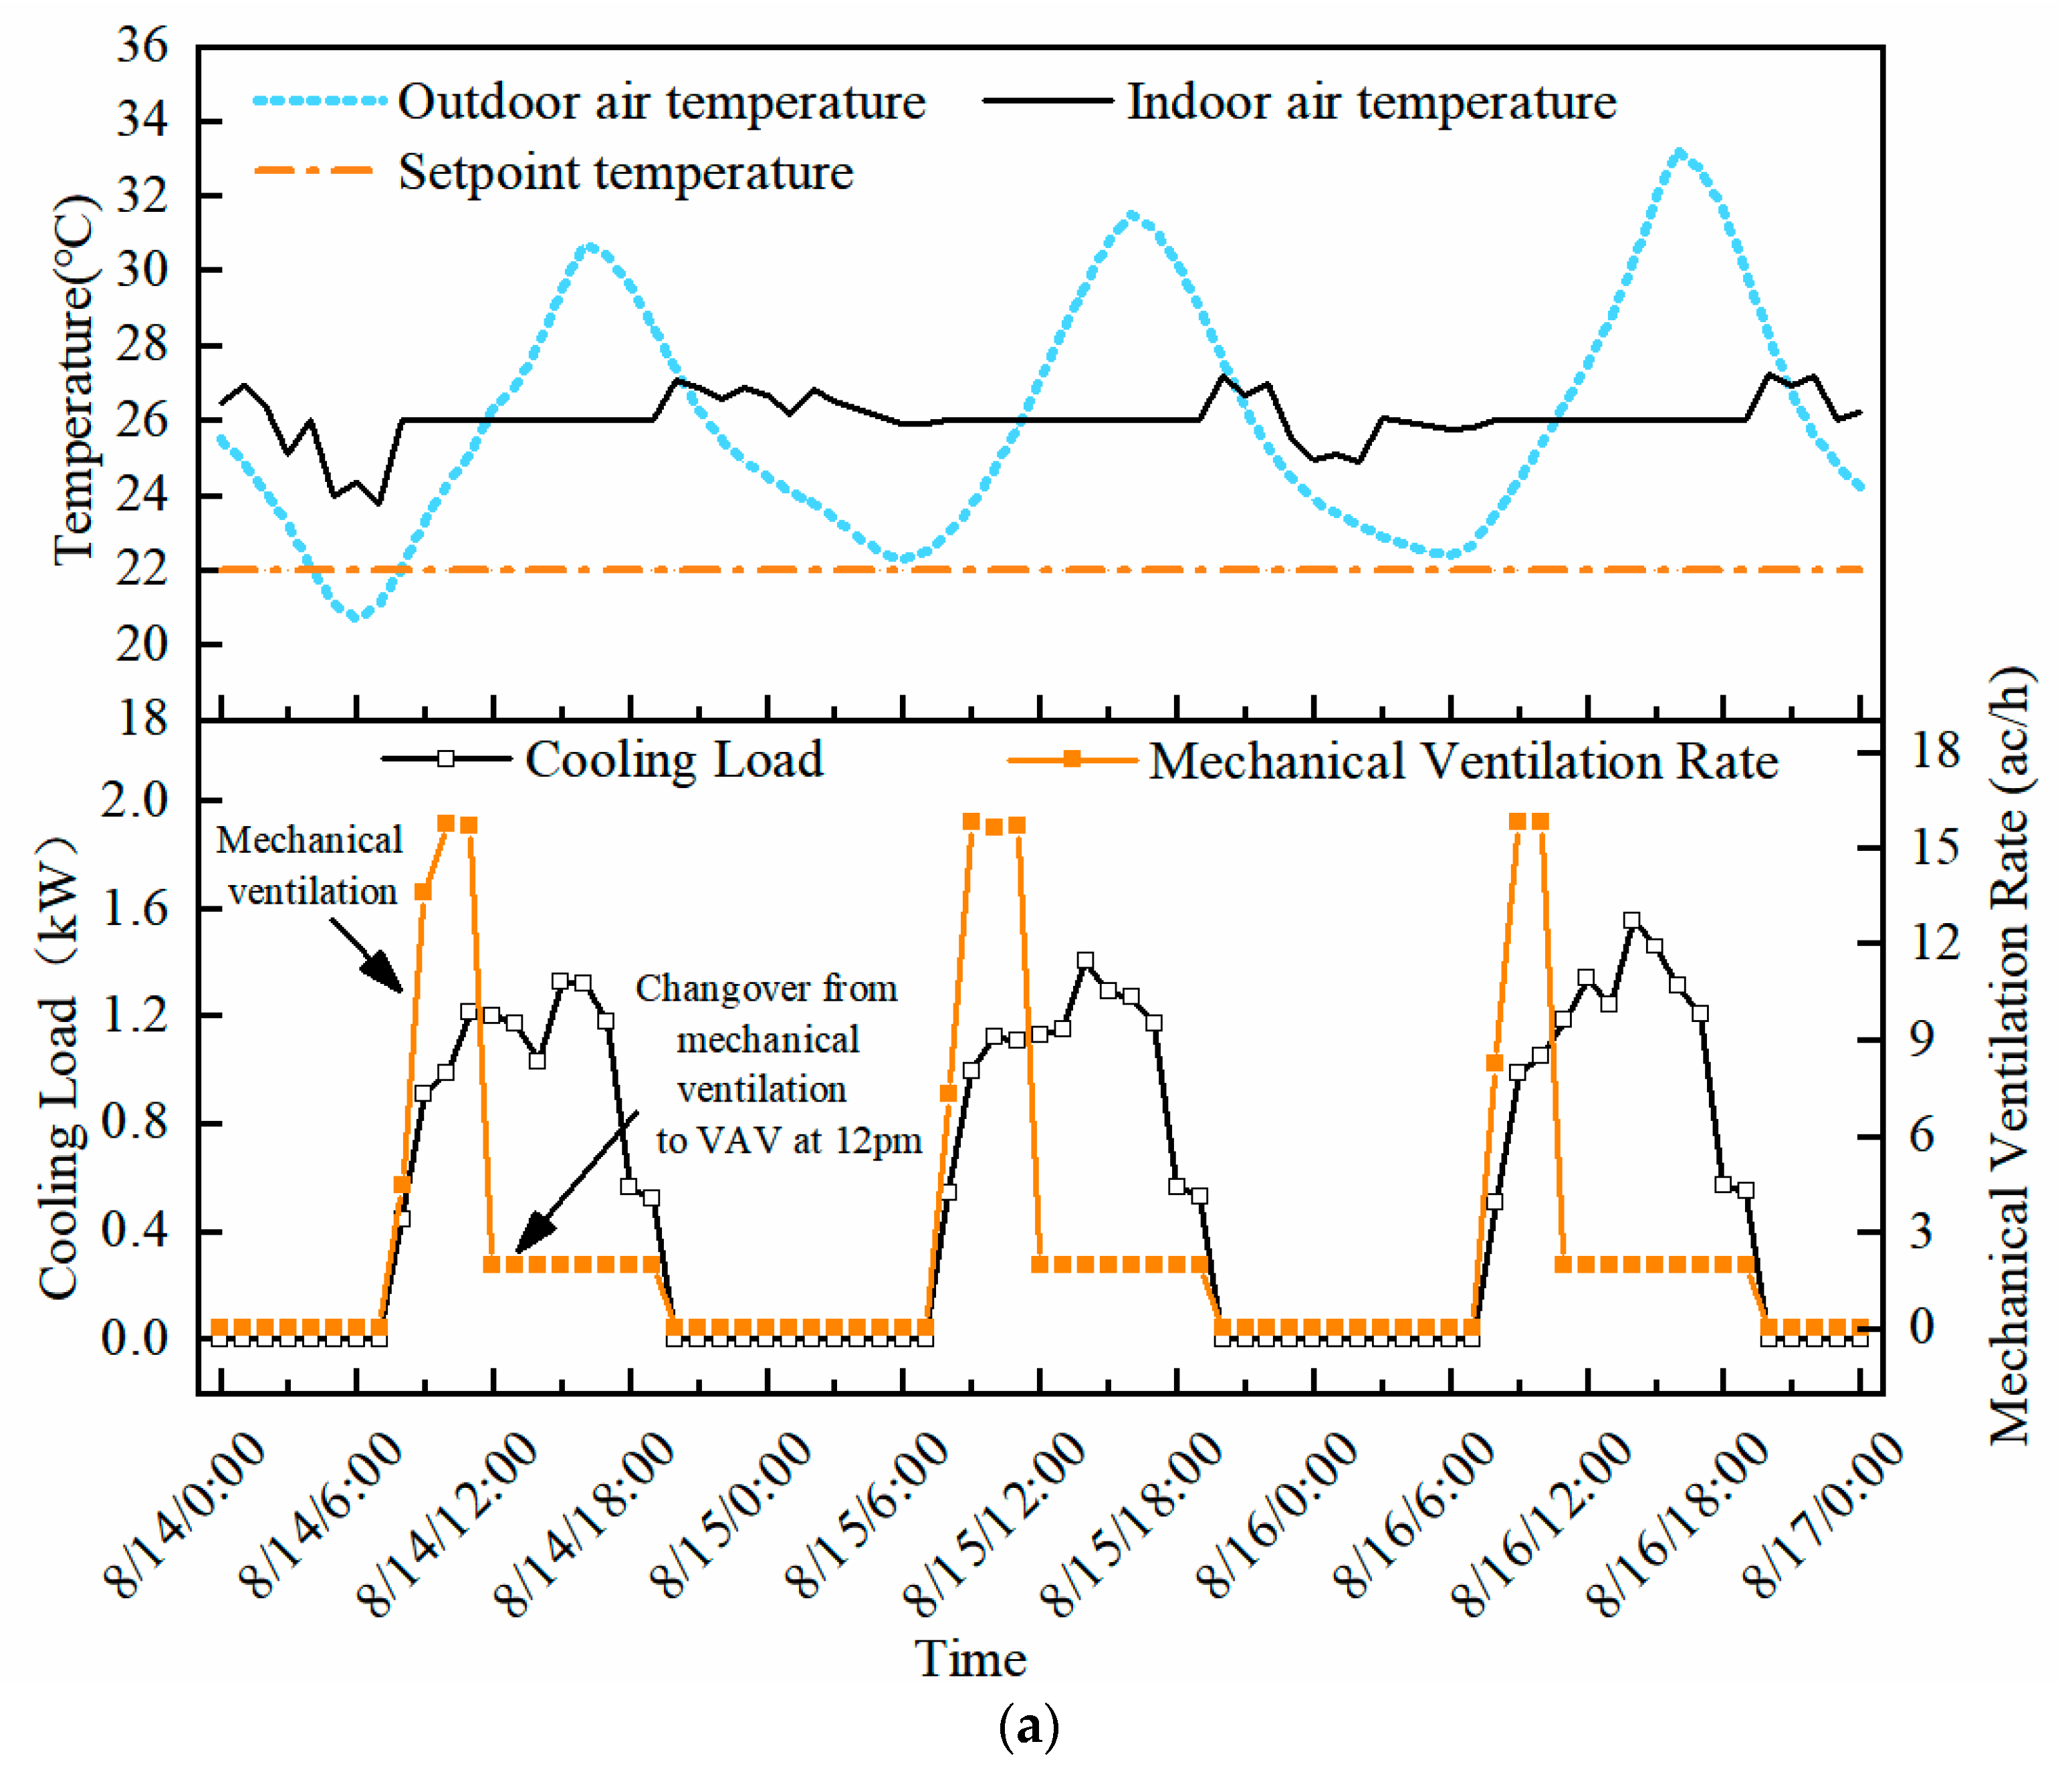
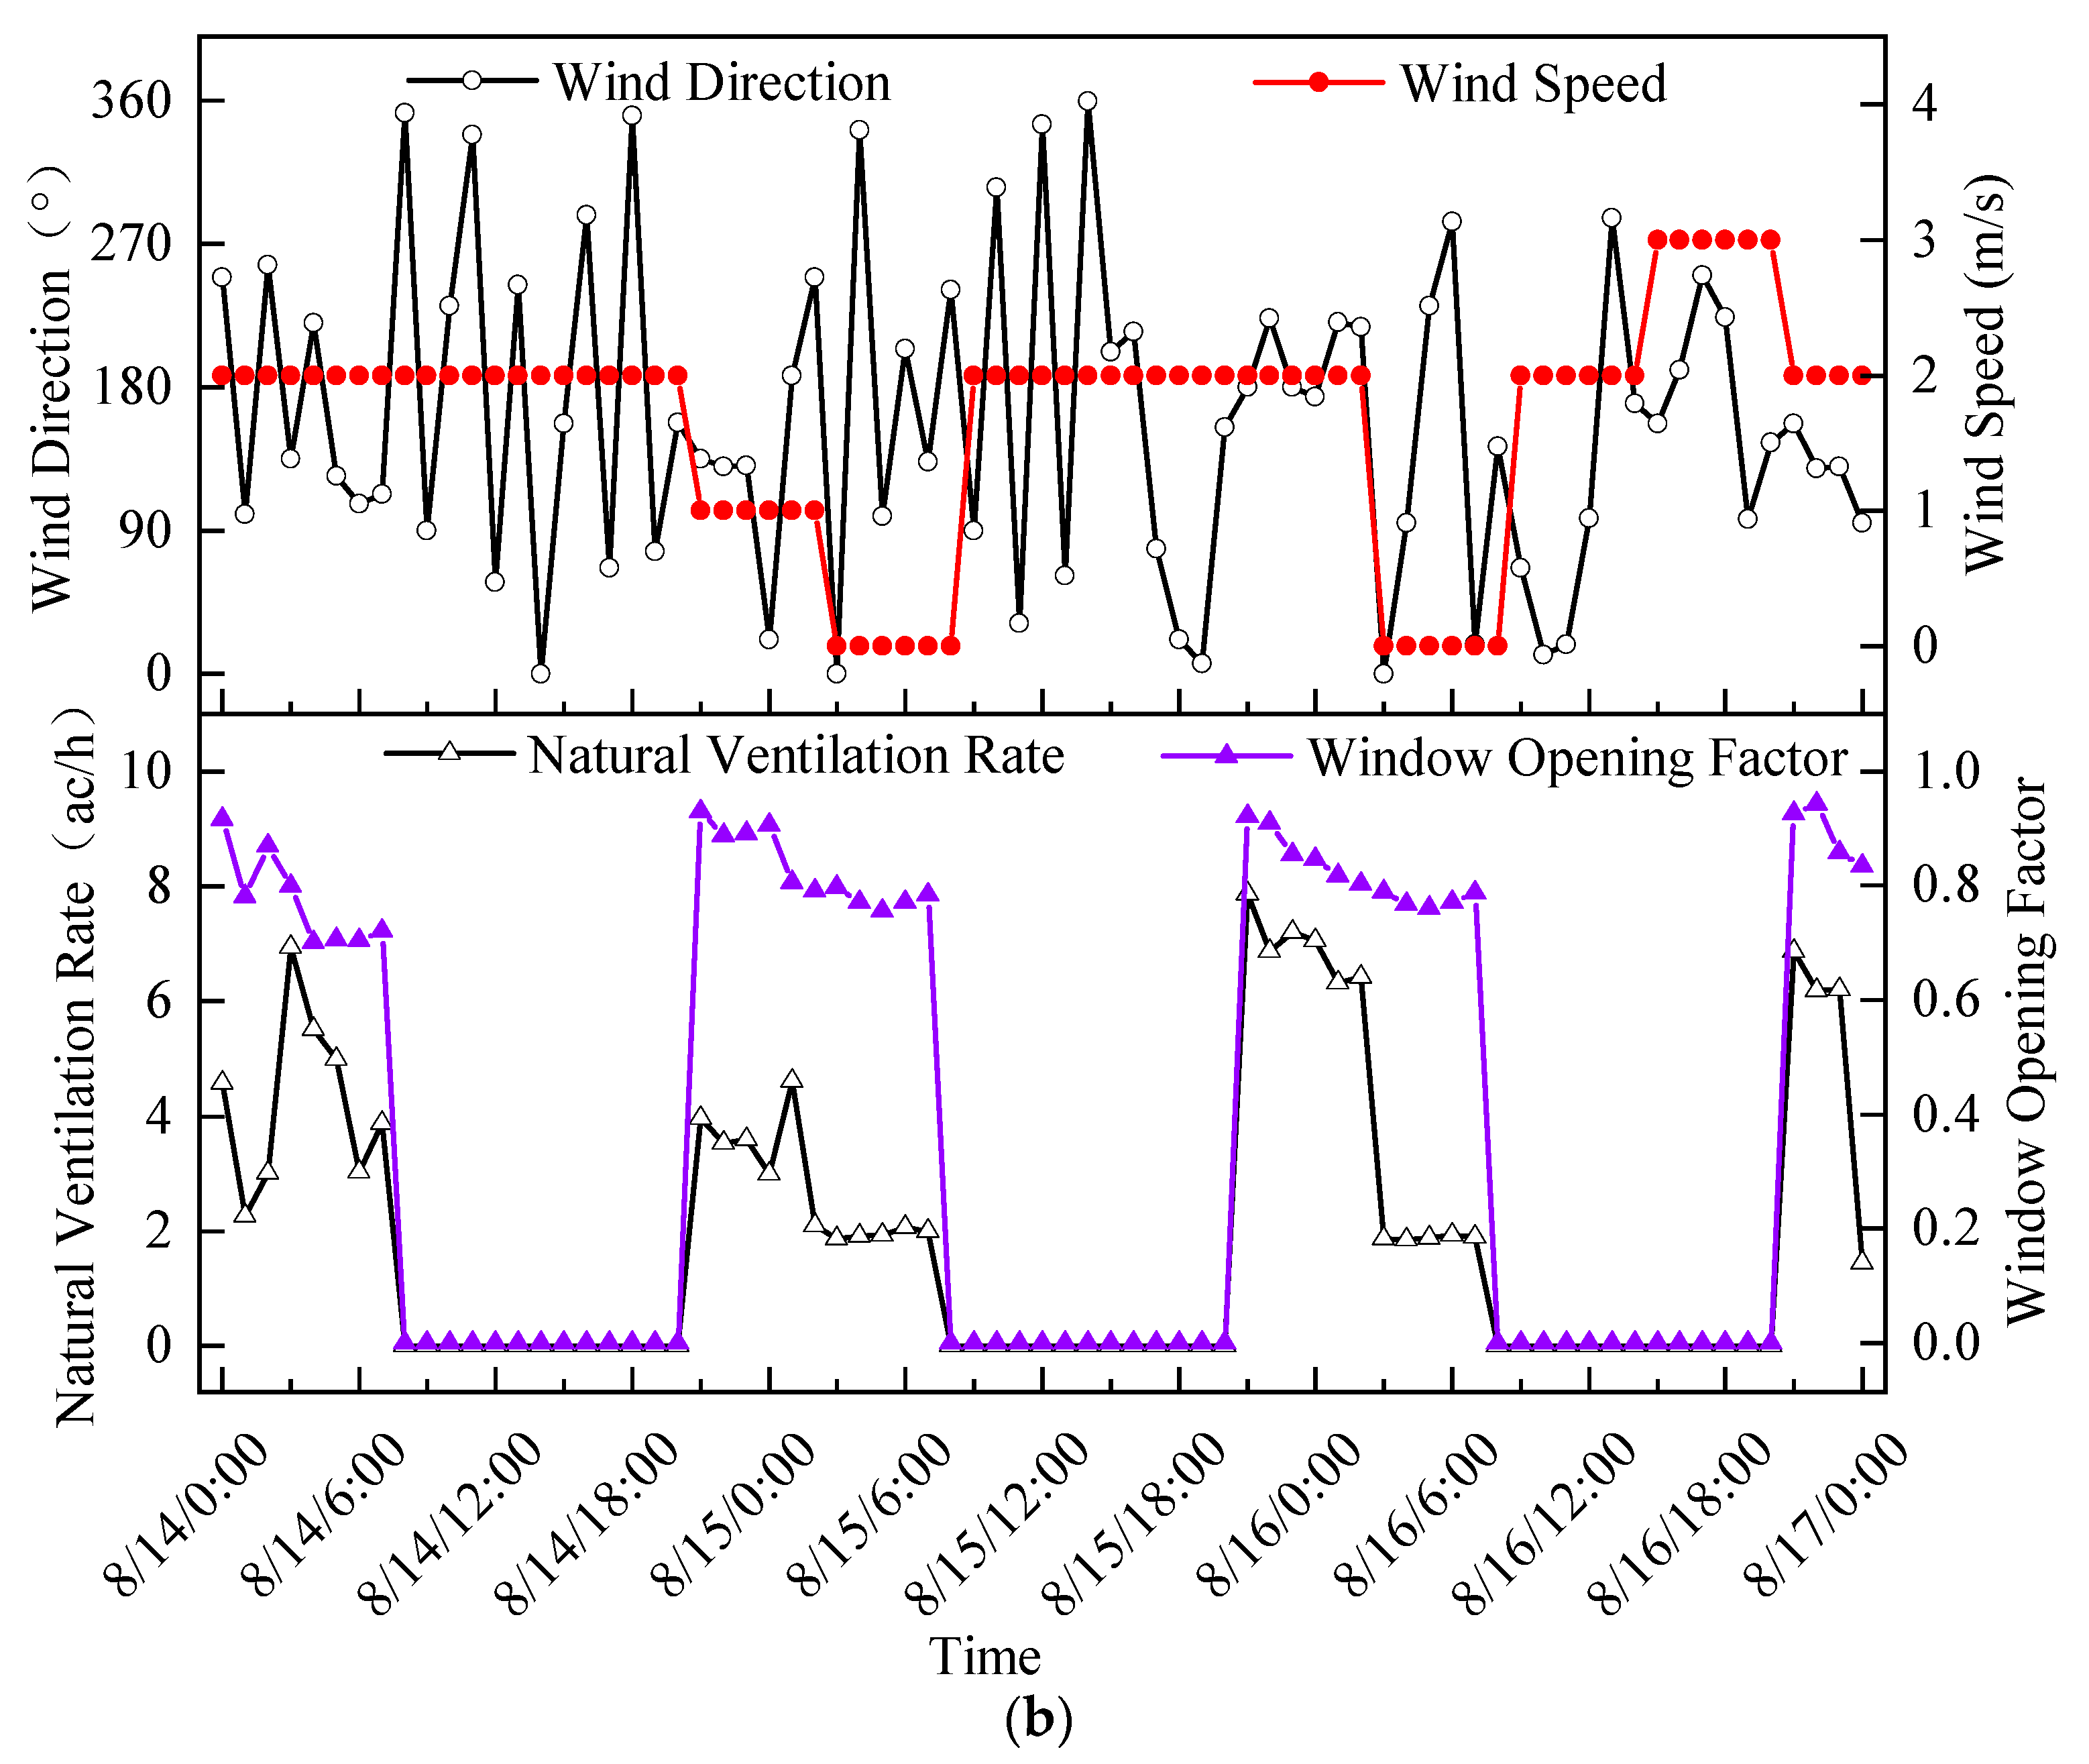
  • The building was operated under the mixed cooling mode for the hot days in August. Night cooling by natural ventilation was available from 21:00 to 07:00 to reduce the requirements of mechanical ventilation in the morning hours. Mechanical ventilation can provide sufficient cooling for the building spaces until 12:00 am. Mechanical refrigeration systems were supposed to supply active cooling for the indoor spaces in the afternoon until the day off.
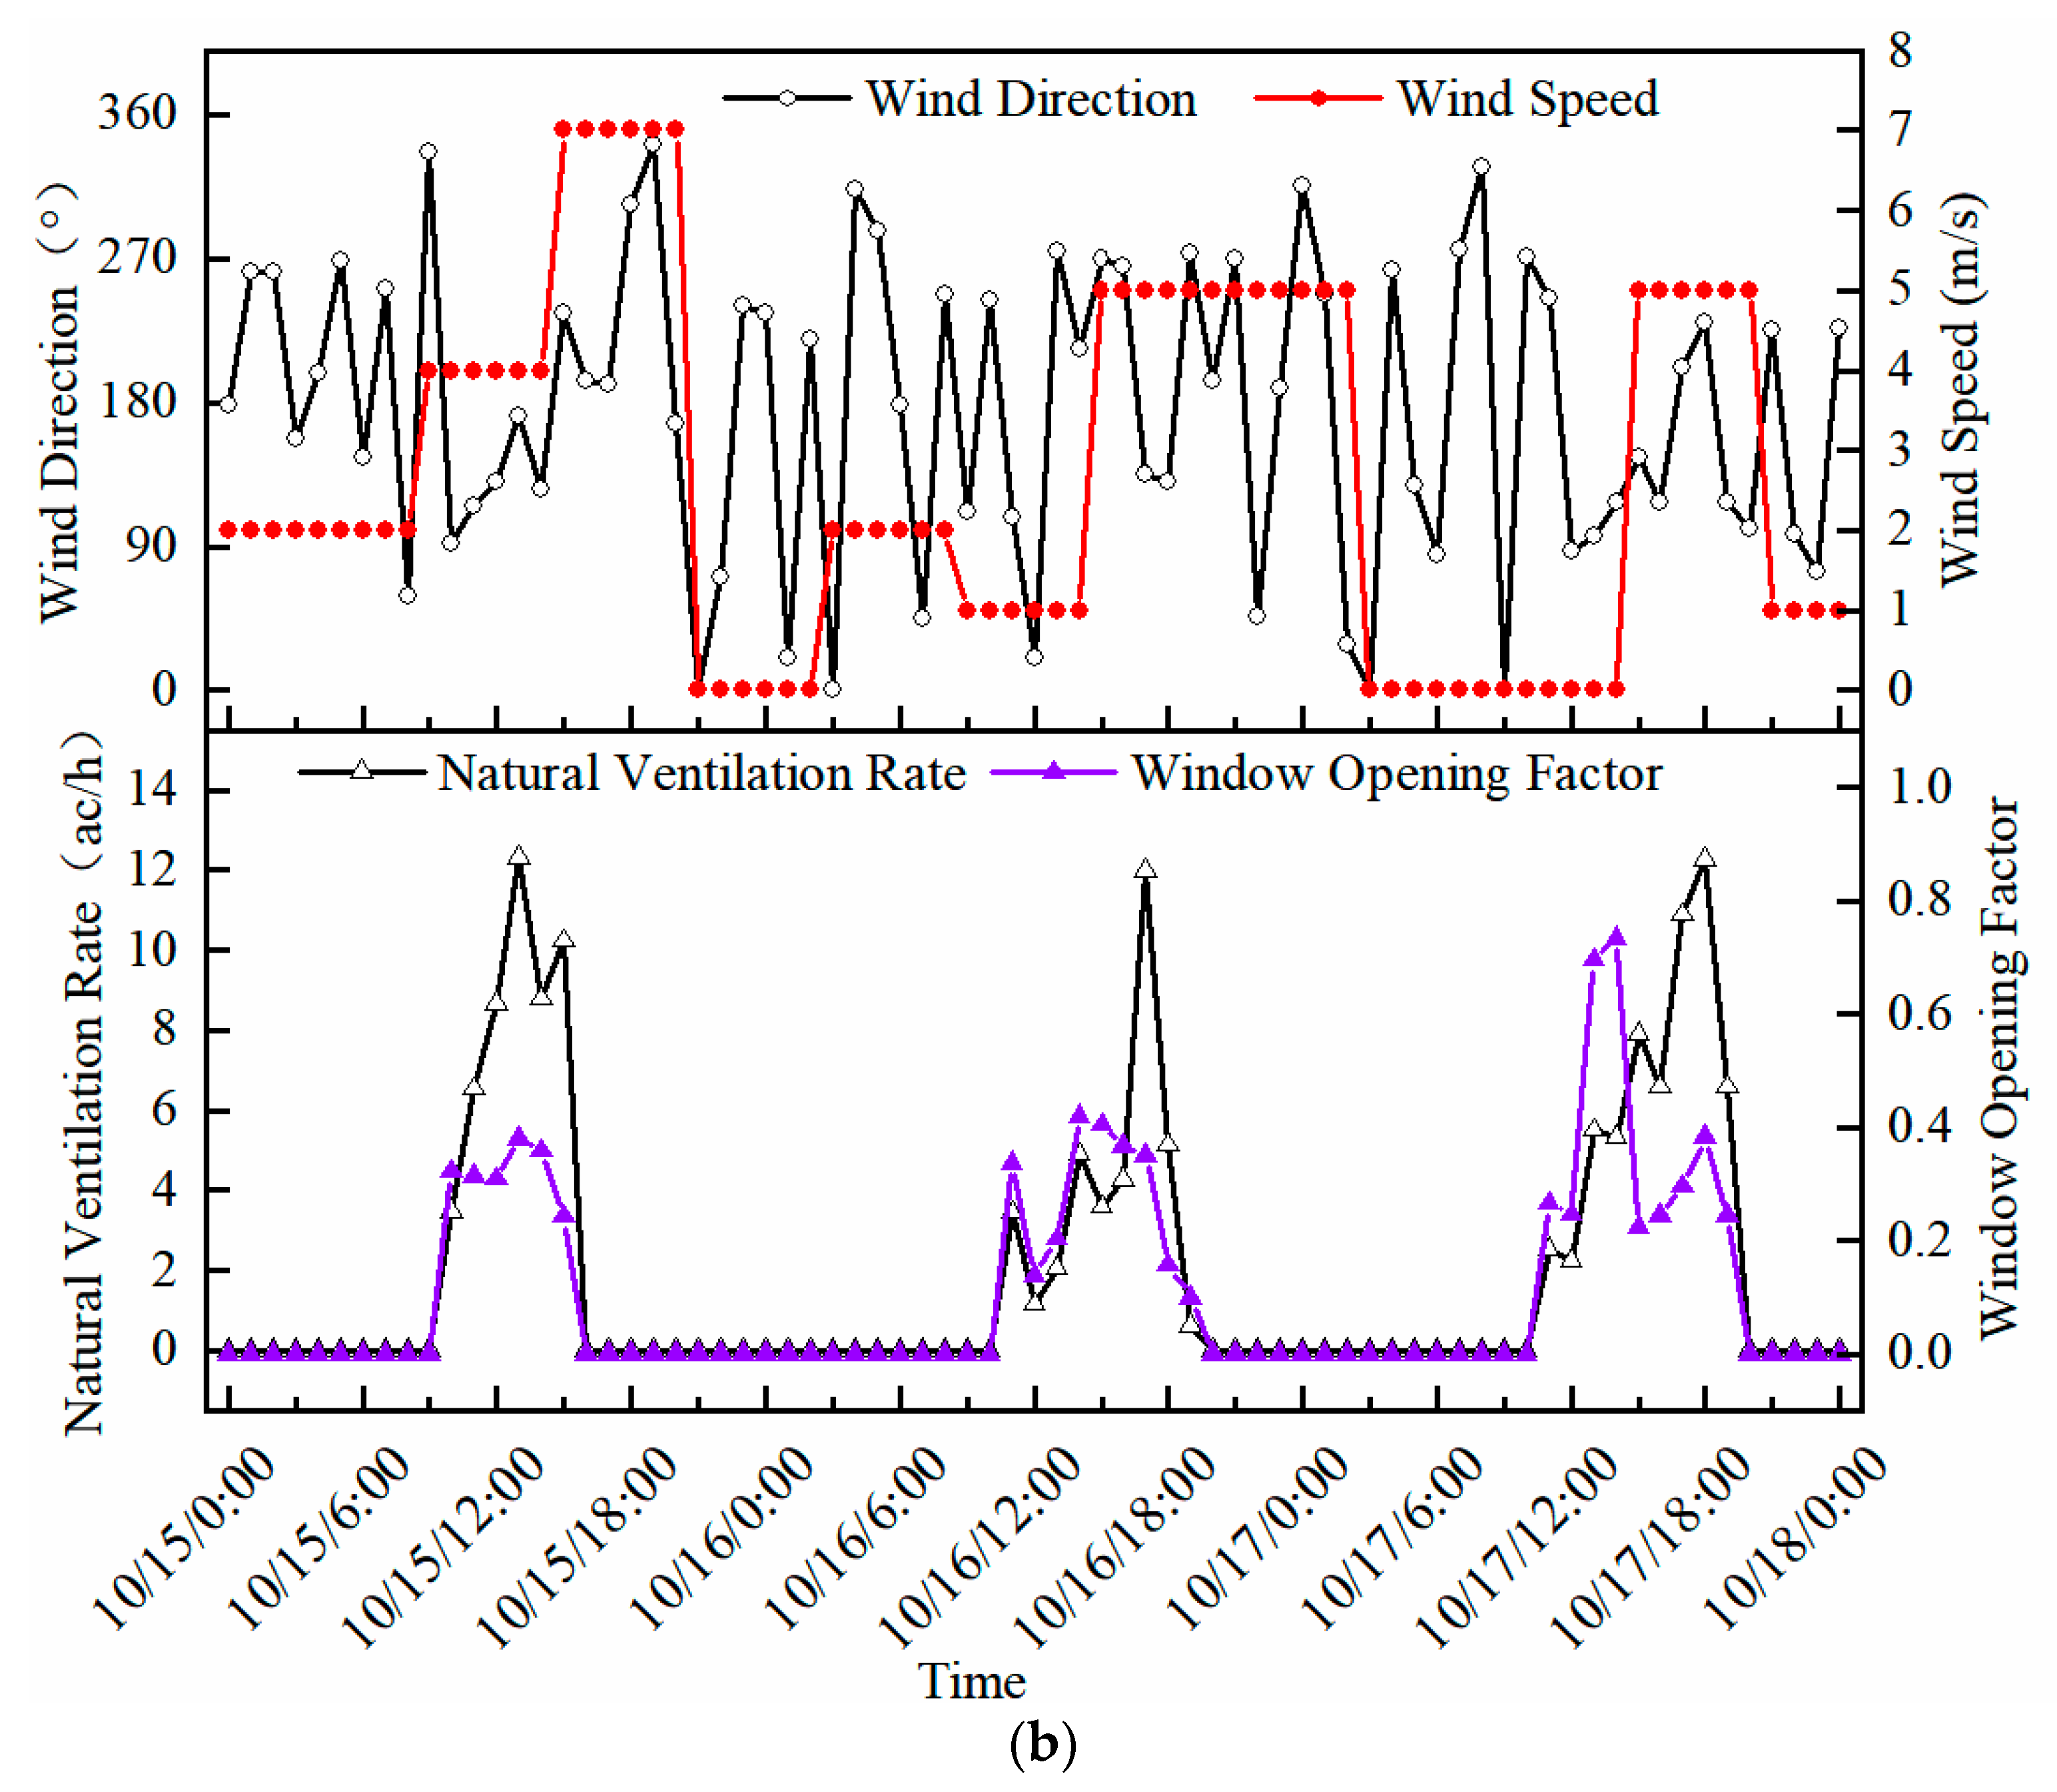
  • For October, natural ventilation was available during 10:00–18:00 to deliver adequate cooling for indoor spaces. Meanwhile, mechanical ventilation only operated occasionally in the morning.
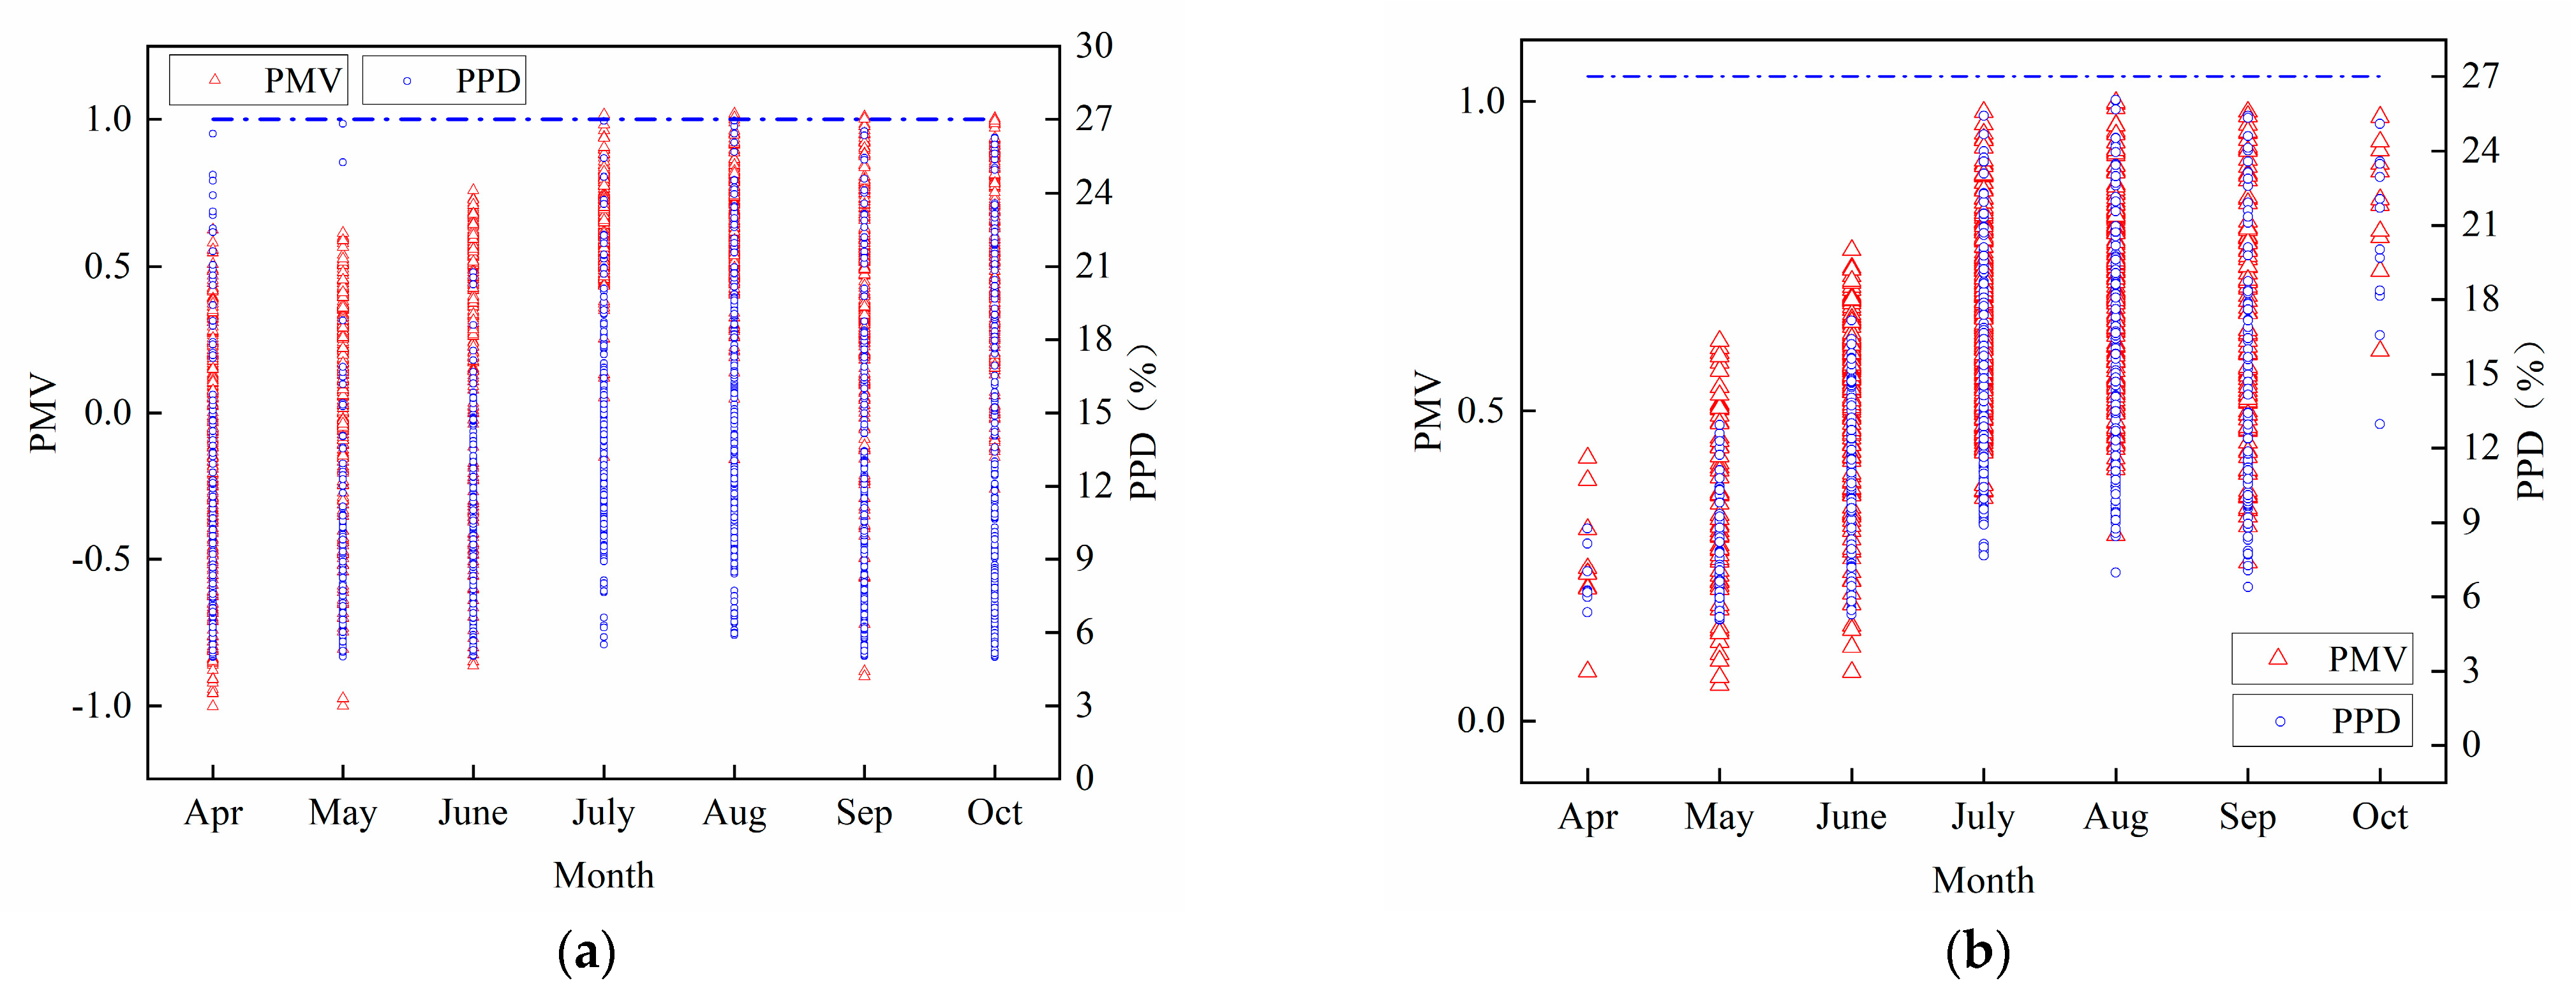
  • PMV and adaptive comfort models were used to indicate the occupants’ thermal comfort in the mixed-mode building. In the mechanical air conditioning mode, indoor thermal comfort can be satisfied with all the hourly PMV falls in the range of [−1, 1], and all PPD data were within 27%, which complies with China’s national code (GB 50736-2012). In the natural ventilation mode, the indoor operative temperatures can live up to the third category thermal comfort requirements specified in EN 15251.
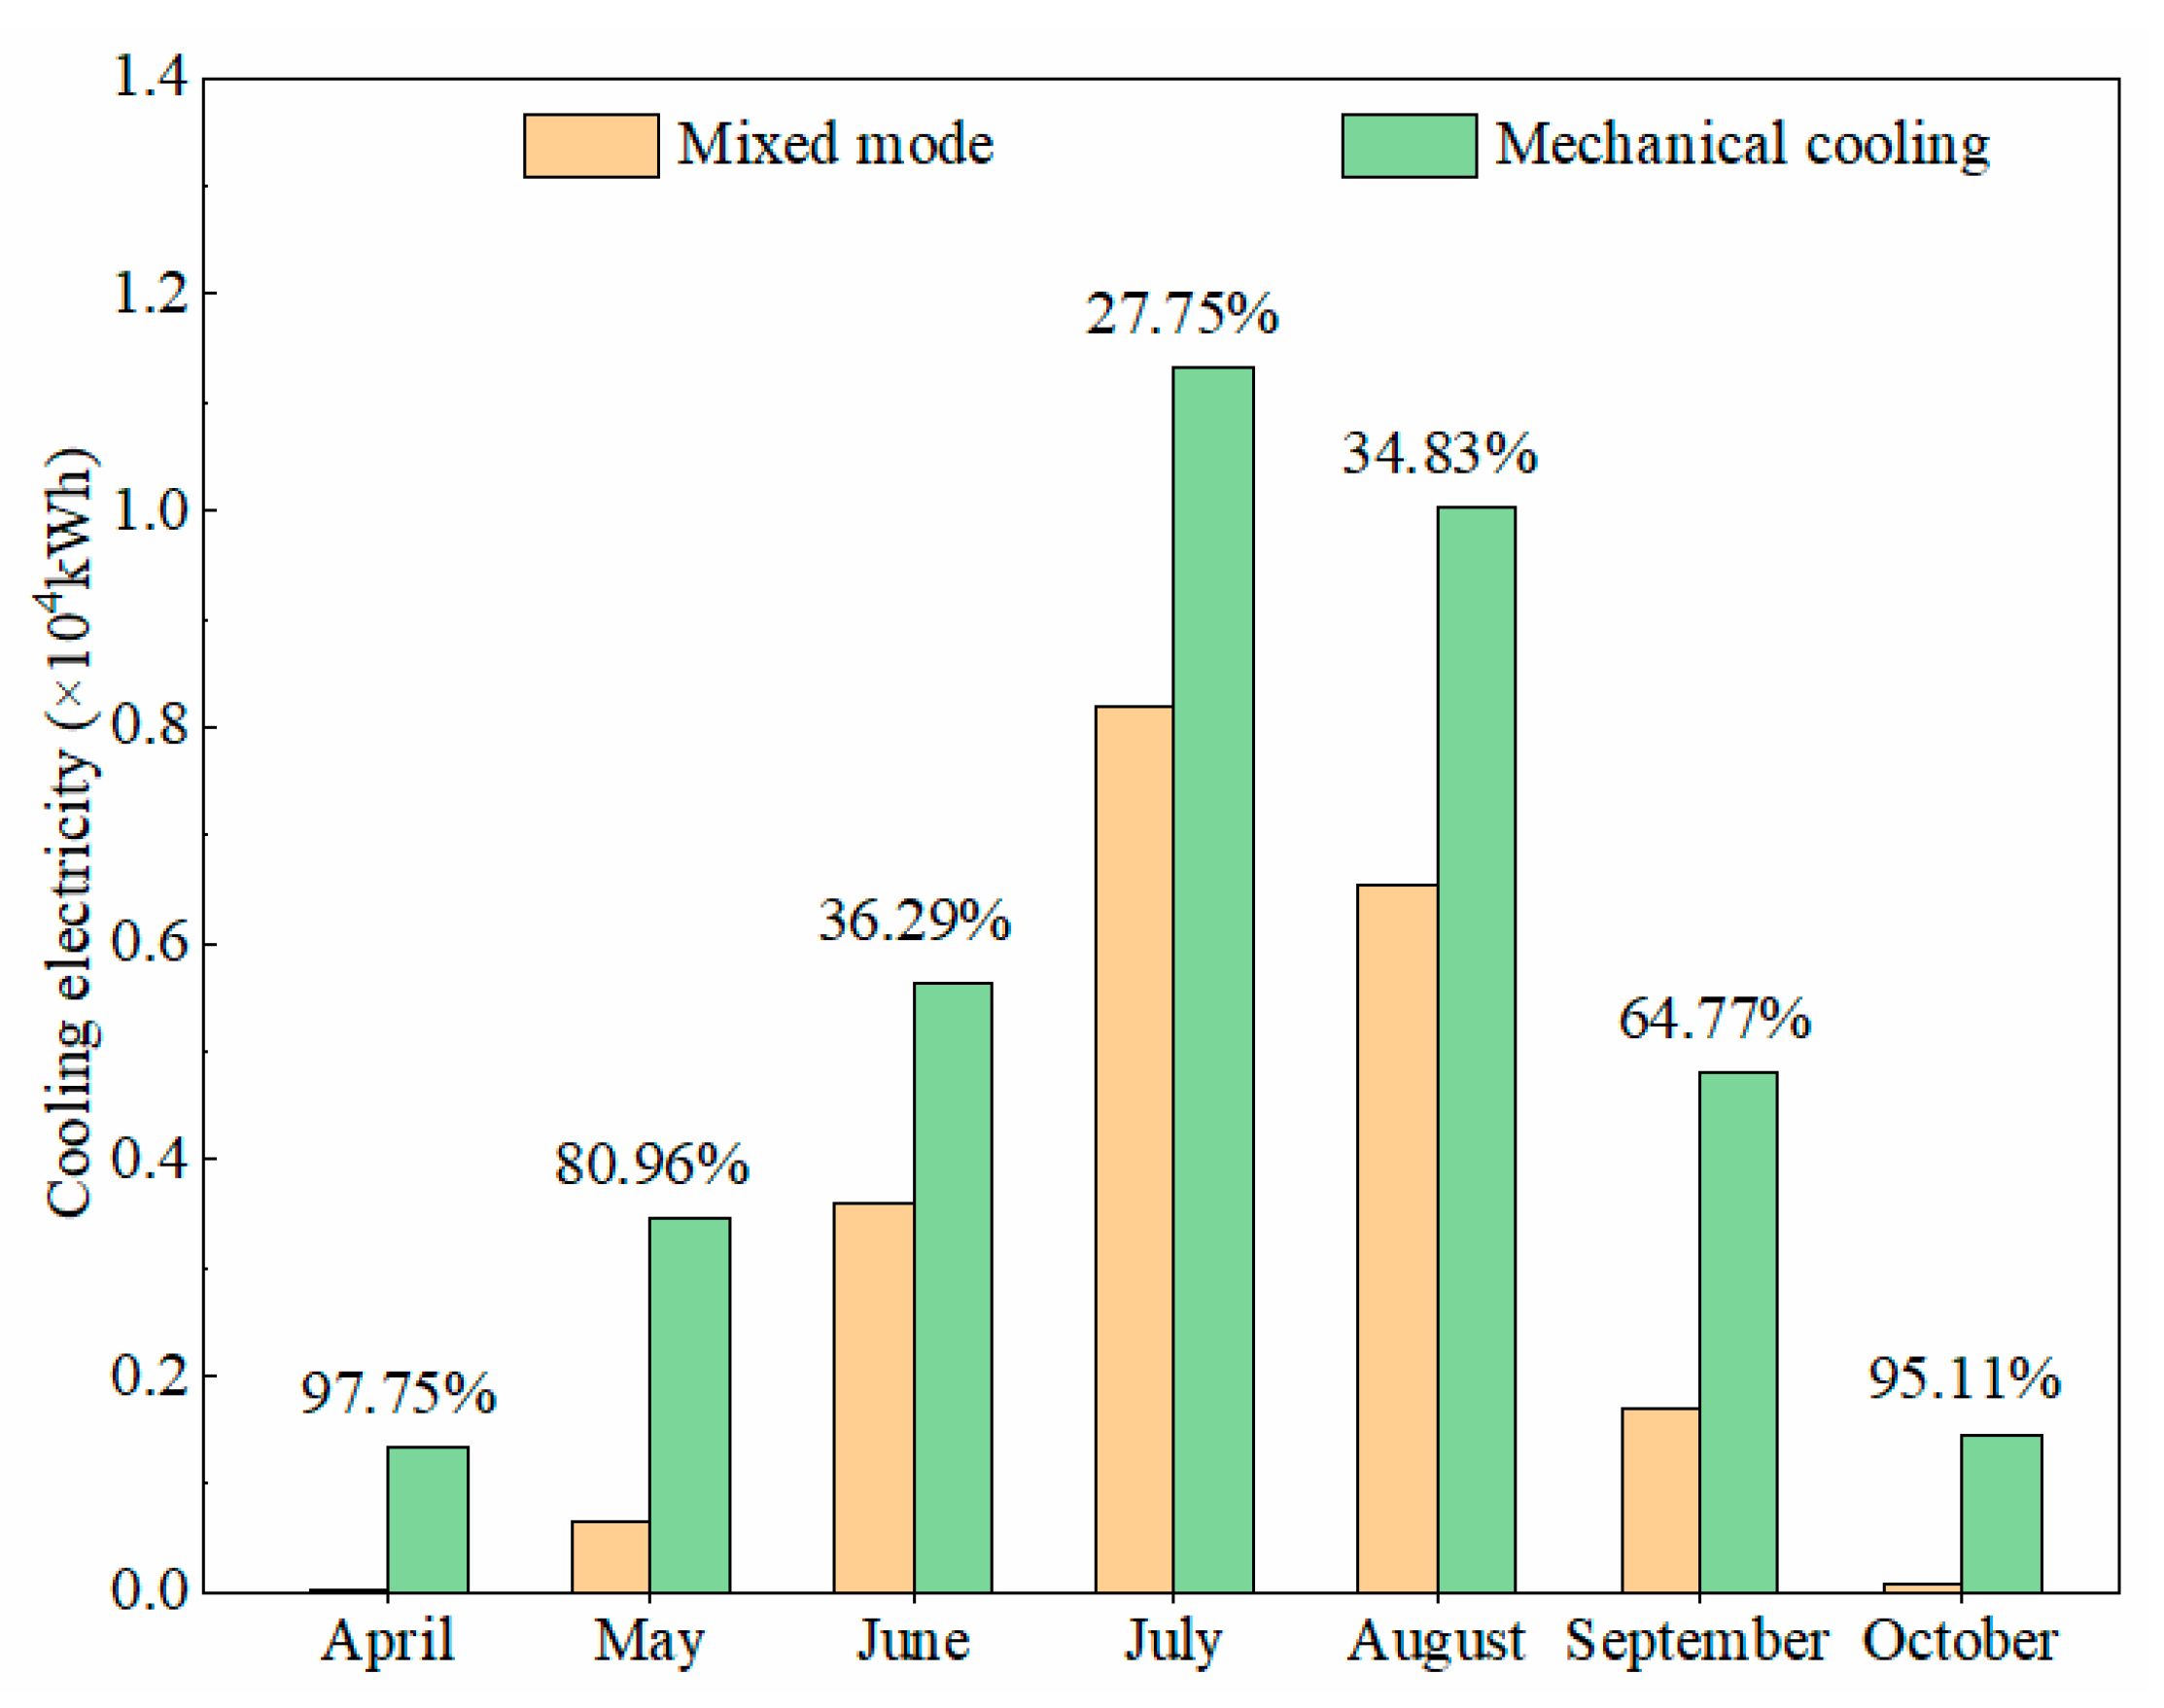
  • Under the conditions of satisfying thermal comfort, almost 45.4% of cooling electricity use and associated carbon emissions can be reduced annually by the proposed mixed cooling mode compared against the mechanical cooling mode.
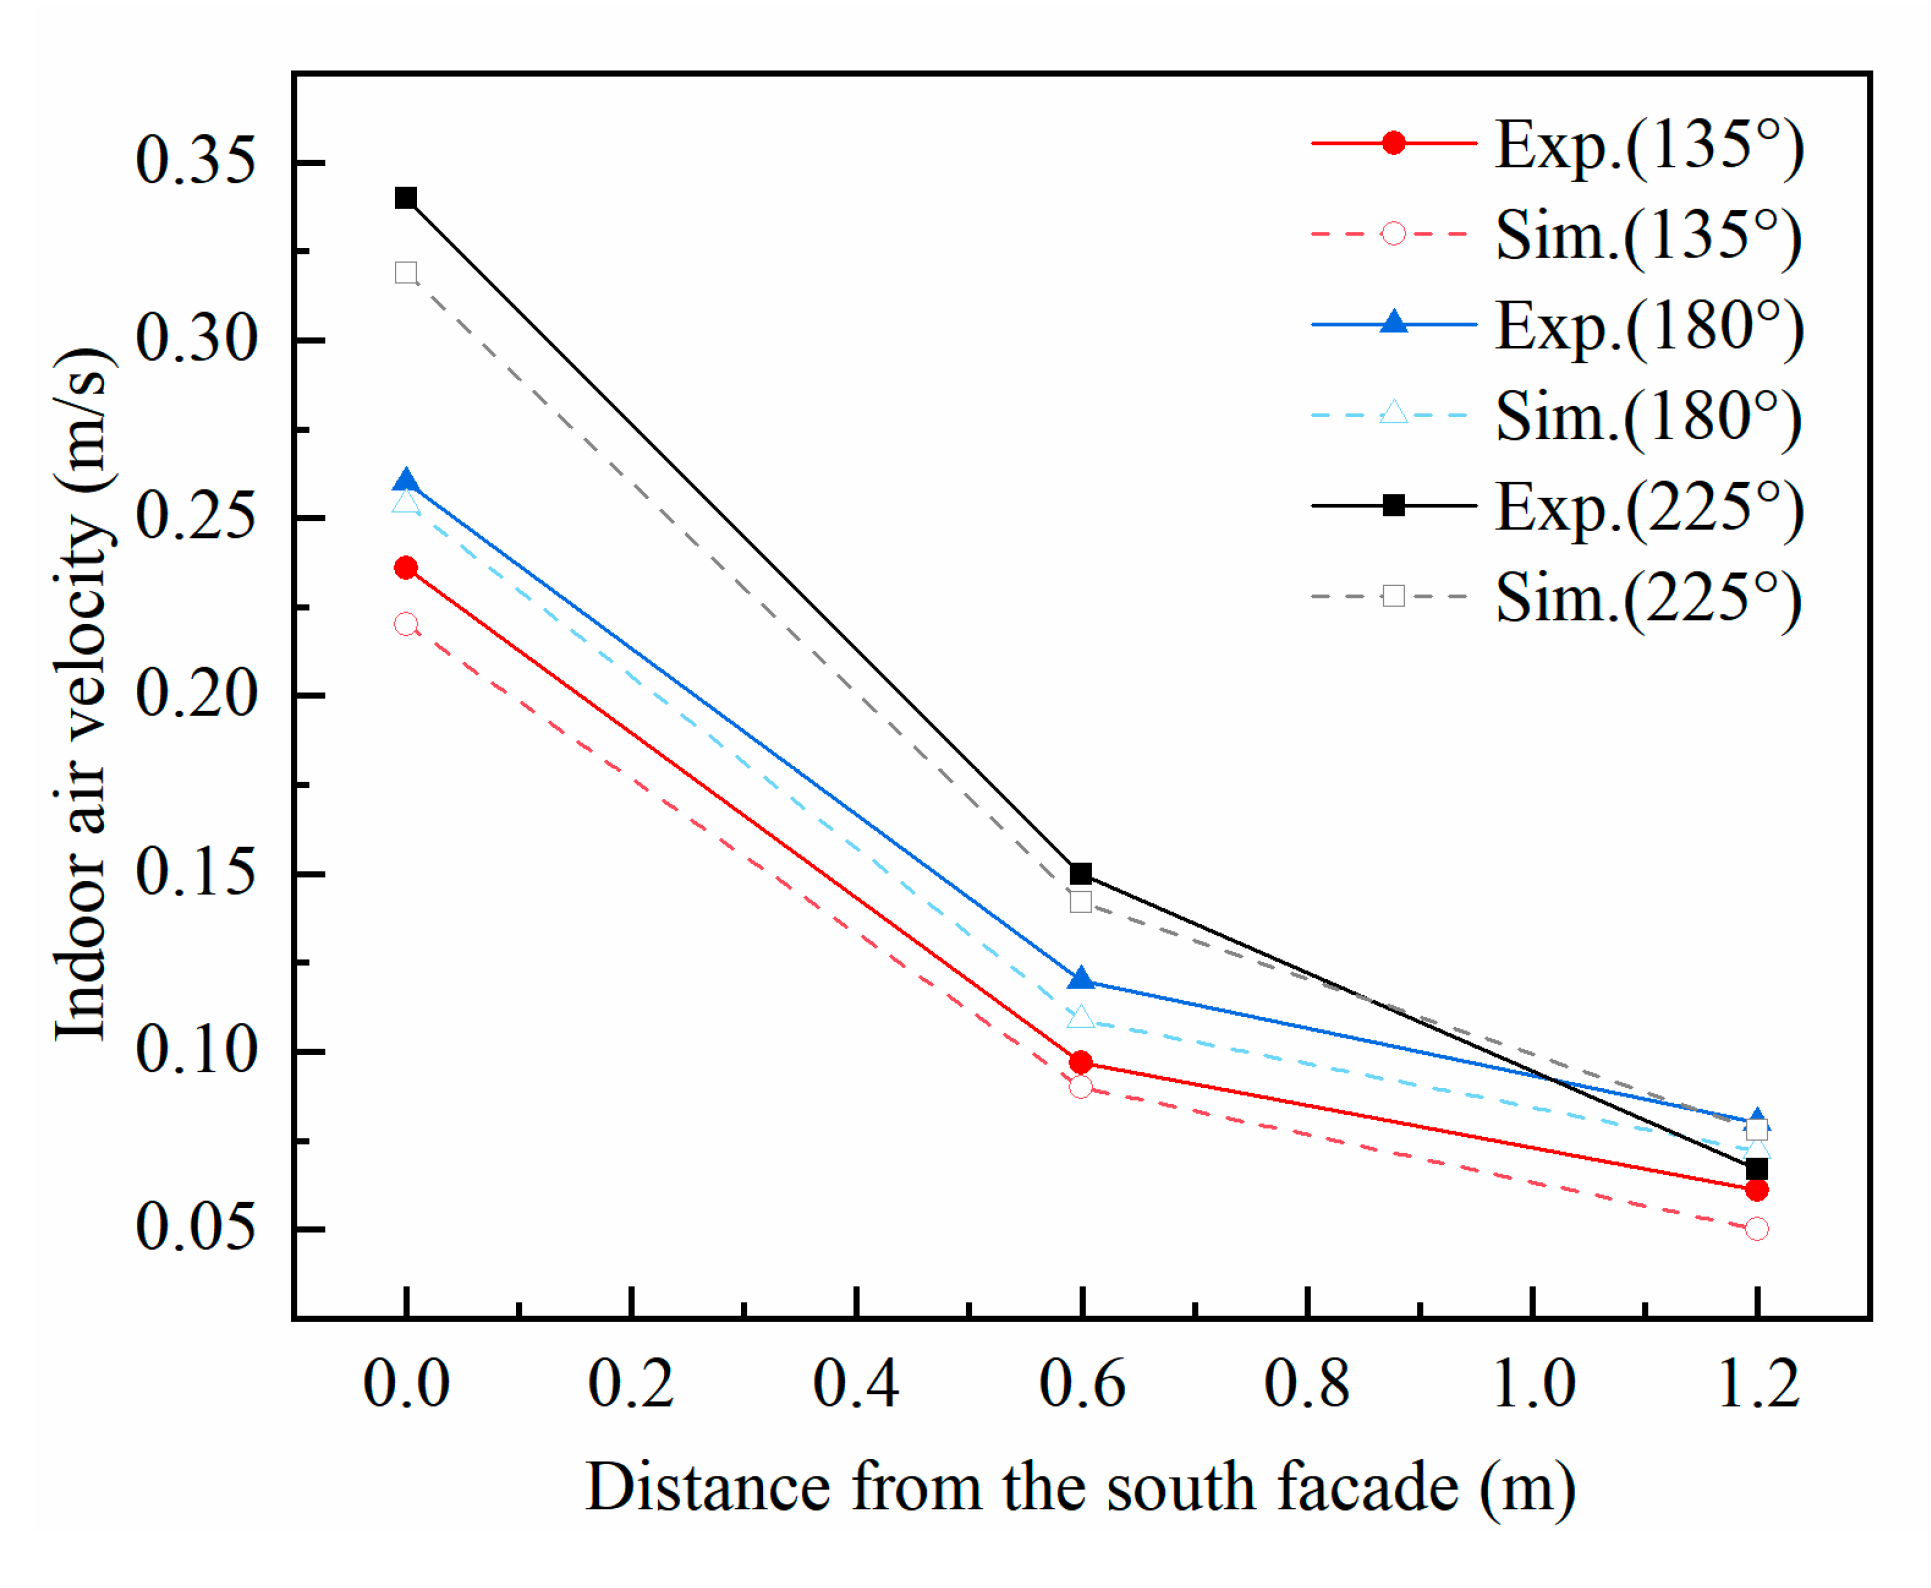
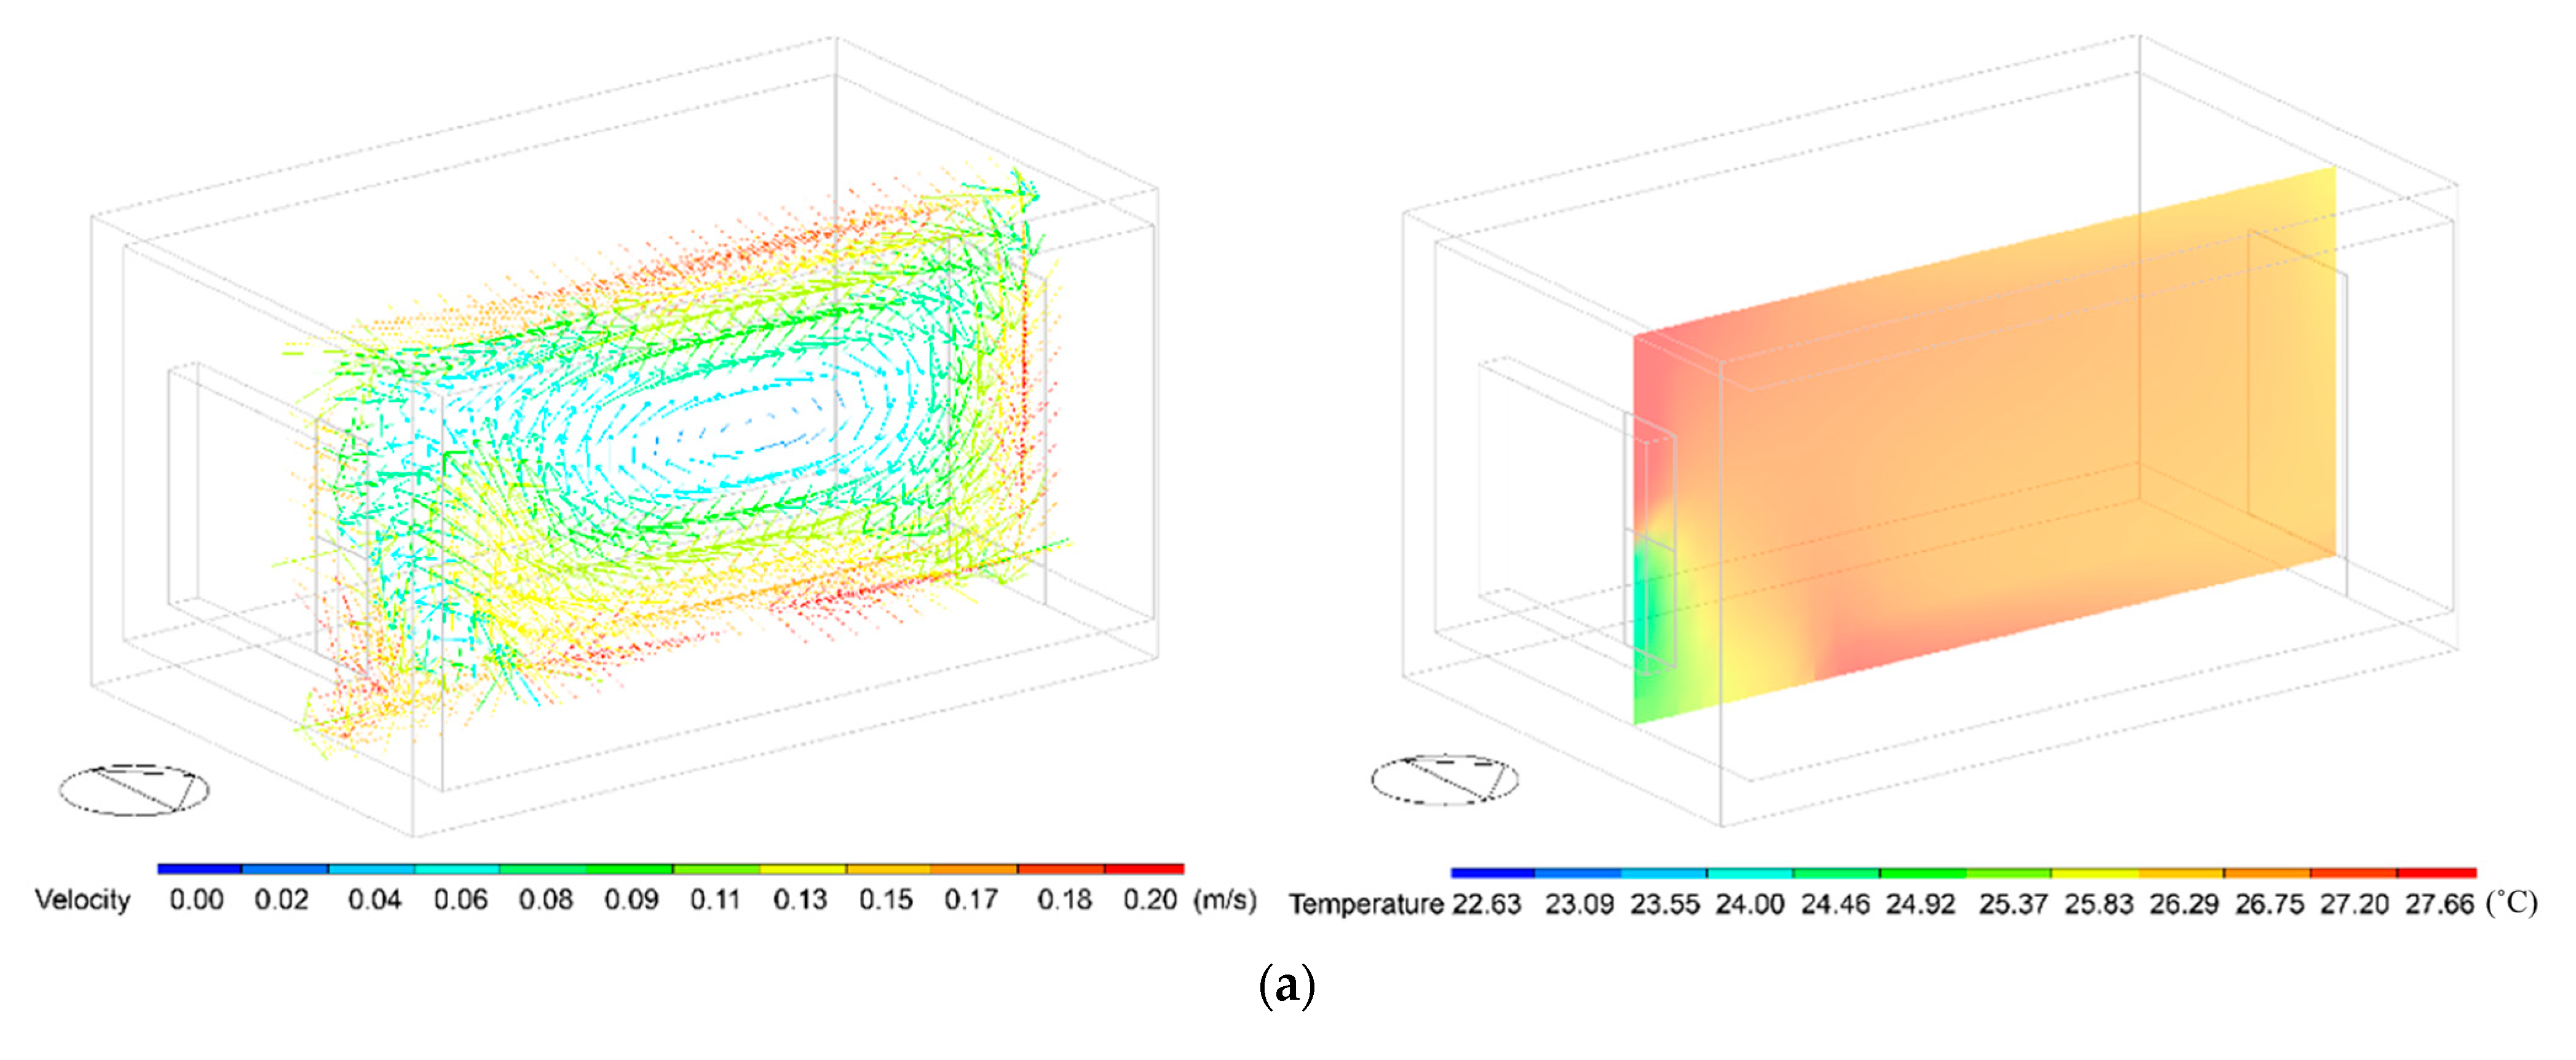
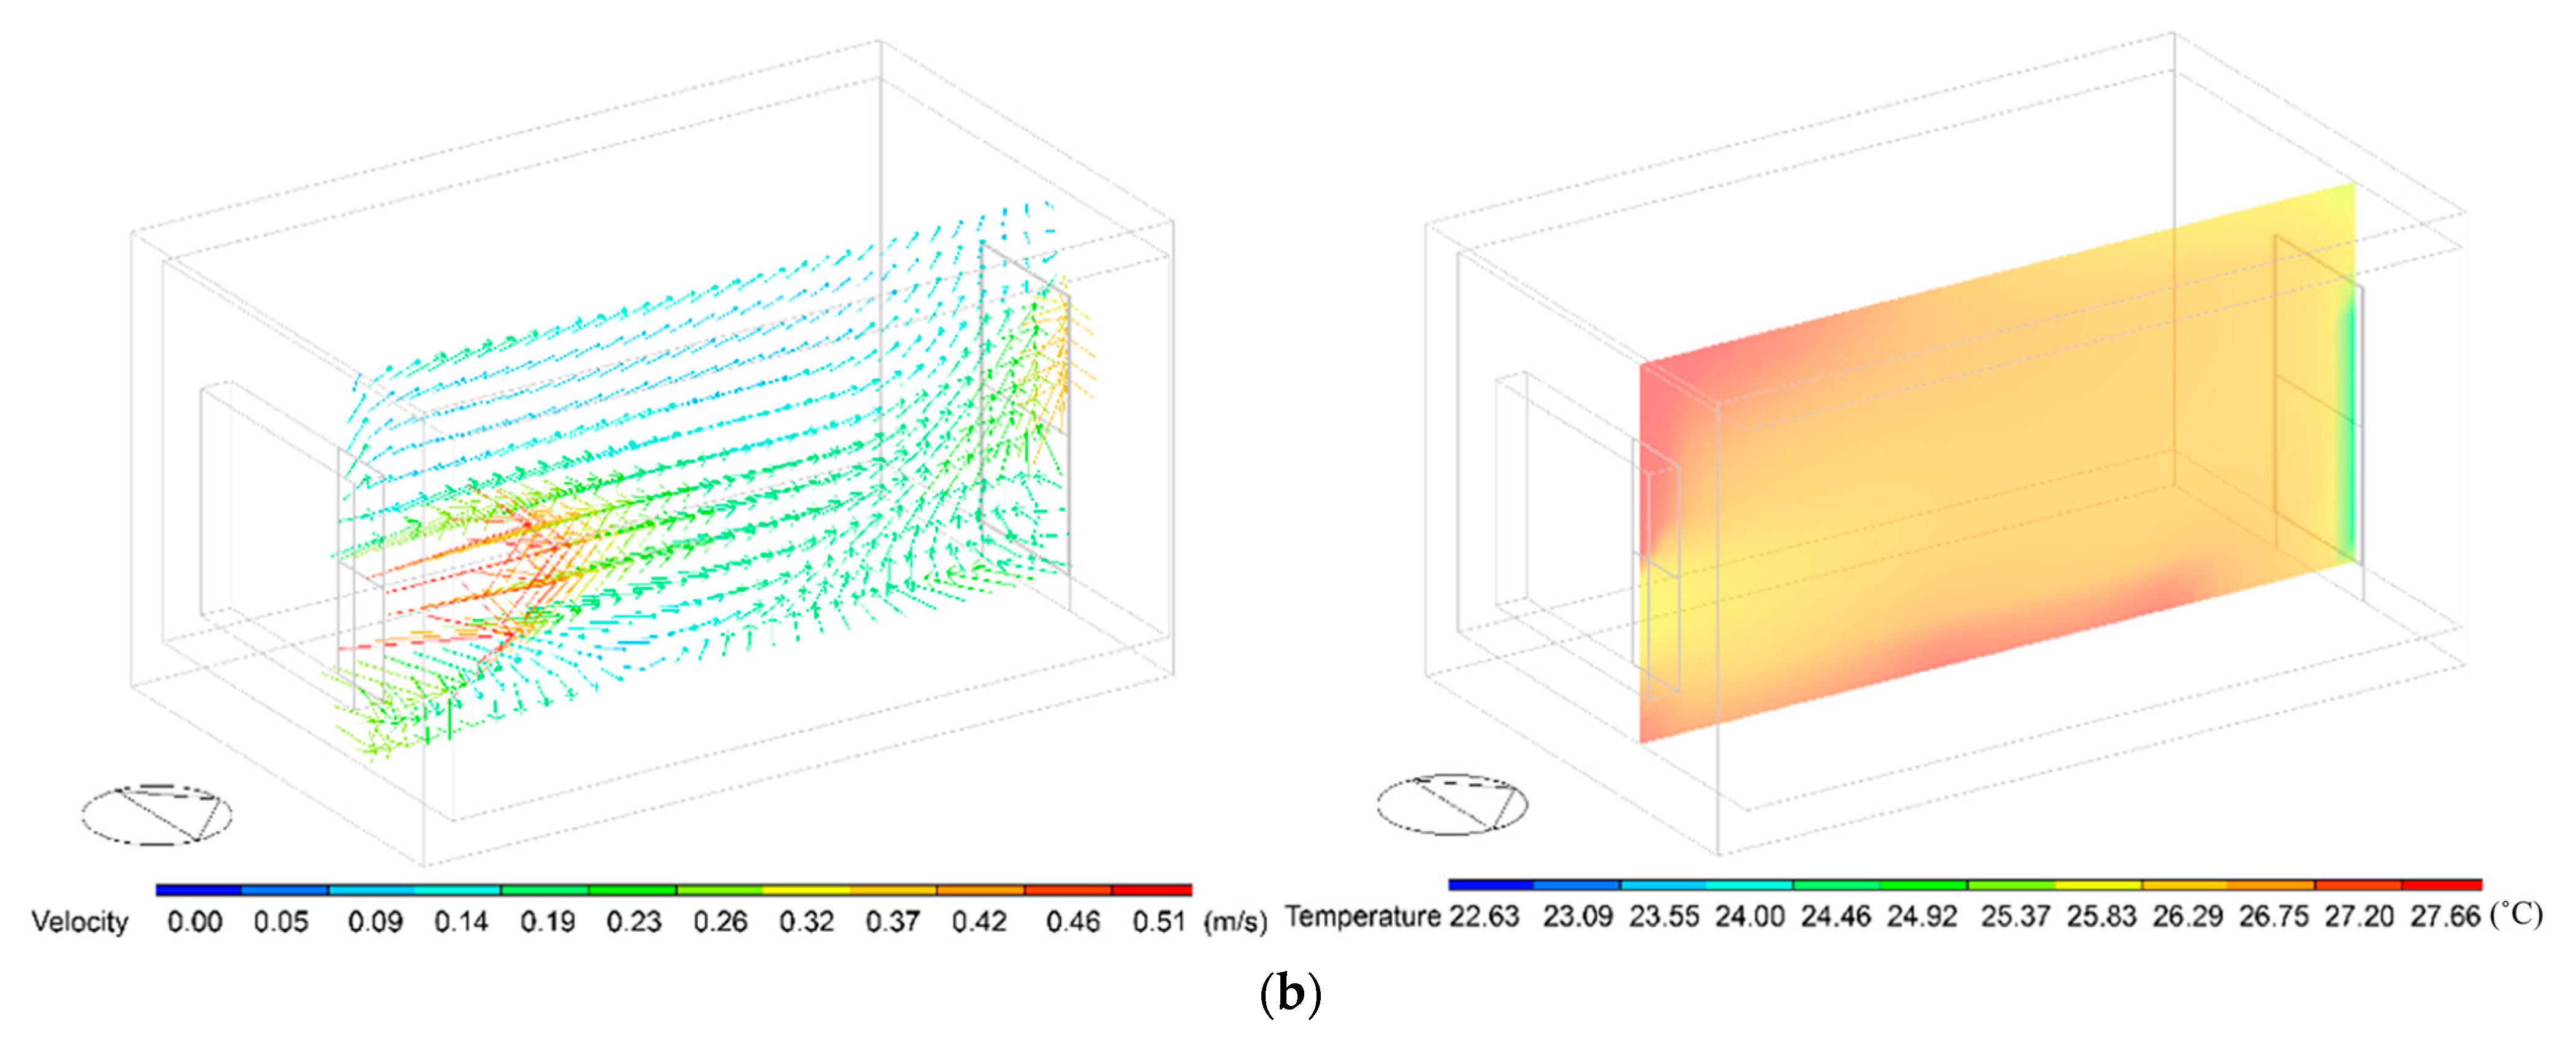
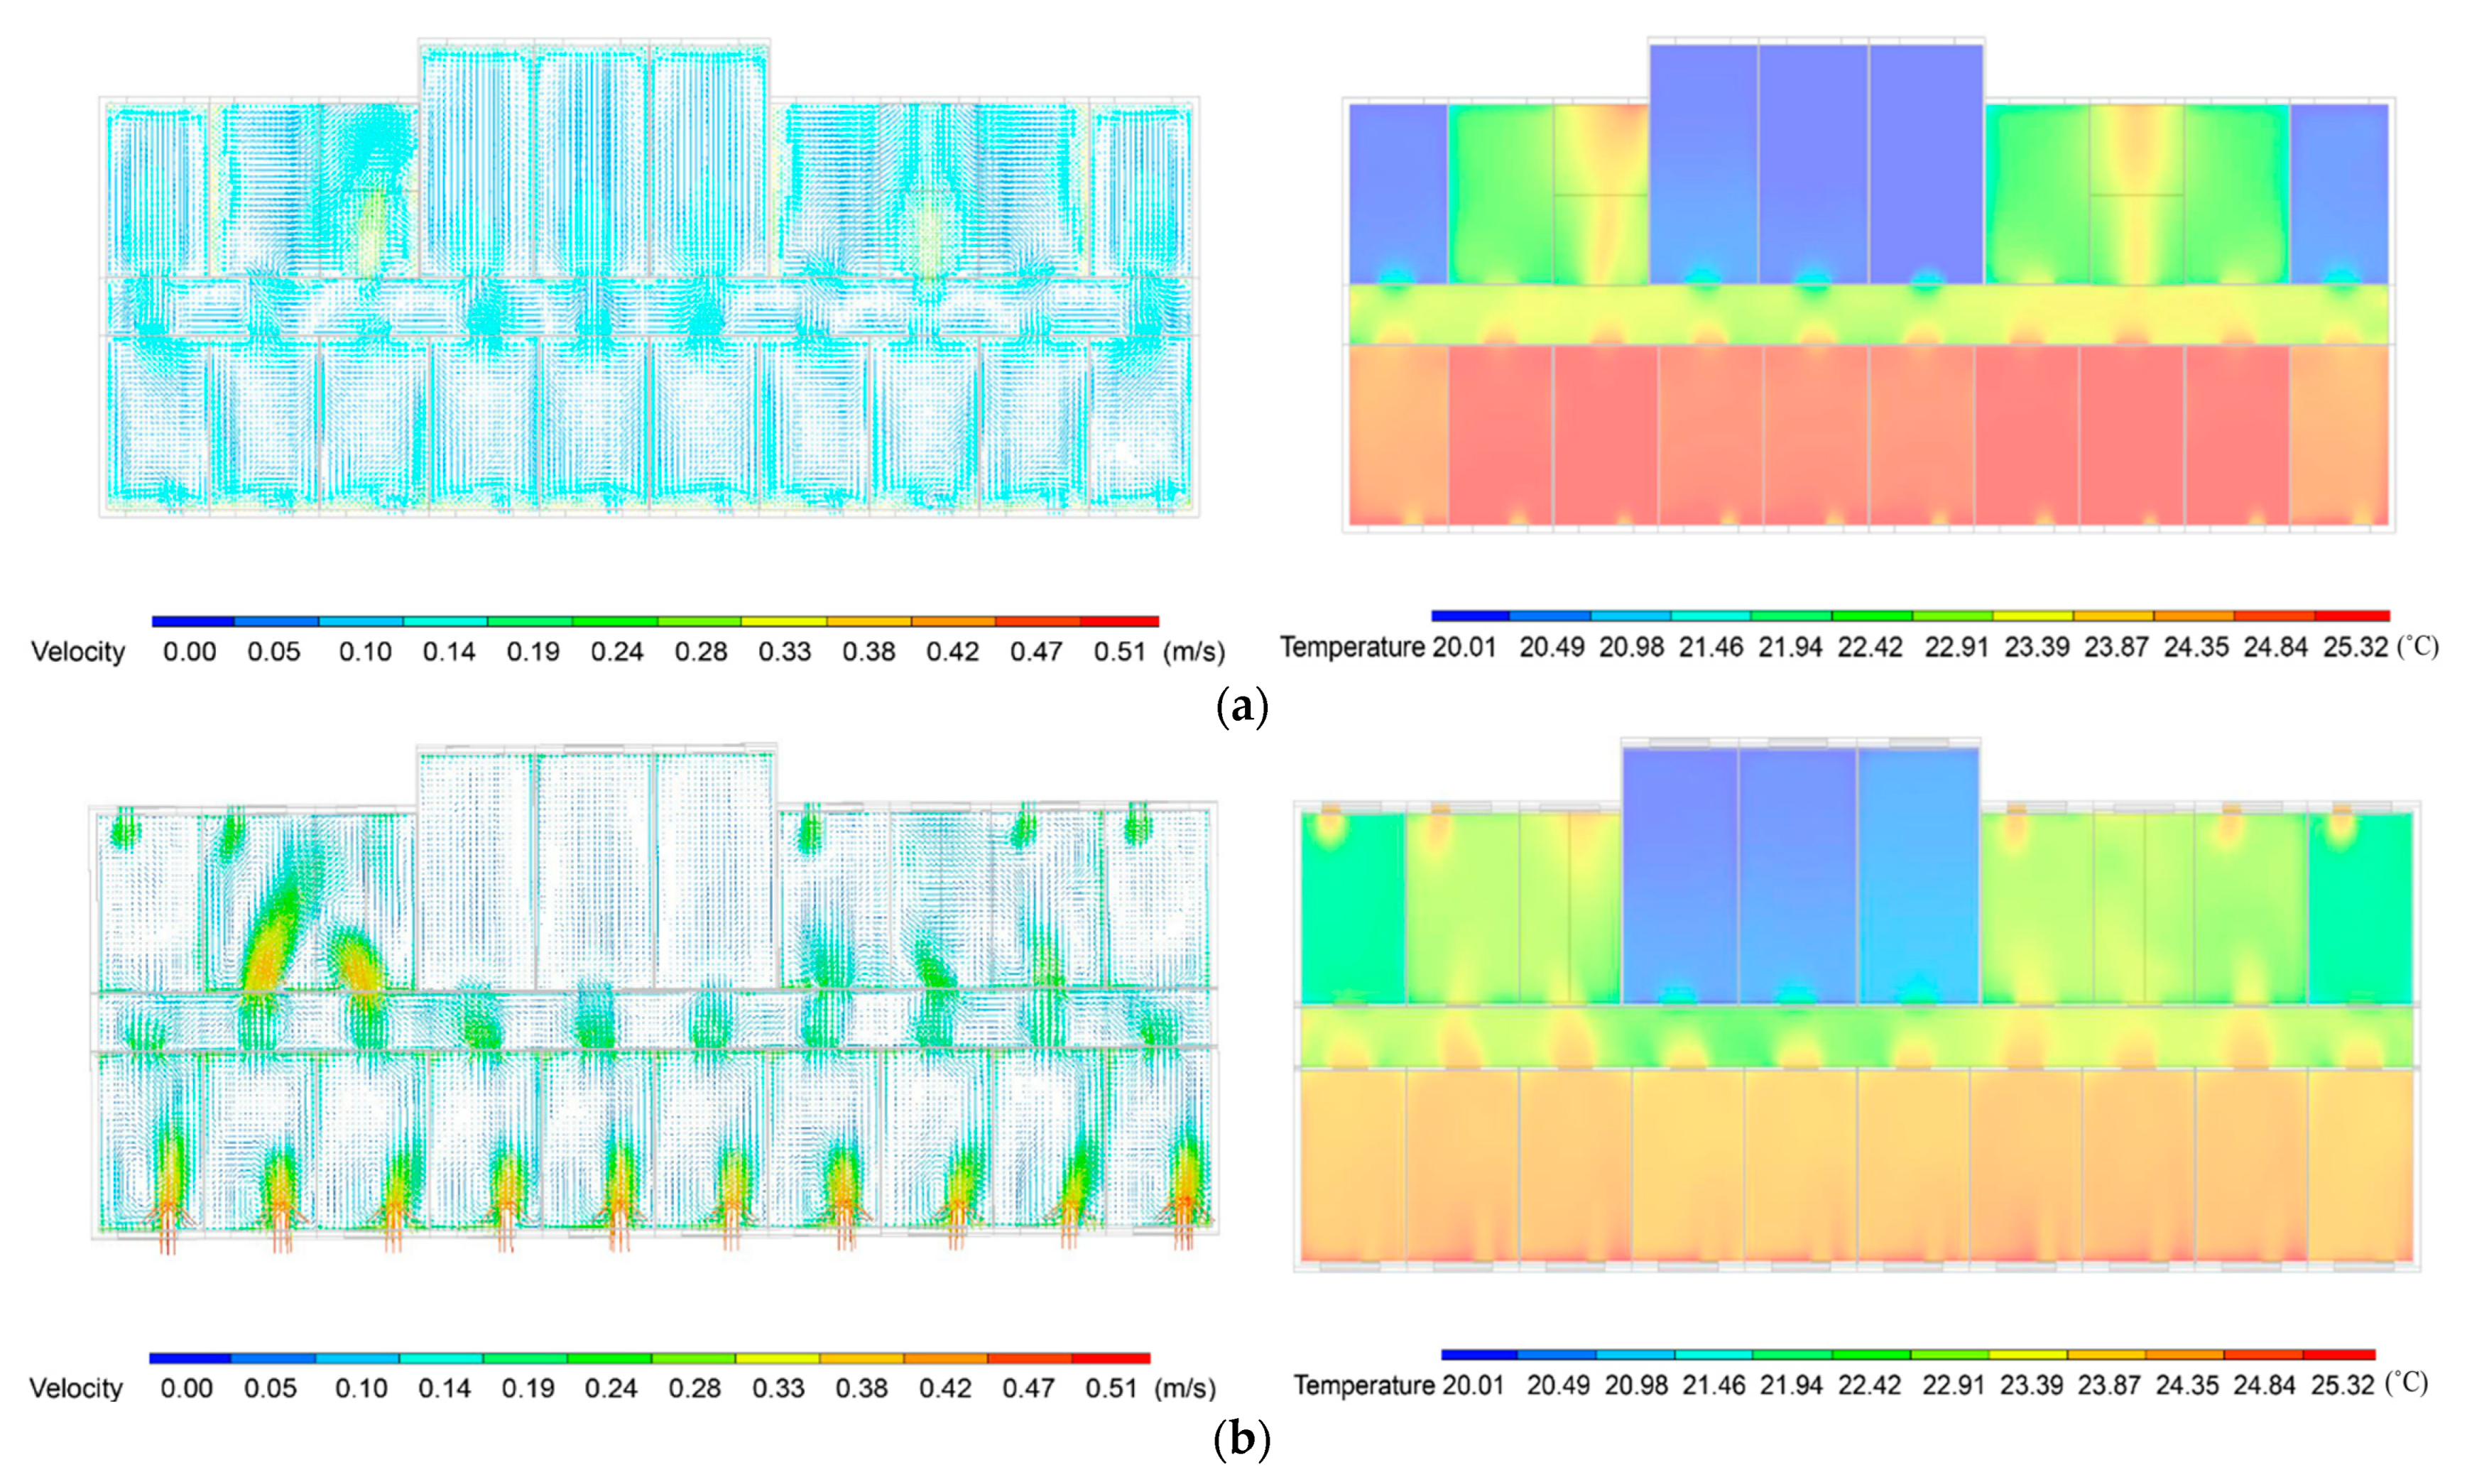
  • The CFD simulation results were in good agreement with the experimental data. The simulation results confirmed that natural ventilation throughout the building space can be achieved. Cross-ventilation occurred for the conditions with opening doors. The air temperature and velocity distributions created by cross-ventilation were able to meet the thermal comfort requirements of the occupancy.
The study suggested that the mixed cooling mode can provide substantial cooling energy savings for the high thermal mass office building in Beijing’s continental climates while satisfying the thermal comfort of the occupancy. A building management system should be installed in the future to control operable windows, doors, and detailed HVAC systems based on the operating strategies presented in the study.

Author Contributions

Conceptualization, Z.D.; methodology, Z.D.; writing—original draft preparation, Z.D.; supervision and funding acquisition, Z.D.; writing—review and editing, Z.D., Y.S., M.W., R.H. and X.D.; analysis and validation, M.W.; visualization, Y.S. and M.W. All authors have read and agreed to the published version of the manuscript.

Funding

This research was funded by the National Natural Science Foundation of China (Grant No. 51908020), the Beijing Natural Science Foundation (Grant No. 3222028), the Science Research Program of the Beijing Municipal Education Commission (Grant No. KM202010016014), and the Pyramid Talent Training Project of Beijing University of Civil Engineering and Architecture (Grant No. JDYC20200314).

Conflicts of Interest

The authors declare no conflict of interest.

References

  1. Wei, W.; He, L.Y. China Building Energy Consumption: Definitions and Measures from an Operational Perspective. Energies 2017, 10, 582. [Google Scholar] [CrossRef] [Green Version]
  2. Jiang, Y.; Yan, D.; Guo, S.; Hu, S. China Building Energy Use 2018; Building Energy Research Center of Tsinghua University: Beijing, China, 2018. [Google Scholar]
  3. IEA. The Future of Cooling in China; IEA: Paris, France, 2019. Available online: https://www.iea.org/reports/the-future-of-cooling-in-china (accessed on 26 April 2022).
  4. Linden, P.; Arens, E.; Daish, N. Natural Ventilation for Energy Savings in California Commercial Buildings; California Energy Commission: San Diego, CA, USA, 2015.
  5. Park, S.; Choi, Y.; Song, D.; Kim, E.K. Natural Ventilation Strategy and Related Issues to Prevent Coronavirus Disease 2019 (COVID-19) Airborne Transmission in a School Building. Sci. Total Environ. 2021, 789, 147764. [Google Scholar] [CrossRef] [PubMed]
  6. Salcido, J.C.; Raheem, A.A.; Issa, R.R.A. From Simulation to Monitoring: Evaluating the Potential of Mixed-Mode Ventilation (MMV) Systems for Integrating Natural Ventilation in Office Buildings through a Comprehensive Literature Review. Energy Build. 2016, 127, 1008–1018. [Google Scholar] [CrossRef]
  7. Mixed Mode Page on Center for Built Environment Website. Available online: https://cbe.berkeley.edu/mixedmode/aboutmm.html (accessed on 22 April 2022).
  8. Sanchez-Garcia, D.; Rubio-Bellido, C.; Martin Del Rio, J.J.; Perez-Fargallo, A. Towards the Quantification of Energy Demand and Consumption through the Adaptive Comfort Approach in Mixed Mode Office Buildings Considering Climate Change. Energy Build 2019, 187, 173–185. [Google Scholar] [CrossRef]
  9. Neves, L.O.; Melo, A.P.; Rodrigues, L.L. Energy Performance of Mixed-Mode Office Buildings: Assessing Typical Construction Design Practices. J. Clean. Prod. 2019, 234, 451–466. [Google Scholar] [CrossRef]
  10. Luo, X.; Eftekhari, M.; Durrani, F.; Kanhirothkandi, D.M. Predicting Thermal Comfort in Mixed-Mode Office Building in the UK. Ashrae Trans. 2019, 125, 158–166. [Google Scholar]
  11. Kim, J.; de Dear, R. Is Mixed-Mode Ventilation a Comfortable Low-Energy Solution? A Literature Review. Build. Environ. 2021, 205, 108215. [Google Scholar] [CrossRef]
  12. Kim, J.; Tartarini, F.; Parkinson, T.; Cooper, P.; de Dear, R. Thermal Comfort in a Mixed-Mode Building: Are Occupants More Adaptive? Energy Build. 2019, 203, 109436. [Google Scholar] [CrossRef]
  13. Khoshbakht, M.; Gou, Z.; Zhang, F. A Pilot Study of Thermal Comfort in Subtropical Mixed-Mode Higher Education Office Buildings with Different Change-over Control Strategies. Energy Build. 2019, 196, 194–205. [Google Scholar] [CrossRef]
  14. Gokarakonda, S.; van Treeck, C.; Rawal, R. Influence of Building Design and Control Parameters on the Potential of Mixed-Mode Buildings in India. Build. Environ. 2019, 148, 157–172. [Google Scholar] [CrossRef] [Green Version]
  15. Gilani, S.; O’Brien, W. Natural Ventilation Usability under Climate Change in Canada and the United States. Build. Res. Inf. 2021, 49, 367–386. [Google Scholar] [CrossRef]
  16. Daaboul, J.; Ghali, K.; Ghaddar, N. Mixed-Mode Ventilation and Air Conditioning as Alternative for Energy Savings: A Case Study in Beirut Current and Future Climate. Energy Eff. 2018, 11, 13–30. [Google Scholar] [CrossRef]
  17. Cerri, S.; Maskrey, A.; Peppard, E. Retaining a Healthy Indoor Environment in On-Demand Mixed-Mode Classrooms. Dev. Built Environ. 2020, 4, 100031. [Google Scholar] [CrossRef]
  18. Hensen, J.L.M.; Lamberts, R. Building Performance Simulation for Design and Operation; Spon Press: London, UK; New York, NY, USA, 2011; ISBN 9780415474146. [Google Scholar]
  19. Malkawi, A.; Yan, B.; Chen, Y.; Tong, Z. Predicting Thermal and Energy Performance of Mixed-Mode Ventilation Using an Integrated Simulation Approach. Build. Simul. 2016, 9, 335–346. [Google Scholar] [CrossRef]
  20. Lomas, K.J.; Cook, M.J.; Fiala, D. Low Energy Architecture for a Severe US Climate: Design and Evaluation of a Hybrid Ventilation Strategy. Energy Build. 2007, 39, 32–44. [Google Scholar] [CrossRef] [Green Version]
  21. Ezzeldin, S.; Rees, S.J. The Potential for Office Buildings with Mixed-Mode Ventilation and Low Energy Cooling Systems in Arid Climates. Energy Build. 2013, 65, 368–381. [Google Scholar] [CrossRef] [Green Version]
  22. Emmerich, S. Simulated Performance of Natural and Hybrid Ventilation Systems in an Office Building. HVAC&R Res. 2006, 12, 975–1004. [Google Scholar] [CrossRef]
  23. Wu, Z.; Li, N.; Wargocki, P.; Peng, J.; Li, J.; Cui, H. Field Study on Thermal Comfort and Energy Saving Potential in 11 Split Air-Conditioned Office Buildings in Changsha, China. Energy 2019, 182, 471–482. [Google Scholar] [CrossRef]
  24. Jia, X.; Cao, B.; Zhu, Y.; Liu, B. Thermal Comfort in Mixed-Mode Buildings: A Field Study in Tianjin, China. Build. Environ. 2020, 185, 107244. [Google Scholar] [CrossRef]
  25. Luo, M.; Cao, B.; Damiens, J.; Lin, B.; Zhu, Y. Evaluating Thermal Comfort in Mixed-Mode Buildings: A Field Study in a Subtropical Climate. Build. Environ. 2015, 88, 46–54. [Google Scholar] [CrossRef]
  26. Tong, Z.; Chen, Y.; Malkawi, A.; Liu, Z.; Freeman, R.B. Energy Saving Potential of Natural Ventilation in China: The Impact of Ambient Air Pollution. Appl. Energy 2016, 179, 660–668. [Google Scholar] [CrossRef] [Green Version]
  27. Chen, Y.; Tong, Z.; Malkawi, A. Investigating Natural Ventilation Potentials across the Globe: Regional and Climatic Variations. Build. Environ. 2017, 122, 386–396. [Google Scholar] [CrossRef]
  28. “Urban Management Development Plan of Beijing in the 14th Five-Year Period” Press Conference. Available online: http://www.scio.gov.cn/xwfbh/gssxwfbh/xwfbh/beijing/Document/1722817/1722817.htm (accessed on 26 April 2022).
  29. DesignBuilder Software Ltd. DesignBuilder Software, Version 7.0; DesignBuilder Software Ltd.: Stroud, UK, 2021. Available online: https://designbuilder.co.uk/(accessed on 26 April 2022).
  30. China Meteorological Bureau-Climate Information Center-Climate Data Office; Tsinghua University-Department of Building Science and Technology. China Standard Weather Data for Analyzing Building Thermal Conditions; China Building Industry Publishing House: Beijing, China, 2005.
  31. ANSI/ASHRAE Standard 55-2013; Thermal Environmental Conditions for Human Occupancy. American Society of Heating, Refrigerating and Air-Conditioning Engineers, Inc.: Atlanta, GA, USA, 2013.
  32. UCLA Energy Design Tools Group. Climate Consultant 6.0. Available online: https://www.sbse.org/resources/climate-consultant (accessed on 7 May 2022).
  33. Dols, W.S.; Walton, G.N. CONTAMW 2.0 User Manual; NISTIR 6921; National Institute of Standards and Technology: Gaithersburg, MD, USA, 2002.
  34. Liddament, M.W. Air Infiltration Calculation Techniques: An Applications Guide; Air Infiltration and Ventilation Centre: Berkshire, UK, 1986. [Google Scholar]
  35. Parsons, R. Fundamentals: 2005 Ashrae Handbook: SI Edition; American Society of Heating, Refrigerating and Air-Conditioning Engineers, Inc.: Atlanta, GA, USA, 2005. [Google Scholar]
  36. China Academy of Building Research. GB 50736-2012 Code for Design of Heating Ventilation and Air Conditioning in Civil Buildings; China Architecture and Building Press: Beijing, China, 2012. [Google Scholar]
  37. Barbadilla-Martín, E.; Guadix Martín, J.; Salmerón Lissén, J.M.; Sánchez Ramos, J.; Álvarez Domínguez, S. Assessment of Thermal Comfort and Energy Savings in a Field Study on Adaptive Comfort with Application for Mixed Mode Offices. Energy Build. 2018, 167, 281–289. [Google Scholar] [CrossRef]
  38. Castaño-Rosa, R.; Rodríguez-Jiménez, C.; Rubio-Bellido, C. Adaptive Thermal Comfort Potential in Mediterranean Office Buildings: A Case Study of Torre Sevilla. Sustainability 2018, 10, 3091. [Google Scholar] [CrossRef] [Green Version]
  39. Ming, R.; Yu, W.; Zhao, X.; Liu, Y.; Li, B.; Essah, E.; Yao, R. Assessing Energy Saving Potentials of Office Buildings Based on Adaptive Thermal Comfort Using a Tracking-Based Method. Energy Build. 2020, 208, 109611. [Google Scholar] [CrossRef]
  40. CIBSE. CIBSE Guide A Environmental Design; The Chartered Institution of Building Services Engineers: London, UK, 2015. [Google Scholar]
  41. EN 15251; Indoor Environmental Input Parameters for Design and Assessment of Energy Performance of Buildings Addressing Indoor Air Quality, Thermal Environment, Lighting and Acoustics. European Committee for Standardization: Brussels, Belgium, 2007.
Figure 1. Flow chart of the research method used in the paper.
Buildings 12 00793 g001
Figure 2. Dry−bulb temperature and moisture content of ambient air in Beijing weather data set (red dots) and the thermal comfort zone (green dots) specified in the ANSI/ASHRAE standard 55.
Buildings 12 00793 g002
Figure 3. Wind rose showing frequency distributions of associated wind direction and wind speed based on favourable outdoor temperature conditions during Beijing’s study period.
Buildings 12 00793 g003
Figure 4. Graphs showing (a) top floor plan and (b) 3-dimensional geometry model of the office building.
Buildings 12 00793 g004aBuildings 12 00793 g004b
Figure 5. Operation strategies of mixed-mode cooling.
Buildings 12 00793 g005
Figure 6. (a) Test room with locations of temperature and relative humidity sensors marked, (b) locations of anemometers measuring indoor air velocity distribution, and (c) the meteorological station placed outside the studied building.
Buildings 12 00793 g006
Figure 7. Location of experimental apparatus arranged in the test room.
Buildings 12 00793 g007
Figure 8. Computational domains: meshed geometries for room No. 403 in the south direction and all the zones on the top floor.
Buildings 12 00793 g008
Figure 9. (a) Indoor air temperature profile compared between simulation and experimental results and the associated (b) outdoor weather data during a week in April and May 2022.
Buildings 12 00793 g009
Figure 10. (a) Indoor air temperature profile compared between simulation and experimental results and the associated (b) outdoor weather data during a week in October 2021.
Buildings 12 00793 g010
Figure 11. (a) Predicted space temperatures, cooling loadand; (b) airflow rates during 3 days in April (hybrid mechanical and natural ventilation mode).
Buildings 12 00793 g011aBuildings 12 00793 g011b
Figure 12. (a) Predicted space temperatures, cooling load and (b) airflow rates during 3 days in August (mixed-mode cooling).
Buildings 12 00793 g012aBuildings 12 00793 g012b
Figure 13. (a) Predicted space temperatures, cooling load and (b) airflow rates during 3 days in October (mechanical and natural ventilation mode).
Buildings 12 00793 g013aBuildings 12 00793 g013b
Figure 14. PMV and PPD thermal comfort data for the (a) mixed−mode and (b) air conditioning mode.
Buildings 12 00793 g014
Figure 15. Adaptive comfort data for the natural ventilation mode.
Buildings 12 00793 g015
Figure 16. Validation of simulated and experimental indoor air velocity distribution for different wind directions.
Buildings 12 00793 g016
Figure 17. A CFD example showing air velocities and temperatures for a naturally ventilated room (403) in the vertical section of the opening window: (a) door closing and (b) door opening.
Buildings 12 00793 g017aBuildings 12 00793 g017b
Figure 18. CFD calculated air velocities and temperatures for the top floor of the naturally ventilated building: (a) internal doors are closed and (b) doors are opened (cross-ventilation) (27 October, 16:00).
Buildings 12 00793 g018
Figure 19. Monthly cooling electricity consumption for mixed cooling and mechanical cooling modes.
Buildings 12 00793 g019
Table 1. Building construction and opening information.
ElementMaterialsThickness
mm
Conductivity
W/(m·K)
Density
kg/m3
Specific Heat
J/(kg·K)
U-Value
W/(m2·K)
External WallBrickwork Outer1050.8417008000.433
Foam—polyurethane500.028301470
Concrete Block(Medium)1000.5114001000
Gypsum Plastering130.410001000
RoofCement mortar250.93180010500.311
XPS Extruded Polystyrene550.034351400
Cement mortar250.9318001050
Slag Cement300.0231000920
Reinforced Concrete1201.742500920
Cement mortar250.9318001050
Internal
Partitions
Cement mortar130.93180010502.755
Aerated concrete block180.247501000
Cement mortar130.9318001050
Dormitory FloorCement mortar130.93180010501.8
Cast Concrete (Dense)1001.42100840
Wood derivatives—plywood300.157001420
Corridor/Toilet FloorCement mortar130.93180010502.545
Cast Concrete (Dense)1001.42100840
Ceramic floor tiles300.81700850
Dormitory Ground FloorRammed soil1501.214608800.268
XPS Extruded Polystyrene1000.034351400
Cast Concrete1001.1320001000
Floor Screed700.411200840
Wood derivatives-plywood300.157001420
Corridor/Toilet Ground FloorRammed soil1501.214608800.28
XPS Extruded Polystyrene1000.034351400
Cast Concrete1001.1320001000
Floor Screed700.411200840
Ceramic floor tiles300.81700850
External WindowsGeneric PYR B CLEAR60.9Solar transmittance
0.635
1.68
Argon12-
Generic CLEAR60.9
Table 2. Details of internal gains including occupancy, lighting, computer, and office equipment loads.
Internal GainOccupancy Density
(m2/Person)
Lighting Power Density
(W/m2)
Computers Power Density
(W/m2)
Office Equipment Power Density
(W/m2)
Office room6181513
Toilet201100
Corridor50500
Table 3. Experimental apparatus with measuring range and accuracy.
Measuring ParametersExperimental ApparatusManufacturerRangeAccuracy
Indoor dry-bulb temperatureTemperature and relative humidity sensorsJianda Renke−40 °C–80 °C±0.1 °C
Indoor relative humidity0–100% RH±1.5% RH
Indoor air velocity AnemometersTesto-4250.01–20 m/s±0.03 m/s
Outdoor dry-bulb temperatureMeteorological stationYIGU-QXM−40 °C–100 °C±0.3 °C
Outdoor relative humidity0–100% RH±5% RH
Global horizontal radiation0.1–1999.9 W/m2±10 W/m2
Wind speed0–45 m/s±0.5 m/s
Wind direction0–360°±3°
Atmospheric pressure300–1100 hPa±0.5 hPa
Publisher’s Note: MDPI stays neutral with regard to jurisdictional claims in published maps and institutional affiliations.

