Article

Experimental Investigations of the Behavior of Stiffened Perforated Cold-Formed Steel Sections Subjected to Axial Compression

1
Civil Engineering Department, Faculty of Engineering Mataria, Helwan University, Cairo 11718, Egypt
2
Faculty of Engineering Mataria, Helwan University, Cairo 11718, Egypt
3
Structural Engineering Department, Future University, New Cairo 11835, Egypt
*
Author to whom correspondence should be addressed.
Buildings 2022, 12(6), 812; https://doi.org/10.3390/buildings12060812
Submission received: 14 April 2022 / Revised: 22 May 2022 / Accepted: 31 May 2022 / Published: 12 June 2022
(This article belongs to the Special Issue Structural Performance of Cold-Formed Steel Structures)

Abstract

:
Cold-formed steel sections are becoming popular for different steel structures, because they have a high resistance against different straining actions, with a minimal weight compared with hard steel sections. Recently, perforated cold-formed steel (PCFS) sections have been used in many applications, such as perforated upright storage racks. Experimental research into the behavior of steel storage rack uprights subjected to axial compression is presented in this paper. First, tensile tests determined the material qualities of the cold-formed steel uprights. Then, seventeen perforated specimens were examined under axial compression, with five different cross-sections, three different web heights and thicknesses, and varying lengths. The study’s goals were to find out how perforations affect the performance and failure mode of steel storage rack uprights, to discuss the interaction of distortional and global buckling, and to verify the accuracy of using the direct strength method (DSM) for predicting the ultimate strength before failure in buckling interactions for perforated uprights. It was found that the failure modes of perforated specimens with stiffeners generally cannot be well predicted using the direct strength method. However, when the modifications proposed by Xianzhong Zhao et al. are used, the accuracy is acceptable.

1. Introduction

Cold-formed steel sections can be efficiently used as structural members of lightweight structures when a hot-roll is not optimum and efficient. They are widely used in commercial, residential, and industrial constructions. They are a component element in steel industrial storage rack systems, such as steel uprights, beams, and bracings. In recent years the use of industrial storage rack systems has been growing. Therefore, it is vital to broaden the scope of research into the structural behavior of their elements. The upright components used in storage racking generally have many perforations. Perforations run the length of the perforated uprights, allowing the beam to be linked at different heights and the bracing to be bolted together to form the frames. Several experimental studies [1,2,3,4,5,6,7,8,9,10,11,12] have been conducted to examine the behavior of perforated uprights, to determine their load capacity.
Casafont M. et al. [1] carried out an experimental study on steel storage rack uprights subjected to axial compression, to study the failure due to a combination between distortional buckling and global buckling modes. They found that the combination of the two different modes of buckling affects the column strength and should be considered in the design. Zhao et al. [2] presented an experimental investigation to study the structural behavior and the failure modes of 67 uprights, with and without perforations, subjected to axial compression. As the direct strength method (DSM) does not account for the effect of perforations, the experimental findings showed that the DSM forecasts overstated the load capacity. Therefore, depending on the results of the experimental study, they proposed a modified (DSM) for perforated uprights. The influence of varied designs of numerous circular holes on the compressive capacity of channels was investigated by Rhodes and Schneider [3]. They carried out a series of compression experiments analyzing perforation patterns. The test findings clearly revealed that the impacts of perforations on component load capacity are dependent on perforation location and size.
Crisan et al. [4] investigated the interactive buckling of steel pallet racks as compression members, to observe the distortionary–global interaction and determine the ultimate strength of the upright members. They studied two groups of upright members with two different cross-sections, one having perforations and the other without perforations. They claimed that all testing was conducted following the Euro-Code for racking systems EN15512 [5] guidelines and conditions. The buckling curve for a specific section type was calculated based on the experimental data. The experimental results led to obtaining the buckling curve for a given section type. Roure et al. [6] conducted a comprehensive set of experimental testing on twenty different pallet-rack upright steel profiles with various compressed cross-sections. They compared the experimental results to two different methods: analytical, using the European Standard; and numerical, using finite element (F.E) analysis. They discovered that while none of the methods can completely replace experimental testing and physical testing is still required, finite element analysis can reduce the number of tests needed, because it reproduces most of the factors involved. In addition, K.S performed stub column tests.
Sivakumaran [7] determined the ultimate compression strength of perforated cold-formed sections. He explained that as the diameter of the hole grew larger, the strength of these parts dropped. Similar results were found when analyzing the effect of web holes on stub column ultimate strength [8,9]. Baldassino, N et al. [10] studied the distortional buckling of cold-formed steel storage rack sections, including with perforations. Kwon et al. [11] studied the ultimate strength of stub and intermediate-length columns by conducting compression tests on cold-formed steel-lipped channel sections and channel sections with intermediate stiffeners at the flanges and web. Local buckling and distortional buckling happened simultaneously, only for the stub columns.
In contrast, the interaction between local buckling and overall buckling was the final failure mode for the intermediate and long columns. The findings of experimental tests on 36 columns with and without perforations with complicated edge stiffeners exposed to axial compression were presented by Xiang, Zhou, and Shi [12]. They found that the properties of perforations affected the ultimate strength and the deformed shape of the columns.
The direct strength method (DSM) was proposed by Schafer and Pekoz [13], and it has been modified over time. As an alternative design technique for cold-formed steel structures, the DSM has been officially incorporated in the latest versions of the North American specification AISI-S100 [14] and the Australian/New Zealand standard AS/NZS4600 [15]. The DSM is recommended for its calculation efficiency, notably for design strength predictions of cold-formed steel sections with complicated stiffeners, which is due to effective section calculation no longer being needed in the design strength predictions. Many researchers have studied the elastic buckling stress of perforated plates and members, such as Moen and Schafer [16]. Based on theoretical and F.E. research, they devised simpler procedures for approximating the global, distortional, and local critical elastic buckling loads of cold-formed steel columns and beams with holes. Yao et al. [17] employed F.E. analysis to develop an effective method representing a modification of the DSM for calculating the elastic distortional buckling stress of perforated parts under axial compression.
From a careful review of the recent research works on (CFS) upright members, it is noted that they focused on studying the behavior and efficiency of these elements under the influence of the different cross-sections, perforated or non-perforated, and stiffened or non-stiffened. Most of the research on (PCFS) upright members focused on circular or rectangular shape openings or slots, because assembling the beams into upright members in the steel racking systems was previously done using bolts. Now, however, an assembly system has been introduced in the manner of an interlock, which calls for the presence of openings in a series of triangular and circular shapes. Therefore, the aims of this research are:
  • Studying the presence of triangular and circular openings on the behavior and capacity of columns (PCFS) experimentally, with upright members, stiffened or non-stiffened.
  • Studying the applicability of using the direct strength method (DSM) to evaluate the efficiency of these sections and the sort of buckling that causes the collapse.
Therefore, the seventeen (PCFS) upright members, stiffened and non-stiffened, with different dimensions, and subjected to axial compression were experimentally tested. The results were used to achieve the objectives of this research.

2. Experimental Program

2.1. Material Properties
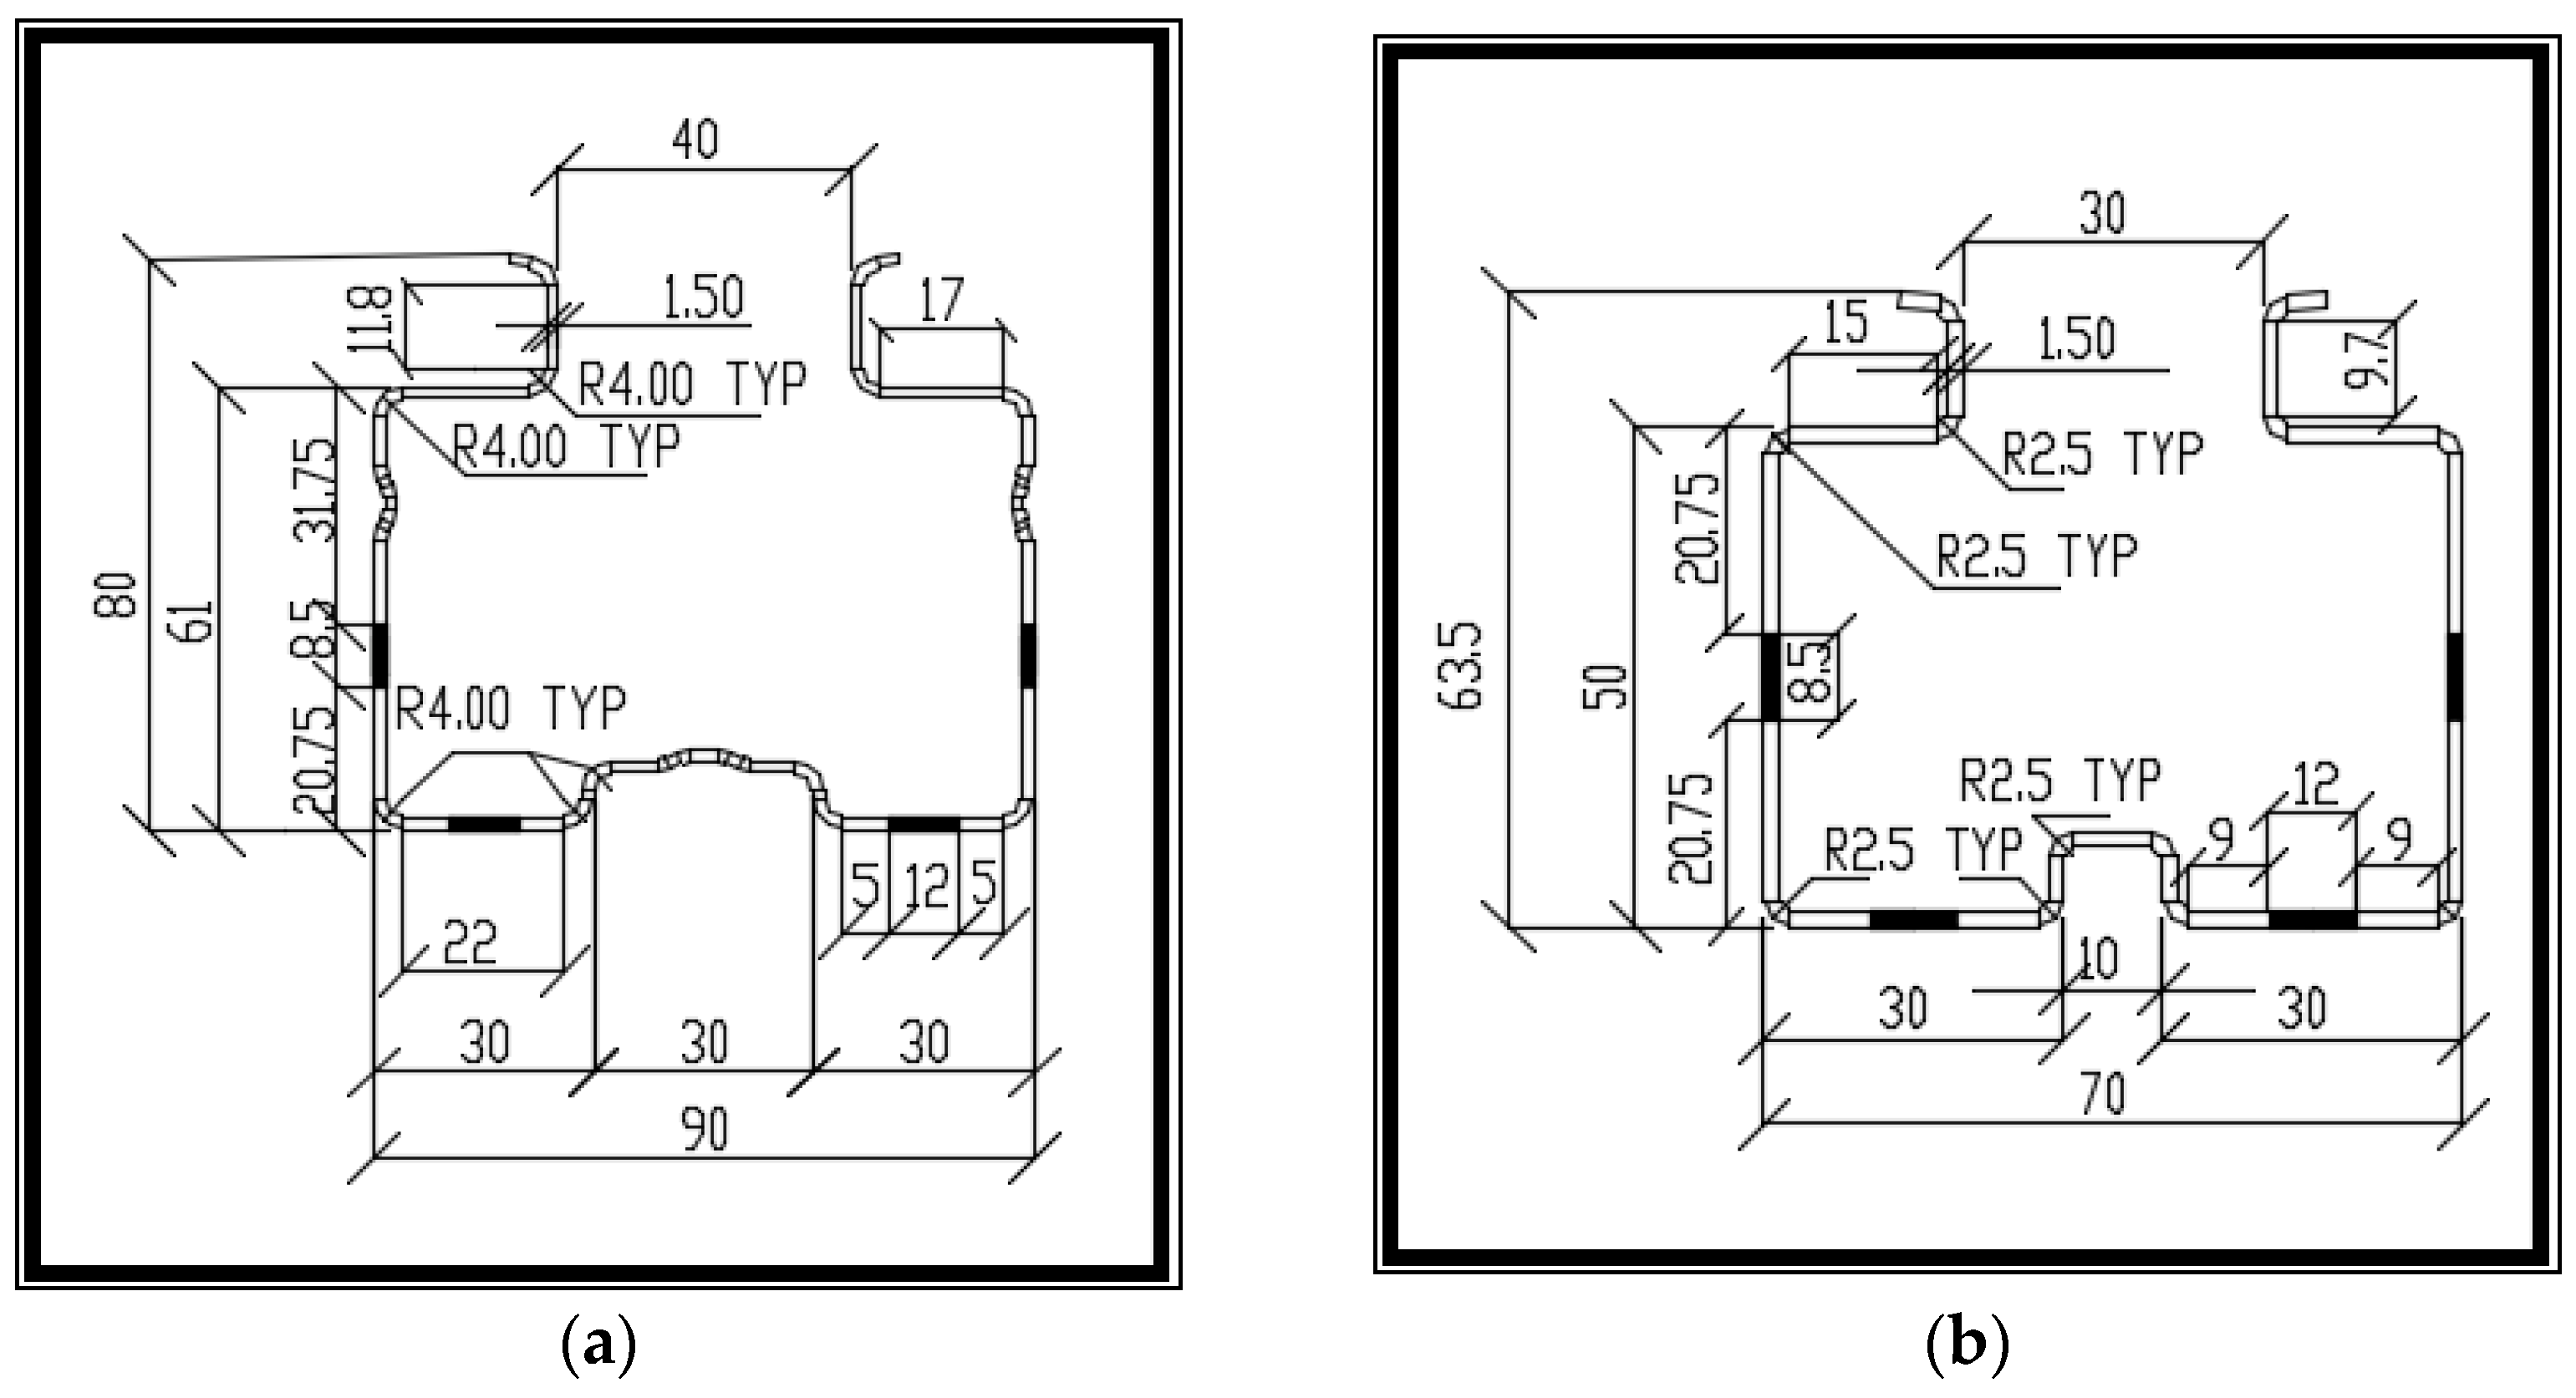
A series of tensile tests were conducted on three categories of slices, with three different thicknesses (1.5, 2.0, and 2.5 mm), using a hydraulic MTS (Material Test System) to determine the material properties of the tested specimens (i.e., ultimate tensile stress (Fu), yield stress (Fy), and Young’s modulus (E)). Nine slices were tested for each thickness. Three of them were tacked as non-perforated flat coupons, which were cut longitudinally from flat parts of the uprights; three other flat coupons with circular perforations were cut from the flanges of the uprights; and the last three flat coupons, with a sequence of triangular and circular perforations, were cut from the webs of the uprights. The ultimate tensile stress (Fu = Pu/An) for each slice was calculated by dividing the value of the maximum breaking load according to the tensile test by the value of its net cross-section area. The yield stress (Fy) for each slice was determined based on the 0.2% offset strength method. Finally, Young’s modulus of each slice (E = F/Ɛ) was calculated by dividing the value of stress (F) by the value of strain (Ɛ). We must note that the strain (Ɛ = ΔL/Lo) was calculated by dividing the elongation under tension (ΔL) by the original gauge length of the test slice (Lo). Then the final material properties (Fu, Fy, and E) for each thickness were calculated from the average of the material properties of the nine slices, as shown in Table 1.

2.2. Specimens

The seventeen stiffened (PCFS) upright members were categorized into five types of cross-sections, according to the web height and thickness, as listed in Table 2. The abbreviations listed in this Table are as follows: (hw) means the overall web height, (bf) means the flange width, (t) means thickness, (L) the specimen length, (Ag) the gross area of cross-section, (Anet) the net area of cross-section, and (rx net) the net radius of gyration in the x-direction. In addition, (ry net) is the net radius of gyration in the y-direction, (λx) is the slenderness ratio of the specimen in the x-direction, where (λx = L/rx net), (λy) is the slenderness ratio of the specimen in the y-direction, where (λy = L/ry net), and (λmax) is the maximum slenderness ratio of both λx and λy.
The specimens were labeled to specify the section type; for example, the label “C70-63.5-1.5-P-500” where “C” refers to “C-section” and the numbers following “C” refer to the overall web height (hw) of 70 mm, flange width (bf) of 63.5 mm, the thickness of section (t) of 1.5 mm, and specimen length (L) of 500 mm, respectively. The letter “P” indicates that the specimen is perforated. The tested specimens’ shape, the shape of perforations, the directions of global axes (x, y, and z), and the cross-section shape are shown in Figure 1. Figure 2 shows the different properties of the perforations at the web and flanges, such as the shapes, locations, dimensions, and the cross-sectional geometry of the tested specimens; all dimensions are in mm.

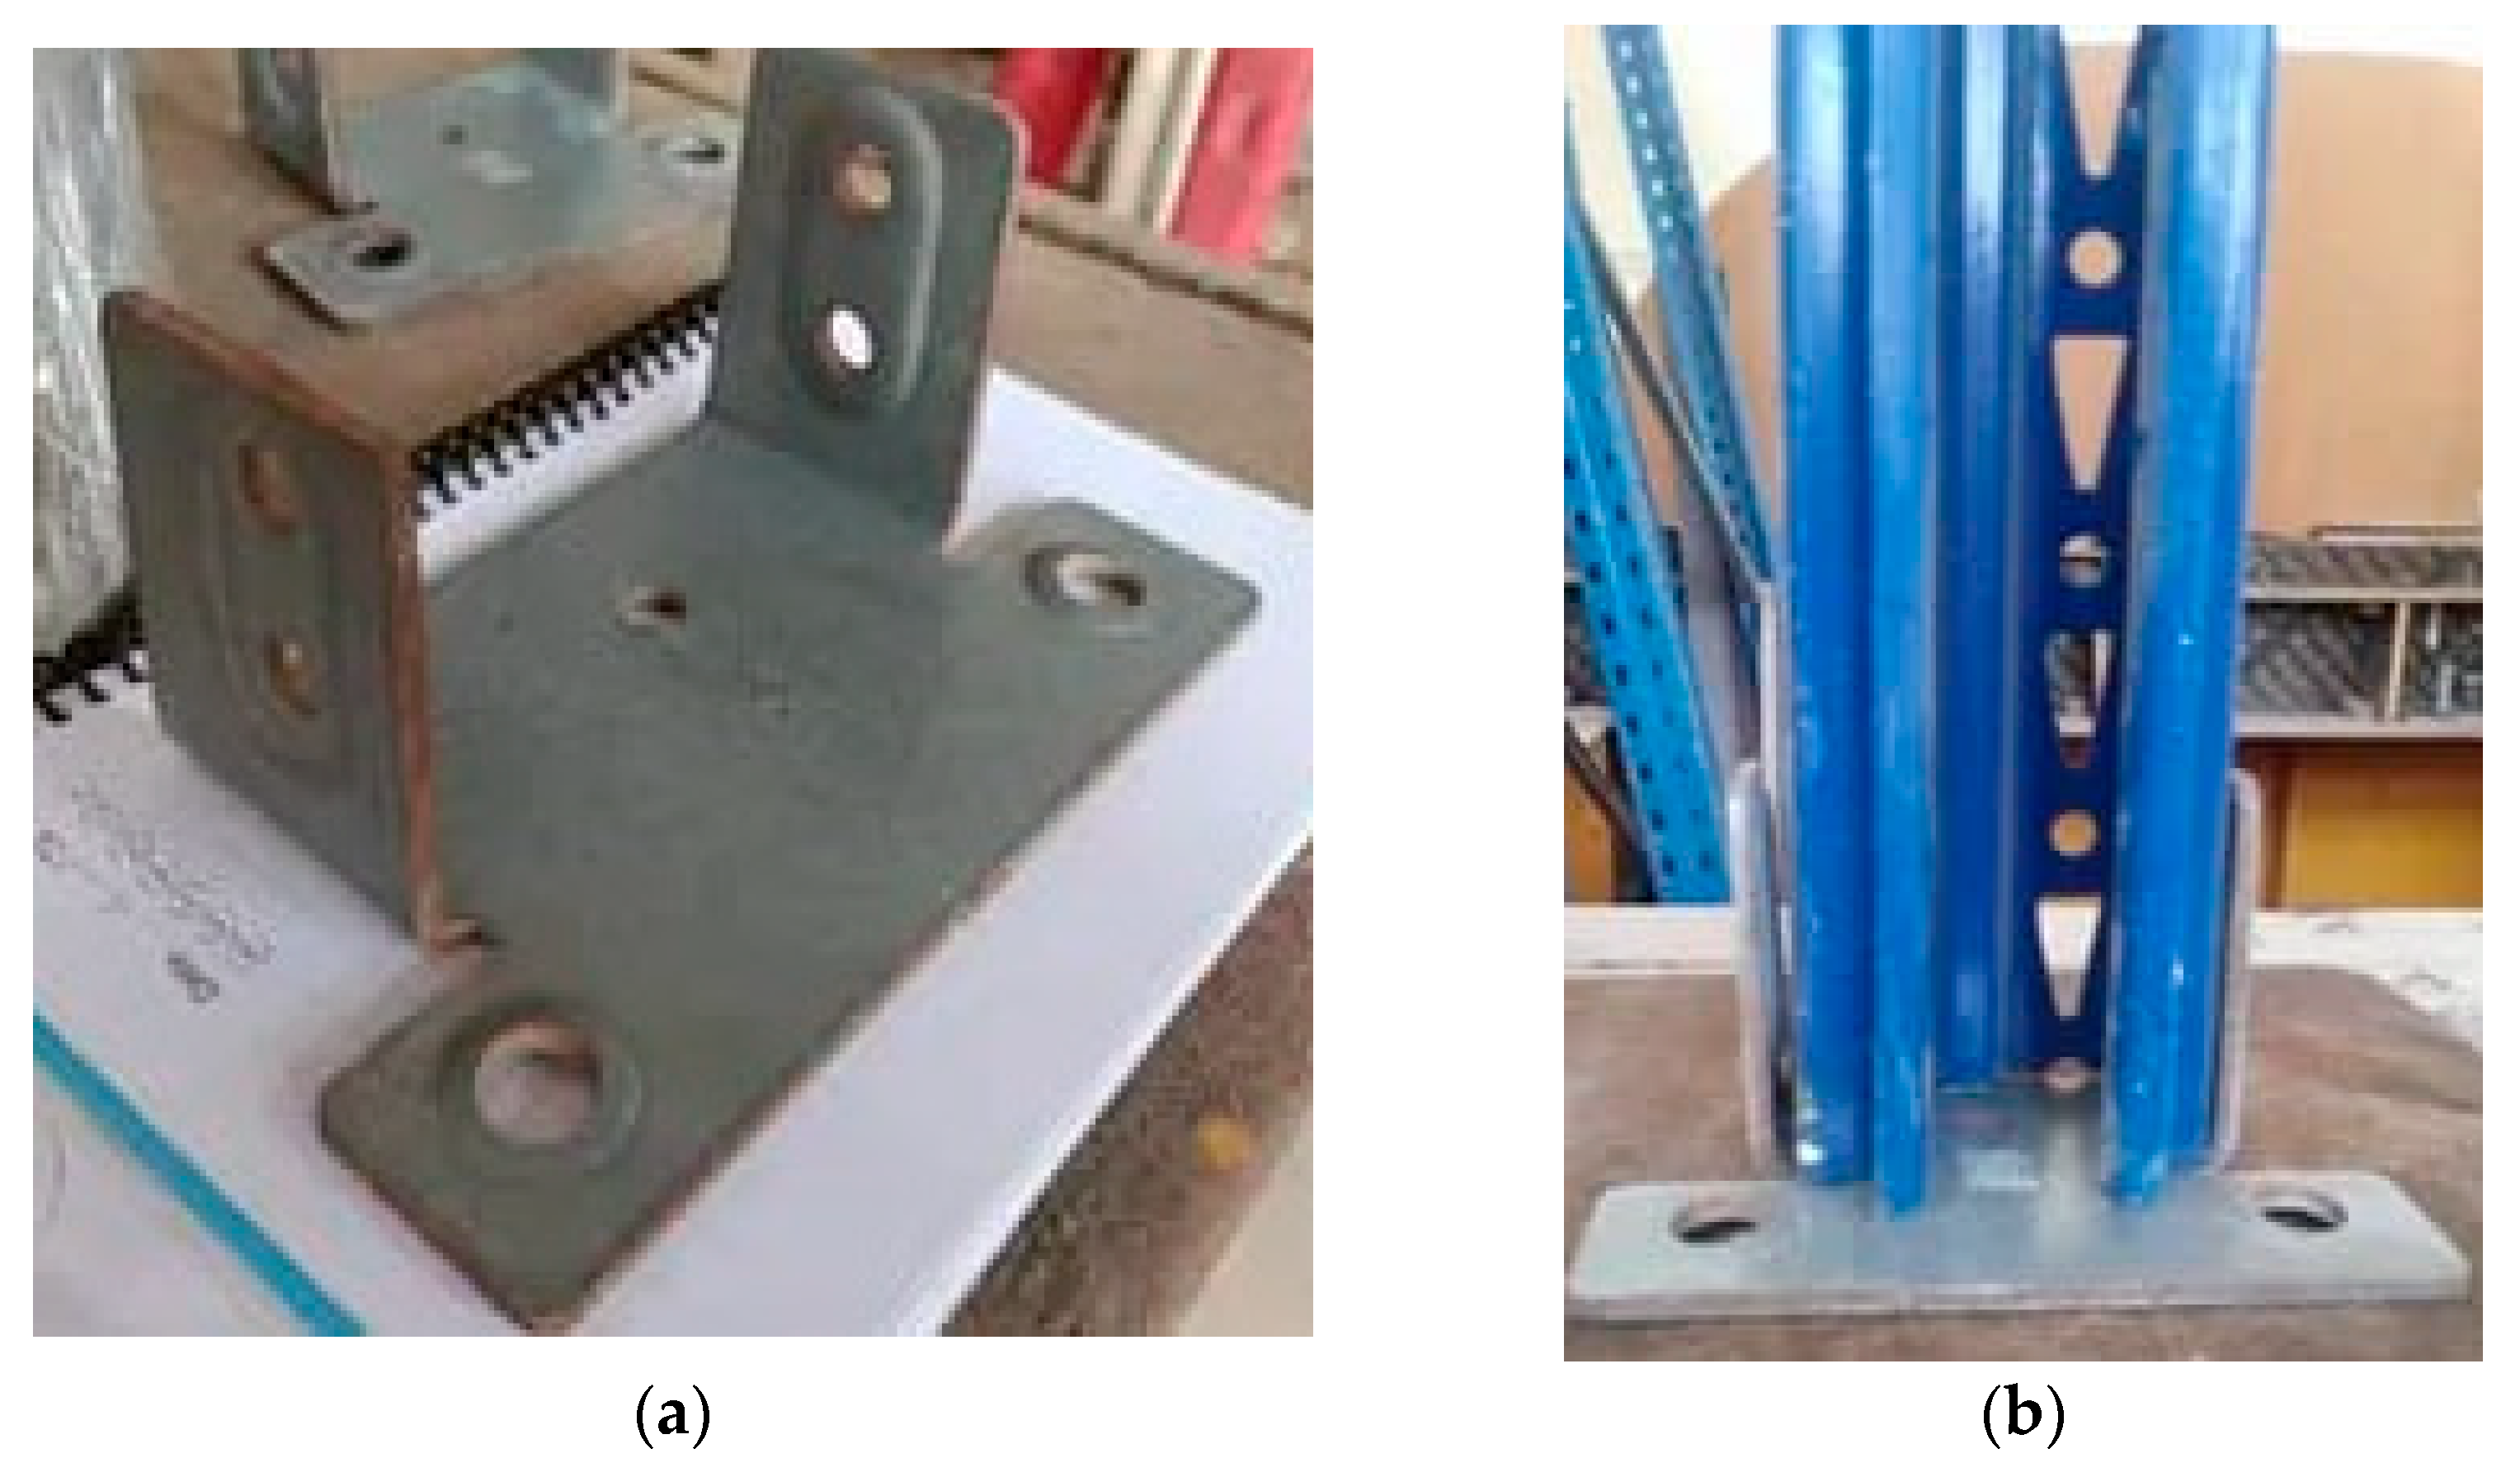
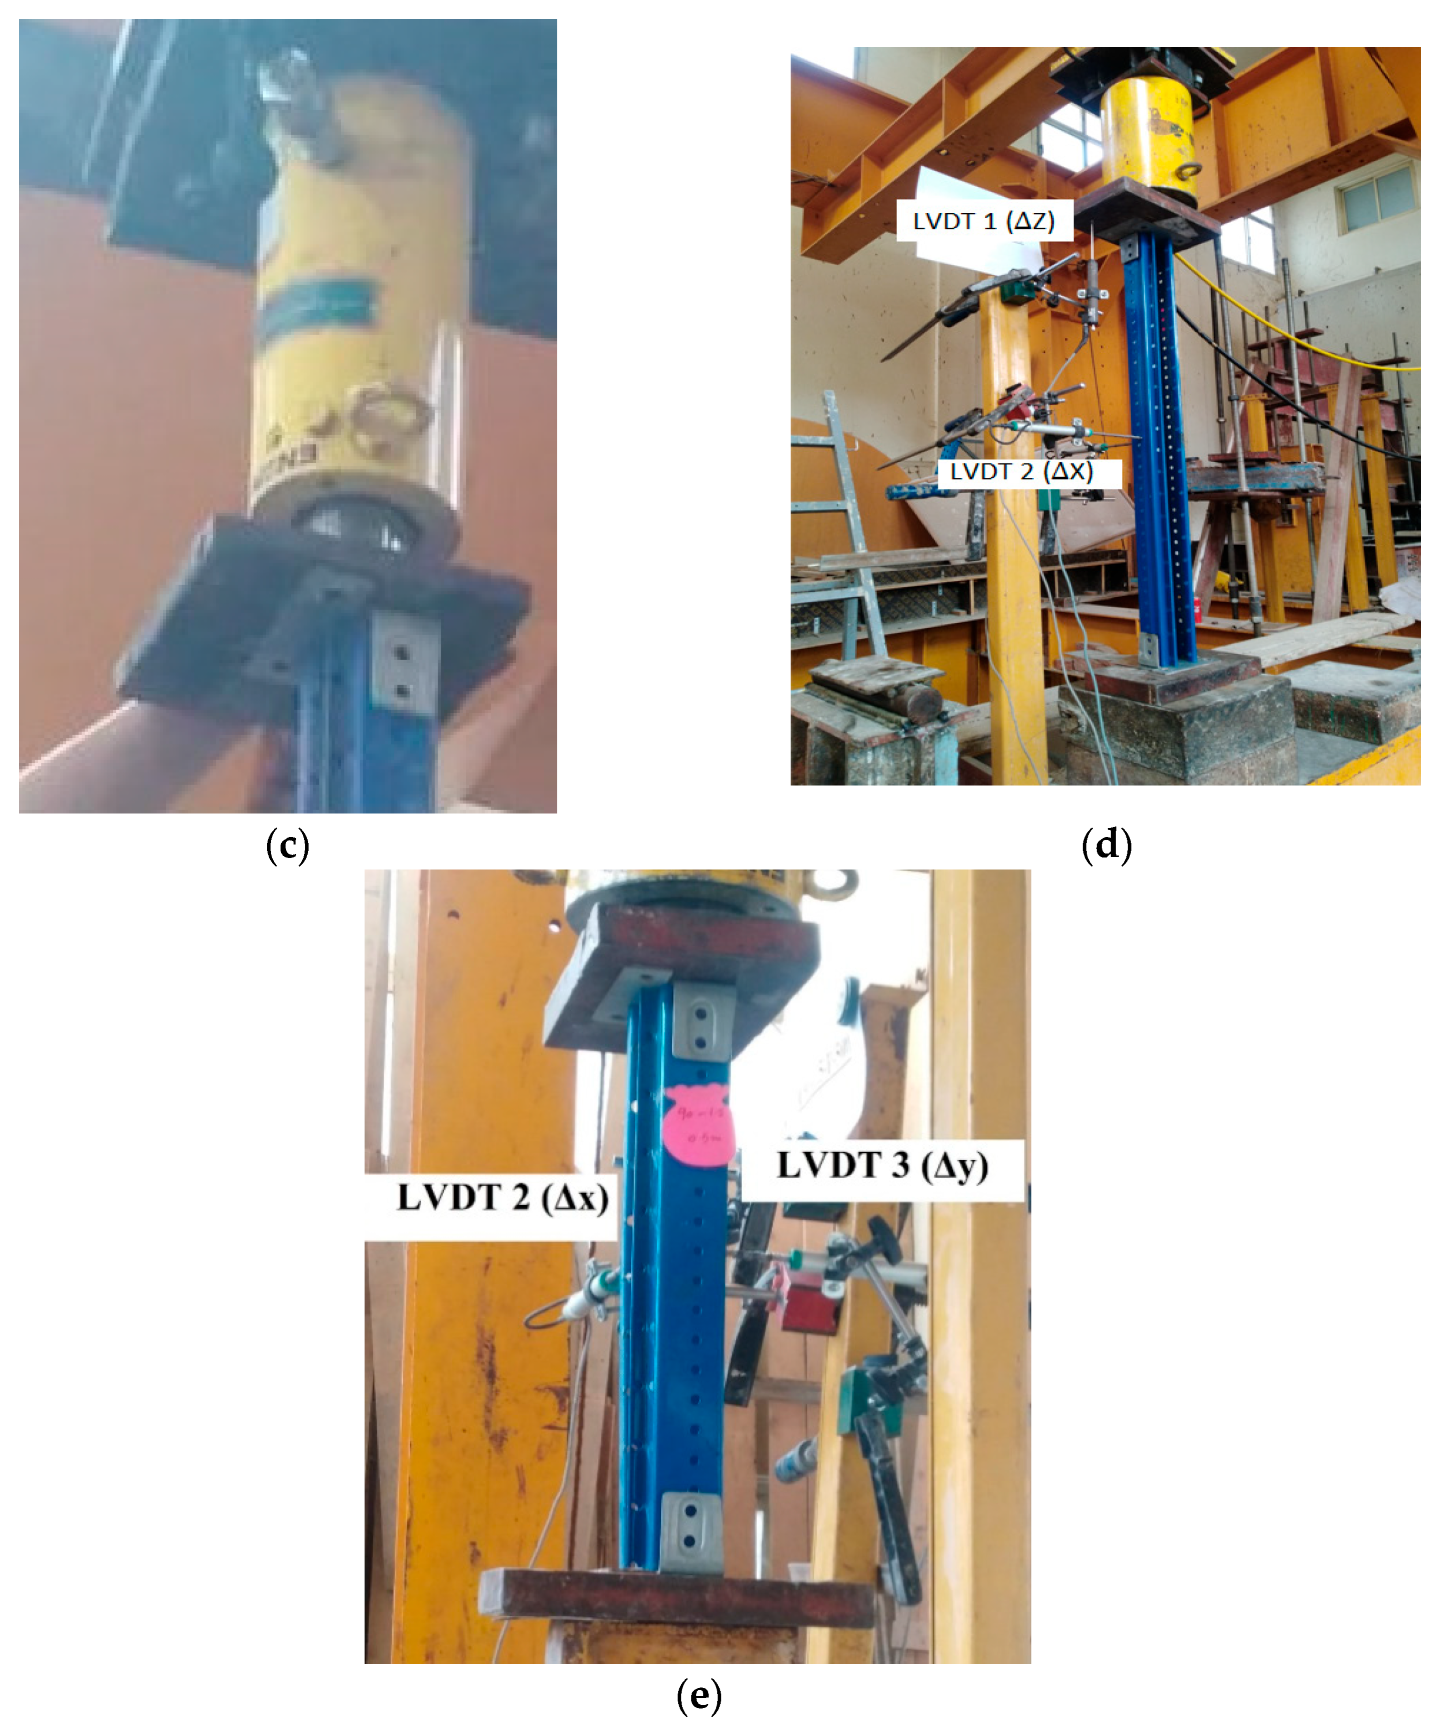
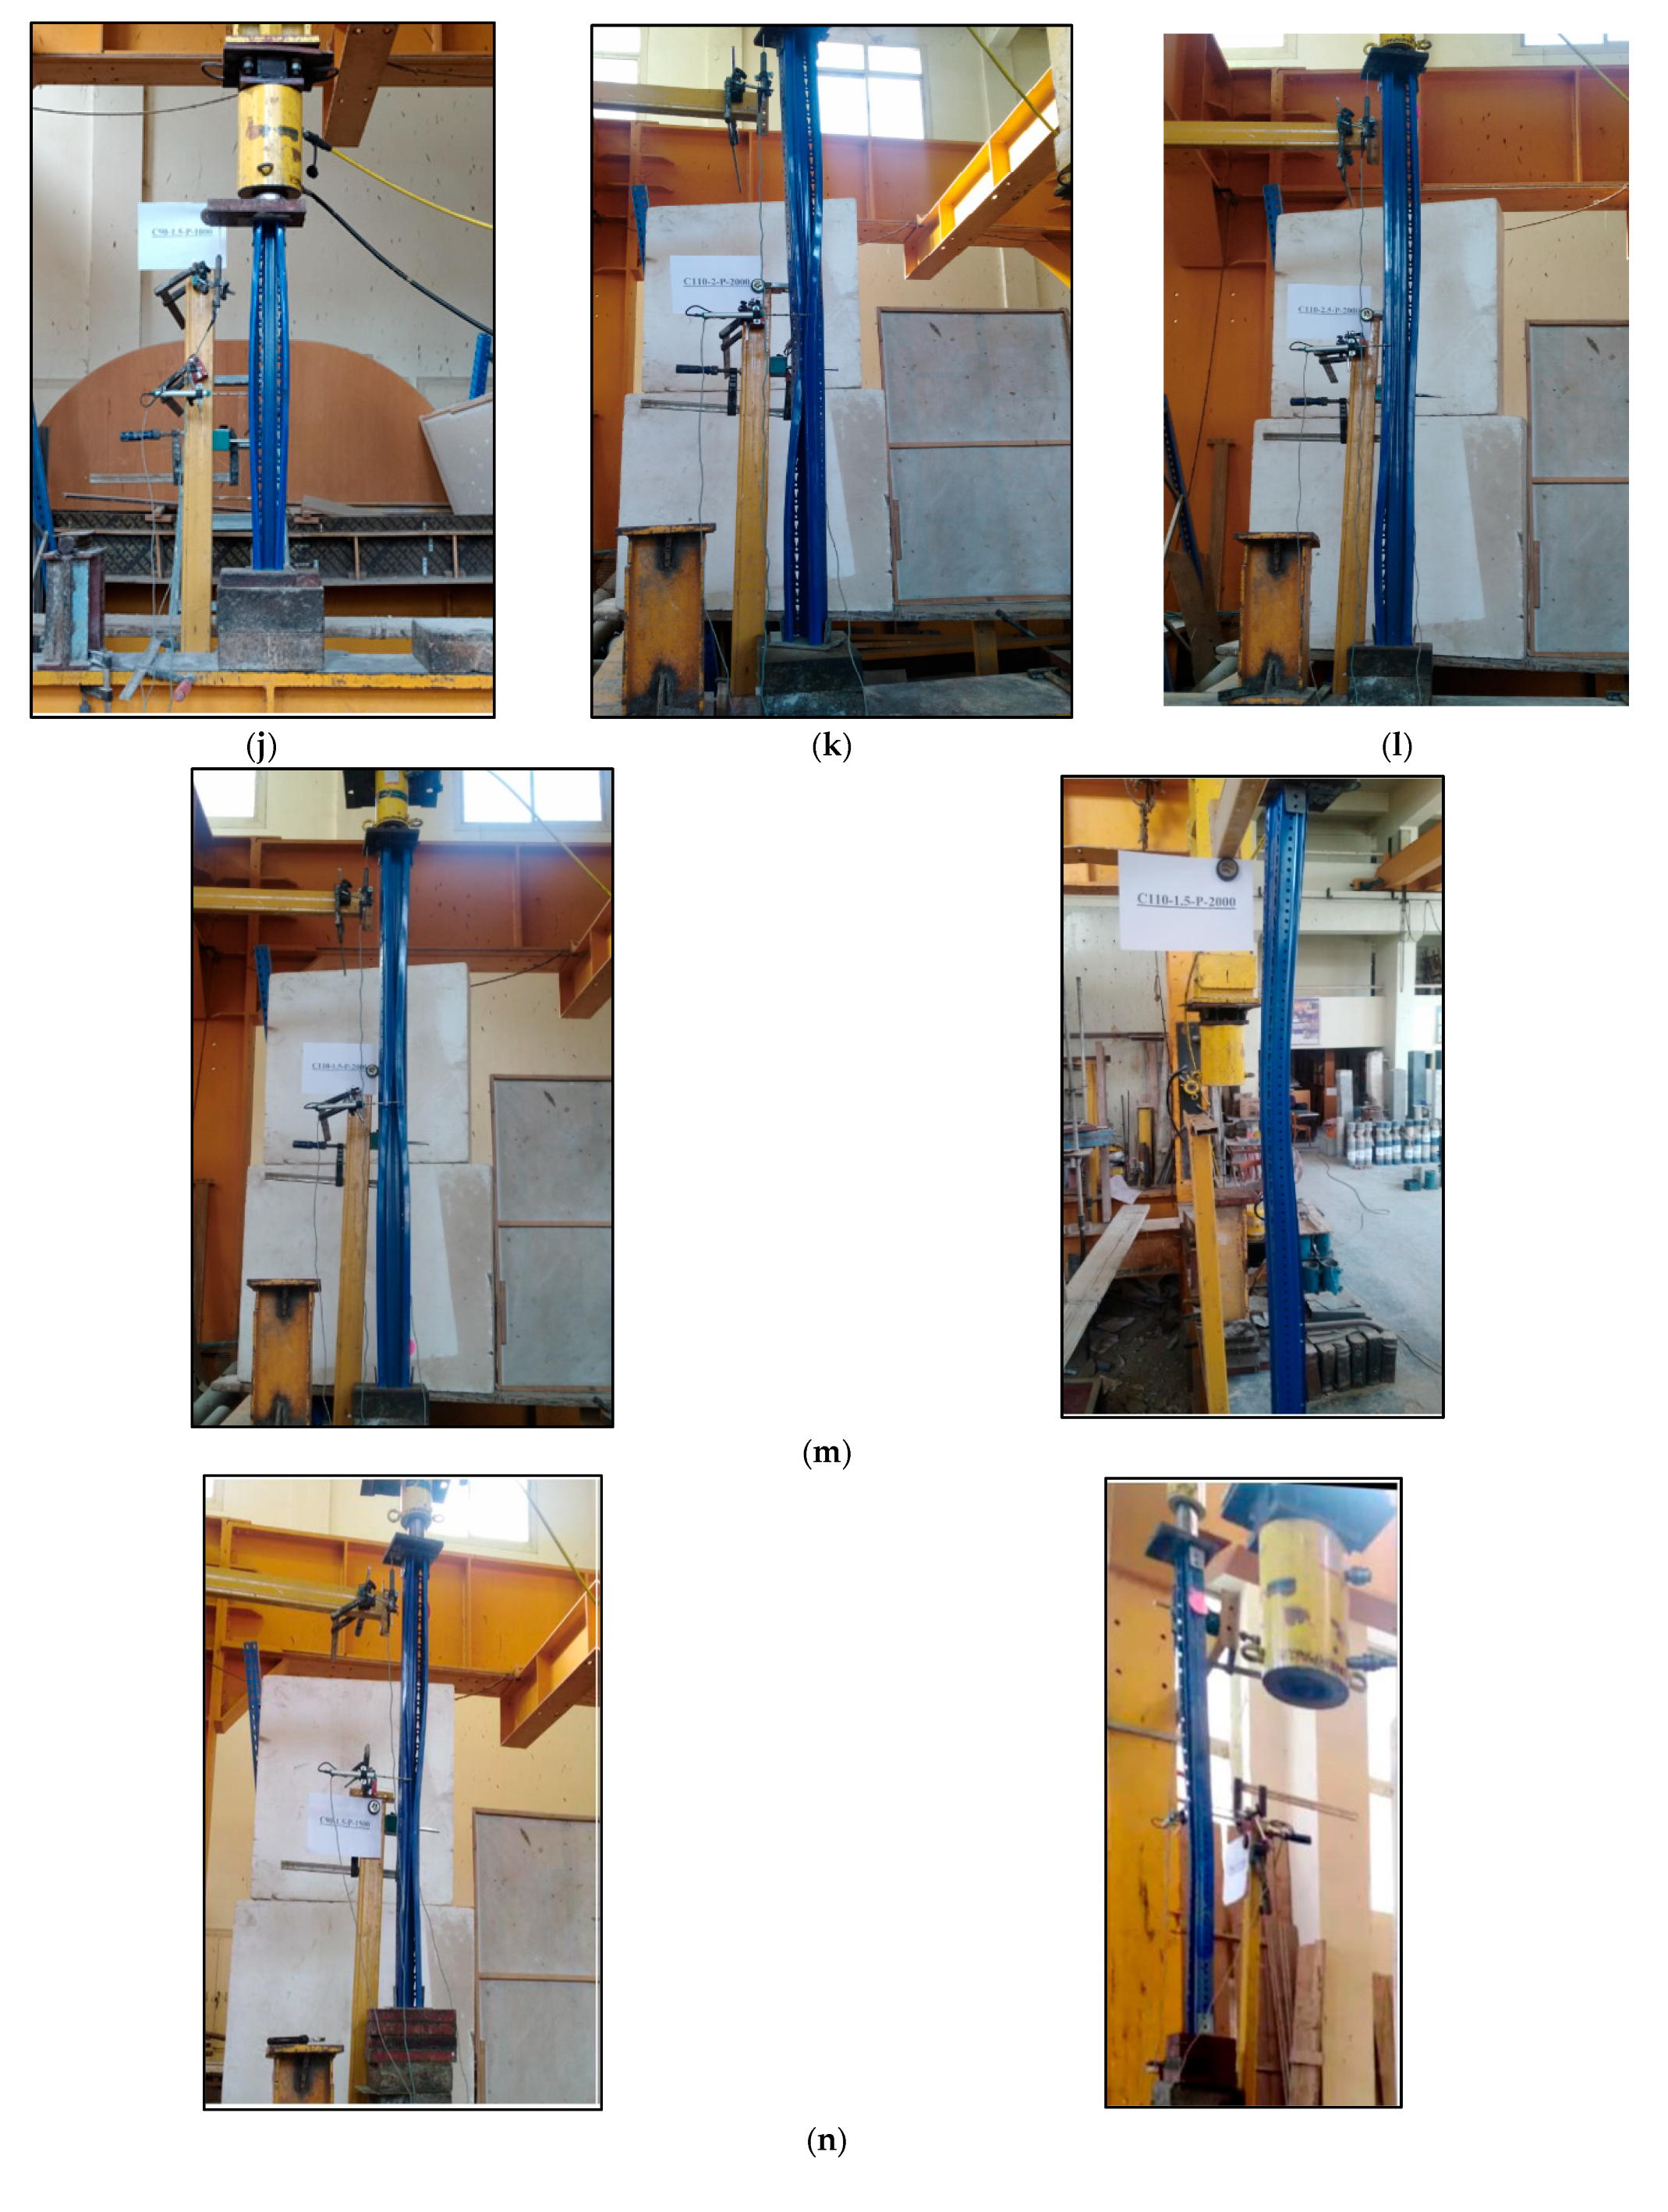
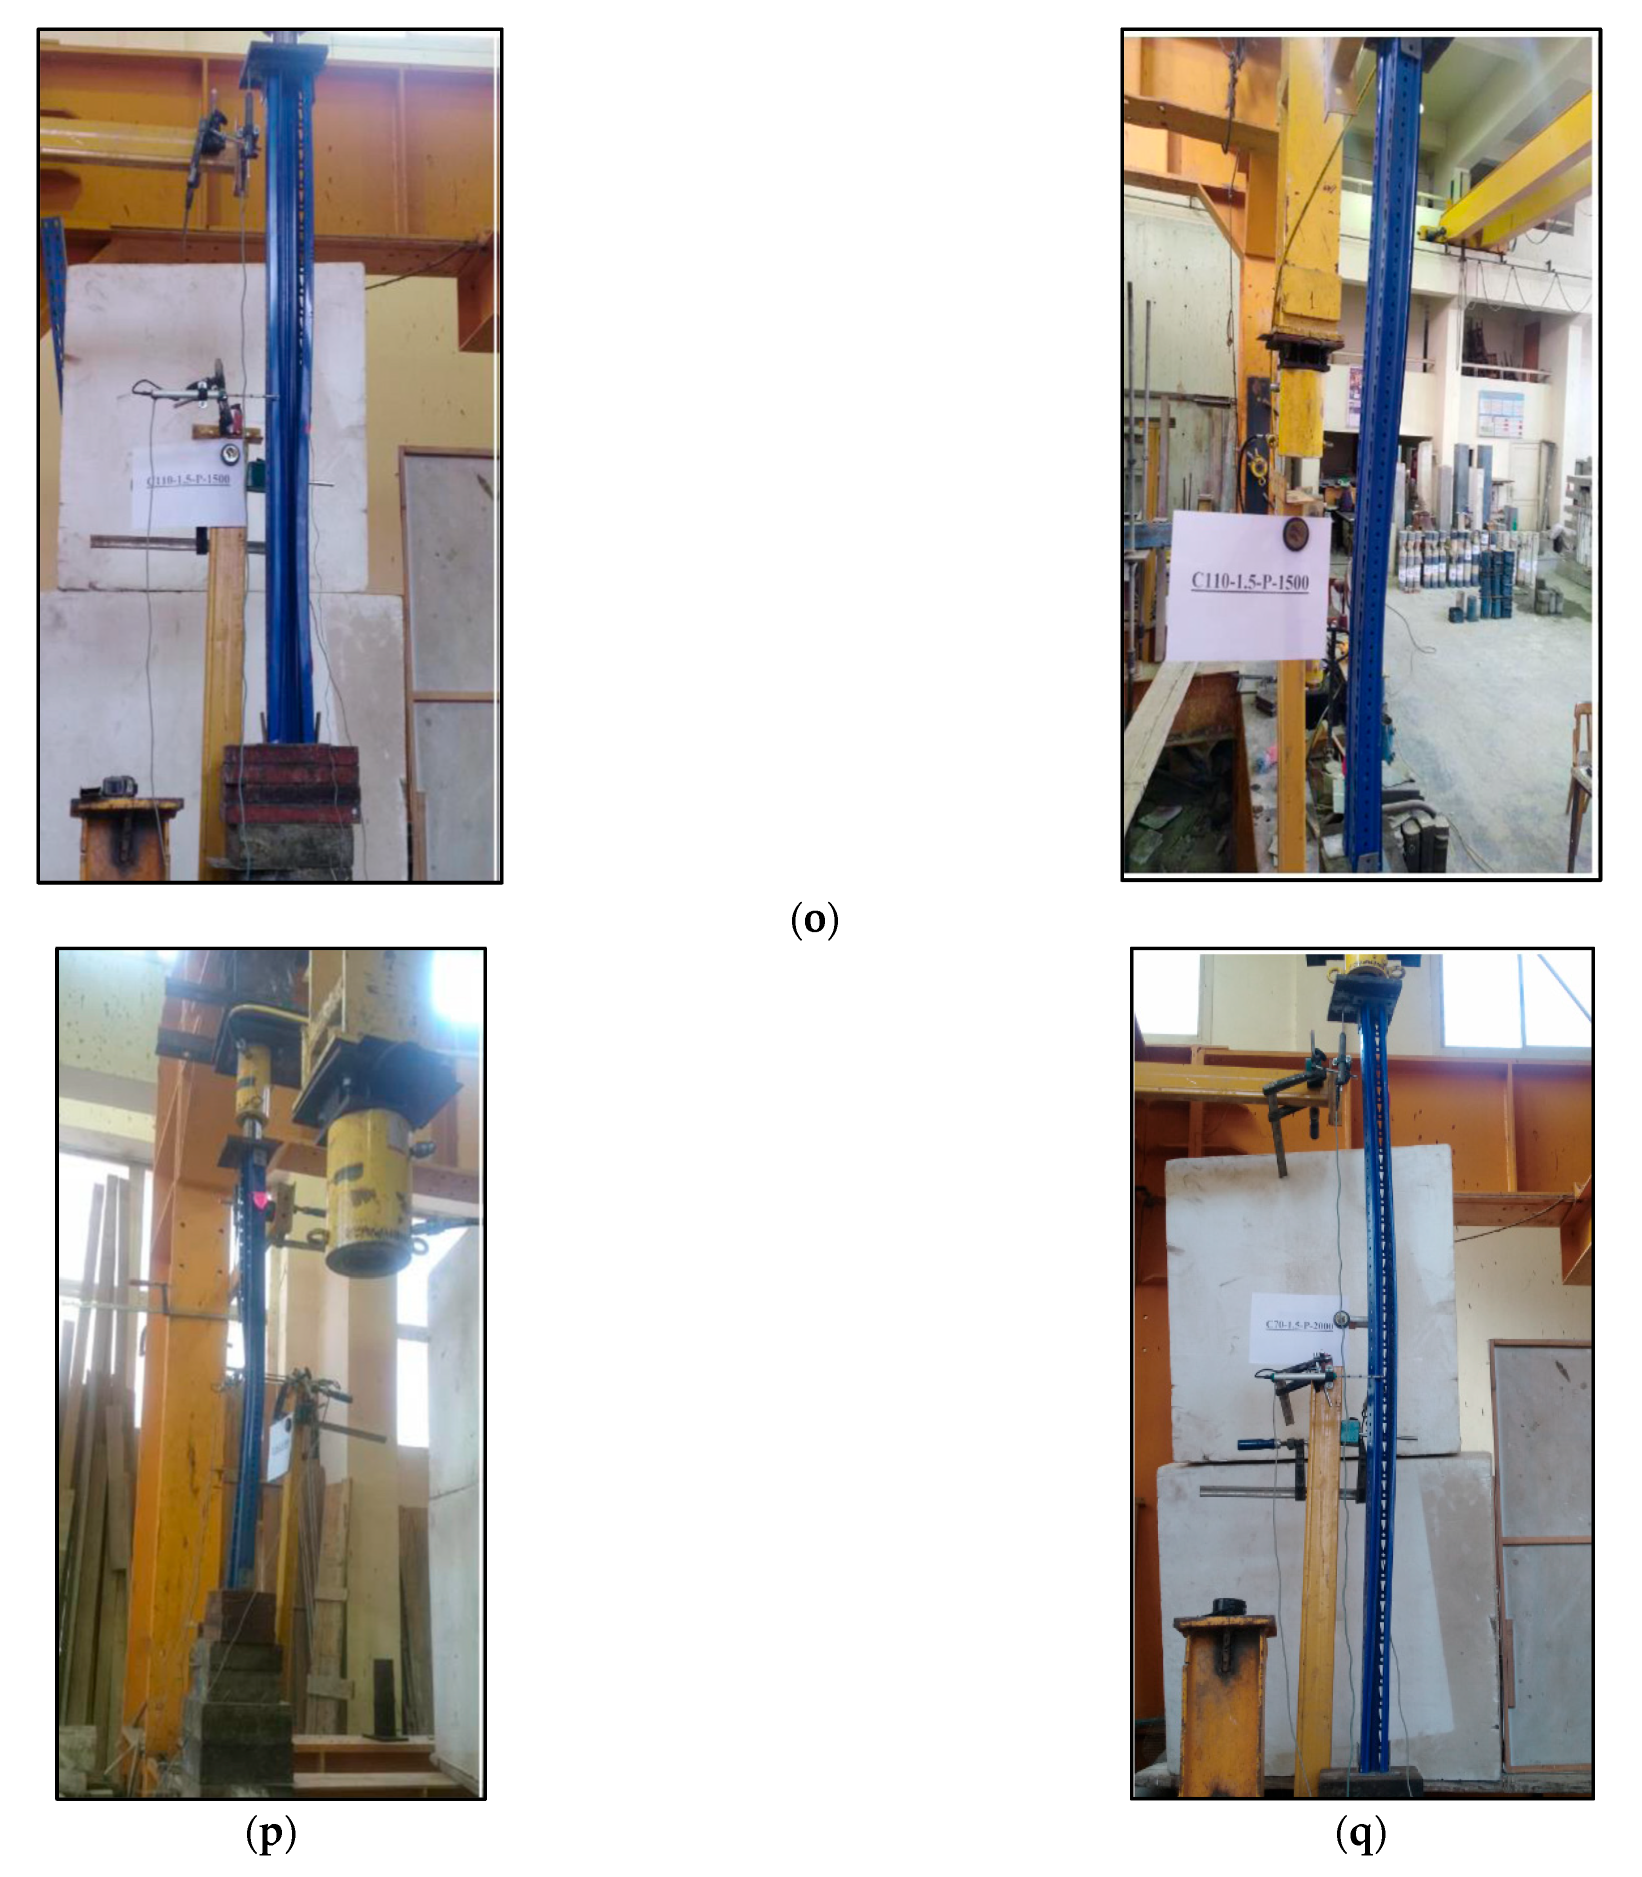
2.3. Test Setup and Instrumentations

The frame consisted of a horizontal I-beam connected with a bolted rigid connection to two vertical columns. The frame rested on the floor. The load was applied using a load cell with a capacity of 250 kN and a pressure of 1000 bar, and with an accuracy of 10 kg. A hydraulic jack and a vertical reaction frame system were used to apply an axial load. Three linear variation displacement transducers (LVDT) of length 100 mm and with an accuracy of 1/1000 mm were used to measure the longitudinal shortening displacement and the lateral displacements at mid-length. The columns were vertically positioned, and the upper and lower ends were hinged at a strong frame. After all the specimens and equipment were in place, 10% of the ultimate load was initially applied to the specimen for centering. The first instrument was the load cell used as an indicator of the applied load. It was placed between the top end of the specimen and the bottom end of the hydraulic jack of the testing machine. Next, manual control was applied on the load at a constant slow speed. The loading rate for each step was 5 kN, lasting for 0.5–1 min. Then, the data were collected.
The three (LVDTs) were placed at three different locations on the steel specimen, to measure the longitudinal shortening displacement and the lateral displacements of the upright specimen at various load levels, up to failure. LVDT 1 was used to monitor the longitudinal shortening displacement (∆Z) of the upright. LVDT 2 and LVDT 3 were used to monitor the lateral in-plane and out-of-plane displacements (∆X, ∆Y) at mid-length of the upright, where one was placed at the flange and the other at the web, as shown in Figure 3. A data acquisition system controlled all test data. All experimental tests were carried out at the laboratory of the faculty of engineering at Mattaria-Helwan University. The experimental setup and instrumentations are illustrated in Figure 3.

3. Test Results and Analysis

The axial compression test was conducted experimentally on seventeen perforated specimens with five different cross-section dimensions and lengths, as detailed in Table 2. The results of the ultimate failure load and different deformations of the tested specimens were analyzed as follows:

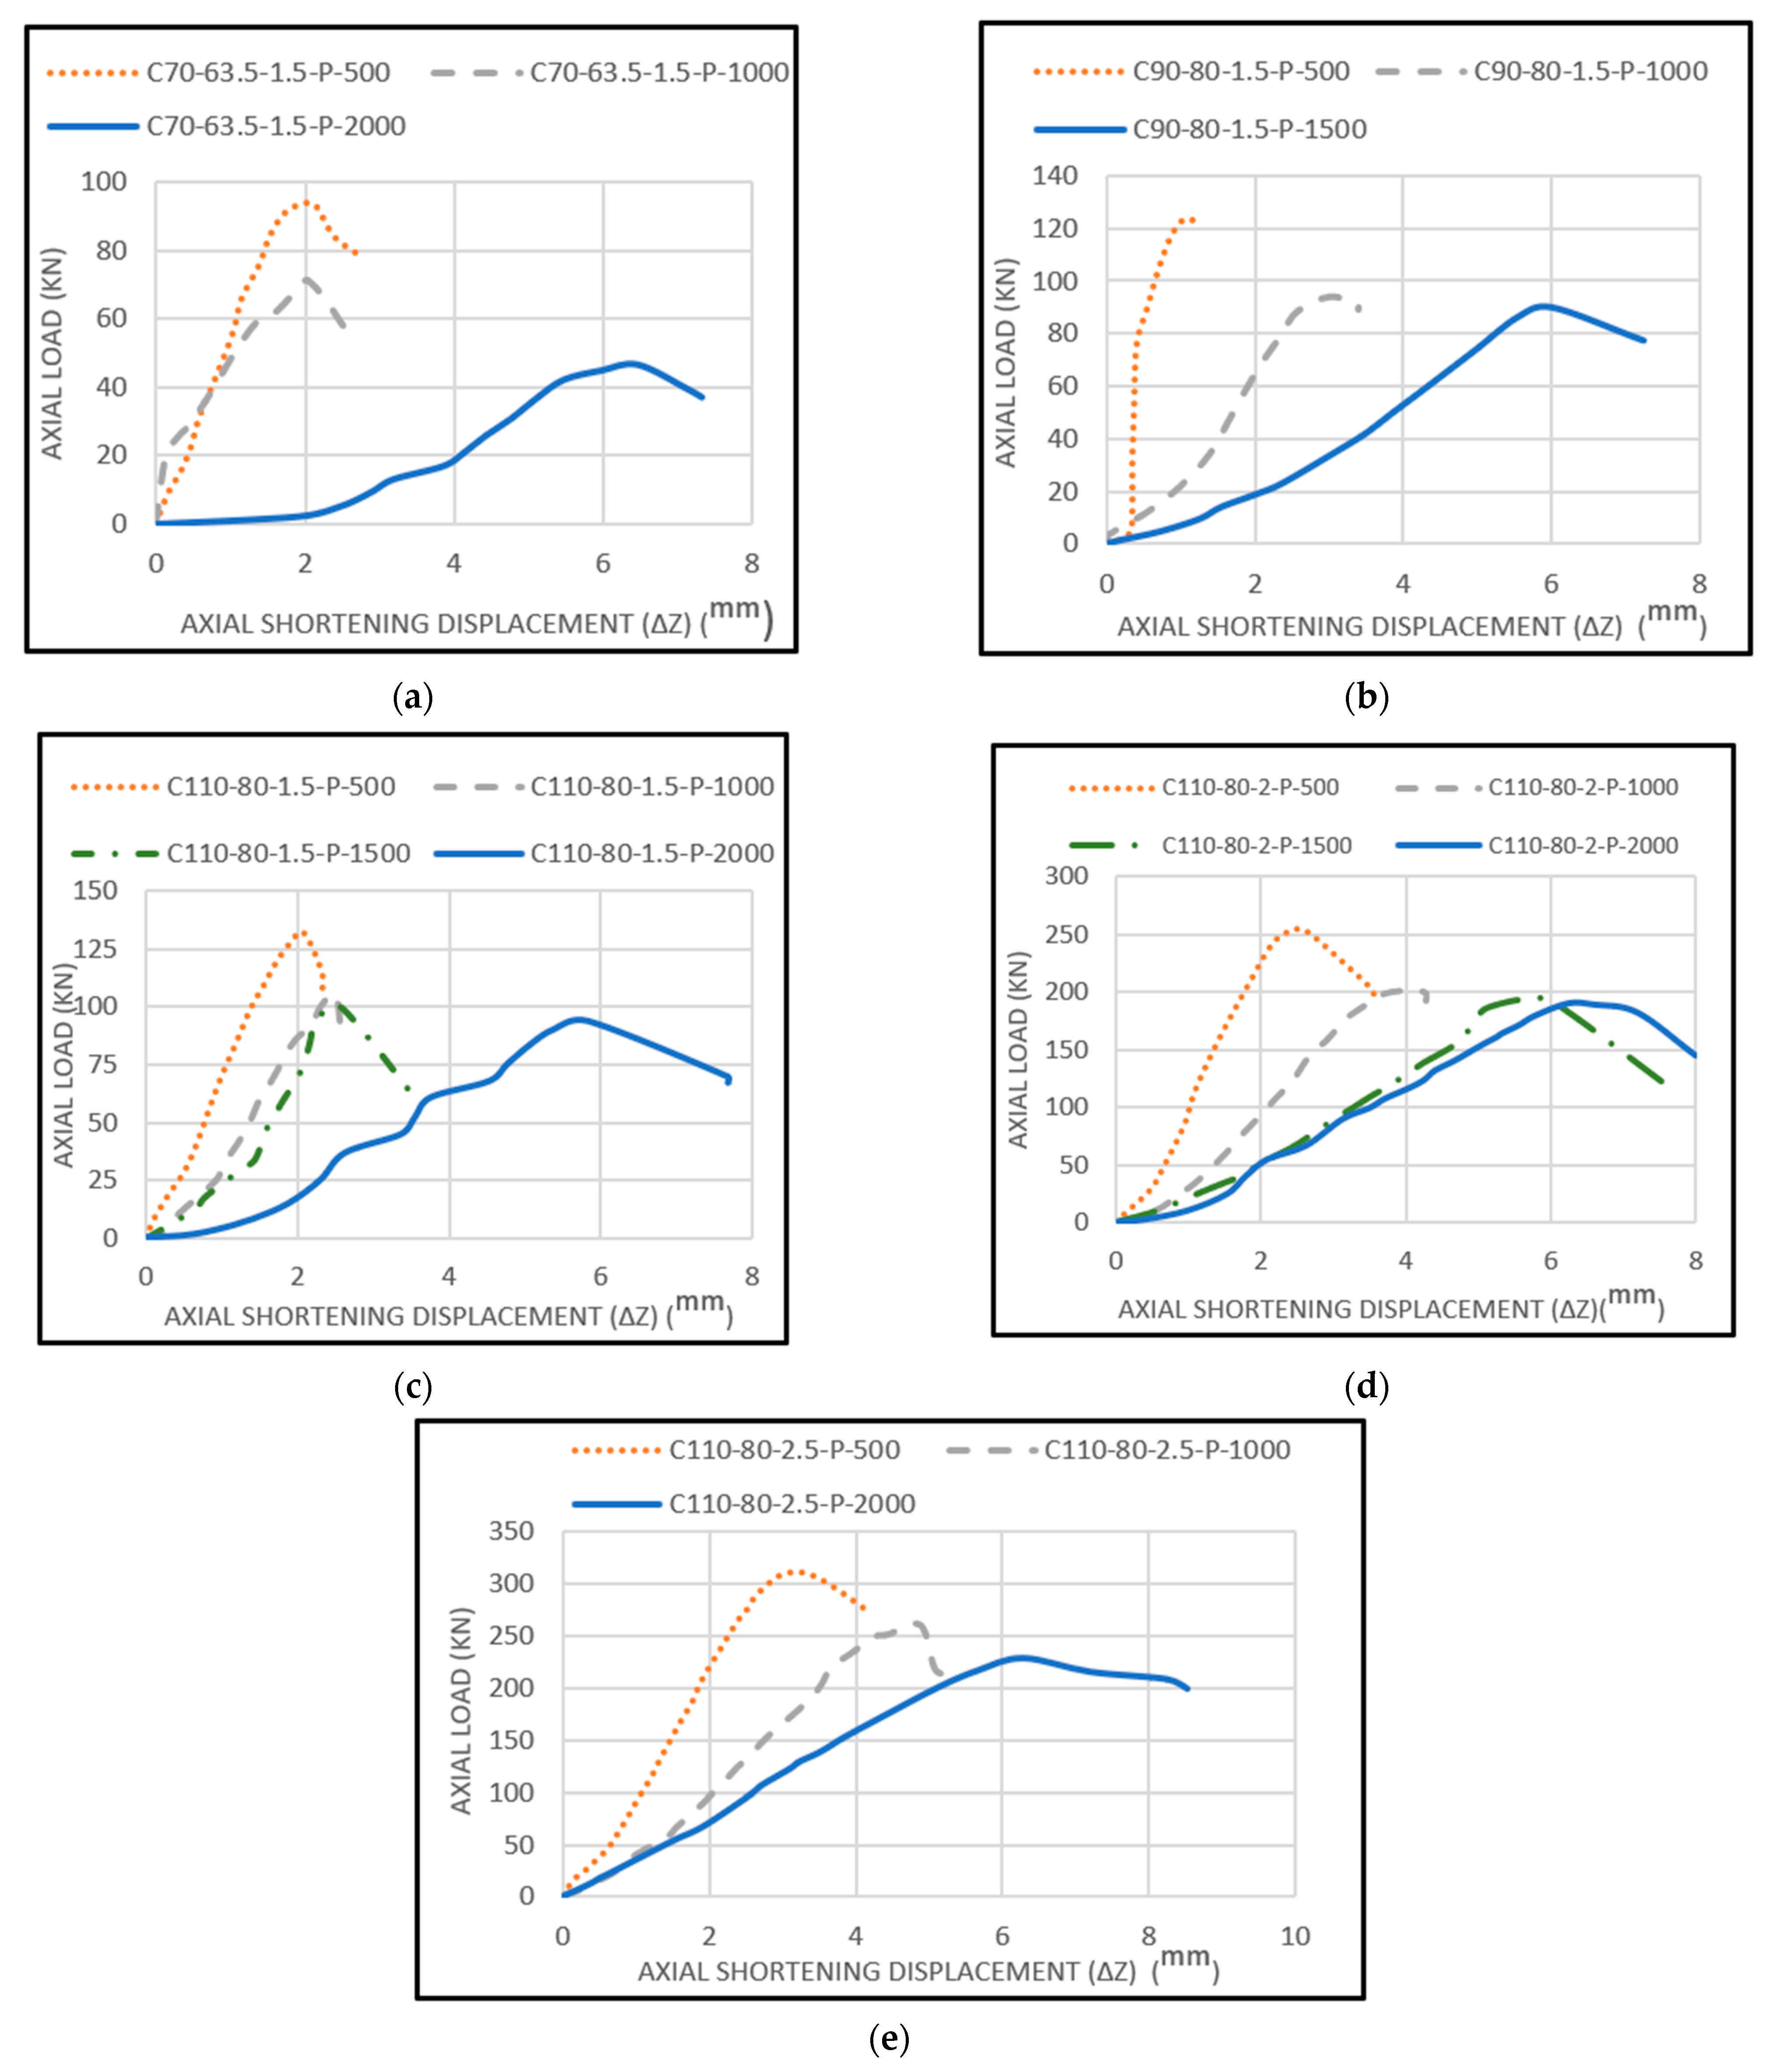
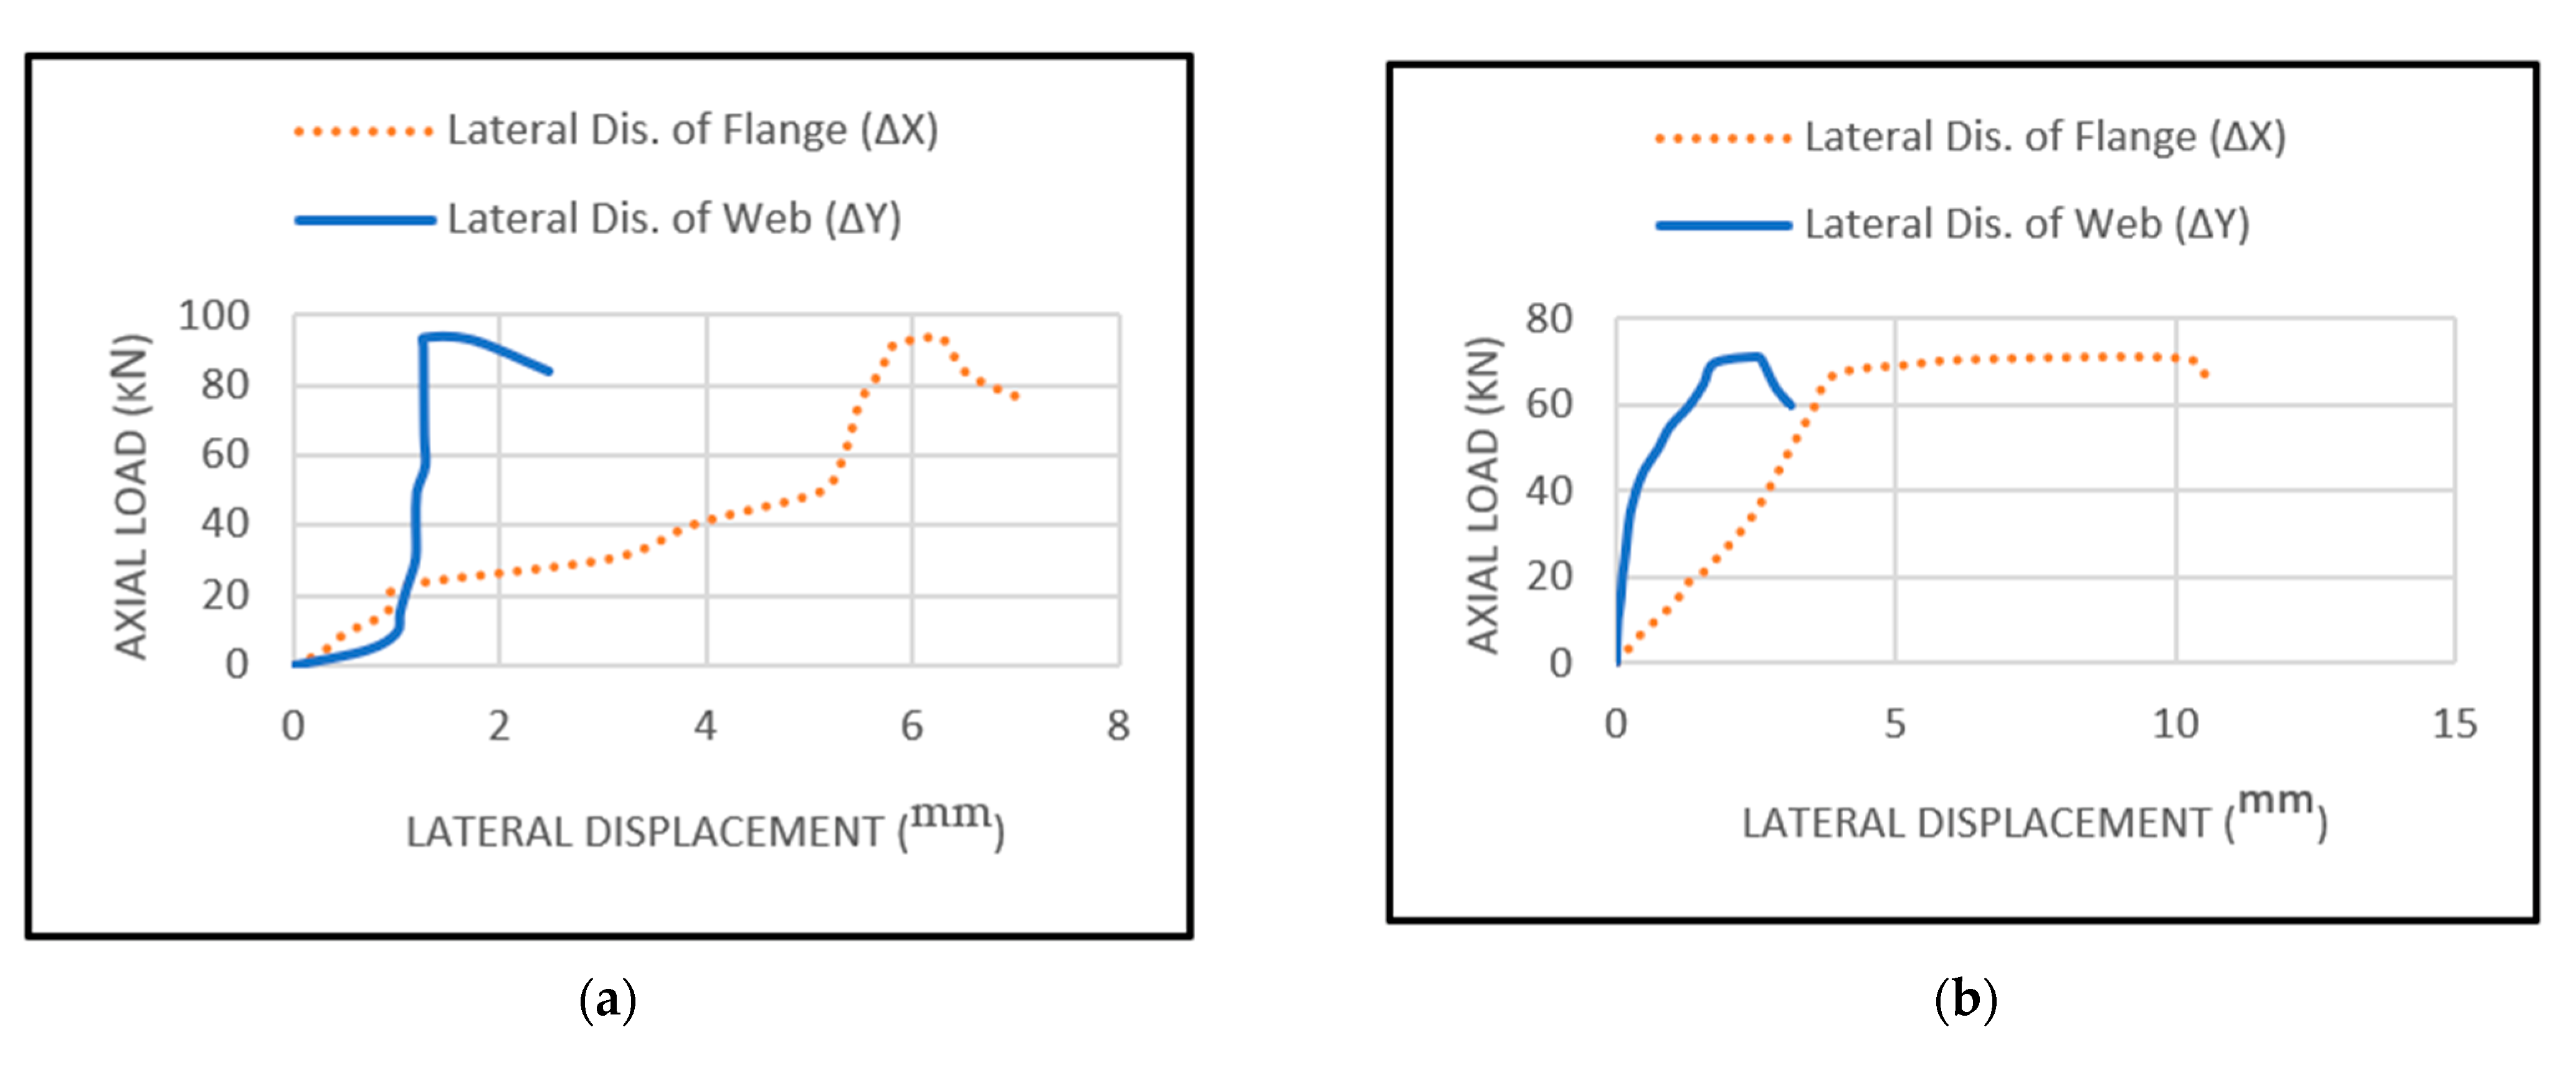
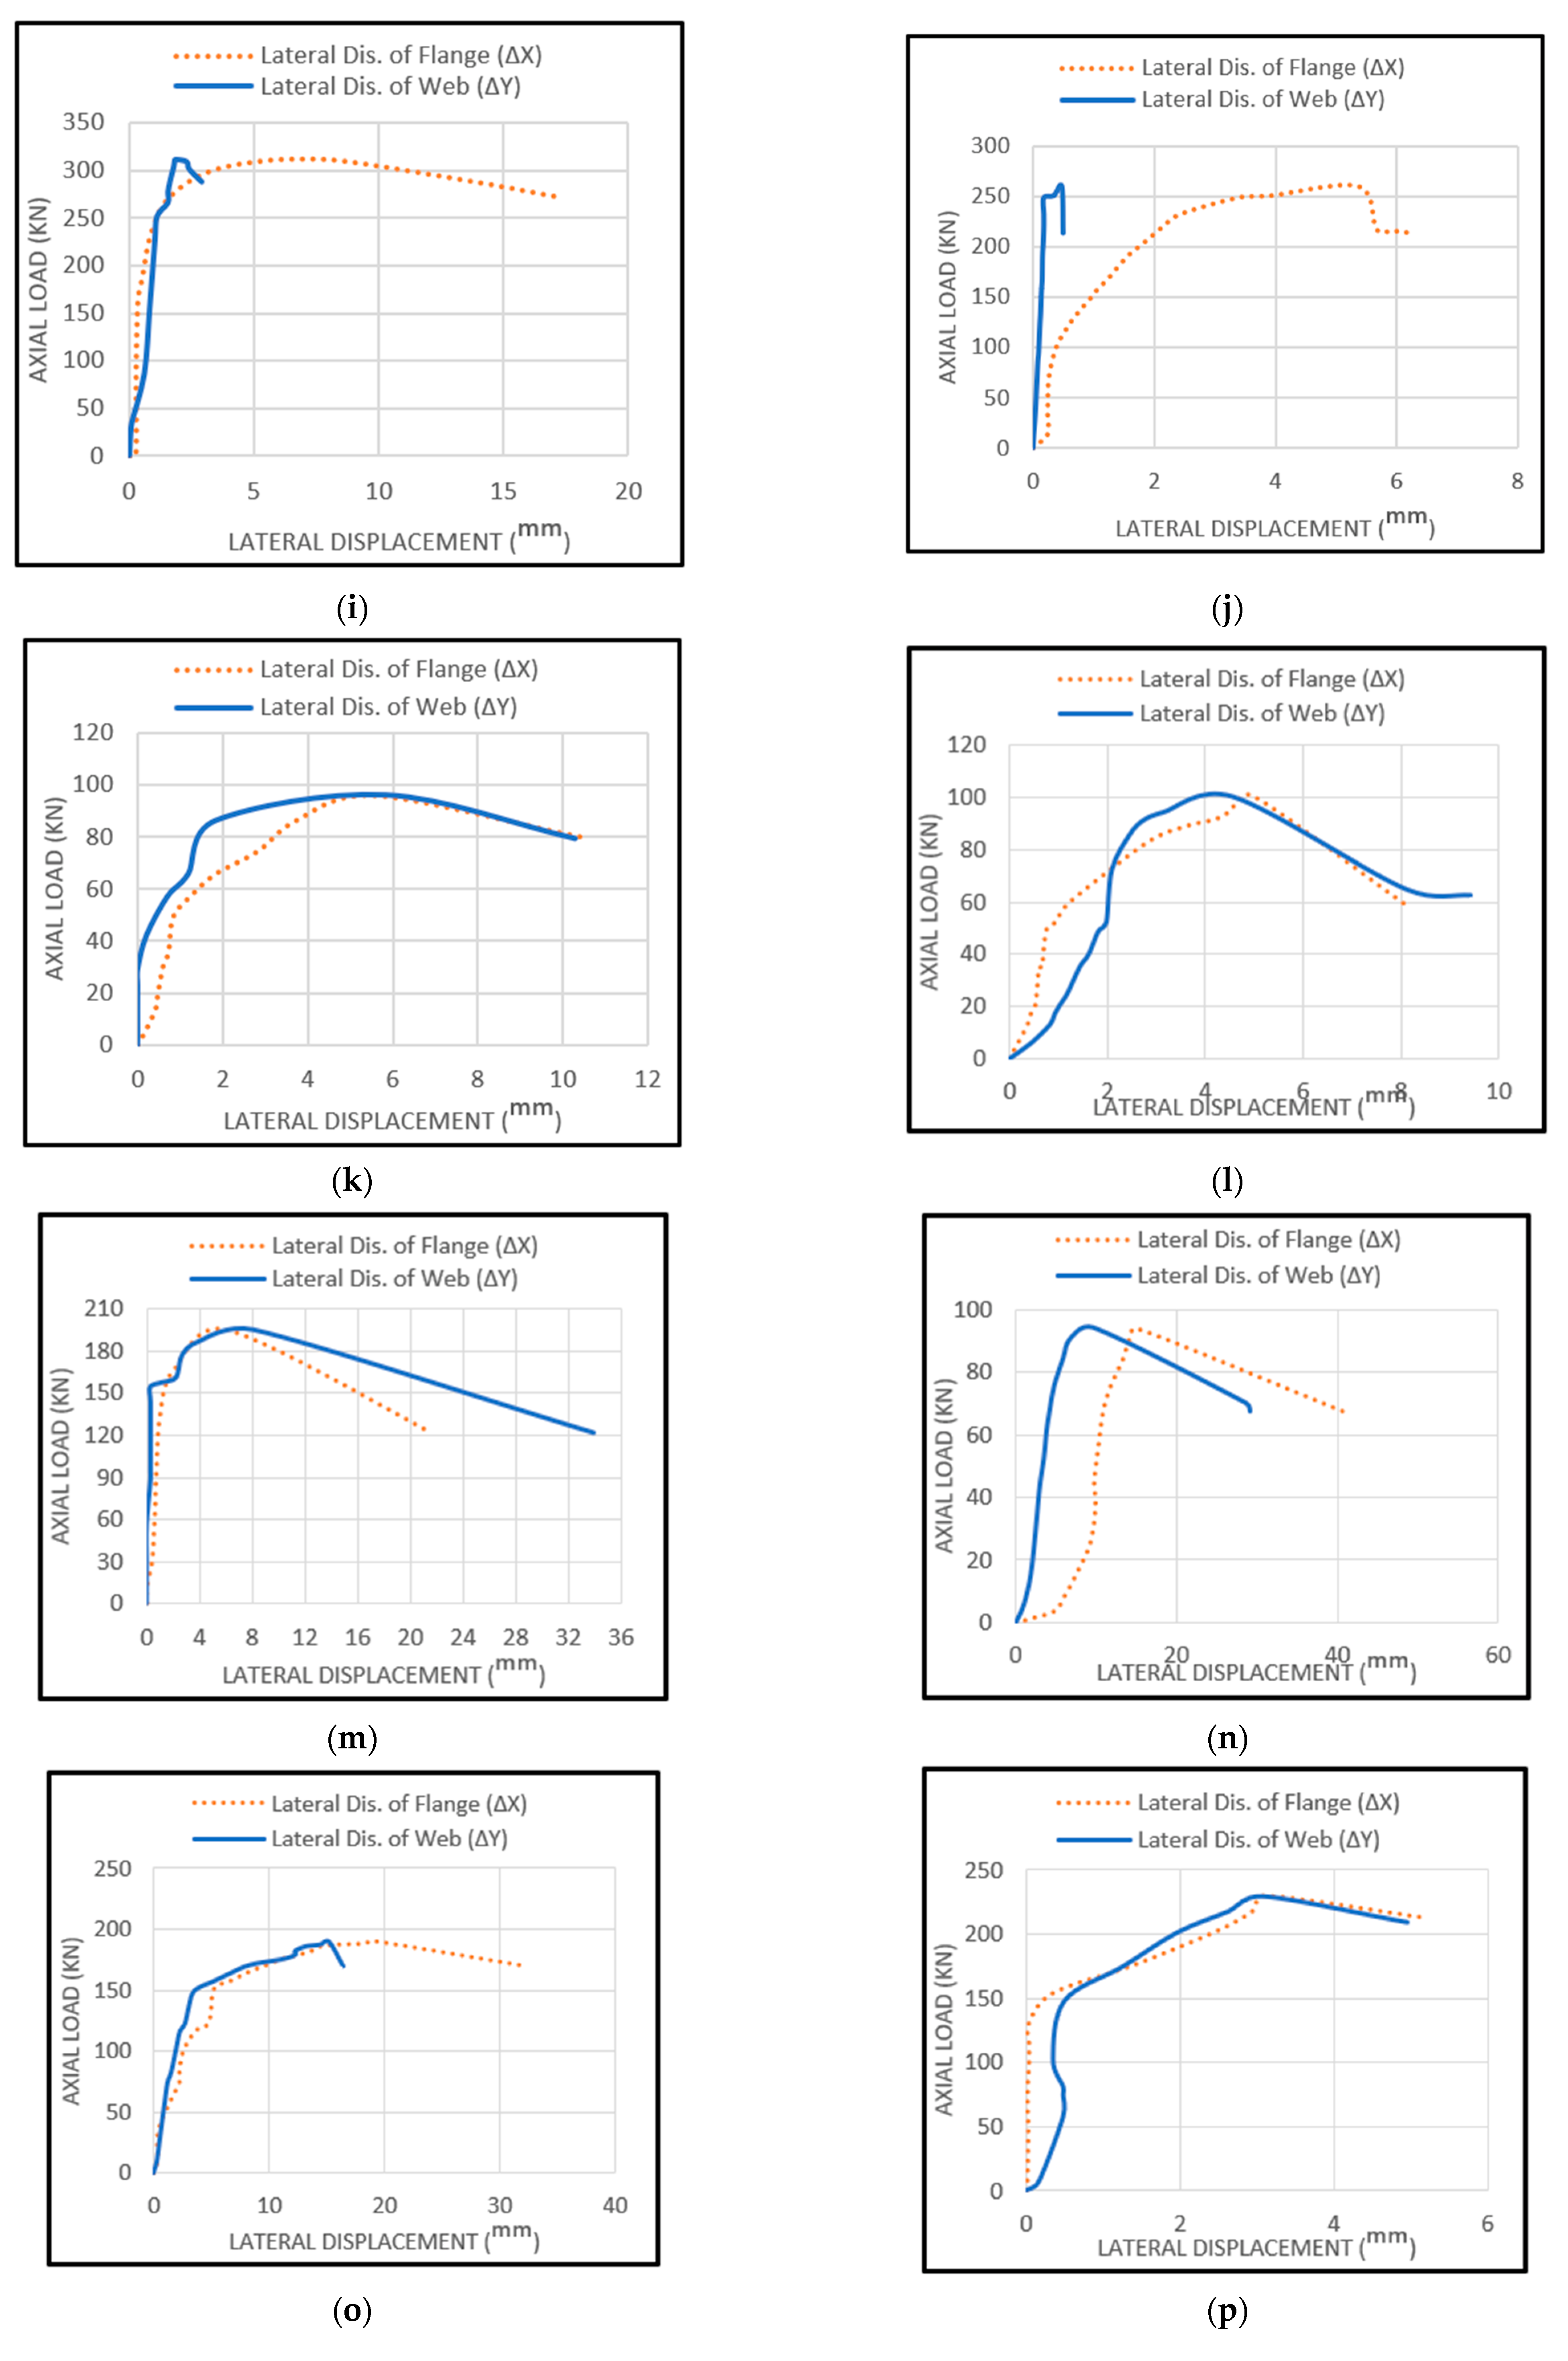
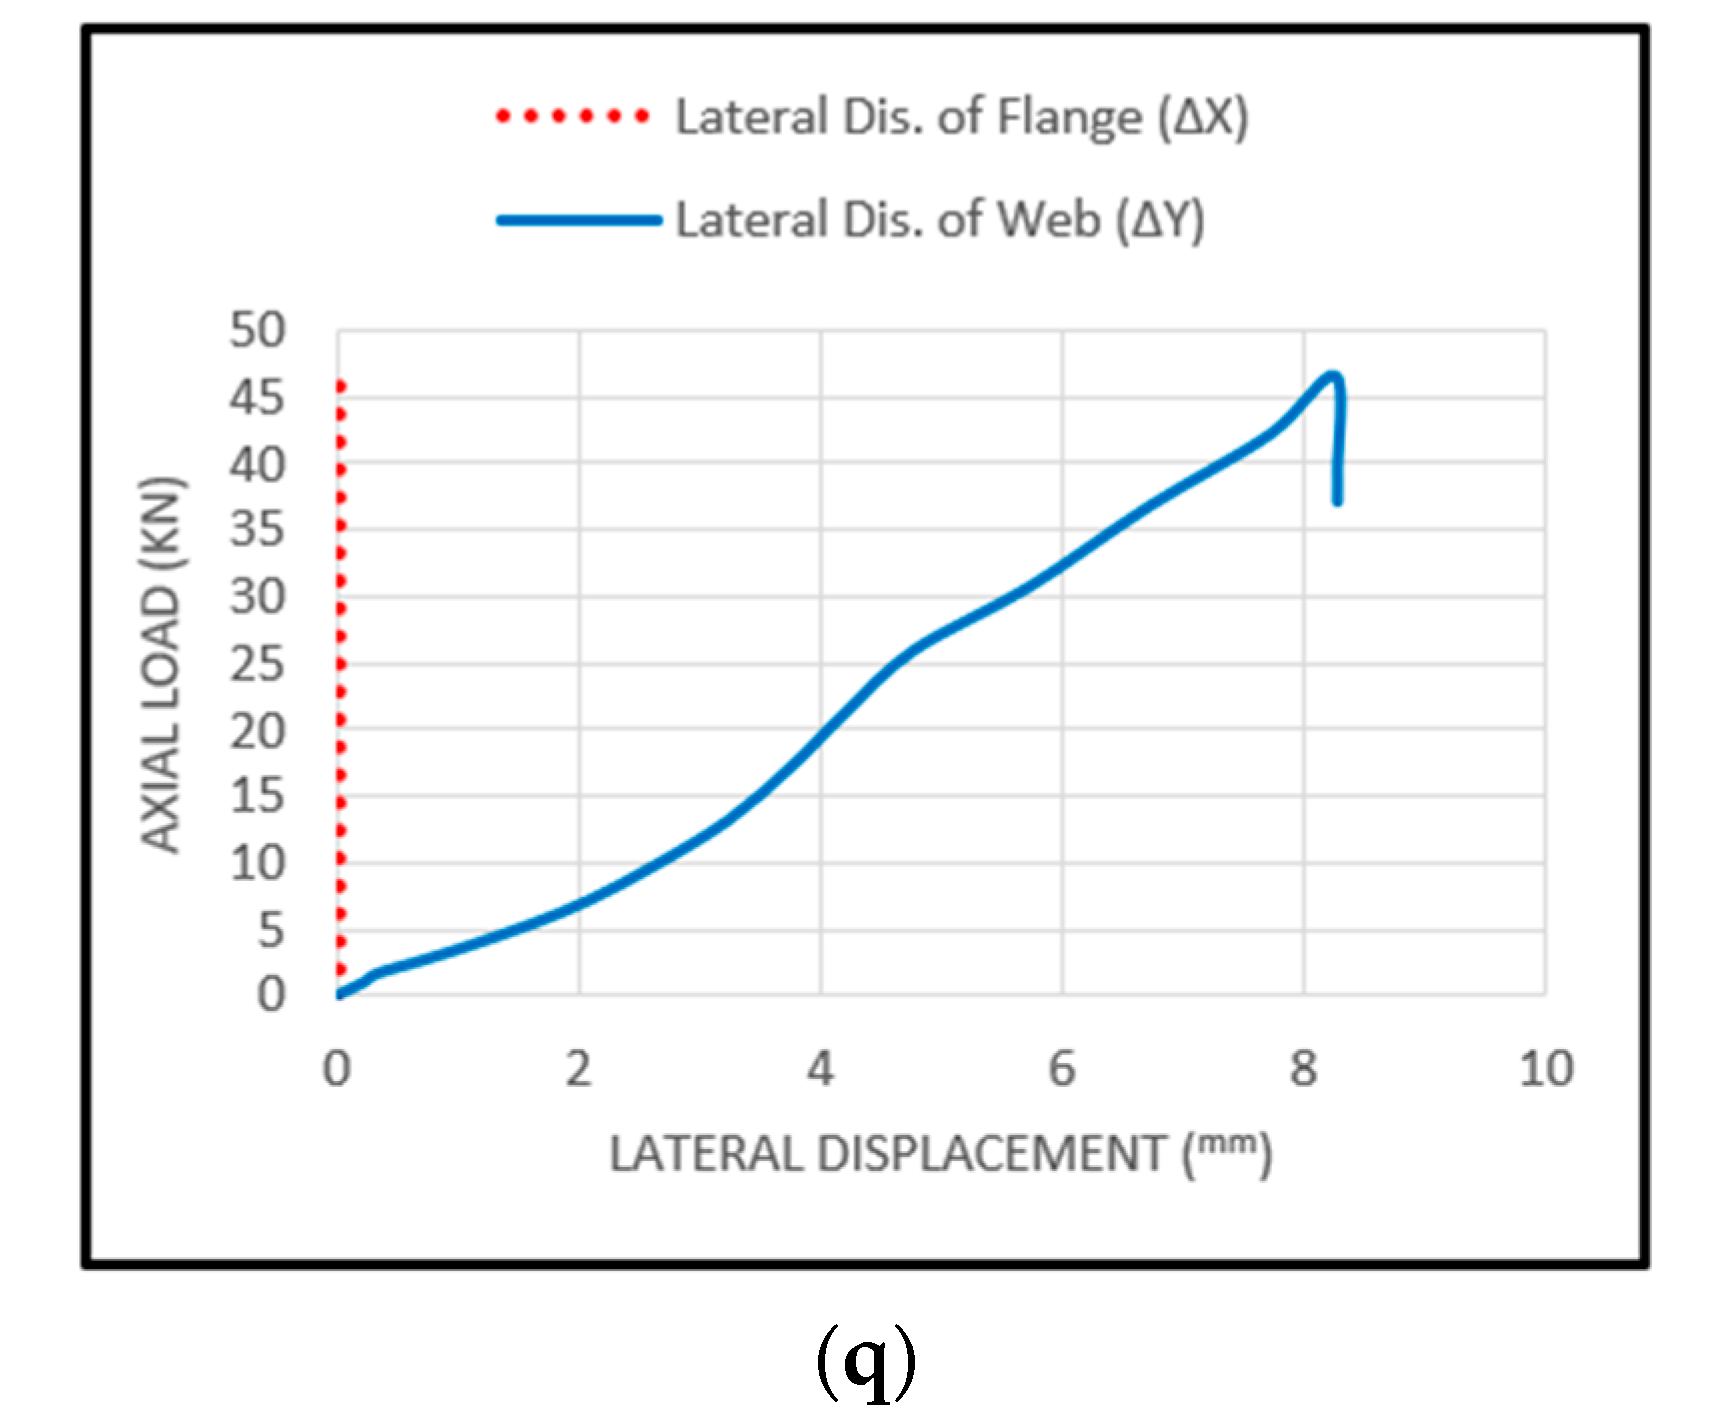
3.1. Load-Displacement Curves

The typical load-axial shortening–displacement (∆Z) curves of different specimens with different cross-section dimensions and lengths were determined, to study the influence of specimen length on the value of ultimate failure load, as shown in Figure 4. The relation (P-∆Z) was compared for the different specimens with the same cross-section but with varying slenderness ratios (λmax), according to the variation in lengths. It is obvious that, according to the logical concept, the value of the ultimate failure load decreased, while the shortening displacement (∆Z) increased according to the increase in the slenderness ratio.
Figure 4 shows that the shortening–displacement (∆Z) for all specimens with lengths 2000 mm had a larger value than that for specimens with lengths 500 and 1000 mm, due to global buckling, because the value of the slender ratio increased with the increase in column length.

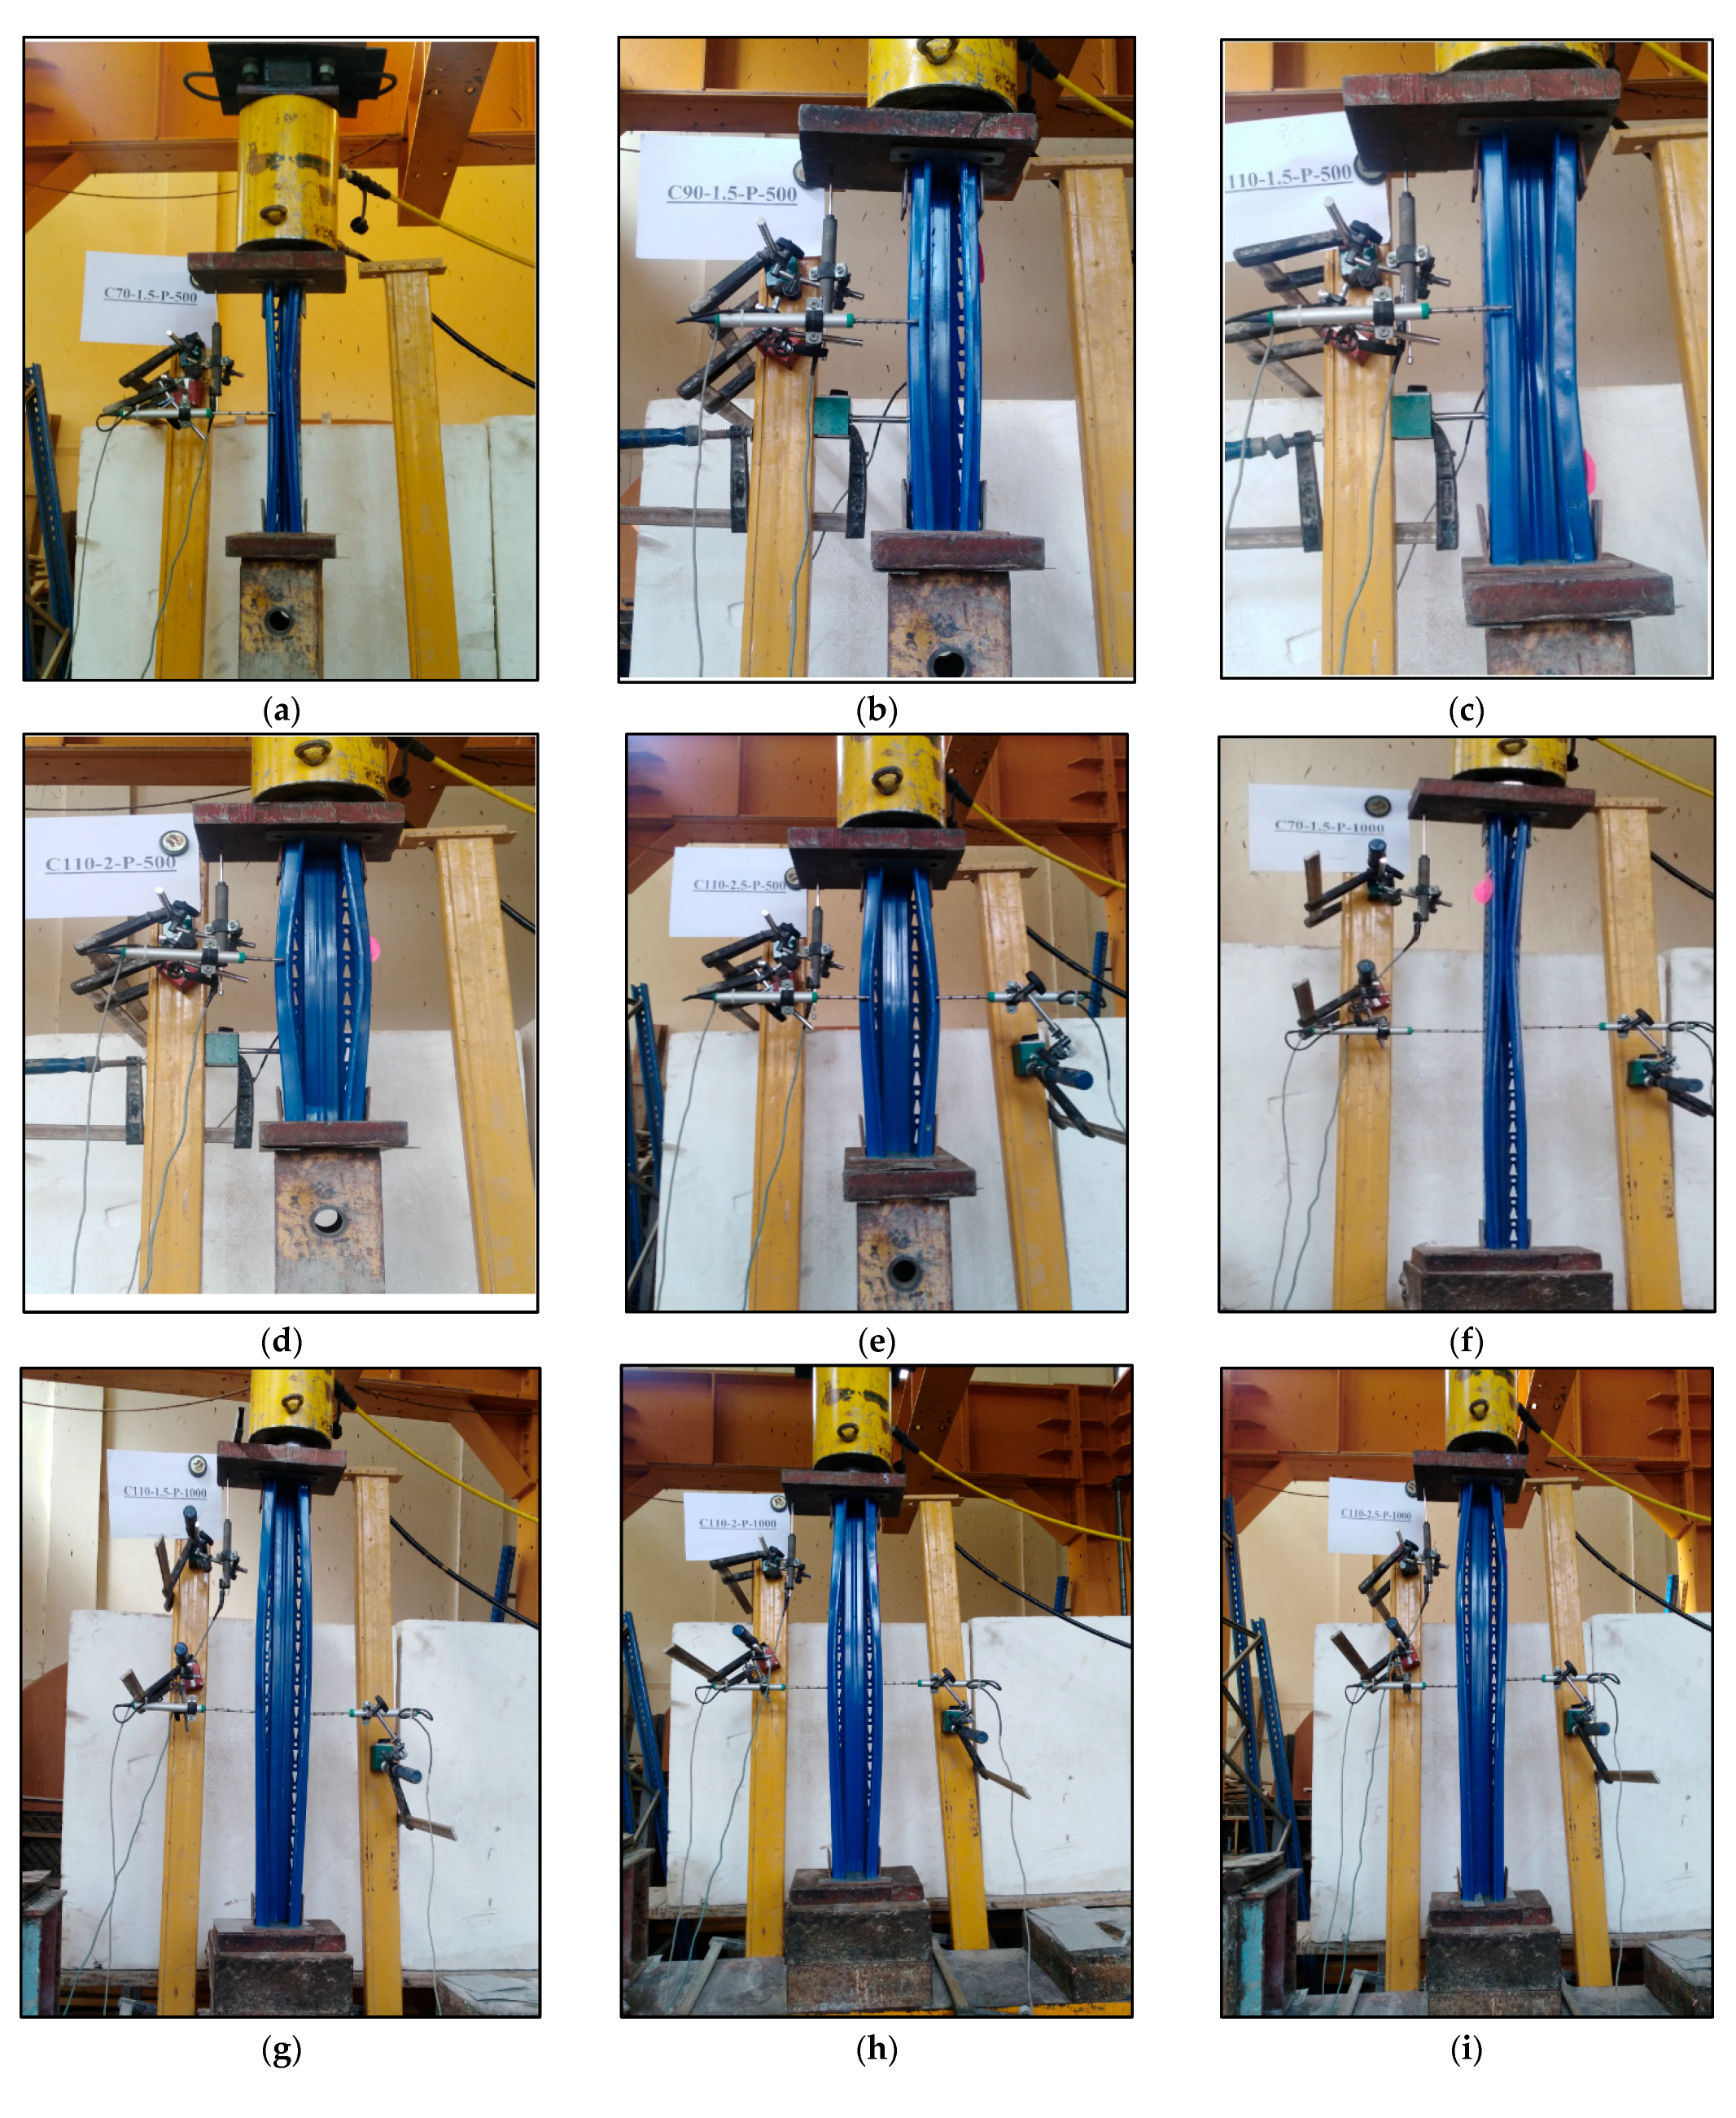
3.2. Buckling Failure Modes

There are different types of failure modes that can affect this behavior, such as global buckling (GB), distortional buckling (DB), or the interaction between distortional buckling and global buckling (DB + GB), depending on the critical slenderness ratio and compactness case.
The type of buckling failure mode can be determined from the relation between the recorded values of the compression load and the corresponding lateral displacements (∆X) and (∆Y) from LVDT 2 and LVDT 3 at the mid-length of each upright for different specimens, as shown in Figure 5. The flange displacements and very small movement at the web imply that distortional buckling (DB) is the main failure mode for the short specimens with lengths equal to 500 and 1000 mm, as shown in Figure 5a–j. This failure mode is evident from the pictures of these specimens during the collapse in the laboratory, as shown in Figure 6a–j. Table 3 shows that the distortional buckling (DB) is the mode of failure for specimens that have a maximum slenderness ratio (λmax < 45).
In addition, the flange displacements, along with the web displacement, imply that the distortional–global buckling interaction (DB + GB) is the main failure mode for specimens that have a length equal to 1500 and 2000 mm, with a section thickness equal to 1.5 mm, such as C90-80-1.5-P-1500 and C110-80-1.5-P-2000; where, a high value of maximum slenderness ratio (45 < λmax < 75) with a low ratio of compactness was found for flanges and webs, as shown in Table 3. Therefore, in this type of specimen, the buckling failure mode is dominated by the interaction of distortionary–global torsional (DB + GB) buckling failure modes, as shown in Figure 5k–p. This is evident from the pictures of these specimens during the collapse in the laboratory, as shown in Figure 6k–p. It can be observed that the lateral deformations occur in webs and flanges with approximately equal values, and the difference between their values is according to the relation between the thickness of the specimen and the value of its maximum slenderness ratio. The increase in the thickness of the cross-section decreases the effect of distortion, as shown in Figure 5m,o,p, where specimens C110-80-2-P-2000 and C110-80-2.5-P-2000 have almost the same displacements of webs and flanges for each specimen. As such, this type of specimen is mostly governed by the effect of global buckling (GB) rather than distortional buckling (DB), and the cross-section shape remains non-deformable when buckling occurs. Therefore, the effect of distortion is small. Thus, the collapse of specimen C70-63.5-1.5-P-2000 occurred due to the effect of global-buckling (GB) alone, as shown in Figure 6q, because according to the classification of ECP [18], this section is non-compact, and the maximum slenderness ratio is high (λmax ≥ 89.5). Figure 5q shows that the lateral deformations for the web and flanges of this specimen are almost equal.

3.3. The Normalized Ultimate Compression Strength Ratio

The normalized ultimate compression strength ratio is the ratio between the maximum value of axial failure load, which was determined from the experimental test (Pu,exp.), and the axial yield load (Py) for each specimen, as shown in Table 3. Therefore, it can be used as a good reference to determine the efficiency of benefit from upright members, according to the appropriateness of the cross-section’s dimensions to the value of the slenderness ratio. Therefore, the higher the normalized ultimate compression strength ratio, the better the cross-section dimensions to the value of the slenderness ratio, and vice versa.
Table 3 shows that the values of the normalized ultimate compression strength ratio (Pu,exp./Py) for all specimens, which ranged from 0.37 to 1.03, according to the value of the slenderness ratio and the compactness ratio. The standard deviation and coefficient of variation (COV) of the normalized ultimate compression strength ratio (Pu,exp./Py) for all specimens were 0.1696 and 0.0404, respectively.

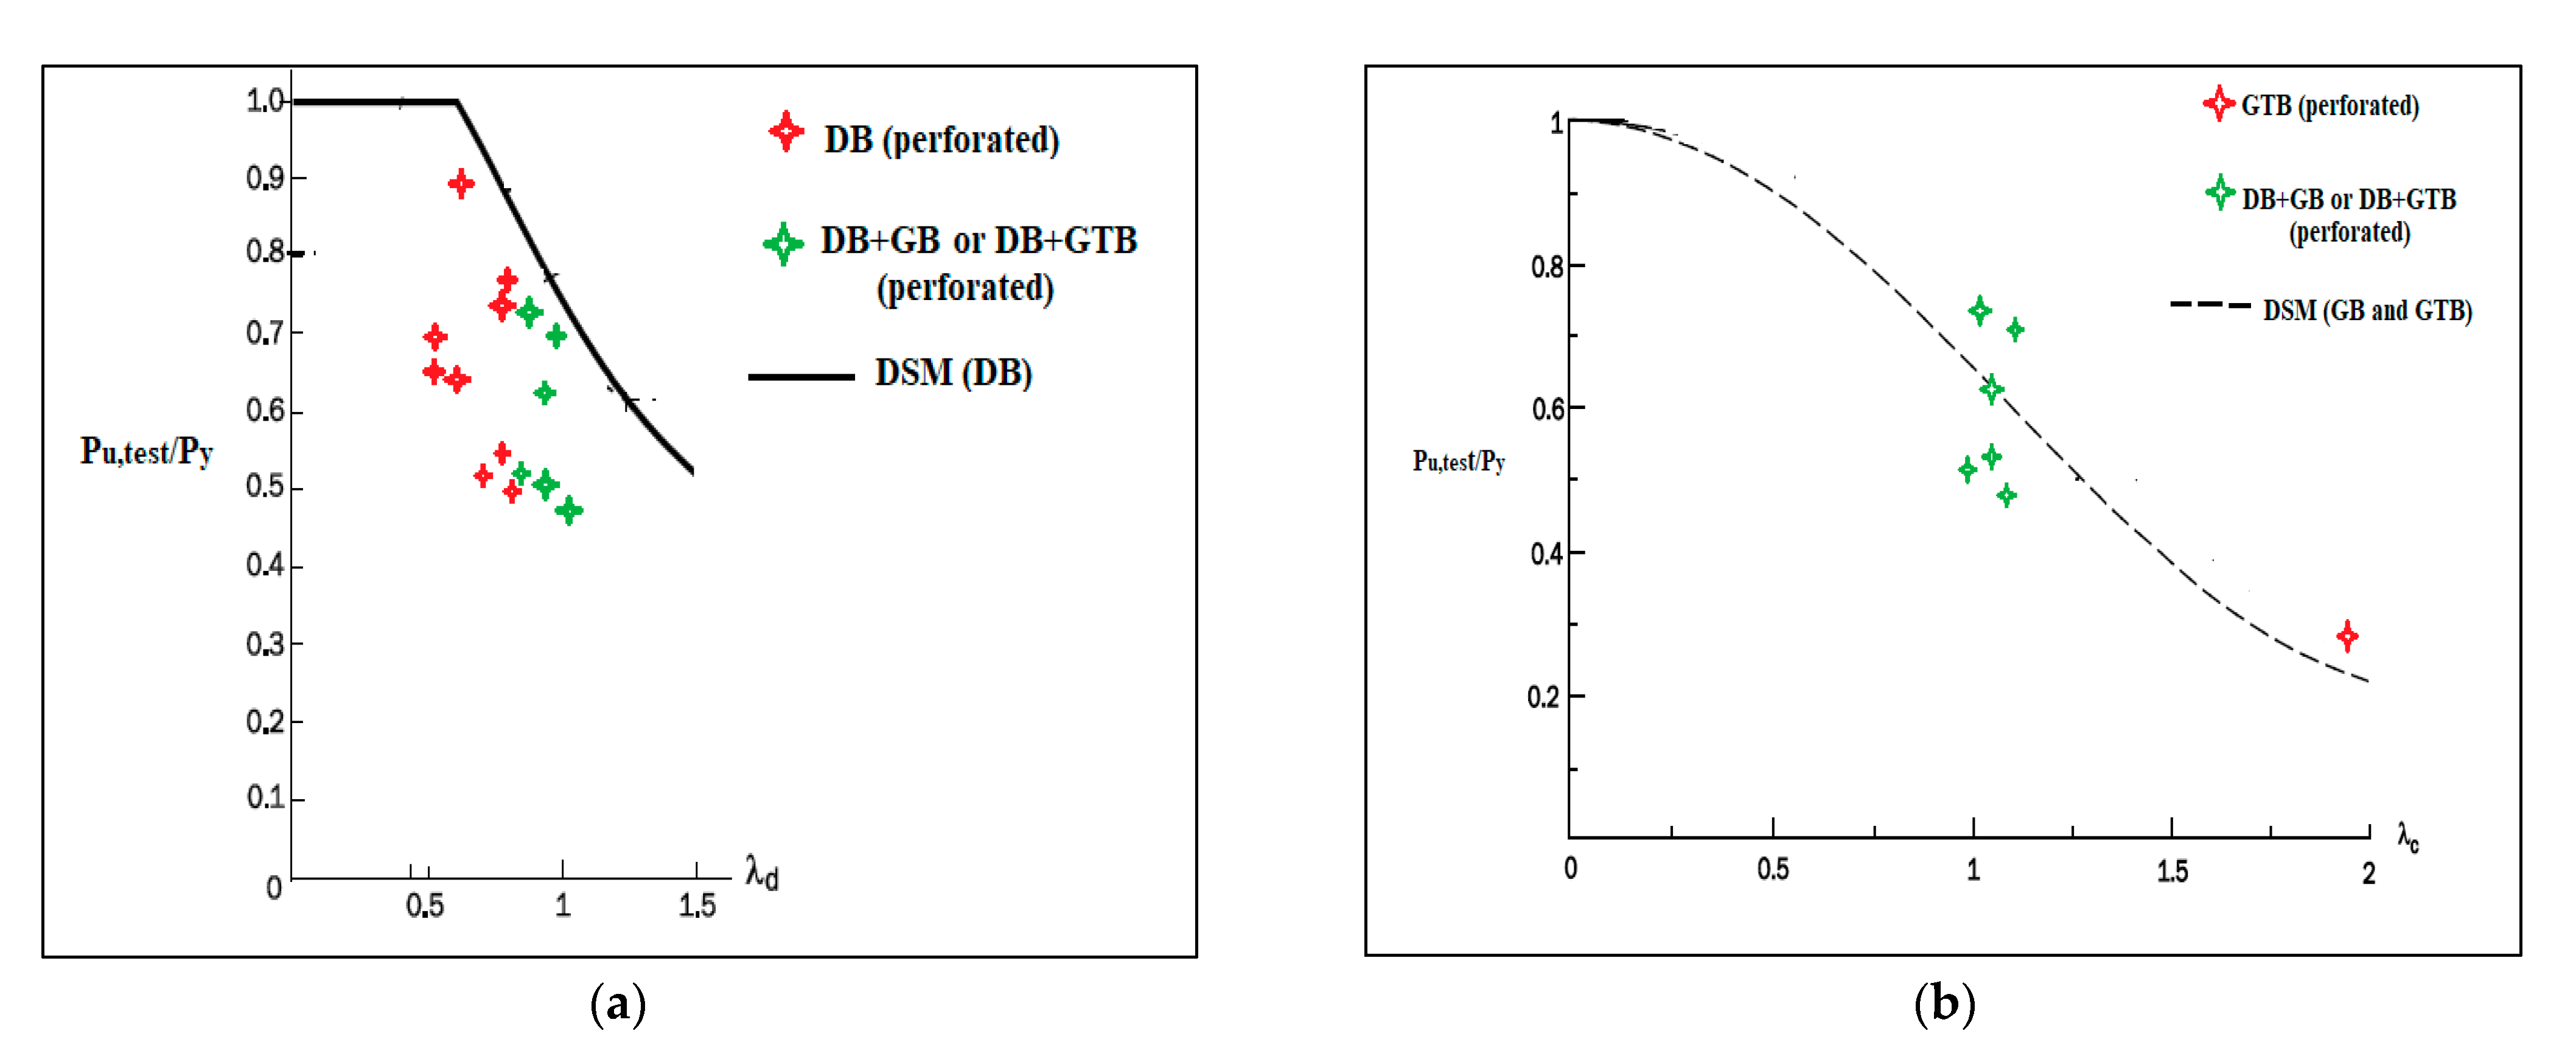
4. Comparison between Direct Strength Method and Experimental Test

The direct strength method (DSM) has become very popular due to its simplicity; it has been accepted in codes of cold-formed steel design, such as the North American specification AISI-S100 [14] and the Australian/New Zealand standard AS/NZS4600 [15]. In addition, many researchers working on thin-walled constructions use it. The DSM is now fully incorporated in the current versions of AISI-S100 as an alternative design technique for cold-formed steel structures.
The applicability of utilizing the DSM to estimate the ultimate strength of uprights failing in various buckling modes is investigated in this section. The following are the equations for the DSM method:
P DSM   is   the   nominal   axial   strength = min .   of   P ne P nd   P nl  
where P ne : is the nominal axial strength in case of global buckling failure.
P ne = 0.658 c 2   P y                       for   c 1.5 0.877 c 2 P y                               for   c > 1.5 ,   where   c =   P y P cre
P y : is the squash load of a cross-section [ P y =   Af y ]
P nd : is the nominal axial strength in case of distortional buckling failure.
P nd =   P y                                                   for   d 0.561 1 0.25 P crd P y 0.6 P crd P y 0.6 P y   for   d > 0.561 where   d =   P y P crd
P nl : is the nominal axial strength in case of local buckling failure.
P nl =   P ne                                                         for   l 0.776 1 0.15 P crl P ne 0.4 P crl P ne 0.4 P ne         for   l > 0.776 where   l = P ne   P crl
c , d , and l are the slenderness factors for overall, distortional, and local buckling, respectively.
[Pcr,e], [Pcr,d], and [Pcr,l] are the critical elastic load due to the overall global, distortional, and local buckling, respectively.
The DSM was used to estimate the values of the ultimate axial strength and the type of failure mode of the stiffened perforated cold-formed steel uprights with different geometries. The results were compared with those determined from the experimental tests, as shown in Table 4.
Table 4 shows that the failure mode predicted by the DSM was only the local buckling for all specimens. While, according to the experimental tests, the mode of failure may be global buckling, distortional buckling, or an interaction between distortional and global buckling; depending on the geometrical form, the specimen cross-section dimensions, and the value of the slenderness ratio. This means the DSM cannot provide interactive failure mode prediction. Furthermore, the perforated steel storage rack uprights subjected to axial compression evaluated in this paper have complex cross-sections that are not specified in the direct strength method (DSM) provided in the North American Specification (AISI S100) [13].
Figure 7a,b show a comparison between the experimental test results and DSM for distortional and global strength, respectively. It can be seen that the distortional buckling curve of the DSM is generally overestimated by the predictions of distortional and distortion–global buckling failure obtained from the experimental tests. Furthermore, for distortional–global buckling interaction failures, the experimental test predictions show that some specimens are below and some are above the DSM’s global buckling strength curve.
The current DSM distortional buckling strength curve and global buckling strength curve do not offer a reliable design for stiffened perforated steel storage rack uprights subjected to axial compression, because the presence of perforations significantly affects the behavior and failure buckling mode, as shown in Table 4. The ultimate strength obtained from tests and that predicated on DSM may be incompatible, as shown in Table 4. Xianzhong Zhao etc. al. [2] developed a modified DSM distortional buckling strength curve to be used for perforated uprights, as detailed in the following equations:
P nd = P y   net                                                             for   λ d λ d 1 P y   net P y   net P d 2 λ d 2 λ d 1 λ d λ d 1           for   λ d 1 < λ d λ d 2
where   λ d 1 and λ d 2 are slenderness factors
λ d 1 = 0.561 P y   net P y  
λ d 2 = 0.561 14 P y P y   net 13
P d 2 = 1 0.25 1 λ d 2 1.2 1 λ d 2 1.2 P y
P crd is the critical elastic buckling load (first buckling mode); P d 2 is the nominal axial strength of distorsional buckling at λ d 2 ; Py, net is the net yield load = Anet * Fy, where Anet is the net cross-sectional area.
Figure 8 shows a comparison between the modified DSM distortional strength curve results and the experimental test results. It can be observed that the results of the modified DSM are more accurate than those calculated using DSM, but its results are exaggerated compared to the experimental results.

5. Conclusions

This paper has presented an experimental investigation into the behavior of stiffened perforated cold-formed steel sections subjected to axial compression. A total of seventeen experimental results were reported. First, the material properties were determined from tensile coupon tests. Next, experimental tests were carried out to observe the buckling failure modes. Next, the axial compression capacity, load-axial shortening, and load-lateral displacement relationships were discussed. Finally, the effect of the total upright lengths, the overall web height of cross-sections, and the thickness were investigated. Based on the experimental results presented in this paper, the following conclusions can be drawn:
  • Distortional buckling (D.B.) is the mode of failure for specimens that have a maximum slenderness ratio (λmax < 45)
  • The distortional–global buckling interaction (DB + GB) dominates the buckling modes of specimens that have a height equal to 1500 and 2000 mm, with section thickness equal to 1.5 mm, where a high value of a maximum slenderness ratio (45 < λmax < 75) with a low ratio of compactness.
  • The collapse of the specimen occurs due to the effect of global buckling (G.B.) alone when the maximum slenderness ratio is high (λmax ≥ 89.5), and the section is classified as a non-compact section.
  • The normalized ultimate compression strength ratio (Pu,exp./Py) for all specimens ranged from 0.37 to 1.03, according to the value of the slenderness ratio and the compactness ratio. It was smaller than unity for all specimens, unless the maximum slenderness ratio was small (λmax ≤ 18.7), and the section was classified as a non-compact section.
  • The web height has a marginal effect on the percentage increase in ultimate axial compression capacity when the web increases from 90 mm to 110 mm, compared to the increase in cross-section area for all lengths. This increase is attributed to the percentage increase in ultimate capacity, ranging from 7.1% to 12.2%, and less than the percentage increase in the cross-section area, which equals 13.6%.
  • The web-thickness ratio is the major factor influencing the ultimate axial compression capacity. When the web height is constant and the plate thickness increases, the web-thickness ratio decreases, and the ultimate axial compression capacity increases for all specimen lengths.
  • The results of this study explicitly show that the direct strength method (DSM) has been demonstrated to be unreliable for predicting the ultimate strength of uprights failing in buckling interactions for perforated uprights.
  • The failure modes of perforated specimens with stiffeners generally cannot be well predicted by the direct strength method.
  • The findings of this study reveal that the direct strength method (DSM) modification carried out by Xianzhong Zhao et al. is more accurate than DSM. Nevertheless, the results are exaggerated compared to the experimental results for many specimens, so a more precise and comprehensive numerical study with many models is needed, to develop a perfect equation that can be used to calculate the ultimate strength of perforated uprights.

6. Patents

This section is not mandatory but may be added if there are patents resulting from the work reported in this manuscript.

Author Contributions

Conceptualization, Methodology, supervision, F.M.F.S.; experimental tests, M.M.Y.; data curation, Z.M.; final supervision, A.D. All authors have read and agreed to the published version of the manuscript.

Funding

This research received no external funding.

Data Availability Statement

Not applicable.

Acknowledgments

Not applicable.

Conflicts of Interest

The authors declare no conflict of interest.

References

  1. Casafont, M.; Pastor, M.; Roure, F.; Pekoz, T. An experimental investigation of distortional buckling of steel storage rack columns. Thin-Walled Struct. 2011, 49, 933–946. [Google Scholar] [CrossRef]
  2. Zhao, X.; Ren, C.; Qin, R. An experimental investigation into perforated and non-perforated steel storage rack uprights. Thin-Walled Struct. 2017, 112, 159–172. [Google Scholar] [CrossRef]
  3. Rhodes, J.; Schneider, F. The compressional behavior of perforated elements. In Proceedings of the CCFSS International Specialty Conference on Cold-Formed Steel Structures 6, Saint Louism, MI, USA, 18 October 1994. [Google Scholar]
  4. Crisan, A.; Ungureanu, V.; Dubina, D. Behaviour of cold-formed steel perforated sections in compression. Part 1—Experimental investigations. Thin-Walled Struct. 2012, 61, 86–96. [Google Scholar] [CrossRef]
  5. EN 15512; The European Standard for Steel Static Storage Systems—Adjustable Pallet Racking Systems. European Standards: Pilsen, Czech Republic, 2020.
  6. Roure, F.; Pastor, M.; Casafont, M.; Somalo, M. Stub column tests for racking design: Experimental testing, F.E. analysis, and EC3. Thin-Walled Struct. 2011, 49, 167–184. [Google Scholar] [CrossRef]
  7. Sivakumaran, K.S. Load capacity of uniformly compressed cold-formed steel section with punched web. Can. J. Civ. Eng. 1987, 14, 550–558. [Google Scholar] [CrossRef]
  8. Moen, C.D.; Schafer, B.W. Experiments on cold-formed steel columns with holes. Thin-Walled Struct. 2008, 46, 1164–1182. [Google Scholar] [CrossRef]
  9. Banwait, A.S. Axial Load Behavior of Thin-Walled Steel Sections with Openings. Ph.D. Thesis, Department of Civil and Environmental Engineering, Mc.Master University, Hamilton, ON, Canada, 1987. [Google Scholar]
  10. Baldassino, N.; Hancock, G. Distortional buckling of cold-formed steel storage rack sections including perforations. In Proceedings of the 4th International Conference on Steel and Aluminum Structures, Espoo, Finland, 20–23 June 1999. [Google Scholar]
  11. Kwon, Y.B.; Kim, B.S.; Hancock, G.J. Compression tests of high strength cold-formed steel channels with buckling interaction. J. Constr. Steel Res. 2009, 65, 278–289. [Google Scholar] [CrossRef]
  12. Xiang, Y.; Zhou, X.; Shi, Y.; Xu, L.; Xu, Y. Experimental investigation and finite element analysis of cold-formed steel channel columns with complex edge stiffeners. Thin-Walled Struct. 2020, 152, 106–120. [Google Scholar] [CrossRef]
  13. Schafer, B.W.; Peköz, T. Computational modeling of cold-formed steel: Characterizing geometric imperfections and residual stresses. J. Constr. Res. 1998, 47, 193–210. [Google Scholar] [CrossRef]
  14. AISI-S100; North American Specification for the Design of Cold-Formed Steel Structural Members. American Iron, and Steel Institute: Washington, DC, USA, 2016.
  15. AS/NZS4600; Cold-Formed Steel Structures. Standards Australian/New Zealand: Wellington, New Zealand, 2018.
  16. Moen, C.D.; Schafer, B.W. Elastic buckling of cold-formed steel columns and beams with holes. Eng. Struct. 2009, 31, 2812–2824. [Google Scholar] [CrossRef]
  17. Yao, X.; Guo, Y.; Liu, Y.; Su, J.; Hu, Y. Analysis on distortional buckling of cold-formed thin-walled steel lipped channel steel members with web openings under axial compression. Indian Concr. J. 2020, 50, 170–177. (In Chinese) [Google Scholar]
  18. ECP 205; Egyptian Code Practice for Steel Construction and Bridges—Allowable Stress Design. Housing and Building National Research Center: Cairo, Egypt, 2001.
Figure 1. Tested specimen details. (a) Specimen shape; (b) Web perforations; (c) Flange perforations; (d) Directions; (e) Cross-section shape.
Buildings 12 00812 g001
Figure 2. Cross-section geometries and dimensions of the tested specimens. (a) Section Dimensions C70-63.5-1.5-P; (b) Section Dimensions C90-80-1.5-P; (c) Section Dimensions C110-80-1.5-P; (d) Section Dimensions C110-80-2-P; (e) Section Dimensions C110-80-2.5-P; (f) Dimensions of perforations in web and flanges.
Buildings 12 00812 g002aBuildings 12 00812 g002b
Figure 3. Test setup and instrumentations. (a) Setup of the used hinge base, where it was connected to the specimen using one bolt only; (b) Setup of a hinge at the top of the specimen; (c) Setup of a hinge at the bottom of the specimen; (d) Positions of LVDT2 and LVDT3; (e) Position of LVDT1.
Buildings 12 00812 g003aBuildings 12 00812 g003b
Figure 4. The load-axial shortening–displacement curves. (a) Section type (C70-63.5-1.5-P); (b) Section type (C90-80-1.5-P); (c) Section type (C110-80-1.5-P); (d) Section type (C110-80-2-P); (e) Section type (C110-80-2.5-P).
Buildings 12 00812 g004
Figure 5. The load–lateral displacement curves for different specimens according to the experimental test. (a) C70-63.5-1.5-P-500; (b) C70-63.5-1.5-P-1000; (c) C90-80-1.5-P-500; (d) C90-80-1.5-P-1000; (e) C110-80-1.5-P-500; (f) C110-80-1.5-P-1000; (g) C110-80-2-P-500; (h) C110-80-2-P-1000; (i) C110-80-2.5-P-500; (j) C110-80-2.5-P-1000; (k) C90-80-1.5-P-1500; (l) C110-80-1.5-P-1500; (m) C110-80-2-P-1500; (n) C110-80-1.5-P-2000; (o) C110-80-2-P-2000; (p) C110-80-2.5-P-2000; (q) C70-63-1.5-P-2000.
Buildings 12 00812 g005aBuildings 12 00812 g005bBuildings 12 00812 g005cBuildings 12 00812 g005d
Figure 6. Pictures of the different specimens at collapse, during the experimental test. (a) C70-63.5-1.5-P-500 (DB); (b) C90-80-1.5-P-500 (DB); (c) C110-80-1.5-P-500 (DB); (d) C110-80-2-P-500 (DB); (e) C110-80-2.5-P-500 (DB); (f) C70-63.5-1.5-P-1000 (DB); (g) C110-80-1.5-P-1000 (DB); (h) C110-80-2-P-1000 (DB); (i) C110-80-2.5-P-1000 (DB); (j) C90-80-1.5-P-1000 (DB); (k) C110-80-2-P-2000 (DB+GTB); (l) C110-80-2.5-P-2000 (DB+GTB); (m) C110-80-1.5-P-2000 (DB + GB); (n) C90-80-1.5-P-1500 (DB + GB); (o) C110-80-1.5-P-1500 (DB + GB); (p) C110-80-2.5-P-1500 (DB + GB); (q) C70-63.5-1.5-P-2000 (GB).
Buildings 12 00812 g006aBuildings 12 00812 g006bBuildings 12 00812 g006c
Figure 7. Comparison between the results of DSM and the results of the experimental test. (a) DSM distortional strength curve and experimental results; (b) DSM global strength curve and experimental results.
Buildings 12 00812 g007
Figure 8. Comparison between the modified DSM distortional strength curve and experimental test results.
Buildings 12 00812 g008
Table 1. The average mechanical properties of the tensile coupon test results.
The Thickness of the Material,
t (mm)
Non-Perforated CouponCoupon with Circular Perforations from FlangeCoupon with Triangular Perforations from WebFinal Material Properties
Fy
(MPa)
Fu
(MPa)
E
(GPa)
Fy
(MPa)
Fu
(MPa)
E
(GPa)
Fy
(MPa)
Fu
(MPa)
E
(GPa)
Fy
(MPa)
Fu
(MPa)
E
(GPa)
1.50377480203.8389488204.1399490204.2388486204.1
2.00386485203.5401493203.9410496204.0399491203.8
2.50387487204.0402495204.1412500204.2400494204.1
Table 2. Properties of the tested specimens.
Specimenhw
(mm)
bf
(mm)
t
(mm)
Length
L (mm)
A g
(mm2)
A (net)
(mm2)
rx (net)
(mm)
ry (net)
(mm)
λxλyλmax
C70-63.5-1.5-P-5007063.51.5500370.732322.3426.1422.3819.1222.38
C70-63.5-1.5-P-10007063.51.51000370.732322.3426.1444.7638.2544.76
C70-63.5-1.5-P-20007063.51.52000370.732322.3426.1489.5276.589.52
C90-80-1.5-P-50090801.5500455.4407.727.0133.8018.5114.7918.51
C90-80-1.5-P-100090801.51000455.4407.727.0133.8037.0229.5937.02
C90-80-1.5-P-1500 90 80 1.5 1500 455.4407.727.0133.8055.5444.3855.54
C110-80-1.5-P-500110801.5500510.9463.226.9640.8918.5412.2218.54
C110-80-1.5-P-1000110801.51000510.9463.226.9640.8937.0924.4537.09
C110-80-1.5-P-1500 110 80 1.5 1500 510.9 463.2 26.9640.8955.6336.6855.63
C110-80-1.5-P-2000110801.52000510.9463.226.9640.8974.1848.9174.18
C110-80-2-P-500110802500678.4614.826.8740.6018.6112.3218.61
C110-80-2-P-10001108021000678.4614.826.8740.6037.2224.6337.22
C110-80-2-P-1500 110 80 2 1500 678.4614.826.8740.6055.8236.9555.82
C110-80-2-P-20001108022000884.4614.826.8740.6074.4349.2674.43
C110-80-2.5-P-500110802.5500884.4764.926.7840.3118.6712.4018.67
C110-80-2.5-P-1000110802.51000884.4764.926.7840.3137.3424.8137.34
C110-80-2.5-P-2000110802.52000884.4764.926.7840.3174.6849.6274.68
Table 3. Ultimate loads, normalized strength, and failure modes.
Specimenλmaxhw/tbf/tIx (net)
(mm4)
Iy (net)
(mm4)
Ip (net) = Ix (net) + Iy (net)
(mm4)
Py = Fy*Anet
(kN)
Pu,(exp)
(kN)
Pu,(exp).
Py
Failure Mode
C70-63.5-1.5-P-50022.3846.642.31.6 × 1052.2 × 1053.8 × 105125.393.60.75(DB)
C70-63.5-1.5-P-100044.7671.40.57(DB)
C70-63.5-1.5-P-200089.5246.60.37(GTB)
C90-80-1.5-P-50018.516053.32.9 × 1054.6 × 1057.6 × 105158.17123.50.78(DB)
C90-80-1.5-P-100037.0293.80.6(DB)
C90-80-1.5-P-150055.5490.10.57(DB + GB)
C110-80-1.5-P-50018.5473.353.33.3 × 1057.7 × 10511.1 × 105179.72132.30.74(DB)
C110-80-1.5-P-100037.09105.30.59(DB)
C110-80-1.5-P-150055.63100.40.56(DB + GB)
C110-80-1.5-P-200074.1894.10.53(DB + GB)
C110-80-2-P-50018.6155404.4 × 10510 × 1051.4 × 106245.282531.03(D.B.)
C110-80-2-P-100037.22201.90.82(DB)
C110-80-2-P-150055.82195.60.8(DB + GB)
C110-80-2-P-200074.43190.10.77(DB + GTB)
C110-80-2.5-P-50018.6744325.4 × 1051.2 × 1061.7 × 106305.96311.51.02(D.B.)
C110-80-2.5-P-100037.34260.80.86(DB)
C110-80-2.5-P-200074.68229.50.75(DB + GTB)
Mean0.712
Standard Deviation0.177
COV0.040
Table 4. Comparison between the results of f experimental and DSM.
SpecimenPu,exp (kN)Pn,DSM (kN)Pn,DSM./Pu,expExperimental Failure ModeDSM Failure Mode
C70-63.5-1.5-P-50093.6112.11.2DBLB
C70-63.5-1.5-P-100071.4100.91.4DBLB
C70-63.5-1.5-P-200046.632.90.7GTBLB
C90-80-1.5-P-500123.5145.21.2DBLB
C90-80-1.5-P-100093.8138.61.5DBLB
C110-80-1.5-P-500132.3163.11.2DBLB
C110-80-1.5-P-1000105.3125.91.2DBLB
C110-80-1.5-P-200094.198.381.04DB + GBLB
C110-80-2-P-500253209.30.8DBLB
C110-80-2-P-1000201.9180.40.9DBLB
C110-80-2-P-2000190.1132.30.7DB + GTBLB
C110-80-2.5-P-500311.5272.70.9DBLB
C110-80-2.5-P-1000260.8228.70.9DBLB
C110-80-2.5-P-2000229.5183.70.8DB + GTBLB
Publisher’s Note: MDPI stays neutral with regard to jurisdictional claims in published maps and institutional affiliations.

