Article

Experimental Investigations on Heat Transfer Characteristics of Direct Contact Liquid Cooling for CPU

1
School of Mechanical Engineering, Tongji University, Shanghai 201804, China
2
China Mobile Group Shanghai Co., Ltd., Shanghai 200060, China
*
Author to whom correspondence should be addressed.
Buildings 2022, 12(7), 913; https://doi.org/10.3390/buildings12070913
Submission received: 3 June 2022 / Revised: 24 June 2022 / Accepted: 27 June 2022 / Published: 28 June 2022
(This article belongs to the Section Building Energy, Physics, Environment, and Systems)

Abstract

:
Cooling systems can effectively enable information and communication technology (ICT) equipment to utilize power more efficiently in data centers (DCs). Two-phase cooling provides a potential method to cool CPUs and other electronics and involves submerging them in a thermal conductive dielectric liquid or coolant. In this study, an innovative cooling structure and a two-phase immersion cooling system procedure are presented. The CPU is directly submerged in an engineered fluid, and an experimental test is conducted to obtain the boiling heat transfer and energy consumption data. A prediction equation for saturated boiling HTC in the pool, based on the influence of the characteristics of the heat transfer surface of the CPU and the physical parameters, is proposed. The average partial power usage effectiveness (pPUE) value of the proposed system is 1.036, indicating a significantly improved energy conservation effect compared to conventional air cooling systems. Studies have shown that direct-touch heat dissipation is suitable for supercomputer server CPU heat dissipation with low heat flux density, while for high-density CPU heat dissipation, it is easy to reach the maximum temperature limit of the CPU, thereby reducing the CPU frequency.

1. Introduction

The growth of digital technology (e.g., Internet of Things, artificial intelligence, big data, 5G, and cloud computing) and its extensive application in many industries, such as transportation [1], communications [2], manufacturing [3], medicine [4], and education [5], indicate an increasing need for data processing, storage, and transmission. A data center (DC) can be a building or part of a building where data are gathered, processed, and stored [6]. With the rapid development of digital information industries, DCs have been widely employed to meet various data processing demands [7]. According to a report by the Synergy Research Group, by the end of the third quarter of 2019, there were 504 hyper-scale DCs worldwide [8], and another report has predicted that this number will increase by 12–14% annually over the next five years [9]. Data centers typically involve high energy consumption. The power consumption of DCs comprised approximately 3% of the total global power supply in 2018 [10], and such consumption is growing at a rate of 15–20% yearly. This high power consumption leads to high requirements for the economical and secure operation of DCs [11,12]. In China, the annual power consumption of domestic data centers in 2018 was 160.8 billion kwh, accounting for 2.35% of the power consumption of the whole country [13].
In addition to power equipment and accessory components, DCs consist of two major energy-consuming parts—IT and cooling system equipment—which account for approximately 90% of the total energy usage [14], in which the cooling system shares 30–50% of the total cost [15,16]. Although some energy-saving technologies, such as air cooling, liquid cooling, and free cooling, are used in DCs, the energy consumption of the cooling system is still large, accounting for around 30% of the total power consumption [17]. The cooling system must be in operation approximately 24 h per day. To improve the energy efficiency of data centers, optimizing the cooling system is one of the key steps. Power usage effectiveness (PUE) is an industry-preferred index for evaluating the infrastructure energy efficiency of data centers [18]. A small PUE, approaching 1.0, indicates that a data center approaches optimal energy efficiency. China has approved projects to build eight national computing hubs and has approved plans for ten national data center clusters, referring to the construction of a new computing network system integrating data centers, cloud computing, and big data, which requires the average PUE of the DCs to be reduced to less than 1.25 [19]. The Shanghai data center construction guidelines (version 2021) stipulate that the comprehensive PUE value of new large data center must not exceed 1.3 [20].
Data center cooling systems can be classified into two types: air-cooled systems [21,22] and liquid-cooled systems [23]. The former sends cold air to racks on which servers are placed, thus removing the heat generated by the servers. Meanwhile, liquid-cooled systems, based on the direct contact of a liquid with heat sources, can be further categorized into direct and indirect cooling. For direct liquid cooling, the dielectric liquid absorbs heat from the electronic components directly; this type of heat transfer can be highly effective [23,24]. There are two types of direct liquid cooling systems: single-phase and two-phase immersion cooling systems. Passive two-phase immersion cooling is a fluid-cooled approach in which electronic components are submerged in a phase-changeable liquid bath in a closed box. The system cycle consists of evaporation and condensation of the liquid through phase change [25,26]. Two-phase immersion cooling can provide better temperature uniformity on the server surface by means of the latent heat transfer, which decreases the energy consumption, compared to that of single-phase immersion cooling.
Compared with air-cooled systems, two-phase cooling systems can reduce the use of accessory equipment, such as chillers, pumps, and fans, potentially improving the energy efficiency of data centers [27]. In addition, these systems can avoid the surface temperature symmetry of electronic devices and guarantee high-performance working environments for information and communication technology (ICT) devices. This not only improves heat dissipation efficiency, but also realizes the reuse of waste heat, as a two-phase coolant can effectively cool a CPU at 60 °C [28]. Therefore, liquid-cooled DC systems have become popular for recent ICT equipment due to their energy-efficient heat removal capacity (up to more than 100 W/cm2), while air-cooled DC systems can only efficiently meet cooling demands up to 37 W/cm2 [29].
Due to the use of a phase change medium, two-phase liquid cooling can use the latent heat of phase change vaporization of the medium to take away the heat of the CPU, with trend coefficients being 72–79% higher than that of single-phase cooling system [30]. Therefore, it is posed as the most efficient emerging refrigeration mode. Cheng et al. [31] have simulated and studied the effect of 3M novec HFE 7100 liquid on the heat dissipation of an Intel CPU i9-9900 K. Zhou et al. [32] have studied the effect of a two-phase liquid cooling uniform heating plate (HFE 7100 liquid) on CPU heat dissipation. Applications of two-phase immersion cooling have been performed at micro-scale level [33], or within a very small server power rate range through experiments [34] and combined energy solution systems [35,36]; however, there has been no system-scale academic study assessing thermal management with respect to environmental and economic aspects in detail, to the best of our knowledge [37,38,39,40].
Two-phase liquid cooling systems are essentially different from the conventional air-cooled systems commonly used at present, and the heat transfer mechanism between the CPU and the medium is also more complex. These systems are currently in the exploratory stage, and systematic heat exchange conclusions have not yet been reached. It is necessary to carry out research on the heat transfer characteristics and heat transfer mechanisms of the system in order to provide theoretical support for practical application. This study includes experiments and a series of computational analyses. First, a phase change liquid cooling testbed was built using 3 M Novec HFE 7100 liquid and Intel CPU core i9-10900K. The CPU calculation power was characterized by the CPU operating frequency (MHz), and heat exchange parameters are collected and changed through an acquisition device. Through the experiment and analysis of saturated boiling heat transfer in a pool, the heat transfer coefficient (HTC) is quantitatively studied, the HTC model of semitheoretical saturated boiling heat transfer is established, and the improved theoretical relationship of boiling heat transfer, based on the characteristic parameters of the heat exchange surface, is given. Our results provide valuable theoretical reference for the engineering application of this technology. Finally, the energy efficiency of the system is evaluated based on partial power usage effectiveness (pPUE) indices.

2. Materials and Methods

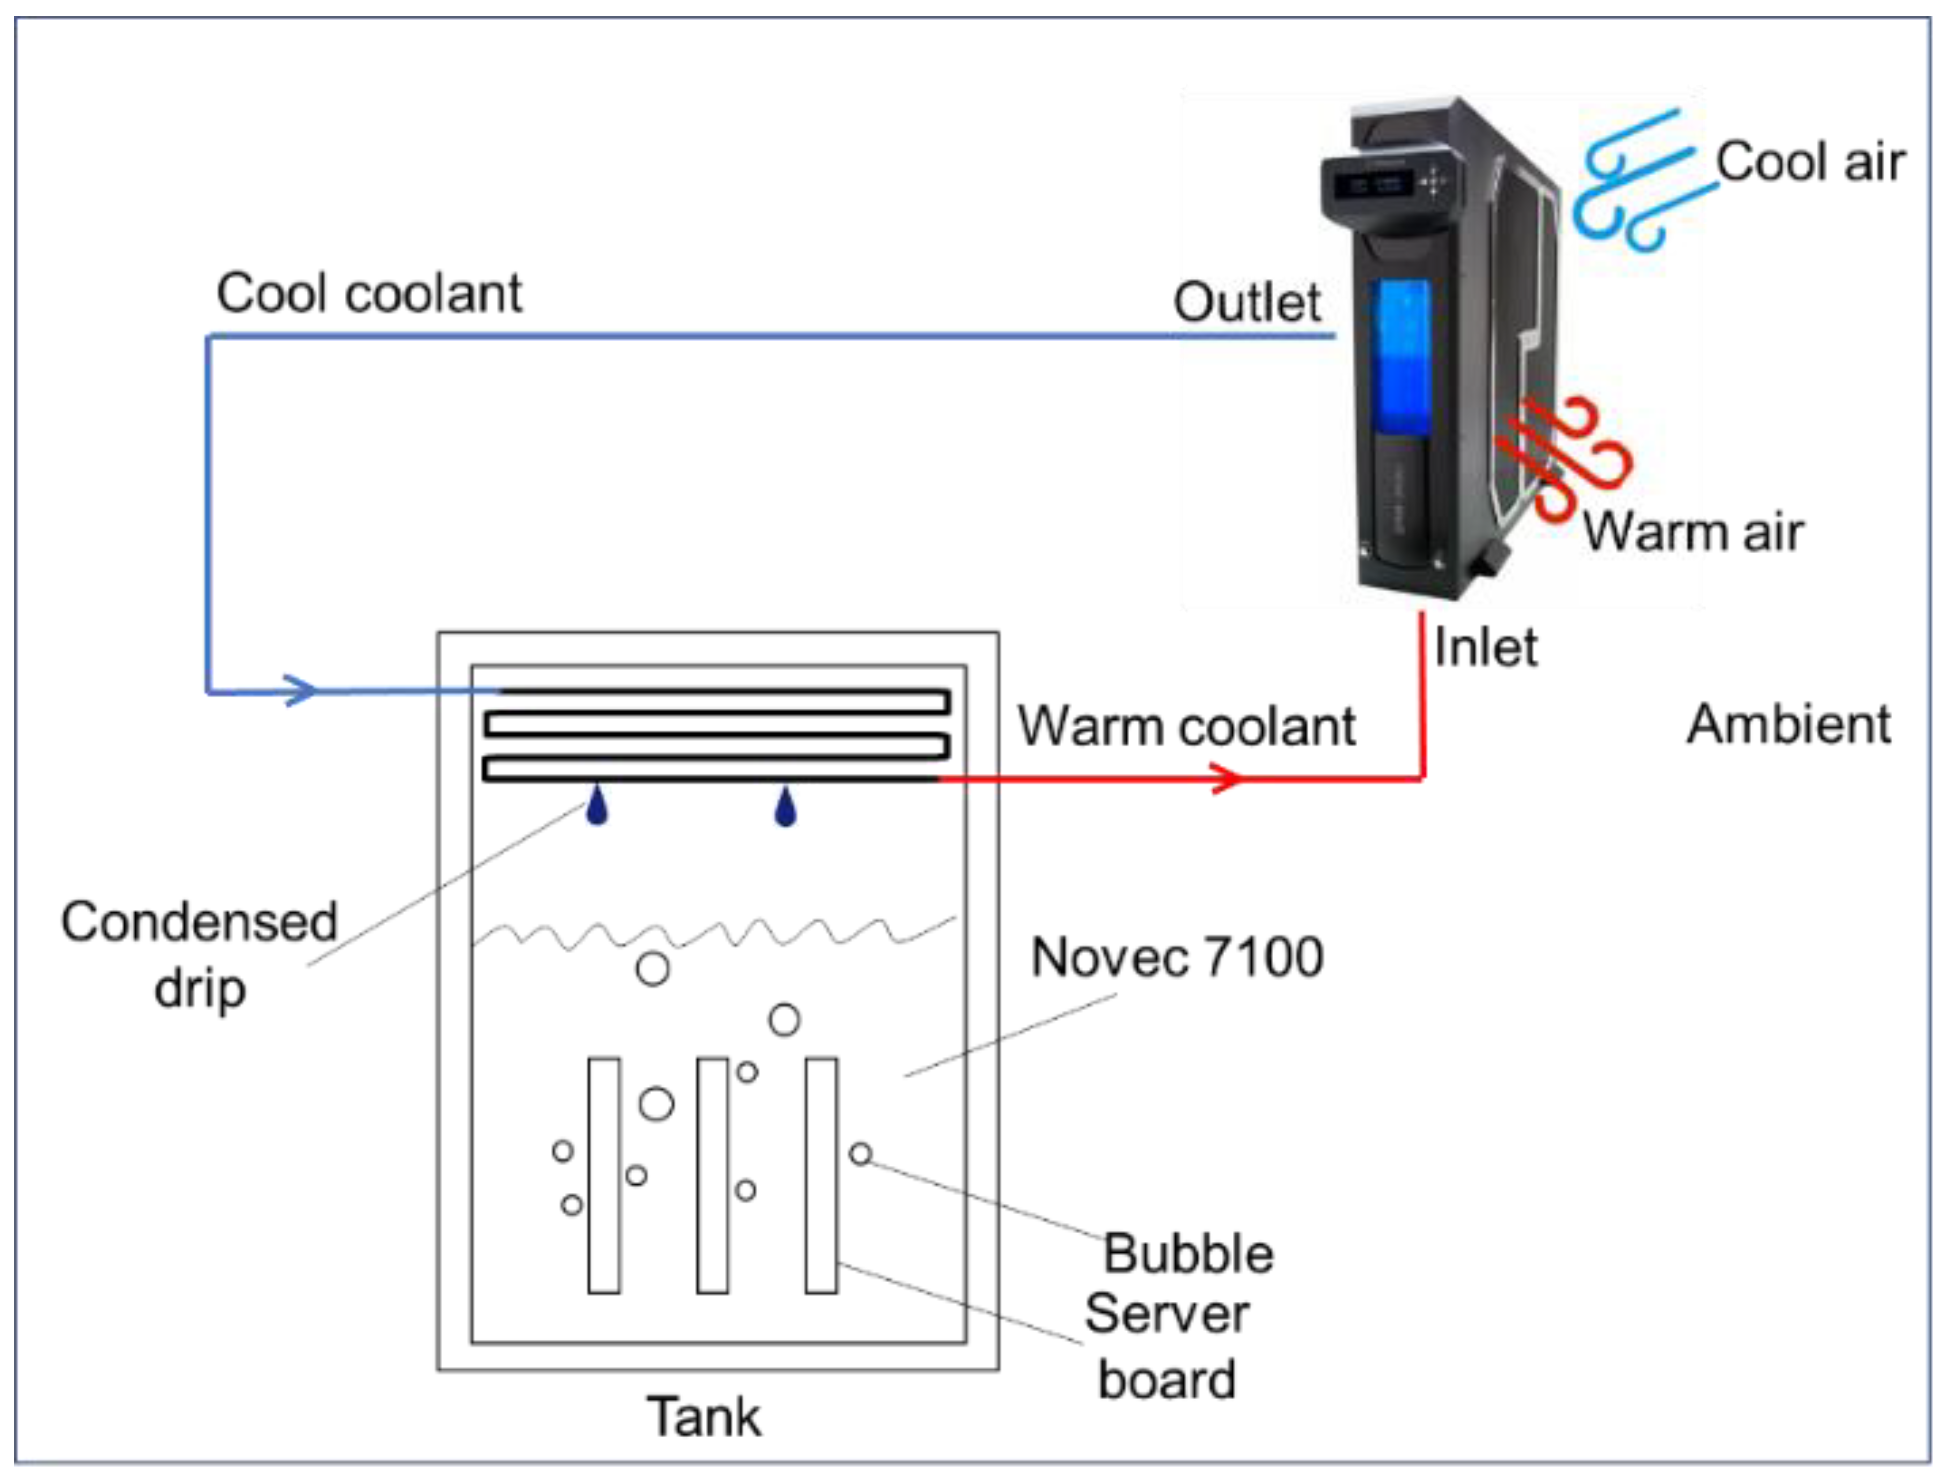
2.1. Structure of System

In this paper, a novel and innovative cooling structure and a two-phase CPU immersion cooling system procedure are established for the cooling of ICT devices. The scheme of the proposed two-phase cooling system is shown in Figure 1, which includes a primary heat exchanger and a tank with coolant and server boards as ICT devices. The ambient air temperature was maintained at 26 °C.
Figure 2a shows a diagram of the experimental setup for the two-phase phase immersion cooling system in a cell. It consists of the experimental chamber, measurement system, CPU, GPU, heat exchange system, power supply system, and air condenser. The experimental chamber is composed of HFE 7100 liquid, with the motherboard (Asus Prime Z590M-Plus), CPU (Intel Core i9-10900K, ten cores and twenty threads, Santa Clara, CA, USA), GPU (Gigabyte RTX 2060 Super Gaming OC), and power supply being immersed in the HFE 7100 liquid. The chassis dimensions are 350 mm × 170 mm × 570 mm, and the interior dimensions are 310 mm × 80 mm × 550 mm. The measurement system includes a high-speed industrial camera, data collector, thermocouple, pressure sensor, and flow meter. Figure 2b shows the CPU in direct immersion liquid cooling conditions, where the CPU is in direct contact with the HFE 7100 liquid and boiling heat exchange is carried out directly at the surface of the CPU. Figure 2c shows the body of the CPU, which directs heat exchange with the liquid, having a size of 3 cm × 3 cm. Figure 2d shows the local enlarged details of the direct contact operating condition. The properties of the HFE 7100 liquid are detailed in Appendix A, Table A1 and Table 1.

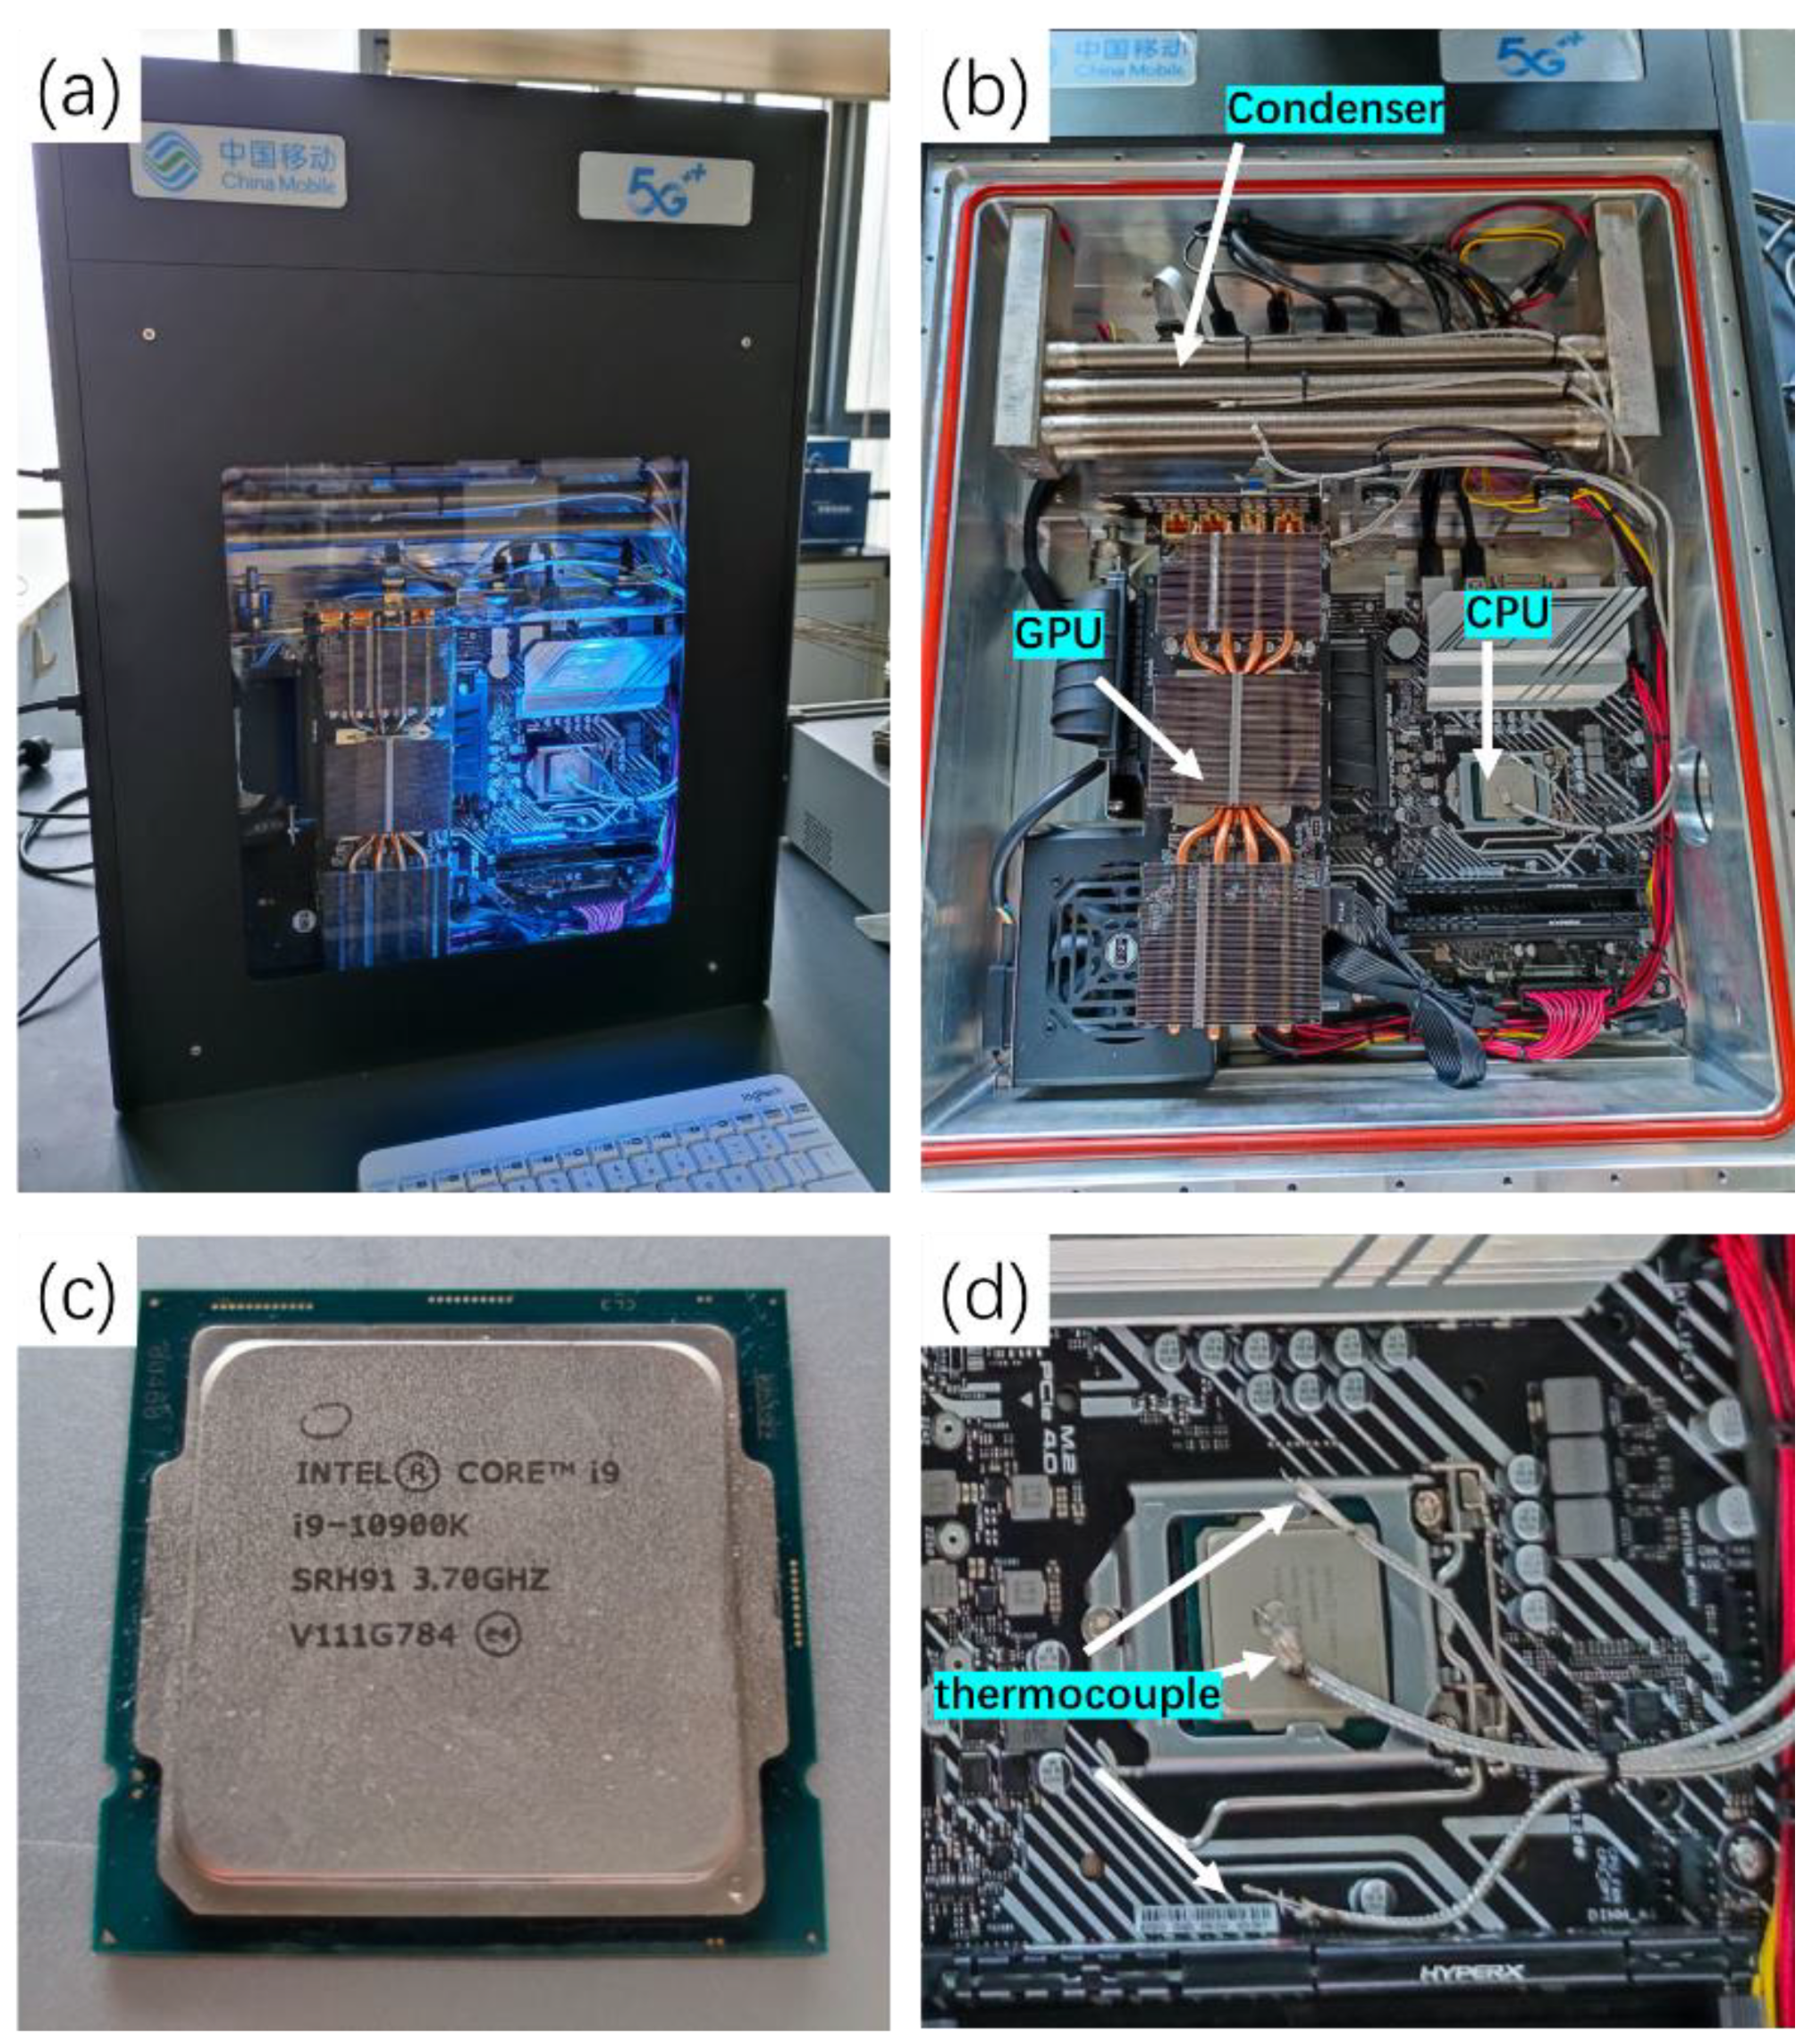
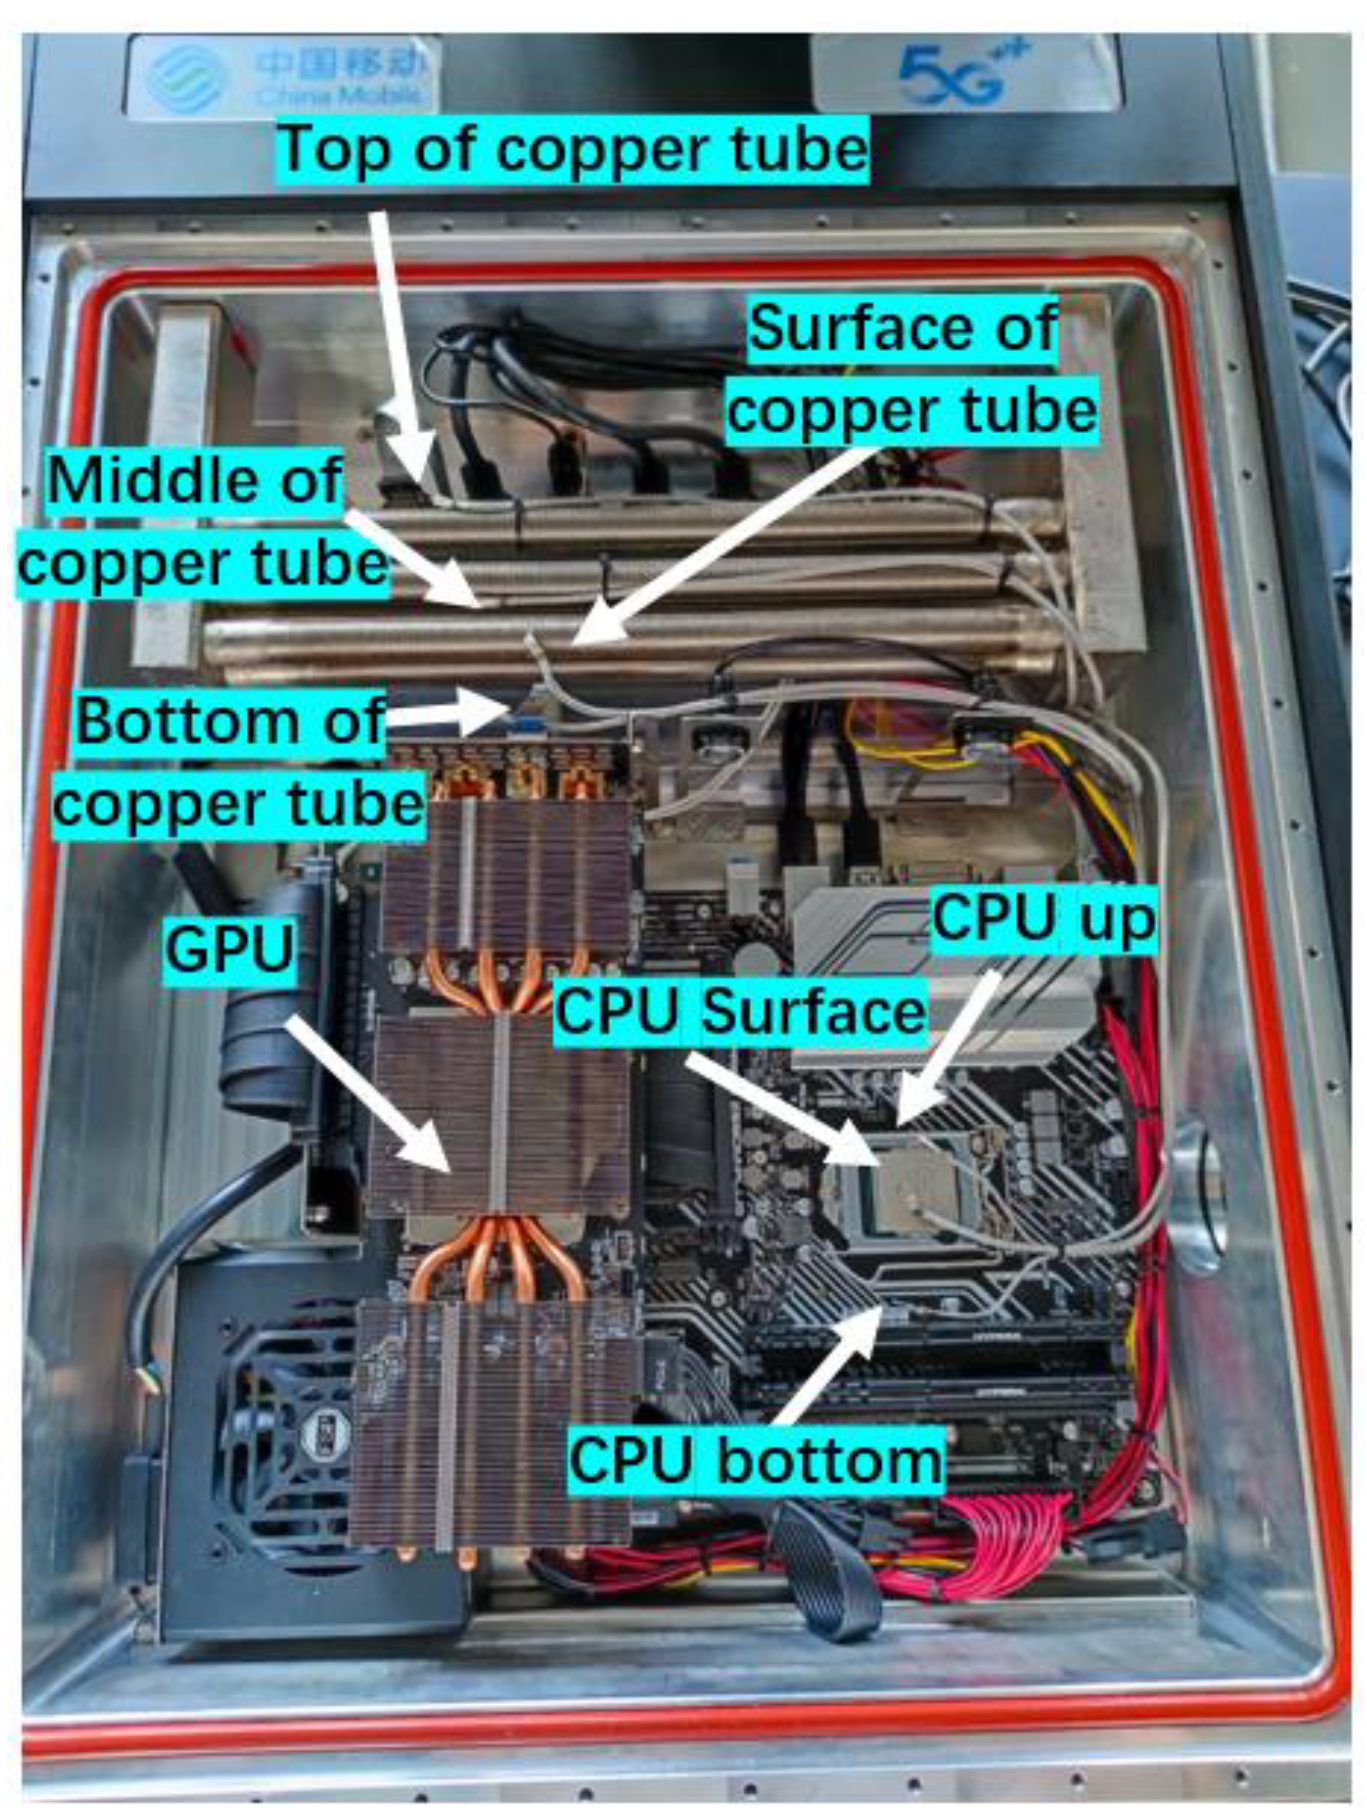
2.2. Experimental Study

Before the experiment, we controlled the experimental environment to 26 °C for one night in order to ensure that the working condition of each experiment remained consistent; that is, the initial temperature of the coolant was around 26 °C. After starting the computer, we closed all background programs and let the computer stay in standby mode for half an hour. We used the Furmark CPU Burner v0.1.0 software to set the number of CPU load cores, where we turned on the core tasks from 1 to 20 one by one, and recorded the CPU power, temperature, and frequency under different cores running by AID64. The Geeks 3D FurMark 1.25 software was used to set the GPU load. As the CPU power is limited by the temperature, the CPU power and utilization rate under the actual operating conditions are shown in Figure 3.
The temperatures of the boiling liquid and CPU surface were measured using K-type thermocouples, which were arranged as shown in Figure 4 with a calibrated uncertainty of ± 0.1 K. The data acquisition system (Fluke, Hybrid series II, Everett, WA, USA) collected the electrical signals of temperature and heat flux every 5 s.

3. Results and Discussion

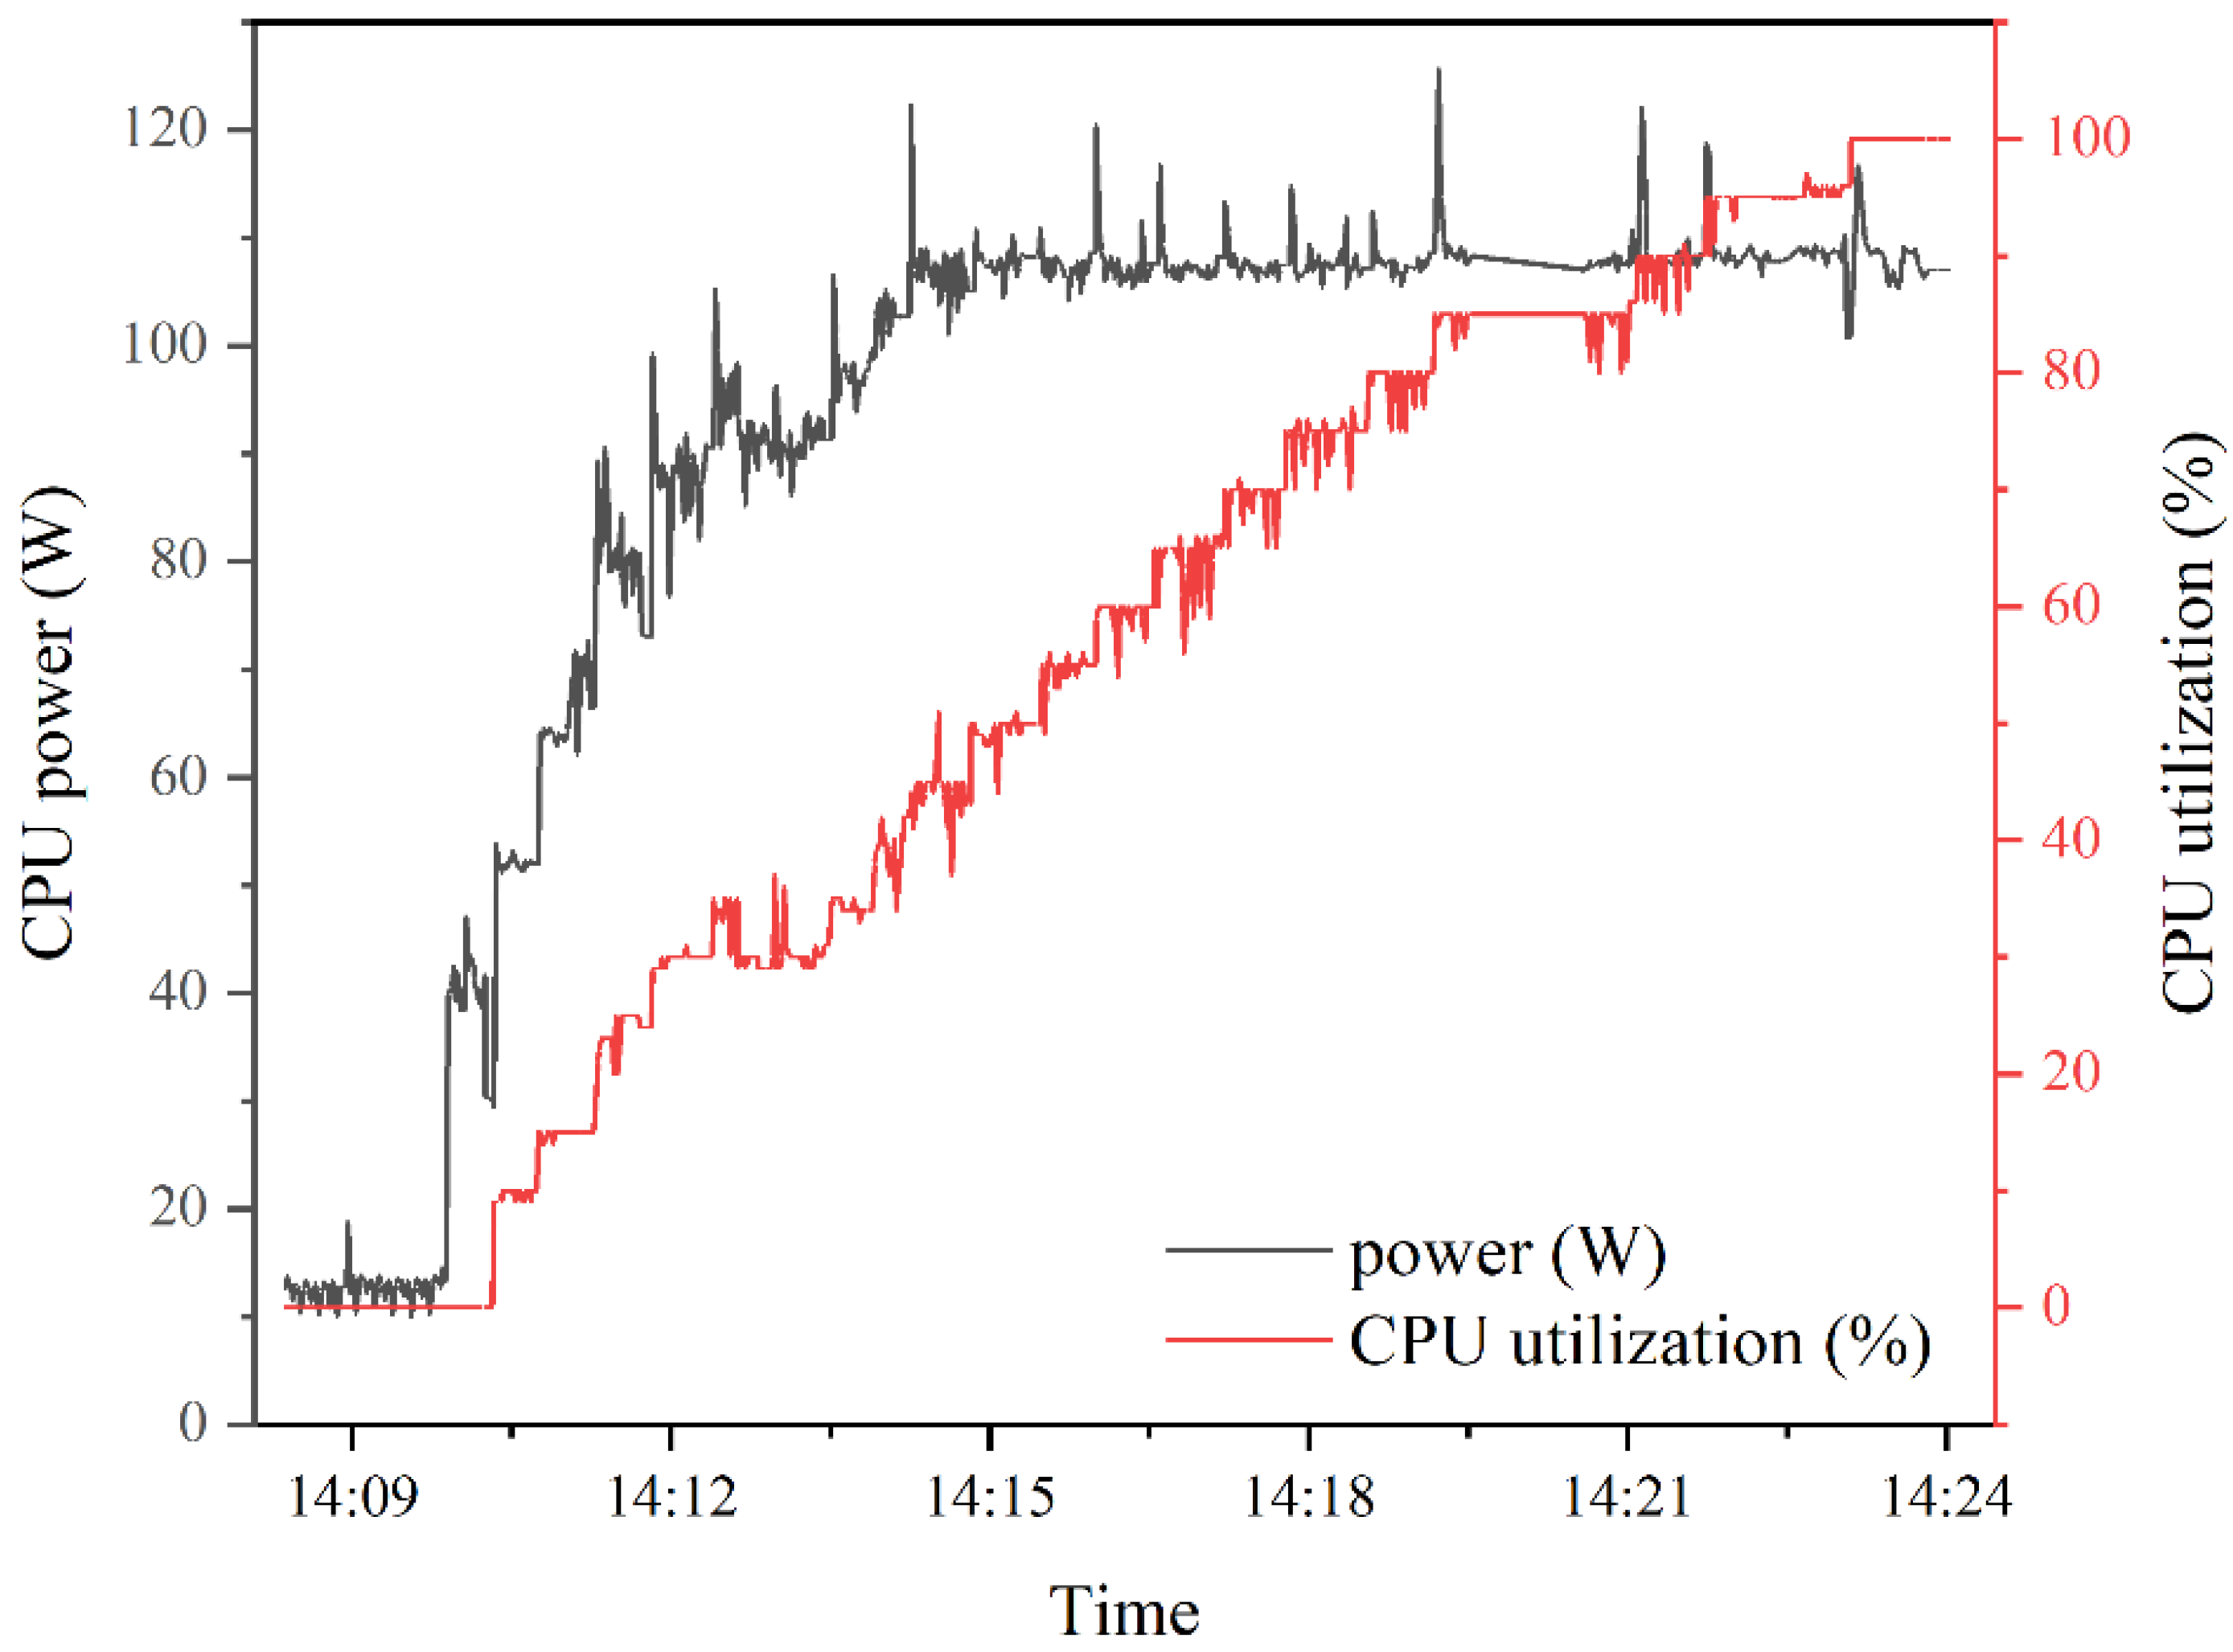
3.1. CPU Direct Contact Boiling Heat Exchange

In order to explore the impact of direct contact boiling heat transfer on CPU liquid microlayer (i.e., different numbers of logical cores), the results are shown in Figure 5. It can be seen from the figure that when the HFE 7100 liquid was used to directly contact the CPU for boiling heat exchange, the die temperature of the CPU reached 100 °C after the four threads were turned on. From then, as the CPU is limited by the maximum temperature (100 °C), the operating frequency gradually decreases to ensure that the CPU can run stably after increasing the number of threads; that is, the CPU’s operating frequency was reduced to achieve stable operations. The frequency of the CPU reduced from the initial 5.0 GHz to 4.28 GHz (a drop of 14.2%). After increasing the number of threads, due to the increase in the temperature of the HFE 7100 liquid, the power of the CPU began to decrease under high load. At this time, the power of the CPU reached 110 W, and the heat that the boiling heat exchange could take away was not enough to maintain the efficient operation of the CPU. It can be seen that the direct contact boiling heat exchange method is not suitable for heat exchange when using high-power CPUs.
The two most important parameters in the boiling process are the boiling heat transfer coefficient (HTC) and critical heat flux (CHF). The former determines the heat exchange efficiency of the system, while the latter determines the maximum heat dissipation power and safety limits of the system. Boiling heat transfer is a heat transfer method in which phase change vaporization occurs inside the working fluid to generate vapor bubbles, which takes away the heat of the heating surface and cools it through the movement of the vapor bubbles. The boiling in the CPU pool is the boiling that occurs when the CPU cylinder cover is immersed in a liquid with a free surface. The principle is shown in Figure 6. A thermocouple was used to measure the temperature of the surface of the CPU cover in our experiment. As the temperature of the CPU surface is difficult to obtain in actual projects, the temperature of the die is usually used to calculate the temperature of the surface of the CPU cover, as shown in Equation (1):
t w = t p a c k a g e - q λ × d
where tw represents the surface temperature of the CPU cover, tpackage represents the temperature of the die, q is the power of the CPU, λ represents the thermal conductivity of the CPU cover—set as 400 W/(m K) [38]—and d is the thickness of the CPU cover.
The boiling in the saturated pool occurs when the main body temperature ts of the liquid reaches the saturation temperature and the wall temperature tw exceeds the saturation temperature. During saturated boiling, as the wall superheat increases, four regions with completely different heat transfer laws will appear: a natural convection zone, a nucleate boiling zone, a transition boiling zone, and a film boiling zone. We propose the qwTsat-like boiling curve for heat transfer on the surface of the CPU in this paper, and the direct contact heat transfer boiling curve of the CPU is shown in Figure 7. Different from the conventional boiling curve, the frequency of the CPU decreases due to the increase in temperature, and the increase in CPU power results in a decrease in superheat, which once again demonstrates the impact of the dynamic adjustment of the CPU on the boiling heat transfer. The reason for the decrease in superheat in the figure is that, as the experiment progresses, the temperature of the liquid gradually rises and finally approaches the boiling point.

3.2. HTC Correlation Equation of Boiling Heat Transfer Considering Surface Characteristics

The process of liquid nucleate boiling includes three basic heat transfer processes: (1) The unsteady heat transfer process between the liquid and the heating surface (CPU wall). This process occurs when the bubble leaves the wall. Then, the lower temperature liquid enters the heating surface and the nearby space is occupied by the original bubble, which is in direct contact with the heating surface for a period of time. That is, after the bubble breaks away, the heat flux qre is required for reconstruction of the thermal boundary layer. (2) A thin layer of liquid at the bottom of the bubble absorbs heat from the heating surface and vaporizes when the bubble grows, where the evaporation heat flux qme is provided to the growth of the vapor bubble through heat conduction of the liquid microlayer. (3) The natural convection heat transfer process between the heating surface and the liquid, where the natural convective heat flux density qnc of the area is not affected by the growth and separation of the bubble, and the growth and separation of the bubble on the heating surface cause disturbance to the nearby liquid, which greatly intensifies this process. Figure 8 shows a schematic diagram of heat growth for a vapor bubble on the wall of the CPU. The total heat flux density on the wall is given by the following Equation:
q w = q m e t g r + q re t w i t g r + t w i + q n c
where twi is the waiting time before the bubble starts to grow at the activated core of the wall and tgr is the growth time from the beginning of the bubble growth to when it leaves the wall.
The size of the CPU used in this experiment is 30 mm × 30 mm × 2 mm. The heat transfer surface is a pure copper matte surface. The contact angle of the HFE 7100 liquid on the copper cover of the CPU was determined to be 10° through a liquid angle tester (Siderns DES-PHa). The average surface roughness of the probe was measured using a German Bruker Dimension Icon atomic force microscope (AFM; probe model: Scan Asyst-Air; scanning mode: Scan Asyst in Air; scanning frequency: 0.5 Hz; scanning area: 10 microns) in order to record the space trajectory of the probe with Ra of 135 nm (from three topographic images with a scanning range of 10 microns, it can be seen that image Ra is 156 nm, 112 nm, and 138 nm), as shown in Figure 9. From the three topography images with a scanning range of 10 microns, it can be seen that the actual surface areas were 104 μm2, 104 μm2, and 103 μm2; therefore, the effective heat transfer area ratios r:1 (the actual surface area to the projected area ratio) were 1.04, 1.04, and 1.03, respectively. Taking their average value, we obtain a sample effective heat exchange area ratio of 1.04.
The physical characteristics of the CPU or liquid cooling contact surface are very important in a submerged liquid cooling system, as the thermal conductivity varies with the type of material, which is the main factor affecting the thermal conductivity in a submerged liquid cooling system. Shahsavar et al. [41] have studied the effect of thermal conductivity of different materials on heat transfer efficiency and found that the higher the number of carbon nanotubes in the CPU, the higher the convective heat transfer coefficient. Jing Z. [42] has used CFD to simulate the effect of the heat exchange plane shape on the boiling process and studied the optimal solution in terms of the number of grooves and CHF value. Lu Z. [43] has found, through simulation, that when bubbles are generated, the bubble growth rate increases with the contact angle. Furthermore, materials with good hydrophobicity can promote bubble growth and enhance heat exchange efficiency [43,44,45,46,47,48].
The current boiling HTC Equation in the literature rarely considers surface characteristic data. Through analysis of the above roughness (Ra) and the effective heat transfer area ratio (r: the ratio of the actual heat transfer area to the projected area) values, and through the CHF experimental data, a semitheoretical pool core boiling heat transfer HTC model, considering the effects of various surface characteristics, is proposed. As the roughness of the heat transfer surface in this experiment was at a nano-level, according to Yuanyang L. [44], the small roughness difference will only bring about 2.3% of the HTC change, so the impact of roughness can be ignored. In the treatment of the experimental results, we controlled the influence of surface roughness Ra by comparing surfaces with the same magnitude of roughness such that we only need to consider the influence of r.
The comprehensive influence parameter Cs of the heating surface was obtained from the literature, as shown in Equation (3) [44], involving the solid–liquid contact angle θ; surface roughness Ra; and the heating surface material influence parameter γ, which is proportional to the wall heat flux (as shown in Equation (4)).
C s = ( 1 cos θ ) 0.5 1 + 5.45 R a 3.5 2 + 2.61 γ 0.04 , θ = max θ , 15 °
q w C s
We use the nucleate boiling heat transfer equation proposed by Rohsenow [44,45]:
c p l Δ T s a t h l v = 0.013 C s 0.33 q w h l v μ l σ g ρ l ρ v 0.33 Pr l
The logarithm of the above Equation can be transformed into the form y = x + B, and the least squares method can be used for regression analysis. The minimum value of f b should be obtained as follows:
f ( b ) = 1 n y i x i b 2
f ( b ) = 2 1 n y i x i b
b = 1 n y i x i n
Through analysis of the experimental data above, Rohsenow’s HTC Equation can be changed to an improved predictive equation, which can be directly used for heat transfer analysis of a CPU immersed two-phase cooling system:
q w = 518 , 503 C s k l 3.03 h l v μ l 2.03 g ρ l ρ v σ Δ T s a t 3.03
After substituting the experimental parameter C s , this becomes:
q w = 88 , 664 k l 3.03 h l v μ l 2.03 σ g ρ l ρ v Δ T s a t 3.03 .
Table 2 and Figure 10 show the error comparison between the predicted boiling heat transfer coefficient and the measured boiling heat transfer coefficient. The predicted value differed from the measured value by 8.72%, indicating a good prediction effect. At present, various HTC prediction equations for saturated boiling in pools cannot uniformly predict the effects of heat transfer surface characteristics and physical parameters. This study proposes a universal prediction equation, which is convenient for practical engineering applications.

3.3. Comparison of HTC Boiling Heat Transfer Correlation Equations

Considering its complexity, there is no widely accepted analytical equation for boiling heat transfer at present. In order to meet the needs of engineering, many researchers use a large number of experimental data to obtain many boiling heat transfer equations. These equations can be used by future generations within their scope of application. In addition to Rohsenow’s HTC Equation above, the following three boiling heat transfer equations have been referenced by several other papers and, so, have certain reference significance.
Shiraishi [49,50]:
h = 0.32 ρ l 0.65 k l 0.3 c p , l 0.7 g 0.2 ρ v 0.25 i l v 0.4 μ l 0.1 P v P atm   0.23 q 0.4
Cooper [51]:
h = 90 q 0.67 P * 0.12 0.2 log R a , p log P * 0.55 M m o l 0.5
Kutateladze [52]:
h = 0.44 P r l 0.35 k l L b ρ l ρ l ρ v P × 10 4 ρ v g i l v μ l q 0.7
Comparing the predicted results of the Shiraishi, Cooper, and Kutateladze boiling heat transfer coefficients with the experimental data, the predicted boiling heat transfer coefficient and the measured boiling heat transfer coefficient differed by 35%, 51%, and 21%, respectively, as shown in Figure 11. The values predicted using the improved Equation (10) in this paper were thus better than those predicted by the reference equations.
The difference between the improved Equation (10) and the Rohsenow Equation is that the proposed equation has a unified form of equation coefficients and a fixed dimensionless parameter index, meaning it is no longer necessary to query the value of the index n corresponding to the selected liquid and the heating surface combination coefficients Csf and Pr. For heating surfaces that are not documented, the heat transfer predictive equation can also be obtained according to their surface characteristics. This is useful for the heat transfer calculation for CPUs submerged in a two-phase cooling system using HFE 7100 liquid.

3.4. pPUE of the System

The PUE is an important parameter for measuring the energy efficiency performance of data centers. It is also used to assess the thermal performance of cooling systems in data centers and has been recommended by the ASHRAE (American Society of Heating, Refrigerating and Air-Conditioning Engineers). In this study, as we considered a two-phase CPU immersion cooling system; the pPUE was used to assess the energy efficiency of the two-phase immersion cooling system. This is defined as the total energy within a boundary divided by the IT equipment energy within that boundary (i.e., pPUE can only be calculated for zones containing IT equipment) [53]. Theoretically, the pPUE should be larger than 1.0, where a value close to 1.0 implies high energy efficiency. The pPUE in this study was calculated using Equation (14):
p P U E = W total + W server W server
Figure 12 shows the results of pPUE calculated in the CPU immersion cooling system experimental study. The uncertainty analysis of pPUE was determined by u c ( P U E ) = P U E P A C 2 u 2 A C + P U E P I T 2 u 2 I T , and the uncertainty of PUE is 1%.
The pPUE ranged from 1.038 to 1.07, indicating a decreasing trend when the number of cores was less than 9, with an average value of 1.05 (the highest value was obtained with one CPU core). The reason for the observed monotonous relationship is that the server power used in this study did not exceed the upper limit of the system’s cooling capacity. During the study, the power of the “fan + pump” was maintained at approximately 6.2 W. This allowed the external heat exchanger to release the heat dissipated by the CPU and GPU efficiently. Thus, there remains the potential for a lower pPUE if the CPU operates at higher power. When the number of cores ranged from 9 to 20, the pPUE was between 1.035 and 1.037 with an average value of 1.036, basically tended to be stable with the change in core number, and showed a small fluctuation with the change of CPU frequency and power. At this time, the cooling system operates within the desired high-efficiency range.

4. Conclusions

In this study, we analyzed the reliability and energy efficiency of a CPU-immersion two-phase cooling system through a series of laboratory experiments and analyses. The results and conclusions reported in this study are as follows:
  • The pPUE of this system ranged from 1.035 to 1.037; the cooling system operated within the desired high-efficiency range, and the average value was 1.036. This value is relatively smaller than that of typical air-cooled systems in data centers. The proposed CPU-immersion two-phase cooling system was, therefore, found to be more energy efficient. It can significantly reduce the energy consumption of data centers while conducting the heat dissipation of high-density CPUs. In addition, the outlet coolant temperature can be considerably high, which allows the supply of high-quality waste heat to be further used to enhance the efficiency of the entire system.
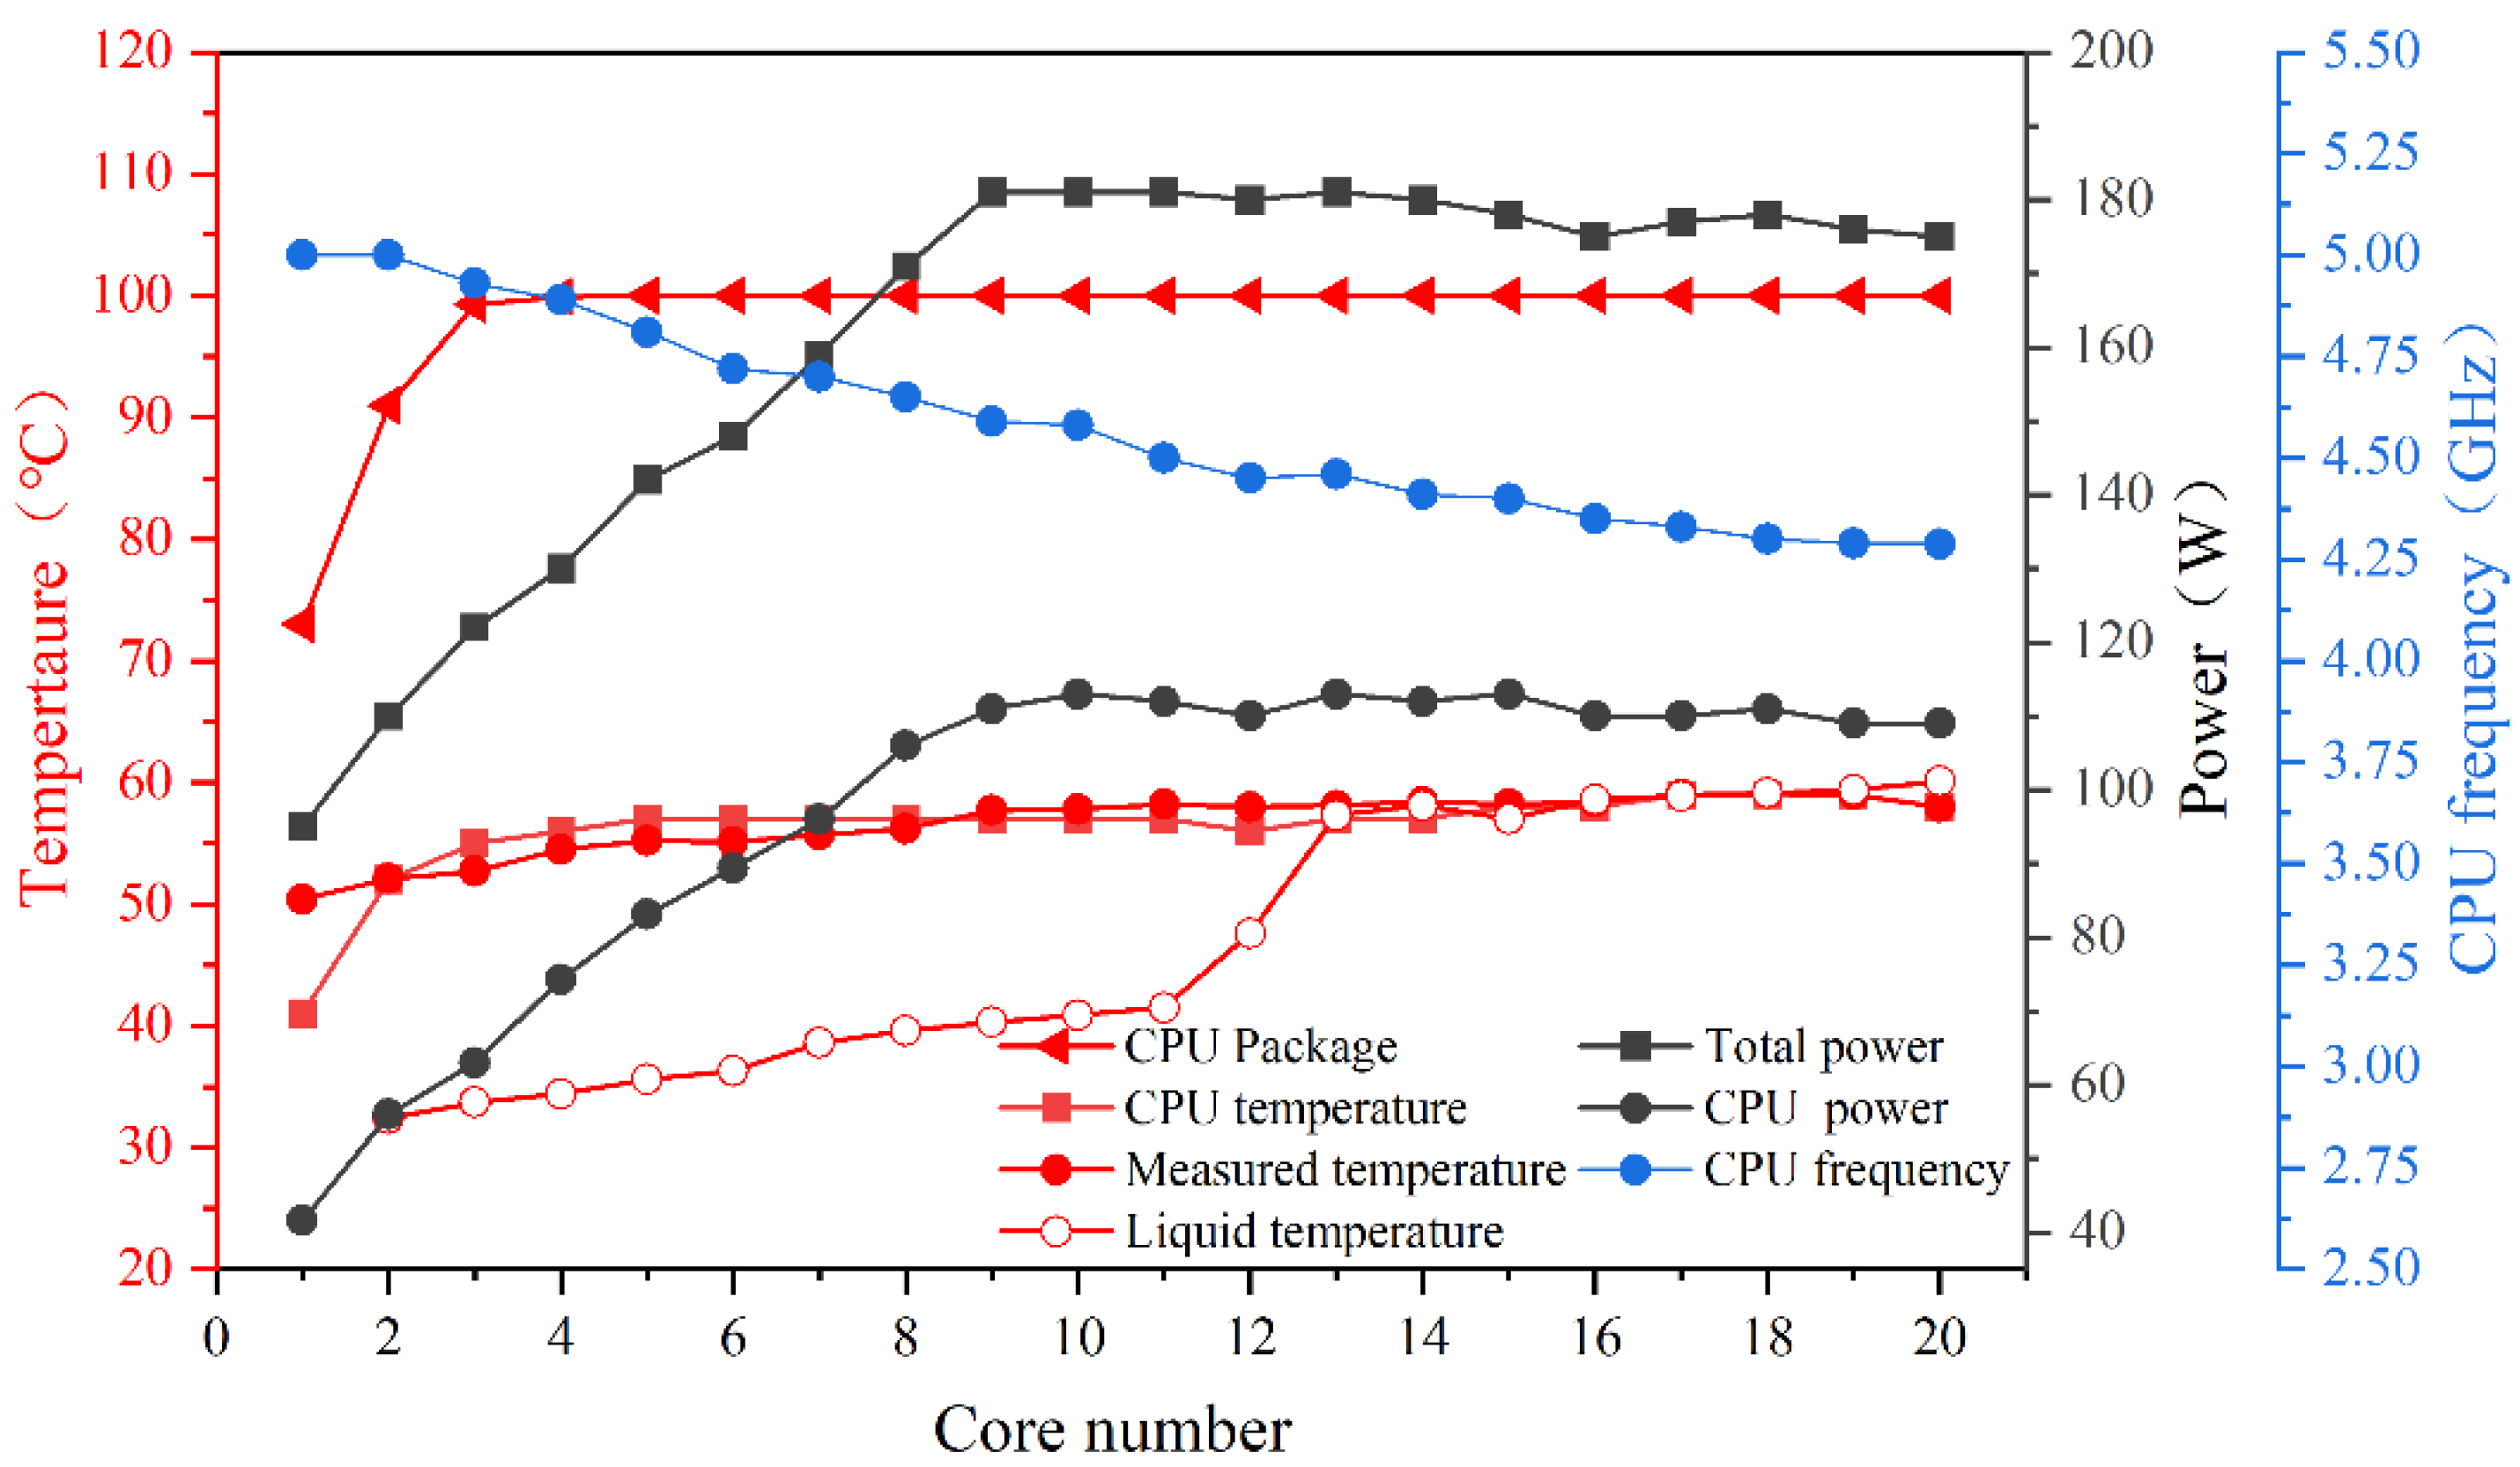
  • The direct contact boiling heat exchange at the CPU was studied for CPU heat dissipation. Studies have shown that direct contact heat dissipation is suitable for supercomputer server CPU heat dissipation with low heat flux density; for high-density CPU heat dissipation, it is easy to reach the maximum temperature limit of the CPU, thereby reducing the frequency of the CPU (evidenced as a drop of 14.2% in this study).
  • We proposed a qwTsat-like boiling curve for the heat transfer at the surface of the CPU, and the direct contact heat transfer boiling curve of the CPU differed from the conventional boiling curve. The frequency of the CPU decreased due to the influence of temperature, and the increase in CPU power results in a decrease in superheat, which once again demonstrates the impact of the dynamic adjustment of the CPU on the boiling heat transfer.
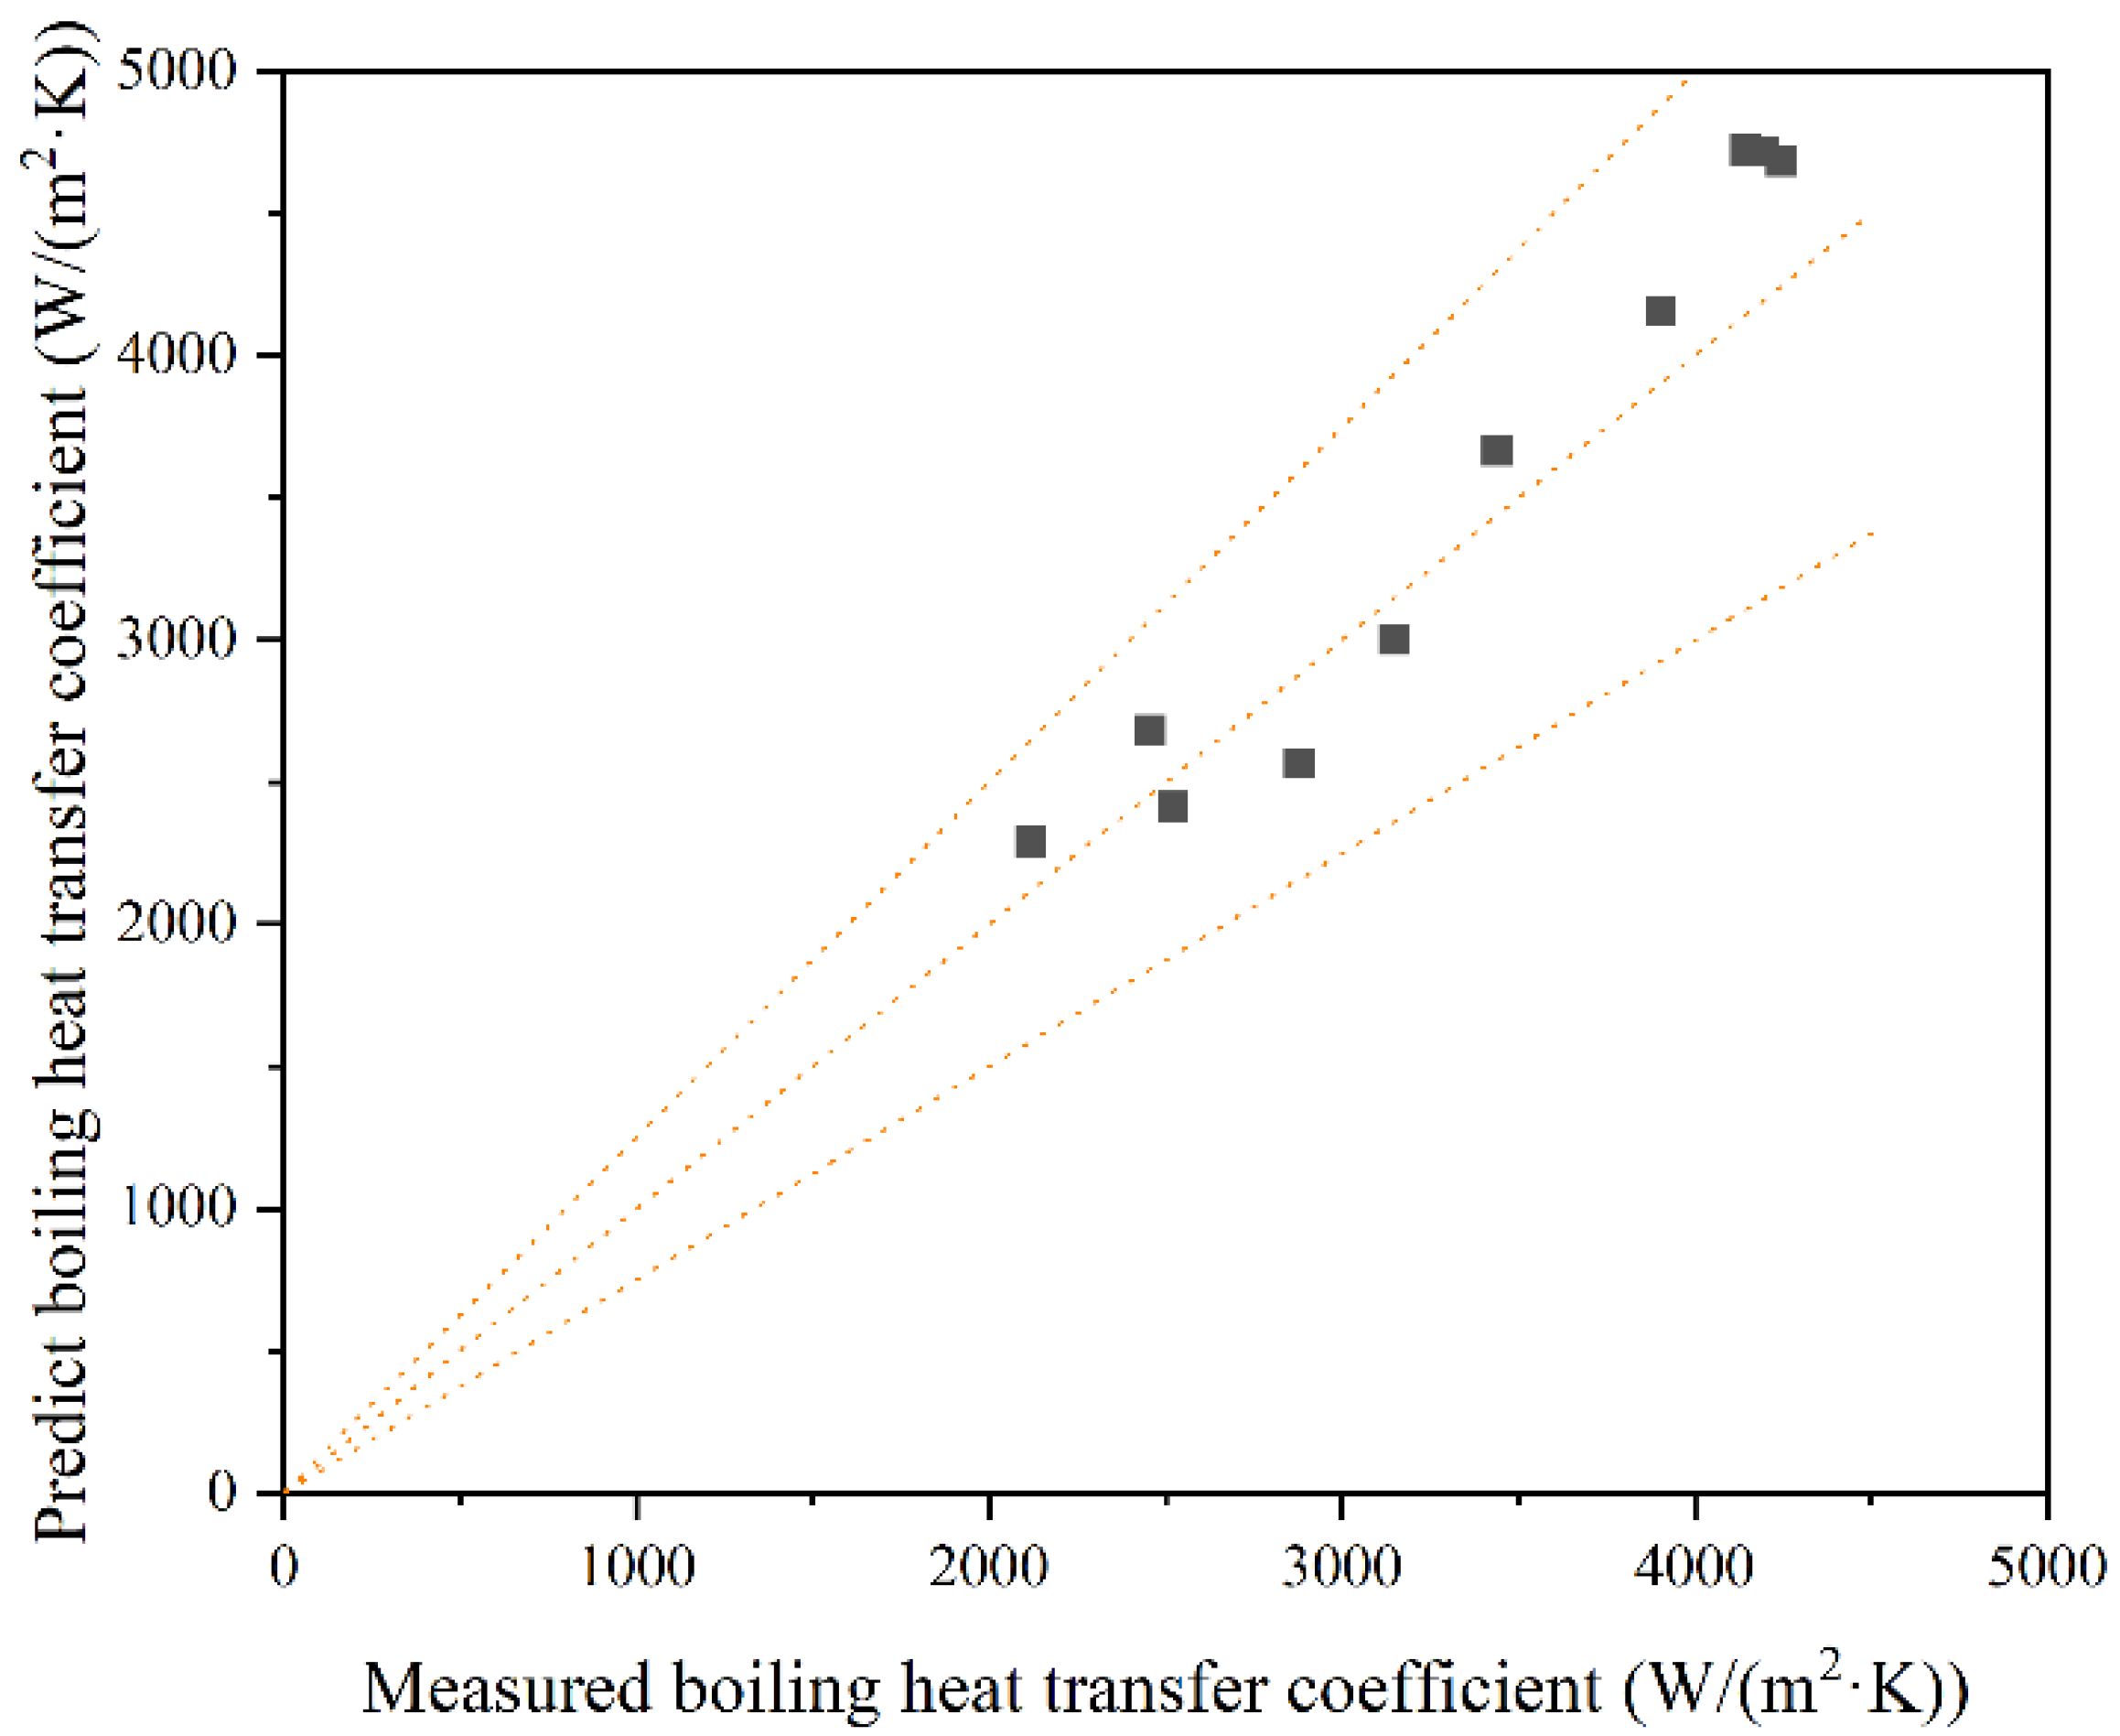
  • Through research on the theoretical relationship of boiling heat transfer, we derived an improved theoretical equation for boiling heat transfer which was in good agreement with the measured values, with the difference between the measured and predicted values being 8.72%. The proposed HTC equation does not need to query the value of the index n corresponding to the selected liquid or the heating surface combination coefficients Csf and Pr.

Author Contributions

Conceptualization, C.L. and H.Y.; methodology, C.L.; software, C.L.; validation, C.L. and H.Y.; formal analysis, C.L.; investigation, C.L.; resources, C.L.; data curation, C.L.; writing—original draft preparation, C.L.; writing—review and editing, C.L.; visualization, C.L.; supervision, C.L.; project administration, H.Y.; funding acquisition, H.Y. All authors have read and agreed to the published version of the manuscript.

Funding

This research was funded by the National Key Research and Development Program of China, grant numbers “2018YFC0704602” and “20182016YFC0700305”.

Institutional Review Board Statement

Not applicable.

Informed Consent Statement

Not applicable.

Data Availability Statement

No data, models or code were generated or used during the study.

Acknowledgments

This work was supported by the National Key Research and Development Program of China [grant numbers 2018YFC0704602, and 20182016YFC0700305].

Conflicts of Interest

The authors declare no conflict of interest.

Nomenclature

PUEPower usage effectiveness
pPUEPartial power usage effectiveness
COPCoefficient performance
ICTInformation communication technology
tTemperature (K)
DCData center
ITInternet technology
ACAir conditioning
HTC/hHeat transfer coefficient
CHFCritical heat flux
CsComprehensive influence parameter
PrPrandtl number
θSolid–liquid contact angle
RaSurface roughness
γSurface material influence parameter
WserverPower of server (W)
WtotalPower total cooling (W)
tpackageTemperature of the die
qHeat exchange/power (W)
λThermal conductivity
dThickness (m)
μDynamic viscosity (Pa s)
μiVelocity component in the xi direction (m/s)
μjVelocity component in the xj direction (m/s)
μturbTurbulent viscosity (Pa s)
ρDensity (kg/m3)
mMass flow (kg/s)
σSurface tension (N/m)
σcCondensation coefficient
σeEvaporation coefficient
kTurbulent kinetic energy (m2/s2)
tboilingBoiling point
0Status at reference temperature
lFluid state
gVapor state
PPower
uUncertainty

Appendix A

Table A1. The thermal properties of HFE 7100 liquid.
TemperatureDensityViscosityDynamic Viscosity (kg/m s)Kinematic ViscositySpecific HeatThermal ConductivitySaturated
Vapor
(°C)(kg/m3)(m2/s)(m2)/s)(J/kg K)(W/m K)Pressure (Pa)
01582.915.28 × 10−70.00080.83511330.07378815.499
101555.994.6 × 10−70.00070.71511530.071714,091.42
201529.074.05 × 10−70.00060.61911730.069821,815.44
301502.153.61 × 10−70.00050.54211930.067832,813.30
401475.233.24 × 10−70.00040.47812130.065848,085.29
501448.312.94 × 10−70.00040.42612330.063968,818.07
601421.392.69 × 10−70.00030.38312530.061996,393.02
701394.472.49 × 10−70.00030.34612730.06132,391.102

References

  1. Król, A. The Application of the Artificial Intelligence Methods for Planning of the Development of the Transportation Network. Transp. Res. Procedia 2016, 14, 4532–4541. [Google Scholar] [CrossRef] [Green Version]
  2. Bae, J.S.; Yong, S.C.; Kim, J.S.; Min, Y.C. Architecture and performance evaluation of MmWave based 5G mobile communication system. In Proceedings of the 2014 International Conference on Information and Communication Technology Convergence (ICTC), Busan, Korea, 22–24 October 2014. [Google Scholar]
  3. Fei, T.; Qi, Q.; Liu, A.; Kusiak, A. Data-driven smart manufacturing. J. Manuf. Syst. 2018, 48, 157–169. [Google Scholar]
  4. Malik, P.; Pathania, M.; Rathaur, V.K. Overview of artificial intelligence in medicine. J. Fam. Med. Prim. Care 2019, 8, 2328. [Google Scholar]
  5. Yang, Y.B. The Application Research of Data Mining Technique in Education. Comput. Sci. 2006, 33, 284–286. [Google Scholar]
  6. Meng, X.; Zhou, J.; Zhang, X.; Luo, Z.; Gan, T. Optimization of the thermal environment of a small-scale data center in China. Energy 2020, 196, 117080. [Google Scholar] [CrossRef]
  7. Petrovi, S.; Colangelo, A.; Balyk, O.; Delmastro, C.; Karlsson, K. The role of data centres in the future Danish energy system. Energy 2020, 194, 116928. [Google Scholar] [CrossRef]
  8. Weissberger, A. Synergy Research Group: Hyperscale Data Center Count >500 as of 3Q-2019. Available online: https://techblog.comsoc.org/2019/10/19/synergy-research-group-hyperscale-data-center-count-500-as-of-3q-2019/ (accessed on 19 October 2019).
  9. Andrae, A.S.G. Total Consumer Power Consumption Forecast. Available online: https://10times.com/nordic-digital-business-summit (accessed on 1 October 2017).
  10. Chen, M.; Gao, C.; Song, M.; Chen, S.; Liu, Q. Internet data centers participating in demand response: A comprehensive review. Renew. Sustain. Energy Rev. 2020, 117, 109466. [Google Scholar] [CrossRef]
  11. Li, J.; Jurasz, J.; Li, H.; Tao, W.Q.; Duan, Y.; Yan, J. A new indicator for a fair comparison on the energy performance of data centers. Appl. Energy 2020, 276, 115497. [Google Scholar] [CrossRef]
  12. Lei, N.; Masanet, E. Statistical analysis for predicting location-specific data center PUE and its improvement potential. Energy 2020, 201, 117556. [Google Scholar] [CrossRef]
  13. Greenpeace. Potential Analysis on Energy Consumption of Data Centers and Renewable Energy in China 2019. Available online: https://www.greenpeace.org.cn/china-data-center-electricity-consumption-and-renewable-energy/ (accessed on 9 September 2019).
  14. Jin, C.; Bai, X.; Yang, C.; Mao, W.; Xu, X. A review of power consumption models of servers in data centers. Appl. Energy 2020, 265, 114806. [Google Scholar] [CrossRef]
  15. Zimmermann, S.; Meijer, I.; Tiwari, K.M.; Paredes, S.; Michel, B.; Poulikakos, D. Aquasar: A hot water cooled data center with direct energy reuse. Energy 2012, 43, 237–245. [Google Scholar] [CrossRef]
  16. Shao, S.; Liu, H.; Zhang, H.; Tian, C. Experimental investigation on a loop thermosyphon with evaporative condenser for free cooling of data centers. Energy 2019, 185, 829–836. [Google Scholar] [CrossRef]
  17. Zhang, Q.; Meng, Z.; Hong, X.; Zhan, Y.; Deen, M.J. A survey on data center cooling systems: Technology, power consumption modeling and control strategy optimization. J. Syst. Archit. 2021, 119, 102253. [Google Scholar] [CrossRef]
  18. ASHRAE. PUE: A Comprehensive Examination of the Metric; ASHRAE: Atlanta, GA, USA, 2012. [Google Scholar]
  19. Guo, L. Mega-projects for data clusters, promoting five major changes in the computing industry. Commun. World 2022, 18–19. [Google Scholar]
  20. Shanghai Municipal Commission of economy and informatization. Guidelines for the Construction of Data Center in Shanghai; White Paper: Singapore, 2021; p. 20. [Google Scholar]
  21. Beghi, A.; Cecchinato, L.; Dalla Mana, G.; Lionello, M.; Rampazzo, M.; Sisti, E. Modelling and control of a free cooling system for Data Centers. Energy Procedia 2017, 140, 447–457. [Google Scholar] [CrossRef]
  22. Ko, J.S.; Huh, J.H.; Kim, J.C. Improvement of Energy Efficiency and Control Performance of Cooling System Fan Applied to Industry 4.0 Data Center. Electronics 2019, 8, 582. [Google Scholar] [CrossRef] [Green Version]
  23. Khalaj, A.H.; Halgamuge, S.K. A Review on efficient thermal management of air- and liquid-cooled data centers: From chip to the cooling system. Appl. Energy 2017, 205, 1165–1188. [Google Scholar] [CrossRef]
  24. Tuma, P.E. The merits of open bath immersion cooling of datacom equipment. In Proceedings of the 2010 26th Annual IEEE Semiconductor Thermal Measurement and Management Symposium (SEMI-THERM), Santa Clara, CA, USA, 21–25 February 2010. [Google Scholar]
  25. Qiu, L.; Dubey, S.; Choo, F.H.; Duan, F. Recent developments of jet impingement nucleate boiling. Int. J. Heat Mass Transf. 2015, 89, 42–58. [Google Scholar] [CrossRef]
  26. Robinson, A.J.; Colenbrander, J.; Byrne, G.; Burke, P.; Kempers, R. Passive two-phase cooling of air circuit breakers in data center power distribution systems. Int. J. Electr. Power Energy Syst. 2020, 121, 106138. [Google Scholar] [CrossRef]
  27. Liu, C.; Yu, H. Evaluation and Optimization of a Two-Phase Liquid-Immersion Cooling System for Data Centers. Energies 2021, 14, 1395. [Google Scholar] [CrossRef]
  28. Wu, D.; Marcinichen, J.B.; Thome, J.R. Experimental Evaluation of a Controlled Hybrid Two-Phase Multi-Microchannel Cooling and Heat Recovery System Driven by Liquid Pump and Vapor Compressor. Int. J. Refrig. 2013, 36, 375–389. [Google Scholar] [CrossRef]
  29. Saini, M.; Webb, R.L. Heat rejection limits of air cooled plane fin heat sinks for computer cooling. IEEE Trans. Compon. Packag. Technol. 2003, 26, 71–79. [Google Scholar] [CrossRef]
  30. Bbk, A.; Cwa, B.; Sfa, B.; Fei, D.A. System-level experimental investigations of the direct immersion cooling data center units with thermodynamic and thermoeconomic assessments. Energy 2020, 217, 119373. [Google Scholar]
  31. Cheng, C.C.; Chang, P.C.; Li, H.C.; Hsu, F.I. Design of a single-phase immersion cooling system through experimental and numerical analysis. Int. J. Heat Mass Transf. 2020, 160, 120203. [Google Scholar] [CrossRef]
  32. Zhou, G.; Zhou, J.; Huai, X.; Zhou, F.; Jiang, Y. A two-phase liquid immersion cooling strategy utilizing vapor chamber heat spreader for data center servers. Appl. Therm. Eng. 2022, 210, 118289. [Google Scholar] [CrossRef]
  33. Chien, L.H.; Chang, C.Y. An experimental study of two-phase multiple jet cooling on finned surfaces using a dielectric fluid. Appl. Therm. Eng. 2011, 31, 1983–1993. [Google Scholar] [CrossRef]
  34. Kanbur, B.B.; Wu, C.; Fan, S.; Tong, W.; Duan, F. Two-phase liquid-immersion data center cooling system: Experimental performance and thermoeconomic analysis. Int. J. Refrig. 2020, 118, 290–301. [Google Scholar] [CrossRef]
  35. Kanbur, B.B.; Wu, C.; Duan, F. Combined heat and power generation via hybrid data center cooling-polymer electrolyte membrane fuel cell system. Int. J. Energy Res. 2020, 44, 4759–4772. [Google Scholar] [CrossRef]
  36. Kanbur, B.B.; Wu, C.; Duan, F. Multi-criteria thermoeconomic and thermodynamic assessments of the desalination-integrated two-phase liquid-immersion data center cooling system. Int. J. Energy Res. 2020, 44, 10453–10470. [Google Scholar] [CrossRef]
  37. Khalid, R.; Wemhoff, A.P.; Joshi, Y. Energy and exergy analysis of modular data centers. IEEE Trans. Compon. Pack. Manuf. Technol. 2017, 7, 1440–1452. [Google Scholar] [CrossRef]
  38. Kawaguchi, K.; Terao, T.; Kobayashi, K. Cooling Unit for Computer Chip by using Boiling Heat Transfer. Trans. Jpn. Soc. Refrig. Air Cond. Eng. 2012, 21, 309–317. [Google Scholar]
  39. El-Genk, M.S. Immersion cooling nucleate boiling of high power computer chips. Energy Convers. Manag. 2012, 53, 205–218. [Google Scholar] [CrossRef]
  40. Nemati, H. A General Equation Based on Entropy Generation Minimization to Optimize Plate Fin Heat Sink. Eng. J. 2018, 22, 159–174. [Google Scholar] [CrossRef]
  41. Shahsavar, A.; Jafari, M.; Sardari, P.T.; Toghraie, D. Hydrothermal and entropy generation specifications of a hybrid ferronanofluid in microchannel heat sink embedded in CPUs. Chin. J. Chem. Eng. 2020, 32, 27–38. [Google Scholar] [CrossRef]
  42. Jing, Z. Numerical Simulation on Critical Heat Flux of Flow Boiling Heat Transfer in Microchannel with V-typed Grooves. Master’s Thesis, Jiangsu University, Zhenjiang, China, 2017. [Google Scholar]
  43. Lu, Z. Influence of Near Wall Bubble Dynamics on the Heat Transfer during Nucleate Pool Boiling. Master’s Thesis, Tsinghua University, Beijing, China, 2008. [Google Scholar]
  44. Yuanyang, L. Experimental and Theoretical Study of the Heat Transfer Characteristic of Pool Boiling and Jet Impingement Boiling on the Modification Surface. Ph.D. Thesis, Shanghai Jiao Tong University, Shanghai, China, 2014. [Google Scholar]
  45. Rohsenow, W.M. A Method of Correlating Heat Transfer Data for Surface Boiling Liquids; MIT Division of Industrial Cooporation: Cambridge, MA, USA, 1951. [Google Scholar]
  46. Nam, Y.; Wu, J.; Warrier, G.; Ju, Y.S. Experimental and Numerical Study of Single Bubble Dynamics on a Hydrophobic Surface. J. Heat Transf. 2009, 131, 315–320. [Google Scholar] [CrossRef]
  47. Bourdon, B.; Bertrand, E.; Di Marco, P.; Marengo, M.; Rioboo, R.; De Coninck, J. Wettability influence on the onset temperature of pool boiling: Experimental evidence onto ultra-smooth surfaces. Adv. Colloid Interface Sci. 2015, 221, 34–40. [Google Scholar] [CrossRef]
  48. Surtaev, A.S.; Serdyukov, V.S.; Safonov, A.I. Enhancement of boiling heat transfer on hydrophobic fluoropolymer coatings. Interfacial Phenom. Heat Transf. 2019, 6, 269–276. [Google Scholar] [CrossRef]
  49. Stephan, K.; Abdelsalam, M. Heat-transfer correlations for natural convection boiling. Int. J. Heat Mass Transf. 1980, 23, 73–87. [Google Scholar] [CrossRef]
  50. Shiraishi, M.; Kikuchi, K.; Yamanishi, T. Investigation of heat transfer characteristics of a two-phase closed thermosyphon. J. Heat Recovery Syst. 1981, 1, 287–297. [Google Scholar] [CrossRef]
  51. Cooper, M.G. Saturation Nucleate Pool Boiling—A Simple Correlation; Oxford University: Oxford, UK, 1984. [Google Scholar]
  52. Kutateladze, S.S. Heat Transfer in Condensation and Boiling; Technical Report; State Scientific and Technical Publishers of Literature on Machinery, 1952. [Google Scholar]
  53. ISO/IEC 30134-2:2016; Information Technology-Data Centres-Key Performance Indicators-Part 2: Power Usage Effectiveness (PUE). ISO/IEC: Geneva, Switzerland, 2016.
Figure 1. Scheme of the two-phase CPU immersion cooling system.
Buildings 12 00913 g001
Figure 2. Scheme of the proposed cooling system:(a) Whole of experimental apparatus; (b) inside of experimental apparatus; (c) CPU; (d) placement of the thermocouple;.
Buildings 12 00913 g002
Figure 3. Power variation process under different CPU loads.
Buildings 12 00913 g003
Figure 4. Results and Discussion.
Buildings 12 00913 g004
Figure 5. Direct contact boiling heat transfer.
Buildings 12 00913 g005
Figure 6. CPU structure and boiling heat exchange schematic.
Buildings 12 00913 g006
Figure 7. CPU surface qwTsat boiling curve.
Buildings 12 00913 g007
Figure 8. Schematic diagram of bubble growth on CPU direct-cooling wall.
Buildings 12 00913 g008
Figure 9. CPU surface characteristics (AFM diagram).
Buildings 12 00913 g009
Figure 10. Error comparison between measured and predicted boiling heat transfer coefficients.
Buildings 12 00913 g010
Figure 11. Comparison of different HTC prediction equations.
Buildings 12 00913 g011
Figure 12. Partial power usage effectiveness (pPUE) of the CPU two-phase cooling system.
Buildings 12 00913 g012
Table 1. Comprehensive influence parameters of heating surface.
Surfaceθ (°)Ra (μm)γrCs
Pure copper surface100.135121.040.171
Table 2. Error comparison between measured and predicted boiling heat transfer coefficients.
Power DensityMeasuredPredictError
W/m2W/(m2 K)W/(m2 K)
162,22224562683−9.2%
270,00021182290−8.1%
382,555252324144.3%
492,3332878256610.8%
599,333314830024.6%
6106,66634403666−6.6%
7117,77739044158−6.5%
8123,33341454726−14.0%
9125,55542444685−10.4%
10124,44441944723−12.6%
Publisher’s Note: MDPI stays neutral with regard to jurisdictional claims in published maps and institutional affiliations.

